Attached files
| file | filename |
|---|---|
| EX-99.1 - EXHIBIT 99.1 - SOUTH PLAINS FINANCIAL, INC. | brhc10023631_ex99-1.htm |
| 8-K - 8-K - SOUTH PLAINS FINANCIAL, INC. | brhc10023631_8k.htm |
Exhibit 99.2

South Plains Financial Earnings Presentation First Quarter, 2021 1

Safe Harbor Statement and Other Disclosures FORWARD-LOOKING STATEMENTSThis presentation contains, and
future oral and written statements of South Plains Financial, Inc. (“South Plains” or the “Company”) and City Bank (“City Bank” or the “Bank”) may contain, statements about future events that constitute forward-looking statements within the
meaning of the Private Securities Litigation Reform Act of 1995. These forward-looking statements reflect South Plains’ current views with respect to, among other things, future events and South Plains’ financial performance. Any statements
about South Plains’ expectations, beliefs, plans, predictions, forecasts, objectives, assumptions or future events or performance are not historical facts and may be forward-looking. These statements are often, but not always, made through
the use of words or phrases such as “anticipate,” “believes,” “can,” “could,” “may,” “predicts,” “potential,” “should,” “will,” “estimate,” “plans,” “projects,” “continuing,” “ongoing,” “expects,” “intends” and similar words or phrases.
Forward-looking statements include, but are not limited to: (i) projections and estimates of revenues, expenses, income or loss, earnings or loss per share, and other financial items, (ii) statements of plans, objectives and expectations of
South Plains or its management, (iii) statements of future economic performance, and (iv) statements of assumptions underlying such statements. Forward-looking statements should not be relied on because they involve known and unknown risks,
uncertainties and other factors, some of which are beyond the control of South Plains and City Bank. These risks, uncertainties and other factors may cause the actual results, performance, and achievements of South Plains and City Bank to be
materially different from the anticipated future results, performance or achievements expressed in, or implied by, the forward-looking statements. Factors that could cause such differences include, but are not limited to, local, regional,
national and international economic conditions, the extent of the impact of the COVID-19 pandemic, including the impact of actions taken by governmental and regulatory authorities in response to such pandemic, such as the Coronavirus Aid,
Relief, and Economic Security Act and subsequent related legislations, and the programs established thereunder, and City Bank’s participation in such programs, volatility of the financial markets, changes in interest rates, regulatory
considerations, competition and market expansion opportunities, changes in non-interest expenditures or in the anticipated benefits of such expenditures, the receipt of required regulatory approvals, changes in non-performing assets and
charge-offs, adequacy of loan loss reserves, changes in tax laws, current or future litigation, regulatory examinations or other legal and/or regulatory actions, the impact of any tariffs, terrorist threats and attacks, acts of war or threats
thereof or other pandemics. Therefore, South Plains can give no assurance that the results contemplated in the forward-looking statements will be realized and readers are cautioned not to place undue reliance on the forward-looking statements
contained in this presentation. For more information about these factors, please see South Plains’ reports filed with or furnished to the U.S. Securities and Exchange Commission (the “SEC”), including South Plains’ most recent Annual Report
on Form 10-K on file with the SEC, including the sections entitled "Risk Factors" and "Management's Discussion and Analysis of Financial Condition and Results of Operations." Further, any forward-looking statement speaks only as of the date
on which it is made and South Plains undertakes no obligation to update or revise any forward-looking statement to reflect events or circumstances after the date on which the statement is made or to reflect the occurrence of unanticipated
events, except as required by law. All forward-looking statements, express or implied, herein are qualified in their entirety by this cautionary statement.NON-GAAP FINANCIAL MEASURESManagement believes that certain non-GAAP performance
measures used in this presentation provide meaningful information about underlying trends in its business and operations. Non-GAAP financial measures should be viewed in addition to, and not as an alternative for, SPFI’s reported results
prepared in accordance with GAAP. Numbers in this presentation may not sum due to rounding. 2

Today’s Speakers 3 Curtis C. GriffithChairman & Chief Executive Officer Elected to the board
of directors of First State Bank of Morton, Texas, in 1972 and employed by it in 1979Elected Chairman of the First State Bank of Morton board in 1984Chairman of the Board of City Bank and the Company since 1993 Steven B. CrockettChief
Financial Officer & Treasurer Began his career in public accounting in 1994 by serving for seven years with a local firm in Lubbock, TexasAppointed Chief Financial Officer in 2015Controller of the Bank and the Company for 14 and 5 years
respectively Cory T. NewsomPresident Entire banking career with the Company focused on lending and operationsAppointed President and Chief Executive Officer of the Bank in 2008Joined the Board in 2008 Brent A. BatesCity Bank’s Chief Credit
Officer Joined City Bank in February 2020Division Credit Officer for Simmons First National CorpEVP and Chief Credit Officer of Southwest Bancorp, Inc.

$3.7 Billion in Total Assets as of March 31, 2021 Parent Company of City Bank, a leading Texas-based
community bank headquartered in Lubbock, TX First Quarter 2021 Highlights 4 One of the largest independent banks headquartered in West Texas New Mexico Texas Dallas Bryan /College Station Houston Midland Odessa El
Paso Lubbock Ruidoso SanAntonio Ft. Worth Austin Albuquerque Santa Fe SPFI Branches (25)661 FTE Employees as of 3/31/21 Net Income of $15.2 million, compared to $15.9 million in 4Q’20 and $7.1 million in 1Q’20Diluted earnings
per share of $0.82, compared to $0.87 in 4Q’20 and $0.38 in 1Q’20Pre-Tax, Pre-Provision income of $19.0 million, compared to $20.0 million in 4Q’20 and $15.1 million in 1Q’20Average cost of deposits declined to 29 bps, compared to 31 bps in
4Q’20 and 65 bps in 1Q’20Provision for loan loss of $89 thousand, compared to $141 thousand in 4Q’20 and $6.2 million in 1Q’20Net Interest Margin of 3.52%, compared to 3.64% in 4Q’20 and 4.13% in 1Q’20 Efficiency ratio was 65.76%, compared to
64.19% in 4Q’20 and 69.10% in 1Q’20Tangible book value per share of $19.28, compared to $18.97 at 12/31/20 and $16.54 at 3/31/20Return on Average Assets (annualized) of 1.66%, compared to 1.76% in 4Q’20 and 0.89% in 1Q’20 NASDAQ: SPFI 1Q'21
Highlights Note: Pre-tax, pre-provision income is a non-GAAP measure. See appendix for the reconciliation to GAAP Source: Company documents

Loan Portfolio 5 Total loans increased $21.1 million compared to 4Q’20Increase in total loans
during the quarter was due primarily to:$46.5 million in organic net growth; including $3.5 million in Paycheck Protection Program (“PPP”) loan net growthPartially offset by $25.4 million in pay downs on seasonal agricultural production
loans1Q’21 loan yield of 4.93%; a decrease of 18 bps compared to 4Q’20 excluding PPP loans 1Q’21 Highlights Total Loans Held for Investment$ in Millions Source: Company documents

Loan Portfolio 6 Portfolio Composition Loan Portfolio ($ in
millions) 3/31/21 Commercial C&D $ 100.4 Residential C&D 172.2 CRE Owner/Occ. 220.7 Other CRE Non Owner/Occ. 438.7 Multi-Family 70.5 C&I 268.6 Agriculture 147.9 1-4 Family 362.6
Auto 220.0 Other Consumer 67.6 PPP 173.5 Total $ 2,242.7 Source: Company documents PPP loans totaled $173.5 million at 3/31/21; includes $77.6 million in 1Q’21 advancesActive loan modifications were 2.1%,
or $46.9 million, of total loans at 3/31/21:Decrease from 2.9%, or $64.1 million, at 12/31/20Approximately 95% of these modifications are in the hotel industry 1Q’21 Highlights

DirectEnergy Select Loan Industry Concentration Detail 7 As of March 31,
2021 Hospitality Total operating hospitality loans of $123 million*$17 million in hotels under construction, with unfunded commitments of $7 million84% of balances are to limited service hotels43% of operating hospitality classified; 2% is
nonaccrual; < 2.5% are 30 days or more past dueAllowance for Loan and Lease Losses (“ALLL”) on operating hospitality is 8.8%** Does not include loans reported in construction and development Total direct energy loans of $63 million92%
support services, 8% upstreamNearly 100% are located in Permian and Palo Duro Basins12% of energy sector classifiedALLL on energy sector is 5.2% Hotels by Geography Source: Company documents Energy Support Services by Type

Mortgage Banking Overview 8 Mortgage Banking Activity$ in Millions 1Q’21 Highlights 101% increase
in mortgage loan originations for 1Q’21 to $435 million compared to $216 million for 1Q’20Mortgage servicing rights asset valuation adjustment – positive $1.3 million in 1Q’21, compared to negative $753 thousand in 4Q’20 Source: Company
documents

Noninterest Income 9 Noninterest Income$ in Millions 1Q’21 Highlights Noninterest income of $26.5
million, compared to $18.9 million in 1Q’20Revenue from mortgage banking activities of $18.8 million, compared to $8.8 million in 1Q’20Fee income primarily driven by mortgage operations, debit card and other bank service charge income, and
income from insurance, trust and investment services business Source: Company documents

Diversified Revenue Stream Three Months Ended March 31, 2021 10 Total Revenues$56.0
million Noninterest Income$26.5 million Source: Company documents

Net Interest Income and Margin 11 Net Interest Income & Margin$ in Millions 1Q’21
Highlights Net interest income of $29.5 million, compared to $30.2 million in 1Q’20The decline as compared to 1Q’20 was a result of:Decrease of 69 bps in loan ratesInterest expense for $50 million of subordinated notes issued in 3Q’20
Partially offset by a decrease of 50 bps in the cost of interest-bearing deposits1Q’21 net interest margin (“NIM”) of 3.52% - decrease of 12 bps compared to 4Q’20:18 bps decline in non-PPP loan yieldExcess liquidity - $90 million growth in
average deposits negatively affected NIM 9 bps Source: Company documents

Deposit Portfolio 12 Total Deposits$ in Millions 1Q’21 Highlights Total Deposits of $3.16 billion
at 1Q’21, an increase of $181.3 million from 4Q’20Increase in total deposits primarily a result of organic growth as well as existing customers depositing funds received from PPP loan advances, stimulus checks, and generally maintaining
higher liquidity in response to the ongoing COVID-19 pandemicCost of interest-bearing deposits declined in 1Q’21 to 41bps from 91bps in 1Q’20Noninterest-bearing deposits represented 30.5% of deposits in 1Q’21, compared to 30.8% in 4Q’20 and
27.8% in 1Q’20 Source: Company documents

Credit Quality 13 1Q’21 Highlights Credit Quality Ratios Minimal provision for loan loss of $89
thousand as the result of modest improvements in the economy and a decline in loans actively under a modificationTotal classified loans decreased $3 million in 1Q’21 as compared to 4Q’20Nonperforming assets and net loans charged-off during
the quarter were decreased in 1Q’21 compared to 4Q’20 Net Charge-Offs to Average Loans ALLL to Total Loans HFI Source: Company documents

Investment Securities 14 1Q’21 Highlights Investment Securities totaled $777.2 million at 1Q’21, a
decrease of $25.9 million from 4Q’20; primarily from a decrease in the fair value of securities of $18.5 million due to market conditions All municipal bonds are in TexasAll MBS, CMO, and Asset Backed securities are U.S. Government or
GSE 1Q’21 Securities Composition $777.2mm Securities & Cash$ in Millions Source: Company documents
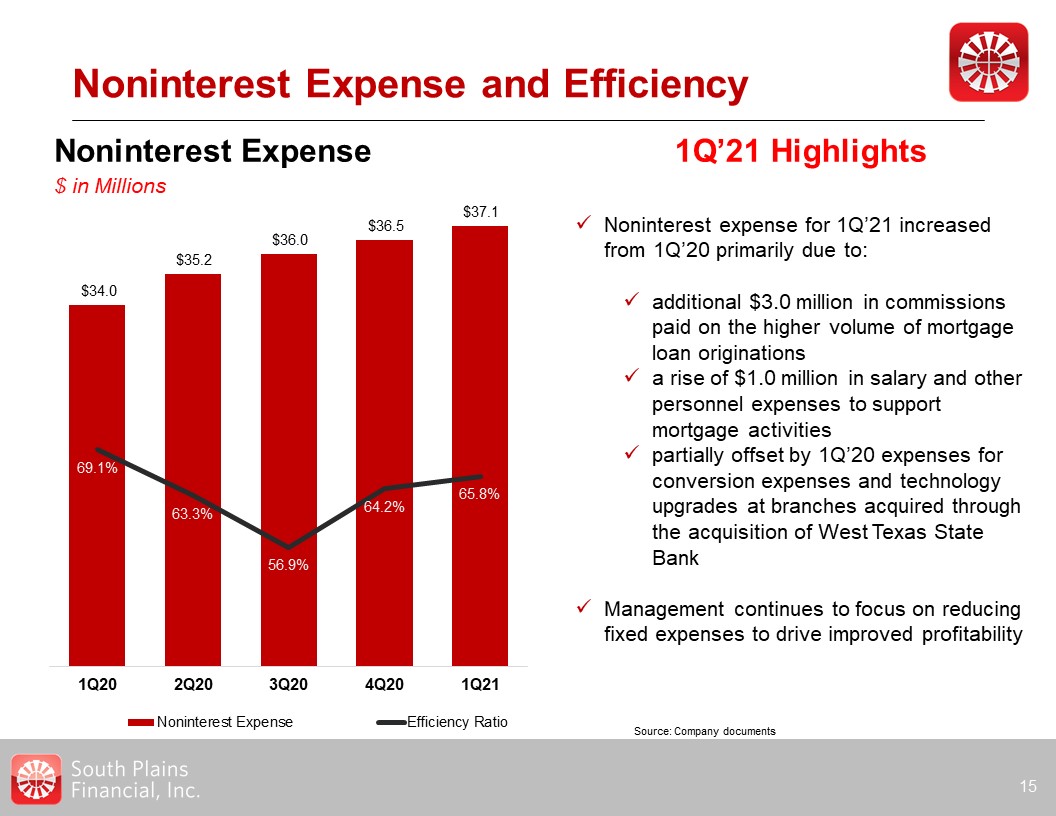
Noninterest Expense and Efficiency 15 Noninterest Expense$ in Millions 1Q’21 Highlights Noninterest
expense for 1Q’21 increased from 1Q’20 primarily due to:additional $3.0 million in commissions paid on the higher volume of mortgage loan originationsa rise of $1.0 million in salary and other personnel expenses to support mortgage
activitiespartially offset by 1Q’20 expenses for conversion expenses and technology upgrades at branches acquired through the acquisition of West Texas State BankManagement continues to focus on reducing fixed expenses to drive improved
profitability Source: Company documents

Balance Sheet Highlights$ in Millions Balance Sheet Growth and Development 16 Tangible Book Value
Per Share Note: Tangible book value per share is a non-GAAP measure. See appendix for the reconciliation to GAAP Source: Company documents

Strong Capital Base 17 Tangible Common Equity to Tangible Assets Ratio Common Equity Tier 1
Ratio Tier 1 Capital to Average Assets Ratio Total Capital to Risk-Weighted Assets Ratio Source: Company documents Note: Tangible common equity to tangible assets is a non-GAAP measure. See appendix for the reconciliation to GAAP

Appendix 18

Non-GAAP Financial Measures 19 As of and for the quarter ended
March 31,2021 December 31,2020 September 30,2020 June 30,2020 March 31,2020 Efficiency Ratio Noninterest expense $ 37,057 $ 36,504 $ 35,993 $ 35,207
$ 34,011 Net interest income $ 29,544 $ 30,365 $ 31,273 $ 30,448 $ 30,199 Tax equivalent yield adjustment 312 336 322 290 145 Noninterest
income 26,500 26,172 31,660 24,896 18,875 Total income $ 56,356 $ 56,873 $ 63,255 $ 55,634 $ 49,219 Efficiency ratio
65.76% 64.19% 56.90% 63.28% 69.10% Noninterest expense $ 37,057 $ 36,504 $ 35,993 $ 35,207 $ 34,011 Less: net loss on sale of securities - -
- - - Adjusted noninterest expense 37,057 36,504 35,993 35,207 34,011 Total income $ 56,356 $ 56,873 $ 63,255 $ 55,634 $
49,219 Less: net gain on sale of securities - - - - (2,318) Adjusted total income $ 56,356 $ 56,873 $ 63,255 $ 53,634 $ 46,901 Adjusted
efficiency ratio 65.76% 64.19% 56.90% 63.28% 72.52% Unaudited$ in Thousands Pre-Tax, Pre-Provision Income Net income $ 15,160 $ 15,924 $ 16,731
$ 5,615 $ 7,083 Income tax expense 3,738 3,968 4,147 1,389 1,746 Provision for loan losses 89 141 6,062 13,133 6,234 Pre-tax,
pre-provision income $ 18,987 $ 20,033 $ 26,940 $ 20,137 $ 15,063 Source: Company documents

Non-GAAP Financial Measures 20 As of and for the quarter ended
March 31,2021 December 31,2020 September 30,2020 June 30,2020 March 31,2020 Tangible common equity Total common stockholders' equity $ 374,671 $ 370,048
$ 352,568 $ 336,534 $ 326,890 Less: goodwill and other intangibles (26,648) (27,070) (27,502) (28,414) (28,181) Tangible common equity $ 348,023
$ 342,978 $ 325,066 $ 308,120 $ 298,709 Tangible assets Total assets $ 3,732,894 $ 3,599,160 $ 3,542,666
$ 3,584,532 $ 3,216,563 Less: goodwill and other intangibles (26,648) (27,070) (27,502) (28,414) (28,181) Tangible assets $ 3,706,246 $ 3,572,090
$ 3,515,164 $ 3,556,118 $ 3,188,382 Shares outstanding 18,053,229 18,076,364 18,059,174 18,059,174 18,056,014 Total
stockholders' equity to total assets 10.04% 10.28% 9.95% 9.39% 10.16% Tangible common equity to tangible assets 9.39% 9.60% 9.25% 8.66% 9.37% Book value per share $ 20.75
$ 20.47 $ 19.52 $ 18.64 $ 18.10 Tangible book value per share $ 19.28 $ 18.97 $ 18.00 $ 17.06 $ 16.54 Unaudited$ in Thousands Source: Company documents