Attached files
| file | filename |
|---|---|
| EX-99.1 - EXHIBIT 99.1 - QCR HOLDINGS INC | tm2113953d1_ex99-1.htm |
| 8-K - FORM 8-K - QCR HOLDINGS INC | tm2113953d1_8k.htm |
Exhibit 99.2
| COVID-19 Exposure Q1 2021 |

| A number of factors, many of which are beyond the ability of the Company to control or predict, could cause actual results to differ materially from those in its forward-looking statements. These factors include, among others, the following: (i) the strength of the local, state, national and international economies (including the impact of the new presidential administration; (ii) the economic impact of any future terrorist threats and attacks, widespread disease or pandemics (including the COVID-19 pandemic in the United States), acts of war or threats thereof, or other adverse external events that could cause economic deterioration or instability in credit markets, and the response of the local, state and national governments to any such adverse external events; (iii) changes in accounting policies and practices as may be adopted by the state and federal regulatory agencies, the FASB, the Securities Exchange Commission, or the PCAOB, including FASB’s CECL impairment standards; (iv) changes in state and federal laws, regulations and governmental policies concerning the Company’s general business; (v) changes in interest rates and prepayment rates of the Company’s assets (including the impact of LIBOR phase-out); (vi) increased competition in the financial services sector and the inability to attract new customers; (vii) changes in technology and the ability to develop and maintain secure and reliable electronic systems; (viii) unexpected results of acquisitions, which may include failure to realize the anticipated benefits of acquisitions and the possibility that transaction costs may be greater than anticipated; (ix) the loss of key executives or employees; (x) changes in consumer spending; (xi) unexpected outcomes of existing or new litigation involving the Company; (xii) the economic impact of exceptional weather occurrence, such as tornados, floods and blizzards, and; (xiii) the ability of the Company to manage the risks associated with the foregoing as well as anticipated. These risks and uncertainties should be considered in evaluating forward-looking statements and undue reliance should not be placed on such statements. Additional information concerning the Company and its business, including additional factors that could materially affect the Company’s financial results, is included in the Company’s filings with the Securities and Exchange Commission. FORWARD-LOOKING STATEMENTS |
| PPP & LRP Participation 3 |

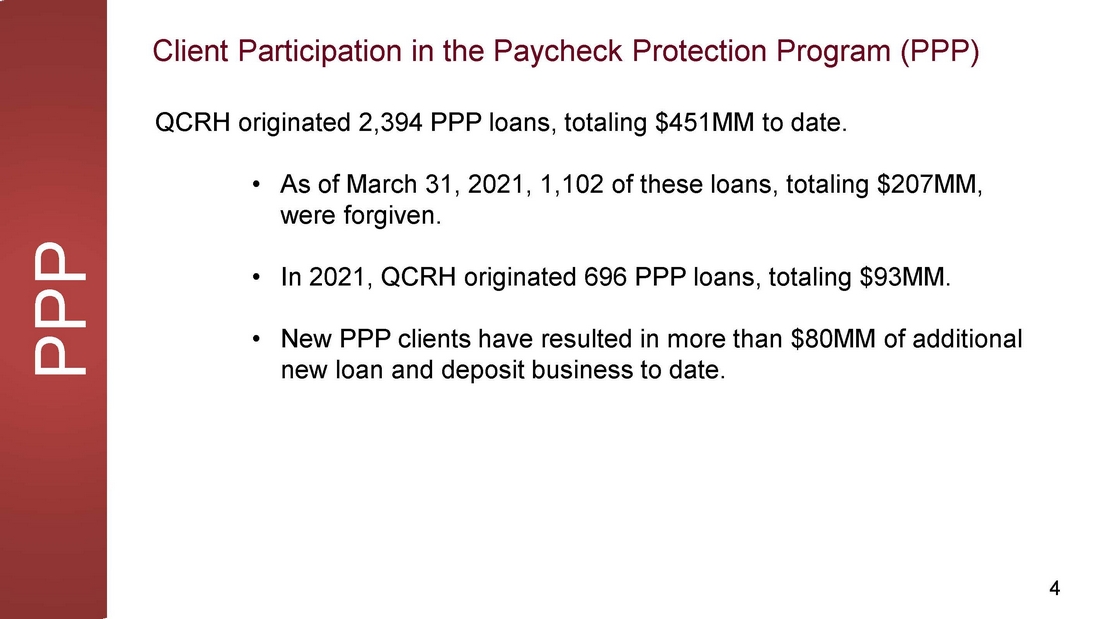
| Paycheck Protection Program (PPP) QCRH originated 2,394 PPP loans, totaling $451MM to date. • As of March 31, 2021, 1,102 of these loans, totaling $207MM, were forgiven. • In 2021, QCRH originated 696 PPP loans, totaling $93MM. • New PPP clients have resulted in more than $80MM of additional new loan and deposit business to date. Client Participation in the Paycheck Protection Program (PPP) PPP 4 |
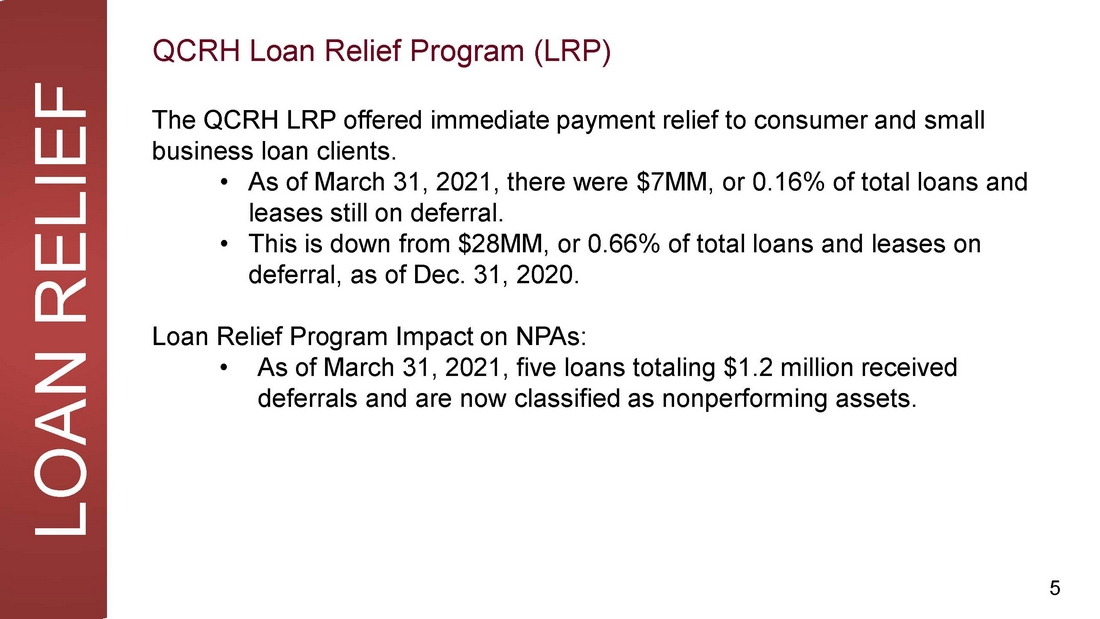
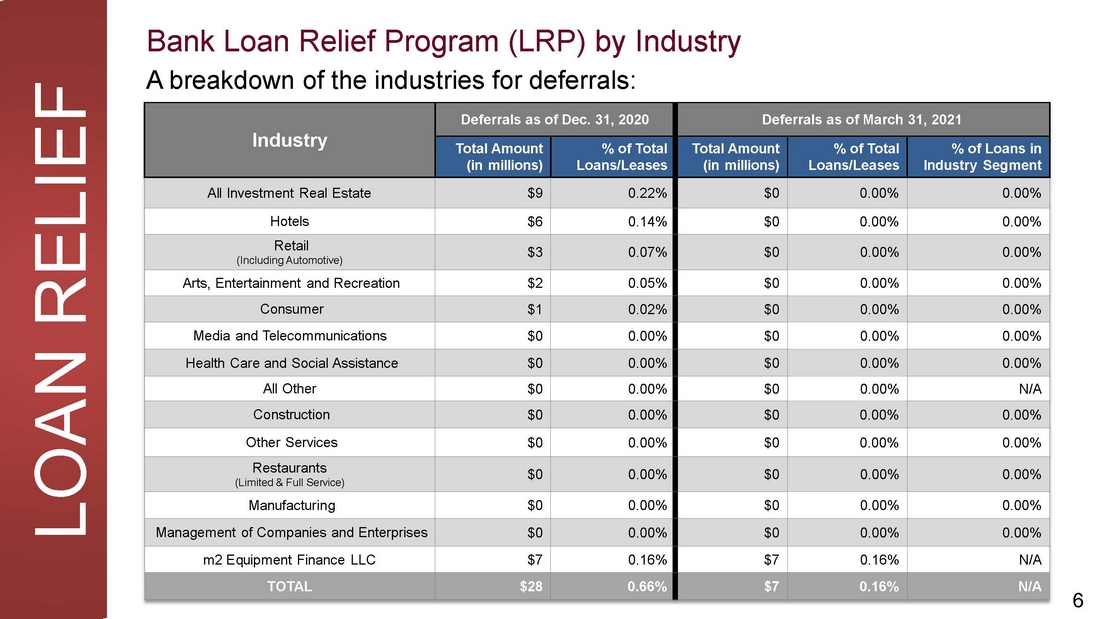
| Supporting our Clients | QCRH Loan Relief Program The QCRH LRP offered immediate payment relief to consumer and small business loan clients. • As of March 31, 2021, there were $7MM, or 0.16% of total loans and leases still on deferral. • This is down from $28MM, or 0.66% of total loans and leases on deferral, as of Dec. 31, 2020. Loan Relief Program Impact on NPAs: • As of March 31, 2021, five loans totaling $1.2 million received deferrals and are now classified as nonperforming assets. QCRH Loan Relief Program (LRP) LOAN RELIEF 5 |
| LOAN RELIEF A breakdown of the industries for deferrals: Bank Loan Relief Program (LRP) by Industry 6 Industry Deferrals as of Dec. 31, 2020 Deferrals as of March 31 , 2021 Total Amount (in millions) % of Total Loans/Leases Total Amount (in millions) % of Total Loans/Leases % of Loans in Industry Segment All Investment Real Estate $9 0.22% $0 0.00% 0.00% Hotels $6 0.14% $0 0.00% 0.00% Retail (Including Automotive) $3 0.07% $0 0.00% 0.00% Arts, Entertainment and Recreation $2 0.05% $0 0.00% 0.00% Consumer $1 0.02% $0 0.00% 0.00% Media and Telecommunications $0 0.00% $0 0.00% 0.00% Health Care and Social Assistance $0 0.00% $0 0.00% 0.00% All Other $0 0.00% $0 0.00% N/A Construction $0 0.00% $0 0.00% 0.00% Other Services $0 0.00% $0 0.00% 0.00% Restaurants (Limited & Full Service) $0 0.00% $0 0.00% 0.00% Manufacturing $0 0.00% $0 0.00% 0.00% Management of Companies and Enterprises $0 0.00% $0 0.00% 0.00% m2 Equipment Finance LLC $7 0.16% $7 0.16% N/A TOTAL $28 0.66% $7 0.16% N/A |
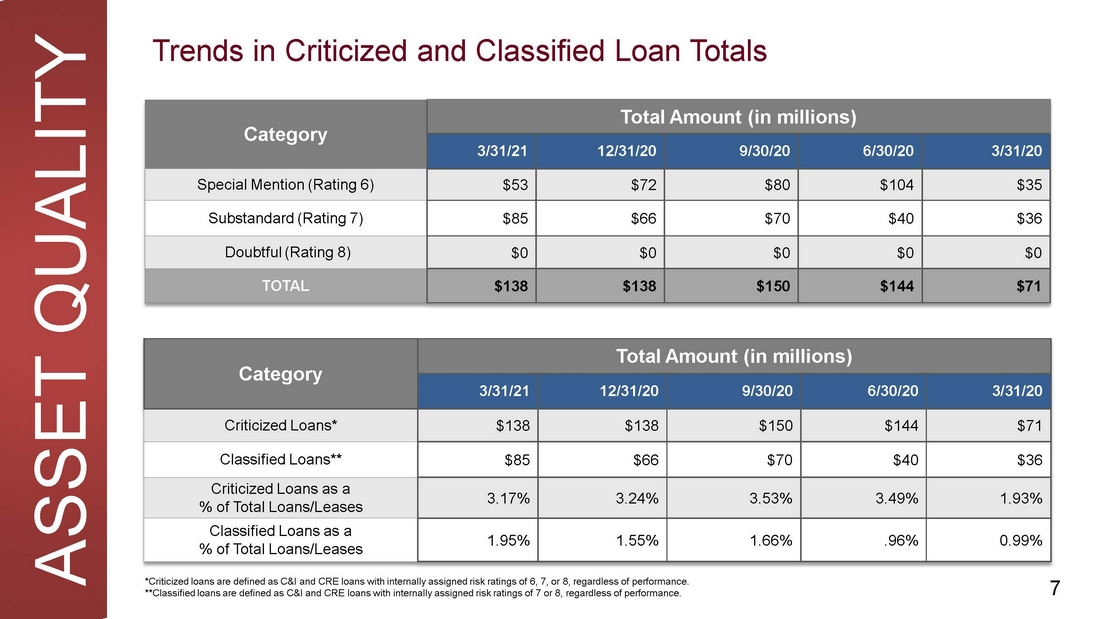
| Supporting our Clients | QCRH Loan Relief Program Trends in Criticized and Classified Loan Totals ASSET QUALITY 7 Category Total Amount (in millions) 3/31/21 12/31/20 9/30/20 6/30/20 3/31/20 Special Mention (Rating 6) $53 $72 $80 $104 $35 Substandard (Rating 7) $85 $66 $70 $40 $36 Doubtful (Rating 8) $0 $0 $0 $0 $0 TOTAL $138 $138 $150 $144 $71 Category Total Amount (in millions) 3/31/21 12/31/20 9/30/20 6/30/20 3/31/20 Criticized Loans* $138 $138 $150 $144 $71 Classified Loans** $85 $66 $70 $40 $36 Criticized Loans as a % of Total Loans/Leases 3.17% 3.24% 3.53% 3.49% 1.93% Classified Loans as a % of Total Loans/Leases 1.95% 1.55% 1.66% .96% 0.99% *Criticized loans are defined as C&I and CRE loans with internally assigned risk ratings of 6, 7, or 8, regardless of performance. **Classified loans are defined as C&I and CRE loans with internally assigned risk ratings of 7 or 8, regardless of performance. |
| Industry Concentration Disclosures 8 |

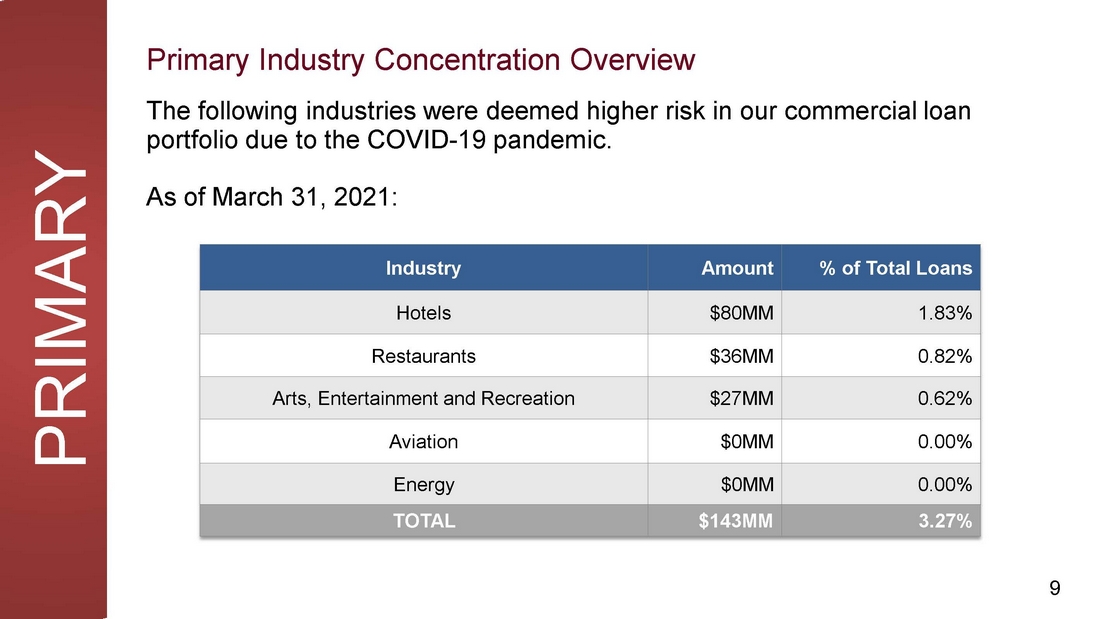
| PRIMARY The following industries were deemed higher risk in our commercial loan portfolio due to the COVID - 19 pandemic. As of March 31, 2021: Industry Amount % of Total Loans Hotels $80MM 1.83% Restaurants $36MM 0.82% Arts, Entertainment and Recreation $27MM 0.62% Aviation $0MM 0.00% Energy $0MM 0.00% TOTAL $143MM 3.27% Primary Industry Concentration Overview 9 |
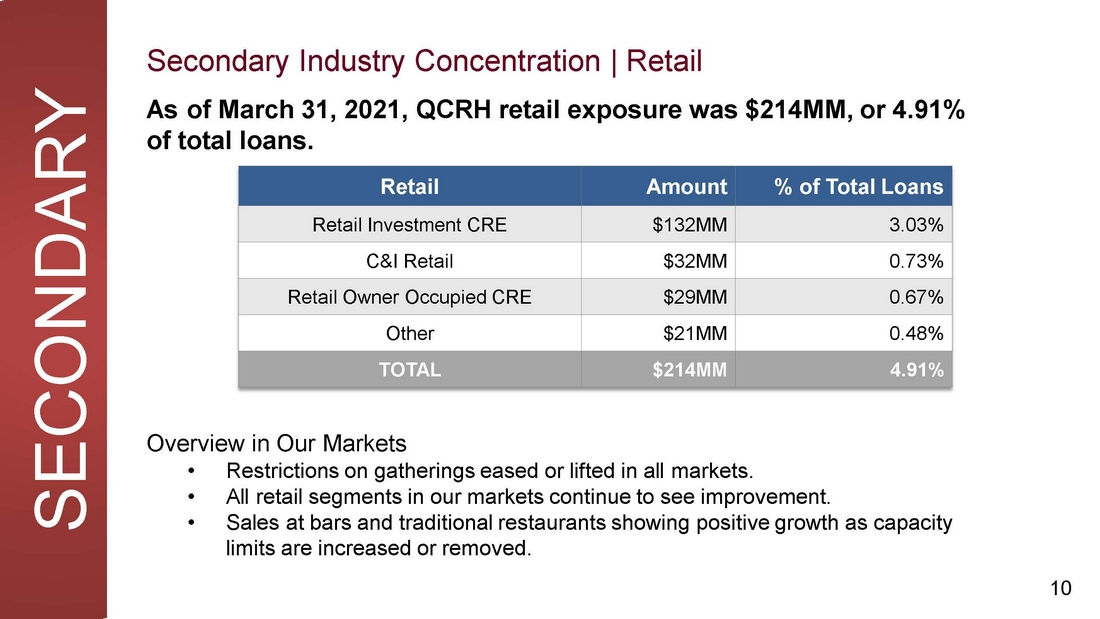
| SECONDARY Secondary Industry Concentration | Retail As of March 31, 2021, QCRH retail exposure was $214MM, or 4.91% of total loans. 10 Overview in Our Markets • Restrictions on gatherings eased or lifted in all markets. • All retail segments in our markets continue to see improvement. • Sales at bars and traditional restaurants showing positive growth as capacity limits are increased or removed. Retail Amount % of Total Loans Retail Investment CRE $132MM 3.03% C&I Retail $32MM 0.73% Retail Owner Occupied CRE $29MM 0.67% Other $21MM 0.48% TOTAL $214MM 4.91% |