Attached files
| file | filename |
|---|---|
| 8-K - 8-K - EDISON INTERNATIONAL | eix-20210427x8k.htm |
| EX-99.2 - EXHIBIT 99.2 EIX Q1 2021 CONFERENCE CALL PREPARED REMARKS DATED APRIL 27, 2021 - EDISON INTERNATIONAL | eix-20210427xex99d2.htm |
| EX-99.1 - EXHIBIT 99.1 EDISON INTERNATIONAL PRESS RELEASE DATED APRIL 27, 2021 - EDISON INTERNATIONAL | eix-20210427xex99d1.htm |
Exhibit 99.3
| April 27, 2021 First Quarter 2021 Financial Results |
| 1 Statements contained in this presentation about future performance, including, without limitation, operating results, capital expenditures, rate base growth, dividend policy, financial outlook, and other statements that are not purely historical, are forward-looking statements. These forward-looking statements reflect our current expectations; however, such statements involve risks and uncertainties. Actual results could differ materially from current expectations. These forward-looking statements represent our expectations only as of the date of this presentation, and Edison International assumes no duty to update them to reflect new information, events or circumstances. Important factors that could cause different results include, but are not limited to the: • ability of SCE to recover its costs through regulated rates, including uninsured wildfire-related and debris flow-related costs, costs incurred to mitigate the risk of utility equipment causing future wildfires, costs incurred to implement SCE's new customer service system and costs incurred as a result of the COVID-19 pandemic; • ability of SCE to implement its Wildfire Mitigation Plan; • risks of regulatory or legislative restrictions that would limit SCE’s ability to implement Public Safety Power Shutoff (“PSPS”) when conditions warrant or would otherwise limit SCE’s operational PSPS practices; • risks associated with implementing PSPS, including regulatory fines and penalties, claims for damages and reputational harm; • ability of SCE to maintain a valid safety certification; • ability to obtain sufficient insurance at a reasonable cost, including insurance relating to SCE's nuclear facilities and wildfire-related claims, and to recover the costs of such insurance or, in the event liabilities exceed insured amounts, the ability to recover uninsured losses from customers or other parties; • extreme weather-related incidents (including events caused, or exacerbated, by climate change, such as wildfires, debris flows, high wind events and extreme heat events) and other natural disasters (such as earthquakes), which could cause, among other things, public safety issues, property damage, operational issues (such as rotating outages and issues due to damaged infrastructure), PSPS activations and unanticipated costs; • risks associated with California Assembly Bill 1054 (“AB 1054”) effectively mitigating the significant risk faced by California investor-owned utilities related to liability for damages arising from catastrophic wildfires where utility facilities are alleged to be a substantial cause, including the longevity of the Wildfire Insurance Fund and the CPUC's interpretation of and actions under AB 1054, including its interpretation of the new prudency standard established under AB 1054; • decisions and other actions by the California Public Utilities Commission, the Federal Energy Regulatory Commission, the Nuclear Regulatory Commission and other governmental authorities, including decisions and actions related to nationwide or statewide crisis, determinations of authorized rates of return or return on equity, the recoverability of wildfire-related and debris-flow-related costs, issuance of SCE's wildfire safety certification, wildfire mitigation efforts, and delays in executive, regulatory and legislative actions; • ability of Edison International or SCE to borrow funds and access bank and capital markets on reasonable terms; • risks associated with the decommissioning of San Onofre, including those related to worker and public safety, public opposition, permitting, governmental approvals, on- site storage of spent nuclear fuel, delays, contractual disputes, and cost overruns; • pandemics, such as COVID-19, and other events that cause regional, statewide, national or global disruption, which could impact, among other things, Edison International's and SCE's business, operations, cash flows, liquidity and/or financial results and cause Edison International and SCE to incur unanticipated costs; • physical security of Edison International's and SCE's critical assets and personnel and the cybersecurity of Edison International's and SCE's critical information technology systems for grid control, and business, employee and customer data; • risks associated with cost allocation resulting in higher rates for utility bundled service customers because of possible customer bypass or departure for other electricity providers such as Community Choice Aggregators (“CCA,” which are cities, counties, and certain other public agencies with the authority to generate and/or purchase electricity for their local residents and businesses) and Electric Service Providers (entities that offer electric power and ancillary services to retail customers, other than electrical corporations (like SCE) and CCAs); • risks inherent in SCE's transmission and distribution infrastructure investment program, including those related to project site identification, public opposition, environmental mitigation, construction, permitting, power curtailment costs (payments due under power contracts in the event there is insufficient transmission to enable acceptance of power delivery), changes in the California Independent System Operator’s transmission plans, and governmental approvals; and • risks associated with the operation of transmission and distribution assets and power generating facilities, including worker and public safety issues, the risk of utility assets causing or contributing to wildfires, failure, availability, efficiency, and output of equipment and facilities, and availability and cost of spare parts. Other important factors are discussed under the headings “Forward-Looking Statements”, “Risk Factors” and “Management’s Discussion and Analysis” in Edison International’s Form 10-K and other reports filed with the Securities and Exchange Commission, which are available on our website: www.edisoninvestor.com. These filings also provide additional information on historical and other factual data contained in this presentation. Forward-Looking Statements April 27, 2021 |
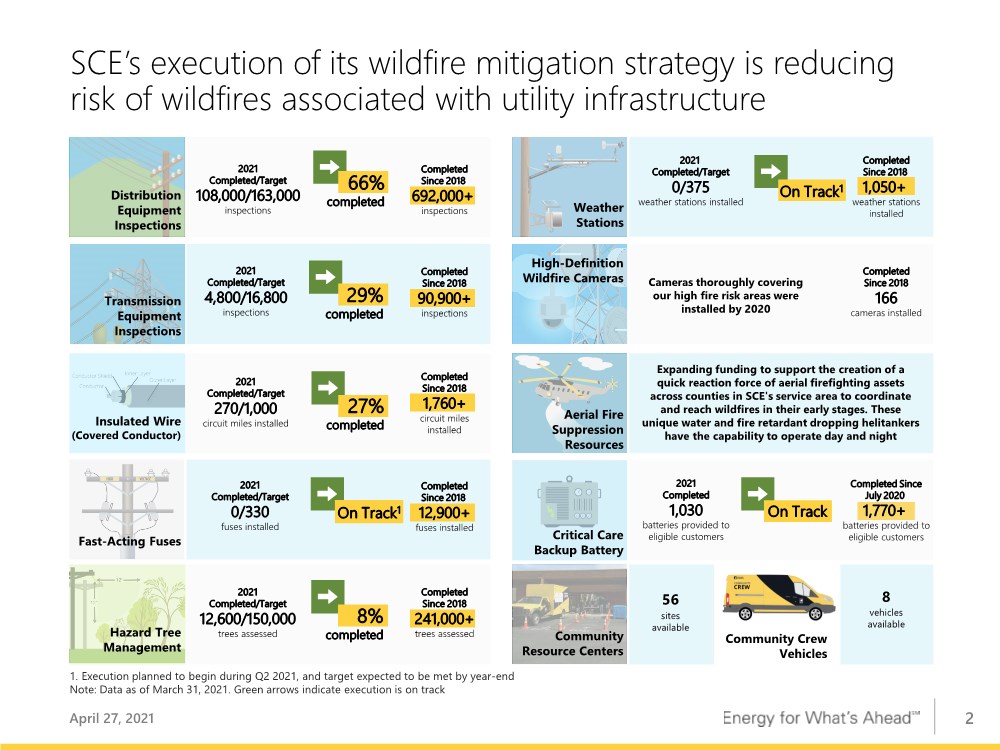
| 2 SCE’s execution of its wildfire mitigation strategy is reducing risk of wildfires associated with utility infrastructure April 27, 2021 Community Resource Centers Community Crew Vehicles 56 sites available 8 vehicles available High-Definition Wildfire Cameras Completed Since 2018 166 cameras installed Cameras thoroughly covering our high fire risk areas were installed by 2020 Distribution Equipment Inspections 2021 Completed/Target 108,000/163,000 inspections Completed Since 2018 692,000+ inspections 66% completed Transmission Equipment Inspections 2021 Completed/Target 4,800/16,800 inspections Completed Since 2018 90,900+ inspections 29% completed Insulated Wire (Covered Conductor) 2021 Completed/Target 270/1,000 circuit miles installed Completed Since 2018 1,760+ circuit miles installed 27% completed Fast-Acting Fuses 2021 Completed/Target 0/330 fuses installed Completed Since 2018 12,900+ fuses installed On Track1 Hazard Tree Management 2021 Completed/Target 12,600/150,000 trees assessed Completed Since 2018 241,000+ trees assessed 8% completed Weather Stations 2021 Completed/Target 0/375 weather stations installed Completed Since 2018 1,050+ weather stations installed On Track1 Aerial Fire Suppression Resources Expanding funding to support the creation of a quick reaction force of aerial firefighting assets across counties in SCE's service area to coordinate and reach wildfires in their early stages. These unique water and fire retardant dropping helitankers have the capability to operate day and night Critical Care Backup Battery Completed Since July 2020 1,770+ batteries provided to eligible customers 2021 Completed 1,030 batteries provided to eligible customers On Track 1. Execution planned to begin during Q2 2021, and target expected to be met by year-end Note: Data as of March 31, 2021. Green arrows indicate execution is on track |
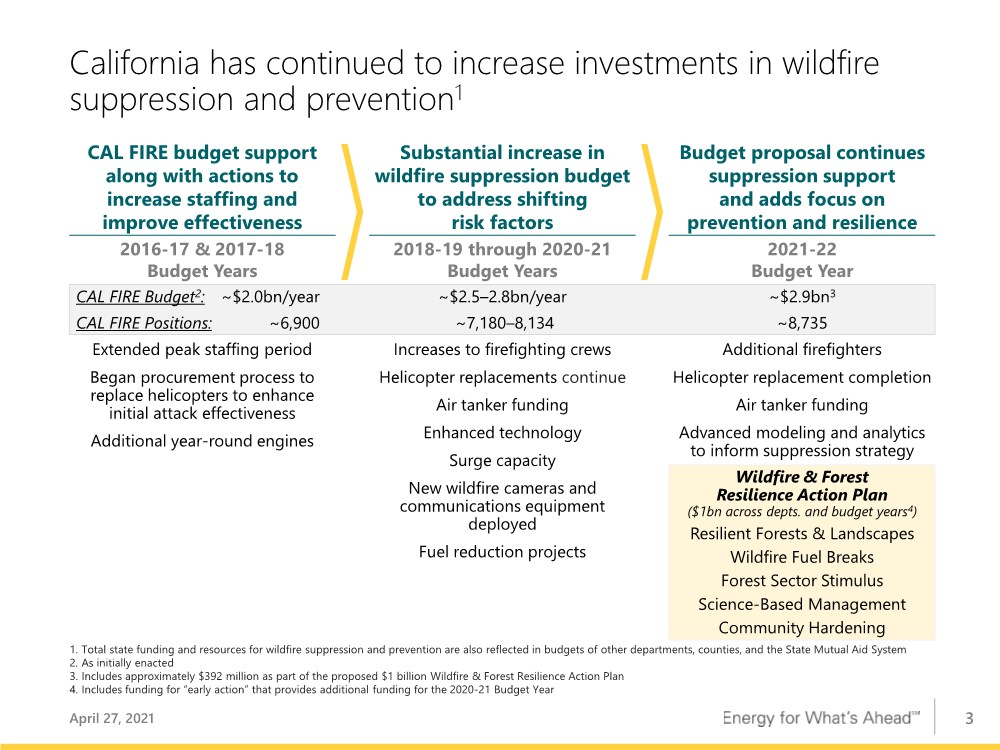
| 3 California has continued to increase investments in wildfire suppression and prevention1 April 27, 2021 CAL FIRE budget support along with actions to increase staffing and improve effectiveness ~$2.5–2.8bn/year ~7,180–8,134 Increases to firefighting crews Helicopter replacements continue Air tanker funding Enhanced technology Surge capacity New wildfire cameras and communications equipment deployed Fuel reduction projects ~$2.9bn3 ~8,735 Additional firefighters Helicopter replacement completion Air tanker funding Advanced modeling and analytics to inform suppression strategy Wildfire & Forest Resilience Action Plan ($1bn across depts. and budget years4) Resilient Forests & Landscapes Wildfire Fuel Breaks Forest Sector Stimulus Science-Based Management Community Hardening Substantial increase in wildfire suppression budget to address shifting risk factors Budget proposal continues suppression support and adds focus on prevention and resilience 2016-17 & 2017-18 Budget Years 2018-19 through 2020-21 Budget Years 2021-22 Budget Year CAL FIRE Budget2: ~$2.0bn/year CAL FIRE Positions: ~6,900 Extended peak staffing period Began procurement process to replace helicopters to enhance initial attack effectiveness Additional year-round engines 1. Total state funding and resources for wildfire suppression and prevention are also reflected in budgets of other departments, counties, and the State Mutual Aid System 2. As initially enacted 3. Includes approximately $392 million as part of the proposed $1 billion Wildfire & Forest Resilience Action Plan 4. Includes funding for “early action” that provides additional funding for the 2020-21 Budget Year |
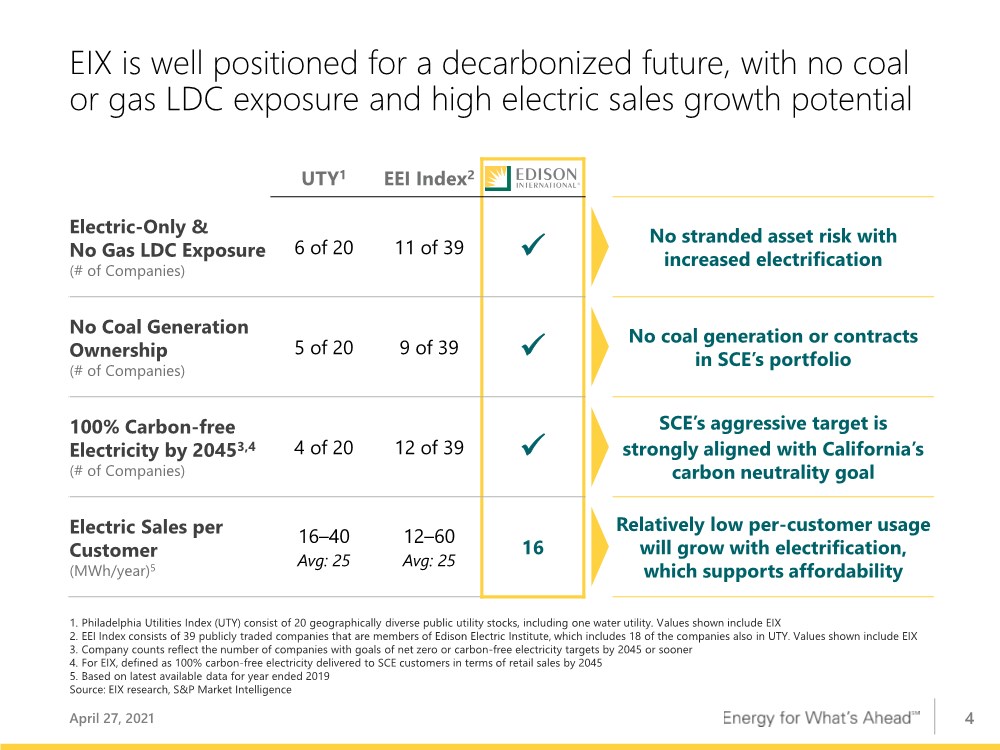
| 4 EIX is well positioned for a decarbonized future, with no coal or gas LDC exposure and high electric sales growth potential UTY1 EEI Index2 Electric-Only & No Gas LDC Exposure (# of Companies) 6 of 20 11 of 39 ✓ No stranded asset risk with increased electrification No Coal Generation Ownership (# of Companies) 5 of 20 9 of 39 ✓ No coal generation or contracts in SCE’s portfolio 100% Carbon-free Electricity by 20453,4 (# of Companies) 4 of 20 12 of 39 ✓ SCE’s aggressive target is strongly aligned with California’s carbon neutrality goal Electric Sales per Customer (MWh/year)5 16–40 Avg: 25 12–60 Avg: 25 16 Relatively low per-customer usage will grow with electrification, which supports affordability 1. Philadelphia Utilities Index (UTY) consist of 20 geographically diverse public utility stocks, including one water utility. Values shown include EIX 2. EEI Index consists of 39 publicly traded companies that are members of Edison Electric Institute, which includes 18 of the companies also in UTY. Values shown include EIX 3. Company counts reflect the number of companies with goals of net zero or carbon-free electricity targets by 2045 or sooner 4. For EIX, defined as 100% carbon-free electricity delivered to SCE customers in terms of retail sales by 2045 5. Based on latest available data for year ended 2019 Source: EIX research, S&P Market Intelligence April 27, 2021 |
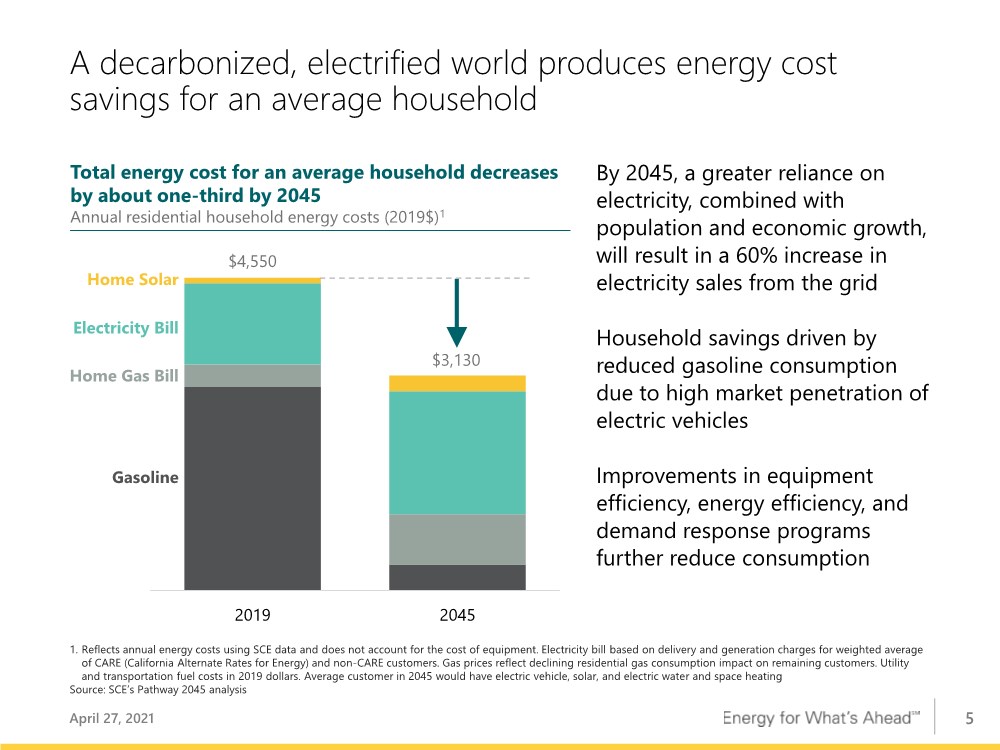
| 5 Annual residential household energy costs (2019$)1 2019 2045 By 2045, a greater reliance on electricity, combined with population and economic growth, will result in a 60% increase in electricity sales from the grid Household savings driven by reduced gasoline consumption due to high market penetration of electric vehicles Improvements in equipment efficiency, energy efficiency, and demand response programs further reduce consumption Total energy cost for an average household decreases by about one-third by 2045 A decarbonized, electrified world produces energy cost savings for an average household $3,130 $4,550 Home Solar Electricity Bill Home Gas Bill Gasoline 1. Reflects annual energy costs using SCE data and does not account for the cost of equipment. Electricity bill based on delivery and generation charges for weighted average of CARE (California Alternate Rates for Energy) and non-CARE customers. Gas prices reflect declining residential gas consumption impact on remaining customers. Utility and transportation fuel costs in 2019 dollars. Average customer in 2045 would have electric vehicle, solar, and electric water and space heating Source: SCE’s Pathway 2045 analysis April 27, 2021 |
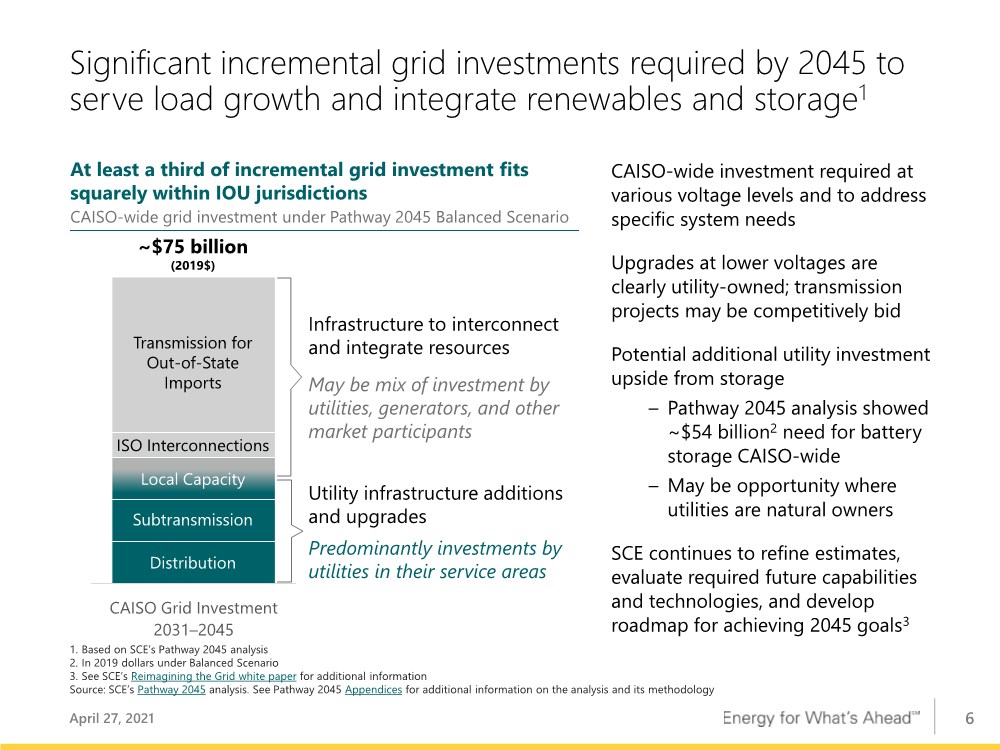
| 6 Significant incremental grid investments required by 2045 to serve load growth and integrate renewables and storage1 April 27, 2021 1. Based on SCE’s Pathway 2045 analysis 2. In 2019 dollars under Balanced Scenario 3. See SCE’s Reimagining the Grid white paper for additional information Source: SCE’s Pathway 2045 analysis. See Pathway 2045 Appendices for additional information on the analysis and its methodology CAISO Grid Investment 2031–2045 At least a third of incremental grid investment fits squarely within IOU jurisdictions CAISO-wide grid investment under Pathway 2045 Balanced Scenario ~$75 billion (2019$) Transmission for Out-of-State Imports ISO Interconnections Local Capacity Distribution Subtransmission Infrastructure to interconnect and integrate resources May be mix of investment by utilities, generators, and other market participants Utility infrastructure additions and upgrades Predominantly investments by utilities in their service areas CAISO-wide investment required at various voltage levels and to address specific system needs Upgrades at lower voltages are clearly utility-owned; transmission projects may be competitively bid Potential additional utility investment upside from storage – Pathway 2045 analysis showed ~$54 billion2 need for battery storage CAISO-wide – May be opportunity where utilities are natural owners SCE continues to refine estimates, evaluate required future capabilities and technologies, and develop roadmap for achieving 2045 goals3 |
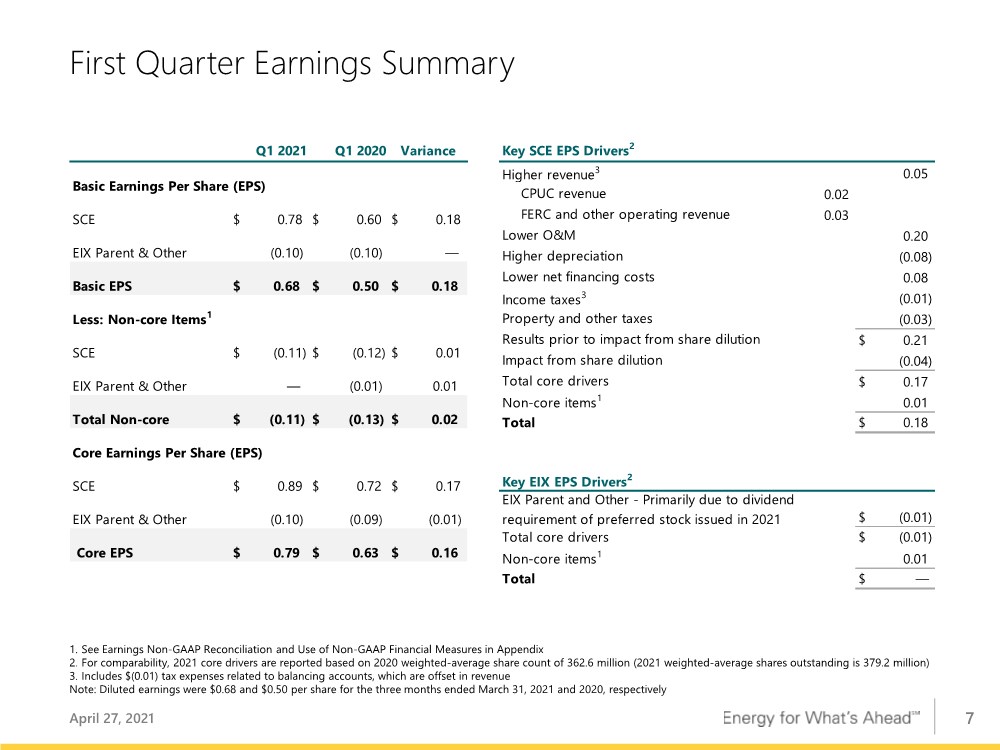
| 7 Key SCE EPS Drivers2 Higher revenue3 0.05 CPUC revenue 0.02 FERC and other operating revenue 0.03 Lower O&M 0.20 Higher depreciation (0.08) Lower net financing costs 0.08 Income taxes3 (0.01) Property and other taxes (0.03) Results prior to impact from share dilution 0.21 $ Impact from share dilution (0.04) Total core drivers 0.17 $ Non-core items1 0.01 Total 0.18 $ (0.01) $ Total core drivers (0.01) $ Non-core items1 0.01 Total — $ Key EIX EPS Drivers2 EIX Parent and Other - Primarily due to dividend requirement of preferred stock issued in 2021 First Quarter Earnings Summary April 27, 2021 1. See Earnings Non-GAAP Reconciliation and Use of Non-GAAP Financial Measures in Appendix 2. For comparability, 2021 core drivers are reported based on 2020 weighted-average share count of 362.6 million (2021 weighted-average shares outstanding is 379.2 million) 3. Includes $(0.01) tax expenses related to balancing accounts, which are offset in revenue Note: Diluted earnings were $0.68 and $0.50 per share for the three months ended March 31, 2021 and 2020, respectively Q1 2021 Q1 2020 Variance Basic Earnings Per Share (EPS) SCE $ 0.78 $ 0.60 $ 0.18 EIX Parent & Other (0.10) (0.10) — Basic EPS $ 0.68 $ 0.50 $ 0.18 Less: Non-core Items1 SCE $ (0.11) $ (0.12) $ 0.01 EIX Parent & Other — (0.01) 0.01 Total Non-core $ (0.11) $ (0.13) $ 0.02 Core Earnings Per Share (EPS) SCE $ 0.89 $ 0.72 $ 0.17 EIX Parent & Other (0.10) (0.09) (0.01) Core EPS $ 0.79 $ 0.63 $ 0.16 |
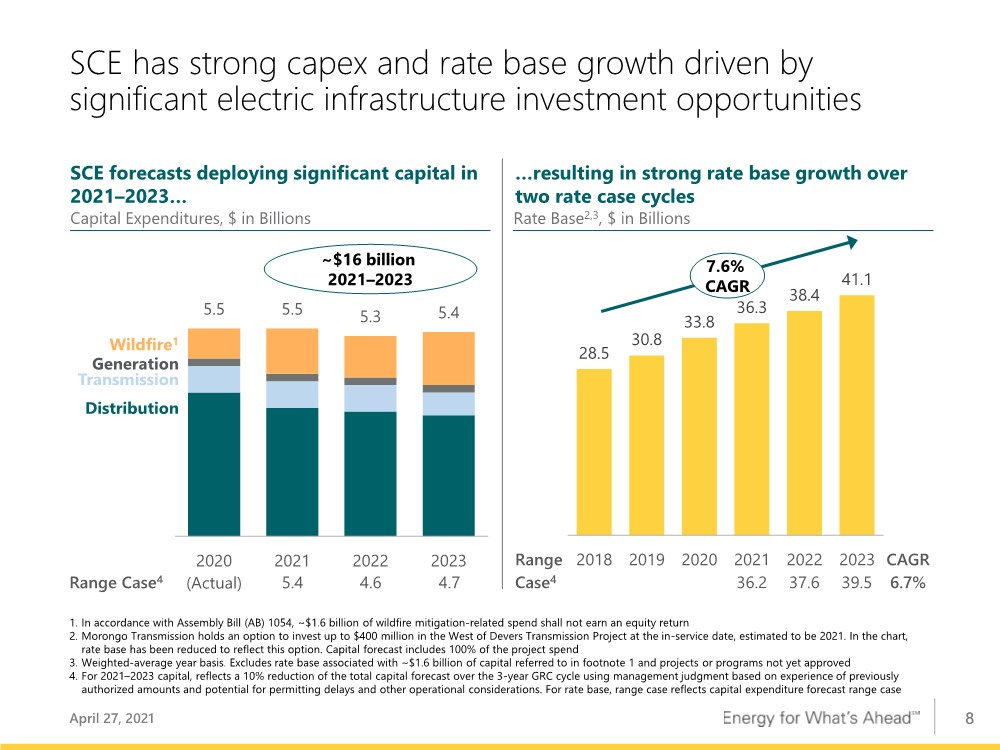
| 8 5.5 5.5 5.3 5.4 2020 (Actual) 2021 2022 2023 SCE has strong capex and rate base growth driven by significant electric infrastructure investment opportunities 1. In accordance with Assembly Bill (AB) 1054, ~$1.6 billion of wildfire mitigation-related spend shall not earn an equity return 2. Morongo Transmission holds an option to invest up to $400 million in the West of Devers Transmission Project at the in-service date, estimated to be 2021. In the chart, rate base has been reduced to reflect this option. Capital forecast includes 100% of the project spend 3. Weighted-average year basis. Excludes rate base associated with ~$1.6 billion of capital referred to in footnote 1 and projects or programs not yet approved 4. For 2021–2023 capital, reflects a 10% reduction of the total capital forecast over the 3-year GRC cycle using management judgment based on experience of previously authorized amounts and potential for permitting delays and other operational considerations. For rate base, range case reflects capital expenditure forecast range case SCE forecasts deploying significant capital in 2021–2023… Capital Expenditures, $ in Billions Wildfire1 …resulting in strong rate base growth over two rate case cycles Rate Base2,3, $ in Billions 7.6% CAGR Generation Transmission Distribution ~$16 billion 2021–2023 Range Case4 5.4 4.6 4.7 Range Case4 36.2 37.6 39.5 CAGR 6.7% 28.5 30.8 33.8 36.3 38.4 41.1 2018 2019 2020 2021 2022 2023 April 27, 2021 |
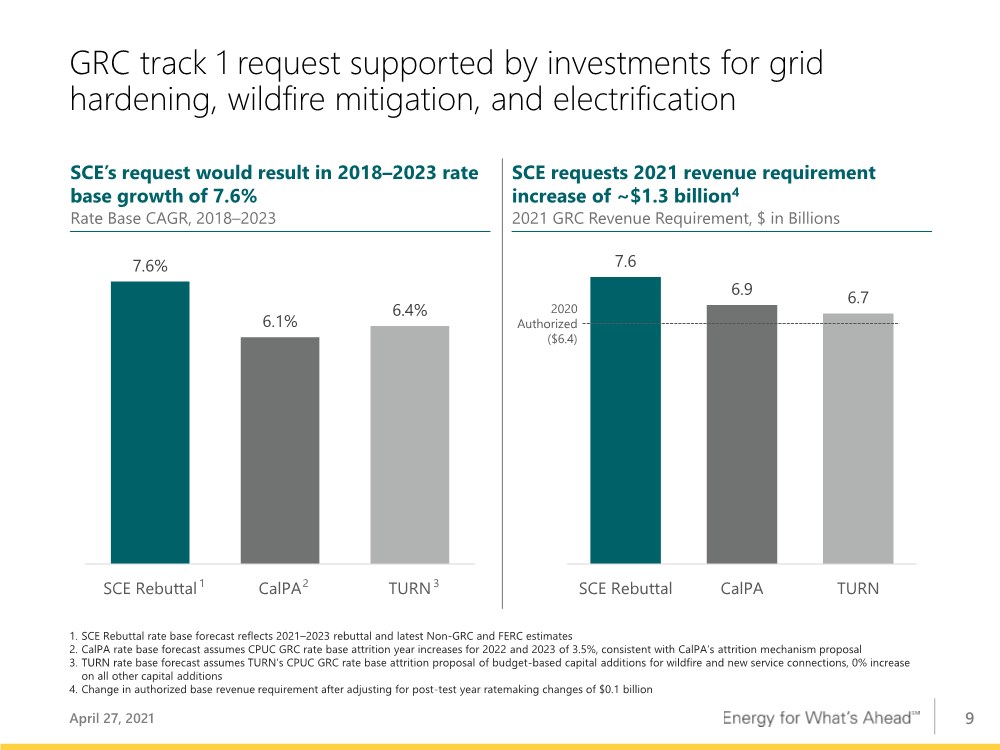
| 9 GRC track 1 request supported by investments for grid hardening, wildfire mitigation, and electrification 1. SCE Rebuttal rate base forecast reflects 2021–2023 rebuttal and latest Non-GRC and FERC estimates 2. CalPA rate base forecast assumes CPUC GRC rate base attrition year increases for 2022 and 2023 of 3.5%, consistent with CalPA’s attrition mechanism proposal 3. TURN rate base forecast assumes TURN’s CPUC GRC rate base attrition proposal of budget-based capital additions for wildfire and new service connections, 0% increase on all other capital additions 4. Change in authorized base revenue requirement after adjusting for post-test year ratemaking changes of $0.1 billion SCE requests 2021 revenue requirement increase of ~$1.3 billion4 2021 GRC Revenue Requirement, $ in Billions SCE’s request would result in 2018–2023 rate base growth of 7.6% Rate Base CAGR, 2018–2023 7.6% 6.1% 6.4% SCE Rebuttal CalPA TURN 7.6 6.9 6.7 SCE Rebuttal CalPA TURN 2020 Authorized ($6.4) 1 3 2 April 27, 2021 |
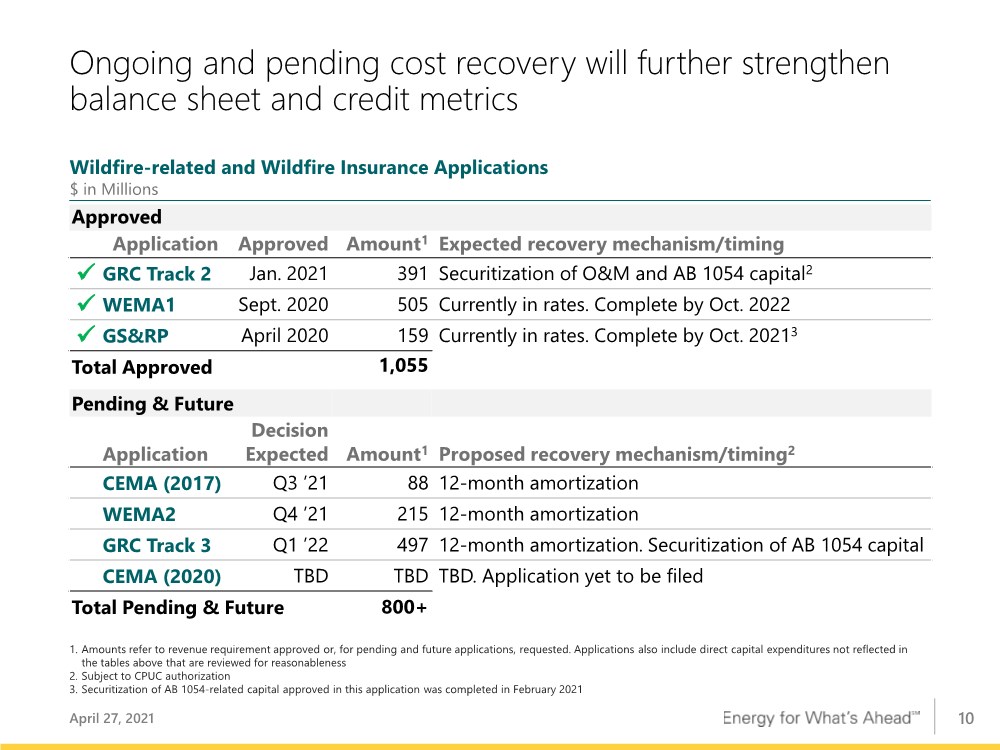
| 10 Ongoing and pending cost recovery will further strengthen balance sheet and credit metrics Approved Application Approved Amount1 Expected recovery mechanism/timing ✓ GRC Track 2 Jan. 2021 391 Securitization of O&M and AB 1054 capital2 ✓ WEMA1 Sept. 2020 505 Currently in rates. Complete by Oct. 2022 ✓ GS&RP April 2020 159 Currently in rates. Complete by Oct. 20213 Total Approved 1,055 Pending & Future Application Decision Expected Amount1 Proposed recovery mechanism/timing2 CEMA (2017) Q3 ’21 88 12-month amortization WEMA2 Q4 ’21 215 12-month amortization GRC Track 3 Q1 ’22 497 12-month amortization. Securitization of AB 1054 capital CEMA (2020) TBD TBD TBD. Application yet to be filed Total Pending & Future 800+ 1. Amounts refer to revenue requirement approved or, for pending and future applications, requested. Applications also include direct capital expenditures not reflected in the tables above that are reviewed for reasonableness 2. Subject to CPUC authorization 3. Securitization of AB 1054-related capital approved in this application was completed in February 2021 April 27, 2021 Wildfire-related and Wildfire Insurance Applications $ in Millions |
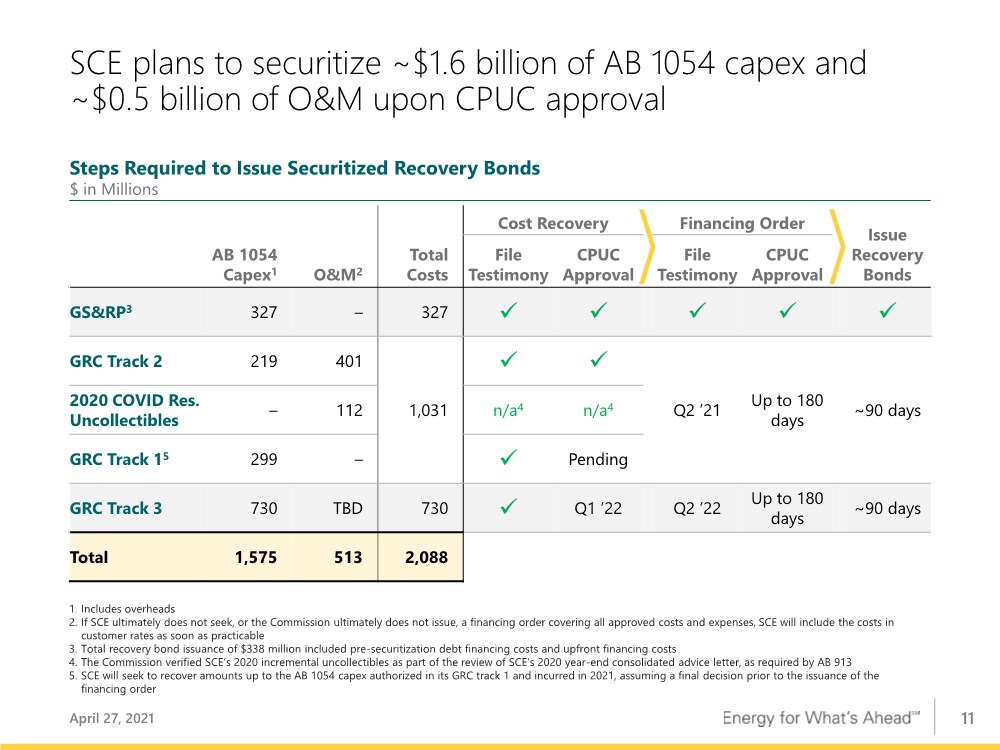
| 11 SCE plans to securitize ~$1.6 billion of AB 1054 capex and ~$0.5 billion of O&M upon CPUC approval April 27, 2021 O&M2 Total Costs Cost Recovery Financing Order Issue Recovery Bonds AB 1054 Capex1 File Testimony CPUC Approval File Testimony CPUC Approval GS&RP3 327 – 327 ✓ ✓ ✓ ✓ ✓ GRC Track 2 219 401 1,031 ✓ ✓ Q2 ’21 Up to 180 days ~90 days 2020 COVID Res. Uncollectibles – 112 n/a4 n/a4 GRC Track 15 299 – ✓ Pending GRC Track 3 730 TBD 730 ✓ Q1 ’22 Q2 ’22 Up to 180 days ~90 days Total 1,575 513 2,088 1. Includes overheads 2. If SCE ultimately does not seek, or the Commission ultimately does not issue, a financing order covering all approved costs and expenses, SCE will include the costs in customer rates as soon as practicable 3. Total recovery bond issuance of $338 million included pre-securitization debt financing costs and upfront financing costs 4. The Commission verified SCE’s 2020 incremental uncollectibles as part of the review of SCE’s 2020 year-end consolidated advice letter, as required by AB 913 5. SCE will seek to recover amounts up to the AB 1054 capex authorized in its GRC track 1 and incurred in 2021, assuming a final decision prior to the issuance of the financing order Steps Required to Issue Securitized Recovery Bonds $ in Millions |
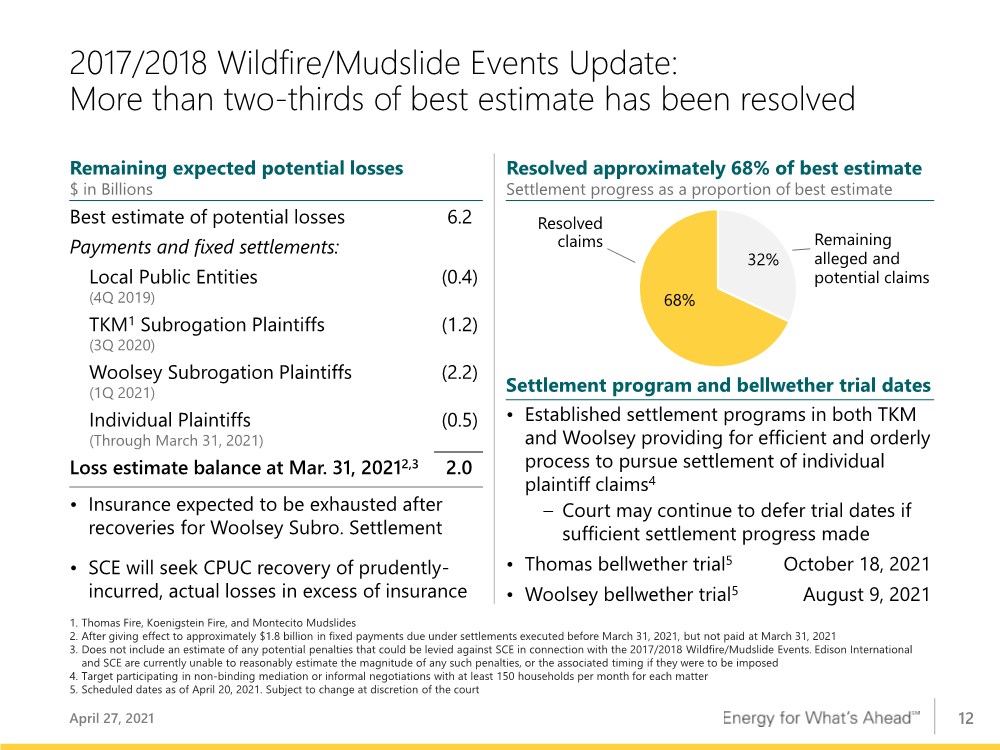
| 12 2017/2018 Wildfire/Mudslide Events Update: More than two-thirds of best estimate has been resolved 1. Thomas Fire, Koenigstein Fire, and Montecito Mudslides 2. After giving effect to approximately $1.8 billion in fixed payments due under settlements executed before March 31, 2021, but not paid at March 31, 2021 3. Does not include an estimate of any potential penalties that could be levied against SCE in connection with the 2017/2018 Wildfire/Mudslide Events. Edison International and SCE are currently unable to reasonably estimate the magnitude of any such penalties, or the associated timing if they were to be imposed 4. Target participating in non-binding mediation or informal negotiations with at least 150 households per month for each matter 5. Scheduled dates as of April 20, 2021. Subject to change at discretion of the court April 27, 2021 Remaining expected potential losses $ in Billions Resolved approximately 68% of best estimate Best estimate of potential losses 6.2 Payments and fixed settlements: Local Public Entities (4Q 2019) (0.4) TKM1 Subrogation Plaintiffs (3Q 2020) (1.2) Woolsey Subrogation Plaintiffs (1Q 2021) (2.2) Individual Plaintiffs (Through March 31, 2021) (0.5) Loss estimate balance at Mar. 31, 20212,3 2.0 • Established settlement programs in both TKM and Woolsey providing for efficient and orderly process to pursue settlement of individual plaintiff claims4 – Court may continue to defer trial dates if sufficient settlement progress made • Thomas bellwether trial5 October 18, 2021 • Woolsey bellwether trial5 August 9, 2021 Settlement program and bellwether trial dates 32% 68% Settlement progress as a proportion of best estimate Resolved claims Remaining alleged and potential claims • Insurance expected to be exhausted after recoveries for Woolsey Subro. Settlement • SCE will seek CPUC recovery of prudently- incurred, actual losses in excess of insurance |
| Appendix |

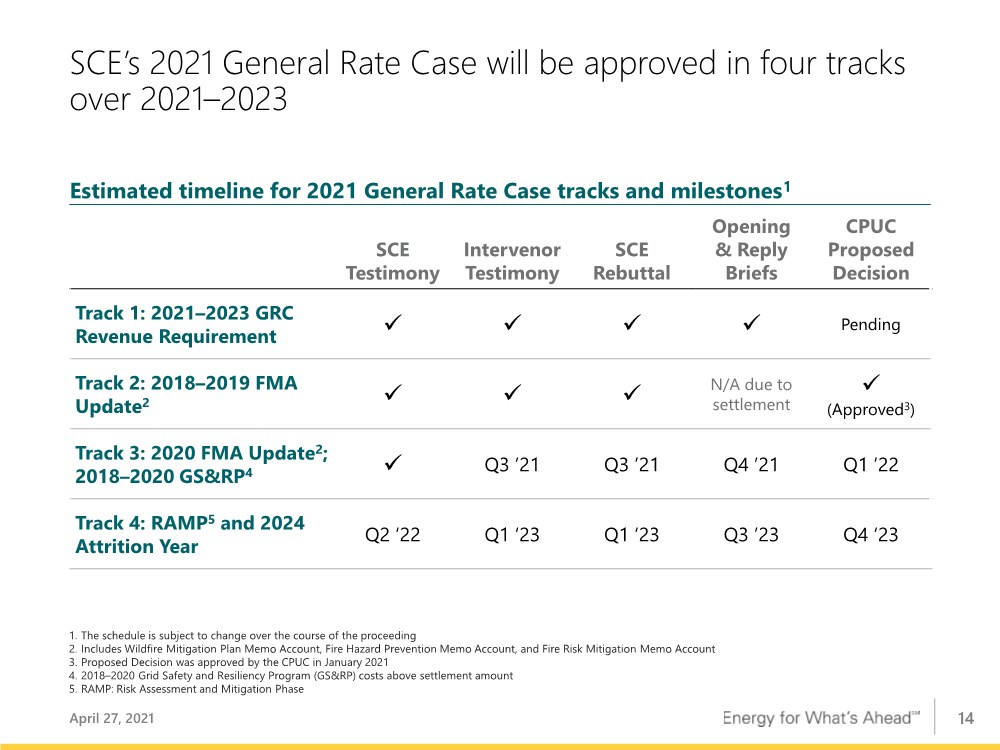
| 14 SCE’s 2021 General Rate Case will be approved in four tracks over 2021–2023 SCE Testimony Intervenor Testimony SCE Rebuttal Opening & Reply Briefs CPUC Proposed Decision Track 1: 2021–2023 GRC Revenue Requirement ✓ ✓ ✓ ✓ Pending Track 2: 2018–2019 FMA Update2 ✓ ✓ ✓ N/A due to settlement ✓ (Approved3) Track 3: 2020 FMA Update2; 2018–2020 GS&RP4 ✓ Q3 ’21 Q3 ’21 Q4 ’21 Q1 ’22 Track 4: RAMP5 and 2024 Attrition Year Q2 ‘22 Q1 ‘23 Q1 ‘23 Q3 ’23 Q4 ‘23 1. The schedule is subject to change over the course of the proceeding 2. Includes Wildfire Mitigation Plan Memo Account, Fire Hazard Prevention Memo Account, and Fire Risk Mitigation Memo Account 3. Proposed Decision was approved by the CPUC in January 2021 4. 2018–2020 Grid Safety and Resiliency Program (GS&RP) costs above settlement amount 5. RAMP: Risk Assessment and Mitigation Phase Estimated timeline for 2021 General Rate Case tracks and milestones1 April 27, 2021 |
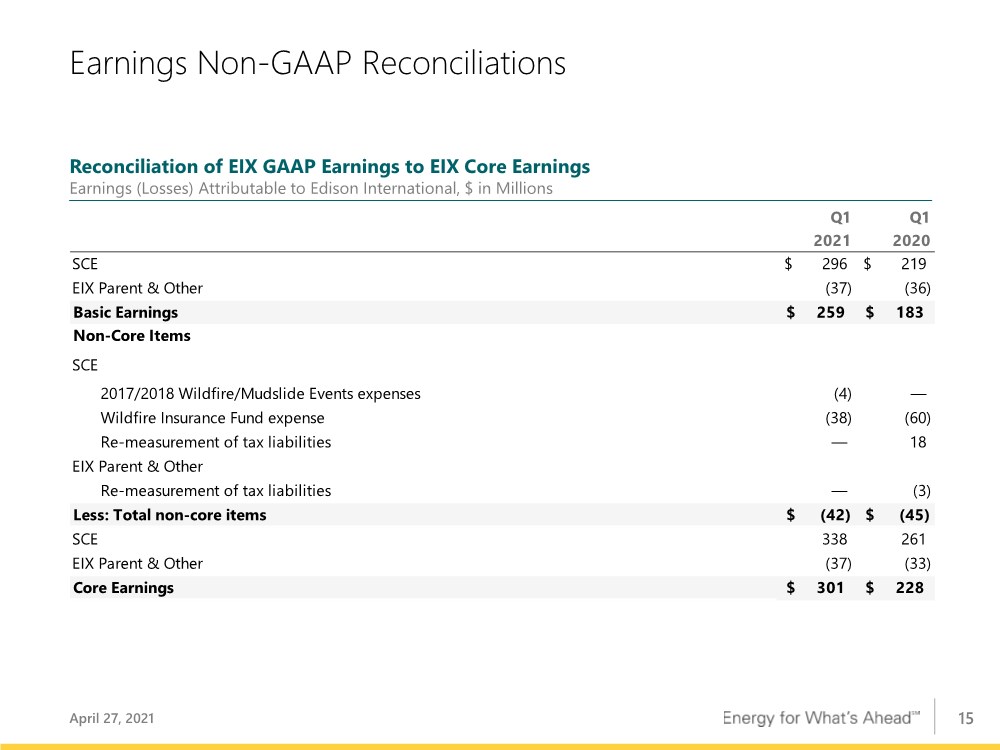
| 15 Earnings Non-GAAP Reconciliations April 27, 2021 Q1 2021 Q1 2020 SCE 296 $ 219 $ EIX Parent & Other (37) (36) Basic Earnings 259 $ 183 $ Non-Core Items SCE 2017/2018 Wildfire/Mudslide Events expenses (4) — Wildfire Insurance Fund expense (38) (60) Re-measurement of tax liabilities — 18 EIX Parent & Other Re-measurement of tax liabilities — (3) Less: Total non-core items (42) $ (45) $ SCE 338 261 EIX Parent & Other (37) (33) Core Earnings 301 $ 228 $ Reconciliation of EIX GAAP Earnings to EIX Core Earnings Earnings (Losses) Attributable to Edison International, $ in Millions |
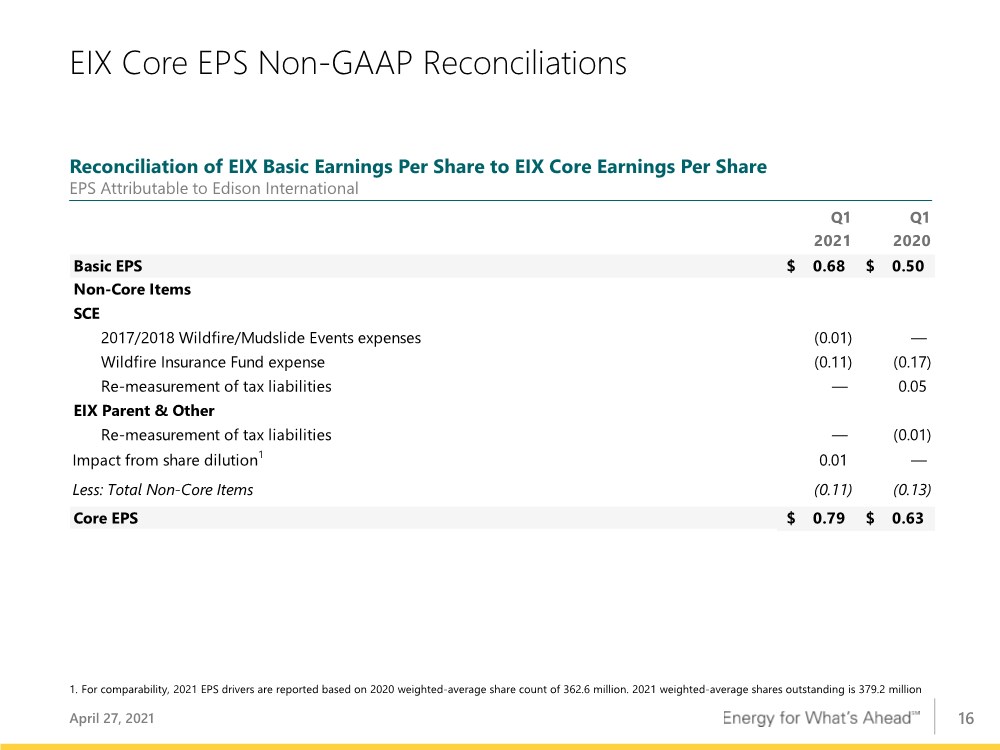
| 16 EIX Core EPS Non-GAAP Reconciliations April 27, 2021 1. For comparability, 2021 EPS drivers are reported based on 2020 weighted-average share count of 362.6 million. 2021 weighted-average shares outstanding is 379.2 million Q1 2021 Q1 2020 Basic EPS 0.68 $ 0.50 $ Non-Core Items SCE 2017/2018 Wildfire/Mudslide Events expenses (0.01) — Wildfire Insurance Fund expense (0.11) (0.17) Re-measurement of tax liabilities — 0.05 EIX Parent & Other Re-measurement of tax liabilities — (0.01) Impact from share dilution1 0.01 — Less: Total Non-Core Items (0.11) (0.13) Core EPS 0.79 $ 0.63 $ Reconciliation of EIX Basic Earnings Per Share to EIX Core Earnings Per Share EPS Attributable to Edison International |
| 17 Edison International's earnings are prepared in accordance with generally accepted accounting principles used in the United States. Management uses core earnings (losses) internally for financial planning and for analysis of performance. Core earnings (losses) are also used when communicating with investors and analysts regarding Edison International's earnings results to facilitate comparisons of the company's performance from period to period. Core earnings (losses) are a non-GAAP financial measure and may not be comparable to those of other companies. Core earnings (losses) are defined as earnings attributable to Edison International shareholders less non-core items. Non- core items include income or loss from discontinued operations and income or loss from significant discrete items that management does not consider representative of ongoing earnings, such as write downs, asset impairments and other income and expense related to changes in law, outcomes in tax, regulatory or legal proceedings, and exit activities, including sale of certain assets and other activities that are no longer continuing. A reconciliation of Non-GAAP information to GAAP information is included either on the slide where the information appears or on another slide referenced in this presentation. EIX Investor Relations Contact Sam Ramraj, Vice President (626) 302-2540 sam.ramraj@edisonintl.com Use of Non-GAAP Financial Measures April 27, 2021 |