Attached files
| file | filename |
|---|---|
| 8-K - 8-K - COASTAL FINANCIAL CORP | ck1437958-8k_20210427.htm |
April 27, 2021 INVESTOR PRESENTATION Exhibit 99.1
LEGAL INFORMATION AND DISCLAIMER This presentation and oral statements made regarding the subject of this presentation contain forward-looking statements within the meaning of the Private Securities Litigation Reform Act of 1995. These forward-looking statements reflect Coastal Financial Corporation (“Coastal” or “CFC”)’s current views with respect to, among other things, future events and Coastal’s financial performance. Any statements about Coastal’s expectations, beliefs, plans, predictions, forecasts, objectives, assumptions or future events or performance are not historical facts and may be forward-looking. These statements are often, but not always, made through the use of words or phrases such as “anticipate,” “believes,” “can,” “could,” “may,” “predicts,” “potential,” “should,” “will,” “estimate,” “plans,” “projects,” “continuing,” “ongoing,” “expects,” “intends” and similar words or phrases. Any or all of the forward-looking statements in (or conveyed orally regarding) this presentation may turn out to be inaccurate. The inclusion of or reference to forward-looking information in this presentation should not be regarded as a representation by Coastal or any other person that the future plans, estimates or expectations contemplated by Coastal will be achieved. Coastal has based these forward-looking statements largely on its current expectations and projections about future events and financial trends that Coastal believes may affect its financial condition, results of operations, business strategy and financial needs. Coastal’s actual results could differ materially from those anticipated in such forward-looking statements as a result of risks, uncertainties and assumptions that are difficult to predict. Factors that could cause actual results to differ materially from those in the forward-looking statements include, without limitation, the risks and uncertainties discussed under “Risk Factors” in Form 10-K for the year ended December 31, 2020, Coastal’s Quarterly Report on Form 10-Q for the most recent quarter, and in any of Coastal’s subsequent filings with the Securities and Exchange Commission. If one or more events related to these or other risks or uncertainties materialize, or if Coastal’s underlying assumptions prove to be incorrect, actual results may differ materially from what Coastal anticipates. You are cautioned not to place undue reliance on forward-looking statements. Further, any forward-looking statement speaks only as of the date on which it is made and Coastal undertakes no obligation to update or revise any forward-looking statement to reflect events or circumstances after the date on which the statement is made or to reflect the occurrence of unanticipated events. This presentation includes industry and trade association data, forecasts and information that Coastal has prepared based, in part, upon data, forecasts and information obtained from independent trade associations, industry publications and surveys, government agencies and other information publicly available to Coastal, which information may be specific to particular markets or geographic locations. Some data is also based on Coastal’s good faith estimates, which are derived from management’s knowledge of the industry and independent sources. Industry publications, surveys and forecasts generally state that the information contained therein has been obtained from sources believed to be reliable. Statements as to Coastal’s market position are based on market data currently available to Coastal. Although Coastal believes these sources are reliable, Coastal has not independently verified the information contained therein. While Coastal is not aware of any misstatements regarding the industry data presented in this presentation, Coastal’s estimates involve risks and uncertainties and are subject to change based on various factors. Similarly, Coastal believes that its internal research is reliable, even though such research has not been verified by independent sources. Trademarks referred to in this presentation are the property of their respective owners, although for presentational convenience we may not use the ® or the TM symbols to identify such trademarks. Non-GAAP Financial Measures This presentation includes certain non-GAAP financial measures for 2017 to exclude the impact of a deferred tax asset revaluation due to the enactment of the Tax Cuts and Jobs Act of 2017 (the “Tax Cuts and Jobs Act”), including adjusted net income, adjusted earnings per share, adjusted return on average assets and adjusted return on average shareholders’ equity. These non-GAAP financial measures and any other non-GAAP financial measures that we discuss in this presentation should not be considered in isolation, and should be considered as additions to, and not substitutes for or superior to, measures of financial performance prepared in accordance with GAAP. There are a number of limitations related to the use of these non-GAAP financial measures versus their most directly comparable GAAP equivalents. For example, other companies may calculate non-GAAP financial measures differently or may use other measures to evaluate their performance, all of which could reduce the usefulness of Coastal’s non-GAAP financial measures as tools for comparison. See the Appendix to this presentation for a reconciliation of the non-GAAP financial measures used in (or conveyed orally during) this presentation to their most directly comparable GAAP financial measures. This presentation also contains certain non-GAAP financial measures in addition to results presented in accordance with GAAP relating to “pre-tax, pre-provision net income” and “pre-tax, pre-provision return on average assets” to illustrate the impact of provision for loan losses and provision for income taxes on net income and return on average assets. The most directly comparable GAAP measure to “pre-tax, pre-provision net income” is net income. The most directly comparable GAAP measure to “pre-tax, pre-provision return on average assets” is return on average assets. See the Appendix to this presentation for a reconciliation of the non-GAAP financial measures used in (or conveyed orally during) this presentation to their most directly comparable GAAP financial measures. This presentation also contains certain non-GAAP financial measures in addition to results presented in accordance with GAAP to illustrate and identify the impact of Paycheck Protection Program (“PPP”) loans, Paycheck Protection Program Liquidity Facility (“PPPLF”) borrowings, customer deposits from PPP loans, and related earnings and expenses. By removing these significant items and show what the results would have been without them we are providing investors with the information to better compare results with periods that did not have these significant items. Adjusted Tier 1 leverage capital, excluding PPP loans is a non-GAAP measure that excludes the impact of PPP loans on balance sheet. The most directly comparable GAAP measure is Tier 1 leverage capital. See the Appendix to this presentation for a reconciliation of the non-GAAP financial measures used in (or conveyed orally during) this presentation to their most directly comparable GAAP financial measures.
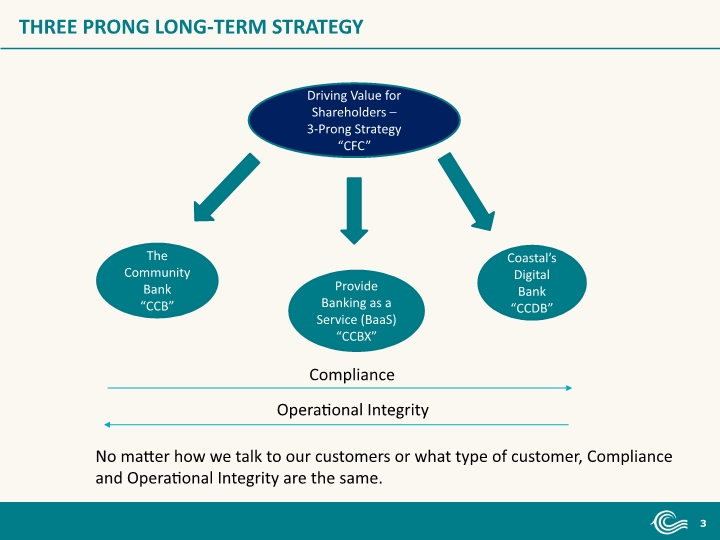
THREE PRONG LONG-TERM STRATEGY Driving Value for Shareholders – 3-Prong Strategy “CFC” The Community Bank “CCB” Provide Banking as a Service (BaaS) “CCBX” Coastal’s Digital Bank “CCDB” Compliance Operational Integrity No matter how we talk to our customers or what type of customer, Compliance and Operational Integrity are the same.
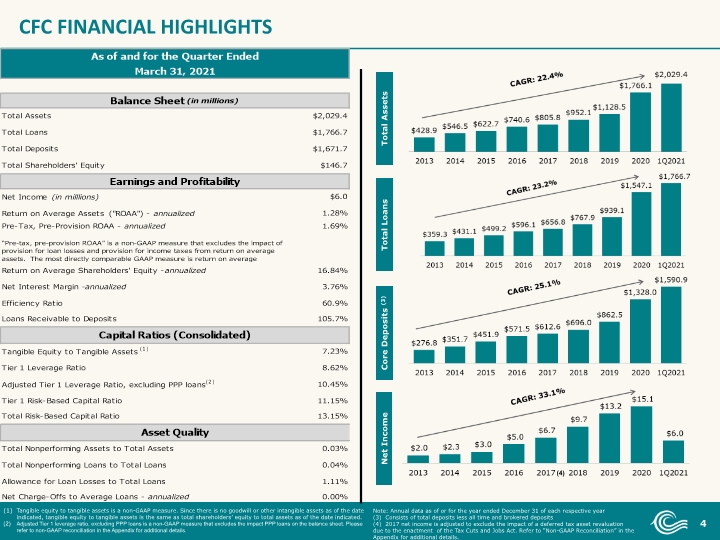
Core Deposits (3) CFC FINANCIAL HIGHLIGHTS Total Assets Note: Annual data as of or for the year ended December 31 of each respective year (3) Consists of total deposits less all time and brokered deposits (4) 2017 net income is adjusted to exclude the impact of a deferred tax asset revaluation due to the enactment of the Tax Cuts and Jobs Act. Refer to “Non-GAAP Reconciliation” in the Appendix for additional details. (4) Total Loans Net Income Tangible equity to tangible assets is a non-GAAP measure. Since there is no goodwill or other intangible assets as of the date indicated, tangible equity to tangible assets is the same as total shareholders’ equity to total assets as of the date indicated. Adjusted Tier 1 leverage ratio, excluding PPP loans is a non-GAAP measure that excludes the impact PPP loans on the balance sheet. Please refer to non-GAAP reconciliation in the Appendix for additional details.
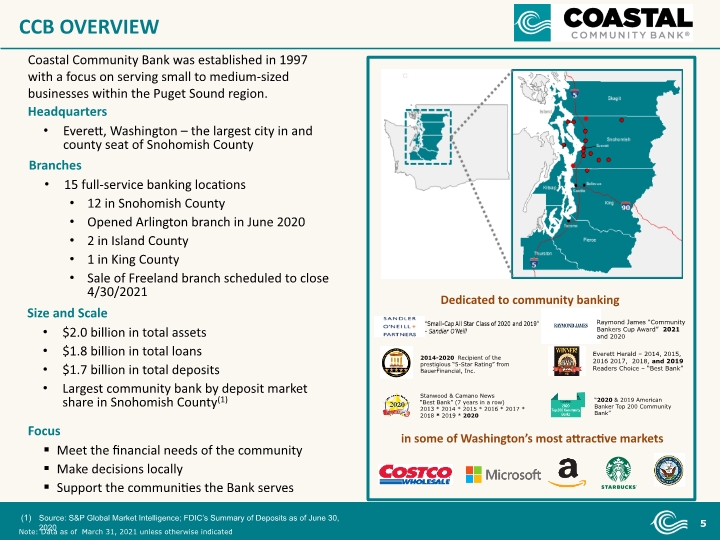
Coastal Community Bank was established in 1997 with a focus on serving small to medium-sized businesses within the Puget Sound region. Headquarters Everett, Washington – the largest city in and county seat of Snohomish County Branches 15 full-service banking locations 12 in Snohomish County Opened Arlington branch in June 2020 2 in Island County 1 in King County Sale of Freeland branch scheduled to close 4/30/2021 Size and Scale $2.0 billion in total assets $1.8 billion in total loans $1.7 billion in total deposits Largest community bank by deposit market share in Snohomish County(1) Focus Meet the financial needs of the community Make decisions locally Support the communities the Bank serves CCB OVERVIEW Note: Data as of March 31, 2021 unless otherwise indicated Raymond James “Community Bankers Cup Award” 2021 and 2020 Source: S&P Global Market Intelligence; FDIC’s Summary of Deposits as of June 30, 2020
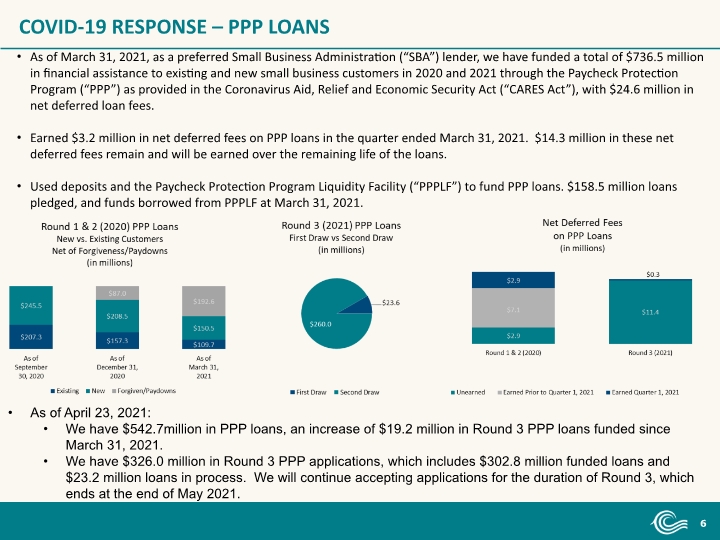
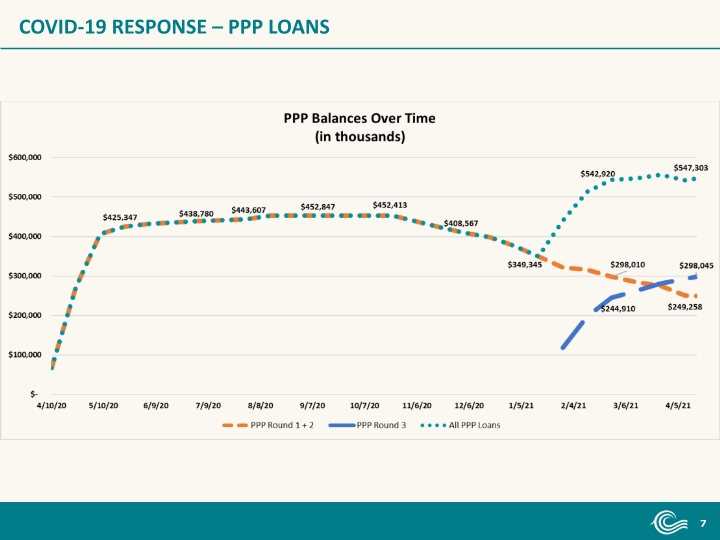
COVID-19 RESPONSE – PPP LOANS As of March 31, 2021, as a preferred Small Business Administration (“SBA”) lender, we have funded a total of $736.5 million in financial assistance to existing and new small business customers in 2020 and 2021 through the Paycheck Protection Program (“PPP”) as provided in the Coronavirus Aid, Relief and Economic Security Act (“CARES Act”), with $24.6 million in net deferred loan fees. Earned $3.2 million in net deferred fees on PPP loans in the quarter ended March 31, 2021. $14.3 million in these net deferred fees remain and will be earned over the remaining life of the loans. Used deposits and the Paycheck Protection Program Liquidity Facility (“PPPLF”) to fund PPP loans. $158.5 million loans pledged, and funds borrowed from PPPLF at March 31, 2021. As of April 23, 2021: We have $542.7million in PPP loans, an increase of $19.2 million in Round 3 PPP loans funded since March 31, 2021. We have $326.0 million in Round 3 PPP applications, which includes $302.8 million funded loans and $23.2 million loans in process. We will continue accepting applications for the duration of Round 3, which ends at the end of May 2021.
COVID-19 RESPONSE – PPP LOANS
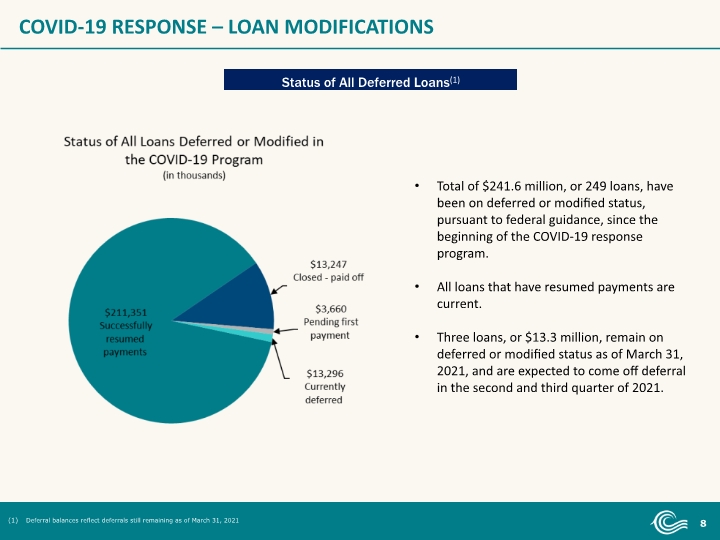
COVID-19 RESPONSE – LOAN MODIFICATIONS Status of All Deferred Loans(1) Deferral balances reflect deferrals still remaining as of March 31, 2021 Total of $241.6 million, or 249 loans, have been on deferred or modified status, pursuant to federal guidance, since the beginning of the COVID-19 response program. All loans that have resumed payments are current. Three loans, or $13.3 million, remain on deferred or modified status as of March 31, 2021, and are expected to come off deferral in the second and third quarter of 2021.
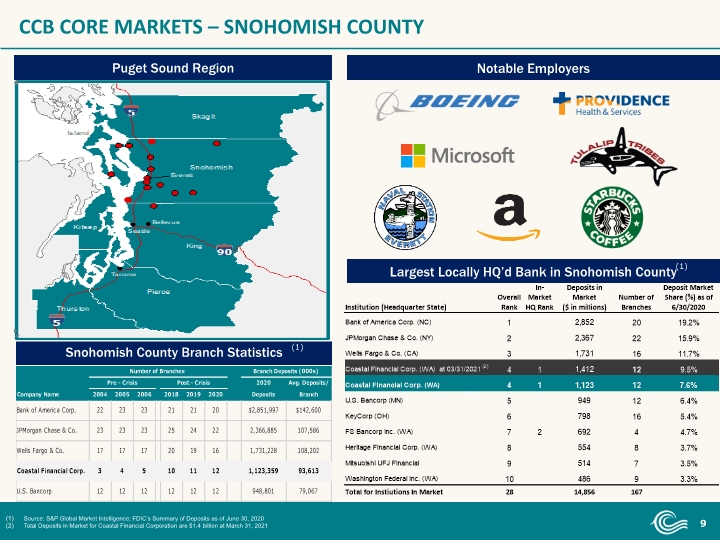
CCB CORE MARKETS – SNOHOMISH COUNTY Largest Locally HQ’d Bank in Snohomish County Notable Employers Source: S&P Global Market Intelligence; FDIC’s Summary of Deposits as of June 30, 2020 Total Deposits in Market for Coastal Financial Corporation are $1.4 billion at March 31, 2021 (2) Puget Sound Region Snohomish County Branch Statistics (1) (1) (2)
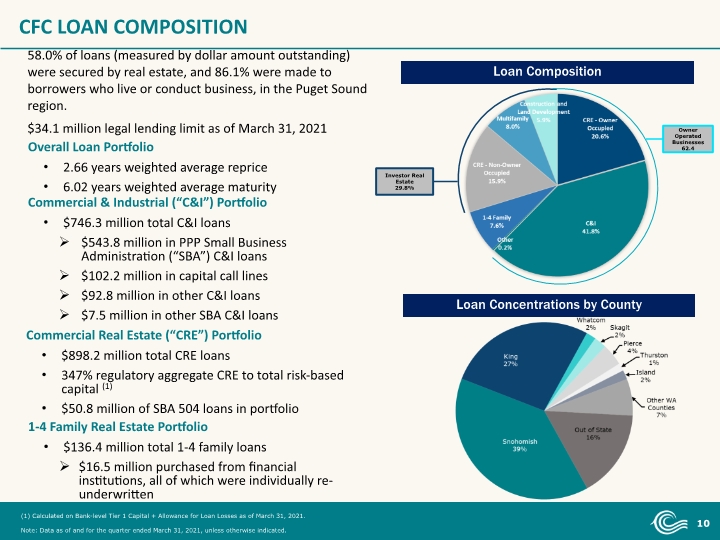
CFC LOAN COMPOSITION Loan Composition Loan Concentrations by County 58.0% of loans (measured by dollar amount outstanding) were secured by real estate, and 86.1% were made to borrowers who live or conduct business, in the Puget Sound region. $34.1 million legal lending limit as of March 31, 2021 Commercial & Industrial (“C&I”) Portfolio $746.3 million total C&I loans $543.8 million in PPP Small Business Administration (“SBA”) C&I loans $102.2 million in capital call lines $92.8 million in other C&I loans $7.5 million in other SBA C&I loans Commercial Real Estate (“CRE”) Portfolio $898.2 million total CRE loans 347% regulatory aggregate CRE to total risk-based capital (1) $50.8 million of SBA 504 loans in portfolio 1-4 Family Real Estate Portfolio $136.4 million total 1-4 family loans $16.5 million purchased from financial institutions, all of which were individually re-underwritten (1) Calculated on Bank-level Tier 1 Capital + Allowance for Loan Losses as of March 31, 2021. Note: Data as of and for the quarter ended March 31, 2021, unless otherwise indicated. Overall Loan Portfolio 2.66 years weighted average reprice 6.02 years weighted average maturity
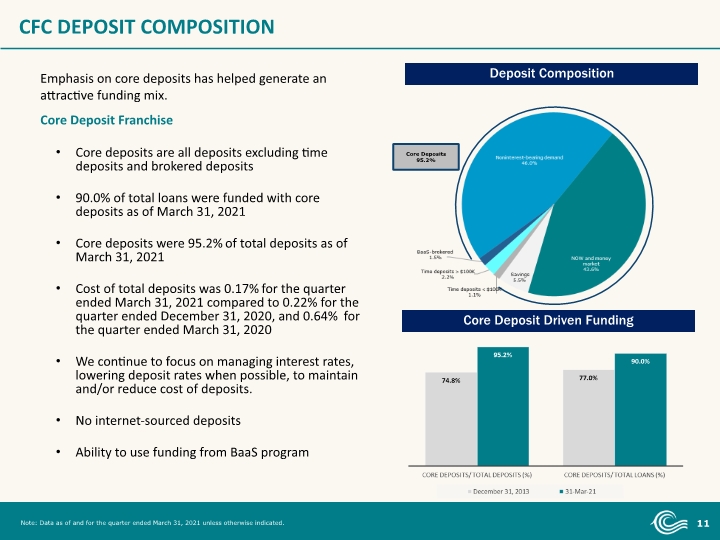
CFC DEPOSIT COMPOSITION Deposit Composition Core Deposit Driven Funding Core Deposit Franchise Core deposits are all deposits excluding time deposits and brokered deposits 90.0% of total loans were funded with core deposits as of March 31, 2021 Core deposits were 95.2% of total deposits as of March 31, 2021 Cost of total deposits was 0.17% for the quarter ended March 31, 2021 compared to 0.22% for the quarter ended December 31, 2020, and 0.64% for the quarter ended March 31, 2020 We continue to focus on managing interest rates, lowering deposit rates when possible, to maintain and/or reduce cost of deposits. No internet-sourced deposits Ability to use funding from BaaS program Emphasis on core deposits has helped generate an attractive funding mix. Note: Data as of and for the quarter ended March 31, 2021 unless otherwise indicated. Core Deposits 95.2% (1)
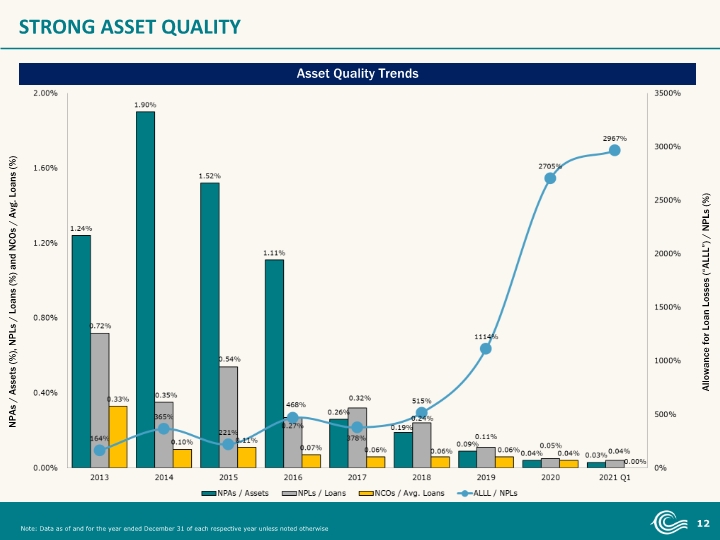
STRONG ASSET QUALITY Asset Quality Trends NPAs / Assets (%), NPLs / Loans (%) and NCOs / Avg. Loans (%) Allowance for Loan Losses (“ALLL”) / NPLs (%) Note: Data as of and for the year ended December 31 of each respective year unless noted otherwise
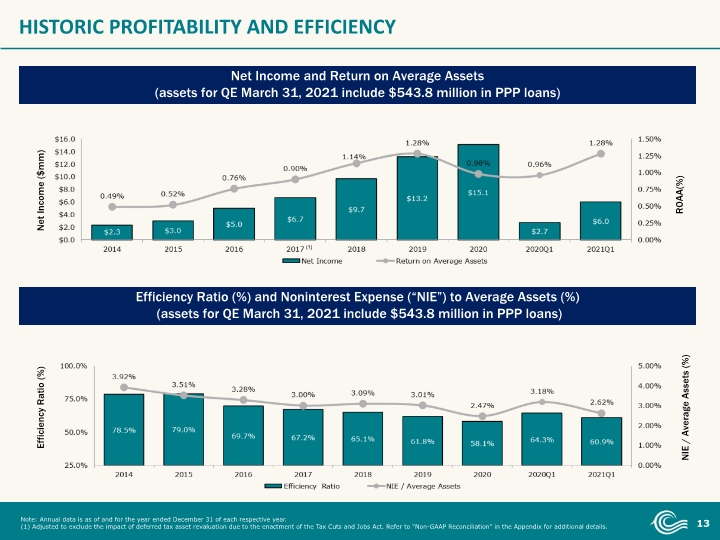
HISTORIC PROFITABILITY AND EFFICIENCY Net Income and Return on Average Assets (assets for QE March 31, 2021 include $543.8 million in PPP loans) Net Income ($mm) Efficiency Ratio (%) and Noninterest Expense (“NIE”) to Average Assets (%) (assets for QE March 31, 2021 include $543.8 million in PPP loans) ROAA(%) Efficiency Ratio (%) NIE / Average Assets (%) Note: Annual data is as of and for the year ended December 31 of each respective year. (1) Adjusted to exclude the impact of deferred tax asset revaluation due to the enactment of the Tax Cuts and Jobs Act. Refer to “Non-GAAP Reconciliation” in the Appendix for additional details. (1)
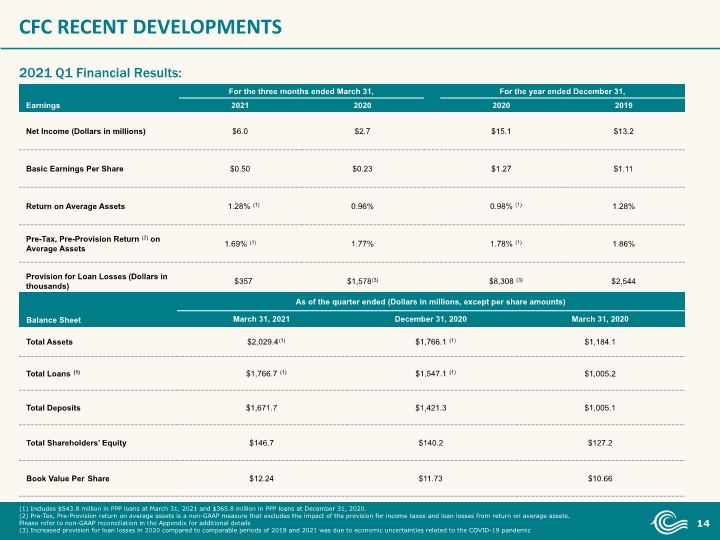
CFC RECENT DEVELOPMENTS 2021 Q1 Financial Results: (1) Includes $543.8 million in PPP loans at March 31, 2021 and $365.8 million in PPP loans at December 31, 2020. (2) Pre-Tax, Pre-Provision return on average assets is a non-GAAP measure that excludes the impact of the provision for income taxes and loan losses from return on average assets. Please refer to non-GAAP reconciliation in the Appendix for additional details (3) Increased provision for loan losses in 2020 compared to comparable periods of 2019 and 2021 was due to economic uncertainties related to the COVID-19 pandemic
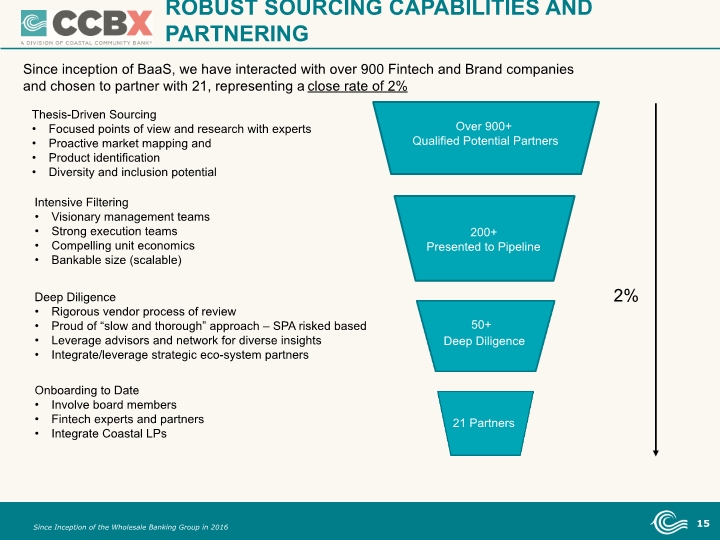
Since Inception of the Wholesale Banking Group in 2016 ROBUST SOURCING CAPABILITIES AND PARTNERING Thesis-Driven Sourcing Focused points of view and research with experts Proactive market mapping and Product identification Diversity and inclusion potential Intensive Filtering Visionary management teams Strong execution teams Compelling unit economics Bankable size (scalable) Deep Diligence Rigorous vendor process of review Proud of “slow and thorough” approach – SPA risked based Leverage advisors and network for diverse insights Integrate/leverage strategic eco-system partners Onboarding to Date Involve board members Fintech experts and partners Integrate Coastal LPs Over 900+ Qualified Potential Partners 200+ Presented to Pipeline 50+ Deep Diligence 21 Partners Since inception of BaaS, we have interacted with over 900 Fintech and Brand companies and chosen to partner with 21, representing a close rate of 2% 2%
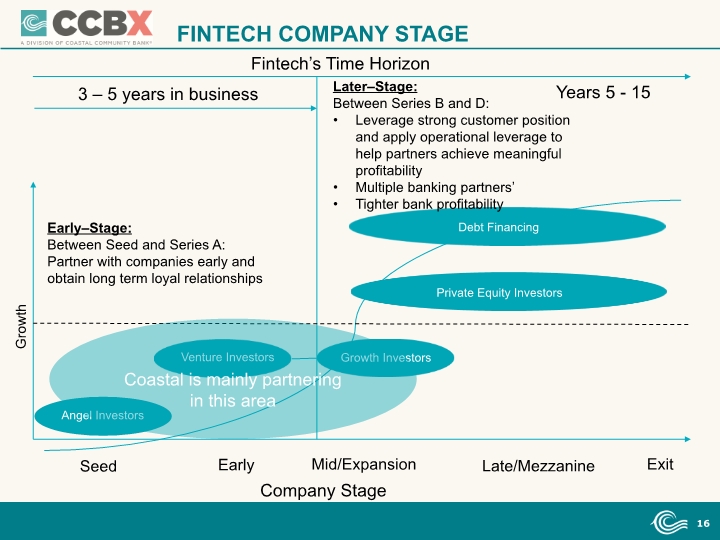
FINTECH COMPANY STAGE Seed Early Mid/Expansion Late/Mezzanine Exit Angel Investors Venture Investors Growth Investors Private Equity Investors Debt Financing Early–Stage: Between Seed and Series A: Partner with companies early and obtain long term loyal relationships Later–Stage: Between Series B and D: Leverage strong customer position and apply operational leverage to help partners achieve meaningful profitability Multiple banking partners’ Tighter bank profitability Coastal is mainly partnering in this area Growth Company Stage Fintech’s Time Horizon 3 – 5 years in business Years 5 - 15
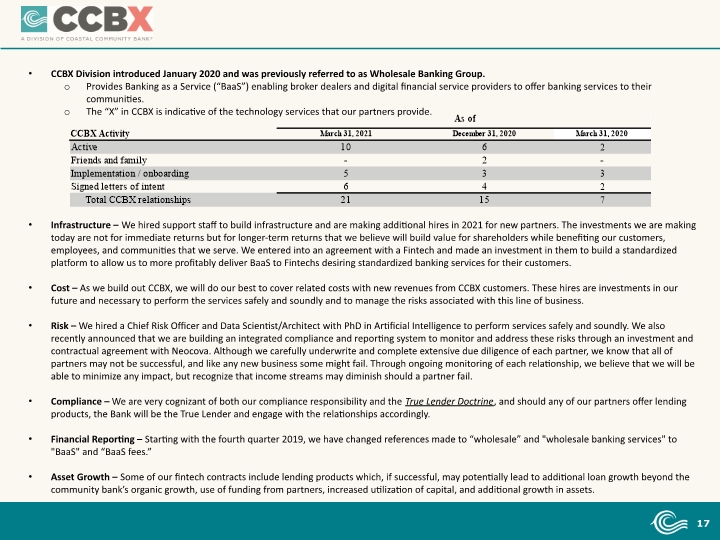
CCBX Division introduced January 2020 and was previously referred to as Wholesale Banking Group. Provides Banking as a Service (“BaaS”) enabling broker dealers and digital financial service providers to offer banking services to their communities. The “X” in CCBX is indicative of the technology services that our partners provide. Infrastructure – We hired support staff to build infrastructure and are making additional hires in 2021 for new partners. The investments we are making today are not for immediate returns but for longer-term returns that we believe will build value for shareholders while benefiting our customers, employees, and communities that we serve. We entered into an agreement with a Fintech and made an investment in them to build a standardized platform to allow us to more profitably deliver BaaS to Fintechs desiring standardized banking services for their customers. Cost – As we build out CCBX, we will do our best to cover related costs with new revenues from CCBX customers. These hires are investments in our future and necessary to perform the services safely and soundly and to manage the risks associated with this line of business. Risk – We hired a Chief Risk Officer and Data Scientist/Architect with PhD in Artificial Intelligence to perform services safely and soundly. We also recently announced that we are building an integrated compliance and reporting system to monitor and address these risks through an investment and contractual agreement with Neocova. Although we carefully underwrite and complete extensive due diligence of each partner, we know that all of partners may not be successful, and like any new business some might fail. Through ongoing monitoring of each relationship, we believe that we will be able to minimize any impact, but recognize that income streams may diminish should a partner fail. Compliance – We are very cognizant of both our compliance responsibility and the True Lender Doctrine, and should any of our partners offer lending products, the Bank will be the True Lender and engage with the relationships accordingly. Financial Reporting – Starting with the fourth quarter 2019, we have changed references made to “wholesale” and "wholesale banking services" to "BaaS" and “BaaS fees.” Asset Growth – Some of our fintech contracts include lending products which, if successful, may potentially lead to additional loan growth beyond the community bank’s organic growth, use of funding from partners, increased utilization of capital, and additional growth in assets.
BANKING AS A SERVICE AND FINANCIAL INCLUSION Coastal began offering Banking as a Service (“BaaS”) with the belief that being flexible while holding our partners to strong compliance and regulatory standards would benefit both the fintech and their customers. We also believed that the partnerships would better help Coastal better understand the disruption that is occurring in the banking industry and allow us to meet the changing environment with a more informed view. As we onboarded new partners, we began to appreciate the focus many fintechs have on financial services for the under-banked and un-banked in our country. Because we believe that financial inclusion is key to reducing poverty and inequities and could see the impact our partners were having on a variety of underserved constituents, we began to actively solicit like-branded fintechs to help them with the resources they needed to go to market. Partnering with organizations focusing on financial inclusion through CCBX allows Coastal to broaden its impact on a scale and speed that could not be otherwise realized as a community bank. Additionally, we are prioritizing diversity and inclusion focused proposals in our pipeline to ensure additional financial service providers are able to come to market and provide these much-needed resources. In these situations, CCBX is uniquely positioned to bring value to inclusion-focused challenger banks. CCBX has developed a business model which collaborates with each fintech partner as it is brought to market. Helping the partner ensure they will meet rigorous compliance requirements, understand how to implement unique products, all while having adequate capital to survive are key components of the relationship. Rather than offer a standard delivery model, the CCBX relationship is to consult with each business to deliver the services and support needed to launch their business.
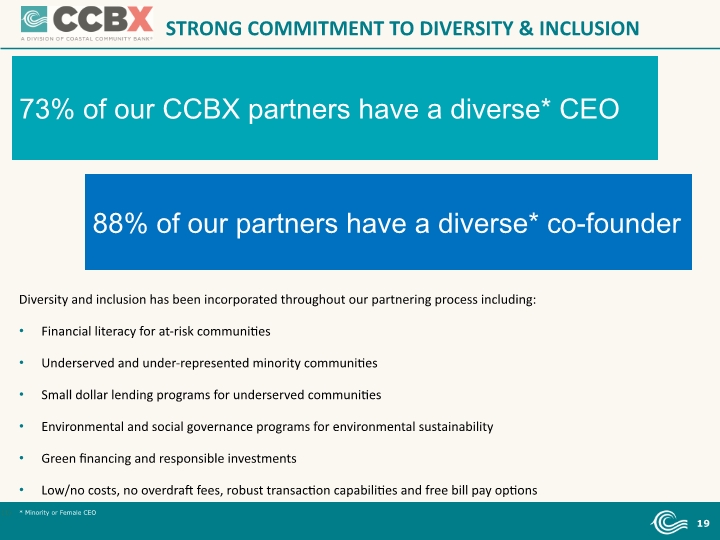
STRONG COMMITMENT TO DIVERSITY & INCLUSION 73% of our CCBX partners have a diverse* CEO 88% of our partners have a diverse* co-founder Diversity and inclusion has been incorporated throughout our partnering process including: Financial literacy for at-risk communities Underserved and under-represented minority communities Small dollar lending programs for underserved communities Environmental and social governance programs for environmental sustainability Green financing and responsible investments Low/no costs, no overdraft fees, robust transaction capabilities and free bill pay options * Minority or Female CEO
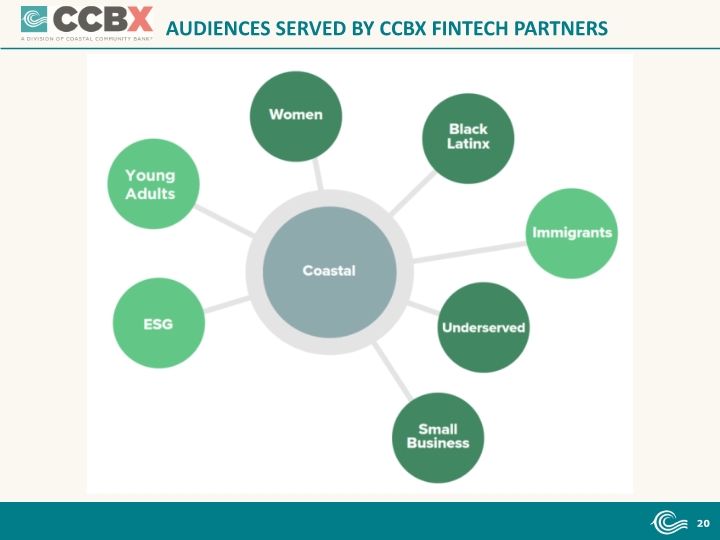
AUDIENCES SERVED BY CCBX FINTECH PARTNERS
CCDB - COASTAL’S DIGITAL BANK THROUGH COLLABORATION WITH GOOGLE Coastal’s collaboration with Google is anticipated to be a great avenue for us to reach existing customers, our communities, and expand to new communities in the coming years. We expect that the new platform will provide customers with an enhanced customer experience and provide them with new avenues to interact with us. Once launched, the Google Plex accounts will give Coastal the opportunity to tap into a younger demographic and offer consumer products to further diversify our customer base. Why is this important? Already this year, we have seen community banks launch their own stand-alone digital bank (like Incredible Bank and Rising Bank). To have sustained success banks must continue to evolve by exploring new strategies, building new expertise and establishing new ways of doing business.
Appendix
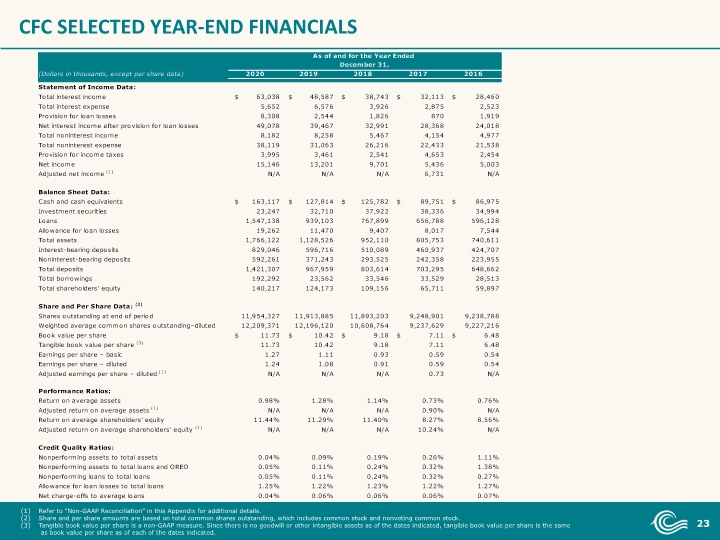
CFC SELECTED YEAR-END FINANCIALS Refer to “Non-GAAP Reconciliation” in this Appendix for additional details. Share and per share amounts are based on total common shares outstanding, which includes common stock and nonvoting common stock. Tangible book value per share is a non-GAAP measure. Since there is no goodwill or other intangible assets as of the dates indicated, tangible book value per share is the same as book value per share as of each of the dates indicated.
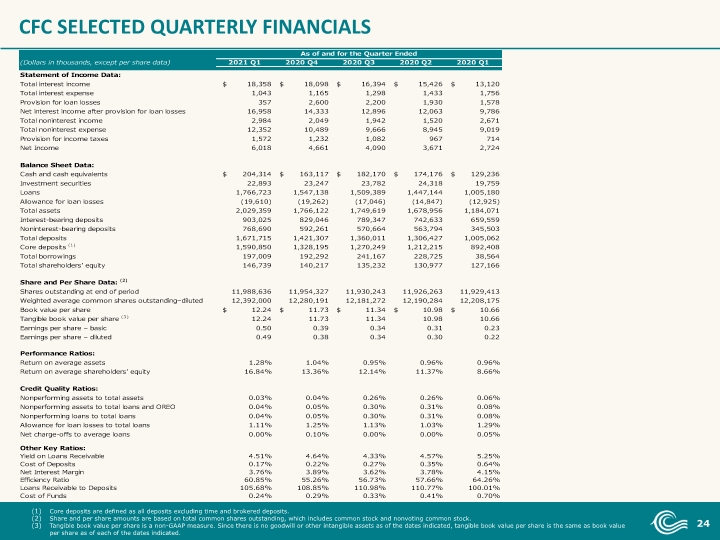
CFC SELECTED QUARTERLY FINANCIALS Core deposits are defined as all deposits excluding time and brokered deposits. Share and per share amounts are based on total common shares outstanding, which includes common stock and nonvoting common stock. Tangible book value per share is a non-GAAP measure. Since there is no goodwill or other intangible assets as of the dates indicated, tangible book value per share is the same as book value per share as of each of the dates indicated.
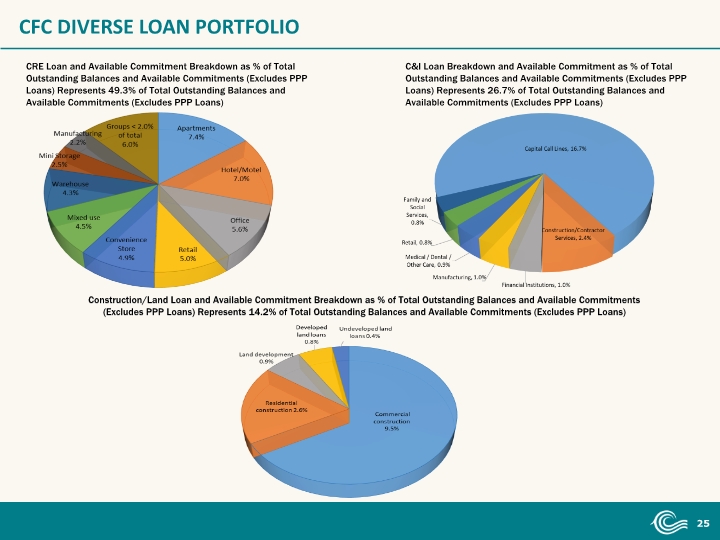
CFC DIVERSE LOAN PORTFOLIO CRE Loan and Available Commitment Breakdown as % of Total Outstanding Balances and Available Commitments (Excludes PPP Loans) Represents 49.3% of Total Outstanding Balances and Available Commitments (Excludes PPP Loans) C&I Loan Breakdown and Available Commitment as % of Total Outstanding Balances and Available Commitments (Excludes PPP Loans) Represents 26.7% of Total Outstanding Balances and Available Commitments (Excludes PPP Loans) Construction/Land Loan and Available Commitment Breakdown as % of Total Outstanding Balances and Available Commitments (Excludes PPP Loans) Represents 14.2% of Total Outstanding Balances and Available Commitments (Excludes PPP Loans)
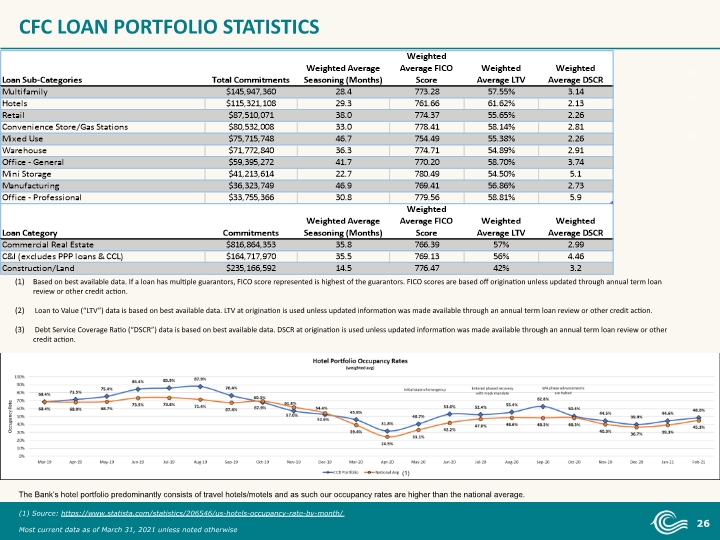
CFC LOAN PORTFOLIO STATISTICS (1) (1) (2) (2) (3) Based on best available data. If a loan has multiple guarantors, FICO score represented is highest of the guarantors. FICO scores are based off origination unless updated through annual term loan review or other credit action. Loan to Value (“LTV”) data is based on best available data. LTV at origination is used unless updated information was made available through an annual term loan review or other credit action. Debt Service Coverage Ratio (“DSCR”) data is based on best available data. DSCR at origination is used unless updated information was made available through an annual term loan review or other credit action. (1) Source: https://www.statista.com/statistics/206546/us-hotels-occupancy-rate-by-month/ Most current data as of March 31, 2021 unless noted otherwise (1) (1) (2) (2) (3) (3) The Bank’s hotel portfolio predominantly consists of travel hotels/motels and as such our occupancy rates are higher than the national average. (1)
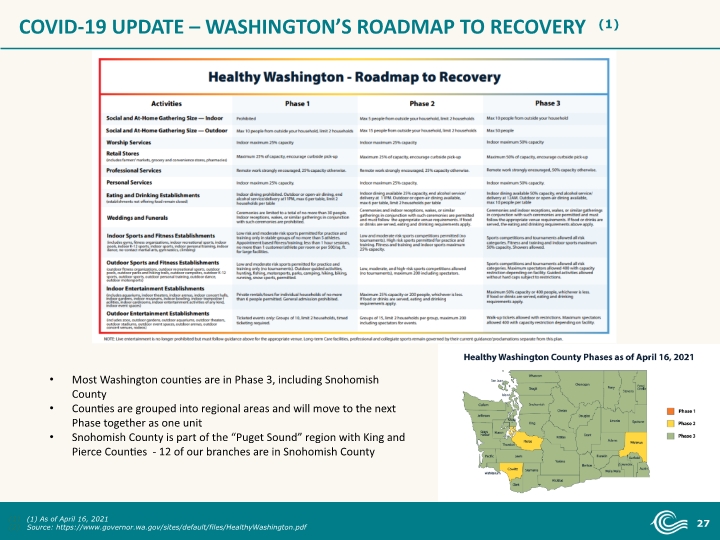
COVID-19 UPDATE – WASHINGTON’S ROADMAP TO RECOVERY (1) (1) As of April 16, 2021 Source: https://www.governor.wa.gov/sites/default/files/HealthyWashington.pdf Most Washington counties are in Phase 3, including Snohomish County Counties are grouped into regional areas and will move to the next Phase together as one unit Snohomish County is part of the “Puget Sound” region with King and Pierce Counties - 12 of our branches are in Snohomish County
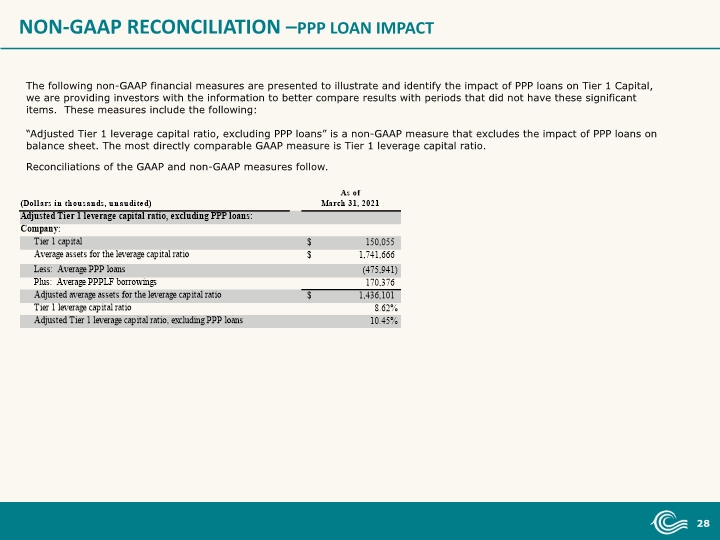
NON-GAAP RECONCILIATION –PPP LOAN IMPACT The following non-GAAP financial measures are presented to illustrate and identify the impact of PPP loans on Tier 1 Capital, we are providing investors with the information to better compare results with periods that did not have these significant items. These measures include the following: “Adjusted Tier 1 leverage capital ratio, excluding PPP loans” is a non-GAAP measure that excludes the impact of PPP loans on balance sheet. The most directly comparable GAAP measure is Tier 1 leverage capital ratio. Reconciliations of the GAAP and non-GAAP measures follow.
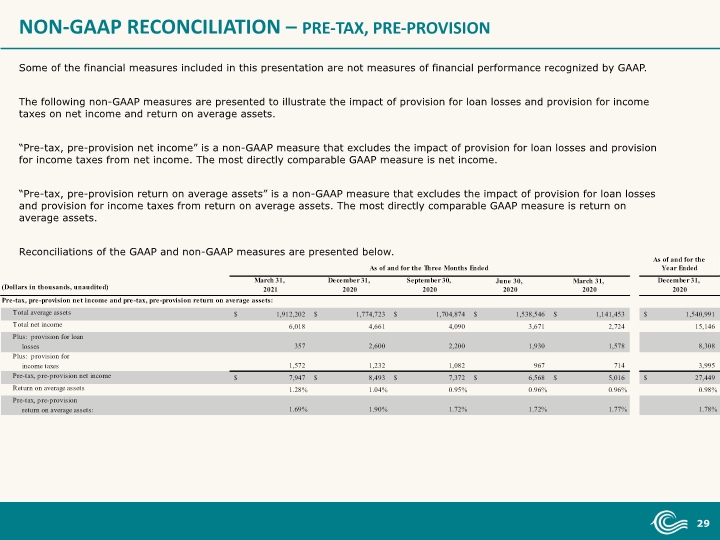
NON-GAAP RECONCILIATION – PRE-TAX, PRE-PROVISION Some of the financial measures included in this presentation are not measures of financial performance recognized by GAAP. The following non-GAAP measures are presented to illustrate the impact of provision for loan losses and provision for income taxes on net income and return on average assets. “Pre-tax, pre-provision net income” is a non-GAAP measure that excludes the impact of provision for loan losses and provision for income taxes from net income. The most directly comparable GAAP measure is net income. “Pre-tax, pre-provision return on average assets” is a non-GAAP measure that excludes the impact of provision for loan losses and provision for income taxes from return on average assets. The most directly comparable GAAP measure is return on average assets. Reconciliations of the GAAP and non-GAAP measures are presented below.
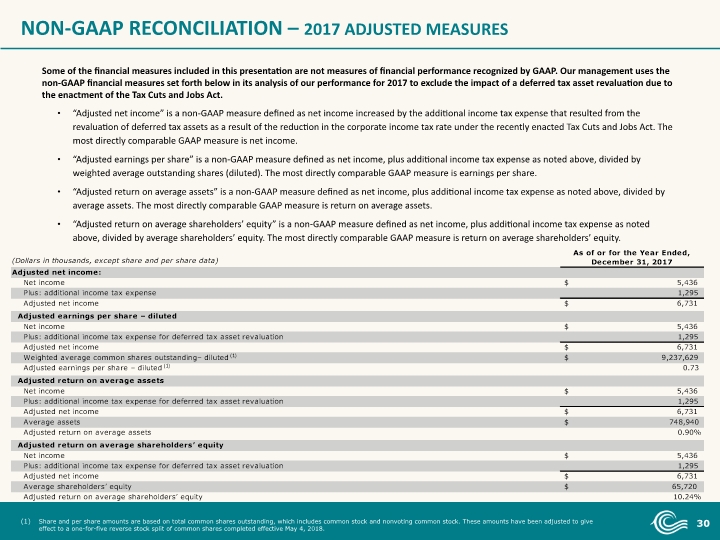
NON-GAAP RECONCILIATION – 2017 ADJUSTED MEASURES Some of the financial measures included in this presentation are not measures of financial performance recognized by GAAP. Our management uses the non-GAAP financial measures set forth below in its analysis of our performance for 2017 to exclude the impact of a deferred tax asset revaluation due to the enactment of the Tax Cuts and Jobs Act. “Adjusted net income” is a non-GAAP measure defined as net income increased by the additional income tax expense that resulted from the revaluation of deferred tax assets as a result of the reduction in the corporate income tax rate under the recently enacted Tax Cuts and Jobs Act. The most directly comparable GAAP measure is net income. “Adjusted earnings per share” is a non-GAAP measure defined as net income, plus additional income tax expense as noted above, divided by weighted average outstanding shares (diluted). The most directly comparable GAAP measure is earnings per share. “Adjusted return on average assets” is a non-GAAP measure defined as net income, plus additional income tax expense as noted above, divided by average assets. The most directly comparable GAAP measure is return on average assets. “Adjusted return on average shareholders’ equity” is a non-GAAP measure defined as net income, plus additional income tax expense as noted above, divided by average shareholders’ equity. The most directly comparable GAAP measure is return on average shareholders’ equity. Share and per share amounts are based on total common shares outstanding, which includes common stock and nonvoting common stock. These amounts have been adjusted to give effect to a one-for-five reverse stock split of common shares completed effective May 4, 2018.
