Attached files
| file | filename |
|---|---|
| EX-99.3 - TRUEBLUE INVESTOR PRESENTATION - TrueBlue, Inc. | a2021-04investorroadshow.htm |
| EX-99.1 - TRUEBLUE PRESS RELEASE - TrueBlue, Inc. | tbi2021q1pressreleaseex991.htm |
| 8-K - TRUEBLUE FORM 8-K - TrueBlue, Inc. | tbi-20210426.htm |

Q1 2021 Earnings April 2021

www.TrueBlue.c om 2 Forward-looking statements This document contains forward-looking statements relating to our plans and expectations, all of which are subject to risks and uncertainties. Such statements are based on management’s expectations and assumptions as of the date of this release and involve many risks and uncertainties that could cause actual results to differ materially from those expressed or implied in our forward-looking statements including: (1) national and global economic conditions, (2) the continued impact of COVID-19 and related economic impact and governmental response, (3) our ability to access sufficient capital to finance our operations, including our ability to comply with covenants contained in our revolving credit facility, (4) our ability to attract and retain clients, (5) our ability to attract sufficient qualified candidates and employees to meet the needs of our clients, (6) our ability to maintain profit margins, (7) new laws, regulations, and government incentives that could affect our operations or financial results, (8) our ability to successfully execute on business strategies to further digitalize our business model, and (9) any reduction or change in tax credits we utilize, including the Work Opportunity Tax Credit. Other information regarding factors that could affect our results is included in our Securities Exchange Commission (SEC) filings, including the company’s most recent reports on Forms 10-K and 10-Q, copies of which may be obtained by visiting our website at www.trueblue.com under the Investor Relations section or the SEC’s website at www.sec.gov. We assume no obligation to update or revise any forward-looking statement, whether as a result of new information, future events, or otherwise, except as required by law. Any other references to future financial estimates are included for informational purposes only and subject to risk factors discussed in our most recent filings with the SEC. In addition, we use several non-GAAP financial measures when presenting our financial results in this document. Please refer to the reconciliations between our GAAP and non-GAAP financial measures in the appendix to this presentation and on our website at www.trueblue.com under the Investor Relations section for additional information on both current and historical periods. The presentation of these non-GAAP financial measures is used to enhance the understanding of certain aspects of our financial performance. It is not meant to be considered in isolation, superior to, or as a substitute for the directly comparable financial measures prepared in accordance with U.S. GAAP, and may not be comparable to similarly titled measures of other companies. Any comparisons made herein to other periods are based on a comparison to the same period in the prior year unless otherwise stated.

www.TrueBlue.c om 3 Q1 2021 Overview 1 See the appendix to this presentation and “Financial Information” in the investors section of our website at www.trueblue.com for a definition and full reconciliation of non-GAAP financial measures to GAAP financial results. 2 Borrowing Availability is based on maximum borrowing availability under our most restrictive covenant, which was Minimum Asset Coverage for Q1 2021. Revenue recovery and cost management continue to drive results ▪ Total revenue -7% v. -12% in Q4 2020 - better trends across all segments ▪ SG&A -17% from disciplined cost management ▪ Net income was $7 million v. a net loss of $150 million in Q1 2020 • Q1 2020 included a non-cash impairment charge of $152 million, net of tax ▪ Adj. net income1 was $9 million v. adj. net loss of $0.3 million in Q1 2020 ▪ Adj. EBITDA increased 189% and margin was up 200 basis points Strong capital position ▪ Cash of $88 million and no debt outstanding ▪ Credit facility provides $150 million2 available for borrowing
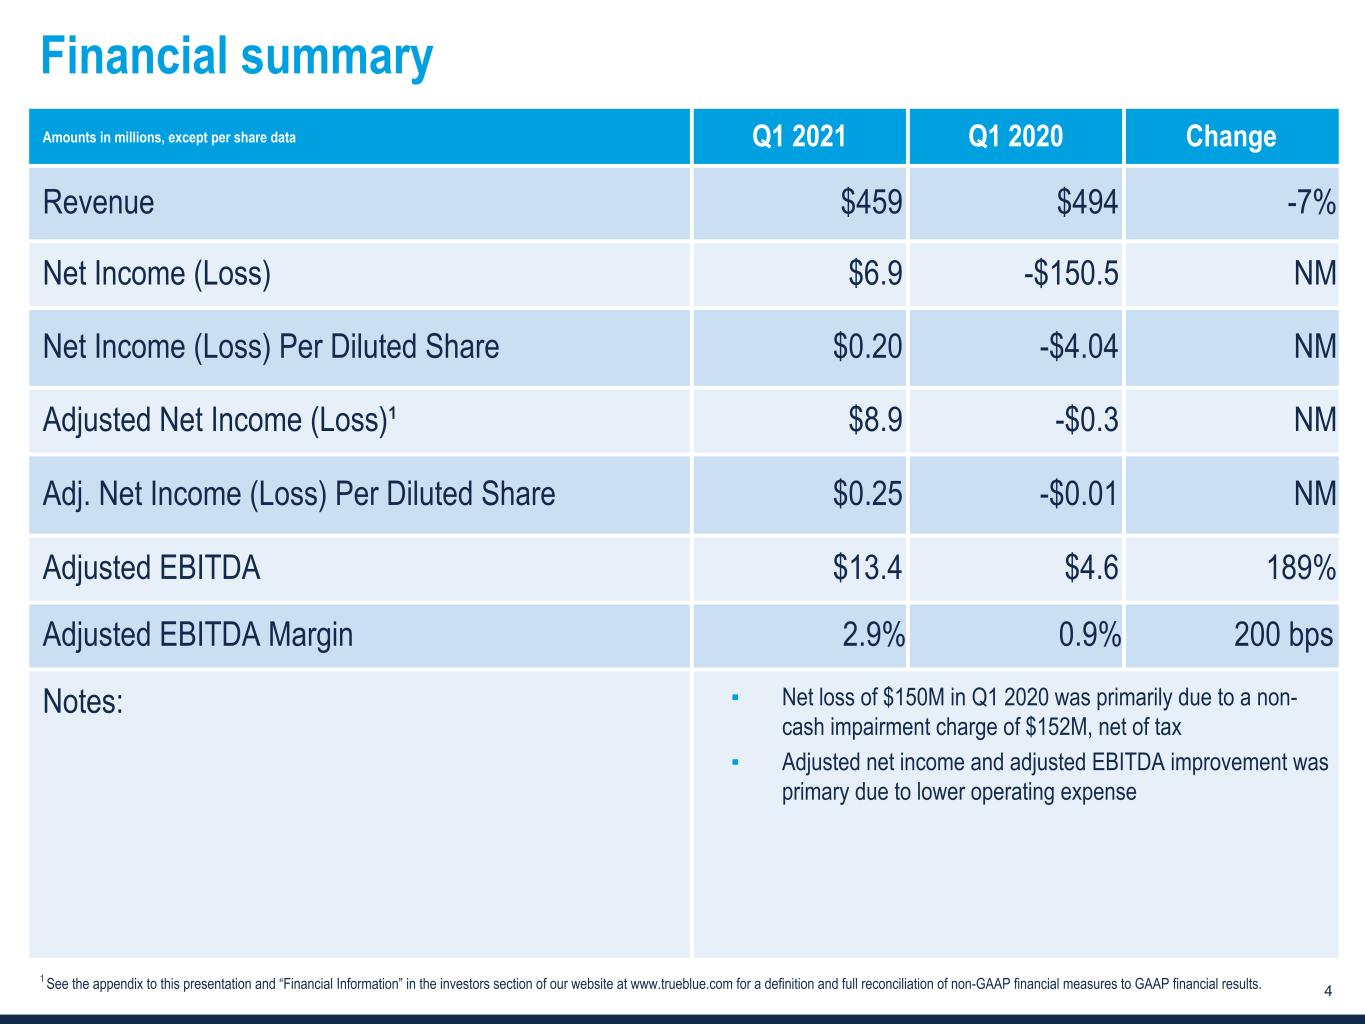
www.TrueBlue.c om 4 Financial summary 1 See the appendix to this presentation and “Financial Information” in the investors section of our website at www.trueblue.com for a definition and full reconciliation of non-GAAP financial measures to GAAP financial results. Amounts in millions, except per share data Q1 2021 Q1 2020 Change Revenue $459 $494 -7 % Net Income (Loss) $6.9 -$150.5 NM Net Income (Loss) Per Diluted Share $0.20 -$4.04 NM Adjusted Net Income (Loss)¹ $8.9 -$0.3 NM Adj. Net Income (Loss) Per Diluted Share $0.25 -$0.01 NM Adjusted EBITDA $13.4 $4.6 189 % Adjusted EBITDA Margin 2.9 % 0.9 % 200 bps Notes: ▪ Net loss of $150M in Q1 2020 was primarily due to a non- cash impairment charge of $152M, net of tax ▪ Adjusted net income and adjusted EBITDA improvement was primary due to lower operating expense

www.TrueBlue.c om 5 Revenue trends Quarter Month ended Apr 2,3 Q1 Jan Feb1 Mar Week 1 Week 2 Week 3 TrueBlue (7)% (12)% (14)% 3% 31% 45% 53% PeopleReady (13)% (18)% (19)% (3)% 31% 45% 57% PeopleManagement 7% 5% 0% 15% 30% 46% 47% PeopleScout (13)% (25)% (18)% 4% NA NA NA 1 February 2021 revenue trends were impacted by weather in the U.S. 2 Easter fell in the 1st week of April this year versus the 2nd week in 2020. 3 TrueBlue represents aggregate revenue results for PeopleReady and PeopleManagement. Weekly data is not available for PeopleScout, which bills clients monthly.

www.TrueBlue.c om 6 Gross margin and SG&A bridges Amounts in millions G ro ss M ar gi n SG &A $117 -$1 -$19 $97 Q1 2020 Core business Q1 2021 25.5% -1.3% -0.2% 0.1% 24.1% Q1 2020 ACA adjustment Staffing RPO Q1 2021 Adjusted EBITDA exclusions3 1 Q1 2020 includes a $6.3 million benefit from a reduction in expected costs to comply with the Affordable Care Act which was excluded from adjusted EBITDA and adjusted net income. See the appendix to this presentation and “Financial Information” in the investors section of our website at www.trueblue.com for a definition and full reconciliation of non-GAAP financial measures to GAAP financial results. 2 Q1 2021 includes a decline in workers' compensation costs largely associated with favorable adjustments to prior period reserves providing a year-over-year benefit of 70 bps. 3 $1 million represents the year-over-year change in Adjusted EBITDA exclusions impacting SG&A. 1 2

www.TrueBlue.c om 7 Q1 2021 results by segment Amounts in millions PeopleReady PeopleManagement PeopleScout Revenue $260 $152 $47 % Change -13% 7% -13% Segment Profit1 $12 $3 $4 % Change 55% NM 61% % Margin 4.6% 2.1% 8.7% Change 200 bps 230 bps 400 bps Notes: ■ Revenue was -13% v. -18% in Q4 2020 ■ Revenue trends improved across most geographies and industries ■ Cost management helped preserve profitability ■ Revenue was 7% v. 5% in Q4 2020 ■ $44 million in annualized new business wins v. $16 million in Q1 2020. New wins booked in Q1 2021 were $2 million and $28 million is expected over the remainder of 2021 ■ Segment profit growth; half from revenue improvement and half from lower costs ■ Revenue was -13% v. -24% in Q4 2020 ■ $30 million in annualized new business wins v. $3 million in in Q1 2020. New wins booked in Q1 2020 were $2 million and $14 million is expected over the remainder of 2021 1 We evaluate performance based on segment revenue and segment profit. Segment profit includes revenue, related cost of services, and ongoing operating expenses directly attributable to the reportable segment. Segment profit excludes depreciation and amortization expense, unallocated corporate general and administrative expense, interest expense, other income, income taxes, and other adjustments not considered to be ongoing.
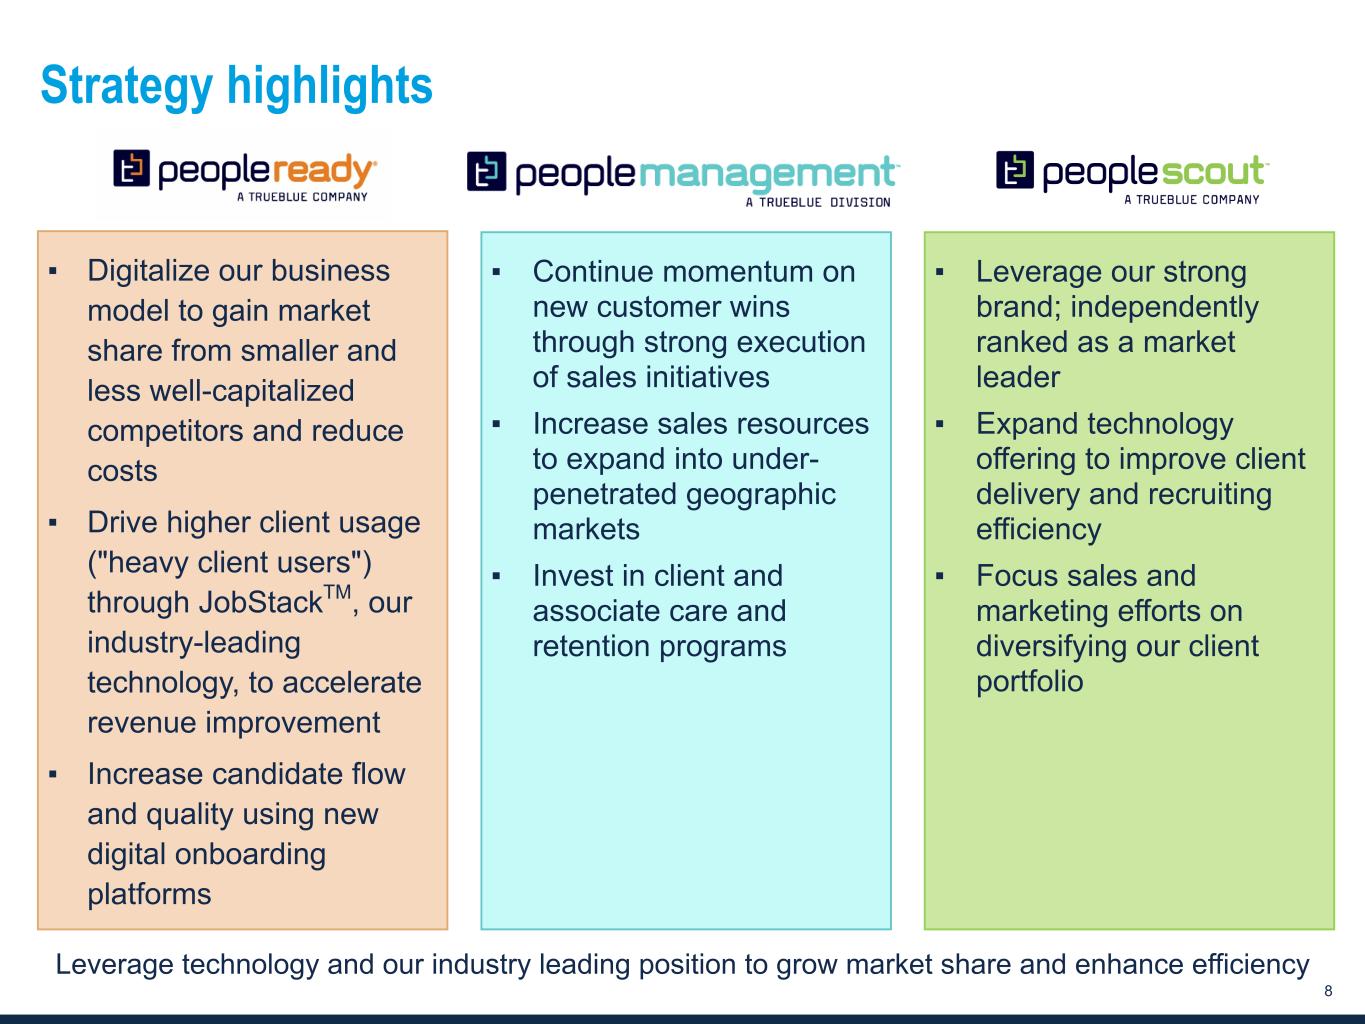
www.TrueBlue.c om 8 Strategy highlights Lev rage technology and our industry leading position to grow market share and enhance efficiency ▪ Leverage our strong brand; independently ranked as a market leader ▪ Expand technology offering to improve client delivery and recruiting efficiency ▪ Focus sales and marketing efforts on diversifying our client portfolio ▪ Digitalize our business model to gain market share from smaller and less well-capitalized competitors and reduce costs ▪ Drive higher client usage ("heavy client users") through JobStackTM, our industry-leading technology, to accelerate revenue improvement ▪ Increase candidate flow and quality using new digital onboarding platforms ▪ Continue momentum on new customer wins through strong execution of sales initiatives ▪ Increase sales resources to expand into under- penetrated geographic markets ▪ Invest in client and associate care and retention programs

www.TrueBlue.c om 9 Leveraging our digital strategy JobStackTM Q1 2021 Update ■ 716,000 shifts filled via JobStack in Q1 2021, representing a digital fill rate of 58%, up 7 percentage points compared to Q1 2020 ■ 26,500 client users, up more than 10% compared to Q1 2020 ■ Heavy client users2 have demonstrated disproportionately higher growth (>35% better v. the rest of PeopleReady) ■ Continue to increase heavy client user mix (31% v. 24% in FY 2020) Year Achievements Digital Fills1 Client Users 2017 Successful branch roll-out 22% 1,600 2018 Launch of client application 41% 13,100 2019 Drive revenue growth with heavy client users 46% 21,300 2020 Drive heavy client users / candidate flow 57% 26,300 Industry-leading mobile app that connects our associates with jobs and simplifies client ordering http://www.peopleready.com/jobstack/ 1 Represents orders filled via JobStack v. all filled orders for Q4 of the given year (calculation excludes unfilled orders). 2 Heavy client users are clients for any given month that have 50+ touches on JobStack (entering an order, rating a worker, etc.). Year-over-year growth rates for heavy users are calculated on a same customer basis. PeopleReady 2021 YTD Revenue $ Mix 31% 9%41% 19% Heavy client users (+50/mo) Moderate client users (20-40/mo) Light/Non client users (<20/mo) Not Eligible Drive Client Usage of JobStack

www.TrueBlue.c om 10 12% 6% 0% 0% 2018 2019 2020 Q1 2021 $80 $37 $0 $0 $33 $47 $38 $63 $88 Net Debt Cash 2018 2019 2020 Q1 2021 $260 $295 $224 $238 $213 $257 $161 $150 $47 $38 $63 $88 Borrowing Availability Cash 2018 2019 2020 Q1 2021 Balance sheet remains strong Amounts in millions Note: Figures may not sum to consolidated totals due to rounding. Balances as of fiscal period end. 1 Borrowing Availability is based on maximum borrowing availability under our most restrictive covenant, which was Minimum Asset Coverage for Q1 2021. 2 Total Debt to Capital calculated as total debt divided by the sum of total debt plus shareholders’ equity. 3 Terms of our credit facility prohibits us from repurchasing shares until Q3 2021. Liquidity Amounts in millions Share RepurchasesTotal Debt to Capital2 Total Debt 1 $37 $35 $39 $52 $0 2017 2018 2019 2020 YTD 2021 Amounts in millions 3

Outlook
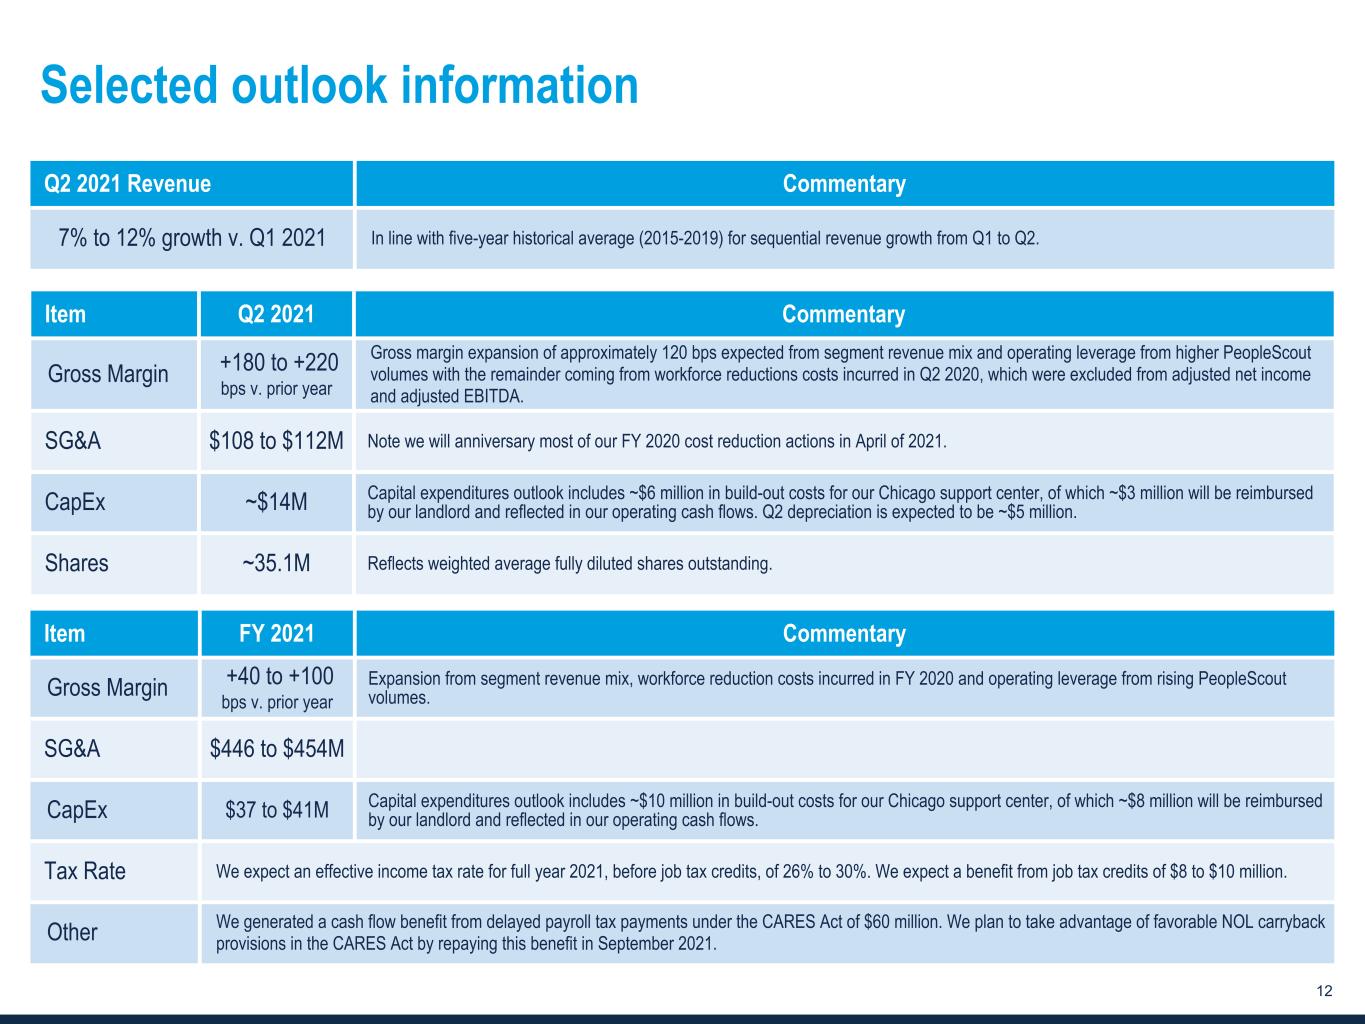
www.TrueBlue.c om 12 Selected outlook information Item Q2 2021 Commentary Gross Margin +180 to +220 bps v. prior year Gross margin expansion of approximately 120 bps expected from segment revenue mix and operating leverage from higher PeopleScout volumes with the remainder coming from workforce reductions costs incurred in Q2 2020, which were excluded from adjusted net income and adjusted EBITDA. SG&A $108 to $112M Note we will anniversary most of our FY 2020 cost reduction actions in April of 2021. CapEx ~$14M Capital expenditures outlook includes ~$6 million in build-out costs for our Chicago support center, of which ~$3 million will be reimbursed by our landlord and reflected in our operating cash flows. Q2 depreciation is expected to be ~$5 million. Shares ~35.1M Reflects weighted average fully diluted shares outstanding. Item FY 2021 Commentary Gross Margin +40 to +100 bps v. prior year Expansion from segment revenue mix, workforce reduction costs incurred in FY 2020 and operating leverage from rising PeopleScout volumes. SG&A $446 to $454M CapEx $37 to $41M Capital expenditures outlook includes ~$10 million in build-out costs for our Chicago support center, of which ~$8 million will be reimbursed by our landlord and reflected in our operating cash flows. Tax Rate We expect an effective income tax rate for full year 2021, before job tax credits, of 26% to 30%. We expect a benefit from job tax credits of $8 to $10 million. Other We generated a cash flow benefit from delayed payroll tax payments under the CARES Act of $60 million. We plan to take advantage of favorable NOL carryback provisions in the CARES Act by repaying this benefit in September 2021. Q2 2021 Revenue Commentary 7% to 12% growth v. Q1 2021 In line with five-year historical average (2015-2019) for sequential revenue growth from Q1 to Q2.

Appendix
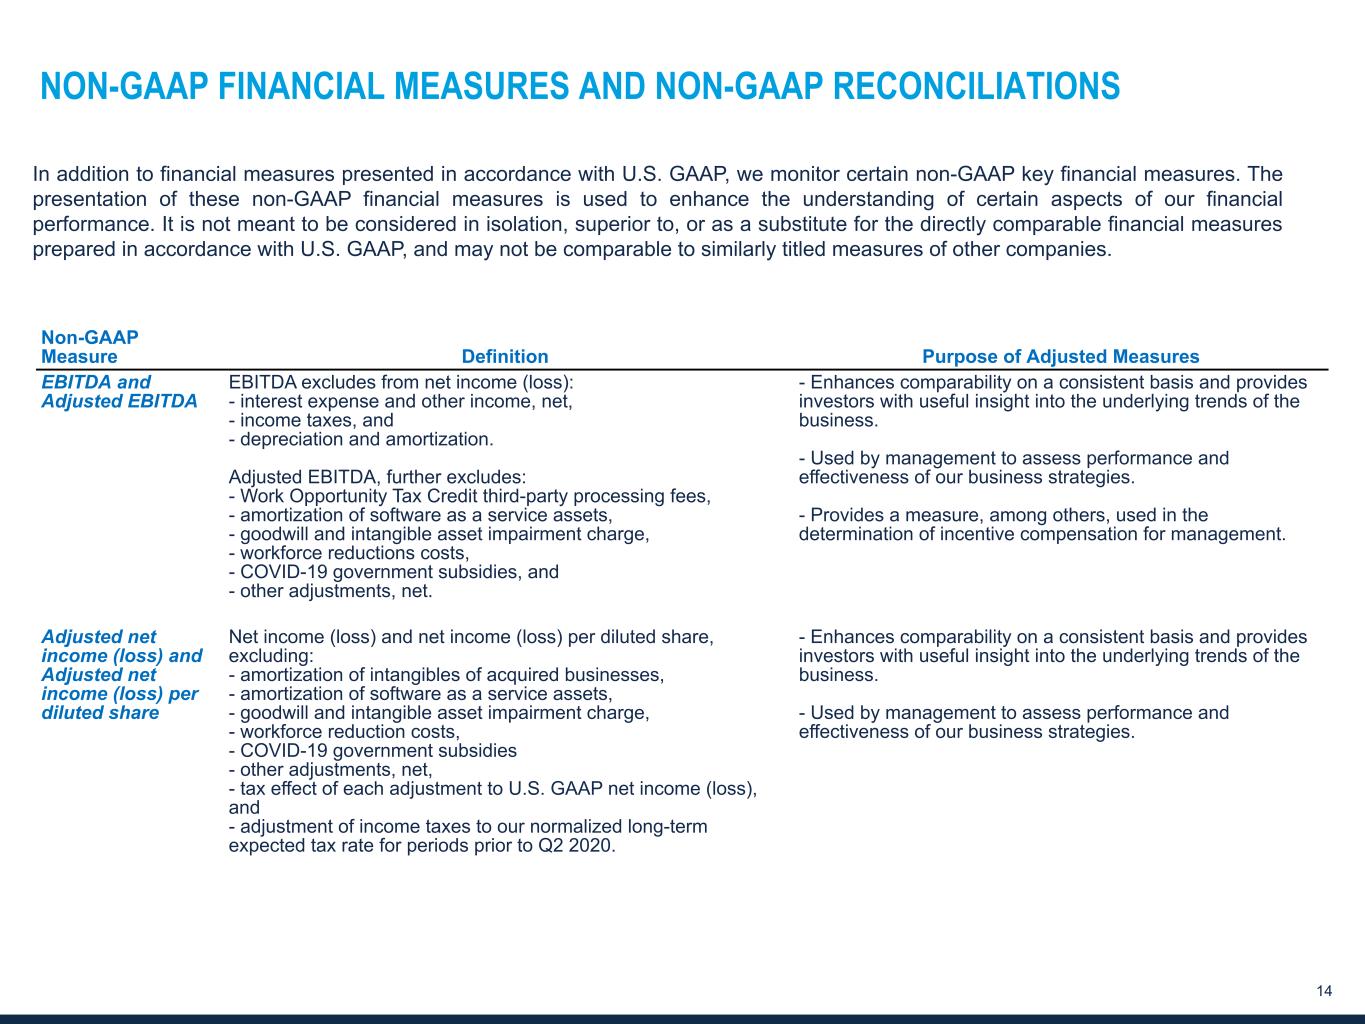
www.TrueBlue.c om 14 NON-GAAP FINANCIAL MEASURES AND NON-GAAP RECONCILIATIONS In addition to financial measures presented in accordance with U.S. GAAP, we monitor certain non-GAAP key financial measures. The presentation of these non-GAAP financial measures is used to enhance the understanding of certain aspects of our financial performance. It is not meant to be considered in isolation, superior to, or as a substitute for the directly comparable financial measures prepared in accordance with U.S. GAAP, and may not be comparable to similarly titled measures of other companies. Non-GAAP Measure Definition Purpose of Adjusted Measures EBITDA and Adjusted EBITDA EBITDA excludes from net income (loss): - interest expense and other income, net, - income taxes, and - depreciation and amortization. Adjusted EBITDA, further excludes: - Work Opportunity Tax Credit third-party processing fees, - amortization of software as a service assets, - goodwill and intangible asset impairment charge, - workforce reductions costs, - COVID-19 government subsidies, and - other adjustments, net. - Enhances comparability on a consistent basis and provides investors with useful insight into the underlying trends of the business. - Used by management to assess performance and effectiveness of our business strategies. - Provides a measure, among others, used in the determination of incentive compensation for management. Adjusted net income (loss) and Adjusted net income (loss) per diluted share Net income (loss) and net income (loss) per diluted share, excluding: - amortization of intangibles of acquired businesses, - amortization of software as a service assets, - goodwill and intangible asset impairment charge, - workforce reduction costs, - COVID-19 government subsidies - other adjustments, net, - tax effect of each adjustment to U.S. GAAP net income (loss), and - adjustment of income taxes to our normalized long-term expected tax rate for periods prior to Q2 2020. - Enhances comparability on a consistent basis and provides investors with useful insight into the underlying trends of the business. - Used by management to assess performance and effectiveness of our business strategies.

www.TrueBlue.c om 15 1. RECONCILIATION OF U.S. GAAP NET INCOME (LOSS) TO ADJUSTED NET INCOME AND ADJUSTED NET INCOME PER DILUTED SHARE (Unaudited) 13 weeks ended (in thousands, except for per share data) Mar 28, 2021 Mar 29, 2020 Net income (loss) $ 6,898 $ (150,494) Amortization of intangible assets of acquired businesses 1,885 4,004 Amortization of software as a service assets (1) 673 552 Goodwill and intangible asset impairment charge — 175,189 Workforce reduction costs (2) 70 1,308 COVID-19 government subsidies (1,743) — Other adjustments, net (3) 1,086 (6,133) Tax effect of adjustments to net income (loss) (4) 33 (20,990) Adjustment of income taxes to normalized effective rate (5) — (3,719) Adjusted net income (loss) $ 8,902 $ (283) Adjusted net income (loss) per diluted share $ 0.25 $ (0.01) Diluted weighted average shares outstanding 35,066 37,255 See the last slide of the appendix for footnotes. 2. RECONCILIATION OF U.S. GAAP NET INCOME (LOSS) TO EBITDA AND ADJUSTED EBITDA (Unaudited) 13 weeks ended (in thousands) Mar 28, 2021 Mar 29, 2020 Net income (loss) $ 6,898 $ (150,494) Income tax benefit (112) (24,748) Interest expense and other (income), net (575) (263) Depreciation and amortization 6,962 9,094 EBITDA 13,173 (166,411) Work Opportunity Tax Credit processing fees (6) 135 135 Amortization of software as a service assets (1) 673 552 Goodwill and intangible asset impairment charge — 175,189 Workforce reduction costs (2) 70 1,308 COVID-19 government subsidies (1,743) — Other adjustments, net (3) 1,086 (6,133) Adjusted EBITDA $ 13,394 $ 4,640

www.TrueBlue.c om 16 Footnotes: (1) Amortization of software as a service assets is reported in selling, general and administrative expense. (2) Workforce reduction costs for the 13 weeks ended March 31, 2020 were primarily due to employee reductions as part of our cost management actions in response to COVID-19. (3) Other adjustments for the 13 weeks ended March 28, 2021 primarily include lease expense of $0.8 million incurred during the build-out phase of our Chicago office and implementation costs for cloud- based systems of $0.1 million. Other adjustments for the 13 weeks ended March 31, 2020 primarily include implementation costs for cloud-based systems of $0.5 million, offset by a $6.3 million benefit from a reduction in expected costs to comply with the Affordable Care Act. (4) Total tax effect of each of the adjustments to U.S. GAAP net income (loss) using the effective income tax rate benefit of 2 percent for Q1 2021 and the expected long-term ongoing income tax rate expense of 12 percent for Q1 2020. (5) Adjustment of the effective income tax rate to the expected long-term ongoing rate of 12 percent for Q1 2020. Beginning in Q2 2020, we decided not to adjust our GAAP tax rate in our adjusted net income (loss) calculation until our profitability rises to a more substantial level. (6) These third-party processing fees are associated with generating the Work Opportunity Tax Credits, which are designed to encourage employers to hire workers from certain targeted groups with higher than average unemployment rates.
