Attached files
| file | filename |
|---|---|
| 8-K - 8-K - HBT Financial, Inc. | tmb-20210426x8k.htm |
| EX-99.1 - EX-99.1 - HBT Financial, Inc. | tmb-20210426xex99d1.htm |
Exhibit 99.2
| STRICTLY PRIVATE AND CONFIDENTIAL Q1 2021 Results Presentation A p r i l 2 6 , 2021 HBT Financial, Inc. |

| Forward-Looking Statements Certain statements contained in this presentation are forward-looking statements. Forward-looking statements may include statements relating to our future plans, strategies and expectations, as well as the economic impact of COVID-19 and the related impacts on our future financial results and statements about our near-term outlook, including near-term loan growth, net interest margin, provision for loan losses, service charges on deposit accounts, mortgage banking profits, wealth management fees, expenses, asset quality, capital levels and continued earnings. Forward looking statements are generally identifiable by use of the words ‘‘believe,’’ “may,” “will,” “should,” “could,” “expect,” “estimate,” “intend,” “anticipate,” “project,” “plan” or similar expressions. Forward looking statements are frequently based on assumptions that may or may not materialize and are subject to numerous uncertainties that could cause actual results to differ materially from those anticipated in the forward-looking statements. Factors that could cause actual results to differ materially from the results anticipated or projected and which could materially and adversely affect our operating results, financial condition or prospects include, but are not limited to: the severity, magnitude and duration of the COVID-19 pandemic; the direct and indirect impacts of the COVID-19 pandemic and governmental responses to the pandemic on our operations and our customers’ businesses; the disruption of global, national, state and local economies associated with the COVID-19 pandemic, which could affect our capital levels and earnings, impair the ability of our borrowers to repay outstanding loans, impair collateral values and further increase our allowance for credit losses; our asset quality and any loan charge-offs; the composition of our loan portfolio; time and effort necessary to resolve nonperforming assets; environmental liability associated with our lending activities; the effects of the current low interest rate environment or changes in interest rates on our net interest income, net interest margin, our investments, and our loan originations, and our modelling estimates relating to interest rate changes; our access to sources of liquidity and capital to address our liquidity needs; our inability to receive dividends from the chartered bank we own (the “Bank”), pay dividends to our common stockholders or satisfy obligations as they become due; the effects of problems encountered by other financial institutions; our ability to achieve organic loan and deposit growth and the composition of such growth; our ability to attract and retain skilled employees or changes in our management personnel; any failure or interruption of our information and communications systems; our ability to identify and address cybersecurity risks; the effects of the failure of any component of our business infrastructure provided by a third party; our ability to keep pace with technological changes; our ability to successfully develop and commercialize new or enhanced products and services; current and future business, economic and market conditions in the United States generally or in Illinois in particular; the geographic concentration of our operations in the State of Illinois; our ability to effectively compete with other financial services companies and the effects of competition in the financial services industry on our business; our ability to attract and retain customer deposits; our ability to maintain the Bank’s reputation; possible impairment of our goodwill and other intangible assets; the impact of, and changes in applicable laws, regulations and accounting standards and policies; our prior status as an “S Corporation” under the applicable provisions of the Internal Revenue Code of 1986, as amended; possible changes in trade, monetary and fiscal policies of, and other activities undertaken by, governments, agencies, central banks and similar organizations; the effectiveness of our risk management and internal disclosure controls and procedures; market perceptions associated with certain aspects of our business; the one-time and incremental costs of operating as a standalone public company; our ability to meet our obligations as a public company, including our obligations under Section 404 of Sarbanes-Oxley; and damage to our reputation from any of the factors described above or elsewhere in this presentation. These risks and uncertainties should be considered in evaluating forward-looking statements and undue reliance should not be placed on such statements. Forward-looking statements speak only as of the date they are made. We do not undertake any obligation to update any forward-looking statement in the future, or to reflect circumstances and events that occur after the date on which the forward-looking statement was made. Non-GAAP Financial Measures This presentation includes certain non-GAAP financial measures. While HBT Financial, Inc. (“HBT” or the “Company”) believes these are useful measures for investors, they are not presented in accordance with GAAP. You should not consider non-GAAP measures in isolation or as a substitute for the most directly comparable or other financial measures calculated in accordance with GAAP. Because not all companies use identical calculations, the presentation herein of non-GAAP financial measures may not be comparable to other similarly titled measures of other companies. Tax equivalent adjustments assume a federal tax rate of 21% and state income tax rate of 9.50% during the three months ended March 31, 2021, December 31, 2020, September 30, 2020, June 30, 2020, and March 31, 2020, and the years ended December 31, 2020, 2019 and 2018, and a federal tax rate of 35% and state income tax rate of 8.63% for the year ended December 31, 2017. For a reconciliation of the non-GAAP measures we use to the most comparable GAAP measures, see the Appendix to this presentation. 1 |
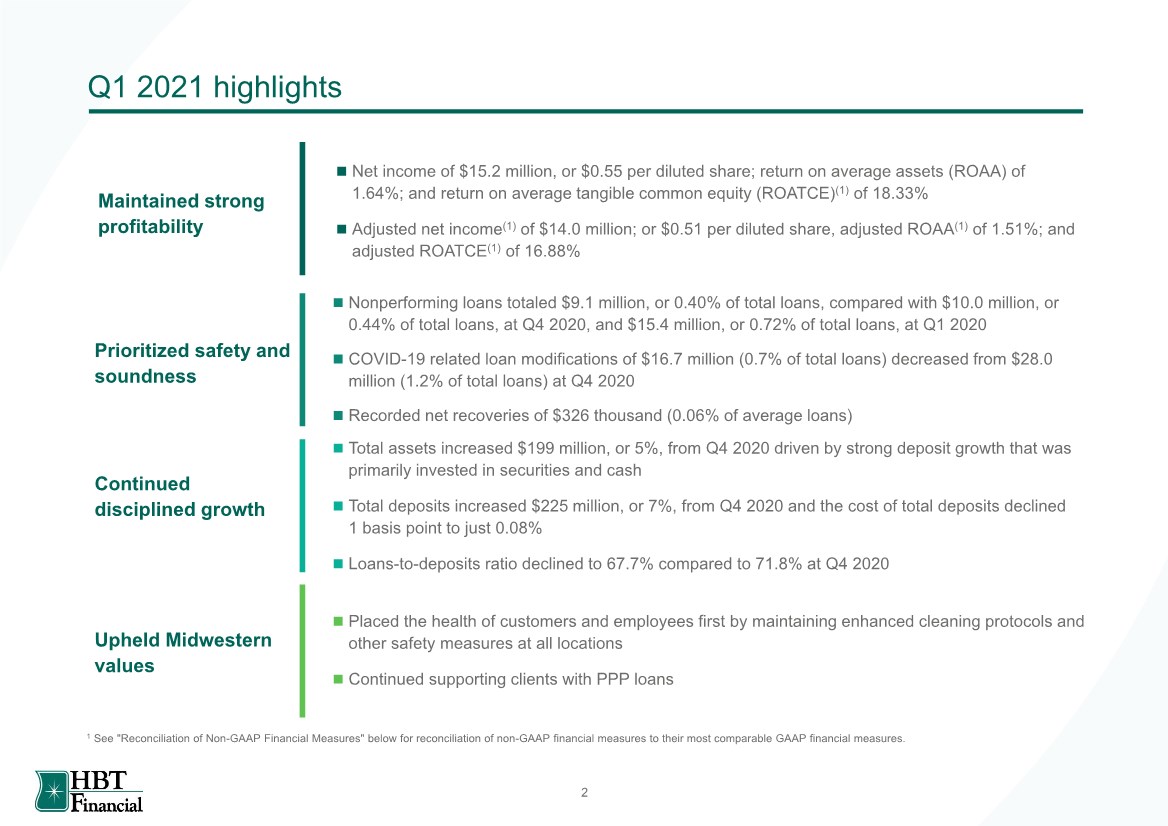
| Q1 2021 highlights Continued disciplined growth ◼ Total assets increased $199 million, or 5%, from Q4 2020 driven by strong deposit growth that was primarily invested in securities and cash ◼ Total deposits increased $225 million, or 7%, from Q4 2020 and the cost of total deposits declined 1 basis point to just 0.08% ◼ Loans-to-deposits ratio declined to 67.7% compared to 71.8% at Q4 2020 Upheld Midwestern values ◼ Placed the health of customers and employees first by maintaining enhanced cleaning protocols and other safety measures at all locations ◼ Continued supporting clients with PPP loans Maintained strong profitability ◼ Net income of $15.2 million, or $0.55 per diluted share; return on average assets (ROAA) of 1.64%; and return on average tangible common equity (ROATCE)(1) of 18.33% ◼ Adjusted net income(1) of $14.0 million; or $0.51 per diluted share, adjusted ROAA(1) of 1.51%; and adjusted ROATCE(1) of 16.88% Prioritized safety and soundness ◼ Nonperforming loans totaled $9.1 million, or 0.40% of total loans, compared with $10.0 million, or 0.44% of total loans, at Q4 2020, and $15.4 million, or 0.72% of total loans, at Q1 2020 ◼ COVID-19 related loan modifications of $16.7 million (0.7% of total loans) decreased from $28.0 million (1.2% of total loans) at Q4 2020 ◼ Recorded net recoveries of $326 thousand (0.06% of average loans) 1 See "Reconciliation of Non-GAAP Financial Measures" below for reconciliation of non-GAAP financial measures to their most comparable GAAP financial measures. 2 |
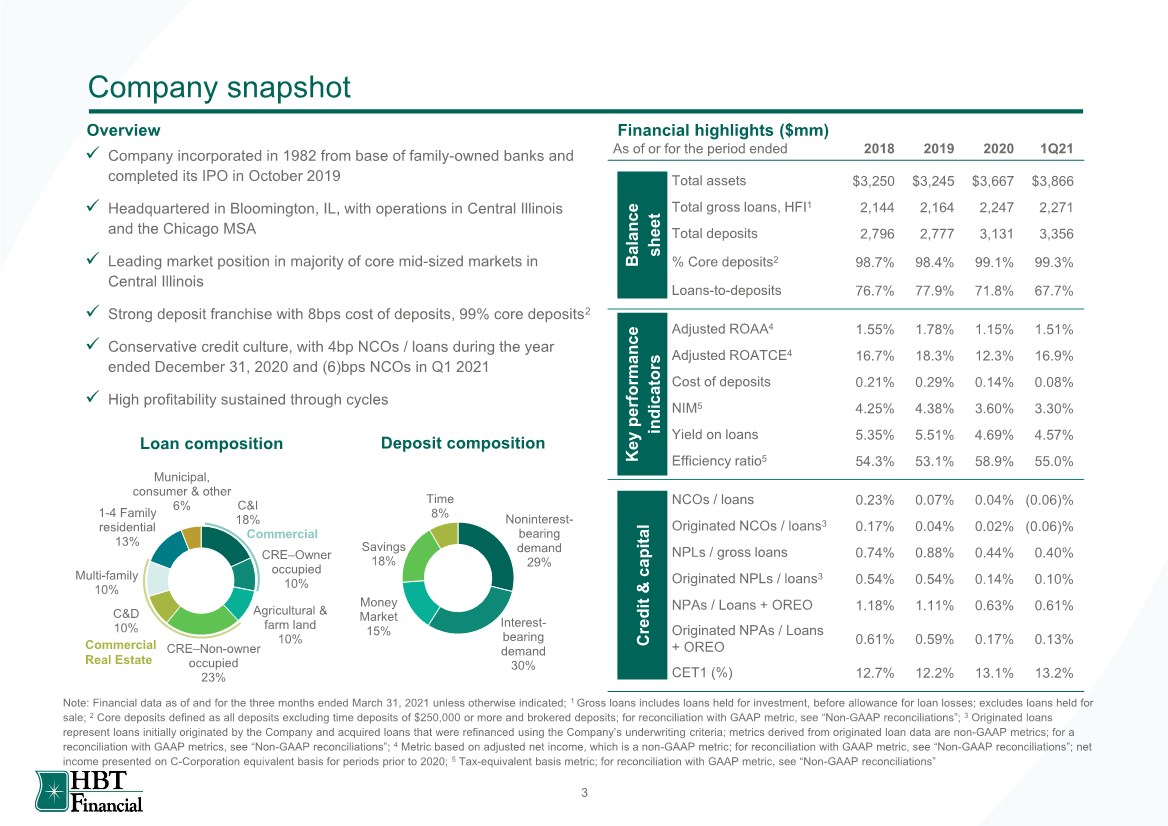
| C&I 18% CRE–Owner occupied 10% Agricultural & farm land 10% CRE–Non-owner occupied 23% C&D 10% Multi-family 10% 1-4 Family residential 13% Municipal, consumer & other 6% Company snapshot ✓ Company incorporated in 1982 from base of family-owned banks and completed its IPO in October 2019 ✓ Headquartered in Bloomington, IL, with operations in Central Illinois and the Chicago MSA ✓ Leading market position in majority of core mid-sized markets in Central Illinois ✓ Strong deposit franchise with 8bps cost of deposits, 99% core deposits2 ✓ Conservative credit culture, with 4bp NCOs / loans during the year ended December 31, 2020 and (6)bps NCOs in Q1 2021 ✓ High profitability sustained through cycles Overview As of or for the period ended 2018 2019 2020 1Q21 Total assets $3,250 $3,245 $3,667 $3,866 Total gross loans, HFI1 2,144 2,164 2,247 2,271 Total deposits 2,796 2,777 3,131 3,356 % Core deposits2 98.7% 98.4% 99.1% 99.3% Loans-to-deposits 76.7% 77.9% 71.8% 67.7% Adjusted ROAA4 1.55% 1.78% 1.15% 1.51% Adjusted ROATCE4 16.7% 18.3% 12.3% 16.9% Cost of deposits 0.21% 0.29% 0.14% 0.08% NIM5 4.25% 4.38% 3.60% 3.30% Yield on loans 5.35% 5.51% 4.69% 4.57% Efficiency ratio5 54.3% 53.1% 58.9% 55.0% NCOs / loans 0.23% 0.07% 0.04% (0.06)% Originated NCOs / loans3 0.17% 0.04% 0.02% (0.06)% NPLs / gross loans 0.74% 0.88% 0.44% 0.40% Originated NPLs / loans3 0.54% 0.54% 0.14% 0.10% NPAs / Loans + OREO 1.18% 1.11% 0.63% 0.61% Originated NPAs / Loans + OREO 0.61% 0.59% 0.17% 0.13% CET1 (%) 12.7% 12.2% 13.1% 13.2% Financial highlights ($mm) Balance sheet Key performance i ndicators Credit & capital Loan composition Note: Financial data as of and for the three months ended March 31, 2021 unless otherwise indicated; 1 Gross loans includes loans held for investment, before allowance for loan losses; excludes loans held for sale; 2 Core deposits defined as all deposits excluding time deposits of $250,000 or more and brokered deposits; for reconciliation with GAAP metric, see “Non-GAAP reconciliations”; 3 Originated loans represent loans initially originated by the Company and acquired loans that were refinanced using the Company’s underwriting criteria; metrics derived from originated loan data are non-GAAP metrics; for a reconciliation with GAAP metrics, see “Non-GAAP reconciliations”; 4 Metric based on adjusted net income, which is a non-GAAP metric; for reconciliation with GAAP metric, see “Non-GAAP reconciliations”; net income presented on C-Corporation equivalent basis for periods prior to 2020; 5 Tax-equivalent basis metric; for reconciliation with GAAP metric, see “Non-GAAP reconciliations” Commercial Commercial Real Estate Deposit composition Noninterest- bearing demand 29% Interest- bearing demand 30% Money Market 15% Savings 18% Time 8% 3 |
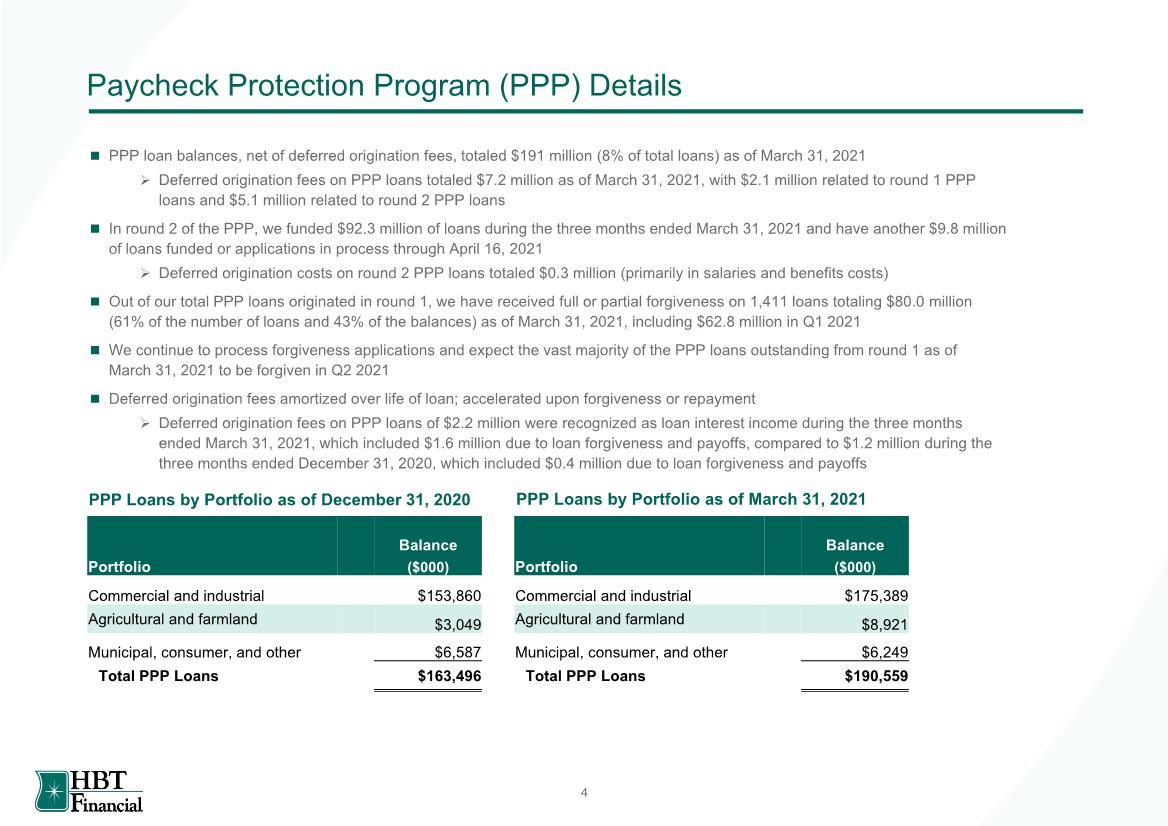
| Paycheck Protection Program (PPP) Details PPP Loans by Portfolio as of December 31, 2020 Portfolio Balance ($000) Commercial and industrial $153,860 Agricultural and farmland $3,049 Municipal, consumer, and other $6,587 Total PPP Loans $163,496 ◼ PPP loan balances, net of deferred origination fees, totaled $191 million (8% of total loans) as of March 31, 2021 ➢ Deferred origination fees on PPP loans totaled $7.2 million as of March 31, 2021, with $2.1 million related to round 1 PPP loans and $5.1 million related to round 2 PPP loans ◼ In round 2 of the PPP, we funded $92.3 million of loans during the three months ended March 31, 2021 and have another $9.8 million of loans funded or applications in process through April 16, 2021 ➢ Deferred origination costs on round 2 PPP loans totaled $0.3 million (primarily in salaries and benefits costs) ◼ Out of our total PPP loans originated in round 1, we have received full or partial forgiveness on 1,411 loans totaling $80.0 million (61% of the number of loans and 43% of the balances) as of March 31, 2021, including $62.8 million in Q1 2021 ◼ We continue to process forgiveness applications and expect the vast majority of the PPP loans outstanding from round 1 as of March 31, 2021 to be forgiven in Q2 2021 ◼ Deferred origination fees amortized over life of loan; accelerated upon forgiveness or repayment ➢ Deferred origination fees on PPP loans of $2.2 million were recognized as loan interest income during the three months ended March 31, 2021, which included $1.6 million due to loan forgiveness and payoffs, compared to $1.2 million during the three months ended December 31, 2020, which included $0.4 million due to loan forgiveness and payoffs 4 PPP Loans by Portfolio as of March 31, 2021 Portfolio Balance ($000) Commercial and industrial $175,389 Agricultural and farmland $8,921 Municipal, consumer, and other $6,249 Total PPP Loans $190,559 |
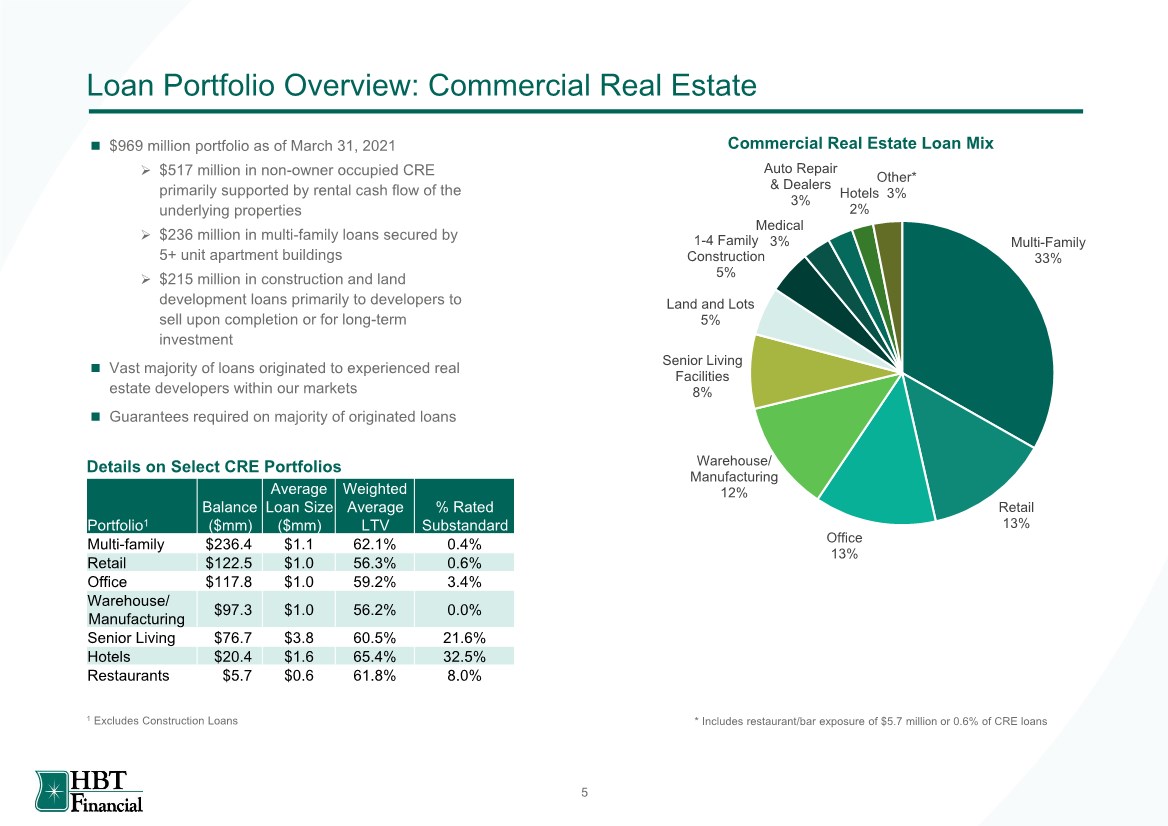
| Loan Portfolio Overview: Commercial Real Estate ◼ $969 million portfolio as of March 31, 2021 ➢ $517 million in non-owner occupied CRE primarily supported by rental cash flow of the underlying properties ➢ $236 million in multi-family loans secured by 5+ unit apartment buildings ➢ $215 million in construction and land development loans primarily to developers to sell upon completion or for long-term investment ◼ Vast majority of loans originated to experienced real estate developers within our markets ◼ Guarantees required on majority of originated loans Multi-Family 33% Retail 13% Office 13% Warehouse/ Manufacturing 12% Senior Living Facilities 8% Land and Lots 5% 1-4 Family Construction 5% Medical 3% Auto Repair & Dealers 3% Hotels 2% Other* 3% Commercial Real Estate Loan Mix * Includes restaurant/bar exposure of $5.7 million or 0.6% of CRE loans 5 Portfolio1 Balance ($mm) Average Loan Size ($mm) Weighted Average LTV % Rated Substandard Multi-family $236.4 $1.1 62.1% 0.4% Retail $122.5 $1.0 56.3% 0.6% Office $117.8 $1.0 59.2% 3.4% Warehouse/ Manufacturing $97.3 $1.0 56.2% 0.0% Senior Living $76.7 $3.8 60.5% 21.6% Hotels $20.4 $1.6 65.4% 32.5% Restaurants $5.7 $0.6 61.8% 8.0% 1 Excludes Construction Loans Details on Select CRE Portfolios |
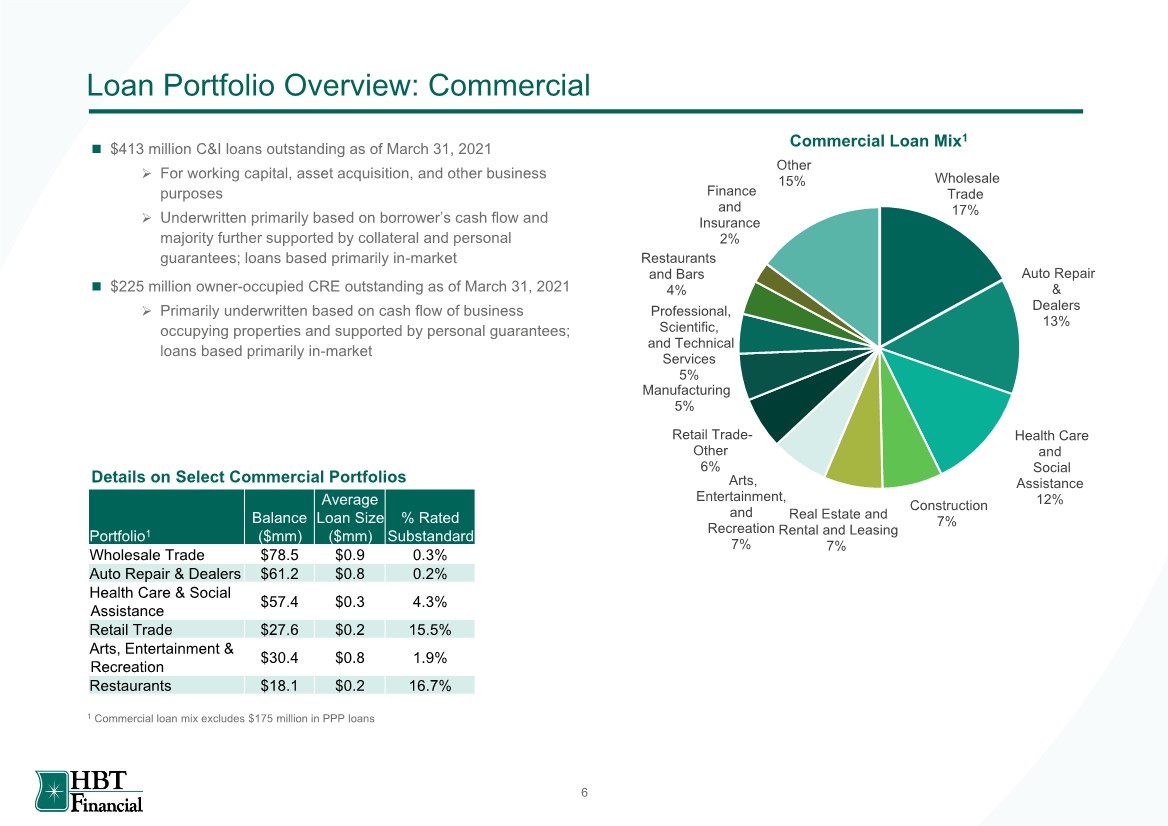
| Loan Portfolio Overview: Commercial ◼ $413 million C&I loans outstanding as of March 31, 2021 ➢ For working capital, asset acquisition, and other business purposes ➢ Underwritten primarily based on borrower’s cash flow and majority further supported by collateral and personal guarantees; loans based primarily in-market ◼ $225 million owner-occupied CRE outstanding as of March 31, 2021 ➢ Primarily underwritten based on cash flow of business occupying properties and supported by personal guarantees; loans based primarily in-market Wholesale Trade 17% Auto Repair & Dealers 13% Health Care and Social Assistance 12% Construction 7% Real Estate and Rental and Leasing 7% Arts, Entertainment, and Recreation 7% Retail Trade- Other 6% Manufacturing 5% Professional, Scientific, and Technical Services 5% Restaurants and Bars 4% Finance and Insurance 2% Other 15% Commercial Loan Mix1 1 Commercial loan mix excludes $175 million in PPP loans 6 Portfolio1 Balance ($mm) Average Loan Size ($mm) % Rated Substandard Wholesale Trade $78.5 $0.9 0.3% Auto Repair & Dealers $61.2 $0.8 0.2% Health Care & Social Assistance $57.4 $0.3 4.3% Retail Trade $27.6 $0.2 15.5% Arts, Entertainment & Recreation $30.4 $0.8 1.9% Restaurants $18.1 $0.2 16.7% Details on Select Commercial Portfolios |
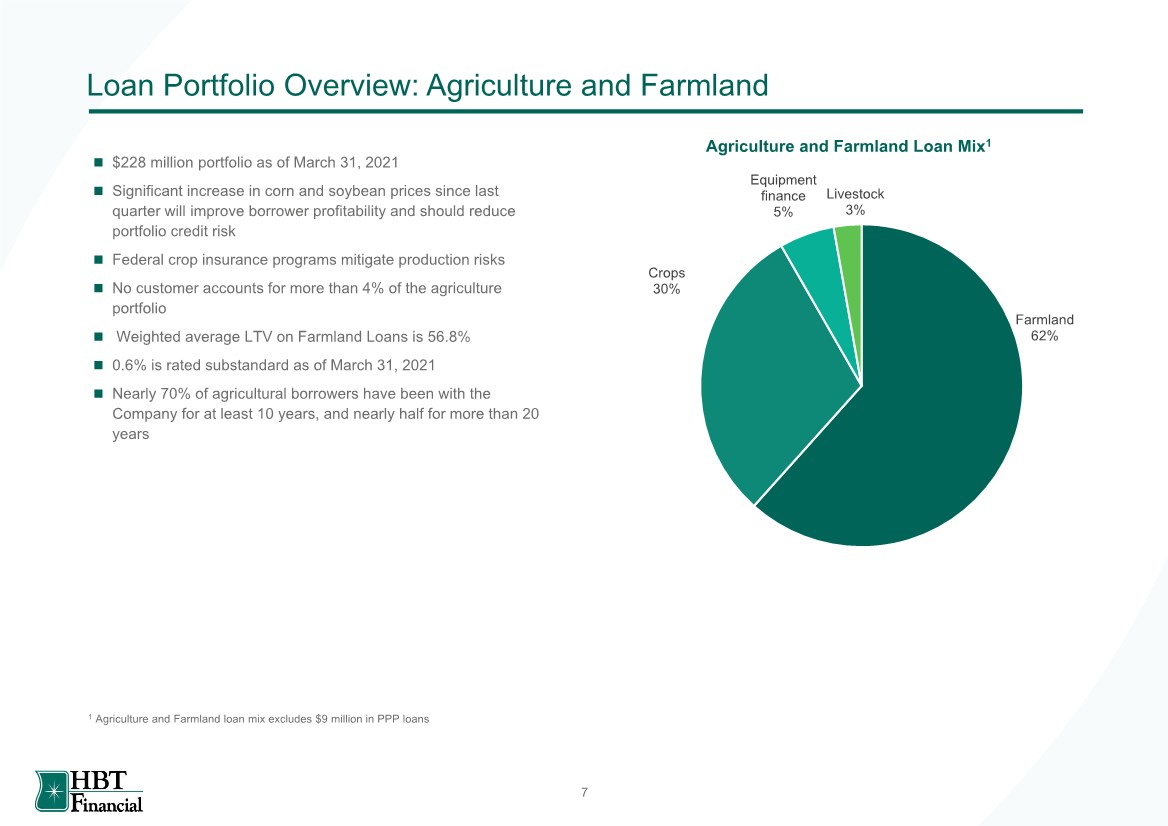
| Loan Portfolio Overview: Agriculture and Farmland ◼ $228 million portfolio as of March 31, 2021 ◼ Significant increase in corn and soybean prices since last quarter will improve borrower profitability and should reduce portfolio credit risk ◼ Federal crop insurance programs mitigate production risks ◼ No customer accounts for more than 4% of the agriculture portfolio ◼ Weighted average LTV on Farmland Loans is 56.8% ◼ 0.6% is rated substandard as of March 31, 2021 ◼ Nearly 70% of agricultural borrowers have been with the Company for at least 10 years, and nearly half for more than 20 years Agriculture and Farmland Loan Mix1 Farmland 62% Crops 30% Equipment finance 5% Livestock 3% 1 Agriculture and Farmland loan mix excludes $9 million in PPP loans 7 |
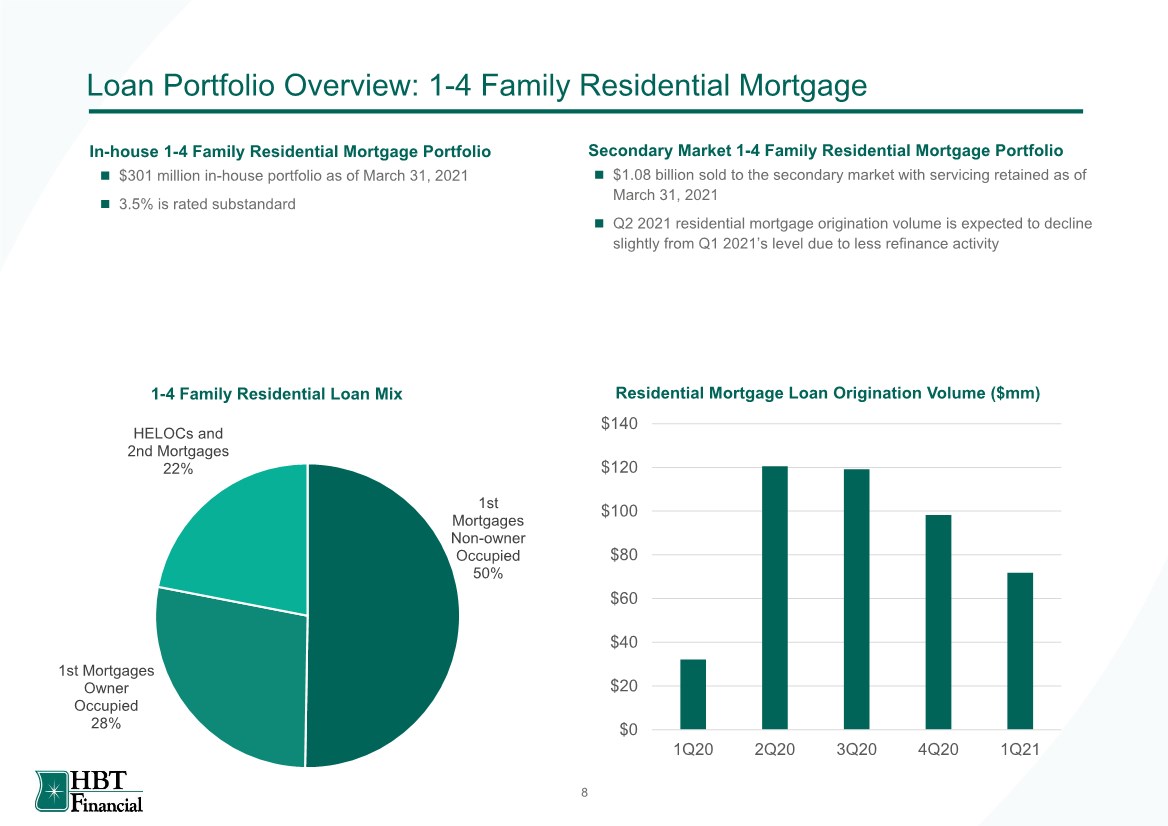
| Loan Portfolio Overview: 1-4 Family Residential Mortgage ◼ $301 million in-house portfolio as of March 31, 2021 ◼ 3.5% is rated substandard 1st Mortgages Non-owner Occupied 50% 1st Mortgages Owner Occupied 28% HELOCs and 2nd Mortgages 22% 1-4 Family Residential Loan Mix ◼ $1.08 billion sold to the secondary market with servicing retained as of March 31, 2021 ◼ Q2 2021 residential mortgage origination volume is expected to decline slightly from Q1 2021’s level due to less refinance activity In-house 1-4 Family Residential Mortgage Portfolio Secondary Market 1-4 Family Residential Mortgage Portfolio Residential Mortgage Loan Origination Volume ($mm) $0 $20 $40 $60 $80 $100 $120 $140 1Q20 2Q20 3Q20 4Q20 1Q21 8 |
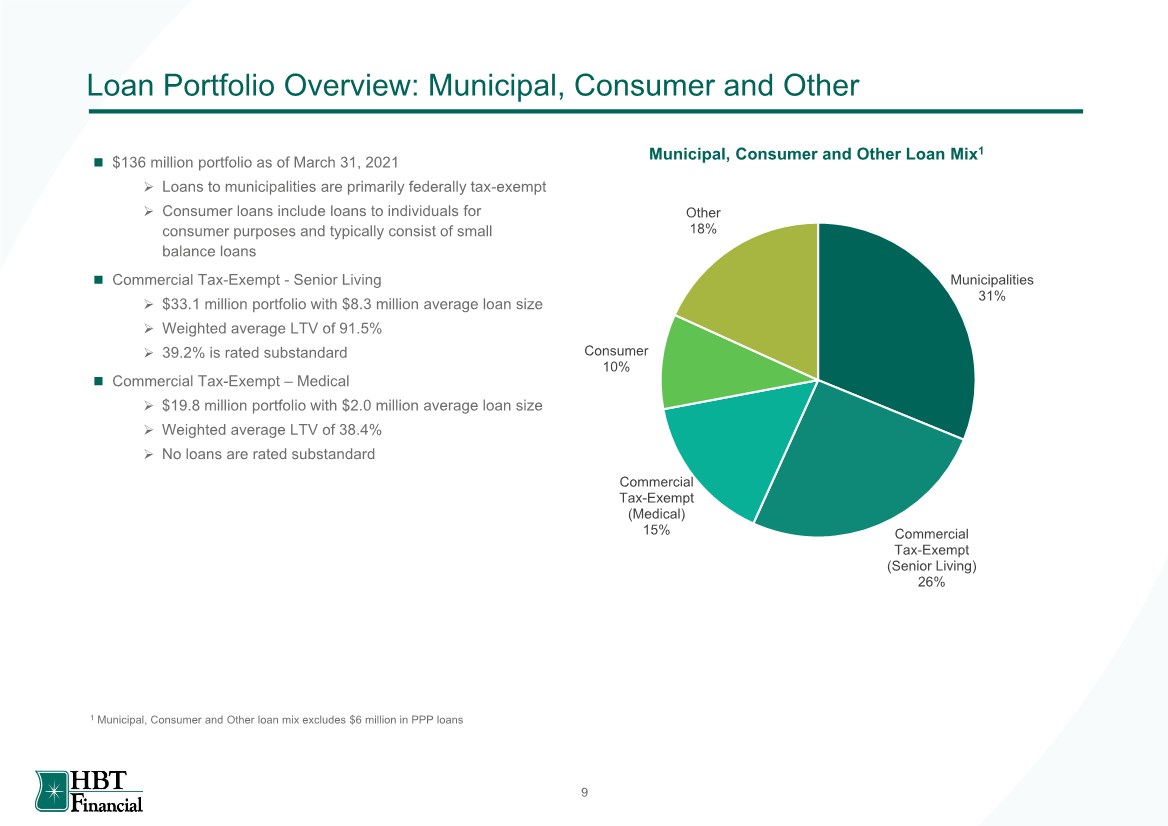
| Loan Portfolio Overview: Municipal, Consumer and Other ◼ $136 million portfolio as of March 31, 2021 ➢ Loans to municipalities are primarily federally tax-exempt ➢ Consumer loans include loans to individuals for consumer purposes and typically consist of small balance loans ◼ Commercial Tax-Exempt - Senior Living ➢ $33.1 million portfolio with $8.3 million average loan size ➢ Weighted average LTV of 91.5% ➢ 39.2% is rated substandard ◼ Commercial Tax-Exempt – Medical ➢ $19.8 million portfolio with $2.0 million average loan size ➢ Weighted average LTV of 38.4% ➢ No loans are rated substandard Municipal, Consumer and Other Loan Mix1 Municipalities 31% Commercial Tax-Exempt (Senior Living) 26% Commercial Tax-Exempt (Medical) 15% Consumer 10% Other 18% 1 Municipal, Consumer and Other loan mix excludes $6 million in PPP loans 9 |
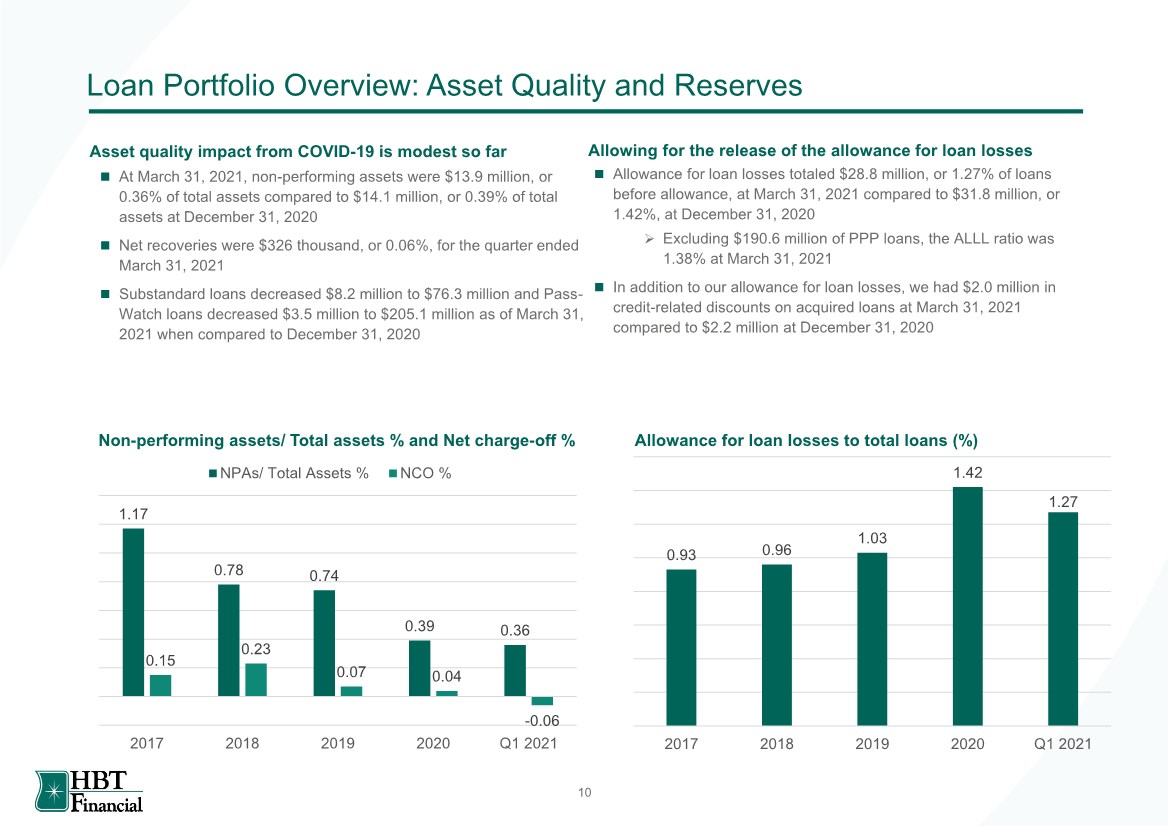
| Loan Portfolio Overview: Asset Quality and Reserves ◼ At March 31, 2021, non-performing assets were $13.9 million, or 0.36% of total assets compared to $14.1 million, or 0.39% of total assets at December 31, 2020 ◼ Net recoveries were $326 thousand, or 0.06%, for the quarter ended March 31, 2021 ◼ Substandard loans decreased $8.2 million to $76.3 million and Pass- Watch loans decreased $3.5 million to $205.1 million as of March 31, 2021 when compared to December 31, 2020 Non-performing assets/ Total assets % and Net charge-off % ◼ Allowance for loan losses totaled $28.8 million, or 1.27% of loans before allowance, at March 31, 2021 compared to $31.8 million, or 1.42%, at December 31, 2020 ➢ Excluding $190.6 million of PPP loans, the ALLL ratio was 1.38% at March 31, 2021 ◼ In addition to our allowance for loan losses, we had $2.0 million in credit-related discounts on acquired loans at March 31, 2021 compared to $2.2 million at December 31, 2020 Asset quality impact from COVID-19 is modest so far Allowing for the release of the allowance for loan losses Allowance for loan losses to total loans (%) 1.17 0.78 0.74 0.39 0.36 0.15 0.23 0.07 0.04 -0.06 2017 2018 2019 2020 Q1 2021 NPAs/ Total Assets % NCO % 0.93 0.96 1.03 1.42 1.27 2017 2018 2019 2020 Q1 2021 10 |
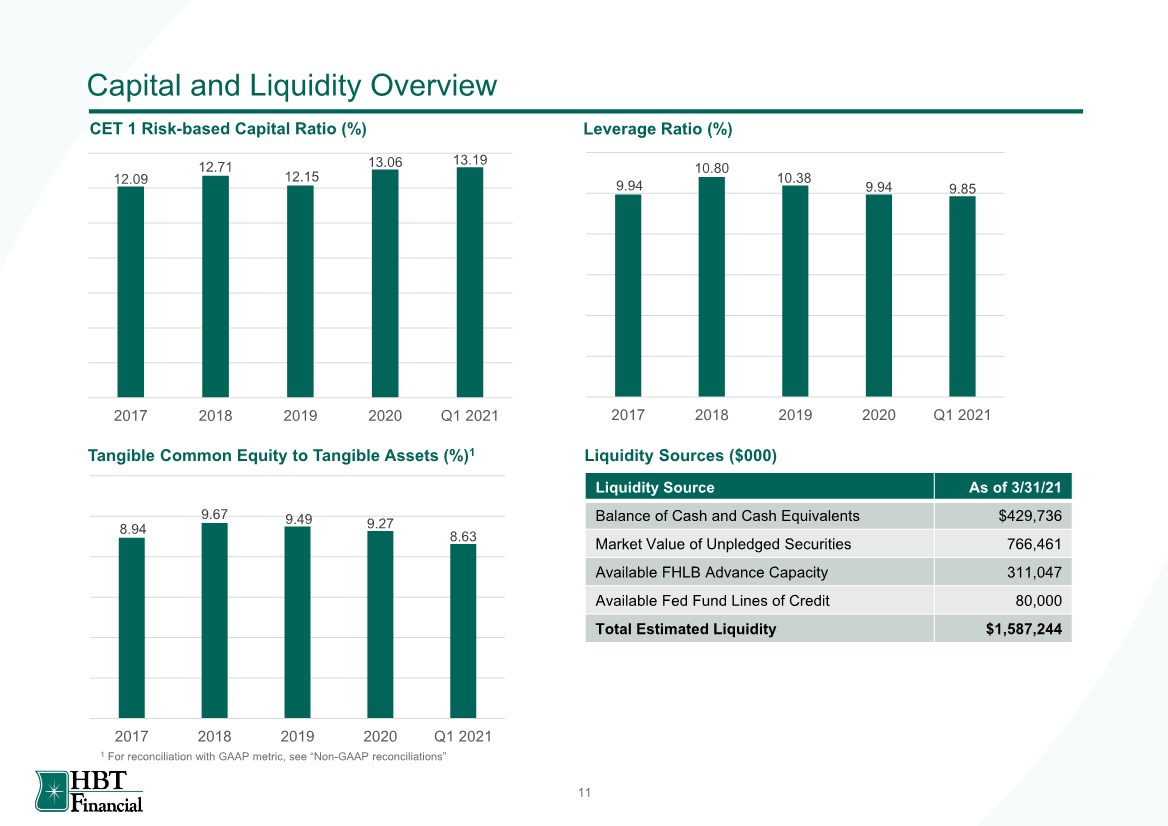
| Capital and Liquidity Overview CET 1 Risk-based Capital Ratio (%) Leverage Ratio (%) Tangible Common Equity to Tangible Assets (%)1 Liquidity Sources ($000) 12.09 12.71 12.15 13.06 13.19 2017 2018 2019 2020 Q1 2021 9.94 10.80 10.38 9.94 9.85 2017 2018 2019 2020 Q1 2021 8.94 9.67 9.49 9.27 8.63 2017 2018 2019 2020 Q1 2021 Liquidity Source As of 3/31/21 Balance of Cash and Cash Equivalents $429,736 Market Value of Unpledged Securities 766,461 Available FHLB Advance Capacity 311,047 Available Fed Fund Lines of Credit 80,000 Total Estimated Liquidity $1,587,244 1 For reconciliation with GAAP metric, see “Non-GAAP reconciliations” 11 |
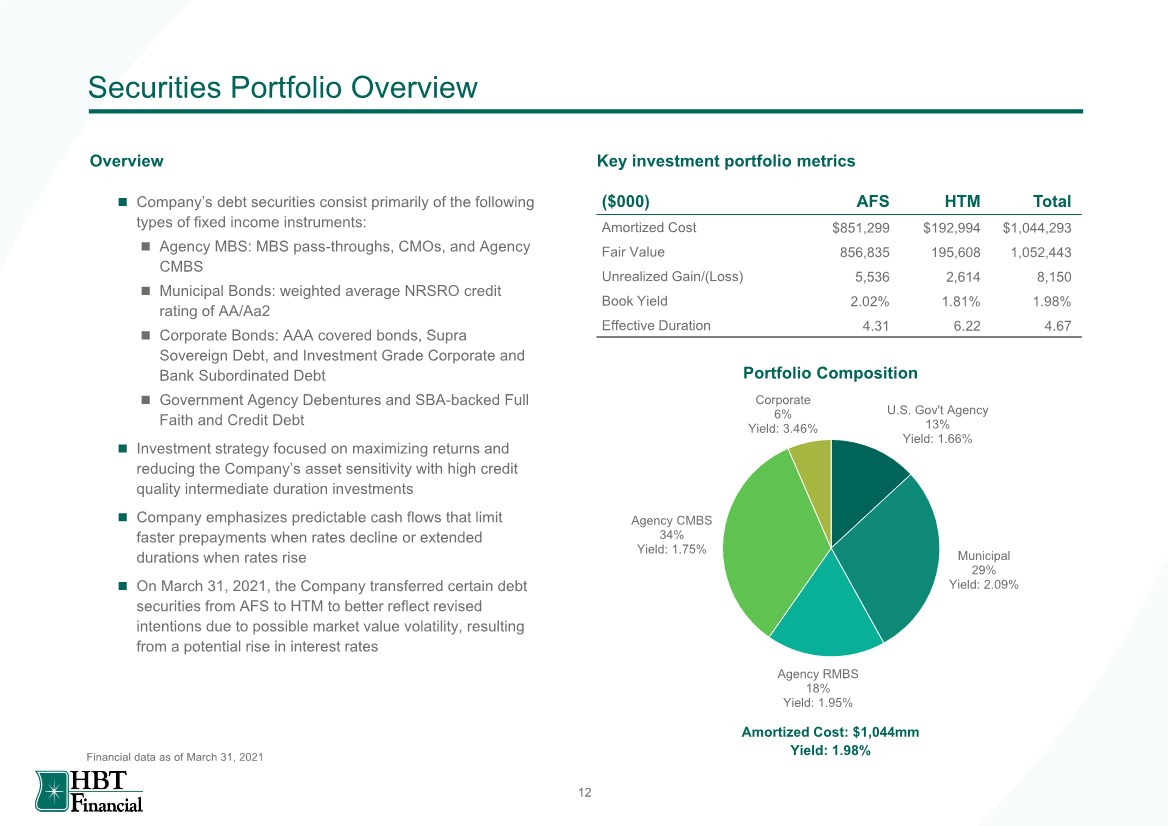
| U.S. Gov't Agency 13% Yield: 1.66% Municipal 29% Yield: 2.09% Agency RMBS 18% Yield: 1.95% Agency CMBS 34% Yield: 1.75% Corporate 6% Yield: 3.46% Securities Portfolio Overview ◼ Company’s debt securities consist primarily of the following types of fixed income instruments: ◼ Agency MBS: MBS pass-throughs, CMOs, and Agency CMBS ◼ Municipal Bonds: weighted average NRSRO credit rating of AA/Aa2 ◼ Corporate Bonds: AAA covered bonds, Supra Sovereign Debt, and Investment Grade Corporate and Bank Subordinated Debt ◼ Government Agency Debentures and SBA-backed Full Faith and Credit Debt ◼ Investment strategy focused on maximizing returns and reducing the Company’s asset sensitivity with high credit quality intermediate duration investments ◼ Company emphasizes predictable cash flows that limit faster prepayments when rates decline or extended durations when rates rise ◼ On March 31, 2021, the Company transferred certain debt securities from AFS to HTM to better reflect revised intentions due to possible market value volatility, resulting from a potential rise in interest rates Financial data as of March 31, 2021 12 Portfolio Composition Amortized Cost: $1,044mm Yield: 1.98% Overview Key investment portfolio metrics ($000) AFS HTM Total Amortized Cost $851,299 $192,994 $1,044,293 Fair Value 856,835 195,608 1,052,443 Unrealized Gain/(Loss) 5,536 2,614 8,150 Book Yield 2.02% 1.81% 1.98% Effective Duration 4.31 6.22 4.67 |
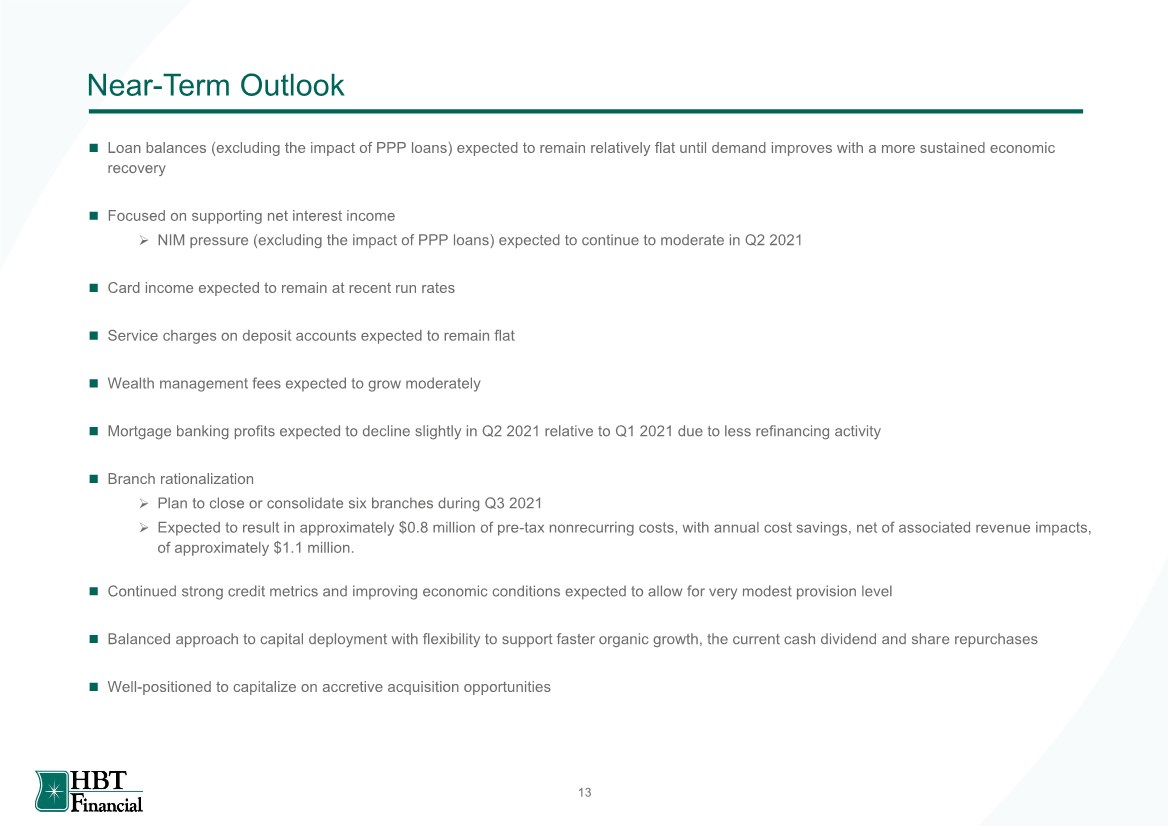
| Near-Term Outlook ◼ Loan balances (excluding the impact of PPP loans) expected to remain relatively flat until demand improves with a more sustained economic recovery ◼ Focused on supporting net interest income ➢ NIM pressure (excluding the impact of PPP loans) expected to continue to moderate in Q2 2021 ◼ Card income expected to remain at recent run rates ◼ Service charges on deposit accounts expected to remain flat ◼ Wealth management fees expected to grow moderately ◼ Mortgage banking profits expected to decline slightly in Q2 2021 relative to Q1 2021 due to less refinancing activity ◼ Branch rationalization ➢ Plan to close or consolidate six branches during Q3 2021 ➢ Expected to result in approximately $0.8 million of pre-tax nonrecurring costs, with annual cost savings, net of associated revenue impacts, of approximately $1.1 million. ◼ Continued strong credit metrics and improving economic conditions expected to allow for very modest provision level ◼ Balanced approach to capital deployment with flexibility to support faster organic growth, the current cash dividend and share repurchases ◼ Well-positioned to capitalize on accretive acquisition opportunities 13 |
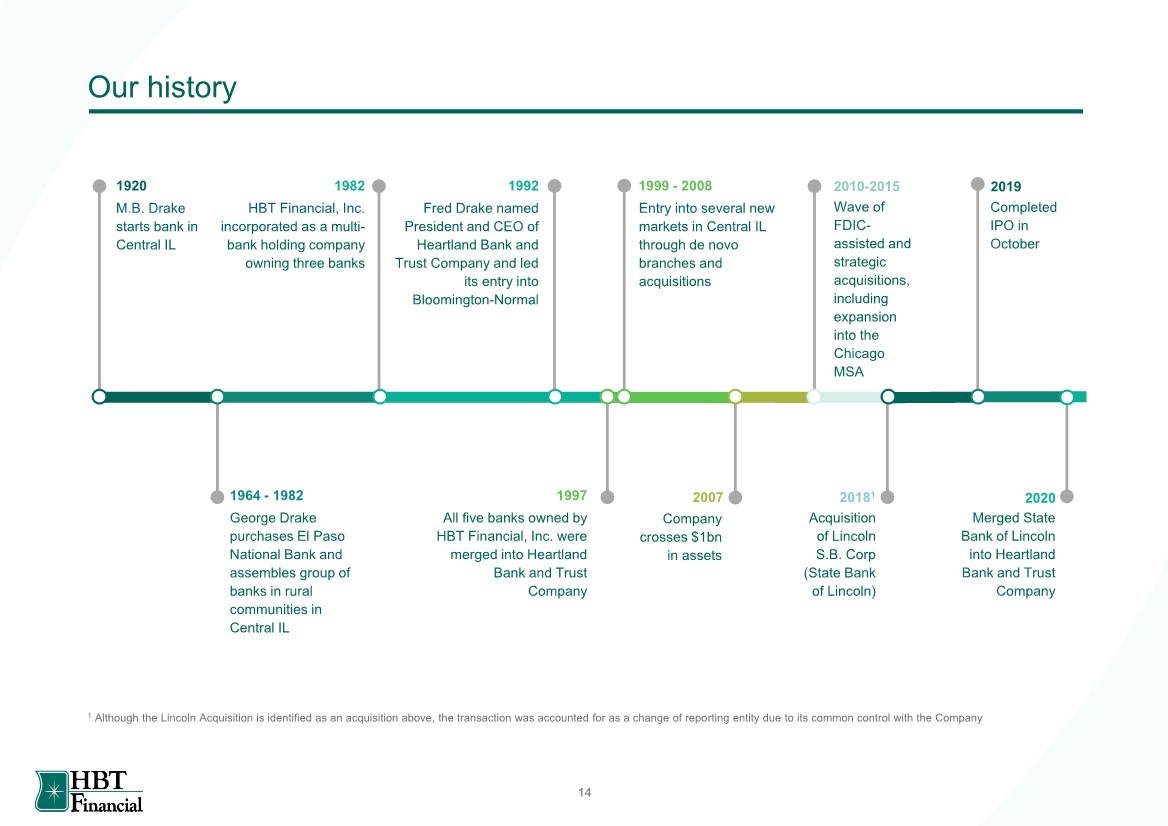
| Our history Fred Drake named President and CEO of Heartland Bank and Trust Company and led its entry into Bloomington-Normal 1992 1964 - 1982 George Drake purchases El Paso National Bank and assembles group of banks in rural communities in Central IL M.B. Drake starts bank in Central IL 1920 HBT Financial, Inc. incorporated as a multi- bank holding company owning three banks 1982 1997 All five banks owned by HBT Financial, Inc. were merged into Heartland Bank and Trust Company Wave of FDIC- assisted and strategic acquisitions, including expansion into the Chicago MSA 2010-2015 Acquisition of Lincoln S.B. Corp (State Bank of Lincoln) 20181 Company crosses $1bn in assets 2007 1999 - 2008 Entry into several new markets in Central IL through de novo branches and acquisitions 1 Although the Lincoln Acquisition is identified as an acquisition above, the transaction was accounted for as a change of reporting entity due to its common control with the Company 2019 Completed IPO in October 14 2020 Merged State Bank of Lincoln into Heartland Bank and Trust Company |
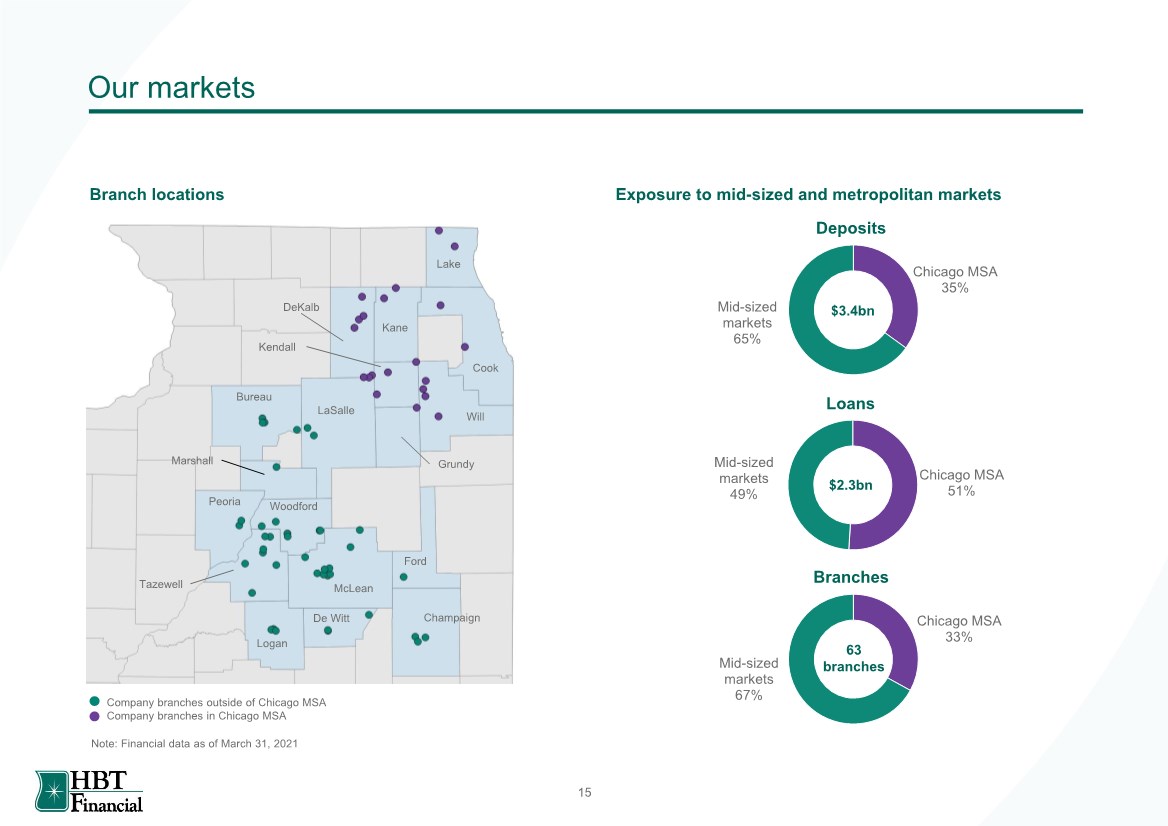
| Our markets Company branches outside of Chicago MSA Company branches in Chicago MSA Lake Kane DeKalb Cook Will Kendall LaSalle Bureau Grundy Ford McLean De Witt Logan Tazewell Peoria Marshall Woodford Champaign Exposure to mid-sized and metropolitan markets Branch locations Chicago MSA 35% Mid-sized markets 65% Deposits Chicago MSA 51% Mid-sized markets 49% Loans Chicago MSA 33% Mid-sized markets 67% Branches $2.3bn $3.4bn 63 branches Note: Financial data as of March 31, 2021 15 |
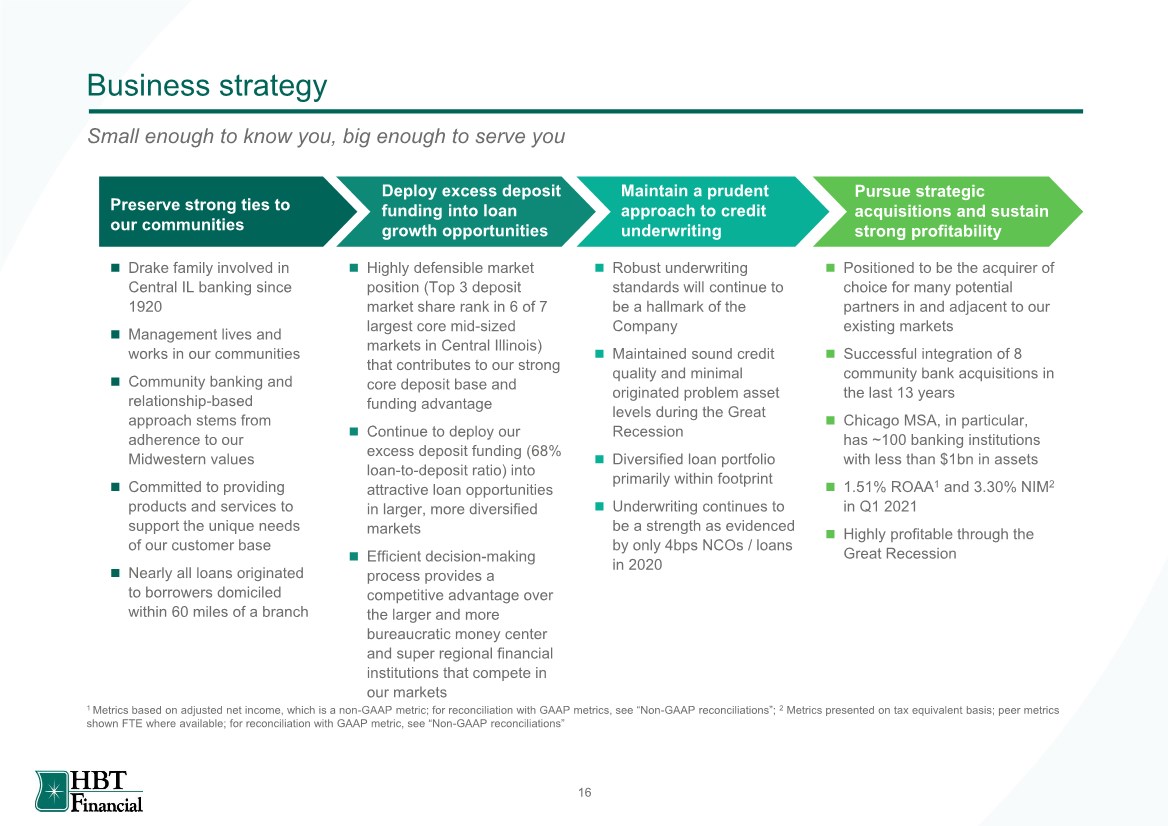
| Business strategy ◼ Drake family involved in Central IL banking since 1920 ◼ Management lives and works in our communities ◼ Community banking and relationship-based approach stems from adherence to our Midwestern values ◼ Committed to providing products and services to support the unique needs of our customer base ◼ Nearly all loans originated to borrowers domiciled within 60 miles of a branch ◼ Robust underwriting standards will continue to be a hallmark of the Company ◼ Maintained sound credit quality and minimal originated problem asset levels during the Great Recession ◼ Diversified loan portfolio primarily within footprint ◼ Underwriting continues to be a strength as evidenced by only 4bps NCOs / loans in 2020 ◼ Positioned to be the acquirer of choice for many potential partners in and adjacent to our existing markets ◼ Successful integration of 8 community bank acquisitions in the last 13 years ◼ Chicago MSA, in particular, has ~100 banking institutions with less than $1bn in assets ◼ 1.51% ROAA1 and 3.30% NIM2 in Q1 2021 ◼ Highly profitable through the Great Recession ◼ Highly defensible market position (Top 3 deposit market share rank in 6 of 7 largest core mid-sized markets in Central Illinois) that contributes to our strong core deposit base and funding advantage ◼ Continue to deploy our excess deposit funding (68% loan-to-deposit ratio) into attractive loan opportunities in larger, more diversified markets ◼ Efficient decision-making process provides a competitive advantage over the larger and more bureaucratic money center and super regional financial institutions that compete in our markets Preserve strong ties to our communities Deploy excess deposit funding into loan growth opportunities Maintain a prudent approach to credit underwriting Pursue strategic acquisitions and sustain strong profitability 1 Metrics based on adjusted net income, which is a non-GAAP metric; for reconciliation with GAAP metrics, see “Non-GAAP reconciliations”; 2 Metrics presented on tax equivalent basis; peer metrics shown FTE where available; for reconciliation with GAAP metric, see “Non-GAAP reconciliations” Small enough to know you, big enough to serve you 16 |
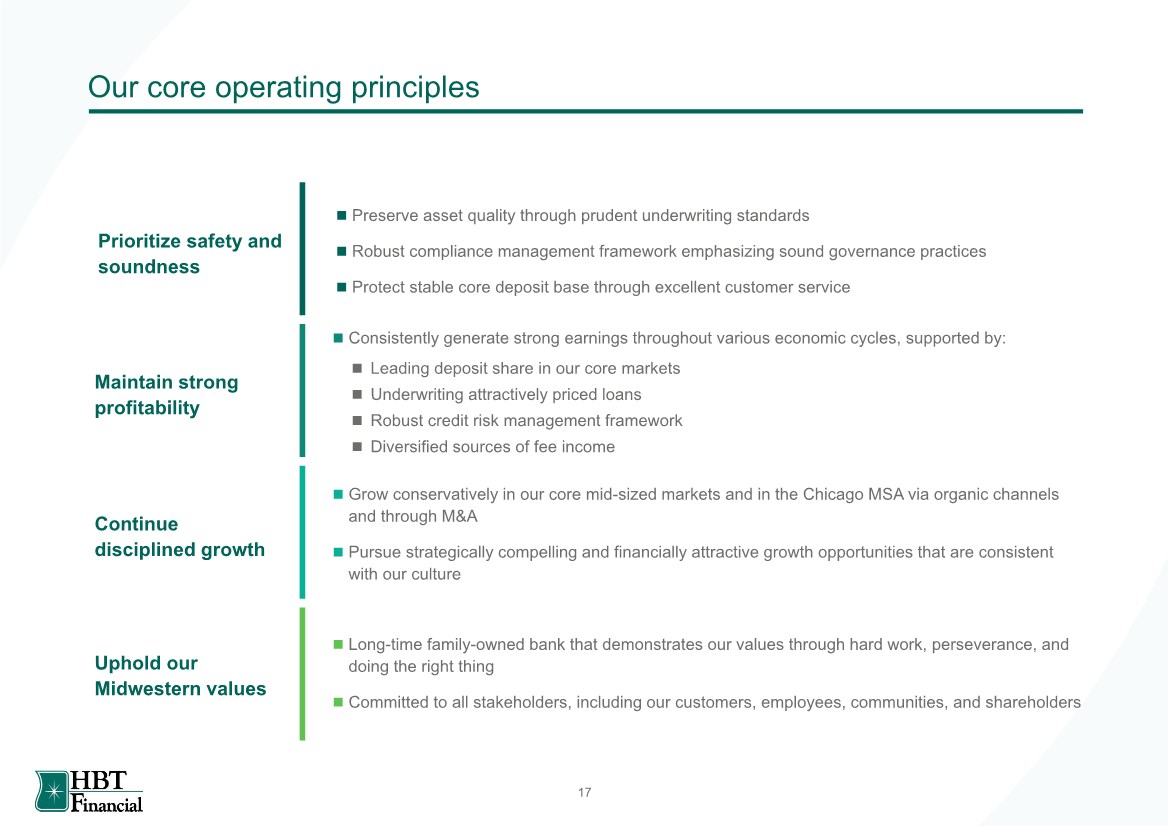
| Our core operating principles Continue disciplined growth ◼ Grow conservatively in our core mid-sized markets and in the Chicago MSA via organic channels and through M&A ◼ Pursue strategically compelling and financially attractive growth opportunities that are consistent with our culture Uphold our Midwestern values ◼ Long-time family-owned bank that demonstrates our values through hard work, perseverance, and doing the right thing ◼ Committed to all stakeholders, including our customers, employees, communities, and shareholders Prioritize safety and soundness ◼ Preserve asset quality through prudent underwriting standards ◼ Robust compliance management framework emphasizing sound governance practices ◼ Protect stable core deposit base through excellent customer service Maintain strong profitability ◼ Consistently generate strong earnings throughout various economic cycles, supported by: ◼ Leading deposit share in our core markets ◼ Underwriting attractively priced loans ◼ Robust credit risk management framework ◼ Diversified sources of fee income 17 |
| Experienced executive management team with deep community ties Fred L. Drake Chairman and CEO 38 years with Company 41 years in industry J. Lance Carter President and Chief Operating Officer 19 years with Company 27 years in industry Patrick F. Busch Chief Lending Officer, President of Heartland Bank 25 years with Company 42 years in industry Matthew J. Doherty Chief Financial Officer 11 years with Company 29 years in industry Lawrence J. Horvath Senior Regional Lender, Heartland Bank 11 years with Company 35 years in industry Mark W. Scheirer Chief Credit Officer 10 years with Company 28 years in industry Andrea E. Zurkamer Chief Risk Officer 7 years with Company 20 years in industry Diane H. Lanier Chief Retail Officer 24 years with Company 36 years in industry 18 |

| Investment highlights 4 1 2 3 5 Track record of successfully integrating acquisitions Consistent performance through cycles Leading market position in core mid-sized markets, with growth opportunity in the Chicago MSA Stable, low-cost deposit base Prudent risk management 19 |
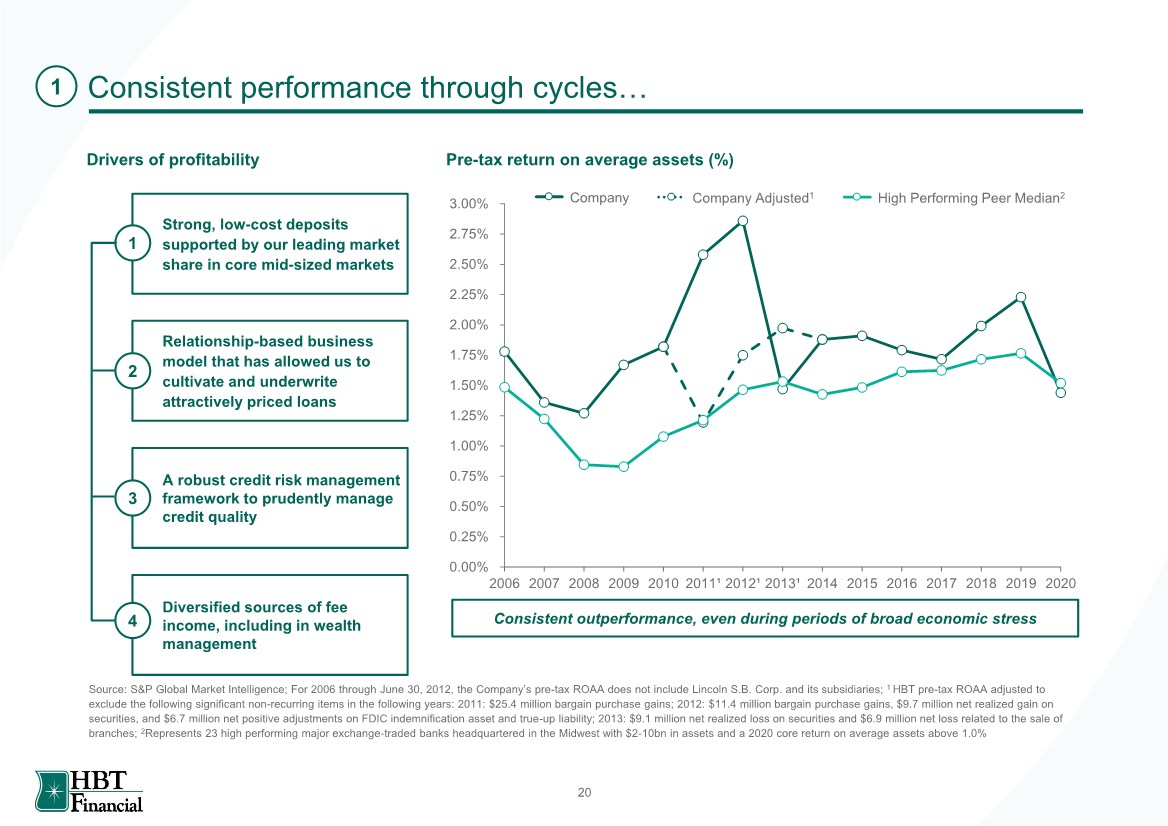
| Consistent performance through cycles… Drivers of profitability Pre-tax return on average assets (%) 0.00% 0.25% 0.50% 0.75% 1.00% 1.25% 1.50% 1.75% 2.00% 2.25% 2.50% 2.75% 3.00% 2006 2007 2008 2009 2010 2011¹ 2012¹ 2013¹ 2014 2015 2016 2017 2018 2019 2020 Source: S&P Global Market Intelligence; For 2006 through June 30, 2012, the Company’s pre-tax ROAA does not include Lincoln S.B. Corp. and its subsidiaries; 1 HBT pre-tax ROAA adjusted to exclude the following significant non-recurring items in the following years: 2011: $25.4 million bargain purchase gains; 2012: $11.4 million bargain purchase gains, $9.7 million net realized gain on securities, and $6.7 million net positive adjustments on FDIC indemnification asset and true-up liability; 2013: $9.1 million net realized loss on securities and $6.9 million net loss related to the sale of branches; 2Represents 23 high performing major exchange-traded banks headquartered in the Midwest with $2-10bn in assets and a 2020 core return on average assets above 1.0% Strong, low-cost deposits supported by our leading market share in core mid-sized markets 1 Relationship-based business model that has allowed us to cultivate and underwrite attractively priced loans A robust credit risk management framework to prudently manage credit quality Diversified sources of fee income, including in wealth management 4 Company Adjusted1 Company High Performing Peer Median2 Consistent outperformance, even during periods of broad economic stress 1 2 3 20 |
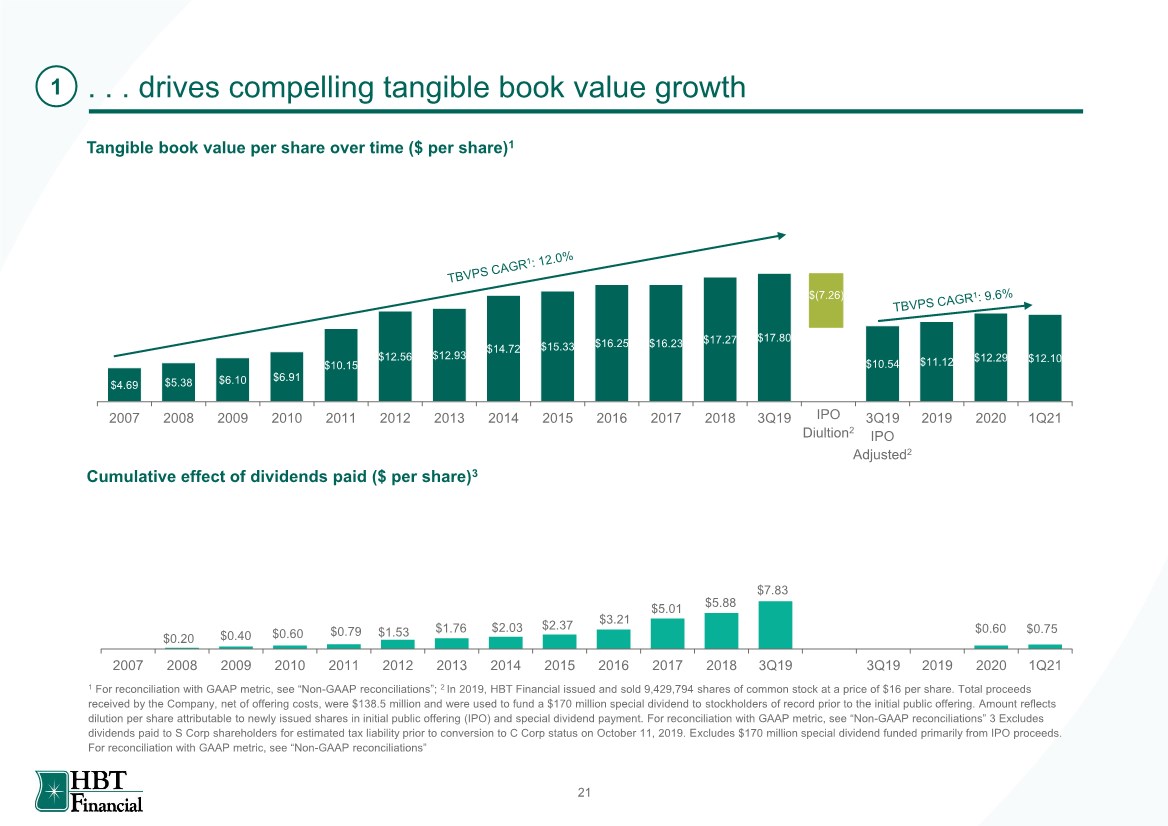
| . . . drives compelling tangible book value growth Tangible book value per share over time ($ per share)1 1 For reconciliation with GAAP metric, see “Non-GAAP reconciliations”; 2 In 2019, HBT Financial issued and sold 9,429,794 shares of common stock at a price of $16 per share. Total proceeds received by the Company, net of offering costs, were $138.5 million and were used to fund a $170 million special dividend to stockholders of record prior to the initial public offering. Amount reflects dilution per share attributable to newly issued shares in initial public offering (IPO) and special dividend payment. For reconciliation with GAAP metric, see “Non-GAAP reconciliations” 3 Excludes dividends paid to S Corp shareholders for estimated tax liability prior to conversion to C Corp status on October 11, 2019. Excludes $170 million special dividend funded primarily from IPO proceeds. For reconciliation with GAAP metric, see “Non-GAAP reconciliations” 1 $4.69 $5.38 $6.10 $6.91 $10.15 $12.56 $12.93 $14.72 $15.33 $16.25 $16.23 $17.27 $17.80 $10.54 $11.12 $12.29 $12.10 2007 2008 2009 2010 2011 2012 2013 2014 2015 2016 2017 2018 3Q19 3Q19 2019 2020 1Q21 IPO Diultion2 $(7.26) IPO Adjusted2 2007 2008 2009 2010 2011 2012 2013 2014 2015 2016 2017 2018 3Q19 3Q19 2019 2020 1Q21 $0.75 $0.60 $0.20 $0.40 $0.60 $0.79 $1.53 $1.76 $2.03 $2.37 $3.21 $5.01 $5.88 $7.83 Cumulative effect of dividends paid ($ per share)3 21 |
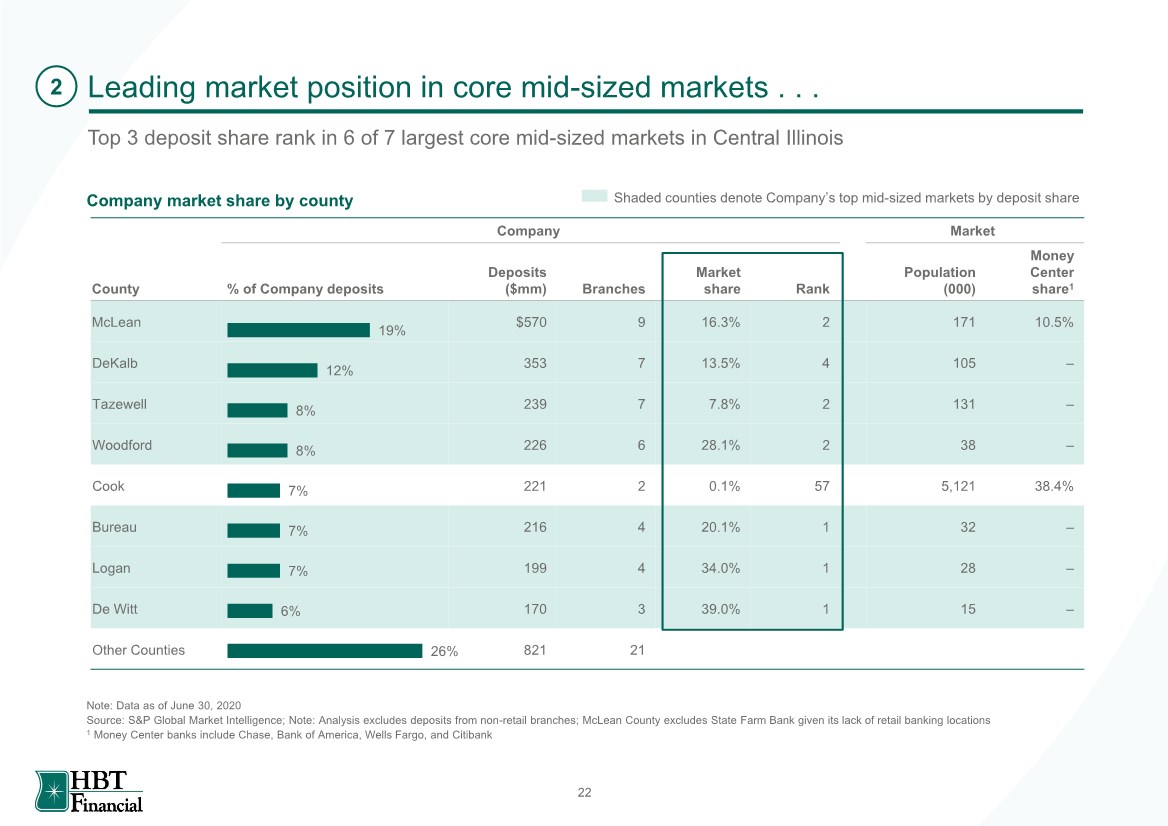
| Leading market position in core mid-sized markets . . . Top 3 deposit share rank in 6 of 7 largest core mid-sized markets in Central Illinois Company Market County % of Company deposits Deposits ($mm) Branches Market share Rank Population (000) Money Center share1 McLean $570 9 16.3% 2 171 10.5% DeKalb 353 7 13.5% 4 105 – Tazewell 239 7 7.8% 2 131 – Woodford 226 6 28.1% 2 38 – Cook 221 2 0.1% 57 5,121 38.4% Bureau 216 4 20.1% 1 32 – Logan 199 4 34.0% 1 28 – De Witt 170 3 39.0% 1 15 – Other Counties 821 21 Company market share by county 26% 6% 7% 7% 7% 8% 8% 12% 19% Note: Data as of June 30, 2020 Source: S&P Global Market Intelligence; Note: Analysis excludes deposits from non-retail branches; McLean County excludes State Farm Bank given its lack of retail banking locations 1 Money Center banks include Chase, Bank of America, Wells Fargo, and Citibank Shaded counties denote Company’s top mid-sized markets by deposit share 2 22 |
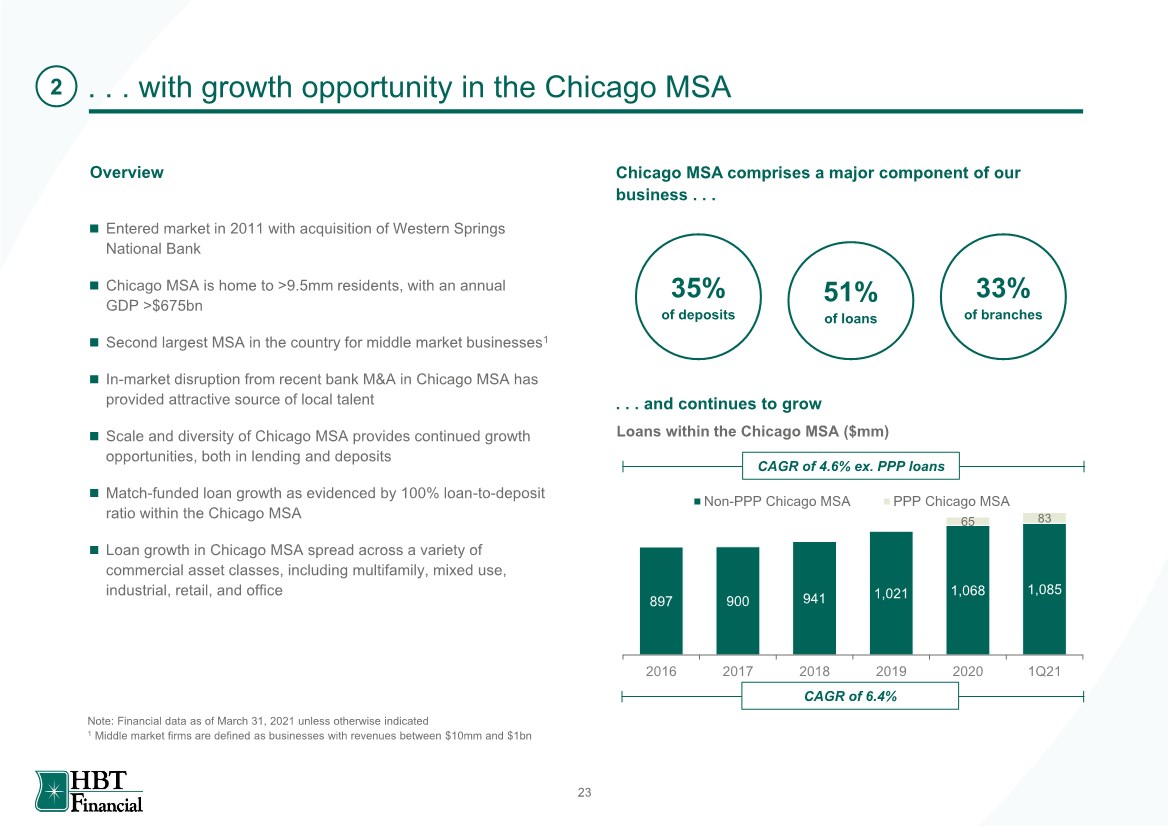
| Loans within the Chicago MSA ($mm) CAGR of 6.4% . . . with growth opportunity in the Chicago MSA ◼ Entered market in 2011 with acquisition of Western Springs National Bank ◼ Chicago MSA is home to >9.5mm residents, with an annual GDP >$675bn ◼ Second largest MSA in the country for middle market businesses1 ◼ In-market disruption from recent bank M&A in Chicago MSA has provided attractive source of local talent ◼ Scale and diversity of Chicago MSA provides continued growth opportunities, both in lending and deposits ◼ Match-funded loan growth as evidenced by 100% loan-to-deposit ratio within the Chicago MSA ◼ Loan growth in Chicago MSA spread across a variety of commercial asset classes, including multifamily, mixed use, industrial, retail, and office Overview Chicago MSA comprises a major component of our business . . . 35% of deposits 51% of loans 33% of branches . . . and continues to grow Note: Financial data as of March 31, 2021 unless otherwise indicated 1 Middle market firms are defined as businesses with revenues between $10mm and $1bn 2 897 900 941 1,021 1,068 1,085 65 83 2016 2017 2018 2019 2020 1Q21 Non-PPP Chicago MSA PPP Chicago MSA CAGR of 4.6% ex. PPP loans 23 |
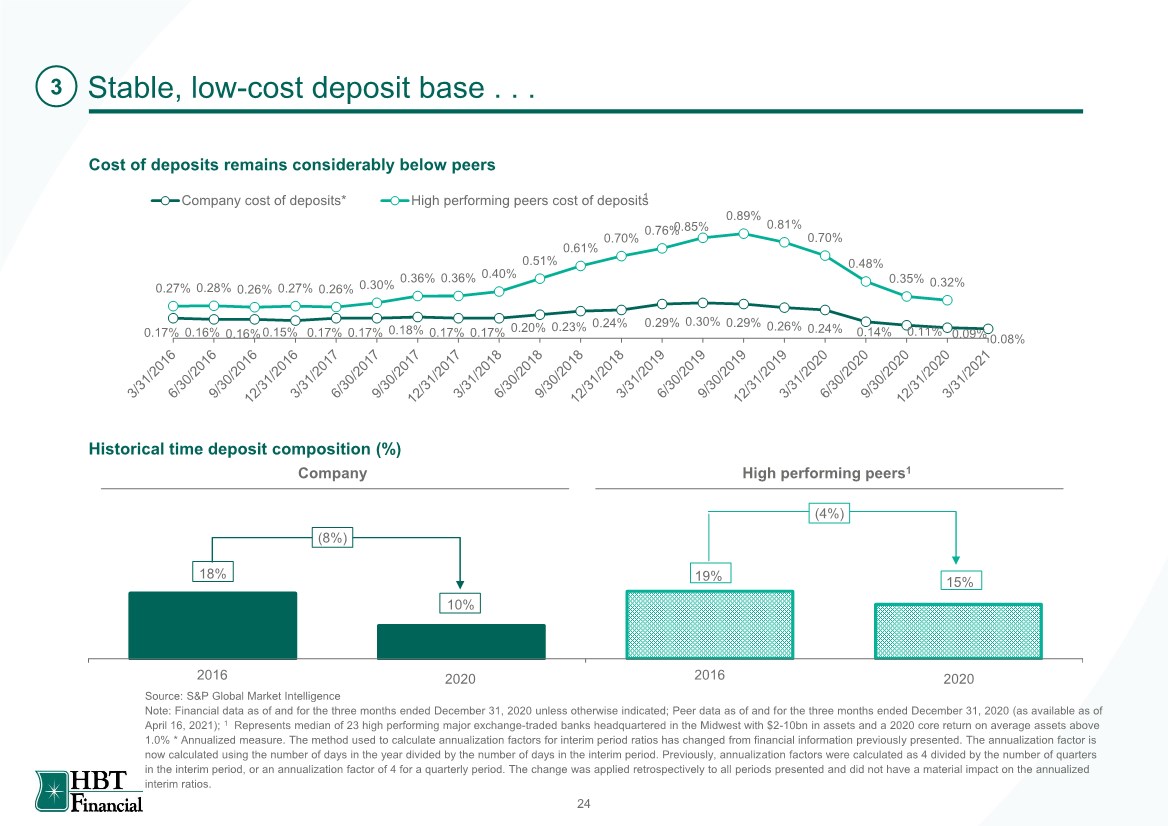
| 18% 19% 10% 15% 2016 2Q19 2016 1Q19 0.17% 0.16% 0.16%0.15% 0.17% 0.17% 0.18% 0.17% 0.17% 0.20% 0.23% 0.24% 0.29% 0.30% 0.29% 0.26% 0.24% 0.14% 0.11% 0.09% 0.08% 0.27% 0.28% 0.26% 0.27% 0.26% 0.30% 0.36% 0.36% 0.40% 0.51% 0.61% 0.70% 0.76% 0.85% 0.89% 0.81% 0.70% 0.48% 0.35% 0.32% Company cost of deposits* High performing peers cost of deposits Stable, low-cost deposit base . . . Cost of deposits remains considerably below peers Source: S&P Global Market Intelligence Note: Financial data as of and for the three months ended December 31, 2020 unless otherwise indicated; Peer data as of and for the three months ended December 31, 2020 (as available as of April 16, 2021); 1 Represents median of 23 high performing major exchange-traded banks headquartered in the Midwest with $2-10bn in assets and a 2020 core return on average assets above 1.0% * Annualized measure. The method used to calculate annualization factors for interim period ratios has changed from financial information previously presented. The annualization factor is now calculated using the number of days in the year divided by the number of days in the interim period. Previously, annualization factors were calculated as 4 divided by the number of quarters in the interim period, or an annualization factor of 4 for a quarterly period. The change was applied retrospectively to all periods presented and did not have a material impact on the annualized interim ratios. Historical time deposit composition (%) 1 Company High performing peers1 (8%) (4%) 2020 2020 3 24 |
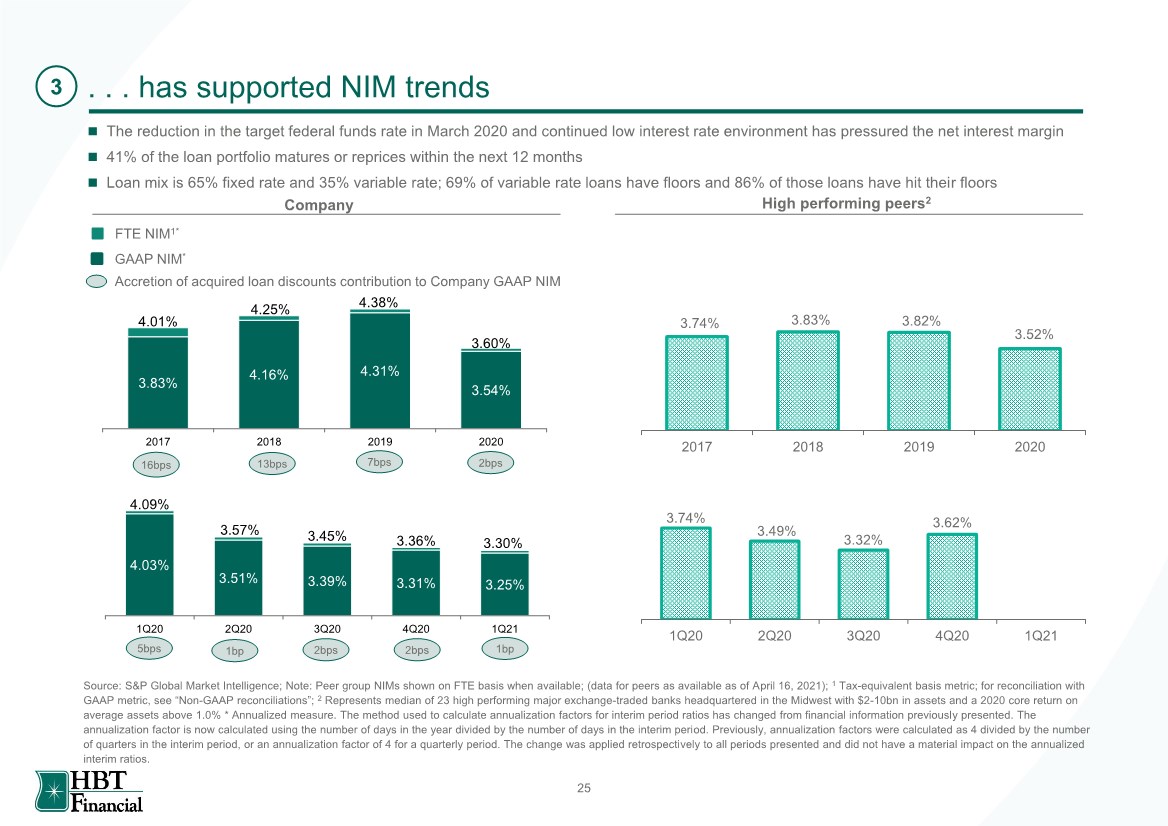
| 3.74% 3.83% 3.52% 2017 2018 2019 2020 3.82% . . . has supported NIM trends FTE NIM1* Source: S&P Global Market Intelligence; Note: Peer group NIMs shown on FTE basis when available; (data for peers as available as of April 16, 2021); 1 Tax-equivalent basis metric; for reconciliation with GAAP metric, see “Non-GAAP reconciliations”; 2 Represents median of 23 high performing major exchange-traded banks headquartered in the Midwest with $2-10bn in assets and a 2020 core return on average assets above 1.0% * Annualized measure. The method used to calculate annualization factors for interim period ratios has changed from financial information previously presented. The annualization factor is now calculated using the number of days in the year divided by the number of days in the interim period. Previously, annualization factors were calculated as 4 divided by the number of quarters in the interim period, or an annualization factor of 4 for a quarterly period. The change was applied retrospectively to all periods presented and did not have a material impact on the annualized interim ratios. GAAP NIM* Company High performing peers2 Accretion of acquired loan discounts contribution to Company GAAP NIM 3 16bps 3.83% 4.16% 4.31% 3.54% 4.01% 4.25% 4.38% 3.60% 2017 2018 2019 2020 ◼ The reduction in the target federal funds rate in March 2020 and continued low interest rate environment has pressured the net interest margin ◼ 41% of the loan portfolio matures or reprices within the next 12 months ◼ Loan mix is 65% fixed rate and 35% variable rate; 69% of variable rate loans have floors and 86% of those loans have hit their floors 25 13bps 7bps 5bps 1bp 2bps 2bps 2bps 4.03% 3.51% 3.39% 3.31% 3.25% 4.09% 3.57% 3.45% 3.36% 3.30% 1Q20 2Q20 3Q20 4Q20 1Q21 3.74% 3.49% 3.62% 1Q20 2Q20 3Q20 4Q20 1Q21 3.32% 1bp |
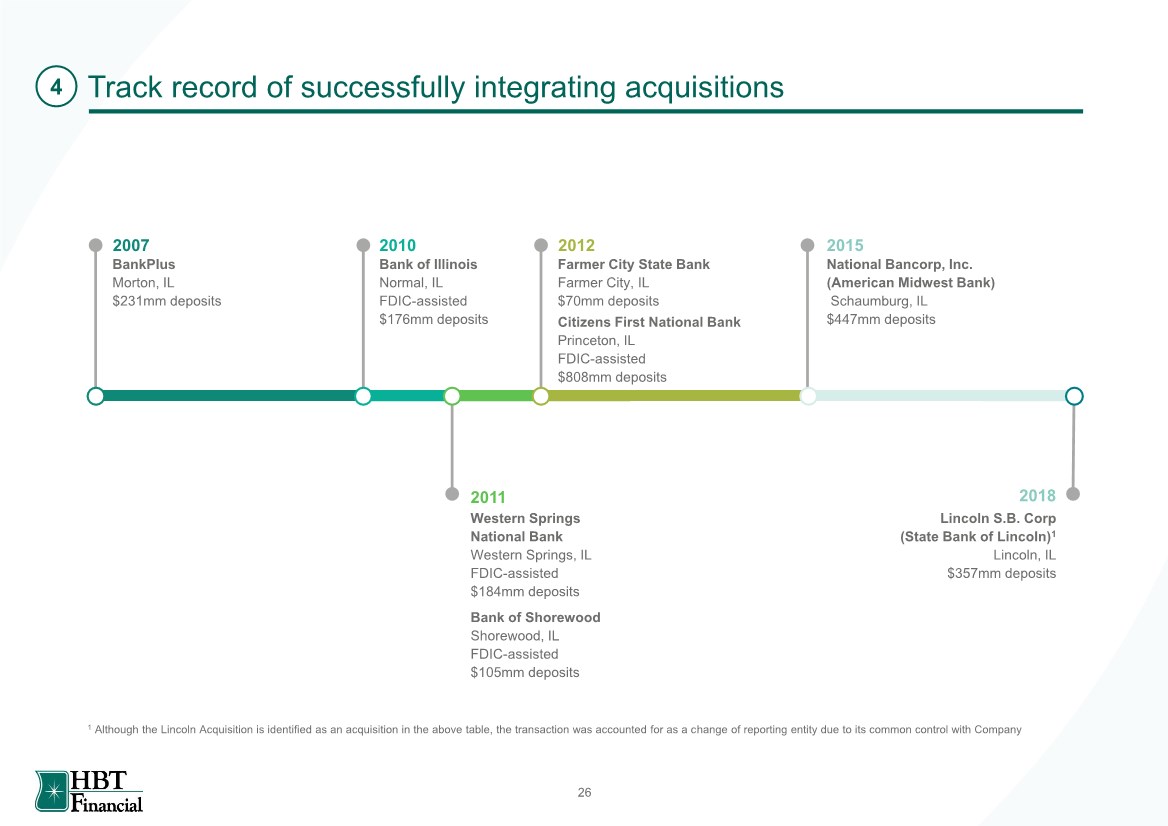
| Track record of successfully integrating acquisitions BankPlus Morton, IL $231mm deposits 2007 2012 Bank of Illinois Normal, IL FDIC-assisted $176mm deposits Western Springs National Bank Western Springs, IL FDIC-assisted $184mm deposits 2011 Citizens First National Bank Princeton, IL FDIC-assisted $808mm deposits 2018 Farmer City State Bank Farmer City, IL $70mm deposits 2015 2010 Bank of Shorewood Shorewood, IL FDIC-assisted $105mm deposits National Bancorp, Inc. (American Midwest Bank) Schaumburg, IL $447mm deposits Lincoln S.B. Corp (State Bank of Lincoln)1 Lincoln, IL $357mm deposits 1 Although the Lincoln Acquisition is identified as an acquisition in the above table, the transaction was accounted for as a change of reporting entity due to its common control with Company 4 26 |
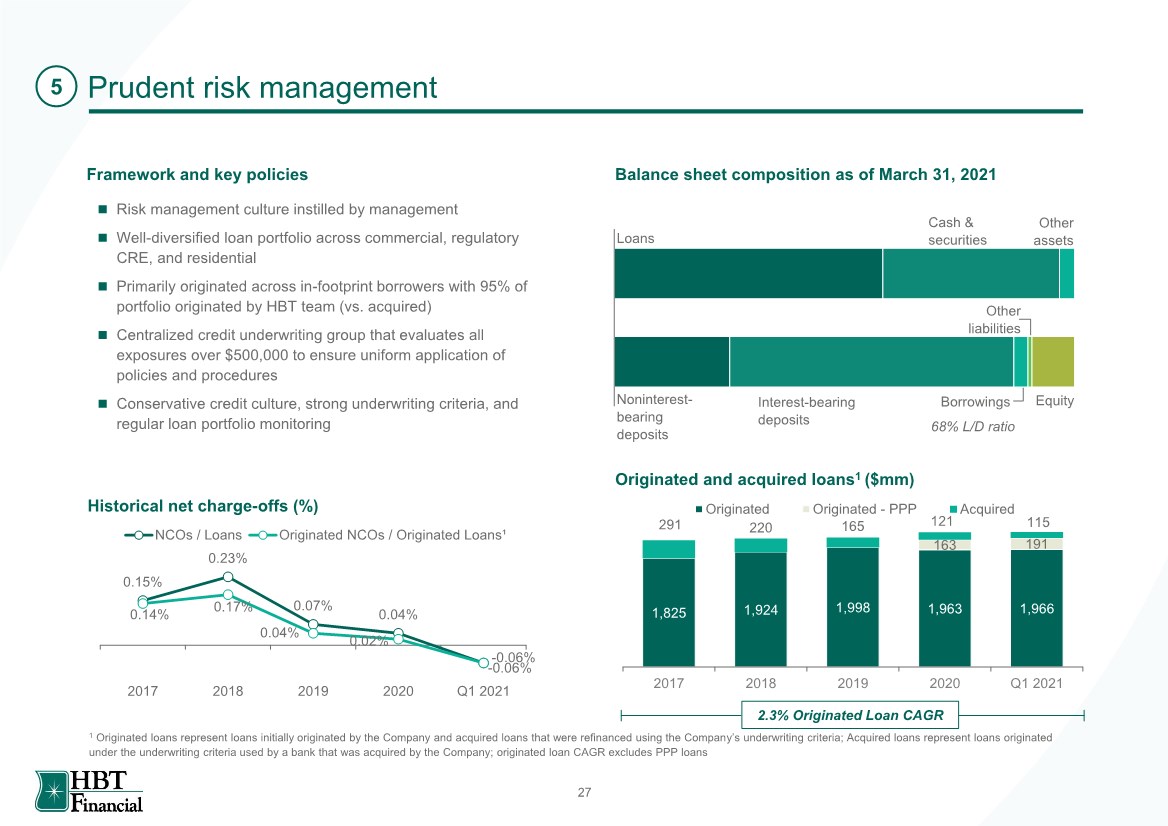
| Prudent risk management Framework and key policies Balance sheet composition as of March 31, 2021 Originated and acquired loans1 ($mm) ◼ Risk management culture instilled by management ◼ Well-diversified loan portfolio across commercial, regulatory CRE, and residential ◼ Primarily originated across in-footprint borrowers with 95% of portfolio originated by HBT team (vs. acquired) ◼ Centralized credit underwriting group that evaluates all exposures over $500,000 to ensure uniform application of policies and procedures ◼ Conservative credit culture, strong underwriting criteria, and regular loan portfolio monitoring Loans Cash & securities Other assets Noninterest- bearing deposits Interest-bearing deposits Borrowings Other liabilities Equity 68% L/D ratio Historical net charge-offs (%) 1 Originated loans represent loans initially originated by the Company and acquired loans that were refinanced using the Company’s underwriting criteria; Acquired loans represent loans originated under the underwriting criteria used by a bank that was acquired by the Company; originated loan CAGR excludes PPP loans 5 1,825 1,924 1,998 1,963 1,966 163 191 291 220 165 121 115 2017 2018 2019 2020 Q1 2021 Originated Originated - PPP Acquired 2.3% Originated Loan CAGR 0.15% 0.23% 0.07% 0.04% -0.06% 0.14% 0.17% 0.04% 0.02% -0.06% 2017 2018 2019 2020 Q1 2021 NCOs / Loans Originated NCOs / Originated Loans¹ 27 |
| Appendix 28 |
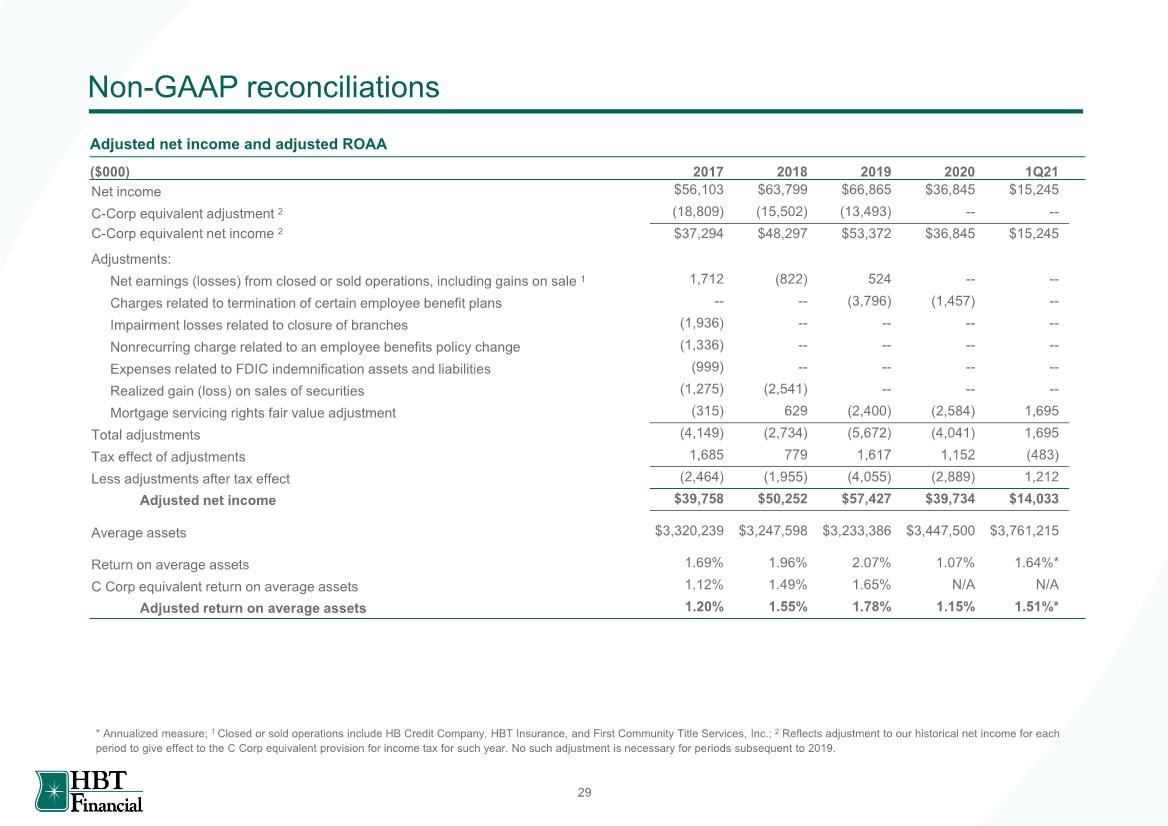
| Non-GAAP reconciliations Adjusted net income and adjusted ROAA ($000) 2017 2018 2019 2020 1Q21 Net income $56,103 $63,799 $66,865 $36,845 $15,245 C-Corp equivalent adjustment 2 (18,809) (15,502) (13,493) -- -- C-Corp equivalent net income 2 $37,294 $48,297 $53,372 $36,845 $15,245 Adjustments: Net earnings (losses) from closed or sold operations, including gains on sale 1 1,712 (822) 524 -- -- Charges related to termination of certain employee benefit plans -- -- (3,796) (1,457) -- Impairment losses related to closure of branches (1,936) -- -- -- -- Nonrecurring charge related to an employee benefits policy change (1,336) -- -- -- -- Expenses related to FDIC indemnification assets and liabilities (999) -- -- -- -- Realized gain (loss) on sales of securities (1,275) (2,541) -- -- -- Mortgage servicing rights fair value adjustment (315) 629 (2,400) (2,584) 1,695 Total adjustments (4,149) (2,734) (5,672) (4,041) 1,695 Tax effect of adjustments 1,685 779 1,617 1,152 (483) Less adjustments after tax effect (2,464) (1,955) (4,055) (2,889) 1,212 Adjusted net income $39,758 $50,252 $57,427 $39,734 $14,033 Average assets $3,320,239 $3,247,598 $3,233,386 $3,447,500 $3,761,215 Return on average assets 1.69% 1.96% 2.07% 1.07% 1.64%* C Corp equivalent return on average assets 1.12% 1.49% 1.65% N/A N/A Adjusted return on average assets 1.20% 1.55% 1.78% 1.15% 1.51%* * Annualized measure; 1 Closed or sold operations include HB Credit Company, HBT Insurance, and First Community Title Services, Inc.; 2 Reflects adjustment to our historical net income for each period to give effect to the C Corp equivalent provision for income tax for such year. No such adjustment is necessary for periods subsequent to 2019. 29 |
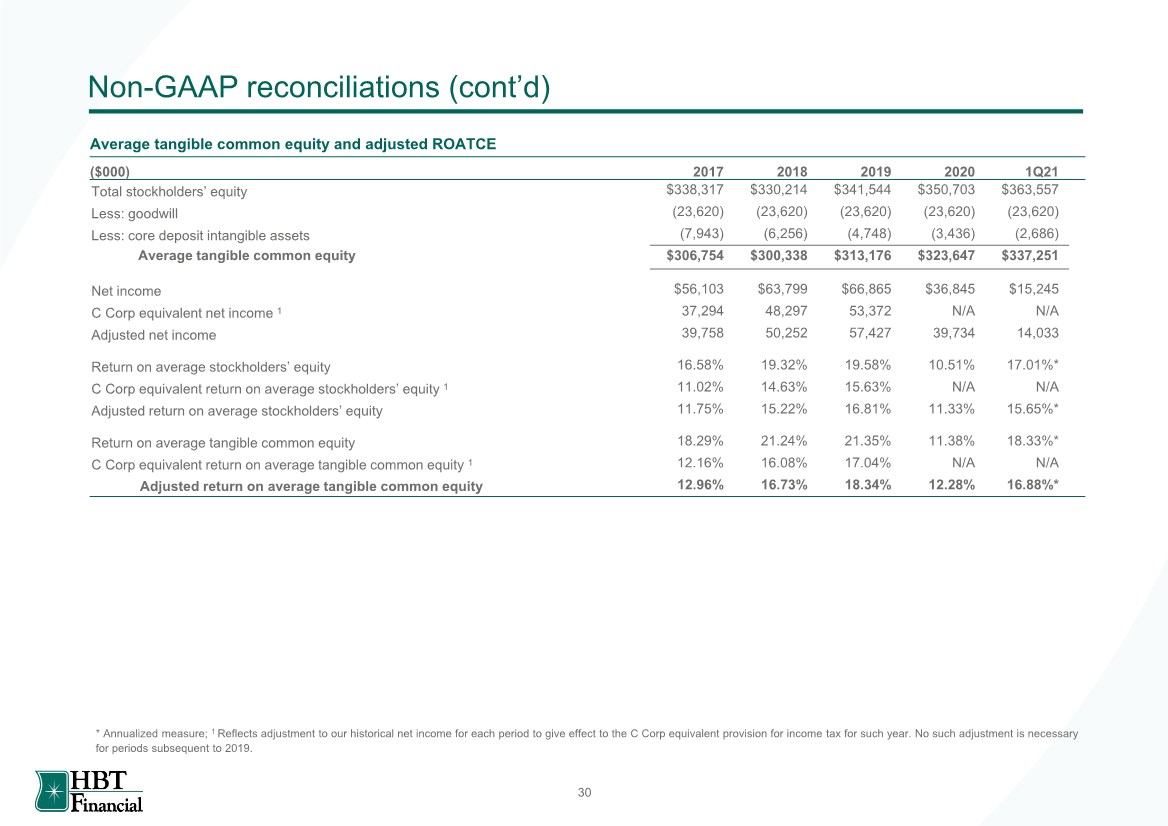
| Non-GAAP reconciliations (cont’d) Average tangible common equity and adjusted ROATCE ($000) 2017 2018 2019 2020 1Q21 Total stockholders’ equity $338,317 $330,214 $341,544 $350,703 $363,557 Less: goodwill (23,620) (23,620) (23,620) (23,620) (23,620) Less: core deposit intangible assets (7,943) (6,256) (4,748) (3,436) (2,686) Average tangible common equity $306,754 $300,338 $313,176 $323,647 $337,251 Net income $56,103 $63,799 $66,865 $36,845 $15,245 C Corp equivalent net income 1 37,294 48,297 53,372 N/A N/A Adjusted net income 39,758 50,252 57,427 39,734 14,033 Return on average stockholders’ equity 16.58% 19.32% 19.58% 10.51% 17.01%* C Corp equivalent return on average stockholders’ equity 1 11.02% 14.63% 15.63% N/A N/A Adjusted return on average stockholders’ equity 11.75% 15.22% 16.81% 11.33% 15.65%* Return on average tangible common equity 18.29% 21.24% 21.35% 11.38% 18.33%* C Corp equivalent return on average tangible common equity 1 12.16% 16.08% 17.04% N/A N/A Adjusted return on average tangible common equity 12.96% 16.73% 18.34% 12.28% 16.88%* * Annualized measure; 1 Reflects adjustment to our historical net income for each period to give effect to the C Corp equivalent provision for income tax for such year. No such adjustment is necessary for periods subsequent to 2019. 30 |
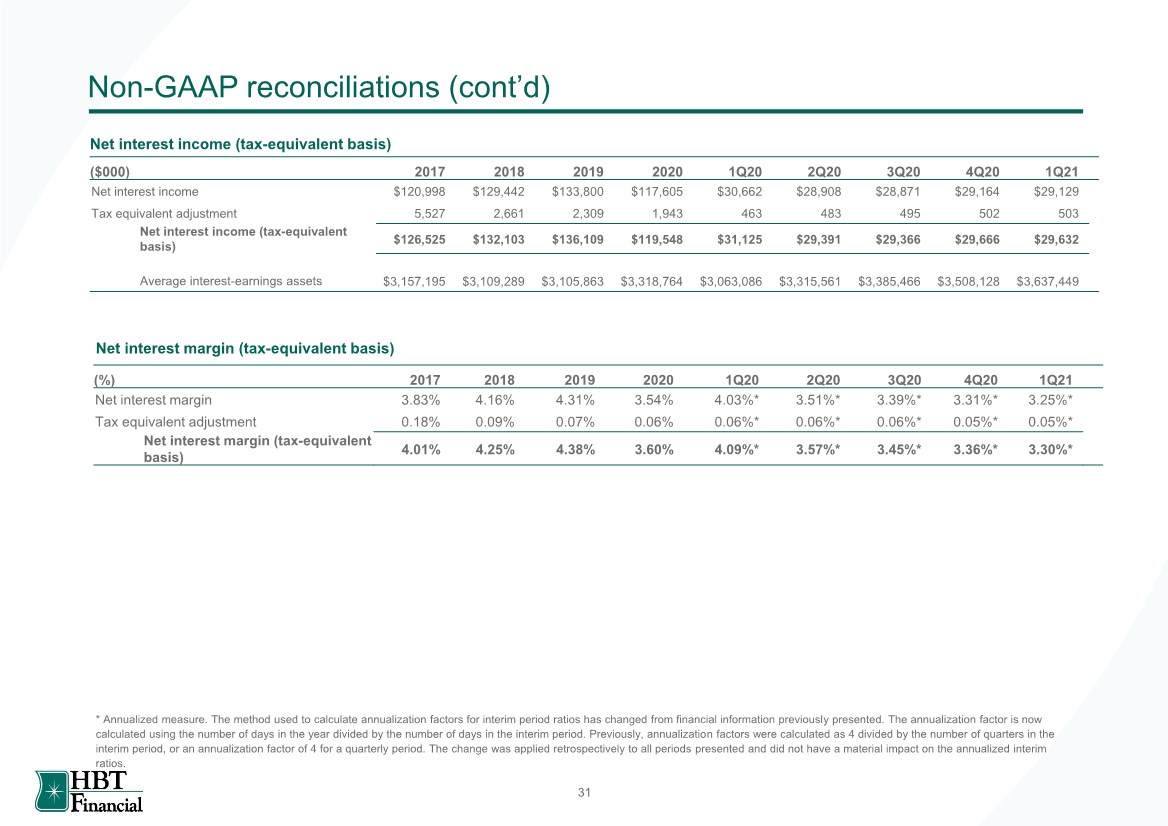
| Non-GAAP reconciliations (cont’d) ($000) 2017 2018 2019 2020 1Q20 2Q20 3Q20 4Q20 1Q21 Net interest income $120,998 $129,442 $133,800 $117,605 $30,662 $28,908 $28,871 $29,164 $29,129 Tax equivalent adjustment 5,527 2,661 2,309 1,943 463 483 495 502 503 Net interest income (tax-equivalent basis) $126,525 $132,103 $136,109 $119,548 $31,125 $29,391 $29,366 $29,666 $29,632 Average interest-earnings assets $3,157,195 $3,109,289 $3,105,863 $3,318,764 $3,063,086 $3,315,561 $3,385,466 $3,508,128 $3,637,449 Net interest income (tax-equivalent basis) Net interest margin (tax-equivalent basis) * Annualized measure. The method used to calculate annualization factors for interim period ratios has changed from financial information previously presented. The annualization factor is now calculated using the number of days in the year divided by the number of days in the interim period. Previously, annualization factors were calculated as 4 divided by the number of quarters in the interim period, or an annualization factor of 4 for a quarterly period. The change was applied retrospectively to all periods presented and did not have a material impact on the annualized interim ratios. (%) 2017 2018 2019 2020 1Q20 2Q20 3Q20 4Q20 1Q21 Net interest margin 3.83% 4.16% 4.31% 3.54% 4.03%* 3.51%* 3.39%* 3.31%* 3.25%* Tax equivalent adjustment 0.18% 0.09% 0.07% 0.06% 0.06%* 0.06%* 0.06%* 0.05%* 0.05%* Net interest margin (tax-equivalent basis) 4.01% 4.25% 4.38% 3.60% 4.09%* 3.57%* 3.45%* 3.36%* 3.30%* 31 |
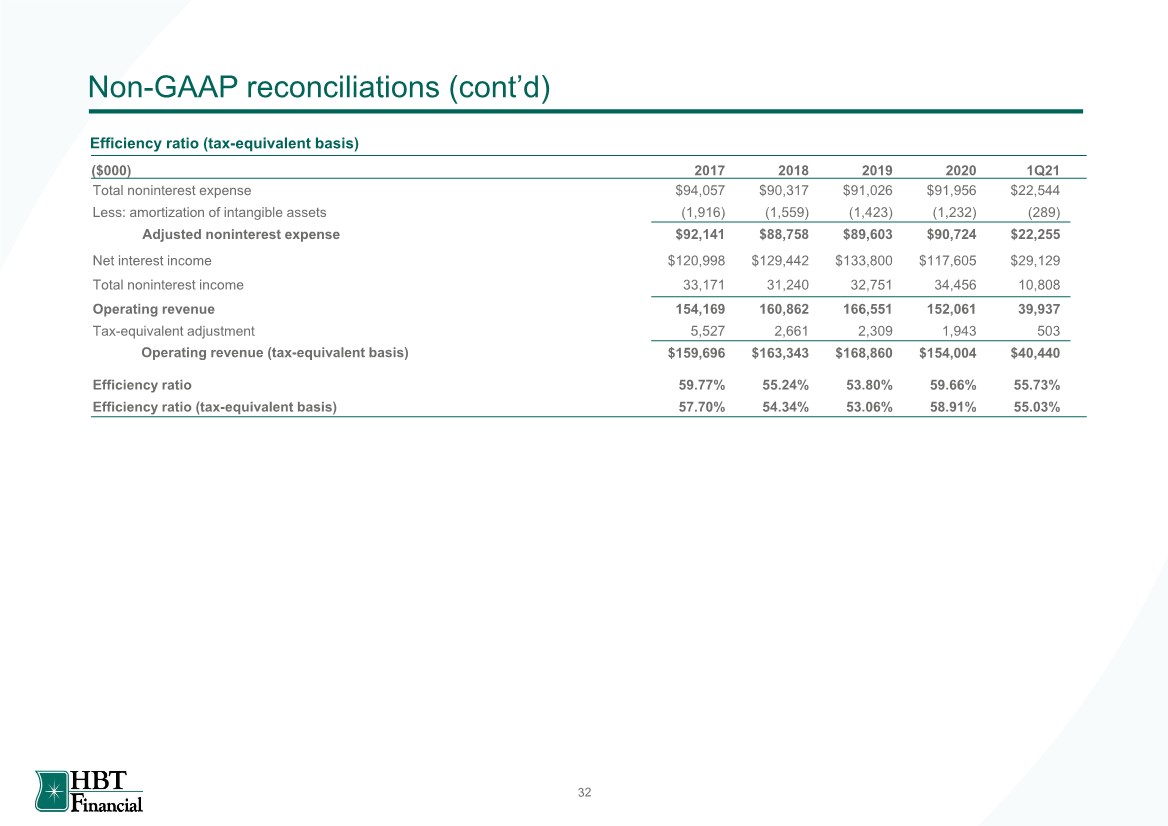
| Non-GAAP reconciliations (cont’d) Efficiency ratio (tax-equivalent basis) ($000) 2017 2018 2019 2020 1Q21 Total noninterest expense $94,057 $90,317 $91,026 $91,956 $22,544 Less: amortization of intangible assets (1,916) (1,559) (1,423) (1,232) (289) Adjusted noninterest expense $92,141 $88,758 $89,603 $90,724 $22,255 Net interest income $120,998 $129,442 $133,800 $117,605 $29,129 Total noninterest income 33,171 31,240 32,751 34,456 10,808 Operating revenue 154,169 160,862 166,551 152,061 39,937 Tax-equivalent adjustment 5,527 2,661 2,309 1,943 503 Operating revenue (tax-equivalent basis) $159,696 $163,343 $168,860 $154,004 $40,440 Efficiency ratio 59.77% 55.24% 53.80% 59.66% 55.73% Efficiency ratio (tax-equivalent basis) 57.70% 54.34% 53.06% 58.91% 55.03% |
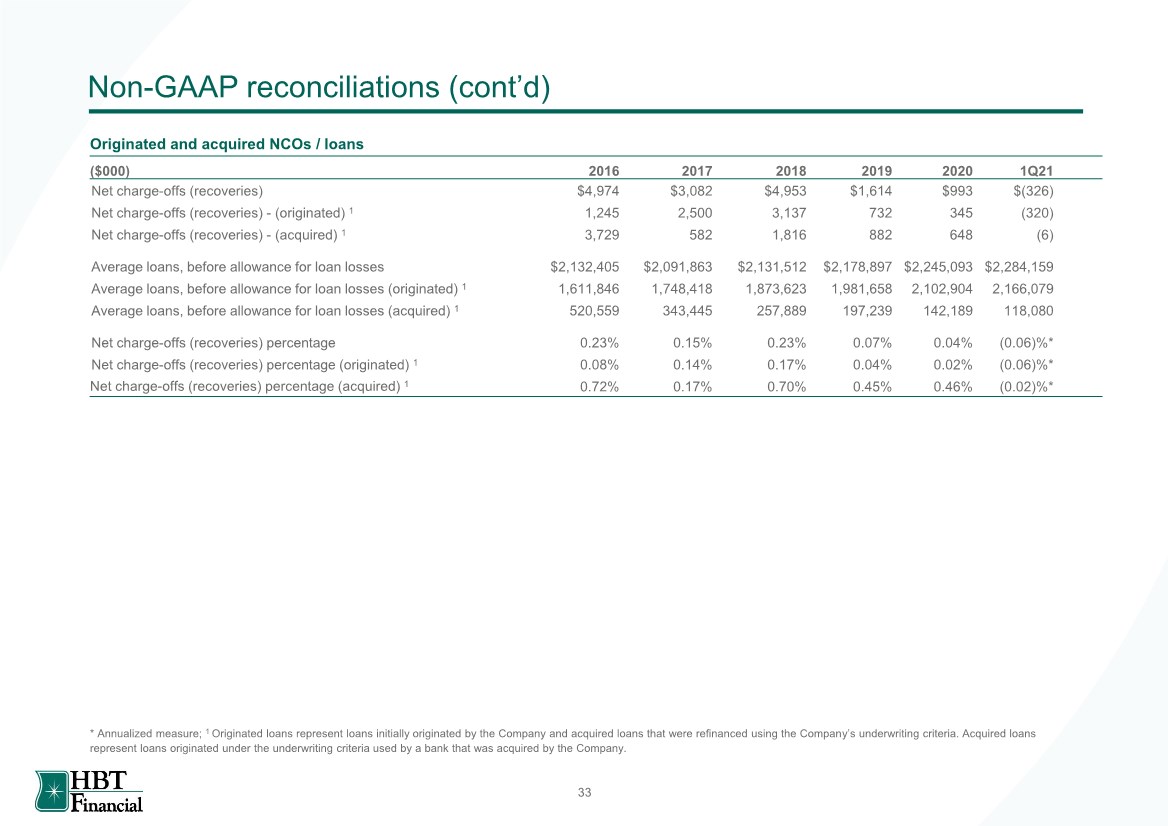
| Non-GAAP reconciliations (cont’d) ($000) 2016 2017 2018 2019 2020 1Q21 Net charge-offs (recoveries) $4,974 $3,082 $4,953 $1,614 $993 $(326) Net charge-offs (recoveries) -(originated) 1 1,245 2,500 3,137 732 345 (320) Net charge-offs (recoveries) -(acquired) 1 3,729 582 1,816 882 648 (6) Average loans, before allowance for loan losses $2,132,405 $2,091,863 $2,131,512 $2,178,897 $2,245,093 $2,284,159 Average loans, before allowance for loan losses (originated) 1 1,611,846 1,748,418 1,873,623 1,981,658 2,102,904 2,166,079 Average loans, before allowance for loan losses (acquired) 1 520,559 343,445 257,889 197,239 142,189 118,080 Net charge-offs (recoveries) percentage 0.23% 0.15% 0.23% 0.07% 0.04% (0.06)%* Net charge-offs (recoveries) percentage (originated) 1 0.08% 0.14% 0.17% 0.04% 0.02% (0.06)%* Net charge-offs (recoveries) percentage (acquired) 1 0.72% 0.17% 0.70% 0.45% 0.46% (0.02)%* Originated and acquired NCOs / loans * Annualized measure; 1 Originated loans represent loans initially originated by the Company and acquired loans that were refinanced using the Company’s underwriting criteria. Acquired loans represent loans originated under the underwriting criteria used by a bank that was acquired by the Company. 33 |
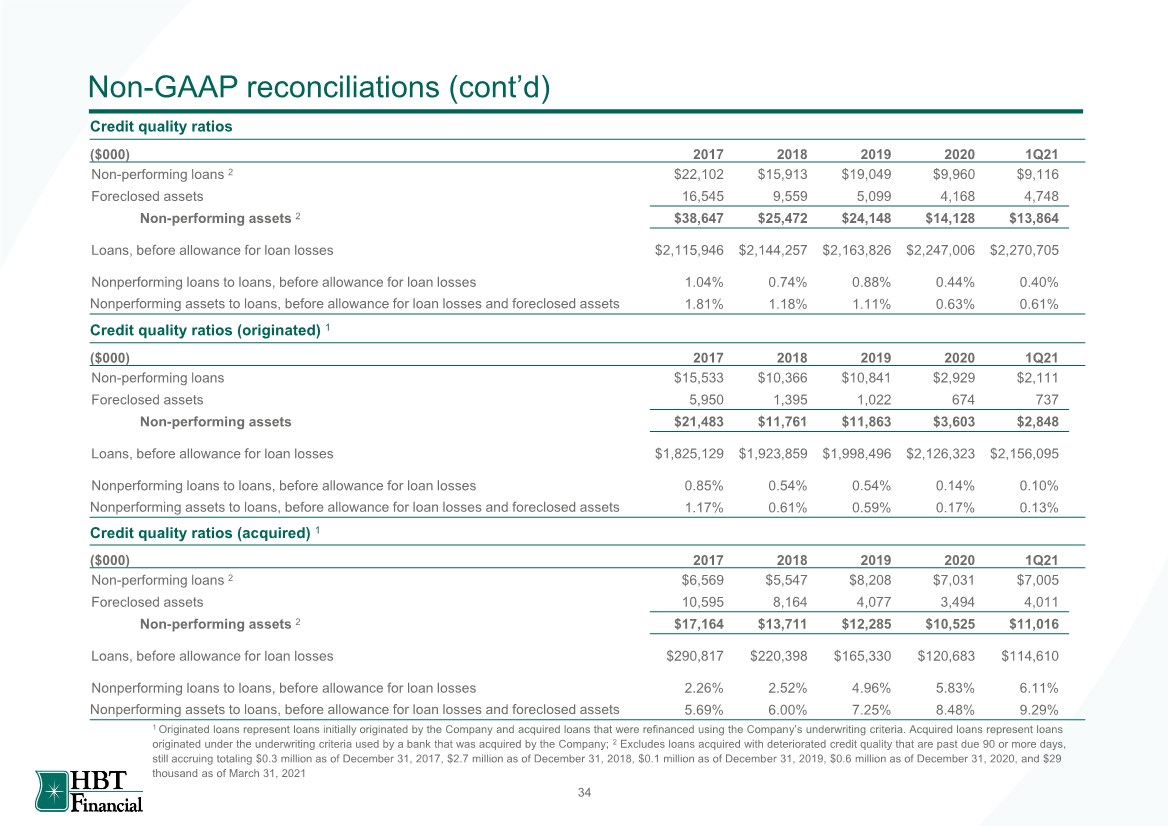
| Non-GAAP reconciliations (cont’d) ($000) 2017 2018 2019 2020 1Q21 Non-performing loans 2 $22,102 $15,913 $19,049 $9,960 $9,116 Foreclosed assets 16,545 9,559 5,099 4,168 4,748 Non-performing assets 2 $38,647 $25,472 $24,148 $14,128 $13,864 Loans, before allowance for loan losses $2,115,946 $2,144,257 $2,163,826 $2,247,006 $2,270,705 Nonperforming loans to loans, before allowance for loan losses 1.04% 0.74% 0.88% 0.44% 0.40% Nonperforming assets to loans, before allowance for loan losses and foreclosed assets 1.81% 1.18% 1.11% 0.63% 0.61% Credit quality ratios ($000) 2017 2018 2019 2020 1Q21 Non-performing loans $15,533 $10,366 $10,841 $2,929 $2,111 Foreclosed assets 5,950 1,395 1,022 674 737 Non-performing assets $21,483 $11,761 $11,863 $3,603 $2,848 Loans, before allowance for loan losses $1,825,129 $1,923,859 $1,998,496 $2,126,323 $2,156,095 Nonperforming loans to loans, before allowance for loan losses 0.85% 0.54% 0.54% 0.14% 0.10% Nonperforming assets to loans, before allowance for loan losses and foreclosed assets 1.17% 0.61% 0.59% 0.17% 0.13% Credit quality ratios (originated) 1 Credit quality ratios (acquired) 1 ($000) 2017 2018 2019 2020 1Q21 Non-performing loans 2 $6,569 $5,547 $8,208 $7,031 $7,005 Foreclosed assets 10,595 8,164 4,077 3,494 4,011 Non-performing assets 2 $17,164 $13,711 $12,285 $10,525 $11,016 Loans, before allowance for loan losses $290,817 $220,398 $165,330 $120,683 $114,610 Nonperforming loans to loans, before allowance for loan losses 2.26% 2.52% 4.96% 5.83% 6.11% Nonperforming assets to loans, before allowance for loan losses and foreclosed assets 5.69% 6.00% 7.25% 8.48% 9.29% 1 Originated loans represent loans initially originated by the Company and acquired loans that were refinanced using the Company’s underwriting criteria. Acquired loans represent loans originated under the underwriting criteria used by a bank that was acquired by the Company; 2 Excludes loans acquired with deteriorated credit quality that are past due 90 or more days, still accruing totaling $0.3 million as of December 31, 2017, $2.7 million as of December 31, 2018, $0.1 million as of December 31, 2019, $0.6 million as of December 31, 2020, and $29 thousand as of March 31, 2021 34 |
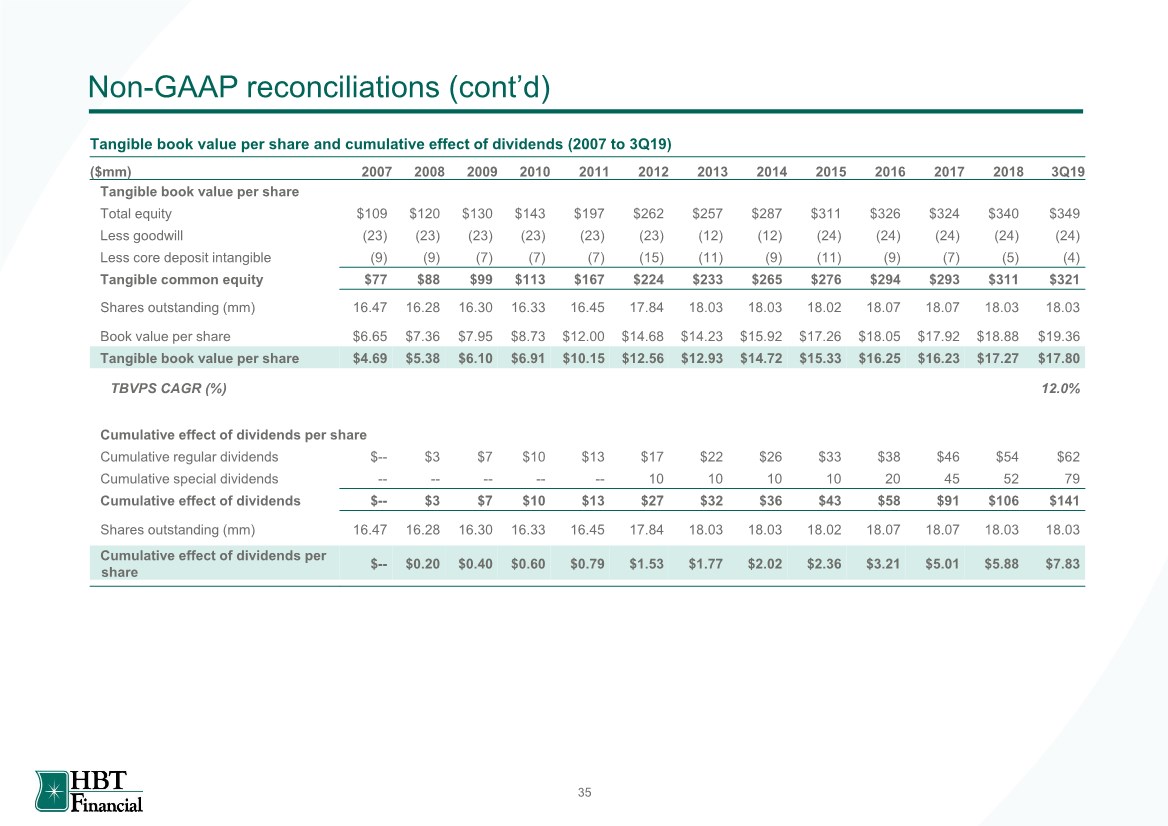
| Non-GAAP reconciliations (cont’d) Tangible book value per share and cumulative effect of dividends (2007 to 3Q19) ($mm) 2007 2008 2009 2010 2011 2012 2013 2014 2015 2016 2017 2018 3Q19 Tangible book value per share Total equity $109 $120 $130 $143 $197 $262 $257 $287 $311 $326 $324 $340 $349 Less goodwill (23) (23) (23) (23) (23) (23) (12) (12) (24) (24) (24) (24) (24) Less core deposit intangible (9) (9) (7) (7) (7) (15) (11) (9) (11) (9) (7) (5) (4) Tangible common equity $77 $88 $99 $113 $167 $224 $233 $265 $276 $294 $293 $311 $321 Shares outstanding (mm) 16.47 16.28 16.30 16.33 16.45 17.84 18.03 18.03 18.02 18.07 18.07 18.03 18.03 Book value per share $6.65 $7.36 $7.95 $8.73 $12.00 $14.68 $14.23 $15.92 $17.26 $18.05 $17.92 $18.88 $19.36 Tangible book value per share $4.69 $5.38 $6.10 $6.91 $10.15 $12.56 $12.93 $14.72 $15.33 $16.25 $16.23 $17.27 $17.80 TBVPS CAGR (%) 12.0% Cumulative effect of dividends per share Cumulative regular dividends $-- $3 $7 $10 $13 $17 $22 $26 $33 $38 $46 $54 $62 Cumulative special dividends -- -- -- -- -- 10 10 10 10 20 45 52 79 Cumulative effect of dividends $-- $3 $7 $10 $13 $27 $32 $36 $43 $58 $91 $106 $141 Shares outstanding (mm) 16.47 16.28 16.30 16.33 16.45 17.84 18.03 18.03 18.02 18.07 18.07 18.03 18.03 Cumulative effect of dividends per share $-- $0.20 $0.40 $0.60 $0.79 $1.53 $1.77 $2.02 $2.36 $3.21 $5.01 $5.88 $7.83 35 |
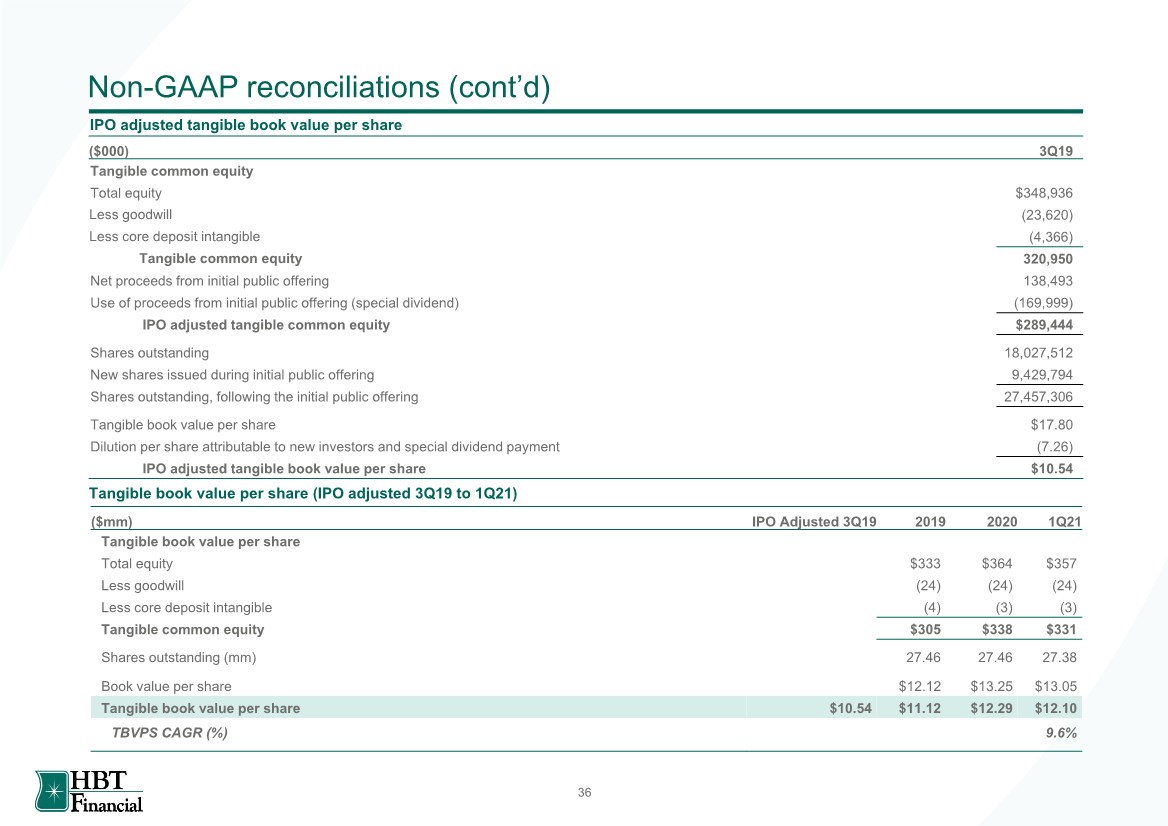
| Non-GAAP reconciliations (cont’d) IPO adjusted tangible book value per share ($mm) IPO Adjusted 3Q19 2019 2020 1Q21 Tangible book value per share Total equity $333 $364 $357 Less goodwill (24) (24) (24) Less core deposit intangible (4) (3) (3) Tangible common equity $305 $338 $331 Shares outstanding (mm) 27.46 27.46 27.38 Book value per share $12.12 $13.25 $13.05 Tangible book value per share $10.54 $11.12 $12.29 $12.10 TBVPS CAGR (%) 9.6% Tangible book value per share (IPO adjusted 3Q19 to 1Q21) ($000) 3Q19 Tangible common equity Total equity $348,936 Less goodwill (23,620) Less core deposit intangible (4,366) Tangible common equity 320,950 Net proceeds from initial public offering 138,493 Use of proceeds from initial public offering (special dividend) (169,999) IPO adjusted tangible common equity $289,444 Shares outstanding 18,027,512 New shares issued during initial public offering 9,429,794 Shares outstanding, following the initial public offering 27,457,306 Tangible book value per share $17.80 Dilution per share attributable to new investors and special dividend payment (7.26) IPO adjusted tangible book value per share $10.54 36 |
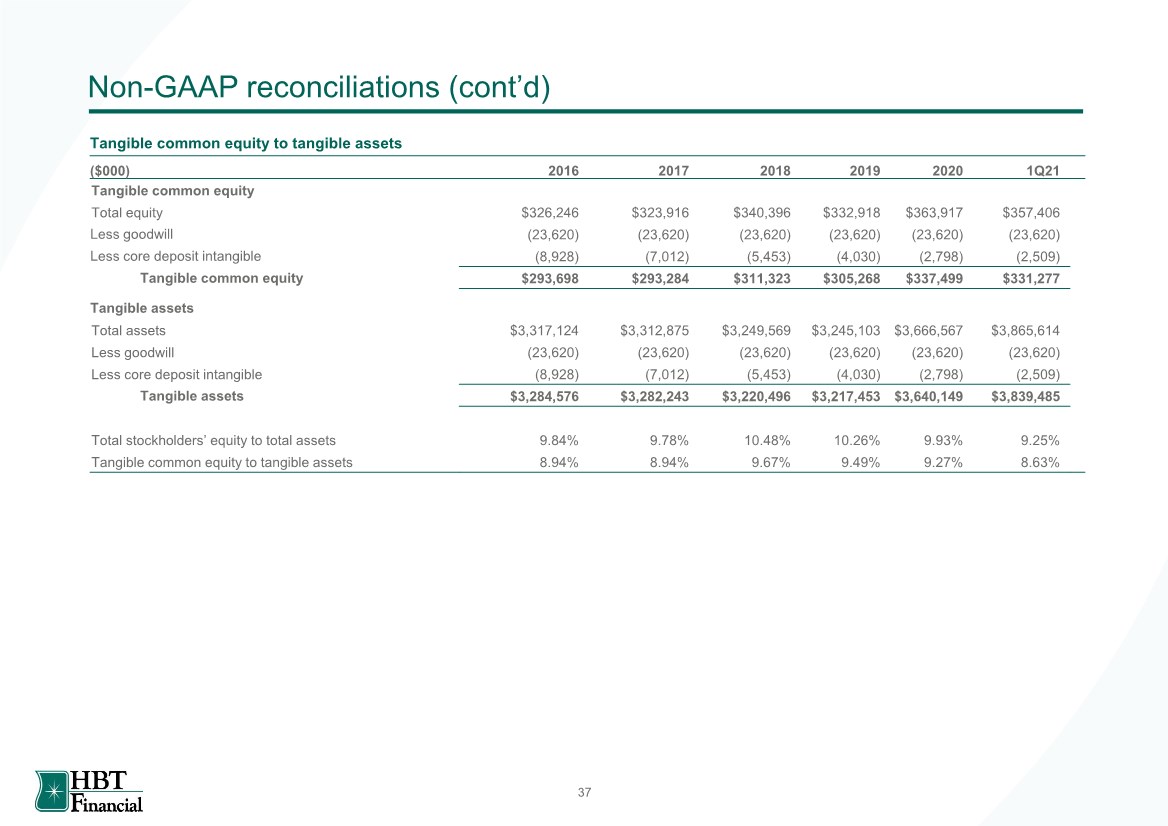
| Non-GAAP reconciliations (cont’d) ($000) 2016 2017 2018 2019 2020 1Q21 Tangible common equity Total equity $326,246 $323,916 $340,396 $332,918 $363,917 $357,406 Less goodwill (23,620) (23,620) (23,620) (23,620) (23,620) (23,620) Less core deposit intangible (8,928) (7,012) (5,453) (4,030) (2,798) (2,509) Tangible common equity $293,698 $293,284 $311,323 $305,268 $337,499 $331,277 Tangible assets Total assets $3,317,124 $3,312,875 $3,249,569 $3,245,103 $3,666,567 $3,865,614 Less goodwill (23,620) (23,620) (23,620) (23,620) (23,620) (23,620) Less core deposit intangible (8,928) (7,012) (5,453) (4,030) (2,798) (2,509) Tangible assets $3,284,576 $3,282,243 $3,220,496 $3,217,453 $3,640,149 $3,839,485 Total stockholders’ equity to total assets 9.84% 9.78% 10.48% 10.26% 9.93% 9.25% Tangible common equity to tangible assets 8.94% 8.94% 9.67% 9.49% 9.27% 8.63% Tangible common equity to tangible assets 37 |
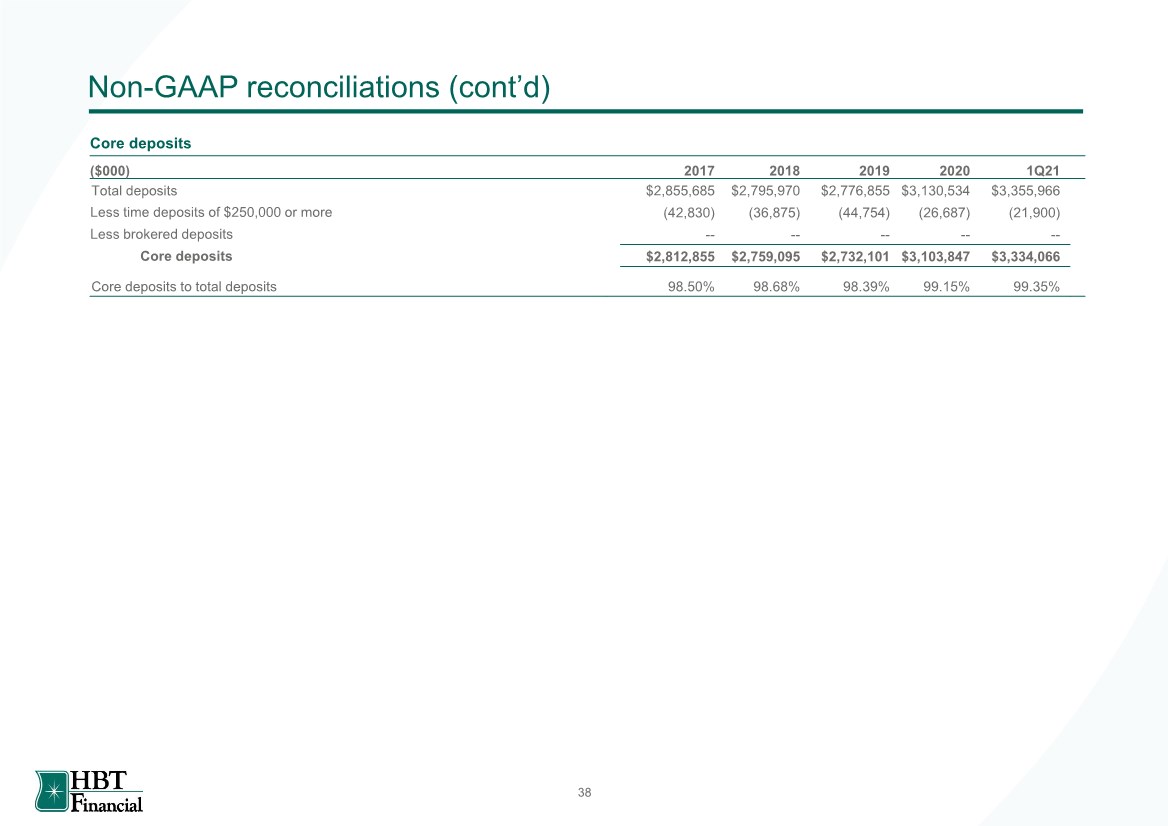
| Non-GAAP reconciliations (cont’d) ($000) 2017 2018 2019 2020 1Q21 Total deposits $2,855,685 $2,795,970 $2,776,855 $3,130,534 $3,355,966 Less time deposits of $250,000 or more (42,830) (36,875) (44,754) (26,687) (21,900) Less brokered deposits -- -- -- -- -- Core deposits $2,812,855 $2,759,095 $2,732,101 $3,103,847 $3,334,066 Core deposits to total deposits 98.50% 98.68% 98.39% 99.15% 99.35% Core deposits 38 |
| HBT Financial, Inc. |