Attached files
| file | filename |
|---|---|
| EX-99.2 - EX-99.2 - FLAGSTAR BANCORP INC | d170934dex992.htm |
| 8-K - 8-K - FLAGSTAR BANCORP INC | d170934d8k.htm |

Exhibit 99.1 NYCB and Flagstar: Accelerating Our Transformation Strategy April 26, 2021Exhibit 99.1 NYCB and Flagstar: Accelerating Our Transformation Strategy April 26, 2021

Disclaimer Cautionary Statements Regarding Forward-Looking Information Certain statements in this presentation may constitute “forward‐looking statements” within the meaning of the Private Securities Litigation Reform Act of 1995, Section 27A of the Securities Act of 1933, as amended, and Section 21E of the Securities Exchange Act of 1934, as amended, with respect to New York Community Bancorp, Inc.’s (“NYCB”) and Flagstar Bancorp Inc.’s (“Flagstar”) beliefs, goals, intentions, and expectations regarding revenues, earnings, loan production, asset quality, capital levels, and acquisitions, among other matters; NYCB’s and Flagstar’s estimates of future costs and benefits of the actions each company may take; NYCB’s and Flagstar’s assessments of probable losses on loans; NYCB’s and Flagstar’s assessments of interest rate and other market risks; and NYCB’s and Flagstar’s ability to achieve their respective financial and other strategic goals. Forward‐looking statements are typically identified by such words as “believe,” “expect,” “anticipate,” “intend,” “outlook,” “estimate,” “forecast,” “project,” “should,” and other similar words and expressions, and are subject to numerous assumptions, risks, and uncertainties, which change over time. These forward-looking statements include, without limitation, those relating to the terms, timing and closing of the proposed transaction. Additionally, forward‐looking statements speak only as of the date they are made; NYCB and Flagstar do not assume any duty, and do not undertake, to update such forward‐looking statements. Furthermore, because forward‐looking statements are subject to assumptions and uncertainties, actual results or future events could differ, possibly materially, from those indicated in such forward-looking statements as a result of a variety of factors, many of which are beyond the control of NYCB and Flagstar. The factors that could cause actual results to differ materially include the following: the occurrence of any event, change or other circumstances that could give rise to the right of one or both of the parties to terminate the definitive merger agreement among NYCB, 615 Corp. and Flagstar; the outcome of any legal proceedings that may be instituted against NYCB or Flagstar; the possibility that the proposed transaction will not close when expected or at all because required regulatory, shareholder or other approvals are not received or other conditions to the closing are not satisfied on a timely basis or at all, or are obtained subject to conditions that are not anticipated; the ability of NYCB and Flagstar to meet expectations regarding the timing, completion and accounting and tax treatments of the proposed transaction; the risk that any announcements relating to the proposed transaction could have adverse effects on the market price of the common stock of NYCB or Flagstar; the possibility that the anticipated benefits of the proposed transaction will not be realized when expected or at all, including as a result of the impact of, or problems arising from, the integration of the two companies or as a result of the strength of the economy and competitive factors in the areas where NYCB and Flagstar do business; certain restrictions during the pendency of the proposed transaction that may impact the parties’ ability to pursue certain business opportunities or strategic transactions; the possibility that the proposed transaction may be more expensive to complete than anticipated, including as a result of unexpected factors or events; diversion of management’s attention from ongoing business operations and opportunities; the possibility that the parties may be unable to achieve expected synergies and operating efficiencies in the proposed transaction within the expected timeframes or at all and to successfully integrate Flagstar’s operations and those of NYCB; such integration may be more difficult, time consuming or costly than expected; revenues following the proposed transaction may be lower than expected; potential adverse reactions or changes to business or employee relationships, including those resulting from the announcement or completion of the proposed transaction; NYCB’s and Flagstar’s success in executing their respective business plans and strategies and managing the risks involved in the foregoing; the dilution caused by NYCB’s issuance of additional shares of its capital stock in connection with the proposed transaction; and other factors that may affect future results of NYCB and Flagstar; and the other factors discussed in the “Risk Factors” section NYCB’s Annual Report on Form 10‐K for the year ended December 31, 2020 and in other reports NYCB files with the U.S. Securities and Exchange Commission (the “SEC”), which are available at http://www.sec.gov and in the “SEC Filings” section of NYCB’s website, https://ir.mynycb.com, under the heading “Financial Information,” and in Flagstar’s Annual Report on Form 10-K for the year ended December 31, 2020 and in Flagstar’s other filings with SEC, which are available at http://www.sec.gov and in the “Documents” section of Flagstar’s website, https://investors.flagstar.com. 2Disclaimer Cautionary Statements Regarding Forward-Looking Information Certain statements in this presentation may constitute “forward‐looking statements” within the meaning of the Private Securities Litigation Reform Act of 1995, Section 27A of the Securities Act of 1933, as amended, and Section 21E of the Securities Exchange Act of 1934, as amended, with respect to New York Community Bancorp, Inc.’s (“NYCB”) and Flagstar Bancorp Inc.’s (“Flagstar”) beliefs, goals, intentions, and expectations regarding revenues, earnings, loan production, asset quality, capital levels, and acquisitions, among other matters; NYCB’s and Flagstar’s estimates of future costs and benefits of the actions each company may take; NYCB’s and Flagstar’s assessments of probable losses on loans; NYCB’s and Flagstar’s assessments of interest rate and other market risks; and NYCB’s and Flagstar’s ability to achieve their respective financial and other strategic goals. Forward‐looking statements are typically identified by such words as “believe,” “expect,” “anticipate,” “intend,” “outlook,” “estimate,” “forecast,” “project,” “should,” and other similar words and expressions, and are subject to numerous assumptions, risks, and uncertainties, which change over time. These forward-looking statements include, without limitation, those relating to the terms, timing and closing of the proposed transaction. Additionally, forward‐looking statements speak only as of the date they are made; NYCB and Flagstar do not assume any duty, and do not undertake, to update such forward‐looking statements. Furthermore, because forward‐looking statements are subject to assumptions and uncertainties, actual results or future events could differ, possibly materially, from those indicated in such forward-looking statements as a result of a variety of factors, many of which are beyond the control of NYCB and Flagstar. The factors that could cause actual results to differ materially include the following: the occurrence of any event, change or other circumstances that could give rise to the right of one or both of the parties to terminate the definitive merger agreement among NYCB, 615 Corp. and Flagstar; the outcome of any legal proceedings that may be instituted against NYCB or Flagstar; the possibility that the proposed transaction will not close when expected or at all because required regulatory, shareholder or other approvals are not received or other conditions to the closing are not satisfied on a timely basis or at all, or are obtained subject to conditions that are not anticipated; the ability of NYCB and Flagstar to meet expectations regarding the timing, completion and accounting and tax treatments of the proposed transaction; the risk that any announcements relating to the proposed transaction could have adverse effects on the market price of the common stock of NYCB or Flagstar; the possibility that the anticipated benefits of the proposed transaction will not be realized when expected or at all, including as a result of the impact of, or problems arising from, the integration of the two companies or as a result of the strength of the economy and competitive factors in the areas where NYCB and Flagstar do business; certain restrictions during the pendency of the proposed transaction that may impact the parties’ ability to pursue certain business opportunities or strategic transactions; the possibility that the proposed transaction may be more expensive to complete than anticipated, including as a result of unexpected factors or events; diversion of management’s attention from ongoing business operations and opportunities; the possibility that the parties may be unable to achieve expected synergies and operating efficiencies in the proposed transaction within the expected timeframes or at all and to successfully integrate Flagstar’s operations and those of NYCB; such integration may be more difficult, time consuming or costly than expected; revenues following the proposed transaction may be lower than expected; potential adverse reactions or changes to business or employee relationships, including those resulting from the announcement or completion of the proposed transaction; NYCB’s and Flagstar’s success in executing their respective business plans and strategies and managing the risks involved in the foregoing; the dilution caused by NYCB’s issuance of additional shares of its capital stock in connection with the proposed transaction; and other factors that may affect future results of NYCB and Flagstar; and the other factors discussed in the “Risk Factors” section NYCB’s Annual Report on Form 10‐K for the year ended December 31, 2020 and in other reports NYCB files with the U.S. Securities and Exchange Commission (the “SEC”), which are available at http://www.sec.gov and in the “SEC Filings” section of NYCB’s website, https://ir.mynycb.com, under the heading “Financial Information,” and in Flagstar’s Annual Report on Form 10-K for the year ended December 31, 2020 and in Flagstar’s other filings with SEC, which are available at http://www.sec.gov and in the “Documents” section of Flagstar’s website, https://investors.flagstar.com. 2

Disclaimer (Cont’d) Important Information and Where You Can Find It This communication may be deemed to be solicitation material in respect of the proposed transaction by NYCB and Flagstar. In connection with the proposed transaction, NYCB will file with the SEC a registration statement on Form S-4 to register the shares of NYCB’s capital stock to be issued in connection with the proposed transaction. The registration statement will include a prospectus of NYCB and a joint proxy statement of NYCB and Flagstar, which will be sent to the stockholders of NYCB and shareholders of Flagstar seeking certain approvals related to the proposed transaction. INVESTORS AND SECURITY HOLDERS OF NYCB AND FLAGSTAR AND THEIR RESPECTIVE AFFILIATES ARE URGED TO READ, WHEN AVAILABLE, THE REGISTRATION STATEMENT ON FORM S-4, THE JOINT PROXY STATEMENT/PROSPECTUS TO BE INCLUDED WITHIN THE REGISTRATION STATEMENT ON FORM S-4 AND ANY OTHER RELEVANT DOCUMENTS FILED OR TO BE FILED WITH THE SEC IN CONNECTION WITH THE PROPOSED TRANSACTION, AS WELL AS ANY AMENDMENTS OR SUPPLEMENTS TO THOSE DOCUMENTS, BECAUSE THEY WILL CONTAIN IMPORTANT INFORMATION ABOUT NYCB, FLAGSTAR AND THE PROPOSED TRANSACTION. Investors and security holders will be able to obtain a free copy of the registration statement, including the joint proxy statement/prospectus, as well as other relevant documents filed with the SEC containing information about NYCB and Flagstar, without charge, at the SEC’s website (http://www.sec.gov). Copies of documents filed with the SEC by NYCB can also be obtained, without charge, by directing a request to Investor Relations, New York Community Bancorp, Inc., 615 Merrick Avenue, Westbury, New York 11590 or by telephone (516-683-4420). Copies of documents filed with the SEC by Flagstar can also be obtained, without charge, by directing requests to Investor Relations, Flagstar Bancorp, Inc., 5151 Corporate Drive, Troy, Michigan 48098 or by telephone (248-312-5741). Participants in the Solicitation of Proxies in Connection with Proposed Transaction NYCB, Flagstar, and certain of their respective directors, executive officers and employees may be deemed to be participants in the solicitation of proxies in respect of the proposed transaction under the rules of the SEC. Information regarding NYCB’s directors and executive officers is available in its definitive proxy statement for its 2021 annual stockholders meeting, which was filed with the SEC on April 16, 2021, and certain of its Current Reports on Form 8-K. Information regarding Flagstar’s directors and executive officers is available in its definitive proxy statement for its 2021 annual shareholders meeting, which was filed with the SEC on April 15, 2021, and certain of its Current Reports on Form 8-K. Other information regarding the participants in the solicitation of proxies in respect of the proposed transaction and a description of their direct and indirect interests, by security holdings or otherwise, will be contained in the joint proxy statement/prospectus and other relevant materials to be filed with the SEC. Free copies of these documents, when available, may be obtained as described in the preceding paragraph. 3Disclaimer (Cont’d) Important Information and Where You Can Find It This communication may be deemed to be solicitation material in respect of the proposed transaction by NYCB and Flagstar. In connection with the proposed transaction, NYCB will file with the SEC a registration statement on Form S-4 to register the shares of NYCB’s capital stock to be issued in connection with the proposed transaction. The registration statement will include a prospectus of NYCB and a joint proxy statement of NYCB and Flagstar, which will be sent to the stockholders of NYCB and shareholders of Flagstar seeking certain approvals related to the proposed transaction. INVESTORS AND SECURITY HOLDERS OF NYCB AND FLAGSTAR AND THEIR RESPECTIVE AFFILIATES ARE URGED TO READ, WHEN AVAILABLE, THE REGISTRATION STATEMENT ON FORM S-4, THE JOINT PROXY STATEMENT/PROSPECTUS TO BE INCLUDED WITHIN THE REGISTRATION STATEMENT ON FORM S-4 AND ANY OTHER RELEVANT DOCUMENTS FILED OR TO BE FILED WITH THE SEC IN CONNECTION WITH THE PROPOSED TRANSACTION, AS WELL AS ANY AMENDMENTS OR SUPPLEMENTS TO THOSE DOCUMENTS, BECAUSE THEY WILL CONTAIN IMPORTANT INFORMATION ABOUT NYCB, FLAGSTAR AND THE PROPOSED TRANSACTION. Investors and security holders will be able to obtain a free copy of the registration statement, including the joint proxy statement/prospectus, as well as other relevant documents filed with the SEC containing information about NYCB and Flagstar, without charge, at the SEC’s website (http://www.sec.gov). Copies of documents filed with the SEC by NYCB can also be obtained, without charge, by directing a request to Investor Relations, New York Community Bancorp, Inc., 615 Merrick Avenue, Westbury, New York 11590 or by telephone (516-683-4420). Copies of documents filed with the SEC by Flagstar can also be obtained, without charge, by directing requests to Investor Relations, Flagstar Bancorp, Inc., 5151 Corporate Drive, Troy, Michigan 48098 or by telephone (248-312-5741). Participants in the Solicitation of Proxies in Connection with Proposed Transaction NYCB, Flagstar, and certain of their respective directors, executive officers and employees may be deemed to be participants in the solicitation of proxies in respect of the proposed transaction under the rules of the SEC. Information regarding NYCB’s directors and executive officers is available in its definitive proxy statement for its 2021 annual stockholders meeting, which was filed with the SEC on April 16, 2021, and certain of its Current Reports on Form 8-K. Information regarding Flagstar’s directors and executive officers is available in its definitive proxy statement for its 2021 annual shareholders meeting, which was filed with the SEC on April 15, 2021, and certain of its Current Reports on Form 8-K. Other information regarding the participants in the solicitation of proxies in respect of the proposed transaction and a description of their direct and indirect interests, by security holdings or otherwise, will be contained in the joint proxy statement/prospectus and other relevant materials to be filed with the SEC. Free copies of these documents, when available, may be obtained as described in the preceding paragraph. 3

Enhancing Shareholder Value By Leveraging Two Like-Minded Organizations with Distinctive Strategic Strengths Accelerates our transition towards building a dynamic commercial banking organization Creates a top-tier regional bank with significant scale and broader diversification Drives strong financial results and enhances capital generation Improves funding profile and interest rate risk positioning Market-leading rent-regulated multifamily lender, mortgage originator and servicer Maintains each bank’s unique low credit risk model Combines two strong management teams and boards 4Enhancing Shareholder Value By Leveraging Two Like-Minded Organizations with Distinctive Strategic Strengths Accelerates our transition towards building a dynamic commercial banking organization Creates a top-tier regional bank with significant scale and broader diversification Drives strong financial results and enhances capital generation Improves funding profile and interest rate risk positioning Market-leading rent-regulated multifamily lender, mortgage originator and servicer Maintains each bank’s unique low credit risk model Combines two strong management teams and boards 4

Key Transaction Terms n 100% stock consideration with a fixed exchange ratio of 4.0151x NYCB shares for each FBC share n Implied Total Transaction Value of $2.6B Consideration & n 9.3x Price / 2022E EPS; 6.4x Price / 2022E EPS with fully realized synergies Transaction Pricing n 1.15x Price / Tangible Book Value Per Share n 2.2% Tangible Book Premium / Core Deposits n Headquarters in Long Island, NY Organization n Regional headquarters in Troy, MI n Approximately 68% NYCB / 32% Flagstar Pro Forma Ownership n Board of Directors: 12 Directors (8 NYCB / 4 FBC) n Non-Executive Chairman: Alessandro “Sandro” DiNello (FBC) Board of Directors n President & CEO: Thomas Cangemi (NYCB) n Lead Independent Director: Hanif “Wally” Dahya (NYCB) n Non-Exec. Chairman: Sandro DiNello (FBC) n Senior EVP & President of Mortgage: Lee Smith (FBC) n President & CEO: Thomas Cangemi (NYCB) Leadership Team n Senior EVP & President of Banking: Reginald Davis (FBC) n Senior EVP & CFO: John Pinto (NYCB) n Plan to combine best talent from both companies for remaining roles n Mortgage division to maintain Flagstar brand n Flagstar Bank brand to be retained in the Midwest Branding n Other states to maintain their current branding Community Support n Continued dedication to the communities and markets in which both organizations operate n Customary shareholder and regulatory approvals for both NYCB and Flagstar Approvals & Closing n Anticipated closing by the end of 2021 Source: Factset, S&P Global Market Intelligence 5Key Transaction Terms n 100% stock consideration with a fixed exchange ratio of 4.0151x NYCB shares for each FBC share n Implied Total Transaction Value of $2.6B Consideration & n 9.3x Price / 2022E EPS; 6.4x Price / 2022E EPS with fully realized synergies Transaction Pricing n 1.15x Price / Tangible Book Value Per Share n 2.2% Tangible Book Premium / Core Deposits n Headquarters in Long Island, NY Organization n Regional headquarters in Troy, MI n Approximately 68% NYCB / 32% Flagstar Pro Forma Ownership n Board of Directors: 12 Directors (8 NYCB / 4 FBC) n Non-Executive Chairman: Alessandro “Sandro” DiNello (FBC) Board of Directors n President & CEO: Thomas Cangemi (NYCB) n Lead Independent Director: Hanif “Wally” Dahya (NYCB) n Non-Exec. Chairman: Sandro DiNello (FBC) n Senior EVP & President of Mortgage: Lee Smith (FBC) n President & CEO: Thomas Cangemi (NYCB) Leadership Team n Senior EVP & President of Banking: Reginald Davis (FBC) n Senior EVP & CFO: John Pinto (NYCB) n Plan to combine best talent from both companies for remaining roles n Mortgage division to maintain Flagstar brand n Flagstar Bank brand to be retained in the Midwest Branding n Other states to maintain their current branding Community Support n Continued dedication to the communities and markets in which both organizations operate n Customary shareholder and regulatory approvals for both NYCB and Flagstar Approvals & Closing n Anticipated closing by the end of 2021 Source: Factset, S&P Global Market Intelligence 5

A Financially Compelling Transaction Financial Metrics Robust Capital Position 10.4% Pro Forma 16% Double-Digit Capital Levels Common Equity 2022E EPS Accretion Tier 1 RBC Ratio (Assuming Fully Phased-in Cost Savings) $0.68 Common Dividend Maintained ~1,140% Increase for FBC Shareholders 3.5% Immediately Accretive To TBVPS TBVPS Accretion At Close Annual Capital Generation after ~$500M Dividends $125M Conservative 8% of Combined Base Fully Phased-In 20bps 11% of Flagstar, or Net Charge-Offs Cost Savings 3-Year Cumulative 30% of Non-Mortgage Losses operations Source: Factset, S&P Global Market Intelligence 6A Financially Compelling Transaction Financial Metrics Robust Capital Position 10.4% Pro Forma 16% Double-Digit Capital Levels Common Equity 2022E EPS Accretion Tier 1 RBC Ratio (Assuming Fully Phased-in Cost Savings) $0.68 Common Dividend Maintained ~1,140% Increase for FBC Shareholders 3.5% Immediately Accretive To TBVPS TBVPS Accretion At Close Annual Capital Generation after ~$500M Dividends $125M Conservative 8% of Combined Base Fully Phased-In 20bps 11% of Flagstar, or Net Charge-Offs Cost Savings 3-Year Cumulative 30% of Non-Mortgage Losses operations Source: Factset, S&P Global Market Intelligence 6

A Top-Tier Bank with National Scale and Strong Footholds in Northeast/Midwest and Exposure to High Growth Markets $22.1B NJ $2.6B NY NYCB Branches (236) 130 Branches 41 Branches NY WI MI FBC Branches (158) FBC Retail Home Lending NJ OH Offices (87) IN $10.4B $2.5B OH CA MI 113 Branches 29 Branches AZ $1.2B $0.1B IN WI FL 32 Branches 3 Branches $87B+ $8B+ $3.3B $1.4B AZ Total Market FL 26 Branches 14 Branches Assets Capitalization $0.7B $6.8B 1.2% 16% CA Custodial FBC 2022E 2022E 9 Branches Deposits HQ ROAA ROATCE Source: Company Filings, S&P Global Market Intelligence, FDIC Note: FBC retail home lending offices (87 offices) not denoted on map; Branch map as of 30-Jun-20 FDIC data; Branch count as of 31-Mar-21. 7 Other Markets Upper Midwest NYC MetroA Top-Tier Bank with National Scale and Strong Footholds in Northeast/Midwest and Exposure to High Growth Markets $22.1B NJ $2.6B NY NYCB Branches (236) 130 Branches 41 Branches NY WI MI FBC Branches (158) FBC Retail Home Lending NJ OH Offices (87) IN $10.4B $2.5B OH CA MI 113 Branches 29 Branches AZ $1.2B $0.1B IN WI FL 32 Branches 3 Branches $87B+ $8B+ $3.3B $1.4B AZ Total Market FL 26 Branches 14 Branches Assets Capitalization $0.7B $6.8B 1.2% 16% CA Custodial FBC 2022E 2022E 9 Branches Deposits HQ ROAA ROATCE Source: Company Filings, S&P Global Market Intelligence, FDIC Note: FBC retail home lending offices (87 offices) not denoted on map; Branch map as of 30-Jun-20 FDIC data; Branch count as of 31-Mar-21. 7 Other Markets Upper Midwest NYC Metro

Flagstar – A Differentiated Bank th th Diversified Strong Low-Risk #1 Mid-Cap 6 Largest 6 Largest Lending Core Deposit Asset Deposit Rank Bank Mortgage Mortgage Business Base Classes in Michigan Originator Sub-Servicer Key Business Lines Geographic Overview Segment Summary Key Information • Leading Michigan- • $29B Assets based bank with a • $19B Deposits Banking balanced, diversified • 209k Households lending platform • 27k Business Relationships 158 • Scalable platform • $53B LTM Originations Bank Branches Mortgage originating business • 87 Retail Lending Offices Origination in all channels and • 1,060 Correspondent Relationships all 50 states • 1,400 Broker Relationships 87 th Retail Home • 6 largest sub- • 1.1MM Loans Serviced Lending servicer of mortgage • $7.2B Average Escrow Deposits (1) Offices Mortgage loans nationwide • $428MM Mortgage Servicing Rights Servicing • Represents a growing and stable revenue stream Loan Portfolio – 1Q21 Deposit Portfolio – 1Q21 Segment Revenue Mix – 1Q21 Consumer HELOC Other Deposits 5% 7% 10% Community Banking CD 32% Resi. 9% Mtg. $14.9B $19.4B Mtg. Mortgage 63% 13% W- Origination 3.73% 0.21% Fee Income Non Int. house C&I 56% Bearing Savings Yield CoD 44% 10% 56% 25% CRE Mortgage 21% Servicing 12% Source: Company filings, S&P Global Market Intelligence 8 Note: Financial data as of the year ended 31-Mar-21; Branch count as of 31-Mar-21. 1. Includes eight home lending offices located in banking branchesFlagstar – A Differentiated Bank th th Diversified Strong Low-Risk #1 Mid-Cap 6 Largest 6 Largest Lending Core Deposit Asset Deposit Rank Bank Mortgage Mortgage Business Base Classes in Michigan Originator Sub-Servicer Key Business Lines Geographic Overview Segment Summary Key Information • Leading Michigan- • $29B Assets based bank with a • $19B Deposits Banking balanced, diversified • 209k Households lending platform • 27k Business Relationships 158 • Scalable platform • $53B LTM Originations Bank Branches Mortgage originating business • 87 Retail Lending Offices Origination in all channels and • 1,060 Correspondent Relationships all 50 states • 1,400 Broker Relationships 87 th Retail Home • 6 largest sub- • 1.1MM Loans Serviced Lending servicer of mortgage • $7.2B Average Escrow Deposits (1) Offices Mortgage loans nationwide • $428MM Mortgage Servicing Rights Servicing • Represents a growing and stable revenue stream Loan Portfolio – 1Q21 Deposit Portfolio – 1Q21 Segment Revenue Mix – 1Q21 Consumer HELOC Other Deposits 5% 7% 10% Community Banking CD 32% Resi. 9% Mtg. $14.9B $19.4B Mtg. Mortgage 63% 13% W- Origination 3.73% 0.21% Fee Income Non Int. house C&I 56% Bearing Savings Yield CoD 44% 10% 56% 25% CRE Mortgage 21% Servicing 12% Source: Company filings, S&P Global Market Intelligence 8 Note: Financial data as of the year ended 31-Mar-21; Branch count as of 31-Mar-21. 1. Includes eight home lending offices located in banking branches
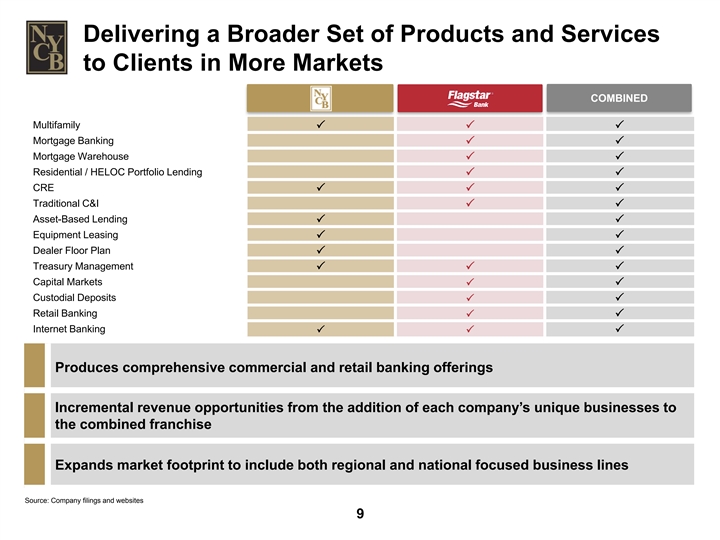
Delivering a Broader Set of Products and Services to Clients in More Markets COMBINED Multifamily PPP Mortgage Banking PP Mortgage Warehouse PP Residential / HELOC Portfolio Lending PP CRE PPP Traditional C&I PP Asset-Based Lending PP Equipment Leasing PP Dealer Floor Plan PP Treasury Management PPP Capital Markets PP Custodial Deposits P P Retail Banking PP Internet Banking PPP Produces comprehensive commercial and retail banking offerings Incremental revenue opportunities from the addition of each company’s unique businesses to the combined franchise Expands market footprint to include both regional and national focused business lines Source: Company filings and websites 9Delivering a Broader Set of Products and Services to Clients in More Markets COMBINED Multifamily PPP Mortgage Banking PP Mortgage Warehouse PP Residential / HELOC Portfolio Lending PP CRE PPP Traditional C&I PP Asset-Based Lending PP Equipment Leasing PP Dealer Floor Plan PP Treasury Management PPP Capital Markets PP Custodial Deposits P P Retail Banking PP Internet Banking PPP Produces comprehensive commercial and retail banking offerings Incremental revenue opportunities from the addition of each company’s unique businesses to the combined franchise Expands market footprint to include both regional and national focused business lines Source: Company filings and websites 9

Combined Revenue Profile With A Reduced Dependency On Spread Income NYCB (1Q21 LTM) FBC (1Q21 LTM) COMBINED (1Q21 LTM) 5 % 32 % 33 % $1.2B 50 % $2.2B $3.4B 55 % 13 % 17 % 95 % 4 % 10 % 20 % 36 % 2015- 2015 - 2015 - 43 % 2020 2020 2020 15 % Avg. Avg. Avg. 65 % 86 % 21 % Net Interest Income Bank Fee Income Mortgage Fee Revenue Pro forma fee income contributes to a more resilient revenue generating profile Mortgage-related earnings create natural hedge for various interest rate environments Source: Company filings, S&P Global Market Intelligence Note: Financial data as of the year ended 31-Mar-21; Revenue excludes net gains / (losses) on securities. 10Combined Revenue Profile With A Reduced Dependency On Spread Income NYCB (1Q21 LTM) FBC (1Q21 LTM) COMBINED (1Q21 LTM) 5 % 32 % 33 % $1.2B 50 % $2.2B $3.4B 55 % 13 % 17 % 95 % 4 % 10 % 20 % 36 % 2015- 2015 - 2015 - 43 % 2020 2020 2020 15 % Avg. Avg. Avg. 65 % 86 % 21 % Net Interest Income Bank Fee Income Mortgage Fee Revenue Pro forma fee income contributes to a more resilient revenue generating profile Mortgage-related earnings create natural hedge for various interest rate environments Source: Company filings, S&P Global Market Intelligence Note: Financial data as of the year ended 31-Mar-21; Revenue excludes net gains / (losses) on securities. 10

Enhanced Operating Strategy to Support Top-Quartile Profitability Metrics 1.3% 1.3% 1.2% 1.2% 1.1% 1.1% 1.1% 1.1% 1.1% 1.0% 1.0% 0.9% 0.9% 0.9% 0.9% 0.8% 0.8% ROAA Pro Forma 17% 16% 15% 15% 14% 14% 14% 14% 13% 13% 12% 12% 11% 11% 10% 10% 10% ROATCE Pro Forma 73.5% 63.5% 63.5% 64.0% 62.2% 59.6% 59.7% 59.8% 57.8% 56.5% 56.6% 55.2% 54.2% 52.1% 42.5% 38.6% 37.0% Efficiency Pro Forma 1.44% 1.23% 1.18% 1.14% 3-Year 0.70% 0.64% 0.62% Cumulative 0.46% 0.45% 0.41% 0.42% 0.25% 0.26% 0.20% 0.13% NCOs 0.01% Pro Forma Source: S&P Global Market Intelligence; Note: Market data as of April 23, 2021; Historical financial data based on fiscal years ended December 31, 2018 to December 31, 2020; Forward metrics based on 2022Y estimates; Pro Forma Peers reflect non-merger target U.S. exchange-traded banks (NASDAQ, NYSE, NYSEAM) with assets between $50B and $200B; excludes peers with unavailable or negative metrics, and NTRS; Illustrative Pro Forma figures inclusive of certain cost savings and other merger related adjustments. 11Enhanced Operating Strategy to Support Top-Quartile Profitability Metrics 1.3% 1.3% 1.2% 1.2% 1.1% 1.1% 1.1% 1.1% 1.1% 1.0% 1.0% 0.9% 0.9% 0.9% 0.9% 0.8% 0.8% ROAA Pro Forma 17% 16% 15% 15% 14% 14% 14% 14% 13% 13% 12% 12% 11% 11% 10% 10% 10% ROATCE Pro Forma 73.5% 63.5% 63.5% 64.0% 62.2% 59.6% 59.7% 59.8% 57.8% 56.5% 56.6% 55.2% 54.2% 52.1% 42.5% 38.6% 37.0% Efficiency Pro Forma 1.44% 1.23% 1.18% 1.14% 3-Year 0.70% 0.64% 0.62% Cumulative 0.46% 0.45% 0.41% 0.42% 0.25% 0.26% 0.20% 0.13% NCOs 0.01% Pro Forma Source: S&P Global Market Intelligence; Note: Market data as of April 23, 2021; Historical financial data based on fiscal years ended December 31, 2018 to December 31, 2020; Forward metrics based on 2022Y estimates; Pro Forma Peers reflect non-merger target U.S. exchange-traded banks (NASDAQ, NYSE, NYSEAM) with assets between $50B and $200B; excludes peers with unavailable or negative metrics, and NTRS; Illustrative Pro Forma figures inclusive of certain cost savings and other merger related adjustments. 11

Pro Forma Loan Portfolio NYCB FBC COMBINED Consumer: HELOC: Resi. Mtg.: Other: 2% Consumer: 1% 7% 1% 5% C&I: 8% Multifamily: C&I: 9% Resi. 56% CRE: Resi. Mtg.: 16% Mtg. W- Mtg.: 4% house: 13% $43.1B $14.9B $58.0B 11% Mtg. W- house: 3.59% Yield 3.73% Yield 3.63% Yield 44% C&I : 10% CRE: 17% Multifamily: CRE: 21% 75% Does not include ~$7bn of LHFS NYCB Pro Forma ~750% ~550% Reduces standalone CRE and mortgage concentrations CRE Concentration CRE Concentration ~330% ~265% CRE concentration excluding Rent-Regulated Multifamily is below 300% ex. RR MultiFam. ex. RR MultiFam. ~(3)% ~8% Repositions interest rate sensitivity profile ΔNII, +200bps ΔNII, +200bps Source: Company filings; S&P Global Market Intelligence Note: MRQ financial data as of 31-Mar-21;CRE defined as the sum of Construction & Land Development, Loans CRE Not Sec by RE and Non-Owner Occ Nonfarm / NonResi. Excludes Flagstar’s loans HFS of $7.1bn and loans with government guarantees of $2.5B 12Pro Forma Loan Portfolio NYCB FBC COMBINED Consumer: HELOC: Resi. Mtg.: Other: 2% Consumer: 1% 7% 1% 5% C&I: 8% Multifamily: C&I: 9% Resi. 56% CRE: Resi. Mtg.: 16% Mtg. W- Mtg.: 4% house: 13% $43.1B $14.9B $58.0B 11% Mtg. W- house: 3.59% Yield 3.73% Yield 3.63% Yield 44% C&I : 10% CRE: 17% Multifamily: CRE: 21% 75% Does not include ~$7bn of LHFS NYCB Pro Forma ~750% ~550% Reduces standalone CRE and mortgage concentrations CRE Concentration CRE Concentration ~330% ~265% CRE concentration excluding Rent-Regulated Multifamily is below 300% ex. RR MultiFam. ex. RR MultiFam. ~(3)% ~8% Repositions interest rate sensitivity profile ΔNII, +200bps ΔNII, +200bps Source: Company filings; S&P Global Market Intelligence Note: MRQ financial data as of 31-Mar-21;CRE defined as the sum of Construction & Land Development, Loans CRE Not Sec by RE and Non-Owner Occ Nonfarm / NonResi. Excludes Flagstar’s loans HFS of $7.1bn and loans with government guarantees of $2.5B 12

Maintain Our Low Risk Credit Model • Average NPLs / Total Loans of 0.56% compared to 1.64% for peers, since 1993 • Cumulative NCOs of 108 bps since 1993 compared to 2,387 bps for Peers NYCB • Since 1993, losses have aggregated 15bps on Multifamily and 10bps on CRE (of CREDIT aggregate originations) PERFORMANCE • Large contribution of loan portfolio comprised of low credit risk assets FBC • No outsized exposure to any geography or industry • 100% of NYCB’s full-payment deferrals have returned to payment status as of Q1 2021 COVID-19 IMPACTED EXPOSURE • Limited COVID-impacted exposure across both loan portfolios with only $13 million in full payment deferrals across C&I and CRE industries ~67% of pro forma loan portfolio is comprised of near-zero credit risk asset classes Retains high quality asset specific expertise across various products Expertise in underwriting and managing through varying credit cycles Source: Company filings 13Maintain Our Low Risk Credit Model • Average NPLs / Total Loans of 0.56% compared to 1.64% for peers, since 1993 • Cumulative NCOs of 108 bps since 1993 compared to 2,387 bps for Peers NYCB • Since 1993, losses have aggregated 15bps on Multifamily and 10bps on CRE (of CREDIT aggregate originations) PERFORMANCE • Large contribution of loan portfolio comprised of low credit risk assets FBC • No outsized exposure to any geography or industry • 100% of NYCB’s full-payment deferrals have returned to payment status as of Q1 2021 COVID-19 IMPACTED EXPOSURE • Limited COVID-impacted exposure across both loan portfolios with only $13 million in full payment deferrals across C&I and CRE industries ~67% of pro forma loan portfolio is comprised of near-zero credit risk asset classes Retains high quality asset specific expertise across various products Expertise in underwriting and managing through varying credit cycles Source: Company filings 13
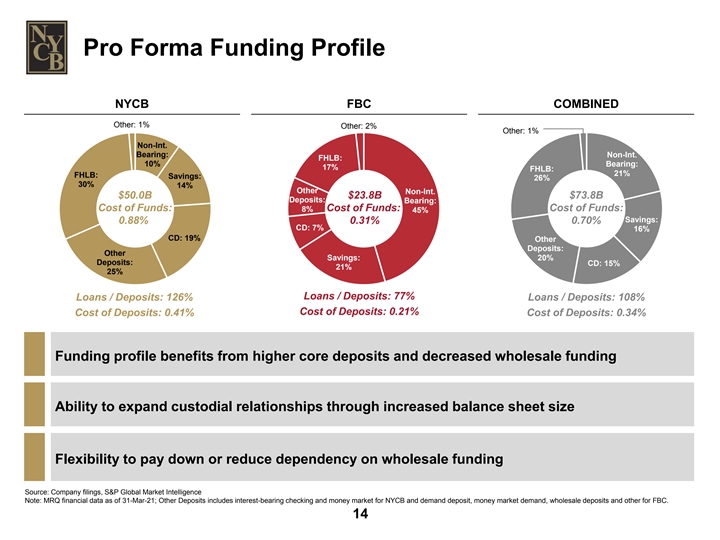
Pro Forma Funding Profile NYCB FBC COMBINED Other: 1% Other: 2% Other: 1% Non-Int. Bearing: Non-Int. FHLB: 10% Bearing: 17% FHLB: 21% FHLB: Savings: 26% 30% 14% Other Non-Int. $50.0B $23.8B $73.8B Deposits: Bearing: Cost of Funds: Cost of Funds: Cost of Funds: 8% 45% Savings: 0.88% 0.31% 0.70% CD: 7% 16% CD: 19% Other Deposits: Other 20% Savings: Deposits: CD: 15% 21% 25% Loans / Deposits: 77% Loans / Deposits: 126% Loans / Deposits: 108% Cost of Deposits: 0.21% Cost of Deposits: 0.41% Cost of Deposits: 0.34% Funding profile benefits from higher core deposits and decreased wholesale funding Ability to expand custodial relationships through increased balance sheet size Flexibility to pay down or reduce dependency on wholesale funding Source: Company filings, S&P Global Market Intelligence Note: MRQ financial data as of 31-Mar-21; Other Deposits includes interest-bearing checking and money market for NYCB and demand deposit, money market demand, wholesale deposits and other for FBC. 14Pro Forma Funding Profile NYCB FBC COMBINED Other: 1% Other: 2% Other: 1% Non-Int. Bearing: Non-Int. FHLB: 10% Bearing: 17% FHLB: 21% FHLB: Savings: 26% 30% 14% Other Non-Int. $50.0B $23.8B $73.8B Deposits: Bearing: Cost of Funds: Cost of Funds: Cost of Funds: 8% 45% Savings: 0.88% 0.31% 0.70% CD: 7% 16% CD: 19% Other Deposits: Other 20% Savings: Deposits: CD: 15% 21% 25% Loans / Deposits: 77% Loans / Deposits: 126% Loans / Deposits: 108% Cost of Deposits: 0.21% Cost of Deposits: 0.41% Cost of Deposits: 0.34% Funding profile benefits from higher core deposits and decreased wholesale funding Ability to expand custodial relationships through increased balance sheet size Flexibility to pay down or reduce dependency on wholesale funding Source: Company filings, S&P Global Market Intelligence Note: MRQ financial data as of 31-Mar-21; Other Deposits includes interest-bearing checking and money market for NYCB and demand deposit, money market demand, wholesale deposits and other for FBC. 14

Comprehensive Due Diligence Process and Integration Planning Scope of NYCB’s Diligence Efforts n Comprehensive due diligence coordinated and led by key executives of NYCB and Flagstar 11 n Management led review of all functional areas NYCB n Full engagement of external consultants and advisors through the diligence process acquisitions n Organized detailed video conference diligence sessions covering all major topics n Extensive review of the loan portfolio: 3 — Significant detailed credit reviews, including 100% of COVID-related loans FBC — Reviewed 100% of residential loan portfolio, consumer portfolio and MSRs valuations acquisitions — Top 20 mortgage warehouse relationships n Integration will be managed by long-time employees of NYCB and FBC who have been actively involved in diligence and previous merger integrations Selected Key Areas of Focus Consumer & Investment Mortgage Mortgage Deposit Commercial Portfolio / Banking Servicing Strategy Banking ALCO 150+ CECL & Risk Mgmt., Technology, Participants across both NYCB Credit / Legal / Capital Stress BSA & Data & Cyber and FBC, including consultants Underwriting Compliance and advisors dedicated to the Testing Internal Audit Security diligence process Accounting, Balance Integration Human Operations Finance & Sheet Planning Resources Tax Positioning Source: Company Management 15Comprehensive Due Diligence Process and Integration Planning Scope of NYCB’s Diligence Efforts n Comprehensive due diligence coordinated and led by key executives of NYCB and Flagstar 11 n Management led review of all functional areas NYCB n Full engagement of external consultants and advisors through the diligence process acquisitions n Organized detailed video conference diligence sessions covering all major topics n Extensive review of the loan portfolio: 3 — Significant detailed credit reviews, including 100% of COVID-related loans FBC — Reviewed 100% of residential loan portfolio, consumer portfolio and MSRs valuations acquisitions — Top 20 mortgage warehouse relationships n Integration will be managed by long-time employees of NYCB and FBC who have been actively involved in diligence and previous merger integrations Selected Key Areas of Focus Consumer & Investment Mortgage Mortgage Deposit Commercial Portfolio / Banking Servicing Strategy Banking ALCO 150+ CECL & Risk Mgmt., Technology, Participants across both NYCB Credit / Legal / Capital Stress BSA & Data & Cyber and FBC, including consultants Underwriting Compliance and advisors dedicated to the Testing Internal Audit Security diligence process Accounting, Balance Integration Human Operations Finance & Sheet Planning Resources Tax Positioning Source: Company Management 15

A Shared Commitment Diversity, Equity and Employees Inclusion § Committed to a diverse, inclusive and § Shared values and company missions culturally rich corporate environment § Strong focus on diversity, inclusion and We expect to§ Focus on promoting cultural awareness employee development to bridge gaps and enhance team maintain performance § Strong risk management cultures and continuous aligned corporate focus § Recurring self-assessment of D&I commitment positioning to remediate identified gaps § Larger company provides additional to our and improve culture of diversity and career opportunities and mobility constituencies inclusion as well as support additional Our Customers Our Community important community § Greater capabilities and § Continued commitment to initiatives expanded product suite community reinvestment and maintaining solid CRA ratings across § Diversified client base and scope our nationwide § Corporate, social, environmental § Increased technology spending and footprint and governance responsibility is a capabilities focus for both organizations § Larger balance sheet and increased § Support for local communities capital to support client growth through multiple foundations and donation of employees’ time Source: Company Management 16A Shared Commitment Diversity, Equity and Employees Inclusion § Committed to a diverse, inclusive and § Shared values and company missions culturally rich corporate environment § Strong focus on diversity, inclusion and We expect to§ Focus on promoting cultural awareness employee development to bridge gaps and enhance team maintain performance § Strong risk management cultures and continuous aligned corporate focus § Recurring self-assessment of D&I commitment positioning to remediate identified gaps § Larger company provides additional to our and improve culture of diversity and career opportunities and mobility constituencies inclusion as well as support additional Our Customers Our Community important community § Greater capabilities and § Continued commitment to initiatives expanded product suite community reinvestment and maintaining solid CRA ratings across § Diversified client base and scope our nationwide § Corporate, social, environmental § Increased technology spending and footprint and governance responsibility is a capabilities focus for both organizations § Larger balance sheet and increased § Support for local communities capital to support client growth through multiple foundations and donation of employees’ time Source: Company Management 16
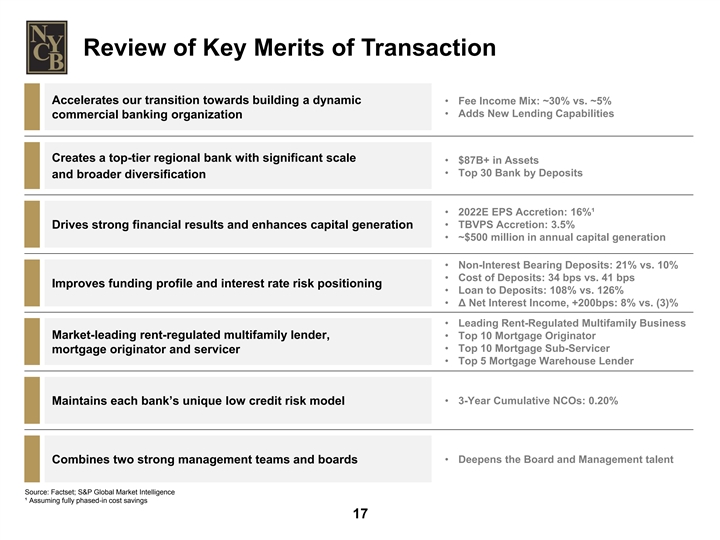
Review of Key Merits of Transaction Accelerates our transition towards building a dynamic • Fee Income Mix: ~30% vs. ~5% • Adds New Lending Capabilities commercial banking organization Creates a top-tier regional bank with significant scale • $87B+ in Assets • Top 30 Bank by Deposits and broader diversification • 2022E EPS Accretion: 16%¹ • TBVPS Accretion: 3.5% Drives strong financial results and enhances capital generation • ~$500 million in annual capital generation • Non-Interest Bearing Deposits: 21% vs. 10% • Cost of Deposits: 34 bps vs. 41 bps Improves funding profile and interest rate risk positioning • Loan to Deposits: 108% vs. 126% • Δ Net Interest Income, +200bps: 8% vs. (3)% • Leading Rent-Regulated Multifamily Business Market-leading rent-regulated multifamily lender, • Top 10 Mortgage Originator • Top 10 Mortgage Sub-Servicer mortgage originator and servicer • Top 5 Mortgage Warehouse Lender • 3-Year Cumulative NCOs: 0.20% Maintains each bank’s unique low credit risk model • Deepens the Board and Management talent Combines two strong management teams and boards Source: Factset; S&P Global Market Intelligence ¹ Assuming fully phased-in cost savings 17Review of Key Merits of Transaction Accelerates our transition towards building a dynamic • Fee Income Mix: ~30% vs. ~5% • Adds New Lending Capabilities commercial banking organization Creates a top-tier regional bank with significant scale • $87B+ in Assets • Top 30 Bank by Deposits and broader diversification • 2022E EPS Accretion: 16%¹ • TBVPS Accretion: 3.5% Drives strong financial results and enhances capital generation • ~$500 million in annual capital generation • Non-Interest Bearing Deposits: 21% vs. 10% • Cost of Deposits: 34 bps vs. 41 bps Improves funding profile and interest rate risk positioning • Loan to Deposits: 108% vs. 126% • Δ Net Interest Income, +200bps: 8% vs. (3)% • Leading Rent-Regulated Multifamily Business Market-leading rent-regulated multifamily lender, • Top 10 Mortgage Originator • Top 10 Mortgage Sub-Servicer mortgage originator and servicer • Top 5 Mortgage Warehouse Lender • 3-Year Cumulative NCOs: 0.20% Maintains each bank’s unique low credit risk model • Deepens the Board and Management talent Combines two strong management teams and boards Source: Factset; S&P Global Market Intelligence ¹ Assuming fully phased-in cost savings 17

Appendix 18Appendix 18
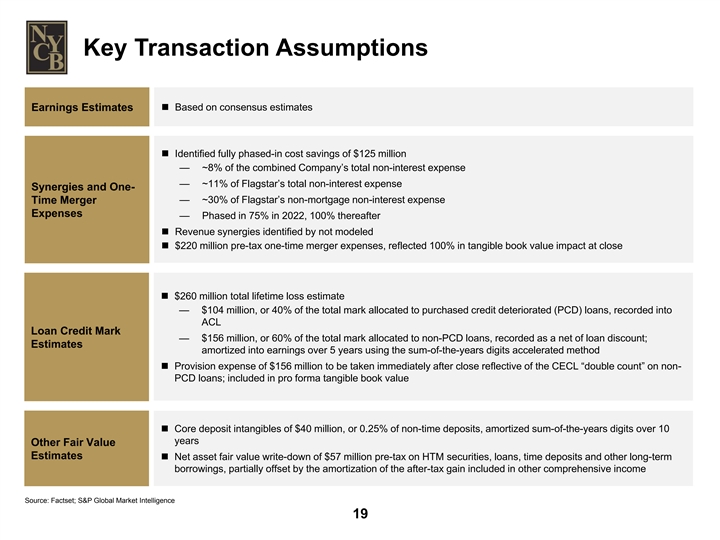
Key Transaction Assumptions Earnings Estimatesn Based on consensus estimates n Identified fully phased-in cost savings of $125 million — ~8% of the combined Company’s total non-interest expense — ~11% of Flagstar’s total non-interest expense Synergies and One- — ~30% of Flagstar’s non-mortgage non-interest expense Time Merger Expenses — Phased in 75% in 2022, 100% thereafter n Revenue synergies identified by not modeled n $220 million pre-tax one-time merger expenses, reflected 100% in tangible book value impact at close n $260 million total lifetime loss estimate — $104 million, or 40% of the total mark allocated to purchased credit deteriorated (PCD) loans, recorded into ACL Loan Credit Mark — $156 million, or 60% of the total mark allocated to non-PCD loans, recorded as a net of loan discount; Estimates amortized into earnings over 5 years using the sum-of-the-years digits accelerated method n Provision expense of $156 million to be taken immediately after close reflective of the CECL “double count” on non- PCD loans; included in pro forma tangible book value n Core deposit intangibles of $40 million, or 0.25% of non-time deposits, amortized sum-of-the-years digits over 10 years Other Fair Value Estimates n Net asset fair value write-down of $57 million pre-tax on HTM securities, loans, time deposits and other long-term borrowings, partially offset by the amortization of the after-tax gain included in other comprehensive income Source: Factset; S&P Global Market Intelligence 19Key Transaction Assumptions Earnings Estimatesn Based on consensus estimates n Identified fully phased-in cost savings of $125 million — ~8% of the combined Company’s total non-interest expense — ~11% of Flagstar’s total non-interest expense Synergies and One- — ~30% of Flagstar’s non-mortgage non-interest expense Time Merger Expenses — Phased in 75% in 2022, 100% thereafter n Revenue synergies identified by not modeled n $220 million pre-tax one-time merger expenses, reflected 100% in tangible book value impact at close n $260 million total lifetime loss estimate — $104 million, or 40% of the total mark allocated to purchased credit deteriorated (PCD) loans, recorded into ACL Loan Credit Mark — $156 million, or 60% of the total mark allocated to non-PCD loans, recorded as a net of loan discount; Estimates amortized into earnings over 5 years using the sum-of-the-years digits accelerated method n Provision expense of $156 million to be taken immediately after close reflective of the CECL “double count” on non- PCD loans; included in pro forma tangible book value n Core deposit intangibles of $40 million, or 0.25% of non-time deposits, amortized sum-of-the-years digits over 10 years Other Fair Value Estimates n Net asset fair value write-down of $57 million pre-tax on HTM securities, loans, time deposits and other long-term borrowings, partially offset by the amortization of the after-tax gain included in other comprehensive income Source: Factset; S&P Global Market Intelligence 19

Pro Forma Net Income And EPS Accretion Reconciliation Earnings Per Share Earnings Buildup 2022E ($ in millions, except per share) Pro Forma NYCB EPS $1.44 $1.25 Buildup: NYCB Consensus Net Income Estimate $ 581 FBC Consensus Net Income Estimate 277 $985 NYCB Consensus EPS Estimate $ 1.25 $127 FBC Consensus EPS Estimate 5.19 After-Tax Transaction Adjustments $277 Cost Savings - Fully Realized for Illustrative Purposes $ 91 Reversal of FBC Existing Intangible Amortization 7 $581 Newly Created Intangible Amortization (5) Accretion of Non-PCD Credit Mark 38 Accretion of Other Interest Rate Marks (2) Opportunity Cost of Cash (1) Pro Forma Net Income $ 985 Pro Forma Average Diluted Shares 683 4 NYCB Pro Forma EPS $ 1.44 NYCB Accretion (%) 16 % NYCB Standalone FBC Standalone After-Tax Pro Forma NYCB Accretion ($) $ 0.19 Net Income Net Income Transaction Net Income Adjustments Source: S&P Global, FactSet and IBES. Note: Figures may not foot due to rounding. 20Pro Forma Net Income And EPS Accretion Reconciliation Earnings Per Share Earnings Buildup 2022E ($ in millions, except per share) Pro Forma NYCB EPS $1.44 $1.25 Buildup: NYCB Consensus Net Income Estimate $ 581 FBC Consensus Net Income Estimate 277 $985 NYCB Consensus EPS Estimate $ 1.25 $127 FBC Consensus EPS Estimate 5.19 After-Tax Transaction Adjustments $277 Cost Savings - Fully Realized for Illustrative Purposes $ 91 Reversal of FBC Existing Intangible Amortization 7 $581 Newly Created Intangible Amortization (5) Accretion of Non-PCD Credit Mark 38 Accretion of Other Interest Rate Marks (2) Opportunity Cost of Cash (1) Pro Forma Net Income $ 985 Pro Forma Average Diluted Shares 683 4 NYCB Pro Forma EPS $ 1.44 NYCB Accretion (%) 16 % NYCB Standalone FBC Standalone After-Tax Pro Forma NYCB Accretion ($) $ 0.19 Net Income Net Income Transaction Net Income Adjustments Source: S&P Global, FactSet and IBES. Note: Figures may not foot due to rounding. 20

Pro Forma Tangible Book Value Accretion Reconciliation Tangible Book Value per Share Buildup +8.2% $9.39 +5.4% +3.5% $9.15 ($0.24) $8.98 $0.71 (2.8)% ($0.17) (1.9)% $0.36 $8.68 $8.32 NYCB Q1’21 Estimated NYCB Net Merger Pro Forma Full One-Time Pro Forma Day 2 CECL Pro Forma Standalone Growth at Close Est. at Close Consid. & FMV TBVPS, Subtotal Merger TBVPS, Subtotal Non-PCD TBVPS Impacts (A-T) Expenses (A-T) Reserve (A/T) Source: S&P Global, FactSet and IBES. Note: Figures may not foot due to rounding. 21Pro Forma Tangible Book Value Accretion Reconciliation Tangible Book Value per Share Buildup +8.2% $9.39 +5.4% +3.5% $9.15 ($0.24) $8.98 $0.71 (2.8)% ($0.17) (1.9)% $0.36 $8.68 $8.32 NYCB Q1’21 Estimated NYCB Net Merger Pro Forma Full One-Time Pro Forma Day 2 CECL Pro Forma Standalone Growth at Close Est. at Close Consid. & FMV TBVPS, Subtotal Merger TBVPS, Subtotal Non-PCD TBVPS Impacts (A-T) Expenses (A-T) Reserve (A/T) Source: S&P Global, FactSet and IBES. Note: Figures may not foot due to rounding. 21

FBC Executive Management Overview Alessandro (Sandro) P. DiNello, President, Chief Executive Officer & Director Alessandro (Sandro) DiNello has served as President, CEO, and a Director of FBC Bank and FBC Bancorp since mid-2013. Prior to his current position, he was president and Chief Administrative Officer of FBC Bank, and for a number of years, Executive Vice President of Retail Banking. As CEO, he navigated the Bank through three consent orders and led the transformation of Flagstar from a monoline mortgage lender to a commercial bank anchored by one of the biggest bank-owned mortgage businesses in the Country, with its market capitalization increasing from $500 million to $2.4 billion during his tenure. Lee M. Smith, Executive VP & President of Mortgage Lee Smith is Executive Vice President and President of Mortgage at FBC Bank, a position he assumed in September 2020. Mr. Smith joined FBC in 2013 as Executive Vice President and Chief Operating Officer and held that position until his appointment as Head of Mortgage. Prior to joining FBC, he was a partner with MatlinPatterson Global Advisers LLC, a private equity fund based in New York, where he managed a number of portfolio companies across a multitude of industries and sat on various boards. th As President of Mortgage, he also leads the Bank’s servicing business, building it from scratch to the 6 largest sub-servicing business and one of the largest bank-owned servicing businesses in the Country. Reginald E. Davis, Executive VP & President of Banking Reginald E. Davis joined FBC Bank in 2020 as Executive Vice President and President of Banking. In this role, he is responsible for all non-mortgage lending, Government Banking, Treasury Management, strategic alliances, and all of Retail Banking. Mr. Davis has 35 years of banking experience, most recently with SunTrust, now Truist, where he was Head of Business Banking. He also served as President of RBC Bank USA, the U.S. Banking Division of the Royal Bank of Canada, and as a senior executive and member of the Operating Committee for Wachovia (now Wells Fargo). Source: Company website and filings; S&P Global 22FBC Executive Management Overview Alessandro (Sandro) P. DiNello, President, Chief Executive Officer & Director Alessandro (Sandro) DiNello has served as President, CEO, and a Director of FBC Bank and FBC Bancorp since mid-2013. Prior to his current position, he was president and Chief Administrative Officer of FBC Bank, and for a number of years, Executive Vice President of Retail Banking. As CEO, he navigated the Bank through three consent orders and led the transformation of Flagstar from a monoline mortgage lender to a commercial bank anchored by one of the biggest bank-owned mortgage businesses in the Country, with its market capitalization increasing from $500 million to $2.4 billion during his tenure. Lee M. Smith, Executive VP & President of Mortgage Lee Smith is Executive Vice President and President of Mortgage at FBC Bank, a position he assumed in September 2020. Mr. Smith joined FBC in 2013 as Executive Vice President and Chief Operating Officer and held that position until his appointment as Head of Mortgage. Prior to joining FBC, he was a partner with MatlinPatterson Global Advisers LLC, a private equity fund based in New York, where he managed a number of portfolio companies across a multitude of industries and sat on various boards. th As President of Mortgage, he also leads the Bank’s servicing business, building it from scratch to the 6 largest sub-servicing business and one of the largest bank-owned servicing businesses in the Country. Reginald E. Davis, Executive VP & President of Banking Reginald E. Davis joined FBC Bank in 2020 as Executive Vice President and President of Banking. In this role, he is responsible for all non-mortgage lending, Government Banking, Treasury Management, strategic alliances, and all of Retail Banking. Mr. Davis has 35 years of banking experience, most recently with SunTrust, now Truist, where he was Head of Business Banking. He also served as President of RBC Bank USA, the U.S. Banking Division of the Royal Bank of Canada, and as a senior executive and member of the Operating Committee for Wachovia (now Wells Fargo). Source: Company website and filings; S&P Global 22

A History Of Accretive Transactions Which Have Added To Our Franchise Value 1. Nov. 2000 2. July 2001 3. Oct. 2003 4. Dec. 2005 5. April 2006 6. April 2007 Haven Bancorp Richmond County Roslyn Bancorp, Long Island Atlantic Bank of PennFed Financial (HAVN) Financial Corp. Inc. (RSLN) Financial Corp. New York (ABNY) Services, Inc. (RCBK) (LICB) (PFSB) Assets: Assets: Assets: Assets: Assets: Assets: $2.3 billion $2.7 billion $3.7 billion $10.4 billion $562 million $2.8 billion Deposits: Deposits: Deposits: Deposits: Deposits: Deposits: $1.6 billion $2.1 billion $2.5 billion $5.9 billion $434 million $1.8 billion 7. July 2007 8. Oct. 2007 9. Dec. 2009 10. March 2010 11. June 2012 12. April 2021 NYC branch Synergy Financial AmTrust Bank Desert Hills Bank Aurora Bank FSB Flagstar Bancorp, network of Doral Group, Inc. (SYNF) Inc. Assets: Bank, FSB None (Doral-NYC) Assets: Deposits: Assets: Assets: Assets: Assets: $29.4 billion $892 million $2.2 billion $485 million $11.0 billion $452 million Deposits: Branches: 0 Deposits: Deposits: Deposits: Deposits: $564 million $19.4 billion Payment $370 million $8.2 billion $375 million Received: Branches: 158 $24.0 million Retail Lending Offices: 87 Transaction Type: Savings Bank Commercial Bank Branch FDIC Deposit 23A History Of Accretive Transactions Which Have Added To Our Franchise Value 1. Nov. 2000 2. July 2001 3. Oct. 2003 4. Dec. 2005 5. April 2006 6. April 2007 Haven Bancorp Richmond County Roslyn Bancorp, Long Island Atlantic Bank of PennFed Financial (HAVN) Financial Corp. Inc. (RSLN) Financial Corp. New York (ABNY) Services, Inc. (RCBK) (LICB) (PFSB) Assets: Assets: Assets: Assets: Assets: Assets: $2.3 billion $2.7 billion $3.7 billion $10.4 billion $562 million $2.8 billion Deposits: Deposits: Deposits: Deposits: Deposits: Deposits: $1.6 billion $2.1 billion $2.5 billion $5.9 billion $434 million $1.8 billion 7. July 2007 8. Oct. 2007 9. Dec. 2009 10. March 2010 11. June 2012 12. April 2021 NYC branch Synergy Financial AmTrust Bank Desert Hills Bank Aurora Bank FSB Flagstar Bancorp, network of Doral Group, Inc. (SYNF) Inc. Assets: Bank, FSB None (Doral-NYC) Assets: Deposits: Assets: Assets: Assets: Assets: $29.4 billion $892 million $2.2 billion $485 million $11.0 billion $452 million Deposits: Branches: 0 Deposits: Deposits: Deposits: Deposits: $564 million $19.4 billion Payment $370 million $8.2 billion $375 million Received: Branches: 158 $24.0 million Retail Lending Offices: 87 Transaction Type: Savings Bank Commercial Bank Branch FDIC Deposit 23