Attached files
| file | filename |
|---|---|
| 8-K - FORM 8-K - PACWEST BANCORP | tm2113825d1_8k.htm |
Exhibit 99.1
Pacific Western Bank Fixed Income Investor Presentation April 23, 2021
Fixed Income Investor Presentation | Pacific Western Bank | p. 2 Disclaimer Forward Looking Statements This presentation contains certain forward - looking information about PacWest Bancorp (the “Company”) and Pacific Western Bank (t he “Bank”) that is intended to be covered by the safe harbor for forward - looking statements provided by the Private Securities Litigation Reform Act of 1995 . Statements that are not historical or current facts, including statements about future financial and operational results, expectations, future plans or intentions are forward - looking statements. Such statements are based on information available at the time of the communication and are based on current beli efs and expectations of the Company’s management and are subject to significant risks, uncertainties and contingencies, many of which are beyond the cont rol of the Company and the Bank. Such risks and uncertainties include, but are not limited to, the following factors: the COVID - 19 pandemic is adversely af fecting the Company, its employees, customers and third - party service providers, and the ultimate extent of the impacts on its business, financial positi on, results of operations, liquidity and prospects is uncertain. The length of the COVID - 19 pandemic and the severity of its impact on key macro - economic indicators such as unemployment and GDP may have a material impact on our allowance for credit losses and related provision for credit losses. Continued deterior ati on in general business and economic conditions could adversely affect the Company’s revenues and the values of its assets, including goodwill, and liabi lit ies, lead to a tightening of credit, and increase stock price volatility. In addition, the Company’s results could be adversely affected by changes in int ere st rates, sustained high unemployment rates, deterioration in the credit quality of the Bank’s loan portfolio or in the value of the collateral securi ng those loans, deterioration in the value of its investment securities, the magnitude of individual loan losses on security monitoring loans, and legal and regulatory dev elopments. Actual results may differ materially from those set forth or implied in the forward - looking statements due to a variety of factors, including the r isk factors described in documents filed by the Company with the U.S. Securities and Exchange Commission. We are under no obligation to (and expressly disclaim any such obligation to) update or alter our forward - looking statements, whether as a result of new information, future events or otherwise except as required b y law . Non - GAAP Financial Measures This presentation contains certain non - GAAP financial measures, including tangible common equity ratio, tangible book value per share, return on average tangible equity, pre - provision, pre - tax net revenues (“PPNR”) and PPNR return on average assets. The Company uses these non - GAAP financial measures to provide meaningful supplemental information regarding the Company’s operational performance and to enhance investors’ overall un derstanding of such financial performance. These non - GAAP financial measures should not be considered a substitute for financial measures presented in accordance with GAAP and may be different from non - GAAP financial measures used by other companies. Reconciliations of non - GAAP amounts to the relev ant GAAP amount are provided on pages 31 – 32 of this presentation. Securities Filings and Disclaimer This presentation is for informational purposes only and does not constitute an offer to sell or a solicitation of an offer t o b uy any securities of the Bank nor shall there be any sale of these securities in any state or jurisdiction in which such an offer, solicitation or sale would be unla wfu l prior to registration or qualification under the securities laws of any such state or jurisdiction. If a transaction follows at a future date, that offering will be ma de only by means of an offering circular. In that event, recipients of this presentation should carefully review any such offering circular, including any ri sk factors contained therein and the documents incorporated by reference, before making any investment decision.
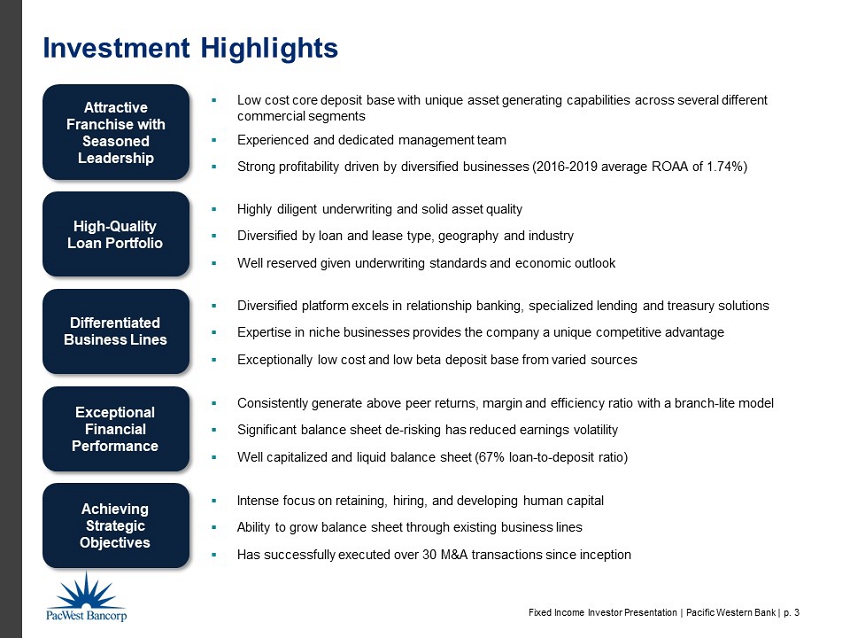
Fixed Income Investor Presentation | Pacific Western Bank | p. 3 Investment Highlights Attractive Franchise with Seasoned Leadership Differentiated Business Lines Exceptional Financial Performance Achieving Strategic Objectives ▪ Low cost core deposit base with unique asset generating capabilities across several different commercial segments ▪ Experienced and dedicated management team ▪ Strong profitability driven by diversified businesses (2016 - 2019 average ROAA of 1.74%) ▪ Diversified platform excels in relationship banking, specialized lending and treasury solutions ▪ Expertise in niche businesses provides the company a unique competitive advantage ▪ Exceptionally low cost and low beta deposit base from varied sources ▪ Consistently generate above peer returns, margin and efficiency ratio with a branch - lite model ▪ Significant balance sheet de - risking has reduced earnings volatility ▪ Well capitalized and liquid balance sheet (67% loan - to - deposit ratio ) ▪ Intense focus on retaining, hiring, and developing human capital ▪ Ability to grow balance sheet through existing business lines ▪ Has successfully executed over 30 accretive M&A transactions since inception High - Quality Loan Portfolio ▪ Highly diligent underwriting and solid asset quality ▪ Diversified by loan and lease type, geography and industry ▪ Well reserved given underwriting standards and economic outlook

Fixed Income Investor Presentation | Pacific Western Bank | p. 4 Experienced Executive Leadership Team William J. Black, Jr. EVP, Strategy & Corporate Development 1 year at PacWest 24 years in financial services ▪ EVP, Strategy & Corporate Development since July 2020 ▪ Served as Founder, Managing Partner and Portfolio Manager at Consector Capital LP, a financial services hedge fund, from August 2008 until June 2020 ▪ Previously, Vice President with Castle Creek Capital LLC and a Managing Director at Second Curve Capital LLC Bart R. Olson EVP, CFO 4 years at PacWest 31 years in financial services ▪ EVP, CFO since January 2021 after serving as Deputy CFO since August 2020 ▪ EVP, Chief Accounting Officer from 2017 - 2020 ▪ Managing Director in the CFO Division of Credit Suisse Group from 2013 - 2017 ▪ Audit Partner at KPMG, 23 years of public accounting experience ▪ Licensed certified public accountant in California Mark T. Yung EVP, COO & Director 4 years at PacWest 24 years in financial services ▪ EVP, COO since April 2019 ▪ Director since 2017 and is currently a member of the risk committee ▪ Previously co - founder and managing principal of OCV Management, LLC, an investor, owner and operator of technology and life science companies ▪ Prior experience in corporate strategy, leveraged finance, private equity and venture investments Matthew P. Wagner President, CEO & Director 21 years at PacWest 40+ years in financial services ▪ President, CEO & Director of PacWest Bancorp since its formation in 2000 ▪ Served as President & CEO of Western Bancorp from 1996 - 1999, when Western Bancorp was acquired by U.S. Bancorp ▪ EVP with U.S. Bancorp in Minneapolis, MN from 1990 to 1996 and as a SVP from 1985 to 1990

Fixed Income Investor Presentation | Pacific Western Bank | p. 5 Nationwide Lender Combined with California Branch Network Durham, NC Los Angeles, CA Chevy Chase, MD Chicago, IL Denver, CO New York, NY Boston, MA Minneapolis, MN Austin, TX Campbell, CA Menlo Park, CA San Francisco, CA National Lending office Venture Banking office Community Banking branch Primary offices in 14 states San Diego, CA
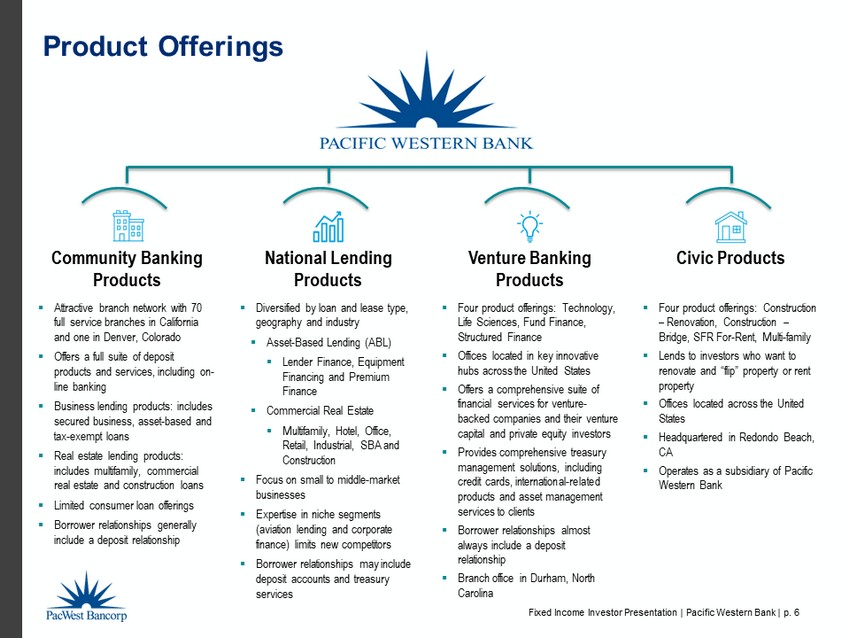
Fixed Income Investor Presentation | Pacific Western Bank | p. 6 Product Offerings Community Banking Products National Lending Products Venture Banking Products ▪ Attractive branch network with 70 full service branches in California and one in Denver, Colorado ▪ Offers a full suite of deposit products and services, including on - line banking ▪ Business lending products: includes secured business, asset - based and tax - exempt loans ▪ Real estate lending products: includes multifamily, commercial real estate and construction loans ▪ Limited consumer loan offerings ▪ Borrower relationships generally include a deposit relationship ▪ Diversified by loan and lease type, geography and industry ▪ Asset - Based Lending (ABL) ▪ Lender Finance, Equipment Financing and Premium Finance ▪ Commercial Real Estate ▪ Multifamily, Hotel, Office, Retail, Industrial, SBA and Construction ▪ Focus on small to middle - market businesses ▪ Expertise in niche segments (aviation lending and corporate finance) limits new competitors ▪ Borrower relationships may include deposit accounts and treasury services ▪ Four product offerings: Technology, Life Sciences, Fund Finance, Structured Finance ▪ Offices located in key innovative hubs across the United States ▪ Offers a comprehensive suite of financial services for venture - backed companies and their venture capital and private equity investors ▪ Provides comprehensive treasury management solutions, including credit cards, international - related products and asset management services to clients ▪ Borrower relationships almost always include a deposit relationship ▪ Branch office in Durham, North Carolina Civic Products ▪ Four product offerings: Construction – Renovation, Construction – Bridge, SFR For - Rent, Multi - family ▪ Lends to investors who want to renovate and “flip” property or rent property ▪ Offices located across the United States ▪ Headquartered in Redondo Beach, CA ▪ Operates as a subsidiary of Pacific Western Bank

Fixed Income Investor Presentation | Pacific Western Bank | p. 7 Balancing Quality Growth with Our Credit De - Risking Strategy 2014 2015 2016 2017 2018 2019 Sold PWEF Leasing Growth Initiatives De - Risking Initiatives New National Construction Lending Team New Multi - Family Lending Team Square 1 Acquisition CapitalSource Acquisition New Tax - Exempt Lending Team CUB Acquisition Colorado Market Expansion Strengthened construction lending criteria - lower loan - to - cost ratio Began to reduce exposure to Healthcare Real Estate Sold $1.5bn of Cash Flow Loans Began to emphasize Equity Fund Loans in Venture Banking Sold Celtic Capital Discontinued originating Security Monitoring and NL Healthcare RE loans 2020 2021 Civic Acquisition 2/01/21 Pandemic – intensely managed loan portfolio HOA Business Acquisition (Close in 4Q21)

Fixed Income Investor Presentation | Pacific Western Bank | p. 8 On February 1, 2021, Pacific Western Bank acquired Civic Ventures, LLC and subsidiaries (“Civic”) in an all - cash transaction . ▪ The acquisition of Civic advances the Bank’s strategy to expand its lending portfolio and diversify its revenue streams . ▪ Civic operates as a wholly - owned subsidiary of the Bank. ▪ Civic is one of the leading lenders in the United States specializing in residential non - owner - occupied investment properties. ▪ Civic typically loans money to investors who need bridge loans, financing for flips, rentals or rehab projects. It also offers multifamily loans. ▪ Civic has funded over 10,000 loans to real estate investors, totaling more than $4.4 billion since its inception in 2014. ▪ In 2020, it originated more than $1 billion as investors looked for new opportunities amid historically low interest rates . ▪ Loan production in February and March 2021 totaled $231 million. ▪ Will become accretive to earnings near year - end as the loan balances grow. Acquisition of Civic Financial Services Note : The acquisition is not considered significant under SEC regulations.

Fixed Income Investor Presentation | Pacific Western Bank | p. 9 On April 1, 2021, PacWest Bancorp announced that Pacific Western Bank has entered into a definitive agreement to acquire MUFG Union Bank, N.A.’s Homeowners Association Services Division Strategic Rationale ▪ Deposit - first focus – adds $4 billion of deposits with an 8 bps cost of deposits ▪ Contrarian strategy in today’s market focusing on the long - term value of core deposits ▪ Aligns with PacWest’s branch - lite business model – 55 %+ of branchless pro forma deposits ▪ Strengthens the foundation for future EPS growth ▪ Leadership position in an attractive, growing, niche business ▪ HOA dedicated technology platform that accelerates PacWest’s recent digitization strategy ▪ Relative size and importance allows us to focus, invest in and cultivate business in a more meaningful way ▪ Closing expected in 4Q 21; subject to normal regulatory approvals Financial Rationale ▪ Deal is EPS accretive at a conservative reinvestment rate with all cash consideration ▪ EPS accretion would be mid - single digits if liquidity is deployed into securities at current rates ▪ This is a long - term investment in our franchise with low beta deposits that position us well for a potentially inflationary environment ▪ Premium paid is less than 6 months of earnings for what we feel is an incredibly valuable business Acquisition of HOA Division of MUFG Union Bank N.A. Note : The acquisition is not considered significant under SEC regulations.

Fixed Income Investor Presentation | Pacific Western Bank | p. 10 $5B $5B $5B $12B $16B $16B $19B $19B $19B $25B 2011 2012 2013 2014 2015 2016 2017 2018 2019 2020 Total Deposits Bank Financial Information – 10 Year Trends $6B $5B $7B $16B $21B $22B $25B $26B $27B $29B 2011 2012 2013 2014 2015 2016 2017 2018 2019 2020 Total Assets 16.2% 15.4% 15.8% 13.2% 12.8% 12.7% 12.7% 11.4% 11.7% 13.0% 2011 2012 2013 2014 2015 2016 2017 2018 2019 2020 Total Risk Based Capital Ratio $58mm $61mm $46mm $177mm $294mm $348mm $350mm $481mm $488mm $228mm 2011 2012 2013 2014 2015 2016 2017 2018 2019 2020 Adjusted Net Income (1) (1) 2020 Net Income calculated using pre - tax income, excluding goodwill impairment of $1.47 billion, tax affected at 29 %.
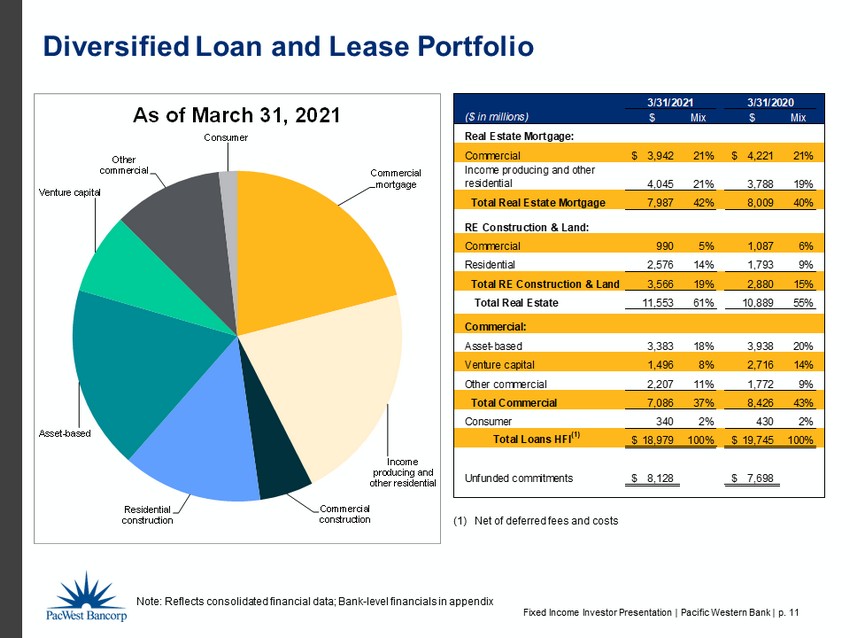
Fixed Income Investor Presentation | Pacific Western Bank | p. 11 Diversified Loan and Lease Portfolio Note: Reflects consolidated financial data; Bank - level financials in appendix ($ in millions) $ Mix $ Mix Real Estate Mortgage: Commercial 3,942$ 21% 4,221$ 21% Income producing and other residential 4,045 21% 3,788 19% Total Real Estate Mortgage 7,987 42% 8,009 40% RE Construction & Land: Commercial 990 5% 1,087 6% Residential 2,576 14% 1,793 9% Total RE Construction & Land 3,566 19% 2,880 15% Total Real Estate 11,553 61% 10,889 55% Commercial: Asset-based 3,383 18% 3,938 20% Venture capital 1,496 8% 2,716 14% Other commercial 2,207 11% 1,772 9% Total Commercial 7,086 37% 8,426 43% Consumer 340 2% 430 2% Total Loans HFI (1) 18,979$ 100% 19,745$ 100% Unfunded commitments 8,128$ 7,698$ 3/31/2021 3/31/2020 Commercial mortgage Income producing and other residential Commercial construction Residential construction Asset - based Venture capital Other commercial Consumer As of March 31, 2021 (1) Net of deferred fees and costs

Fixed Income Investor Presentation | Pacific Western Bank | p. 12 Diversified Loan and Lease Portfolio Note: Reflects consolidated financial data; Bank - level financials in appendix ($ in millions) $ Mix $ Mix Asset-Based: Lender Finance 2,113$ 63% 2,294$ 58% Equipment Finance 647 19% 822 21% Premium Finance 450 13% 490 13% Other 173 5% 332 8% Total Asset-Based 3,383$ 100% 3,938$ 100% 3/31/2021 3/31/2020 ($ in millions) $ Mix $ Mix Real Estate: Income Producing Residential 3,823$ 33% 3,688$ 34% Construction & Land (1) 3,566 31% 2,880 26% Other Commercial (2) 2,617 23% 2,748 25% SBA 610 5% 561 5% Hotel 539 5% 621 6% Other Residential 223 2% 100 1% Healthcare 175 1% 291 3% Total Real Estate 11,553$ 100% 10,889$ 100% 3/31/2021 3/31/2020 Other Commercial, $2,617mm, 23% SBA , $610mm , 5% Hotel , $539mm , 5% Income Producing Residential, $3,823mm, 33% Healthcare , $175mm , 1% Other Residential , $223mm , 2% Construction & Land , $3,566mm , 31% Real Estate ($11.6B) Lender Finance $2,113mm , 63% Equipment Finance $647mm , 19% Premium Finance $450mm , 13% Other $173mm , 5% Asset - Based ($3.4B) (1) Of which land represents $148 million and $169 million at 3/31/21 and 3/31/20. (2) Comprised of 45% office, 18% industrial, 18% retail and 19% other at 3/31/21.

Fixed Income Investor Presentation | Pacific Western Bank | p. 13 Diversified Loan and Lease Portfolio Note: Reflects consolidated financial data; Bank - level financials in appendix ($ in millions) $ Mix $ Mix Venture Capital: Equity Fund Loans 890$ 59% 1,403$ 52% Venture Capital 606 41% 1,313 48% Total Venture Capital 1,496$ 100% 2,716$ 100% 3/31/2021 3/31/2020 Paycheck Protection Program , $1,079mm , 49% Secured Business Loans , $398mm , 18% Security Monitoring , $206mm , 9% Unsecured Business Loans , $237mm , 11% Municipal , $126mm , 6% Other , $161mm , 7% Other Commercial ($2.2B) Equity Fund Loans , $890mm , 59% Venture Capital , $606mm , 41% Venture Capital ($1.5B) ($ in millions) $ Mix $ Mix Other Commercial: Paycheck Protection Program 1,079$ 49% -$ - Secured Business Loans 398 18% 667 38% Unsecured Business Loans 237 11% 226 13% Security Monitoring 206 9% 539 30% Municipal 126 6% 155 9% Other 161 7% 185 10% Total Other Commercial 2,207$ 100% 1,772$ 100% 3/31/2021 3/31/2020

Fixed Income Investor Presentation | Pacific Western Bank | p. 14 (1) The weighted average TE rate on production presents contractual rates and does not include amortized fees. Amortized fees add ed approximately 43 basis points to loan yields in 2021 and 25 basis points in 2020. (2) Net of deferred fees and costs (3) “Quarterly Change” equals “Net Difference” plus transfers to loans held for sale, transfers to OREO, charge - offs and loan sales. Note: Reflects consolidated financial data; Bank - level financials in appendix Loan and Lease Production of $1.6 Billion in 1Q21 ($ in millions) Production/ Disbursements Payoffs/ Paydowns Net Difference Rate on Production (1) ($ in millions) Loans Beginning Balance (2) Loans Ending Balance (2) Quarterly Change (3) 1Q21 2,636$ 2,702$ (66)$ 4.36% 1Q21 19,083$ 18,979$ (104)$ 4Q20 2,485 2,287 198 4.41% 4Q20 19,026 19,083 57 3Q20 1,528 2,144 (616) 4.95% 3Q20 19,695 19,026 (669) 2Q20 2,603 2,635 (32) 2.33% 2Q20 19,745 19,695 (50) 1Q20 2,787 1,867 920 4.31% 1Q20 18,847 19,745 898 $790 $546 $520 $1,131 $1,232 $1,997 $800 $1,008 $1,354 $1,023 $0 $1,257 $0 $0 $381 $813 $613 $983 $1,330 $1,635 $1,054 $2,022 $1,161 $957 $1,067 $2,787 $2,603 $1,528 $2,485 $2,636 $1,867 $2,635 $2,144 $2,287 $2,702 0.0% 1.0% 2.0% 3.0% 4.0% 5.0% 6.0% $0 $500 $1,000 $1,500 $2,000 $2,500 $3,000 1Q20 2Q20 3Q20 4Q20 1Q21 Avg. Rate on Production Millions Production Disbursements PPP Loans Payoffs Paydowns Rate on Production

Fixed Income Investor Presentation | Pacific Western Bank | p. 15 (1) MF construction commitments total $3.8bn and have an average loan - to - cost ratio of 62% as of March 31, 2021. (2) $1.9bn, or approximately 49%, of MF portfolio is 50% risk - weighted. (3) Included in MF construction commitments are $814mm of commitments to build low income housing MF projects with a weighted ave rag e LTC of 71%. Note: Reflects consolidated financial data; Bank - level financials in appendix Multi - Family Loans California, 57% Colorado , 5% Florida , 9% Washington , 4% Virginia , 6% Georgia , 4% Nevada , 4% Others , 11% $1.7bn (1) MF Construction Portfolio Principal Balance Amount Count 3/31/21 Tota l 3/31/21 % of Tota l $0 ~ $5mm 1,917 1,924mm 50% $5mm ~ $10mm 141 941mm 25% $10mm ~ $30mm 45 656mm 17% $30mm ~ $106mm 4 302mm 8% Total 2,107 $ 3,823mm California, 71% Washington , 7% Florida , 6% Oregon , 3% New York , 2% Colorado , 3% Others , 8% $3.8bn (2) Income Producing Residential Portfolio Income Producing Residential LTC > 70% , 19% LTC 40% - 50% , 4% LTC 50% - 60% , 54% LTC 60% - 70% , 23% MF Construction Commitments By Loan - To - Cost Range (3) Risk Rating Count 3/31/21 Tota l Pass/Watch 2,093 $ 3,758mm Special Mention 9 60mm Classified 5 5mm Total 2,107 $ 3,823mm

Fixed Income Investor Presentation | Pacific Western Bank | p. 16 Construction & Land Loans (1) Excludes $717mm of land and Civic commitments. (2) 59% of loans with LTC > 70% are for low income housing projects. Note: Reflects consolidated financial data; Bank - level financials in appendix Multi - Family Apts, 58% Condominiums , 4% Hotel , 11% Office, 5% Industrial , 3% Retail , 2% Mixed - Use, 3% Land & Other, 6% SFR , 8% Commitments by Property Type Nevada , 4% Other, 10% Florida, 6% Wash. DC, 3% New York, 9% Colorado 6% Washington, 3% California , 53%% Georgia, 3% Virginia , 3% Commitments by State Commitment Amount Count 3/31/21 Tota l 3/31/21 % of Tota l $0 ~ $10mm 102 $ 933mm 14% $10mm ~ $25mm 66 1,043mm 16% $25mm ~ $50mm 45 1,696mm 26% $50mm ~ $100mm 28 1,863mm 28% $100mm ~ $150mm 9 1,059mm 16% Total 250 $ 6,594mm LTC < 40 %, 4% LTC 40% - 50%, 9% LTC 50% - 60%, 47% LTC 60% - 70%, 25% LTC > 70%, 15% (2) Commitments By Loan - To - Cost Range (1) Risk Rating Count 3/31/21 Tota l Pass/Watch 243 $ 3,498mm Special Mention 4 67mm Classified 3 1mm Total 250 $ 3,566mm

Fixed Income Investor Presentation | Pacific Western Bank | p. 17 Diversified Investment Portfolio (1) Fair value at 3/31/21 (2) Yield is for 1Q21 (3) Not rated category comprised primarily of not rated revenue bonds backed by an underlying agency security or CRA - related revenue bonds . Note: Reflects consolidated financial data; Bank - level financials in appendix Asset - backed Securities , $224mm , 4% Agency Residential MBS , $433mm , 7% Agency Residential CMOs , $1,109mm , 19% Agency Commercial MBS , $1,273mm , 22% U.S. Treasuries , $491mm , 8% Corporate Securities , $380mm , 6% Municipal Securities , $1,646mm , 28% Collateralized Loan Obligations , $244mm , 4% Other, $140mm , 2% $5.9 Billion Total Investment Portfolio (1) 6.1 6.4 6.6 6.7 6.9 3.5 3.6 3.8 4.5 4.8 2 3 4 5 6 7 8 1Q20 2Q20 3Q20 4Q20 1Q21 Years Average Life and Effective Duration Average Life Effective Duration S&P Ratings % Total Issue Type % Total AAA 33% G.O. Limited 5% AA 65% G.O . Unlimited 76% A 1% Revenue 19% Not Rated (3) 1% 100% 100% 2.44% overall portfolio tax equivalent yield (2) Municipal Securities Composition
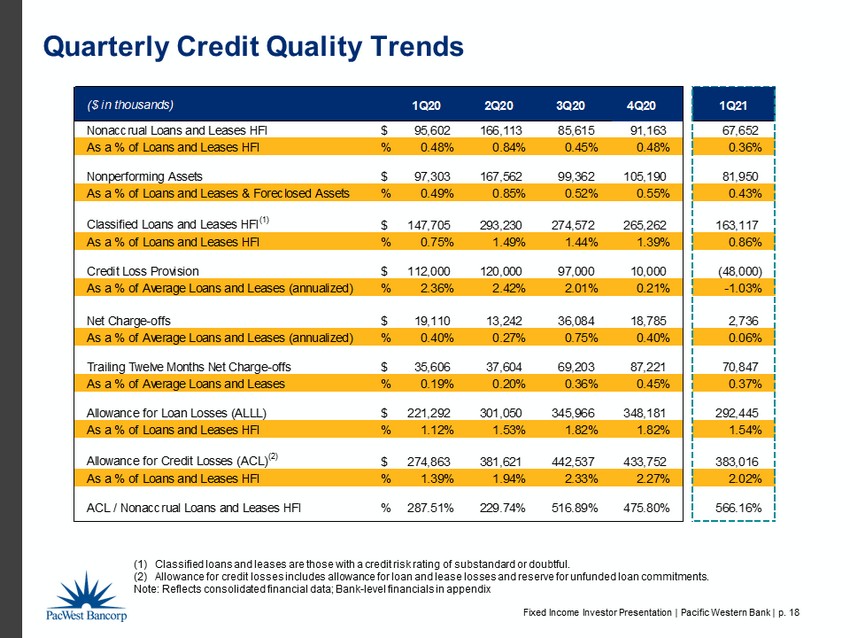
Fixed Income Investor Presentation | Pacific Western Bank | p. 18 Quarterly Credit Quality Trends (1) Classified loans and leases are those with a credit risk rating of substandard or doubtful. (2) Allowance for credit losses includes allowance for loan and lease losses and reserve for unfunded loan commitments. Note: Reflects consolidated financial data; Bank - level financials in appendix ($ in thousands) 1Q20 2Q20 3Q20 4Q20 1Q21 Nonaccrual Loans and Leases HFI $ 95,602 166,113 85,615 91,163 67,652 As a % of Loans and Leases HFI % 0.48% 0.84% 0.45% 0.48% 0.36% Nonperforming Assets $ 97,303 167,562 99,362 105,190 81,950 As a % of Loans and Leases & Foreclosed Assets % 0.49% 0.85% 0.52% 0.55% 0.43% Classified Loans and Leases HFI (1) $ 147,705 293,230 274,572 265,262 163,117 As a % of Loans and Leases HFI % 0.75% 1.49% 1.44% 1.39% 0.86% Credit Loss Provision $ 112,000 120,000 97,000 10,000 (48,000) As a % of Average Loans and Leases (annualized) % 2.36% 2.42% 2.01% 0.21% -1.03% Net Charge-offs $ 19,110 13,242 36,084 18,785 2,736 As a % of Average Loans and Leases (annualized) % 0.40% 0.27% 0.75% 0.40% 0.06% Trailing Twelve Months Net Charge-offs $ 35,606 37,604 69,203 87,221 70,847 As a % of Average Loans and Leases % 0.19% 0.20% 0.36% 0.45% 0.37% Allowance for Loan Losses (ALLL) $ 221,292 301,050 345,966 348,181 292,445 As a % of Loans and Leases HFI % 1.12% 1.53% 1.82% 1.82% 1.54% Allowance for Credit Losses (ACL) (2) $ 274,863 381,621 442,537 433,752 383,016 As a % of Loans and Leases HFI % 1.39% 1.94% 2.33% 2.27% 2.02% ACL / Nonaccrual Loans and Leases HFI % 287.51% 229.74% 516.89% 475.80% 566.16%
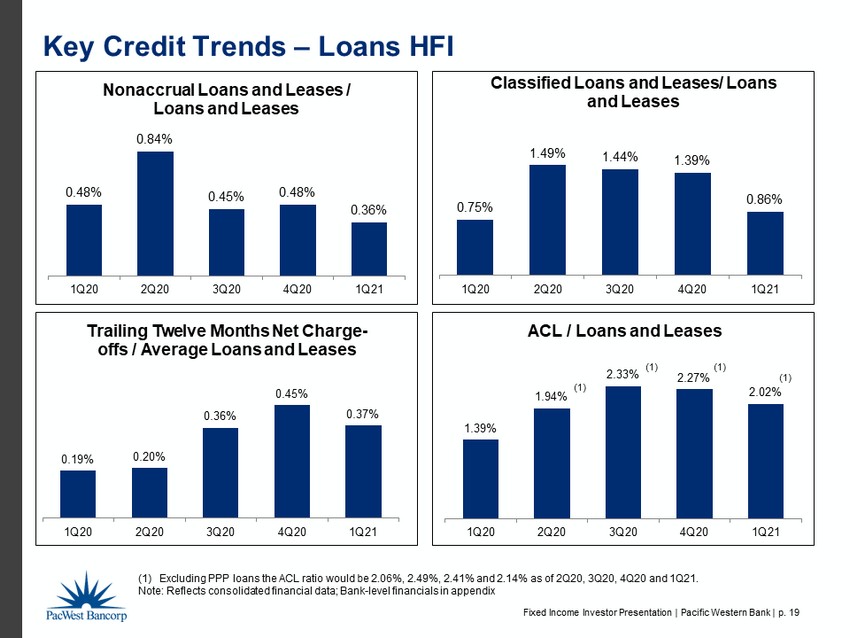
Fixed Income Investor Presentation | Pacific Western Bank | p. 19 Key Credit Trends – Loans HFI (1) (1) Excluding PPP loans the ACL ratio would be 2.06%, 2.49%, 2.41% and 2.14% as of 2Q20, 3Q20, 4Q20 and 1Q21. Note: Reflects consolidated financial data; Bank - level financials in appendix (1) (1) 0.19% 0.20% 0.36% 0.45% 0.37% 1Q20 2Q20 3Q20 4Q20 1Q21 Trailing Twelve Months Net Charge - offs / Average Loans and Leases 0.48% 0.84% 0.45% 0.48% 0.36% 1Q20 2Q20 3Q20 4Q20 1Q21 Nonaccrual Loans and Leases / Loans and Leases 1.39% 1.94% 2.33% 2.27% 2.02% 1Q20 2Q20 3Q20 4Q20 1Q21 ACL / Loans and Leases (1) 0.75% 1.49% 1.44% 1.39% 0.86% 1Q20 2Q20 3Q20 4Q20 1Q21 Classified Loans and Leases/ Loans and Leases
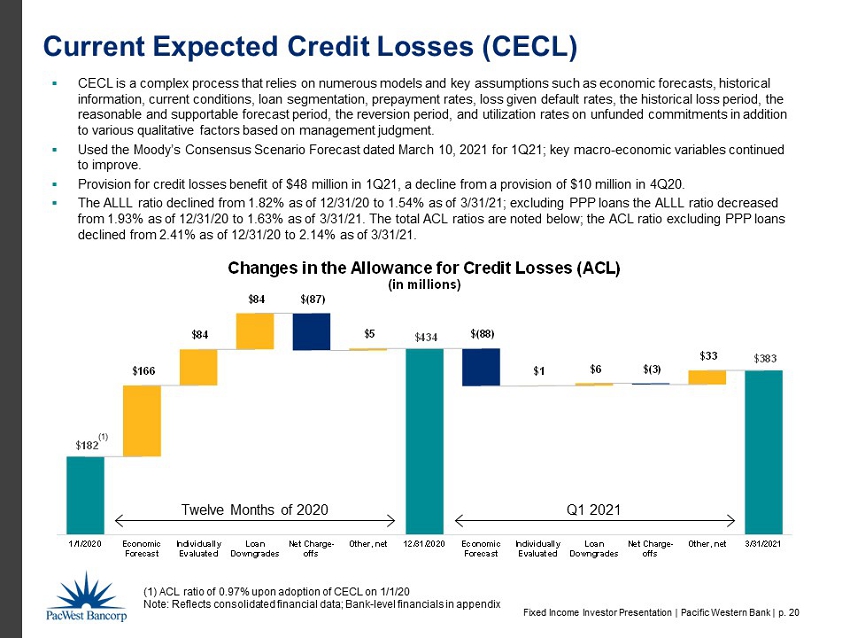
Fixed Income Investor Presentation | Pacific Western Bank | p. 20 Current Expected Credit Losses (CECL) 0.97% 2.27 % 2.02 % Twelve Months of 2020 Q1 2021 Note: ACL ratio of 0.97% upon adoption of CECL on 1/1/20 Reflects consolidated financial data; Bank - level financials in appendix $182 $434 $383 $166 $84 $84 $(87) $5 $(88) $1 $6 $(3) $33 1/1/2020 Economic Forecast Individually Evaluated Loan Downgrades Net Charge- offs Other, net 12/31/2020 Economic Forecast Individually Evaluated Loan Downgrades Net Charge- offs Other, net 3/31/2021 Changes in the Allowance for Credit Losses (ACL) (in millions) ▪ CECL is a complex process that relies on numerous models and key assumptions such as economic forecasts, historical information, current conditions, loan segmentation, prepayment rates, loss given default rates, the historical loss period, t he reasonable and supportable forecast period, the reversion period, and utilization rates on unfunded commitments in addition to various qualitative factors based on management judgment. ▪ Used the Moody’s Consensus Scenario Forecast dated March 10, 2021 for 1Q21; key macro - economic variables continued to improve. ▪ Provision for credit losses benefit of $48 million in 1Q21, a decline from a provision of $10 million in 4Q20. ▪ The ALLL ratio declined from 1.82% as of 12/31/20 to 1.54% as of 3/31/21; excluding PPP loans the ALLL ratio decreased from 1.93% as of 12/31/20 to 1.63% as of 3/31/21. The total ACL ratios are noted below; the ACL ratio excluding PPP loans declined from 2.41% as of 12/31/20 to 2.14% as of 3/31/21.

Fixed Income Investor Presentation | Pacific Western Bank | p. 21 0.59% 0.25% 0.17% 0.14% 0.11% 0.64% 0.40% 0.31% 0.23% 1Q20 2Q20 3Q20 4Q20 1Q21 Cost of Total Deposits PACW Avg. Total Deposits Cost KRX Median Deposits Cost 5.54% 5.01% 5.00% 5.15% 5.21% 5.44% 4.96% 4.96% 5.07% 5.09% 4.55% 4.02% 3.89% 4.00% 1Q20 2Q20 3Q20 4Q20 1Q21 Loan Yield (TE) PACW TE Avg. PACW Excl. Discount Accretion KRX Median 4.31% 4.20% 3.90% 3.83% 3.69% 3.34% 3.12% 3.03% 3.12% 1Q20 2Q20 3Q20 4Q20 1Q21 Net Interest Margin (TE) PACW Reported TE NIM KRX Median NIM $249.7mm $254.3mm $251.3mm $259.2mm $261.3mm 1Q20 2Q20 3Q20 4Q20 1Q21 Net Interest Income Industry Leading Tax Equivalent Net Interest Margin Source: S&P Global Market Intelligence. Peer data is through 4Q20. Peer group is banks in the KBW Nasdaq Regional Bank Index – “KRX”. Note: Reflects consolidated financial data; Bank - level financials in appendix
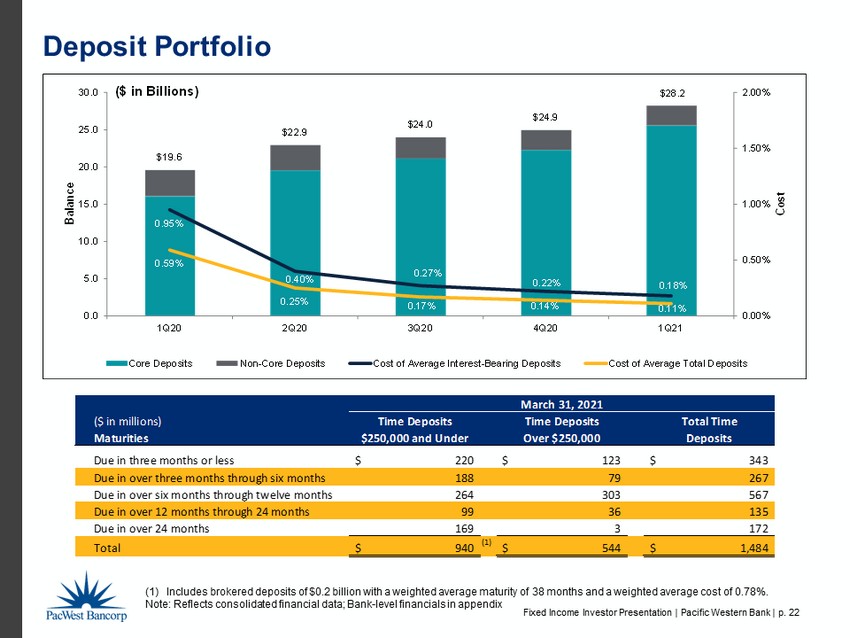
Fixed Income Investor Presentation | Pacific Western Bank | p. 22 ($ in millions) Time Deposits Time Deposits Total Time Maturities $250,000 and Under Over $250,000 Deposits Due in three months or less 220$ 123$ 343$ Due in over three months through six months 188 79 267 Due in over six months through twelve months 264 303 567 Due in over 12 months through 24 months 99 36 135 Due in over 24 months 169 3 172 Total 940$ (1) 544$ 1,484$ March 31, 2021 $19.6 $22.9 $24.0 $24.9 $28.2 0.95% 0.40% 0.27% 0.22% 0.18% 0.59% 0.25% 0.17% 0.14% 0.11% 0.00% 0.50% 1.00% 1.50% 2.00% 0.0 5.0 10.0 15.0 20.0 25.0 30.0 1Q20 2Q20 3Q20 4Q20 1Q21 Cost Balance ($ in Billions) Core Deposits Non-Core Deposits Cost of Average Interest-Bearing Deposits Cost of Average Total Deposits Deposit Portfolio (1) Includes brokered deposits of $0.2 billion with a weighted average maturity of 38 months and a weighted average cost of 0.78%. Note: Reflects consolidated financial data; Bank - level financials in appendix

Fixed Income Investor Presentation | Pacific Western Bank | p. 23 Interest Rate Components of the Loan and Lease Portfolio $729mm $1,325mm $1,529mm $4,766mm 1 Year 2 Years 3 Years > 3 Years Fixed/Hybrid Years to Maturity/Repricing Fixed - Rate , 28% Variable - Rate, 56% Hybrid , 16%, Loan Portfolio by Repricing Type 0% 10% 20% 30% 40% 50% 60% 70% 80% 90% - 2.00 4.00 6.00 8.00 10.00 Floor is "In the Money" Now Increase 50 bps Increase 100 bps Increase 150 bps Increase 200 bps Increase 250 bps Increase 300 bps % of Variable Rate Loans Cumulative Balance ($ bn’s ) Billions Amount of Rate Increase Floor Analysis - Variable Rate Loans as of March 31, 2021 Loan Book % of Total Variable ($ in millions) Variable Loans by Rate Index Amount % of Total Variable 1 - month LIBOR $5,497 2 - month LIBOR - 3 - month LIBOR 155 6 - month LIBOR 217 12 - month LIBOR 7 Total LIBOR - based Loans $5,876 55% Prime Rate 3,219 30% Other Index 1,637 15% Total Variable Loans $10,732 100% Note: Reflects consolidated financial data; Bank - level financials in appendix
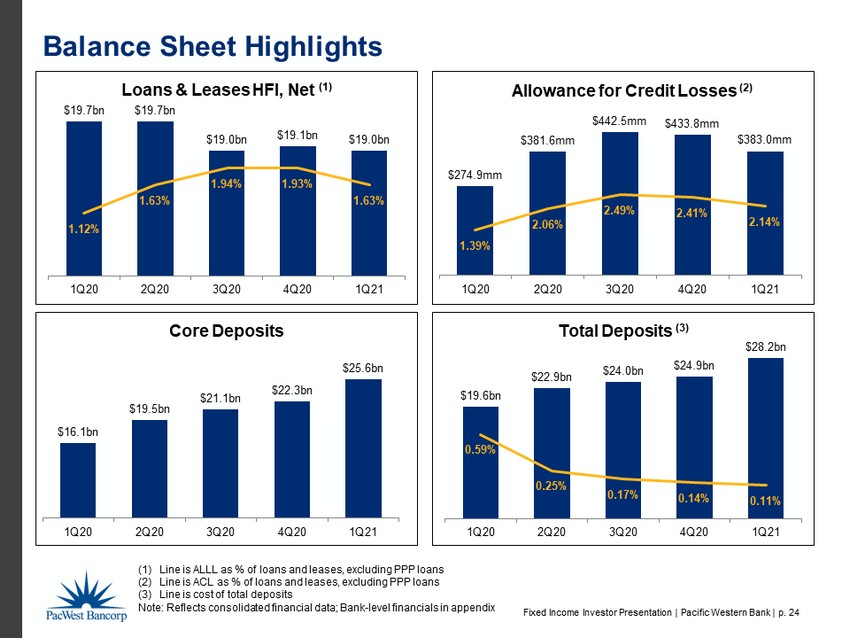
Fixed Income Investor Presentation | Pacific Western Bank | p. 24 $16.1bn $19.5bn $21.1bn $22.3bn $25.6bn 1Q20 2Q20 3Q20 4Q20 1Q21 Core Deposits Balance Sheet Highlights $19.7bn $19.7bn $19.0bn $19.1bn $19.0bn 1.12% 1.63% 1.94% 1.93% 1.63% 1Q20 2Q20 3Q20 4Q20 1Q21 Loans & Leases HFI, Net (1) $19.6bn $22.9bn $24.0bn $24.9bn $28.2bn 0.59% 0.25% 0.17% 0.14% 0.11% 1Q20 2Q20 3Q20 4Q20 1Q21 Total Deposits (3) $274.9mm $381.6mm $442.5mm $433.8mm $383.0mm 1.39% 2.06% 2.49% 2.41% 2.14% 1Q20 2Q20 3Q20 4Q20 1Q21 Allowance for Credit Losses (2) (1) Line is ALLL as % of loans and leases, excluding PPP loans (2) Line is ACL as % of loans and leases, excluding PPP loans (3) Line is cost of total deposits Note: Reflects consolidated financial data; Bank - level financials in appendix
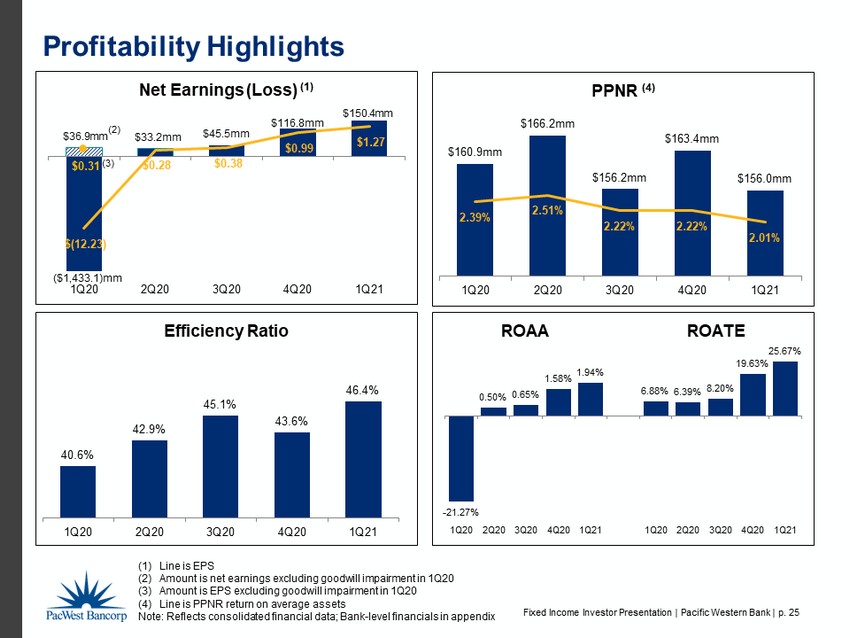
Fixed Income Investor Presentation | Pacific Western Bank | p. 25 40.6% 42.9% 45.1% 43.6% 46.4% 1Q20 2Q20 3Q20 4Q20 1Q21 Efficiency Ratio Profitability Highlights ($1,433.1)mm $33.2mm $45.5mm $116.8mm $150.4mm $36.9mm $(12.23) $0.28 $0.38 $0.99 $1.27 $0.31 1Q20 2Q20 3Q20 4Q20 1Q21 Net Earnings (Loss) (1) (3) - 21.27% 0.50% 0.65% 1.58% 1.94% 6.88% 6.39% 8.20% 19.63% 25.67% 1Q20 2Q20 3Q20 4Q20 1Q21 1Q20 2Q20 3Q20 4Q20 1Q21 ROAA ROATE $160.9mm $166.2mm $156.2mm $163.4mm $156.0mm 2.39% 2.51% 2.22% 2.22% 2.01% 1Q20 2Q20 3Q20 4Q20 1Q21 PPNR (4) (1) Line is EPS (2) Amount is net earnings excluding goodwill impairment in 1Q20 (3) Amount is EPS excluding goodwill impairment in 1Q20 (4) Line is PPNR return on average assets Note: Reflects consolidated financial data; Bank - level financials in appendix (2)
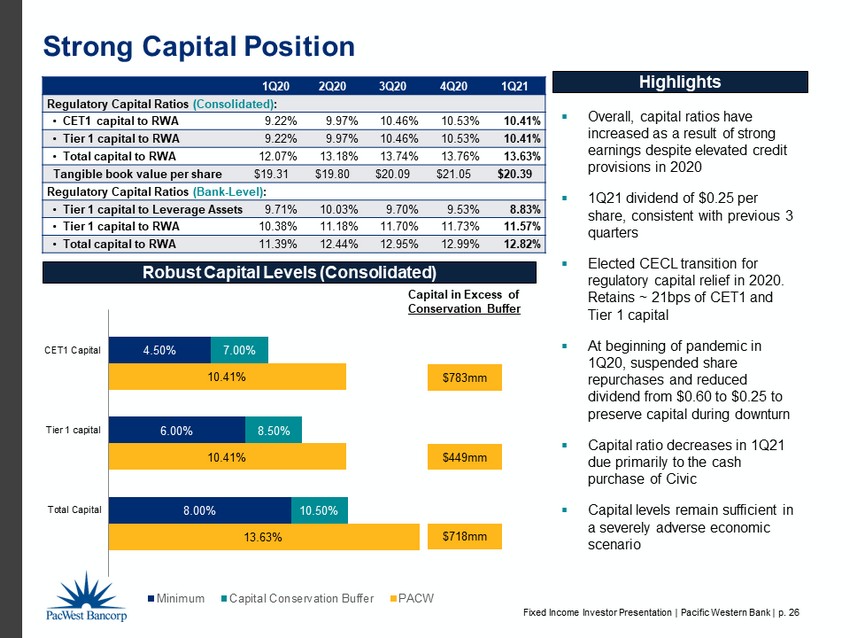
Fixed Income Investor Presentation | Pacific Western Bank | p. 26 8.00% 6.00% 4.50% 10.50% 8.50% 7.00% 13.63% 10.41% 10.41% Total Capital Tier 1 capital CET1 Capital Minimum Capital Conservation Buffer PACW Strong Capital Position 1Q20 2Q20 3Q20 4Q20 1Q21 Regulatory Capital Ratios (Consolidated) : • CET1 capital to RWA 9.22% 9.97% 10.46% 10.53% 10.41% • Tier 1 capital to RWA 9.22% 9.97% 10.46% 10.53% 10.41% • Total capital to RWA 12.07% 13.18% 13.74% 13.76% 13.63% Tangible book value per share $19.31 $19.80 $20.09 $21.05 $20.39 Regulatory Capital Ratios (Bank - Level) : • Tier 1 capital to Leverage Assets 9.71% 10.03% 9.70% 9.53% 8.83% • Tier 1 capital to RWA 10.38% 11.18% 11.70% 11.73% 11.57% • Total capital to RWA 11.39% 12.44% 12.95% 12.99% 12.82% Robust Capital Levels (Consolidated) Highlights ▪ Overall, capital ratios have increased as a result of strong earnings despite elevated credit provisions in 2020 ▪ 1Q21 dividend of $0.25 per share, consistent with previous 3 quarters ▪ Elected CECL transition for regulatory capital relief in 2020. Retains ~ 21bps of CET1 and Tier 1 capital ▪ At beginning of pandemic in 1Q20, suspended share repurchases and reduced dividend from $0.60 to $0.25 to preserve capital during downturn ▪ Capital ratio decreases in 1Q21 due primarily to the cash purchase of Civic ▪ Capital levels remain sufficient in a severely adverse economic scenario $783mm $449mm $718mm Capital in Excess of Conservation Buffer

Fixed Income Investor Presentation | Pacific Western Bank | p. 27 Conclusion x Strategy focused on soundness, profitability and growth, in that order x Management and company track - record of delivering above peer financial results to all stakeholders and superior service to customers x Long history of diversified balance sheet coupled with conservative credit and underwriting standards x Well - positioned market share in niche businesses provides opportunity to further expand and grow x Continue to drive growth and increase bottom - line profitability via M&A and organic initiatives

Fixed Income Investor Presentation | Pacific Western Bank | p. 28 Appendix

Fixed Income Investor Presentation | Pacific Western Bank | p. 29 Bank Financial Information – Balance Sheet ($ in thousands) AS OF MARCH 31, 2021 Pacific Eliminations & PacWest Western Bank PacWest Other Adjustments Consolidated ASSETS Total cash and cash equivalents 5,691,043$ 135,155$ (131,332)$ 5,694,866$ Total investment securities 5,958,940 - - 5,958,940 Loans held for sale 25,554 - - 25,554 Total loans and leases, net 18,687,008 - (225) 18,686,783 Investment in banking subsidiaries - 3,576,817 (3,576,817) - Other assets 2,445,661 82,210 (37,481) 2,490,390 Total assets 32,808,206$ 3,794,182$ (3,745,855)$ 32,856,533$ LIABILITIES Total deposits 28,356,375$ –$ (133,084)$ 28,223,291$ Borrowings 69,750 - (50,000) 19,750 Subordinated debentures - 135,055 330,759 465,814 Other liabilities 468,071 4,990 20,480 493,541 Total liabilities 28,894,196$ 140,045$ 168,155$ 29,202,396$ STOCKHOLDERS' EQUITY Total stockholders' equity 3,914,010$ 3,654,137$ (3,914,010)$ 3,654,137$ Total liabilities and stockholders' equity 32,808,206$ 3,794,182$ (3,745,855)$ 32,856,533$

Fixed Income Investor Presentation | Pacific Western Bank | p. 30 Bank Financial Information – Income Statement ($ in thousands) QUARTER-TO-DATE MARCH 31, 2021 Pacific Eliminations & PacWest Western Bank PacWest Other Adjustments Consolidated Total interest income 271,508$ 85$ 1,744$ 273,337$ Total interest expense 7,777 887 3,404 12,068 Net interest income 263,731$ (802)$ (1,660)$ 261,269$ Provision for credit losses (48,008) - 8 (48,000) Total noninterest income 27,793 154,979 (137,943) 44,829 Total noninterest expense 146,762 3,170 204 150,136 Earnings (loss) before income taxes 192,770$ 151,007$ (139,815)$ 203,962$ Income taxes 50,749 601 2,206 53,556 Net earnings (loss) 142,021$ 150,406$ (142,021)$ 150,406$

Fixed Income Investor Presentation | Pacific Western Bank | p. 31 Non - GAAP Measurements The Company uses certain non - GAAP financial measures to provide meaningful supplemental information regarding the Company’s operational performance and to enhance investors’ overall understanding of such financial performance. These non - GAAP financial measures should not be considered a substitute for financial measures presented in accordance with GAAP and may be different from non - GAAP financial measures used by other companies. The table below presents reconciliations of certain GAAP to non - GAAP financial measures: (1) Tangible common equity divided by tangible assets (2) Tangible common equity divided by shares outstanding (3) Annualized adjusted net earnings divided by average tangible common equity Note: Reflects consolidated financial data; Bank - level financials in appendix ($ in thousands, except per share amounts) March 31, 2021 December 31, 2020 September 30, 2020 June 30, 2020 March 31, 2020 Tangible Common Equity Ratio & Tangible Book Value Per Share Stockholders' equity 3,654,137$ 3,594,951$ 3,486,231$ 3,452,898$ 3,390,389$ Less: Intangible assets 1,225,404 1,102,311 1,105,483 1,109,234 1,113,116 Tangible common equity 2,428,733$ 2,492,640$ 2,380,748$ 2,343,664$ 2,277,273$ Total assets 32,856,533$ 29,498,442$ 28,426,716$ 27,365,738$ 26,143,267$ Less: Intangible assets 1,225,404 1,102,311 1,105,483 1,109,234 1,113,116 Tangible assets 31,631,129$ 28,396,131$ 27,321,233$ 26,256,504$ 25,030,151$ Equity to assets ratio 11.12% 12.19% 12.26% 12.62% 12.97% Tangible common equity ratio (1) 7.68% 8.78% 8.71% 8.93% 9.10% Book value per share 30.68$ 30.36$ 29.42$ 29.17$ 28.75$ Tangible book value per share (2) 20.39$ 21.05$ 20.09$ 19.80$ 19.31$ Shares outstanding 119,105,642 118,414,853 118,489,927 118,374,603 117,916,789 Return on Average Tangible Equity Net earnings (loss) 150,406$ 116,830$ 45,503$ 33,204$ (1,433,111)$ Add: goodwill impairment - - - - 1,470,000 Add: intangible amortization 3,079 3,172 3,751 3,882 3,948 Adjusted net earnings 153,485$ 120,002$ 49,254$ 37,086$ 40,837$ Average stockholders' equity 3,617,248$ 3,536,425$ 3,497,869$ 3,446,850$ 4,956,778$ Less: Average intangible assets 1,192,780 1,103,945 1,107,548 1,111,302 2,569,189 Average tangible common equity 2,424,468$ 2,432,480$ 2,390,321$ 2,335,548$ 2,387,589$ Return on average equity 16.86% 13.14% 5.18% 3.87% -116.28% Return on average tangible equity (3) 25.67% 19.63% 8.20% 6.39% 6.88% (1) Tangible common equity divided by tangible assets (2) Tangible common equity divided by shares outstanding (3) Annualized adjusted net earnings divided by average tangible common equity

Fixed Income Investor Presentation | Pacific Western Bank | p. 32 Non - GAAP Measurements The table below presents reconciliations of certain GAAP to non - GAAP financial measures. PPNR represents pre - provision, pre - tax net revenues and excludes goodwill impairment. (1) Annualized net earnings (loss) divided by average assets (2) Annualized PPNR divided by average assets Note: Reflects consolidated financial data; Bank - level financials in appendix ($ in thousands) March 31, 2021 December 31, 2020 September 30, 2020 June 30, 2020 March 31, 2020 PPNR and PPNR Return on Average Assets Net earnings (loss) 150,406$ 116,830$ 45,503$ 33,204$ (1,433,111)$ Add: Provision for credit losses (48,000) 10,000 97,000 120,000 112,000 Add: Goodwill impairment - - - - 1,470,000 Add: Income tax expense 53,556 36,546 13,671 12,968 11,988 Pre-provision, pre-goodwill impairment, pre-tax revenue ("PPNR") 155,962$ 163,376$ 156,174$ 166,172$ 160,877$ Average assets 31,415,882$ 29,334,789$ 27,935,193$ 26,621,227$ 27,099,040$ Return on average assets (1) 1.94% 1.58% 0.65% 0.50% -21.27% PPNR return on average assets (2) 2.01% 2.22% 2.22% 2.51% 2.39% (1) Annualized net earnings (loss) divided by average assets (2) Annualized PPNR divided by average asets Three Months Ended
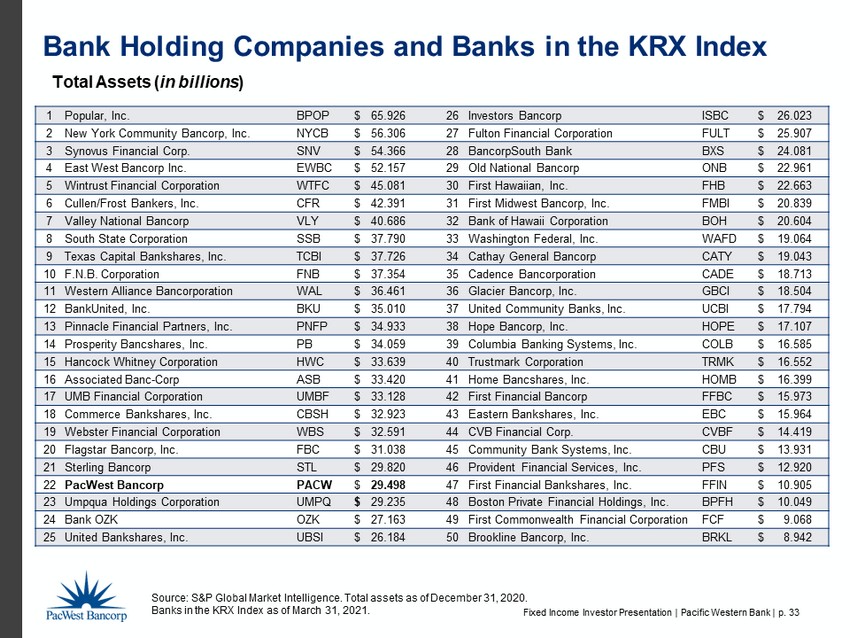
Fixed Income Investor Presentation | Pacific Western Bank | p. 33 Bank Holding Companies and Banks in the KRX Index Total Assets ( in billions ) Source: S&P Global Market Intelligence. Total assets as of December 31, 2020. Banks in the KRX Index as of March 31, 2021. 1 Popular, Inc. BPOP $ 65.926 26 Investors Bancorp ISBC $ 26.023 2 New York Community Bancorp, Inc. NYCB $ 56.306 27 Fulton Financial Corporation FULT $ 25.907 3 Synovus Financial Corp. SNV $ 54.366 28 BancorpSouth Bank BXS $ 24.081 4 East West Bancorp Inc. EWBC $ 52.157 29 Old National Bancorp ONB $ 22.961 5 Wintrust Financial Corporation WTFC $ 45.081 30 First Hawaiian, Inc. FHB $ 22.663 6 Cullen/Frost Bankers, Inc. CFR $ 42.391 31 First Midwest Bancorp, Inc. FMBI $ 20.839 7 Valley National Bancorp VLY $ 40.686 32 Bank of Hawaii Corporation BOH $ 20.604 8 South State Corporation SSB $ 37.790 33 Washington Federal, Inc. WAFD $ 19.064 9 Texas Capital Bankshares , Inc. TCBI $ 37.726 34 Cathay General Bancorp CATY $ 19.043 10 F.N.B. Corporation FNB $ 37.354 35 Cadence Bancorporation CADE $ 18.713 11 Western Alliance Bancorporation WAL $ 36.461 36 Glacier Bancorp, Inc. GBCI $ 18.504 12 BankUnited , Inc. BKU $ 35.010 37 United Community Banks, Inc. UCBI $ 17.794 13 Pinnacle Financial Partners, Inc. PNFP $ 34.933 38 Hope Bancorp, Inc. HOPE $ 17.107 14 Prosperity Bancshares, Inc. PB $ 34.059 39 Columbia Banking Systems, Inc. COLB $ 16.585 15 Hancock Whitney Corporation HWC $ 33.639 40 Trustmark Corporation TRMK $ 16.552 16 Associated Banc - Corp ASB $ 33.420 41 Home Bancshares, Inc. HOMB $ 16.399 17 UMB Financial Corporation UMBF $ 33.128 42 First Financial Bancorp FFBC $ 15.973 18 Commerce Bankshares , Inc. CBSH $ 32.923 43 Eastern Bankshares , Inc. EBC $ 15.964 19 Webster Financial Corporation WBS $ 32.591 44 CVB Financial Corp. CVBF $ 14.419 20 Flagstar Bancorp, Inc. FBC $ 31.038 45 Community Bank Systems, Inc. CBU $ 13.931 21 Sterling Bancorp STL $ 29.820 46 Provident Financial Services, Inc. PFS $ 12.920 22 PacWest Bancorp PACW $ 29.498 47 First Financial Bankshares , Inc. FFIN $ 10.905 23 Umpqua Holdings Corporation UMPQ $ 29.235 48 Boston Private Financial Holdings, Inc. BPFH $ 10.049 24 Bank OZK OZK $ 27.163 49 First Commonwealth Financial Corporation FCF $ 9.068 25 United Bankshares , Inc. UBSI $ 26.184 50 Brookline Bancorp, Inc. BRKL $ 8.942