Attached files
| file | filename |
|---|---|
| 8-K - FORM 8-K - CRAWFORD & CO | tm2113721d1_8k.htm |
Exhibit 99.1

Investor Presentation April 2021 CRD - A & CRD - B (NYSE)

2 Forward - Looking Statements and Additional Information Forward - Looking Statements This presentation contains forward - looking statements, including statements about the expected future financial condition, resul ts of operations and earnings outlook of Crawford & Company. Statements, both qualitative and quantitative, that are not statements of historical fact may be "forward - looking statements" as defined in the Private Securitie s Litigation Reform Act of 1995 and other securities laws. Forward - looking statements involve a number of risks and uncertainties that could cause actual results to differ materially from historical experience or Crawford & Company's pre sen t expectations. Accordingly, no one should place undue reliance on forward - looking statements, which speak only as of the date on which they are made. Crawford & Company does not undertake to update forward - looking statements to reflec t the impact of circumstances or events that may arise or not arise after the date the forward - looking statements are made. Results for any interim period presented herein are not necessarily indicative of results to be expected fo r the full year or for any other future period. For further information regarding Crawford & Company, and the risks and uncertainties involved in forward - looking statements, please read Crawford & Company's reports filed with the Securiti es and Exchange Commission and available at www.sec.gov or in the Investor Relations portion of Crawford & Company's website at https://ir.crawco.com. Crawford's business is dependent, to a significant extent, on case volumes. The Company cannot predict the future trend of ca se volumes for a number of reasons, including the fact that the frequency and severity of weather - related claims and the occurrence of natural and man - made disasters, which are a significant source of cases and revenue for the Company , are generally not subject to accurate forecasting. Revenues Before Reimbursements ("Revenues") Revenues Before Reimbursements are referred to as "Revenues" in both consolidated and segment charts, bullets and tables thro ugh out this presentation. Segment and Consolidated Operating Earnings Under the Financial Accounting Standards Board's Accounting Standards Codification ("ASC") Topic 280, "Segment Reporting," th e C ompany has defined segment operating earnings as the primary measure used by the Company to evaluate the results of each of its three operating segments. Segment operating earnings represent segment earnings, includin g t he direct and indirect costs of certain administrative functions required to operate our business, but excludes unallocated corporate and shared costs and credits, net corporate interest expense, stock option expense, amortizati on of customer - relationship intangible assets, goodwill impairment, certain tax valuation allowances, restructuring and other costs, arbitration and claim settlements, gain on disposition of businesses, income taxes and net inc ome or loss attributable to noncontrolling interests and redeemable noncontrolling interests. Earnings Per Share The Company's two classes of stock are substantially identical, except with respect to voting rights and the Company's abilit y t o pay greater cash dividends on the non - voting Class A Common Stock than on the voting Class B Common Stock, subject to certain limitations. In addition, with respect to mergers or similar transactions, holders of Class A Commo n S tock must receive the same type and amount of consideration as holders of Class B Common Stock, unless different consideration is approved by the holders of 75% of the Class A Common Stock, voting as a class. In certain periods, the Company has paid a higher dividend on CRD - A than on CRD - B. This may result in a different earnings per s hare ("EPS") for each class of stock due to the two - class method of computing EPS as required by ASC Topic 260 - "Earnings Per Share". The two - class method is an earnings allocation method under which EPS is calculated for each class o f common stock considering both dividends declared and participation rights in undistributed earnings as if all such earnings had been distributed during the period. Segment Gross Profit Segment gross profit is defined as revenues, less direct costs, which exclude indirect centralized administrative support cos ts allocated to the business. Indirect expenses consist of centralized administrative support costs, regional and local shared services that are allocated to each segment based on usage. Non - GAAP Financial Information For additional information about certain non - GAAP financial information presented herein, see the Appendix following this presen tation.

3 Strategic Pillars Our Purpose Restoring and enhancing lives, businesses and communities. Our Values Our purpose is embedded in our values – to RESTORE is part of everything we do. espect mpowerment ustainability raining ne Crawford ecognition ntrepreneurial Spirit
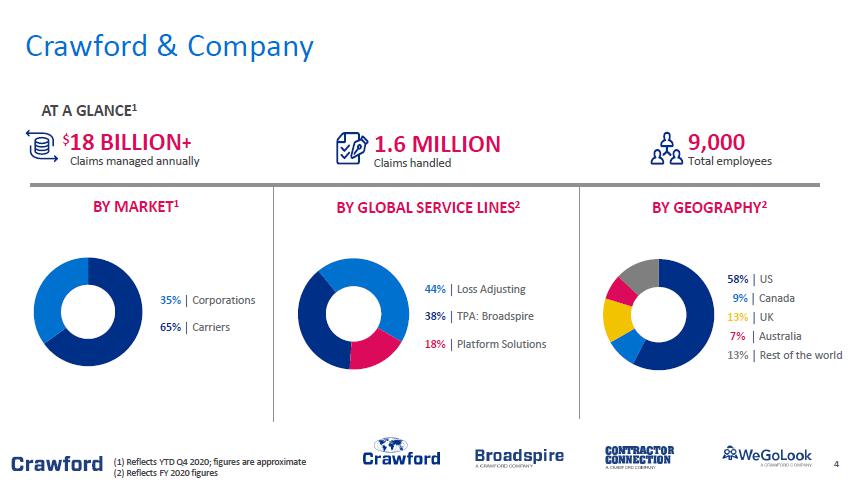
4 Crawford & Company AT A GLANCE 1 $ 18 BILLION + Claims managed annually 1.6 MILLION Claims handled 9,000 Total employees (1) Reflects YTD Q4 2020; figures are approximate (2) Reflects FY 2020 figures BY GEOGRAPHY 2 58% ⎹ US 9% ⎹ Canada 13% ⎹ UK 7% ⎹ Australia 13% ⎹ Rest of the world BY GLOBAL SERVICE LINES 2 44% ⎹ Loss Adjusting 38% ⎹ TPA: Broadspire 18% ⎹ Platform Solutions BY MARKET 1 35% ⎹ Corporations 65% ⎹ Carriers
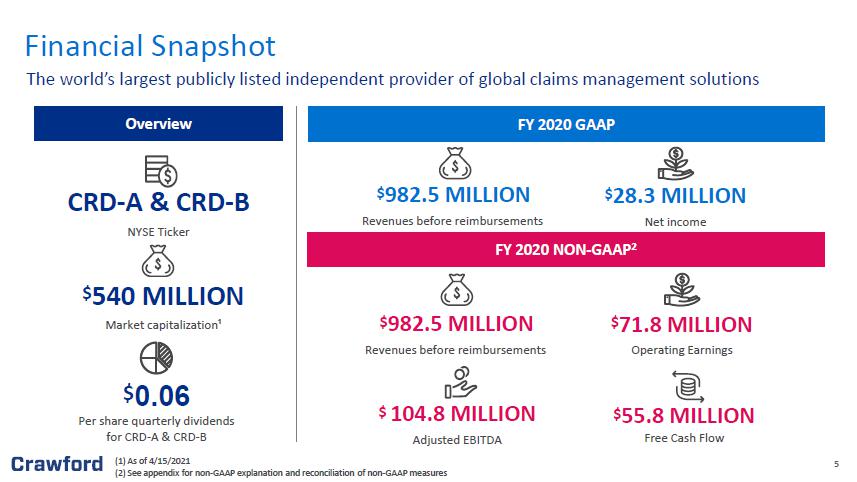
5 (1) As of 4/15/2021 ( 2 ) See appendix for non - GAAP explanation and reconciliation of non - GAAP measures Overview FY 2020 GAAP FY 2020 NON - GAAP 2 $ 540 MILLION Market capitalization¹ Financial Snapshot The world’s largest publicly listed independent provider of global claims management solutions $ 982.5 MILLION Revenues before reimbursements $ 55.8 MILLION Free Cash Flow $ 71.8 MILLION Operating Earnings $ 982.5 MILLION Revenues before reimbursements $ 28.3 MILLION Net income $ 104.8 MILLION Adjusted EBITDA CRD - A & CRD - B NYSE Ticker $ 0.06 Per share quarterly dividends for CRD - A & CRD - B

6 6 Loss Adjusting Third Party Administration Managed Repair Medical Management On - Demand Services Catastrophe Response We bring together thoughtful experts from around the world to offer comprehensive, intelligent solutions to our customers The Crawford brands offer high - quality and technologically advanced solutions to clients Market Leading Solutions

7 7 Loss Adjusting TPA: Broadspire Platform Solutions Volume and Large or Complex Claims Global Third Party Administration Networks Manage Repair Services $10B+ Indemnity Dollars $1.0B Managed Medical Spend 175,000+ Claims Calls Handled $3.0B Total Project Costs ~315,000 Claims Managed $3.3B Claims Paid 7,000+ Licensed and Trained Catastrophe Resources 440,000+ Assignments 2,500 Claims Professionals 813,000 Claims Managed 45,000+ On Demand Resources 6,000 General/Specialty Contractors 700+ Executive General Adjusters 25 Years Average Experience 50%+ Fortune 250 Corporations Served (1) All figures are approximate annually Scope and Scale of Operations Comprehensive experience across the spectrum of the claims world¹

8 8 Attractive investment profile Experienced leadership team Strategically positioned in a rapidly changing industry Investing to drive innovation and accelerate growth Committed to environmental, social and governance initiatives Financial strength and flexibility Why Invest in Crawford? Crawford’s leading market position in an evolving landscape provides a compelling investment narrative

9 9 Attractive Investment Profile Investment Profile | Leadership Team| Strategically Positioned | Driving Innovation and Growth| ESG | Financial Strength and Flexibility Technology - Enabled BPO Platform Strong Cash Flow Generation Recurring Fee for Service Revenue Model Blue - Chip Global Client Base Solid Balance Sheet and Low Debt Profile Healthy Dividend Yield Global Product and Geographic Diversification Competitive Market Position

10 10 Rohit Verma Chief Executive Officer Joseph Blanco President Bruce Swain Chief Financial Officer Tami Stevenson Senior Vice President, Global General Counsel Bonnie Sawdey Chief People Officer Mike Jones President, TPA: Broadspire, International Mike Hoberman President TPA: Broadspire, North America Pat Van Bakel President, Loss Adjusting, North America Larry Thomas Global President, Platform Solutions Andrew Bart Pr esident, Loss Adjusting, International Benedict Burke Chief Client Officer, Global Client Development Experienced Leadership Team Investment Profile | Leadership Team | Strategically Positioned | Driving Innovation and Growth| ESG | Financial Strength and Flexibility Leadership team with an average of 30+ years of experience

11 Description Customers Strategy • Adjust individual claims • Claim sizes vary from $500 to $5+ billion • Two units: 1. Large and complex claims (GTS) 2. Volume claims • Carriers of all sizes • MGAs • Lloyds • Benchmark in quality and expertize • Digitally enabled for efficiency • Broadest global reach • Large and complex: Grow by investing in expertise • Volume claims: Improve margin through efficiency • Third party administration, across workers compensation, liability, accident and health, disability and medical management claims • Legal services such as recovery, fraud and litigation • Corporations, municipalities • MGAs, captives • Small - to mid - size carriers • Industry leading data and analytics for improved claims outcomes • Intense digitization to improve adjuster and customer experience • Margin enhancement through digitization and scaling • Alternative channel to loss adjusting services • Marketplace for existing and new disruptive services • Two units: 1. Managed Repair (CCC) 2. Network businesses (E.g., CAT, WGL, Crawford Inspection Services) • Carriers of all sizes • MGAs • Lloyds • Most comprehensive alternatives in industry to traditional loss adjusting approaches • New markets and capabilities enabled by tech, built on years of claims experience • Drive growth through scaling businesses with compelling transactional economics LOSS ADJUSTING TPA PLATFORMS Evolving Crawford’s Strategy for Long - term Growth Investment Profile | Leadership Team| Strategically Positioned | Driving Innovation and Growth| ESG | Financial Strength and Flexibility Strategic evolution to reimagine claims ecosystem
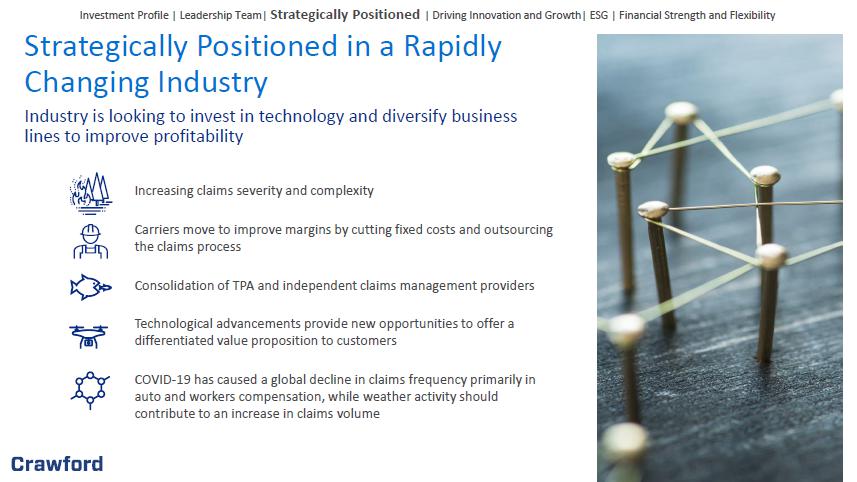
12 12 Industry is looking to invest in technology and diversify business lines to improve profitability Increasing claims severity and complexity Carriers move to improve margins by cutting fixed costs and outsourcing the claims process Consolidation of TPA and independent claims management providers Technological advancements provide new opportunities to offer a differentiated value proposition to customers COVID - 19 has caused a global decline in claims frequency primarily in auto and workers compensation, while weather activity should contribute to an increase in claims volume Strategically Positioned in a Rapidly Changing Industry Investment Profile | Leadership Team| Strategically Positioned | Driving Innovation and Growth| ESG | Financial Strength and Flexibility

13 13 More Frequent and Destructive CAT Events Leading to Heightened Insured Losses Catastrophe - related insured losses (1970 - 2020) 1 (1) SwissRe Investment Profile | Leadership Team| Strategically Positioned | Driving Innovation and Growth| ESG | Financial Strength and Flexibility
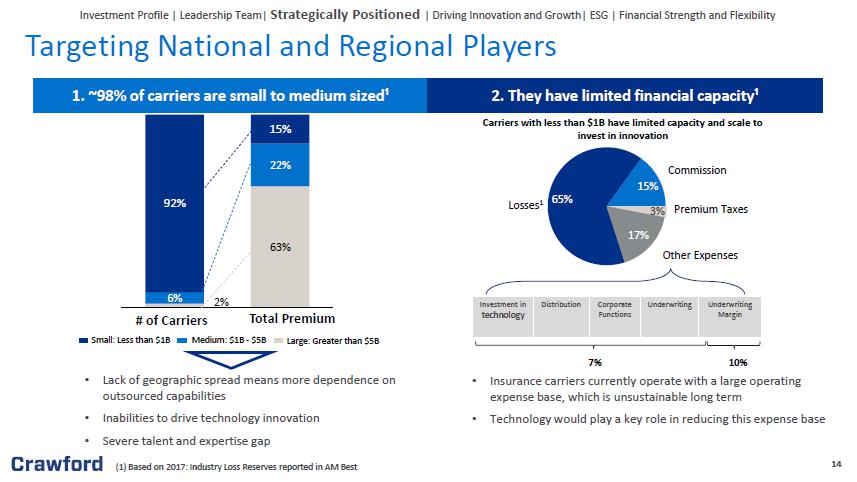
14 14 2 % 63 % 6% 22% 92% 15% # of Carriers Total Premium Medium: $1B - $5B Small: Less than $1B Large: Greater than $5B 1. ~98% of carriers are small to medium sized¹ 2. They have limited financial capacity¹ • Insurance carriers currently operate with a large operating expense base, which is unsustainable long term • Technology would play a key role in reducing this expense base 65% 15% 17% Losses 1 Commission Premium Taxes Other Expenses Investment in technology Distribution Corporate Functions Underwriting Underwriting Margin Carriers with less than $1B have limited capacity and scale to invest in innovation 10% 7% • Lack of geographic spread means more dependence on outsourced capabilities • Inabilities to drive technology innovation • Severe talent and expertise gap Targeting National and Regional Players Investment Profile | Leadership Team| Strategically Positioned | Driving Innovation and Growth| ESG | Financial Strength and Flexibility (1) Based on 2017: Industry Loss Reserves reported in AM Best 3%

15 15 Investing to Drive Innovation and Accelerate Growth Investment Profile | Leadership Team| Strategically Positioned | Driving Innovation and Growth | ESG | Financial Strength and Flexibility At the forefront of technological disruption while maintaining industry leadership position (1) YouGoLook ¹
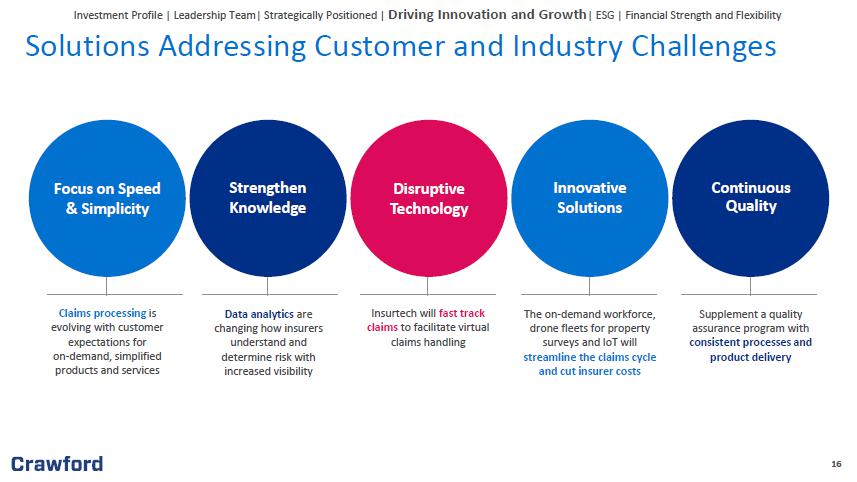
16 16 Solutions Addressing Customer and Industry Challenges Focus on Speed & Simplicity Strengthen Knowledge Disruptive Technology Innovative Solutions Continuous Quality Claims processing is evolving with customer expectations for on - demand, simplified products and services Data analytics are changing how insurers understand and determine risk with increased visibility Insurtech will fast track claims to facilitate virtual claims handling The on - demand workforce, drone fleets for property surveys and IoT will streamline the claims cycle and cut insurer costs Supplement a quality assurance program with consistent processes and product delivery Investment Profile | Leadership Team| Strategically Positioned | Driving Innovation and Growth | ESG | Financial Strength and Flexibility

17 17 United States 1 Q2 2020 Q3 2020 Q4 2020 Unemployment rate 11.1% 7.9% 6.7% Miles driven (B) 198.3 242.5 (22.3%) 246.8 (1.8%) Housing starts (000’s) 1,079.0 1,432.3 (33%) 1,537.5 (7.4%) Retail sales ($B) 476.9 544.0 (14.1%) 549.5 (1.0%) UK Q2 2020 Q3 2020 Q4 2020 Unemployment rate 4.0% 4.8% 4.9% Housing starts (000’s) 16.9 35.7 (111%) - Retail sales (£B) 32.2 37.7 (17.1%) 35.0 ( - 7.2%) US Economic Outlook (1) Source: Federal Reserve Bank of St. Louis, U.S. Bureau of Labor Statistics, United States Census Bureau Notes: Miles driven, Housing starts, permits and Retail sales displayed are monthly averages for the quarter, Q4 Miles driven is for the month of Oct based on latest data available, Q4 Retail sales and Housing Starts (except for UK whi ch is the total quarterly data) is the average of Oct and Nov based on latest data available. Recent data on UK housing starts is not available. • Formed a global incident response team and modified sick leave policies • Weekly health and safety updates globally • Physical and mental health and wellness programs across various countries • Working parents support group on Intranet • Conduced COVID - 19 response surveys Estimate COVID - 19 negatively impacted revenues in the range of $45.0 - $55.0 million through 2020 fourth quarter Our Response to COVID - 19 Investment Profile | Leadership Team| Strategically Positioned | Driving Innovation and Growth| ESG | Financial Strength and Flexibility Favorable Flat Unfavorable compared to prior quarter Continuing to demonstrate resilience despite the significant challenges presented by COVID - 19

18 Diversity and Inclusion Established Office of Inclusion and Diversity, Employee Resource Groups, and an Employee Advisory Council aligned with our purpose to foster a safe and inclusive working environment, where employees can bring their authentic selves to work and offer unique experiences and perspectives Human Capital Development Promote an environment where employees are empowered to grow, emboldened to act and inspired to innovate through internal programs and initiatives Environment Ensure processes are efficient and sustainable, and incorporate sustainability criteria into purchasing policies Community Involvement Give back to the communities we serve and responsibly steward our resources through donations to causes aligned with our mission Corporate Governance Committed to good corporate governance and maintaining the trust of our investors and other stakeholders, including our employees, clients and vendors Environmental, Social and Governance Investment Profile | Leadership Team| Strategically Positioned | Driving Innovation and Growth| ESG | Financial Strength and Flexibility Crawford believes in giving back to the communities we serve and responsibly stewarding our resources

19 Strong financial position with ample liquidity Reinstated share repurchase program as a component of our capital allocation strategy Financial Strength and Flexibility Investment Profile | Leadership Team| Strategically Positioned | Driving Innovation and Growth| ESG | Financial Strength and Flexibility (1) Reflects results as of 12/31/2020 24% 1.11x $ 0.19 increase in operating cash flow over last year¹ net funded debt - to - EBITDA, a seven - year low leverage ratio¹ CASH FLOW 2020 ¹ $93M $ 0.17 per share dividends paid for CRD - A in 2020¹ per share dividends paid for CRD - B in 2020¹ $37M capital expenditures in 2020¹ Proactively manage capital allocation across the business and adapt to opportunities

20 Investment Profile | Leadership Team| Strategically Positioned | Driving Innovation and Growth| ESG | Financial Strength and Flexibility Market Expansion Extending our market position through recent acquisitions and innovative solutions HBA Group • Acquired HBA Group in 2020, a legal services provider which complements the Crawford TPA Solutions segment in Australia and the larger Asia region Asservio • Launched Asservio in 2021, a bold innovation that will support the digital transformation of property claims • Improves efficiency, accuracy and consistency in the estimating process Crawford Carvallo • Acquired Crawford Carvallo in 2020, establishing Crawford as the largest loss adjusting company in Latin America
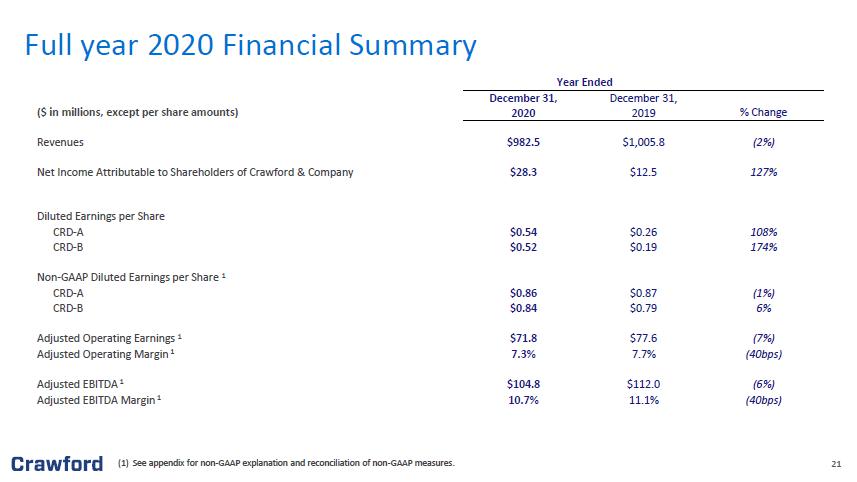
21 (1) See appendix for non - GAAP explanation and reconciliation of non - GAAP measures. 21 Year Ended December 31 , December 31 , ($ in millions, except per share amounts) 20 20 201 9 % Change Revenues $ 982.5 $ 1,005.8 (2%) Net Income Attributable to Shareholders of Crawford & Company $ 28.3 $12.5 127% Diluted Earnings per Share CRD - A $0. 54 $0.26 108% CRD - B $0. 52 $0. 19 174% Non - GAAP Diluted Earnings per Share 1 CRD - A $0. 86 $0. 87 (1%) CRD - B $0. 84 $0. 79 6% Adjusted Operating Earnings 1 $ 71.8 $ 77.6 (7%) Adjusted Operating Margin 1 7.3 % 7.7 % (40b ps ) Adjusted EBITDA 1 $ 104.8 $ 112.0 (6%) Adjusted EBITDA Margin 1 10.7 % 11.1 % (40bps) Full year 2020 Financial Summary

22 (1) See Appendix for non - GAAP explanation and reconciliation 22 Unaudited ($ in thousands) December 31 , 20 20 December 31, 201 9 Change Cash and cash equivalents $ 44,656 $ 51,802 $ (7,146 ) Accounts receivable, net 123,060 128,217 ( 5,157 ) Unbilled revenues, net 103,528 103,894 (366) Total receivables 226,588 232,111 ( 5,523 ) Goodwill 66,537 80,642 ( 14,105 ) Intangible assets arising from business acquisitions, net 71,176 75,083 ( 3,907 ) Deferred revenues 51,369 5 2,368 (999 ) Pension liabilities 53,886 65,909 ( 12,023 ) Short - term borrowings and current portion of finance leases 1,837 28,546 (26,709 ) Long - term debt, less current portion 111,758 148,408 (36,650 ) Total debt 113,595 1 76,954 (63,359) Total stockholders' equity attributable to Crawford & Company 186,939 1 59,317 27,622 Net debt 1 68,939 1 25,152 (56,213 ) Balance Sheet Highlights

23 Net Debt and Pension Liability (1) As of 12/31/2020 0 20,000 40,000 60,000 80,000 100,000 120,000 140,000 160,000 180,000 200,000 2015 2016 2017 2018 2019 2020 Net Debt ¹ 0 20,000 40,000 60,000 80,000 100,000 120,000 140,000 2015 2016 2017 2018 2019 2020 Pension Liability ¹ $68.9 million $53.9 million Net debt at $68.9 million, the lowest level since 2013 Pension liability at $53.9 million, the lowest level since before the Financial Crisis $171.2 million $121.7 million

24 (1) See Appendix for non - GAAP explanation and reconciliation 24 Unaudited ($ in thousands) 20 20 201 9 Change Net Income Attributable to Shareholders of Crawford & Company $ 28,296 $ 12,485 $ 15,811 Goodwill Impairment 17,674 17,484 190 Gain on Disposition of Businesses, Net (13,763 ) — (13,763 ) Depreciation and Other Non - Cash Operating Items 34,269 44,703 (10,434 ) Billed Receivables Change 5,063 5,922 (859 ) Unbilled Receivables Change (3,762 ) 5,302 (9,064 ) Change in Accrued Compensation , 401K , and Other Payroll 8,295 1,656 6,639 Change in Accrued and Prepaid Income Taxes 9,311 ( 5,985 ) 15,296 Other Working Capital Changes 17,250 ( 5,627 ) 22,877 U.S. and U.K. Pension Contributions ( 9,455 ) ( 724 ) (8,731 ) Cash Flows from Operating Activities 93,178 75,216 17,962 Property & Equipment Purchases, net ( 14,226 ) ( 8,688 ) (5,538 ) Capitalized Software (internal and external costs) ( 23,154 ) (12,436 ) (10,718 ) Free Cash Flow 1 $ 55,798 $ 54,092 $ 1,706 For the year to date periods ended December 3 1, Operating and Free Cash Flow

25 Employee Health & Safety Protect our workforce first and foremost Customer Excellence Provide best - in - class service to our clients regardless of the global environment Brands, Relationships & Differentiation Strengthen industry leadership through our innovations and market leading solutions Future Growth Deliver superior results for our shareholders 2021 Priorities
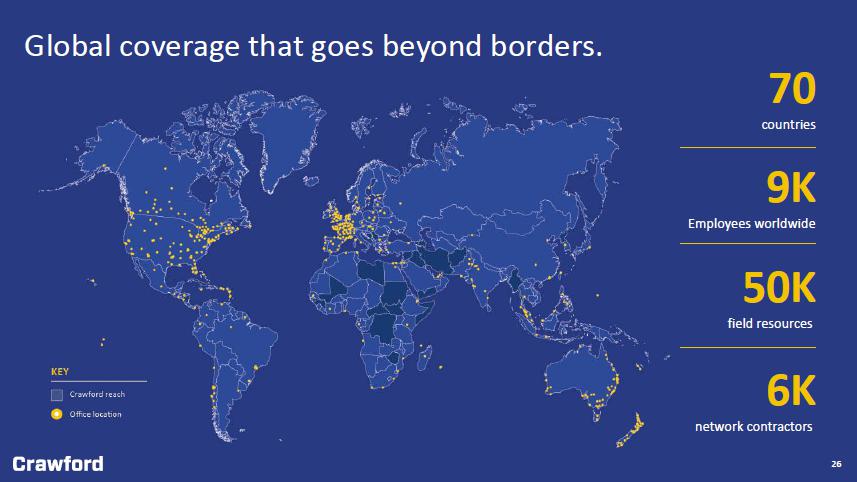
26 70 countries 9K Employees worldwide 50K field resources 6K network contractors 26 Global coverage that goes beyond borders.

27 27 Appendix A: Global Service Lines & 2020 Segment Results 27

28 Clients Scope & Scale Strategy • Carriers of all sizes • MGAs • Lloyds • Brokers • Corporations • Claims sizes vary from $500 - $5B+ • ~315K Claims managed annually, $10B+ indemnity dollars • Nearly 2,500 claims professionals • 700+ executive general adjusters with an average of 25 years of experience Gain market share through digital simplification, setting quality benchmarks and investing in expertise For clients seeking to increase policyholder satisfaction across the full spectrum of loss adjusting needs, Crawford is the one - stop - shop delivering efficiency and savings through unmatched experience, specialized expertise and digitally - enabled solutions. (1) First Notice of Loss Property Casualty Catastrophe Equipment Inspections Subrogation Centralized Intake/FNOL ¹ Cyber Forensic Accounting Energy Marine Global Admin (FNOL ¹ to Final Payment) Field Adjusting Construction Crawford Loss Adjusting

29 29 Highlights • Launched new digital solutions across all our operations • Focused on expanding through recruitment of teams and M&A in GTS • Solid margin expansion during 2020 Operating Results (FY 2020 v. FY 2019) • Revenues of $438.5 million versus $457.5 million • Gross profit of $118.9 million versus 116.8 million • Gross profit margin of 27.1% versus 25.5% • Operating earnings of $41.1 million versus $30.1 million • Operating margin of 9.4% versus 6.6% Crawford Loss Adjusting Year ended (in thousands, except percentages) December 31, 2020 December 31 , 201 9 Variance Revenues $ 438,491 $ 457,484 (4.2%) Direct expenses 319,638 340,657 (6.2%) Gross profit 118,853 116,827 1.7 % Indirect expenses 77,749 86,702 (10.3 % ) Operating earnings $ 41,104 $30,125 36.4% Gross profit margin 27.1% 25.5% 1.6 % Operating margin 9.4% 6.6% 2.8 % Total cases received 337,937 354,852 (4.8%) Full time equivalent employees 3,327 3 , 429 (3.0%)
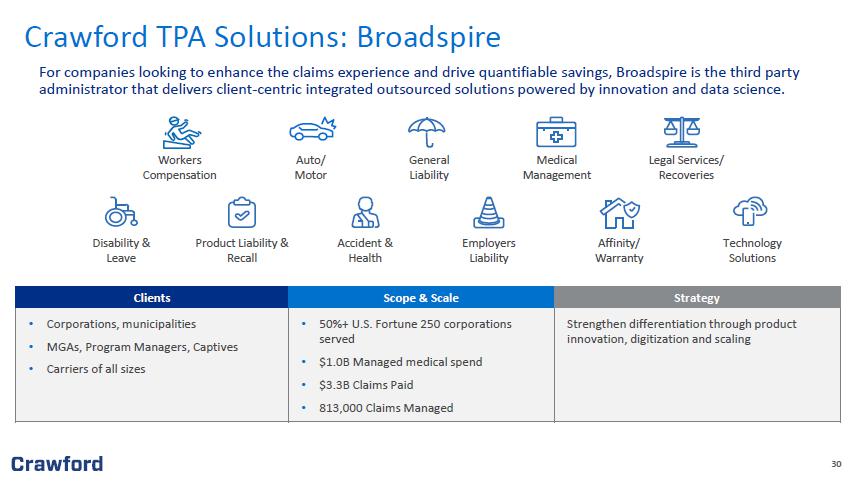
30 Clients Scope & Scale Strategy • Corporations, municipalities • MGAs, Program Managers, Captives • Carriers of all sizes • 50%+ U.S. Fortune 250 corporations served • $1.0B Managed medical spend • $3.3B Claims Paid • 813,000 Claims Managed Strengthen differentiation through product innovation, digitization and scaling For companies looking to enhance the claims experience and drive quantifiable savings, Broadspire is the third party administrator that delivers c lient - centric integrated outsourced solutions powered by innovation and data science. Workers Compensation Auto/ Motor Accident & Health Affinity/ Warranty General Liability Product Liability & Recall Employers Liability Medical Management Legal Services/ Recoveries Disability & Leave Technology Solutions Crawford TPA Solutions: Broadspire

31 31 Highlights • Ongoing investment in new technologies and client service capabilities • US client retention for 2020 was 96% • Focused on digitization and developing integrated solutions for our global clients Operating Results (FY 2020 v. FY 2019) • Revenues of $371.4 million versus $397.6 million • Gross profit of $76.7 million versus $89.3 million • Gross profit margin of 20.6% versus 22.5% • Operating earnings of $20.5 million versus $28.5 million • Operating margin of 5.5% versus 7.2% Crawford TPA Solutions: Broadspire Year ended (in thousands, except percentages) December 31, 2020 December 3 1 , 201 9 Variance Revenues $ 371,392 $ 397,626 ( 6.6 %) Direct expenses 294,727 308,350 (4.4 % ) Gross profit 76,665 89,276 (14.1%) Indirect expenses 56,158 60,770 (7.6 % ) Operating earnings $ 20,507 $ 28,506 (28.1%) Gross profit margin 20.6% 22.5% (1.9%) Operating margin 5.5% 7.2% (1.7%) Total cases received 779,123 822,691 (5.3%) Full time equivalent employees 3 , 128 3 , 156 ( 0.9 %)

32 For clients looking for speed , cost savings, customer satisfaction and quality through end - to - end digitized solutions, Crawford Platform Solutions is reimagining claims management by uniquely architecting networks, technology and Insurtech innovations. Clients Scope & Scale Strategy • Carriers • Corporates • Risk Managers and Brokers • 5,500 General/Specialty Contractors • $3.0B total managed repair project costs • 45,000 on demand resources • 7,000+ licensed and trained catastrophe resources • 175,000+ claim calls handled Grow market share of platform based solutions with reimagined industry leading claims management solutions that deliver against the markets unmet needs setting the benchmarks for quality and expertise Managed Repair Adjuster Referral Emergency Services Affinity Direct to Consumer Catastrophe Response Drone Inspections Desk Operations Roof Inspections & Ladder Assist On - Demand Services Digital FNOL Technology Innovations Notary Service & Document Retrieval Temporary Staffing Crawford Platform Solutions

33 Digital FNOL Digital Assist Digital Desk ¹ Asservio • Digital claim intake process • Increased scale & efficiency in claim capture • Omni - Channel approach: Web, SMS, Alexa, iOT sensors • Assisted self - service (YouGoLook) ¹ • On - demand field inspection services (ladder assist / interior) • Drone capture • Traditional Loss Adjusting Services • Building Consultancy/Forensic Accounting Expertise • End to end digital desk claims management • Smart triage claim segmentation • Empower claim segmentation and channeling • Crawford internal Digital Desk solution • Client Virtual Desk option – SaaS model ¹ • Digital automated estimate review • Integrated with leading estimating platform • Embedded in Crawford Loss Adjusting and Contractor Managed Repair • Available for carrier licensing ² From FNOL to finished repair, our commitment is to provide digitized claim platforms that reimagine and simplify the claims process resulting in elevated customer experience outcomes (1) In development including white label capabilities (2) Available June 2021 Digital X iOT RPA Escape of Water Alexa Asservio Renovo Job Track Crawford Platform Solutions - Innovations
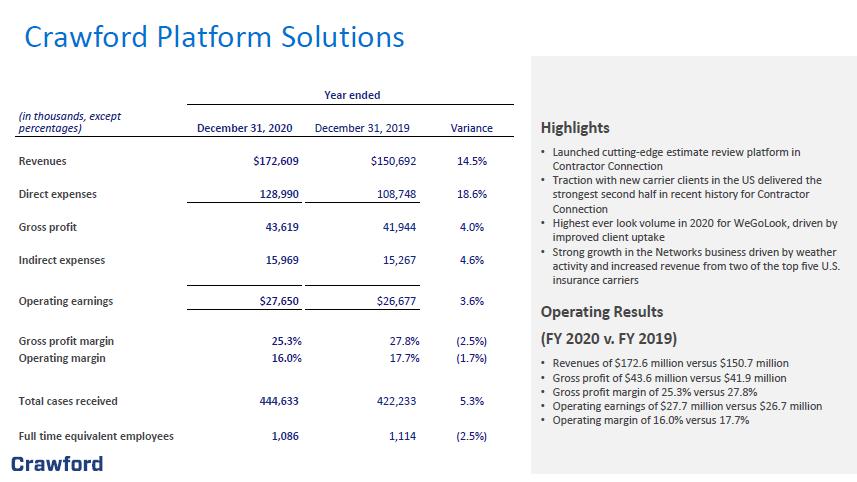
34 34 Highlights • Launched cutting - edge estimate review platform in Contractor Connection • Traction with new carrier clients in the US delivered the strongest second half in recent history for Contractor Connection • Highest ever look volume in 2020 for WeGoLook , driven by improved client uptake • Strong growth in the Networks business driven by weather activity and increased revenue from two of the top five U.S. insurance carriers Operating Results (FY 2020 v. FY 2019) • Revenues of $172.6 million versus $150.7 million • Gross profit of $43.6 million versus $41.9 million • Gross profit margin of 25.3% versus 27.8% • Operating earnings of $27.7 million versus $26.7 million • Operating margin of 16.0% versus 17.7% Crawford Platform Solutions Year ended (in thousands, except percentages) December 31, 2020 December 31 , 201 9 Variance Revenues $ 172,609 $ 150,692 14.5 % Direct expenses 128,990 108,748 18.6 % Gross profit 43,619 41,944 4.0 % Indirect expenses 15,969 15,267 4.6% Operating earnings $ 27,650 $ 26,677 3.6 % Gross profit margin 25.3% 27.8% (2.5%) Operating margin 16.0% 17.7% (1.7%) Total cases received 444,633 422,233 5.3 % Full time equivalent employees 1,086 1,114 (2.5 % )

35 35 Appendix B: Non - GAAP Financial Information 35
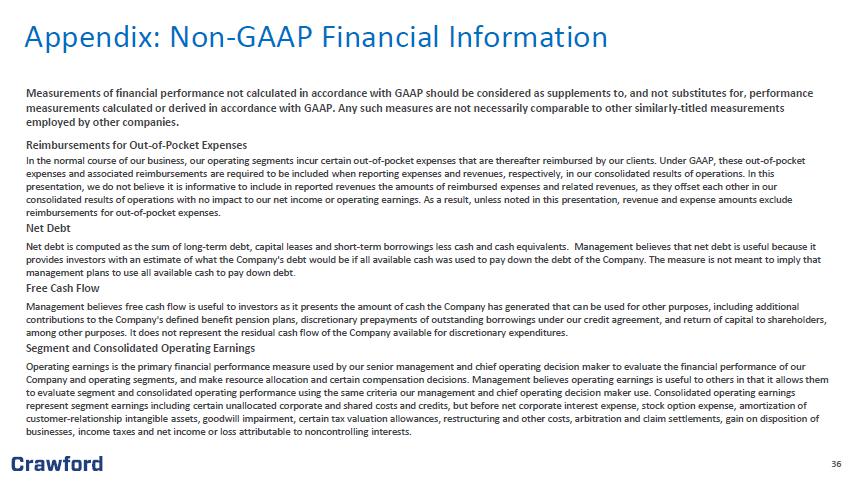
36 Measurements of financial performance not calculated in accordance with GAAP should be considered as supplements to, and not sub stitutes for, performance measurements calculated or derived in accordance with GAAP. Any such measures are not necessarily comparable to other similar ly - titled measurements employed by other companies. Reimbursements for Out - of - Pocket Expenses In the normal course of our business, our operating segments incur certain out - of - pocket expenses that are thereafter reimbursed by our clients. Under GAAP, these out - of - pocket expenses and associated reimbursements are required to be included when reporting expenses and revenues, respectively, in our co nsolidated results of operations. In this presentation, we do not believe it is informative to include in reported revenues the amounts of reimbursed expenses and rela ted revenues, as they offset each other in our consolidated results of operations with no impact to our net income or operating earnings. As a result, unless noted in this pre sentation, revenue and expense amounts exclude reimbursements for out - of - pocket expenses. Net Debt Net debt is computed as the sum of long - term debt, capital leases and short - term borrowings less cash and cash equivalents. Man agement believes that net debt is useful because it provides investors with an estimate of what the Company's debt would be if all available cash was used to pay down the debt o f t he Company. The measure is not meant to imply that management plans to use all available cash to pay down debt . Free Cash Flow Management believes free cash flow is useful to investors as it presents the amount of cash the Company has generated that ca n b e used for other purposes, including additional contributions to the Company's defined benefit pension plans, discretionary prepayments of outstanding borrowings under our c red it agreement, and return of capital to shareholders, among other purposes. It does not represent the residual cash flow of the Company available for discretionary expenditures. Segment and Consolidated Operating Earnings Operating earnings is the primary financial performance measure used by our senior management and chief operating decision ma ker to evaluate the financial performance of our Company and operating segments, and make resource allocation and certain compensation decisions. Management believes operatin g e arnings is useful to others in that it allows them to evaluate segment and consolidated operating performance using the same criteria our management and chief operating decisio n m aker use. Consolidated operating earnings represent segment earnings including certain unallocated corporate and shared costs and credits, but before net corporate int ere st expense, stock option expense, amortization of customer - relationship intangible assets, goodwill impairment, certain tax valuation allowances, restructuring and other costs, a rbitration and claim settlements, gain on disposition of businesses, income taxes and net income or loss attributable to noncontrolling interests. Appendix: Non - GAAP Financial Information

37 Segment and Consolidated Gross Profit Gross profit is defined as revenues less direct expenses which exclude indirect overhead expenses allocated to the business. Ind irect expenses consist of centralized administrative support costs, regional and local shared services that are allocated to each segment based on usage. Adjusted EBITDA Adjusted EBITDA is used by management to evaluate, assess and benchmark our operational results and the Company believes that ad justed EBITDA is relevant and useful information widely used by analysts, investors and other interested parties. Adjusted EBITDA is defined as net income attributable to sh are holders of the Company with recurring adjustments for depreciation and amortization, net corporate interest expense, income taxes, stock - based compensation expense and foreign exchan ge fluctuations. Additionally, adjustments for non - recurring expenses for goodwill impairment, certain tax valuation allowances, restructuring and other costs, gain on disposit ion of businesses, and arbitration and claim settlements have been included in the calculation of adjusted EBITDA. Adjusted EBITDA is not a term defined by GAAP and as a result our m eas ure of adjusted EBITDA might not be comparable to similarly titled measures used by other companies. Adjusted Revenue, Operating Earnings, Pretax Earnings, Net Income, Diluted Earnings per Share and EBITDA Included in non - GAAP adjusted measurements as an add back or subtraction to GAAP measurements, are impacts of the goodwill impai rment, restructuring and other costs, gain on disposition of businesses, arbitration and claim settlements, and foreign exchange impacts, which arise from non - core items not directly related to our normal business or operations, or our future performance. Management believes it is useful to exclude these charges when comparing net income and diluted earni ngs per share across periods, as these charges are not from ordinary operations. Appendix: Non - GAAP Financial Information (cont.)

38 38 Three Months Ended Twelve Months Ended ( in thousands ) December 31, 2020 December 31, 2019 December 31, 2020 December 31, 2019 Geographic Area Currency USD equivalent % of total USD equivalent % of total USD equivalent % of total USD equivalent % of total U.S. USD $ 151,758 59.0% $ 136,913 55.4% $ 570,822 58.1% $ 569,205 56.6% U.K. GBP 33,542 13.0% 32,370 13.1% 128,545 13.1% 126,337 12.6% Canada CAD 20,824 8.1% 27,401 11.1% 89,163 9.1% 114,438 11.4% Australia AUD 18,811 7.3% 16,346 6.6% 73,081 7.4% 70,569 7.0% Europe EUR 13,985 5.4% 14,135 5.7% 54,122 5.5% 54,136 5.4% Rest of World Various 18,501 7.2% 20,021 8.1% 66,759 6.8% 71,117 7.0% Total Revenues, before reimbursements $ 257,421 100.0% $ 247,186 100.0% $ 982,492 100.0% $ 1,005,802 100.0% Total Revenues Before Reimbursements by Major Currency The following table illustrates revenue as a percentage of total revenue in the major currencies of the geographic areas in which Crawford does business:

39 39 Year Ended Yea r Ended December 3 1 , December 31 , Unaudited ($ in thousands) 20 20 20 19 Revenues Before Reimbursements Total Revenues $ 1,016,195 $ 1,047,627 Reimbursements ( 33,703 ) ( 41,825 ) Revenues Before Reimbursements 982,492 1,005,802 Costs of Services Provided, Before Reimbursements Total Costs of Services 771,023 794,598 Reimbursements ( 33,703 ) ( 41,825 ) Costs of Services Provided, Before Reimbursements $ 737,320 $ 752,773 Year Ended Year Ended December 31 , December 3 1 , Unaudited ($ in thousands) 20 20 2 019 Operating Earnings: Crawford Loss Adjusting $ 41,104 $ 30,125 Crawford Platform Solutions 27,650 26,677 Crawford TPA Solutions 20,507 28,506 Unallocated corporate and shared costs and credits, net (17,431 ) (7,699 ) Consolidated Operating Earnings 71,830 77,609 (Deduct) Add: Net corporate interest expense ( 7 , 923 ) ( 10,774 ) Stock option expense ( 1,122 ) (1,885 ) Amortization expense ( 11,653 ) ( 11,277 ) Restructuring and other costs ( 8,133 ) — Goodwill impairment ( 17,674 ) ( 17,484 ) Gain/(Loss) on disposal of businesses, net 13,763 — Arbitration and claim settlement — ( 12,552 ) Income ta x provision (12,013 ) (14,111 ) Net (income) loss attributable to noncontrolling interests and redeemable noncontrolling interests 1,221 2,959 Net Income Attributable to Shareholders of Crawford & Company $ 28,296 $ 12,485 Reconciliation of Non - GAAP Items Revenues, Costs of Services Provided, and Operating Earnings
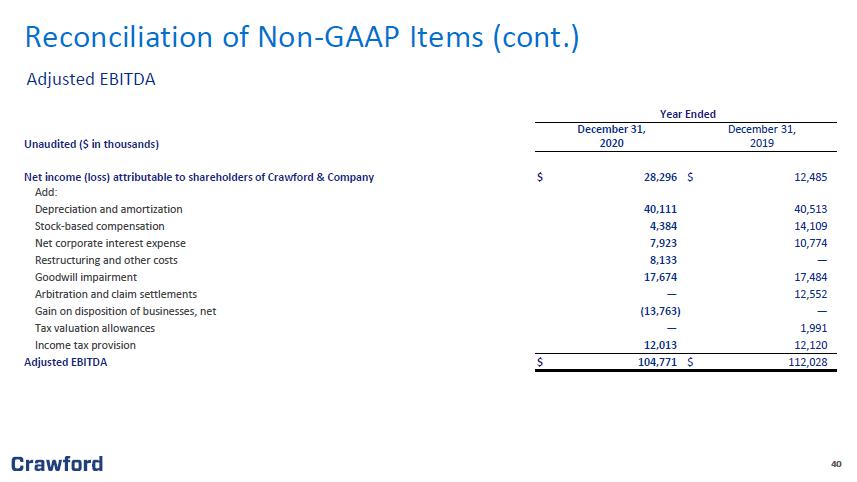
40 40 ) Year Ended December 31 , December 3 1 , Unaudited ($ in thousands) 20 20 201 9 Net income (loss) attributable to shareholders of Crawford & Company $ 28,296 $ 12,485 Add: Depreciation and amortization 40,111 40,513 Stock - based compensation 4,384 14,109 Net corporate interest expense 7 , 923 10,774 Restructuring and other costs 8,133 — Goodwill impairment 17,674 17,484 Arbitration and claim settlements — 12,552 Gain on disposition of businesses, net (13,763 ) — Tax valuation allowances — 1,991 Income tax provision 12,013 12,120 Adjusted EBITDA $ 104,771 $ 112,028 Reconciliation of Non - GAAP Items (cont.) Adjusted EBITDA

41 41 December 31 , December 31, Unaudited ($ in thousands) 20 20 201 9 Net Debt Short - term borrowings $ 1,570 $ 2 8,531 Current installments of finance leases and other obligations 267 15 Long - term debt and finance leases, less current installments 111,758 1 48 , 408 Total debt 113,595 1 76 , 954 Less: Cash and cash equivalents 44,656 51,802 Net debt $ 68,939 $ 125,152 Reconciliation of Non - GAAP Items (cont.) Net Debt
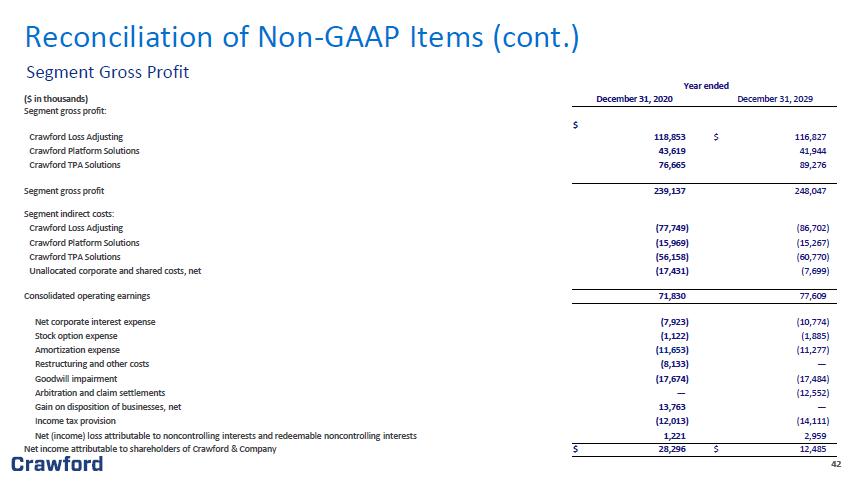
42 42 Year ended ( $ in thousands) December 31 , 20 20 December 31 , 20 29 Segment gross profit: Crawford Loss Adjusting $ 118,853 $ 116,827 Crawford Platform Solutions 43,619 41,944 Crawford TPA Solutions 76,665 89,276 Segment gross profit 239 , 137 248,047 Segment indirect costs: Crawford Loss Adjusting ( 77,749 ) ( 86 , 702 ) Crawford Platform Solutions ( 15 , 969 ) ( 15 , 267 ) Crawford TPA Solutions (56 , 158 ) ( 60 , 770 ) Unallocated corporate and shared costs, net (17,431 ) (7,699 ) Consolidated operating earnings 71,830 77,609 Net corporate interest expense ( 7 , 923 ) ( 10 , 774 ) Stock option expense ( 1,122 ) ( 1,885 ) Amortization expense ( 11 , 653 ) ( 11 , 277 ) Restructuring and other costs ( 8,133 ) — Goodwill impairment ( 17,674 ) ( 17,484 ) Arbitration and claim settlements — ( 12,552 ) Gain on disposition of businesses, net 13,763 — Income tax provision (12,013 ) (14,111 ) Net (income) loss attributable to noncontrolling interests and redeemable noncontrolling interests 1,221 2,959 Net income attributable to shareholders of Crawford & Company $ 28,296 $ 12,485 Reconciliation of Non - GAAP Items (cont.) Segment Gross Profit

43 43 Year Ended December 3 1 , 20 20 Unaudited ($ in thousands) Revenues Non - GAAP Operating Earnings Pretax Earnings Net Income Attributable to Crawford & Company Diluted Earnings per CRD - A Share Diluted Earnings per CRD - B Share GAAP $ 982,492 $ 71,830 $ 39,088 $ 28,296 $ 0. 54 $ 0. 52 Adjustments: Amortization of Intangible Assets — — 11,653 8,740 0.16 0.16 Goodwill impairment — — 17,674 14,209 0.27 0.27 Restructuring and other costs, net — — 8,133 4,927 0.09 0.09 Gain on disposition of businesses, net — — (13,763 ) (10,807 ) (0.20 ) (0.20 ) Non - GAAP Adjusted $ 982,492 $ 71,830 $ 62,785 $ 45,365 $ 0. 86 $ 0. 84 Year Ended December 3 1 , 201 9 Unaudited ($ in thousands) Revenues Non - GAAP Operating Earnings Pretax Earnings Net Income Attributable to Crawford & Company Diluted Earnings per CRD - A Share Diluted Earnings per CRD - B Share GAAP $ 1,005,802 $ 77,609 $ 23,637 $ 12,485 $ 0.26 $ 0.19 Adjustments: Amortization of Intangible Assets — — 11,277 8,459 0.16 0.15 Goodwill impairment — — 17,484 13,057 0.24 0.24 Arbitration and claim settlements — — 12,552 9,276 0.17 0.17 Tax valuation allowances — — — 1,991 0.04 0.04 Non - GAAP Adjusted $ 1,005,802 $ 77,609 $ 64,950 $ 45,268 $ 0. 87 $ 0.79 Reconciliation of Full Year Non - GAAP Results