Attached files
| file | filename |
|---|---|
| 8-K - 8-K - Northwest Bancshares, Inc. | nwbi-20210421.htm |
Ronald J. Seiffert Chairman, President and CEO William W. Harvey SEVP, Chief Financial Officer Richard K. Laws EVP, Chief Counsel and Corporate Secretary Northwest Bancshares, Inc. 2021 Annual Meeting of Stockholders April 21, 2021
Forward Looking Statements • This presentation contains forward-looking statements, which can be identified by the use of words such as “estimate,” “project,” “believe,” “intend,” “anticipate,” “plan,” “seek,” “expect” and words of similar meaning. These forward-looking statements include, but are not limited to: • statements of our goals, intentions and expectations; • statements regarding our business plans, prospects, growth and operating strategies; • statements regarding the asset quality of our loan and investment portfolios; and • estimates of our risks and future costs and benefits. • These forward-looking statements are based on current beliefs and expectations of our management and are inherently subject to significant business, economic and competitive uncertainties and contingencies, many of which are beyond our control. In addition, these forward- looking statements are subject to assumptions with respect to future business strategies and decisions that are subject to change.. • The following factors, among others, could cause actual results to differ materially from the anticipated results or other expectations expressed in the forward-looking statements: • changes in laws or government regulations or policies affecting financial institutions, including changes in regulatory fees and capital requirements; • general economic conditions, either nationally or in our market areas, that are worse than expected; • competition among depository and other financial institutions; • inflation and changes in the interest rate environment that reduce our margins or reduce the fair value of financial instruments; • adverse changes in the securities markets; • our ability to enter new markets successfully and capitalize on growth opportunities; • our ability to successfully integrate acquired entities, if any; • changes in consumer spending, borrowing and savings habits; • changes in our organization, compensation and benefit plans; • our ability to continue to increase and manage our commercial and residential real estate, multi-family, and commercial and industrial loans; • possible impairments of securities held by us, including those issued by government entities and government sponsored enterprises; • the level of future deposit premium assessments; • the impact of the current recession on our loan portfolio (including cash flow and collateral values), investment portfolio, customers and capital market activities; • the impact of the current governmental effort to restructure the U.S. financial and regulatory system; • changes in the financial performance and/or condition of our borrowers; and • the effect of changes in accounting policies and practices, as may be adopted by the regulatory agencies, as well as the Securities and Exchange Commission, the Public Company Accounting Oversight Board, the Financial Accounting Standards Board and other accounting standard setters. • Because of these and other uncertainties, our actual future results may be materially different from the results indicated by these forward- looking statements. 2

Thank you Northwest Employees! 3

Thank you Northwest Customers! 4
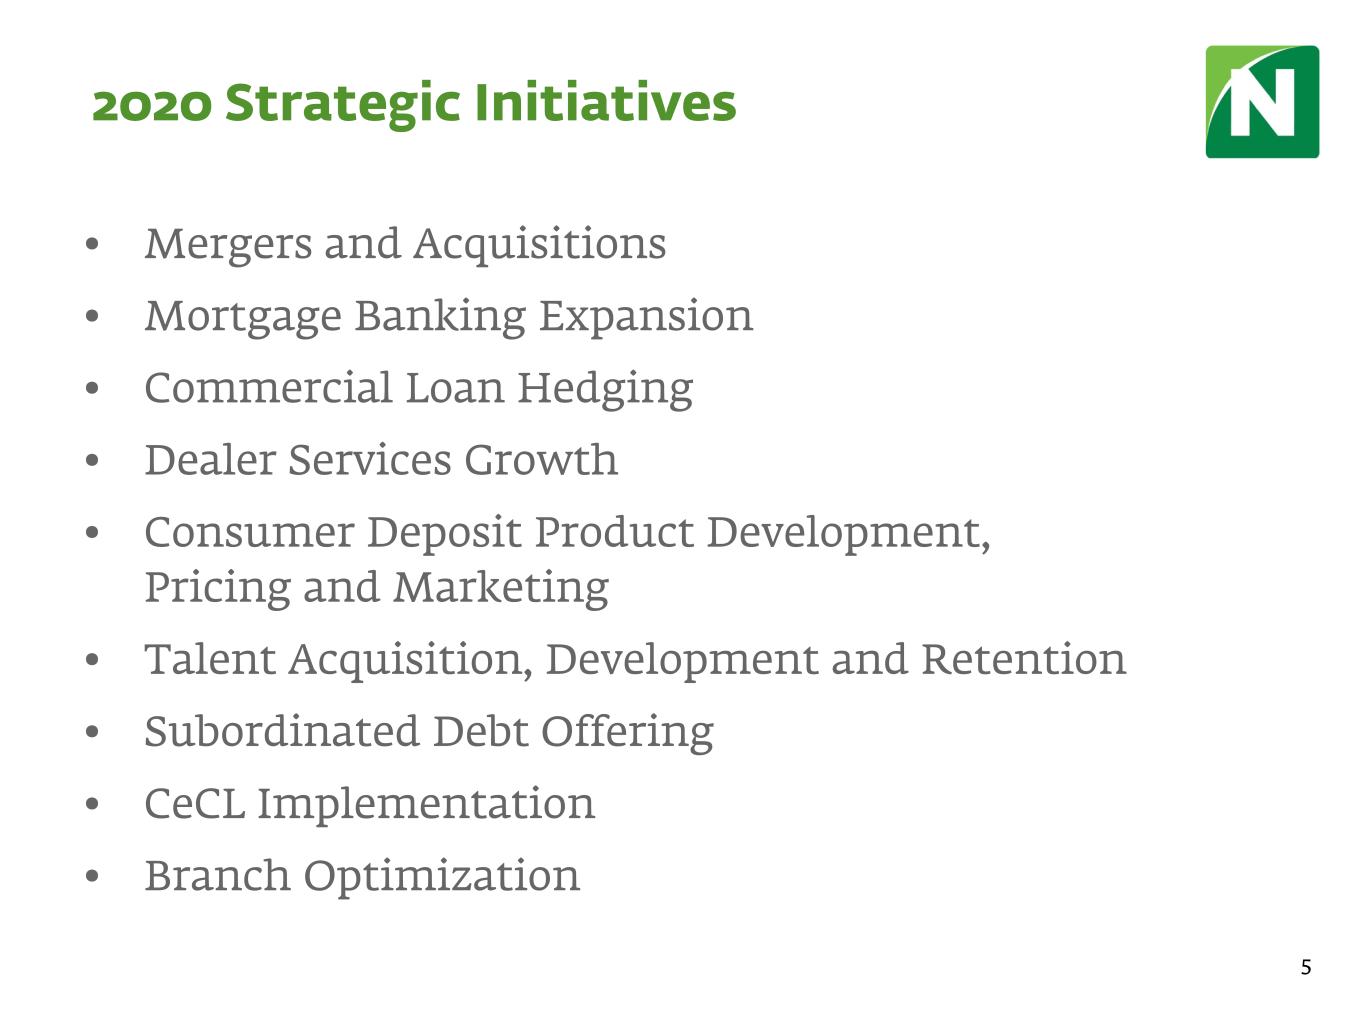
2020 Strategic Initiatives • Mergers and Acquisitions • Mortgage Banking Expansion • Commercial Loan Hedging • Dealer Services Growth • Consumer Deposit Product Development, Pricing and Marketing • Talent Acquisition, Development and Retention • Subordinated Debt Offering • CeCL Implementation • Branch Optimization 5
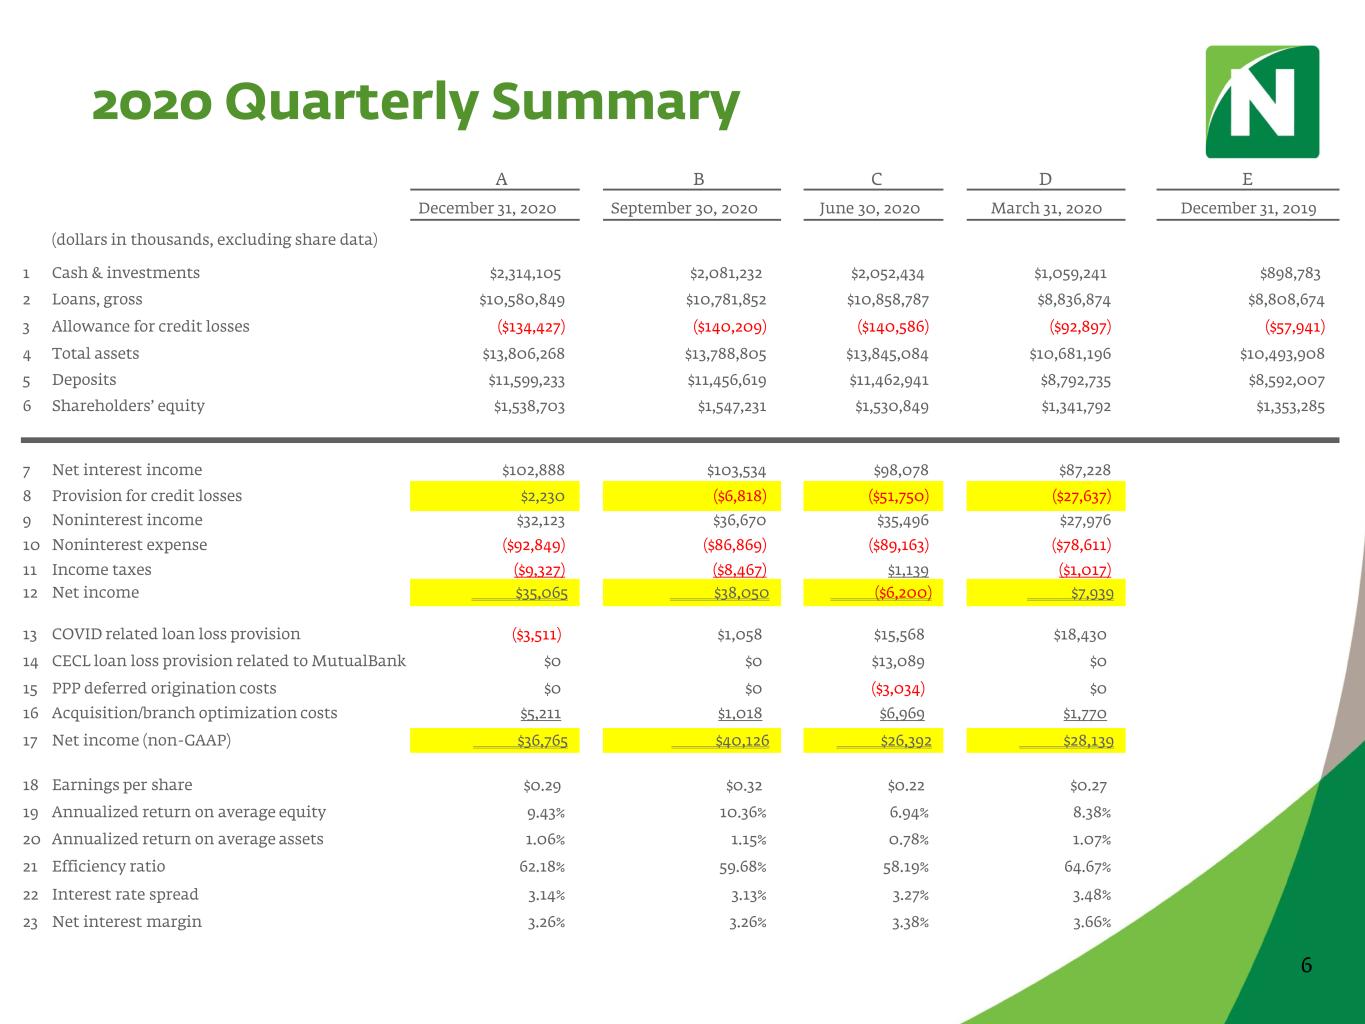
A B C D E December 31, 2020 September 30, 2020 June 30, 2020 March 31, 2020 December 31, 2019 (dollars in thousands, excluding share data) 1 Cash & investments $2,314,105 $2,081,232 $2,052,434 $1,059,241 $898,783 2 Loans, gross $10,580,849 $10,781,852 $10,858,787 $8,836,874 $8,808,674 3 Allowance for credit losses ($134,427) ($140,209) ($140,586) ($92,897) ($57,941) 4 Total assets $13,806,268 $13,788,805 $13,845,084 $10,681,196 $10,493,908 5 Deposits $11,599,233 $11,456,619 $11,462,941 $8,792,735 $8,592,007 6 Shareholders’ equity $1,538,703 $1,547,231 $1,530,849 $1,341,792 $1,353,285 7 Net interest income $102,888 $103,534 $98,078 $87,228 8 Provision for credit losses $2,230 ($6,818) ($51,750) ($27,637) 9 Noninterest income $32,123 $36,670 $35,496 $27,976 10 Noninterest expense ($92,849) ($86,869) ($89,163) ($78,611) 11 Income taxes ($9,327) ($8,467) $1,139 ($1,017) 12 Net income $35,065 $38,050 ($6,200) $7,939 13 COVID related loan loss provision ($3,511) $1,058 $15,568 $18,430 14 CECL loan loss provision related to MutualBank $0 $0 $13,089 $0 15 PPP deferred origination costs $0 $0 ($3,034) $0 16 Acquisition/branch optimization costs $5,211 $1,018 $6,969 $1,770 17 Net income (non-GAAP) $36,765 $40,126 $26,392 $28,139 18 Earnings per share $0.29 $0.32 $0.22 $0.27 19 Annualized return on average equity 9.43% 10.36% 6.94% 8.38% 20 Annualized return on average assets 1.06% 1.15% 0.78% 1.07% 21 Efficiency ratio 62.18% 59.68% 58.19% 64.67% 22 Interest rate spread 3.14% 3.13% 3.27% 3.48% 23 Net interest margin 3.26% 3.26% 3.38% 3.66% 6 2020 Quarterly Summary
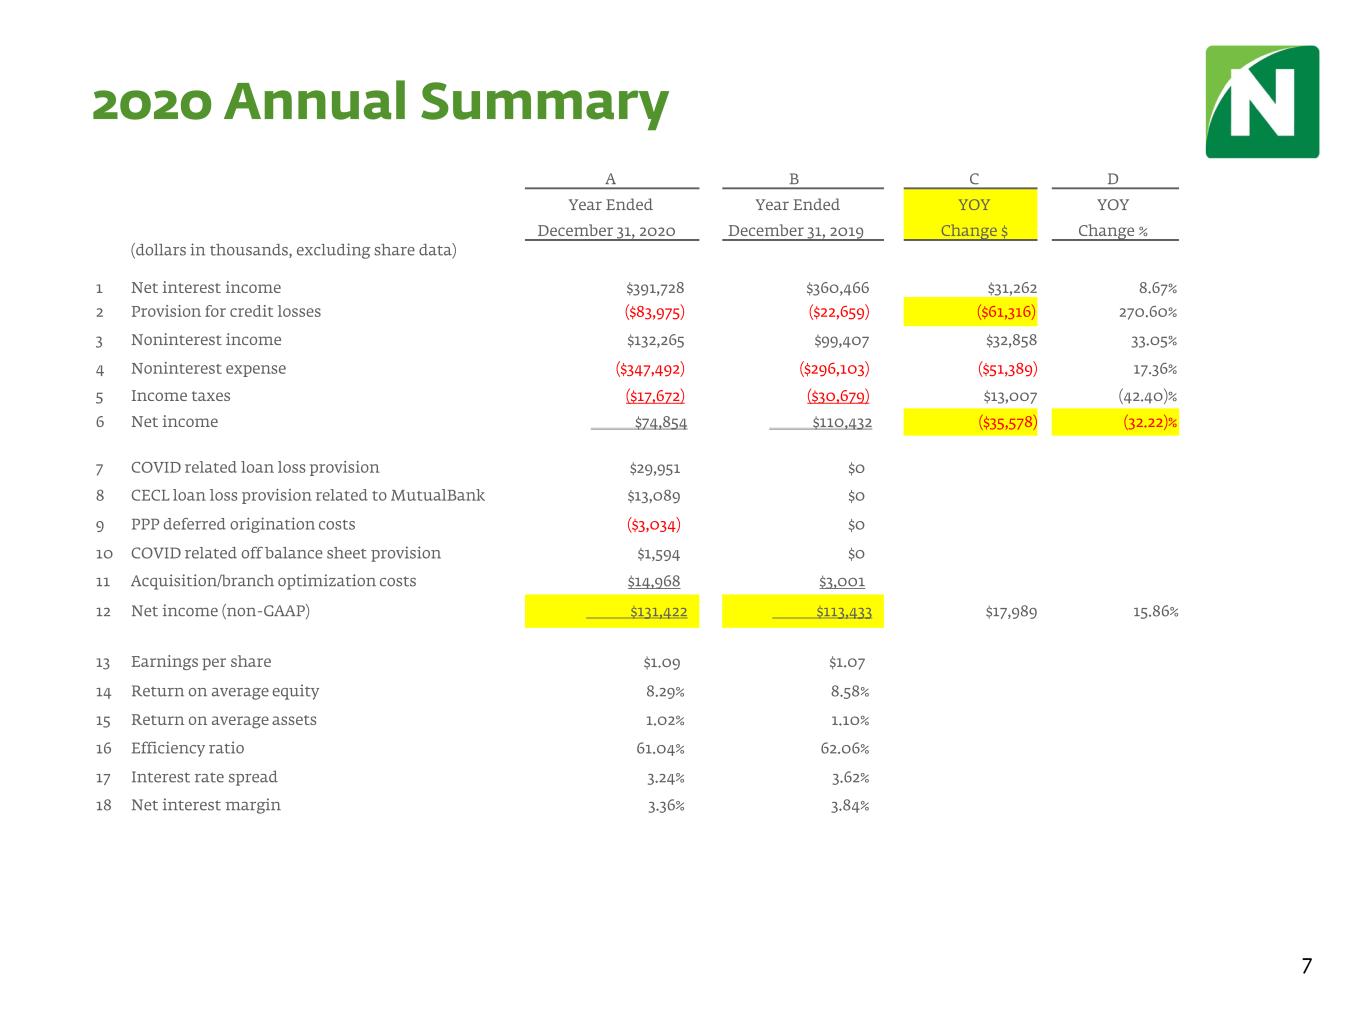
A B C D Year Ended Year Ended YOY YOY December 31, 2020 December 31, 2019 Change $ Change % (dollars in thousands, excluding share data) 1 Net interest income $391,728 $360,466 $31,262 8.67% 2 Provision for credit losses ($83,975) ($22,659) ($61,316) 270.60% 3 Noninterest income $132,265 $99,407 $32,858 33.05% 4 Noninterest expense ($347,492) ($296,103) ($51,389) 17.36% 5 Income taxes ($17,672) ($30,679) $13,007 (42.40)% 6 Net income $74,854 $110,432 ($35,578) (32.22)% 7 COVID related loan loss provision $29,951 $0 8 CECL loan loss provision related to MutualBank $13,089 $0 9 PPP deferred origination costs ($3,034) $0 10 COVID related off balance sheet provision $1,594 $0 11 Acquisition/branch optimization costs $14,968 $3,001 12 Net income (non-GAAP) $131,422 $113,433 $17,989 15.86% 13 Earnings per share $1.09 $1.07 14 Return on average equity 8.29% 8.58% 15 Return on average assets 1.02% 1.10% 16 Efficiency ratio 61.04% 62.06% 17 Interest rate spread 3.24% 3.62% 18 Net interest margin 3.36% 3.84% 7 2020 Annual Summary
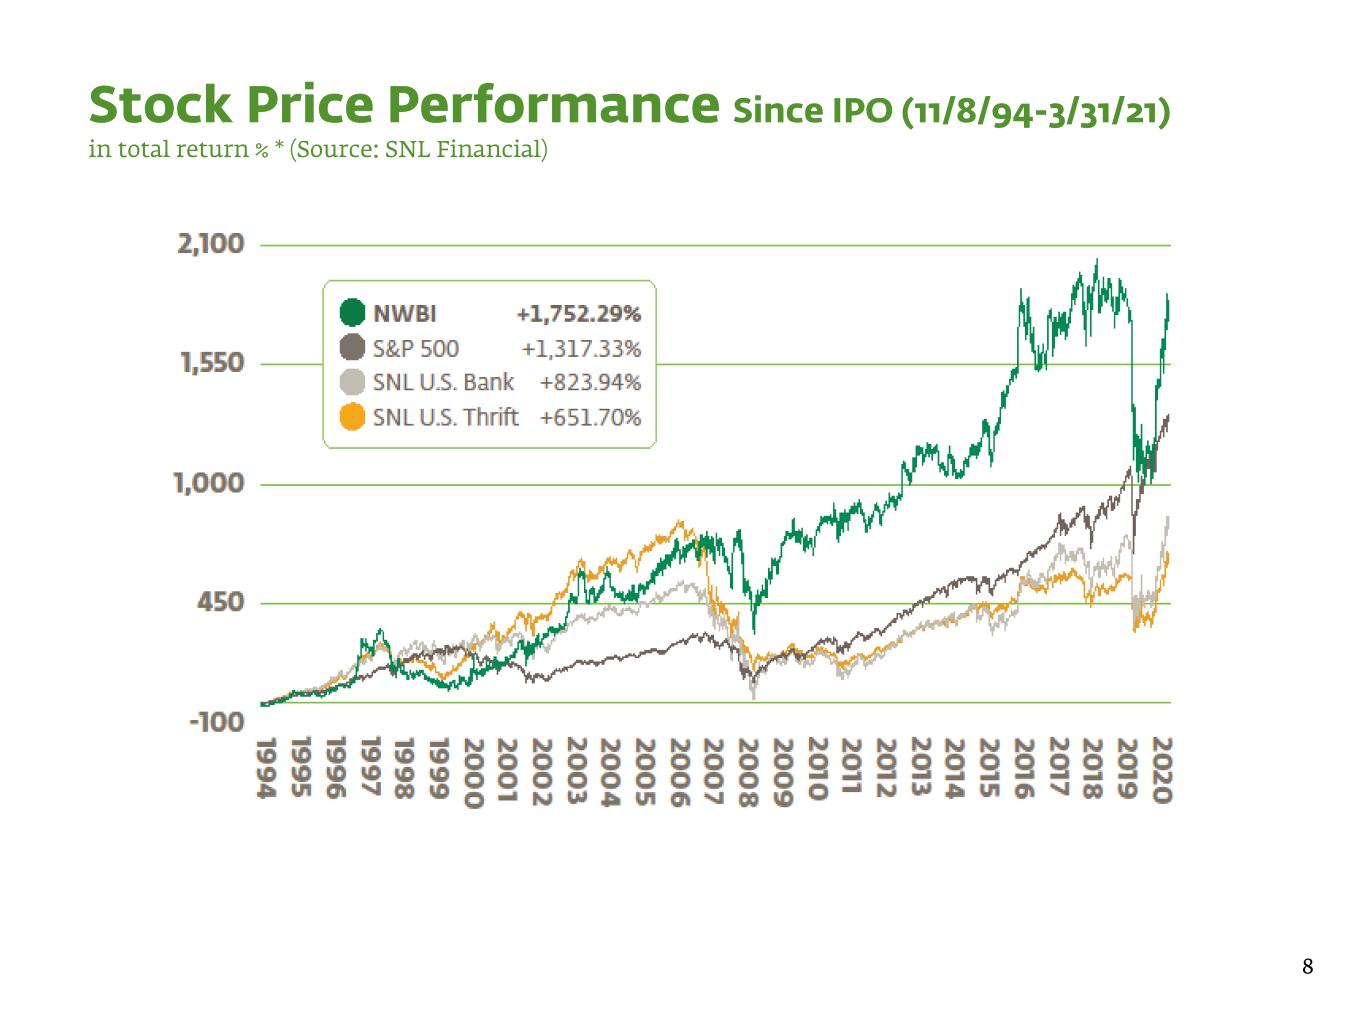
8 Stock Price Performance Since IPO (11/8/94-3/31/21) in total return % * (Source: SNL Financial)
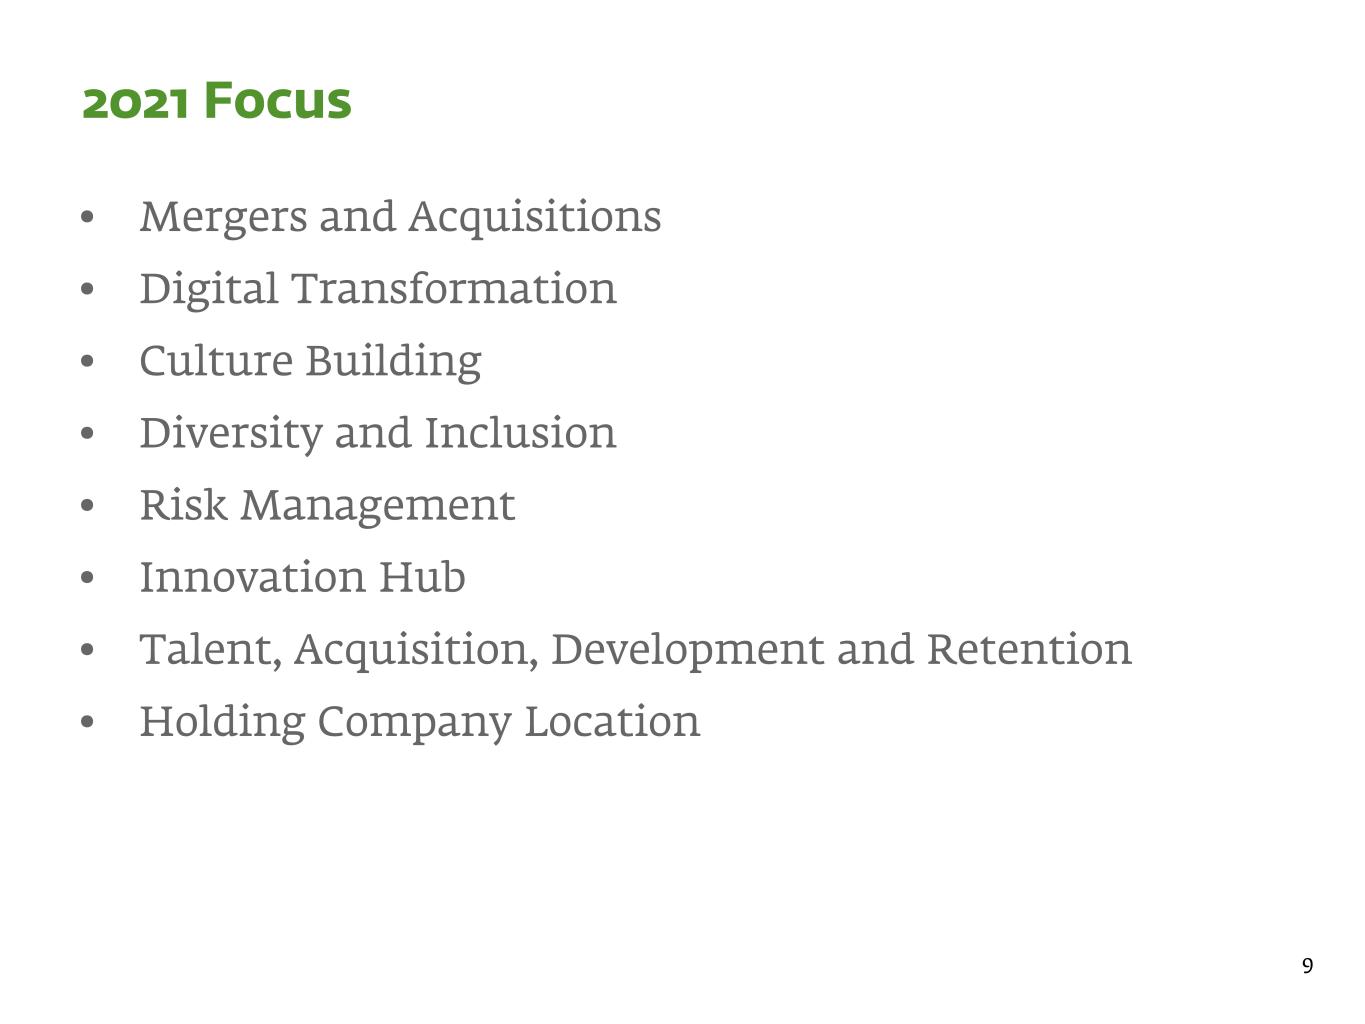
2021 Focus • Mergers and Acquisitions • Digital Transformation • Culture Building • Diversity and Inclusion • Risk Management • Innovation Hub • Talent, Acquisition, Development and Retention • Holding Company Location 9

Conclusion
