Attached files
| file | filename |
|---|---|
| EX-99.1 - EX-99.1 - CapStar Financial Holdings, Inc. | cstr-ex991_6.htm |
| 8-K - 8-K - CapStar Financial Holdings, Inc. | cstr-8k_20210422.htm |
First Quarter 2021 Earnings Call April 23, 2021 Exhibit 99.2
FORWARD-LOOKING STATEMENTS This investor presentation contains forward-looking statements, as defined by federal securities laws, including statements about CapStar Financial Holdings, Inc. (“CapStar”) and its financial outlook and business environment. All statements, other than statements of historical fact, included in this release and any oral statements made regarding the subject of this release, including in the conference call referenced herein, that address activities, events or developments that the Company expects, believes or anticipates will or may occur in the future are “forward-looking statements“ within the meaning of Section 27A of the Securities Act of 1933, as amended, and Section 21E of the Securities Exchange Act of 1934, as amended, and are made pursuant to the safe harbor provisions of the Private Securities Litigation Reform Act of 1955. The words “expect“, “anticipate”, “intend”, “may”, “should”, “plan”, “believe”, “seek“, “estimate“ and similar expressions are intended to identify such forward-looking statements, but other statements not based on historical information may also be considered forward-looking statements. These forward-looking statements are subject to known and unknown risks, uncertainties and other factors that could cause the actual results to differ materially from the statements, including, but not limited to: (I) deterioration in the financial condition of borrowers of the Company and its subsidiaries, resulting in significant increases in loan losses and provisions for those losses; (II) the effects of the emergence of widespread health emergencies or pandemics, including the magnitude and duration of the Covid-19 pandemic and its impact on general economic and financial market conditions and on the Company’s customer’s business, results of operations, asset quality and financial condition; (III) the ability to grow and retain low-cost, core deposits and retain large, uninsured deposits, including during times when the Company is seeking to lower rates it pays on deposits; (IV) the impact of competition with other financial institutions, including pricing pressures and the resulting impact on the Company’s results, including as a result of compression to net interest margin; (V) fluctuations or differences in interest rates on loans or deposits from those that the Company is modeling or anticipating, including as a result of the Company’s inability to better match deposit rates with the changes in the short term rate environment, or that affect the yield curve; (VI) difficulties and delays in integrating required businesses or fully realizing cost savings or other benefits from acquisitions; (VII) the Company‘s ability to profitably grow its business and successfully execute on its business plans; (VIII) any matter that would cause the Company to conclude that there was impairment of any asset, including goodwill or other intangible assets; (IX) the vulnerability of the Company’s network and online banking portals, and the systems of customers or parties with whom the Company contracts, to unauthorized access, computer viruses, phishing schemes, spam attacks, human error, natural disasters, power loss and other security breaches; (X) the availability of and access to capital; (XI) adverse results (including costs, fines, reputational harm, inability to obtain necessary approvals, and/or other negative affects) from current or future litigation, regulatory examinations or other legal and/or regulatory actions, including as a result of the Company’s participation in and execution of government programs related to the Covid-19 pandemic; and (XII) general competitive, economic, political and market conditions. Additional factors which could affect the forward-looking statements can be found in the Company’s Annual Report on Form 10-K, Quarterly Reports on Form 10-Q, and Current Reports on Form 8-K, filed with the SEC. The Company disclaims any obligation to update or revise any forward-looking statements contained in this press release (we speak only as of the date hereof ), whether as a result of new information, future events, or otherwise. NON-GAAP MEASURES This investor presentation includes financial information determined by methods other than in accordance with generally accepted accounting principles (“GAAP”). This financial information includes certain operating performance measures, which exclude merger-related and other charges that are not considered part of recurring operations. Such measures include: “Efficiency ratio – operating,” “Expenses – operating,” “Earnings per share – operating,” “Diluted earnings per share – operating,” “Tangible book value per share,” “Return on common equity – operating,” “Return on tangible common equity – operating,” “Return on assets – operating,” and “Tangible common equity to tangible assets.” Management has included these non-GAAP measures because it believes these measures may provide useful supplemental information for evaluating CapStar’s underlying performance trends. Further, management uses these measures in managing and evaluating CapStar’s business and intends to refer to them in discussions about our operations and performance. Operating performance measures should be viewed in addition to, and not as an alternative to or substitute for, measures determined in accordance with GAAP, and are not necessarily comparable to non-GAAP measures that may be presented by other companies. To the extent applicable, reconciliations of these non-GAAP measures to the most directly comparable GAAP measures can be found in the ‘Non-GAAP Reconciliation Tables’ included in the exhibits to this presentation. Disclosures
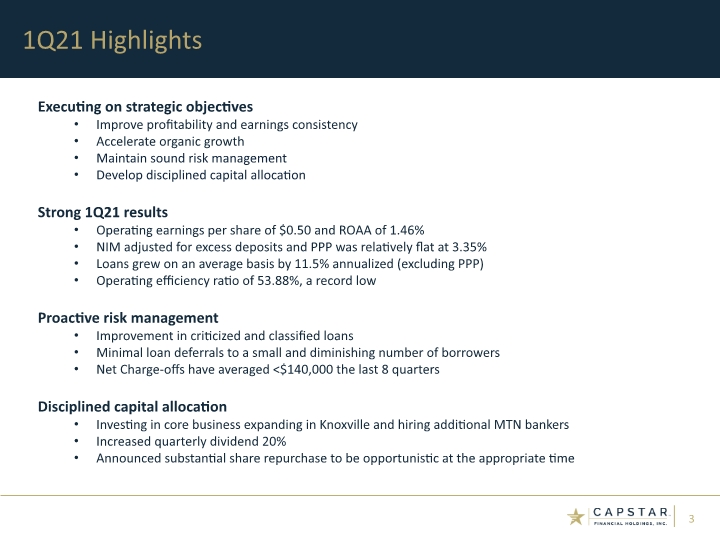
Executing on strategic objectives Improve profitability and earnings consistency Accelerate organic growth Maintain sound risk management Develop disciplined capital allocation Strong 1Q21 results Operating earnings per share of $0.50 and ROAA of 1.46% NIM adjusted for excess deposits and PPP was relatively flat at 3.35% Loans grew on an average basis by 11.5% annualized (excluding PPP) Operating efficiency ratio of 53.88%, a record low Proactive risk management Improvement in criticized and classified loans Minimal loan deferrals to a small and diminishing number of borrowers Net Charge-offs have averaged <$140,000 the last 8 quarters Disciplined capital allocation Investing in core business expanding in Knoxville and hiring additional MTN bankers Increased quarterly dividend 20% Announced substantial share repurchase to be opportunistic at the appropriate time 1Q21 Highlights
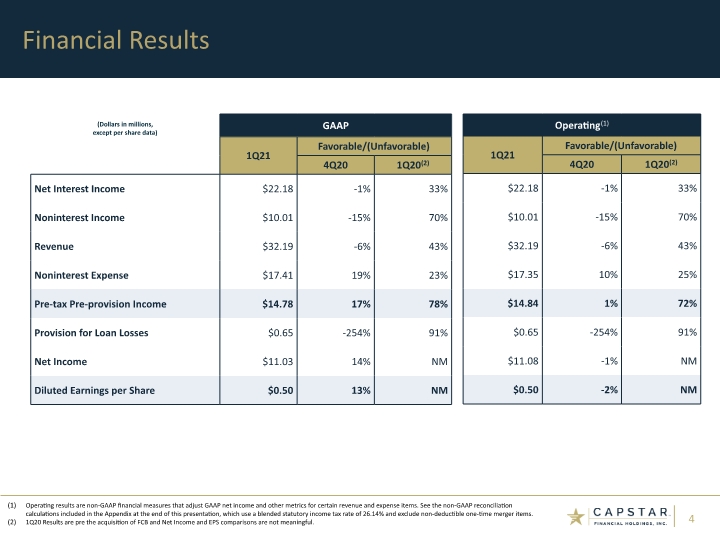
Financial Results Operating results are non-GAAP financial measures that adjust GAAP net income and other metrics for certain revenue and expense items. See the non-GAAP reconciliation calculations included in the Appendix at the end of this presentation, which use a blended statutory income tax rate of 26.14% and exclude non-deductible one-time merger items. 1Q20 Results are pre the acquisition of FCB and Net Income and EPS comparisons are not meaningful.
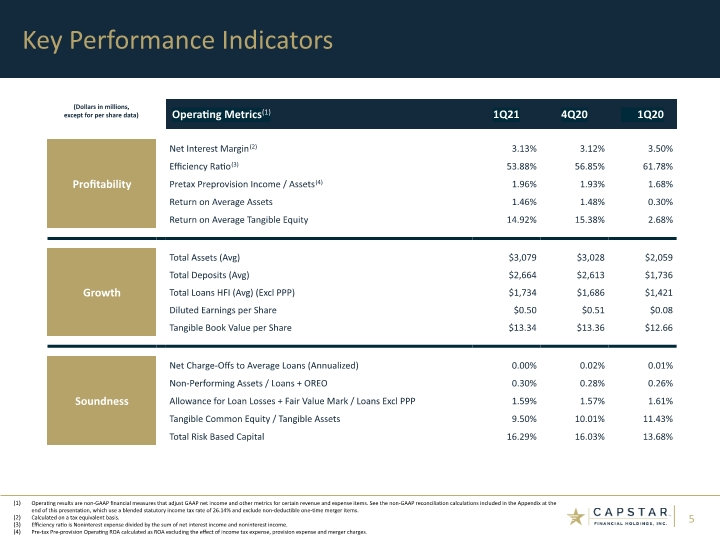
Key Performance Indicators Operating results are non-GAAP financial measures that adjust GAAP net income and other metrics for certain revenue and expense items. See the non-GAAP reconciliation calculations included in the Appendix at the end of this presentation, which use a blended statutory income tax rate of 26.14% and exclude non-deductible one-time merger items. Calculated on a tax equivalent basis. Efficiency ratio is Noninterest expense divided by the sum of net interest income and noninterest income. Pre-tax Pre-provision Operating ROA calculated as ROA excluding the effect of income tax expense, provision expense and merger charges. (Dollars in millions, except for per share data)

Financial Detail
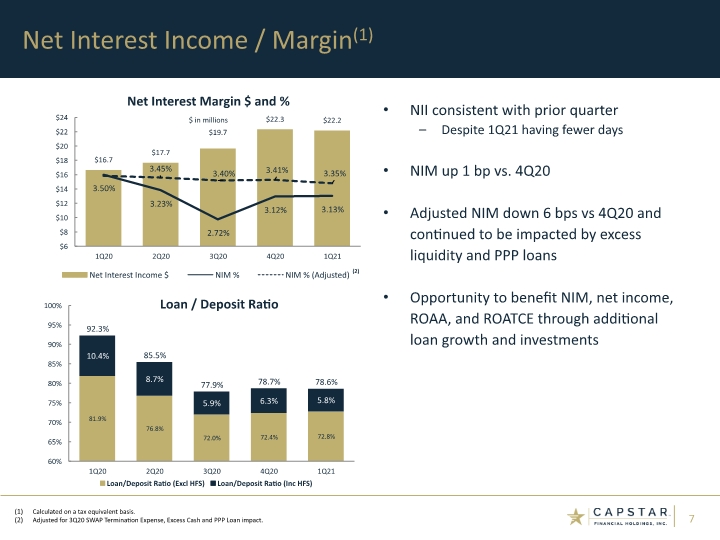
Net Interest Income / Margin(1) NII consistent with prior quarter Despite 1Q21 having fewer days NIM up 1 bp vs. 4Q20 Adjusted NIM down 6 bps vs 4Q20 and continued to be impacted by excess liquidity and PPP loans Opportunity to benefit NIM, net income, ROAA, and ROATCE through additional loan growth and investments Calculated on a tax equivalent basis. Adjusted for 3Q20 SWAP Termination Expense, Excess Cash and PPP Loan impact. (2)
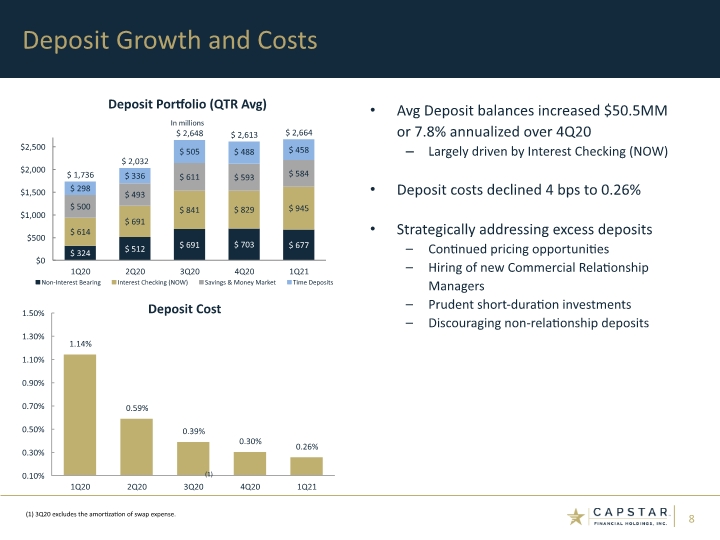
Deposit Growth and Costs Avg Deposit balances increased $50.5MM or 7.8% annualized over 4Q20 Largely driven by Interest Checking (NOW) Deposit costs declined 4 bps to 0.26% Strategically addressing excess deposits Continued pricing opportunities Hiring of new Commercial Relationship Managers Prudent short-duration investments Discouraging non-relationship deposits (1) 3Q20 excludes the amortization of swap expense. (1)
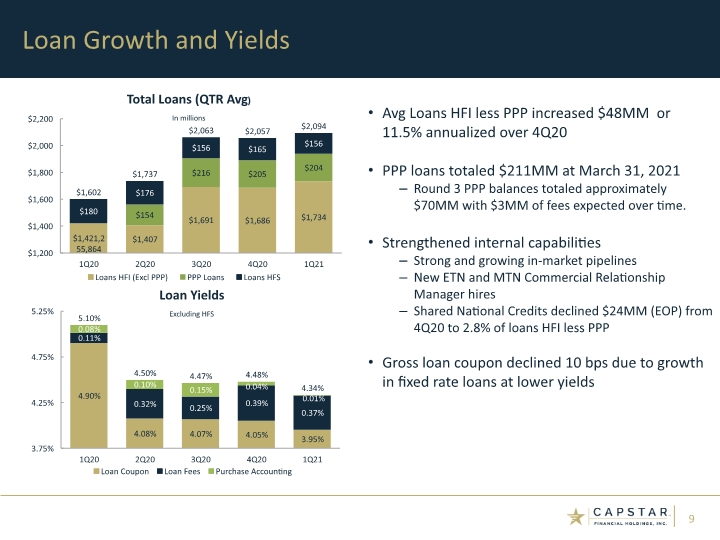
Avg Loans HFI less PPP increased $48MM or 11.5% annualized over 4Q20 PPP loans totaled $211MM at March 31, 2021 Round 3 PPP balances totaled approximately $70MM with $3MM of fees expected over time. Strengthened internal capabilities Strong and growing in-market pipelines New ETN and MTN Commercial Relationship Manager hires Shared National Credits declined $24MM (EOP) from 4Q20 to 2.8% of loans HFI less PPP Gross loan coupon declined 10 bps due to growth in fixed rate loans at lower yields Loan Growth and Yields
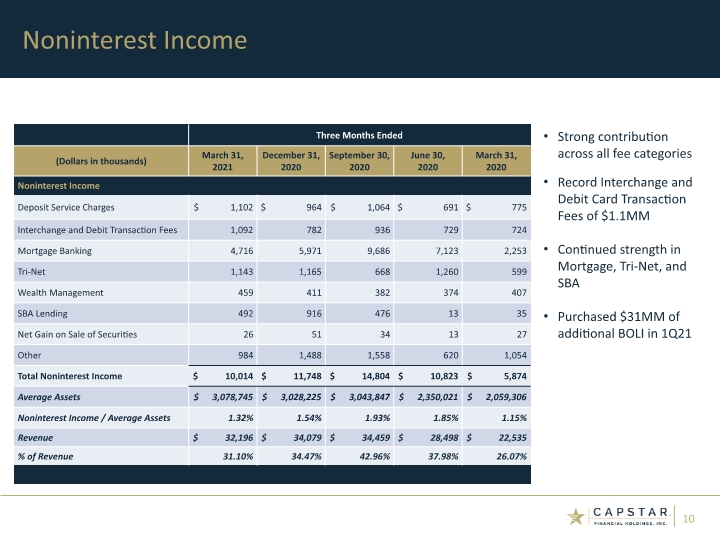
Noninterest Income Strong contribution across all fee categories Record Interchange and Debit Card Transaction Fees of $1.1MM Continued strength in Mortgage, Tri-Net, and SBA Purchased $31MM of additional BOLI in 1Q21
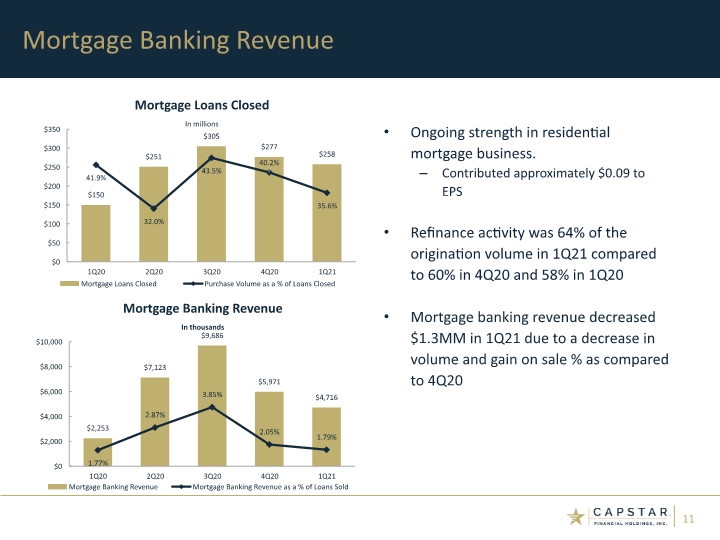
Ongoing strength in residential mortgage business. Contributed approximately $0.09 to EPS Refinance activity was 64% of the origination volume in 1Q21 compared to 60% in 4Q20 and 58% in 1Q20 Mortgage banking revenue decreased $1.3MM in 1Q21 due to a decrease in volume and gain on sale % as compared to 4Q20 Mortgage Banking Revenue
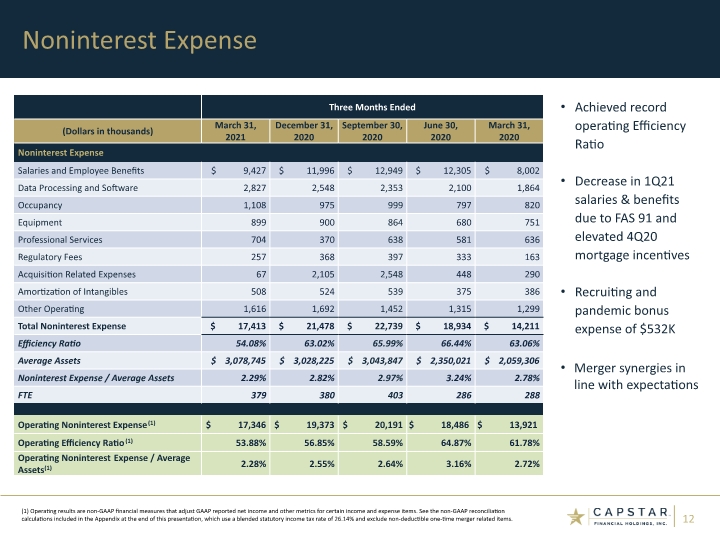
Noninterest Expense (1) Operating results are non-GAAP financial measures that adjust GAAP reported net income and other metrics for certain income and expense items. See the non-GAAP reconciliation calculations included in the Appendix at the end of this presentation, which use a blended statutory income tax rate of 26.14% and exclude non-deductible one-time merger related items. Achieved record operating Efficiency Ratio Decrease in 1Q21 salaries & benefits due to FAS 91 and elevated 4Q20 mortgage incentives Recruiting and pandemic bonus expense of $532K Merger synergies in line with expectations
Risk Management
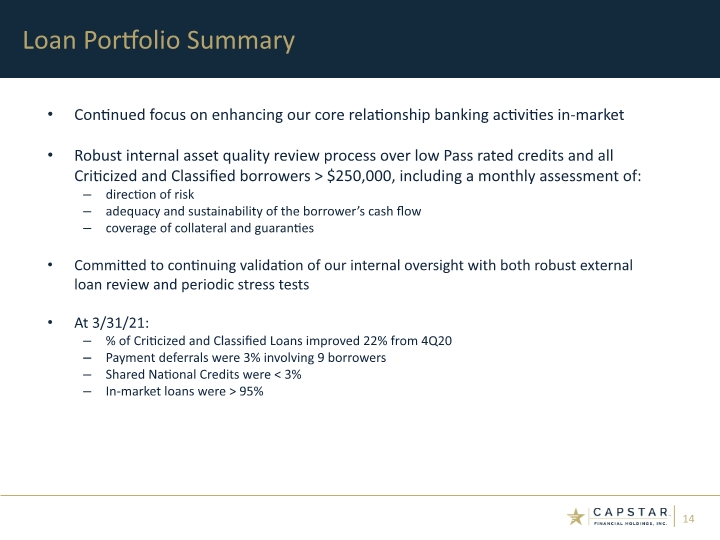
Continued focus on enhancing our core relationship banking activities in-market Robust internal asset quality review process over low Pass rated credits and all Criticized and Classified borrowers > $250,000, including a monthly assessment of: direction of risk adequacy and sustainability of the borrower’s cash flow coverage of collateral and guaranties Committed to continuing validation of our internal oversight with both robust external loan review and periodic stress tests At 3/31/21: % of Criticized and Classified Loans improved 22% from 4Q20 Payment deferrals were 3% involving 9 borrowers Shared National Credits were < 3% In-market loans were > 95% Loan Portfolio Summary (1)
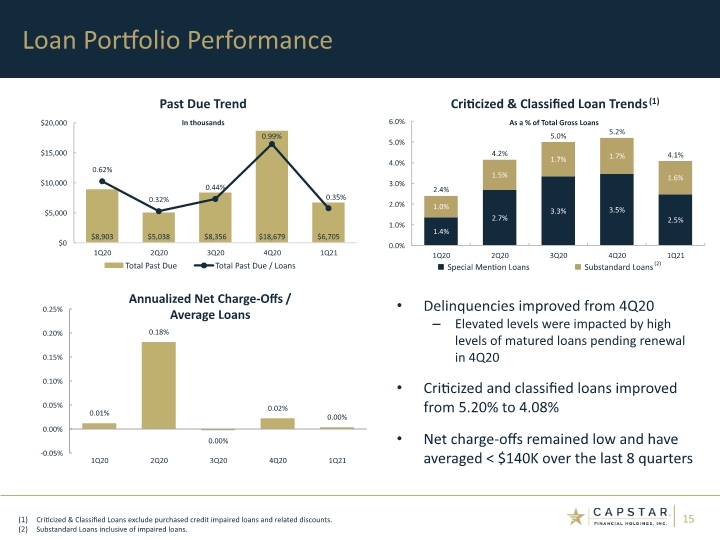
Loan Portfolio Performance (1) Delinquencies improved from 4Q20 Elevated levels were impacted by high levels of matured loans pending renewal in 4Q20 Criticized and classified loans improved from 5.20% to 4.08% Net charge-offs remained low and have averaged < $140K over the last 8 quarters Criticized & Classified Loans exclude purchased credit impaired loans and related discounts. Substandard Loans inclusive of impaired loans. (2)
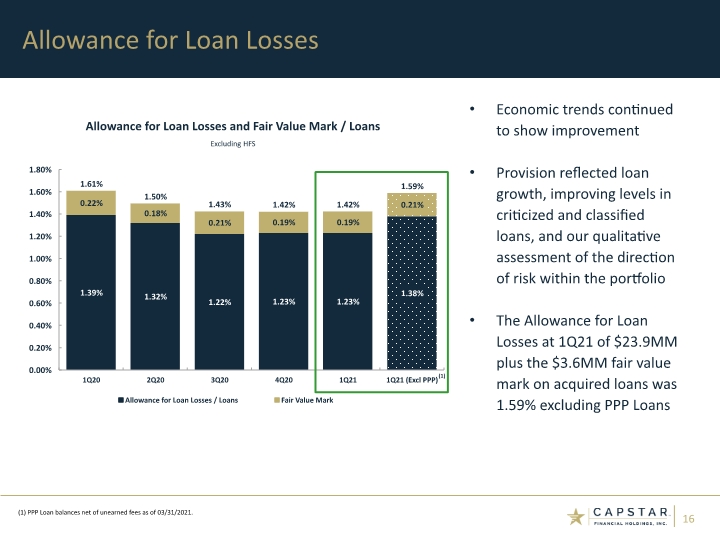
Allowance for Loan Losses Economic trends continued to show improvement Provision reflected loan growth, improving levels in criticized and classified loans, and our qualitative assessment of the direction of risk within the portfolio The Allowance for Loan Losses at 1Q21 of $23.9MM plus the $3.6MM fair value mark on acquired loans was 1.59% excluding PPP Loans (1) PPP Loan balances net of unearned fees as of 03/31/2021. (1)
Capital Management
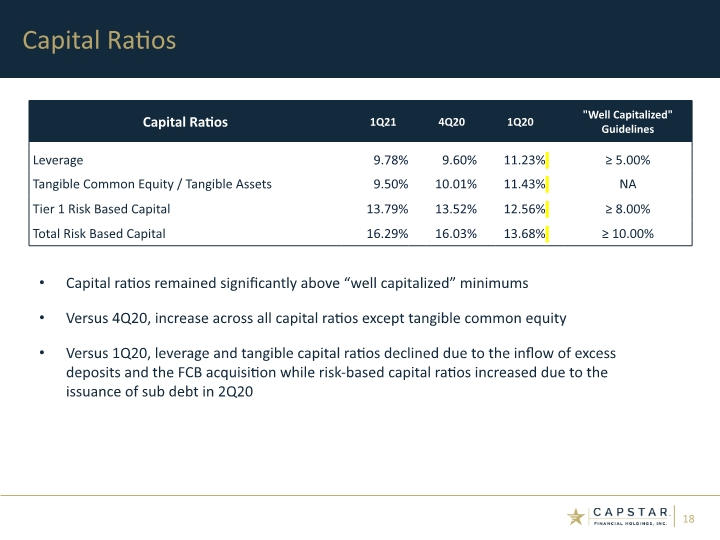
Capital Ratios Capital ratios remained significantly above “well capitalized” minimums Versus 4Q20, increase across all capital ratios except tangible common equity Versus 1Q20, leverage and tangible capital ratios declined due to the inflow of excess deposits and the FCB acquisition while risk-based capital ratios increased due to the issuance of sub debt in 2Q20
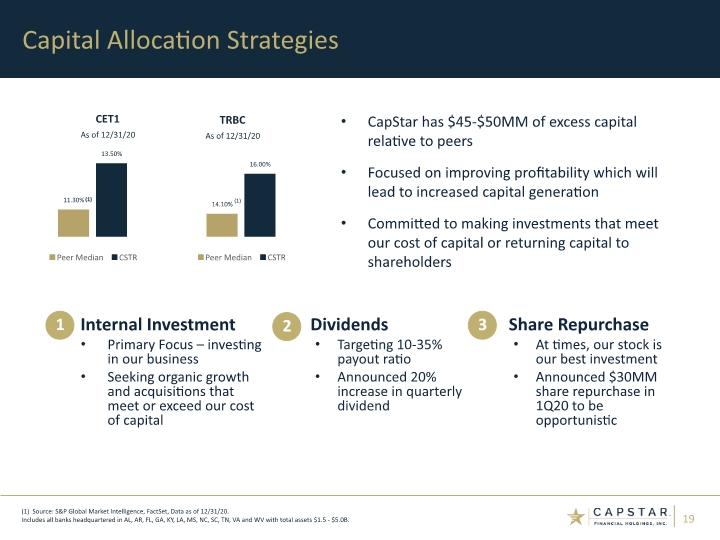
Capital Allocation Strategies Internal Investment Primary Focus – investing in our business Seeking organic growth and acquisitions that meet or exceed our cost of capital Dividends Targeting 10-35% payout ratio Announced 20% increase in quarterly dividend Share Repurchase At times, our stock is our best investment Announced $30MM share repurchase in 1Q20 to be opportunistic (1) (1) (1) Source: S&P Global Market Intelligence, FactSet, Data as of 12/31/20. Includes all banks headquartered in AL, AR, FL, GA, KY, LA, MS, NC, SC, TN, VA and WV with total assets $1.5 - $5.0B. 1 2 3 CapStar has $45-$50MM of excess capital relative to peers Focused on improving profitability which will lead to increased capital generation Committed to making investments that meet our cost of capital or returning capital to shareholders
Appendix: Other Financial Results and Non-GAAP Reconciliations
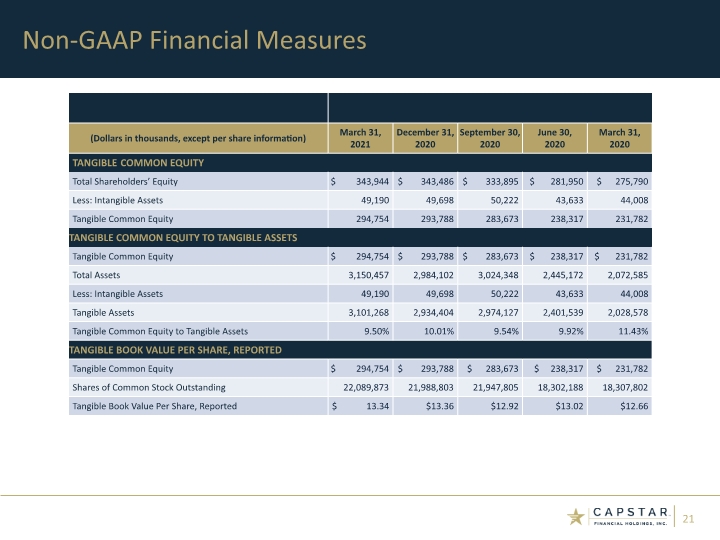
Non-GAAP Financial Measures
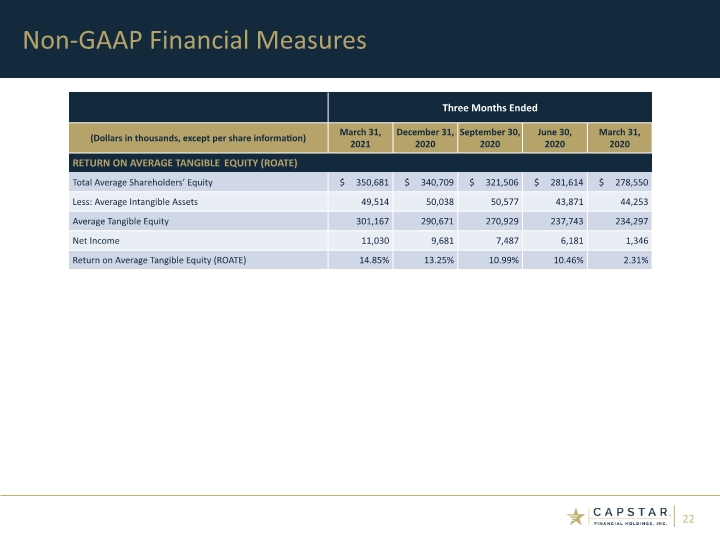
Non-GAAP Financial Measures
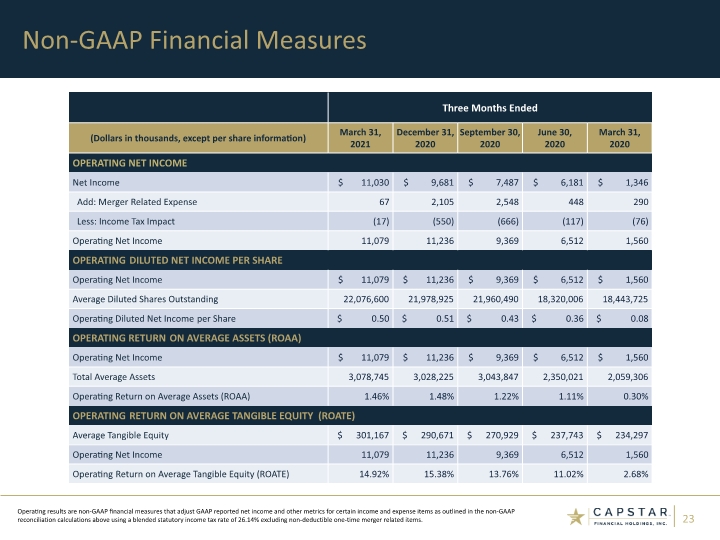
Non-GAAP Financial Measures Operating results are non-GAAP financial measures that adjust GAAP reported net income and other metrics for certain income and expense items as outlined in the non-GAAP reconciliation calculations above using a blended statutory income tax rate of 26.14% excluding non-deductible one-time merger related items.
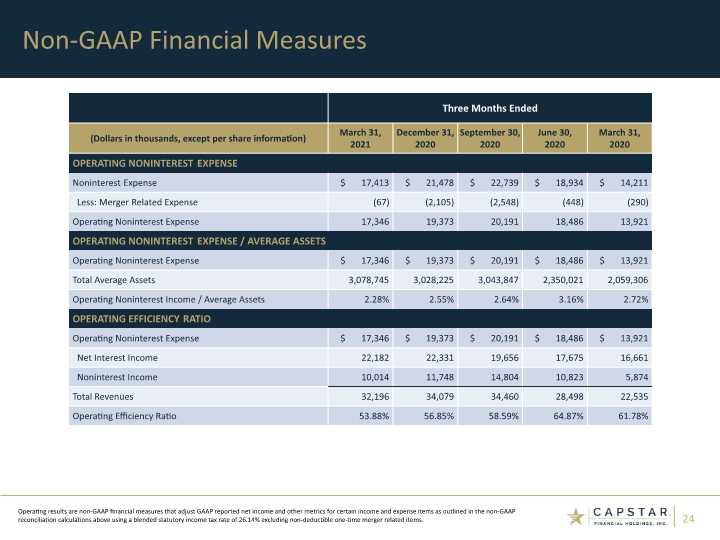
Non-GAAP Financial Measures Operating results are non-GAAP financial measures that adjust GAAP reported net income and other metrics for certain income and expense items as outlined in the non-GAAP reconciliation calculations above using a blended statutory income tax rate of 26.14% excluding non-deductible one-time merger related items.
CapStar Financial Holdings, Inc. 1201 Demonbreun Street, Suite 700 Nashville, TN 37203 Mail: P.O. Box 305065 Nashville, TN 37230-5065 (615) 732-6400 Telephone www.capstarbank.com (615) 732-6455 Email: ir@capstarbank.com Contact Information Investor Relations Executive Leadership Denis J. Duncan Chief Financial Officer CapStar Financial Holdings, Inc. (615) 732-7492 Email: denis.duncan@capstarbank.com Corporate Headquarters

