Attached files
| file | filename |
|---|---|
| 8-K - 8-K - Amalgamated Financial Corp. | amal-20210422.htm |
| EX-99.1 - PRESS RELEASE - Amalgamated Financial Corp. | a202103earningsrelease.htm |

amalgamatedbank.com Member FDIC Amalgamated Financial Corp. First Quarter 2021 Earnings Presentation April 22, 2021

2 Safe Harbor Statements INTRODUCTION On March 1, 2021 (the “Effective Date”), Amalgamated Financial Corp. (the “Company”) completed its holding company reorganization and acquired all of the outstanding stock of Amalgamated Bank (the “Bank”). In this presentation, unless the context indicates otherwise, references to “we,” “us,” and “our” refer to the Company and the Bank. However, if the discussion relates to a period before the Effective Date, the terms refer only to the Bank. FORWARD-LOOKING STATEMENTS This presentation contains forward-looking statements within the meaning of the Private Securities Litigation Reform Act, Section 21E of the Securities Exchange Act of 1934, as amended. any statement that does not describe historical or current facts is a forward-looking statement. These statements generally can be identified by forward-looking terminology, such as “plan,” “seek to,” “outlook,” “guidance,” “may,” “will,” “anticipate,” “should,” “would,” “believe,” “contemplate,” “expect,” “estimate,” “continue,” “initiatives,” and “intend,” as well as other similar words and expressions of the future. These forward-looking statements include, but are not limited to, our 2021 Guidance and, statements related to future loss/income of solar tax equity investments. These forward-looking statements are subject to known and unknown risks, uncertainties and other factors, many of which are beyond our control and any or all of which could cause actual results to differ materially from the results expressed or implied by such forward-looking statements. These risks and uncertainties include, but are not limited to: • negative economic and political conditions that adversely affect the general economy, housing prices, the real estate market, the job market, consumer confidence, the financial condition of our borrowers and consumer spending habits, which may affect, among other things, the level of non-performing assets, charge-offs and provision expense; • the rate of growth (or lack thereof) in the economy and employment levels, as well as general business and economic conditions, coupled with the risk that adverse conditions may be greater than anticipated in the markets that we serve; • the COVID-19 pandemic and its effects on the economic and business environments in which we operate; • continuation of the historically low short-term interest rate environment; • fluctuations or unanticipated changes in interest rates on loans or deposits or that affect the yield curve; • our inability to maintain the historical growth rate of its loan portfolio; • changes in loan underwriting, credit review or loss reserve policies associated with economic conditions, examination conclusions, or regulatory developments either as they currently exist or as they may be affected by conditions associated with the COVID-19 pandemic; • the impact of competition with other financial institutions, many of which are larger and have greater resources, as well as changes in the competitive environment; • our ability to meet heightened regulatory and supervisory requirements; • our ability to grow and retain low-cost core deposits and retain large, uninsured deposits; • any matter that would cause us to conclude that there was impairment of any asset, including intangible assets; • inability to comply with regulatory capital requirements, including those resulting from changes to capital calculation methodologies, required capital maintenance levels or regulatory requests or directives; • risks associated with litigation, including the applicability of insurance coverage; • the risk of not achieving anticipated cost savings related to reduction in salaries and benefits, professional fees and other expense areas; • a failure in or breach of our operational or security systems or infrastructure, or those of third party vendors or other service providers, including as a result of unauthorized access, computer viruses, phishing schemes, spam attacks, human error, natural disasters, power loss and other security breaches, the risk of any of which could be exacerbated by employees and others working remotely as a result of the effects of the COVID-19 pandemic; • volatile credit and financial markets both domestic and foreign; • the risk that the preliminary financial information reported herein and our current preliminary analysis could be different when our review is finalized; • our inability to timely identify a new Chief Executive Officer or Chief Financial Officer in light of, among other things, competition for experienced executives in the banking industry; and • unexpected challenges related to our executive officer transitions. Additional factors which could affect the forward-looking statements can be found in our Annual Report on Form 10-K, Quarterly Reports on Form 10-Q, and Current Reports on Form 8-K filed with the SEC and available on the SEC’s website at www.sec.gov/. Forward-looking statements are based upon the current beliefs and expectations of management, and on information currently available to management. We disclaim any obligation to update or revise any forward-looking statements contained in this presentation, which speak only as of the date hereof, or to update the reasons why actual results could differ from those contained in or implied by such statements, whether as a result of new information, future events or otherwise, except as required by law.

3 Safe Harbor Statements cont. NON-GAAP FINANCIAL MEASURES This presentation contains certain non-GAAP financial measures including, without limitation, “Core Operating Revenue,” “Core Non-interest Expense,” “Tangible Common Equity,” “Average Tangible Common Equity,” “Core Efficiency Ratio,” “Core Net Income,” “Core ROAA,” and “Core ROATCE.” We believe these non-GAAP financial measures provide useful information to management and investors that is supplementary to our financial condition, results of operations and cash flows computed in accordance with GAAP. Specifically, we believe these non-GAAP financial measures (a) allow management and investors to better assess our performance by removing volatility that is associated with discrete items that are unrelated to our core business, and (b) enable a more complete understanding of factors and trends affecting our business. Non-GAAP financial measures, however, have inherent limitations, are not required to be uniformly applied, and are not audited. Accordingly, these non-GAAP financial measures should not be considered as substitutes for GAAP financial measures, and we strongly encourage investors to review the GAAP financial measures included in this presentation and not to place undue reliance on any single financial measure. In addition, because non-GAAP financial measures are not standardized, it may not be possible to compare the non-GAAP financial measures presented in this presentation with other companies’ non-GAAP financial measures having the same or similar names. As such, you should not view these disclosures as a substitute for results determined in accordance with GAAP, and they are not necessarily comparable to non-GAAP financial measures that other companies use. Reconciliations of non-GAAP financial disclosures to what we believe to be the most directly comparable GAAP measures found in this presentation are set forth in the final pages of this presentation and also may be viewed on the bank’s website, amalgamatedbank.com. You should assume that all numbers presented are unaudited unless otherwise noted.
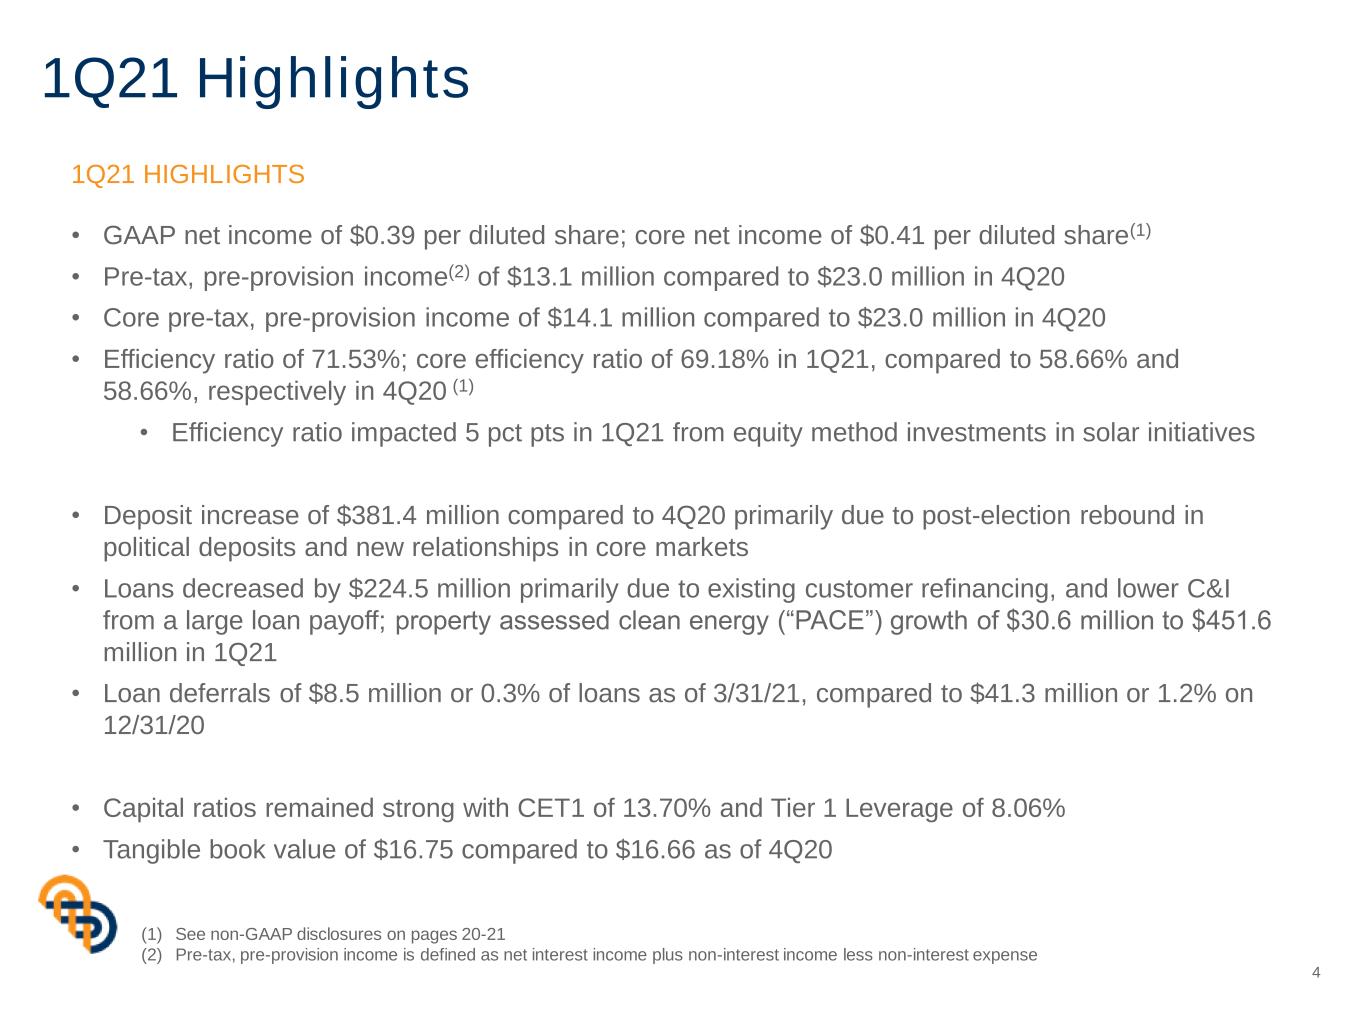
1Q21 Highlights 4 (1) See non-GAAP disclosures on pages 20-21 (2) Pre-tax, pre-provision income is defined as net interest income plus non-interest income less non-interest expense 1Q21 HIGHLIGHTS • GAAP net income of $0.39 per diluted share; core net income of $0.41 per diluted share(1) • Pre-tax, pre-provision income(2) of $13.1 million compared to $23.0 million in 4Q20 • Core pre-tax, pre-provision income of $14.1 million compared to $23.0 million in 4Q20 • Efficiency ratio of 71.53%; core efficiency ratio of 69.18% in 1Q21, compared to 58.66% and 58.66%, respectively in 4Q20 (1) • Efficiency ratio impacted 5 pct pts in 1Q21 from equity method investments in solar initiatives • Deposit increase of $381.4 million compared to 4Q20 primarily due to post-election rebound in political deposits and new relationships in core markets • Loans decreased by $224.5 million primarily due to existing customer refinancing, and lower C&I from a large loan payoff; property assessed clean energy (“PACE”) growth of $30.6 million to $451.6 million in 1Q21 • Loan deferrals of $8.5 million or 0.3% of loans as of 3/31/21, compared to $41.3 million or 1.2% on 12/31/20 • Capital ratios remained strong with CET1 of 13.70% and Tier 1 Leverage of 8.06% • Tangible book value of $16.75 compared to $16.66 as of 4Q20

3,439 3,447 3,223 264 421 452 2,780 3,211 3,703 3,868 3,674 2017 2018 2019 2020 1Q21 3,233 4,105 4,641 5,339 5,720 2017 2018 2019 2020 1Q21 26.4 50.1 68.0 86.7 52.9 2017 2018 2019 2020 1Q21 Trends 5 KEY FINANCIAL TRENDS THROUGH 1Q21 ($ in millions) (1) Compounded Annual Growth Rate (“CAGR”) (2) 1Q21 Pre-tax Pre-Provision earnings are annualized 9.0% CAGR(1) 19.2% CAGR(1) 23.9% CAGR(1) Pre-tax Pre-Provision Earnings(2) Ending Deposits NPA / Total Assets 2.20% 1.27% 1.25% 1.38% 1.27% 2017 2018 2019 2020 1Q21 Loans + PACE
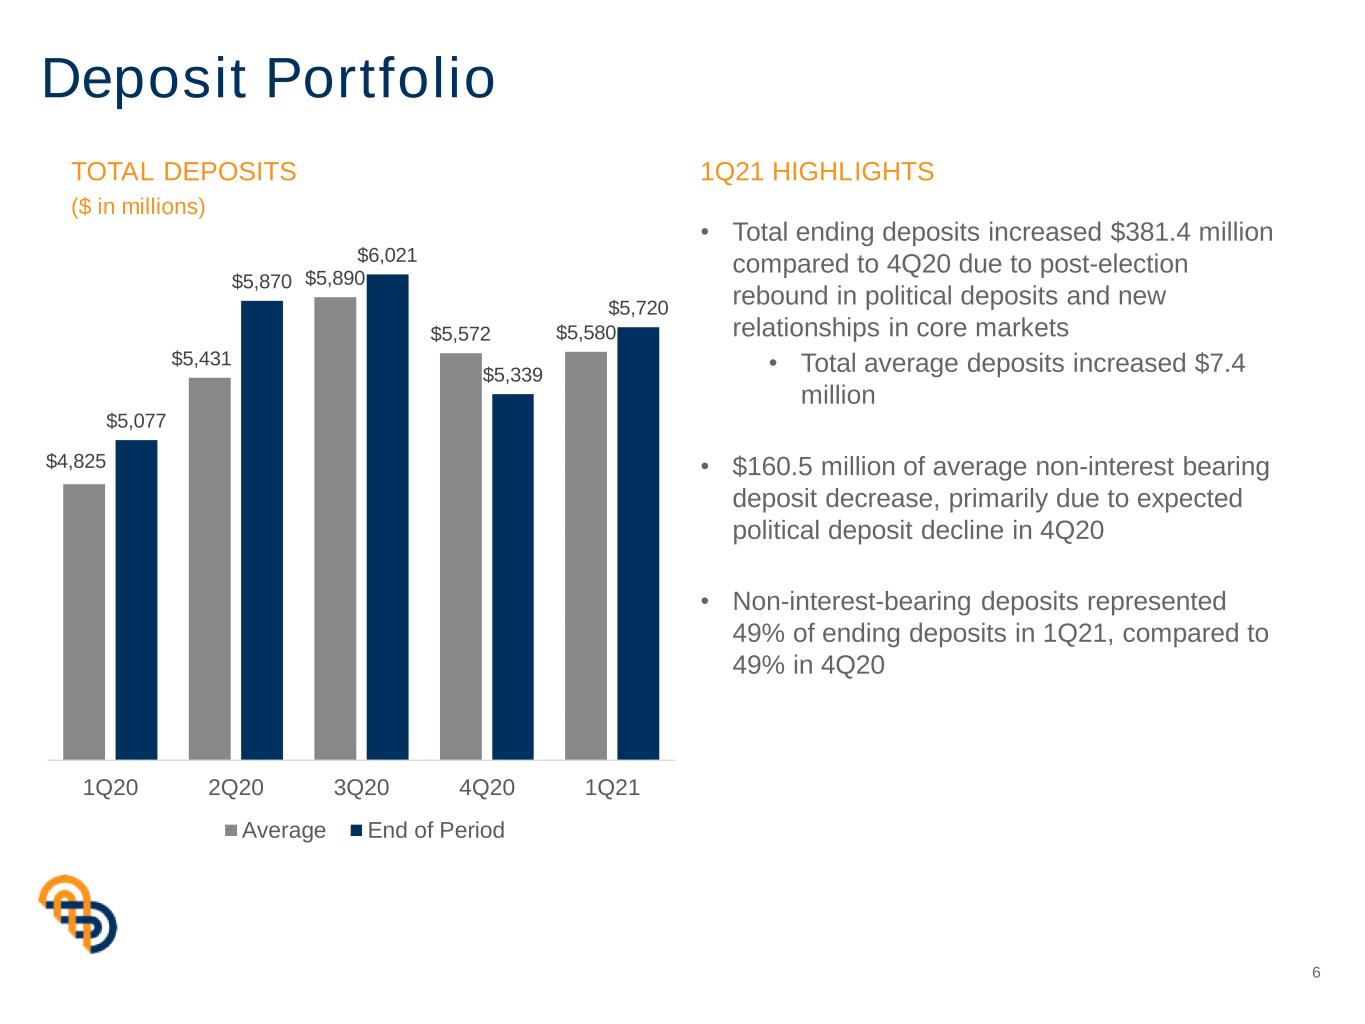
Deposit Portfolio 6 TOTAL DEPOSITS ($ in millions) 1Q21 HIGHLIGHTS • Total ending deposits increased $381.4 million compared to 4Q20 due to post-election rebound in political deposits and new relationships in core markets • Total average deposits increased $7.4 million • $160.5 million of average non-interest bearing deposit decrease, primarily due to expected political deposit decline in 4Q20 • Non-interest-bearing deposits represented 49% of ending deposits in 1Q21, compared to 49% in 4Q20 $4,825 $5,431 $5,890 $5,572 $5,580 $5,077 $5,870 $6,021 $5,339 $5,720 1Q20 2Q20 3Q20 4Q20 1Q21 Average End of Period

Political Deposits 7 HISTORICAL TREND ($ in millions) $85 $124 $156 $242 $321 $416 $398 $182 $271 $419 $511 $579 $775 $1,101 $1,212 $603 $692 $705 1Q17 2Q17 3Q17 4Q17 1Q18 2Q18 3Q18 4Q18 1Q19 2Q19 3Q19 4Q19 1Q20 2Q20 3Q20 4Q20 1Q21 4/19

Interest Earning Assets 8 INTEREST EARNING ASSETS OF $6.1B AS OF MARCH 31, 2021 We maintain a diverse, low risk profile of interest earning assets C&I, Consumer and Other $0.8 B 13% Securities & IB Deposits $2.9 B 47% Multifamily & Commercial Real Estate $1.3 B 21% Residential $1.1 B 19% • No fossil fuel exposure • $256mm of government guaranteed loans • $174mm residential solar loans with strong credit profiles • Predominantly NYC properties with low LTV • $858mm agency securities • $889mm of non-agency securities • $452mm of PACE securities with low LTV • All non-agency securities are top of the capital structure • $177mm of resell agreements and other • $498mm of cash deposits at Bank • 99% first lien mortgages • Low Loan to Original Value = 57% • First lien mortgages average FICO of 763 $6.1B as of 1Q21 Loan to Value (LTV) Pre-COVID 4Q20(1) MF 56% 66% CRE 43% 62% (1) LTV estimate based on updated appraisals and statistical analysis as of Dec 2020
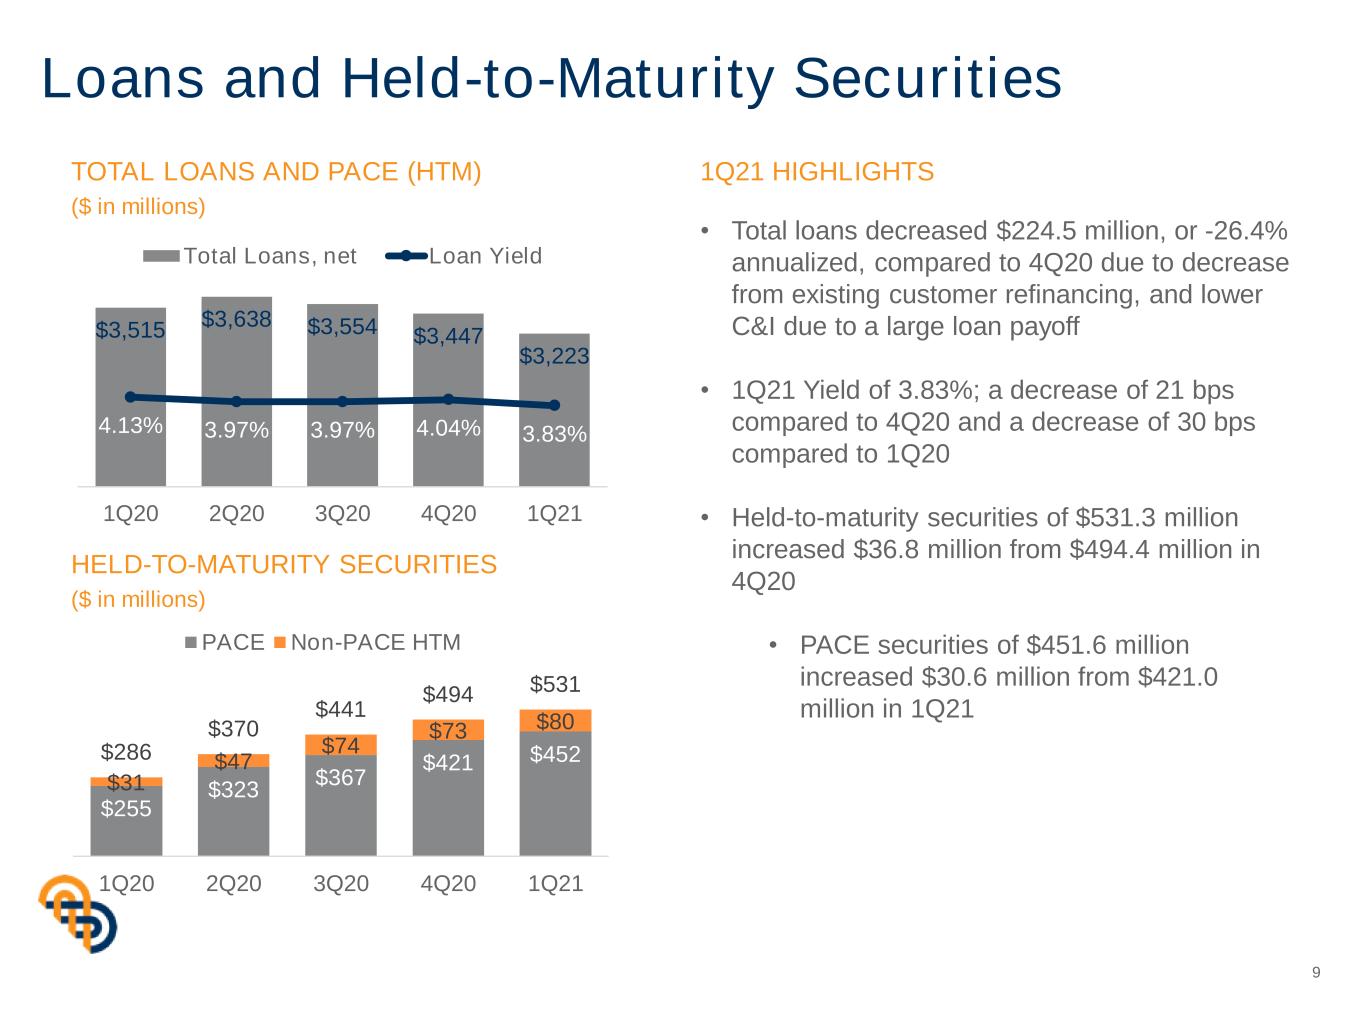
Loans and Held-to-Maturity Securities 9 TOTAL LOANS AND PACE (HTM) ($ in millions) HELD-TO-MATURITY SECURITIES ($ in millions) • Total loans decreased $224.5 million, or -26.4% annualized, compared to 4Q20 due to decrease from existing customer refinancing, and lower C&I due to a large loan payoff • 1Q21 Yield of 3.83%; a decrease of 21 bps compared to 4Q20 and a decrease of 30 bps compared to 1Q20 • Held-to-maturity securities of $531.3 million increased $36.8 million from $494.4 million in 4Q20 • PACE securities of $451.6 million increased $30.6 million from $421.0 million in 1Q21 1Q21 HIGHLIGHTS $255 $323 $367 $421 $452 $31 $47 $74 $73 $80 $286 $370 $441 $494 $531 - 200 400 600 1Q20 2Q20 3Q20 4Q20 1Q21 PACE Non-PACE HTM $3,515 $3,638 $3,554 $3,447 $3,223 4.13% 3.97% 3.97% 4.04% 3.83% 1.00% 3.00% 5.00% 7.00% 1,500 2,000 2,500 3,000 3,500 1Q20 2Q20 3Q20 4Q20 1Q21 Total Loans, net Loan Yield
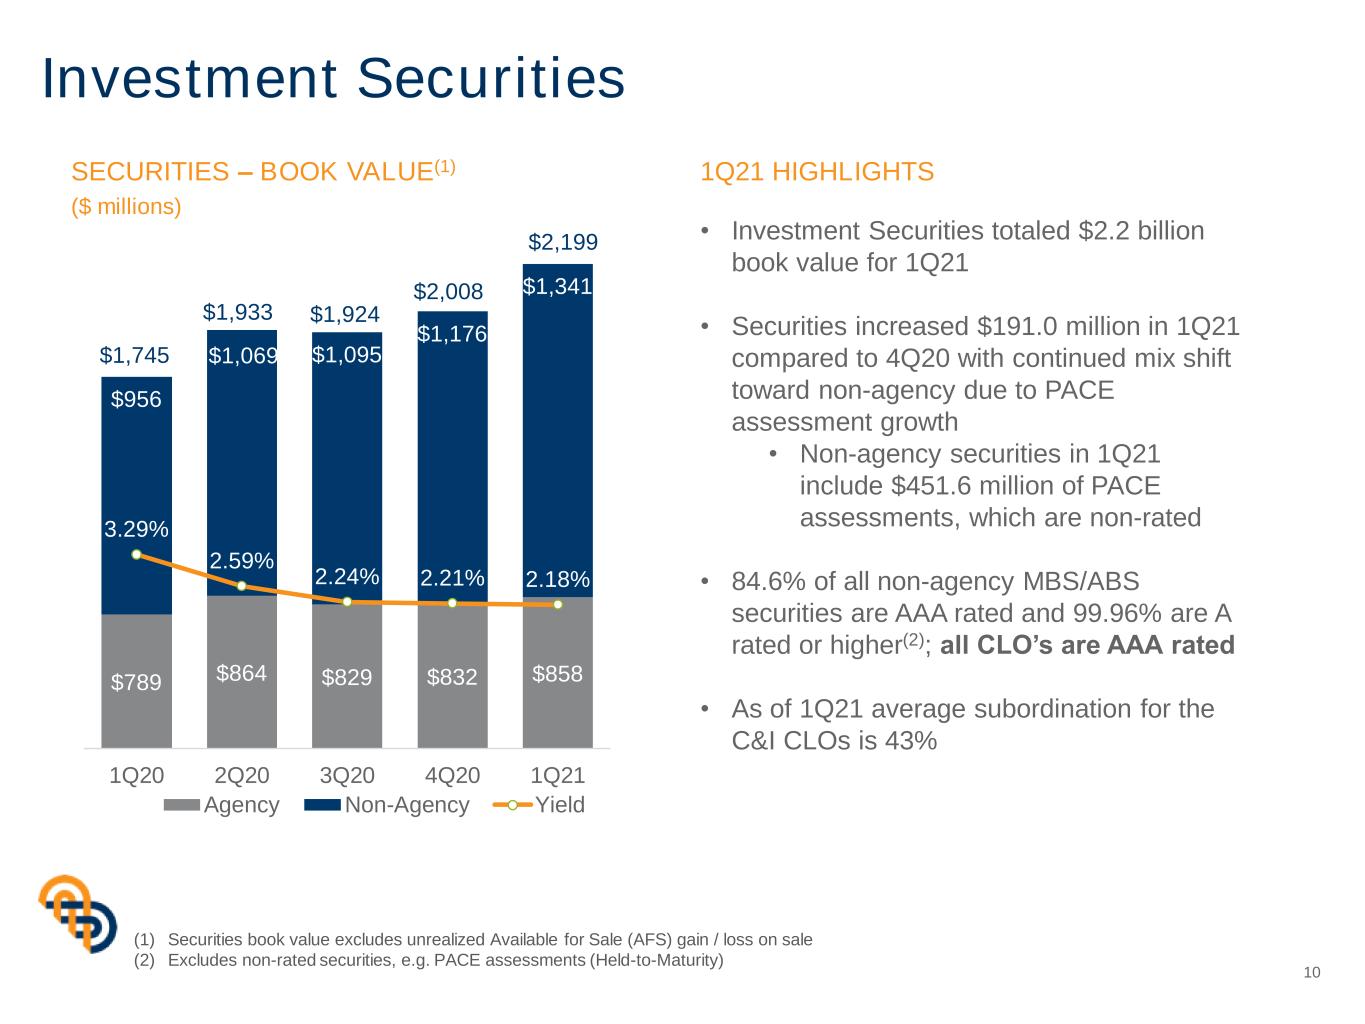
Investment Securities 10 SECURITIES – BOOK VALUE(1) ($ millions) (1) Securities book value excludes unrealized Available for Sale (AFS) gain / loss on sale (2) Excludes non-rated securities, e.g. PACE assessments (Held-to-Maturity) • Investment Securities totaled $2.2 billion book value for 1Q21 • Securities increased $191.0 million in 1Q21 compared to 4Q20 with continued mix shift toward non-agency due to PACE assessment growth • Non-agency securities in 1Q21 include $451.6 million of PACE assessments, which are non-rated • 84.6% of all non-agency MBS/ABS securities are AAA rated and 99.96% are A rated or higher(2); all CLO’s are AAA rated • As of 1Q21 average subordination for the C&I CLOs is 43% 1Q21 HIGHLIGHTS $789 $864 $829 $832 $858 $956 $1,069 $1,095 $1,176 $1,341 $1,745 $1,933 $1,924 $2,008 $2,199 3.29% 2.59% 2.24% 2.21% 2.18% -1.00% 1.00% 3.00% 5.00% 7.00% 9.00% 250 450 650 850 1050 1250 1450 1650 1850 2050 2250 1Q20 2Q20 3Q20 4Q20 1Q21 Agency Non-Agency Yield

$44.7 $44.4 $45.2 $45.7 $41.8 3.46% 3.10% 2.88% 3.06% 2.85% 0.00% 1.00% 2.00% 3.00% 4.00% 5.00% 6.00% 7.00% 8.00% 9.00% 25.0 30.0 35.0 40.0 45.0 50.0 1Q20 2Q20 3Q20 4Q20 1Q21 Net Interest Income Net Interest Margin Net Interest Income and Margin 11 NET INTEREST INCOME & MARGIN ($ millions) • Net interest income is $41.8 million, compared to $45.7 million in 4Q20 • 1Q21 NIM at 2.85%; a decrease of 21 bps and 61 bps, compared to 4Q20 and 1Q20, respectively • NIM is negatively impacted by approximately 14 bps due to the high-level of cash on the balance sheet • Loan prepayment penalties favorably impacted NIM by 4 bps in 1Q21, compared to 13 bps and 6 bps in 4Q20 and 1Q21, respectively 1Q21 HIGHLIGHTS
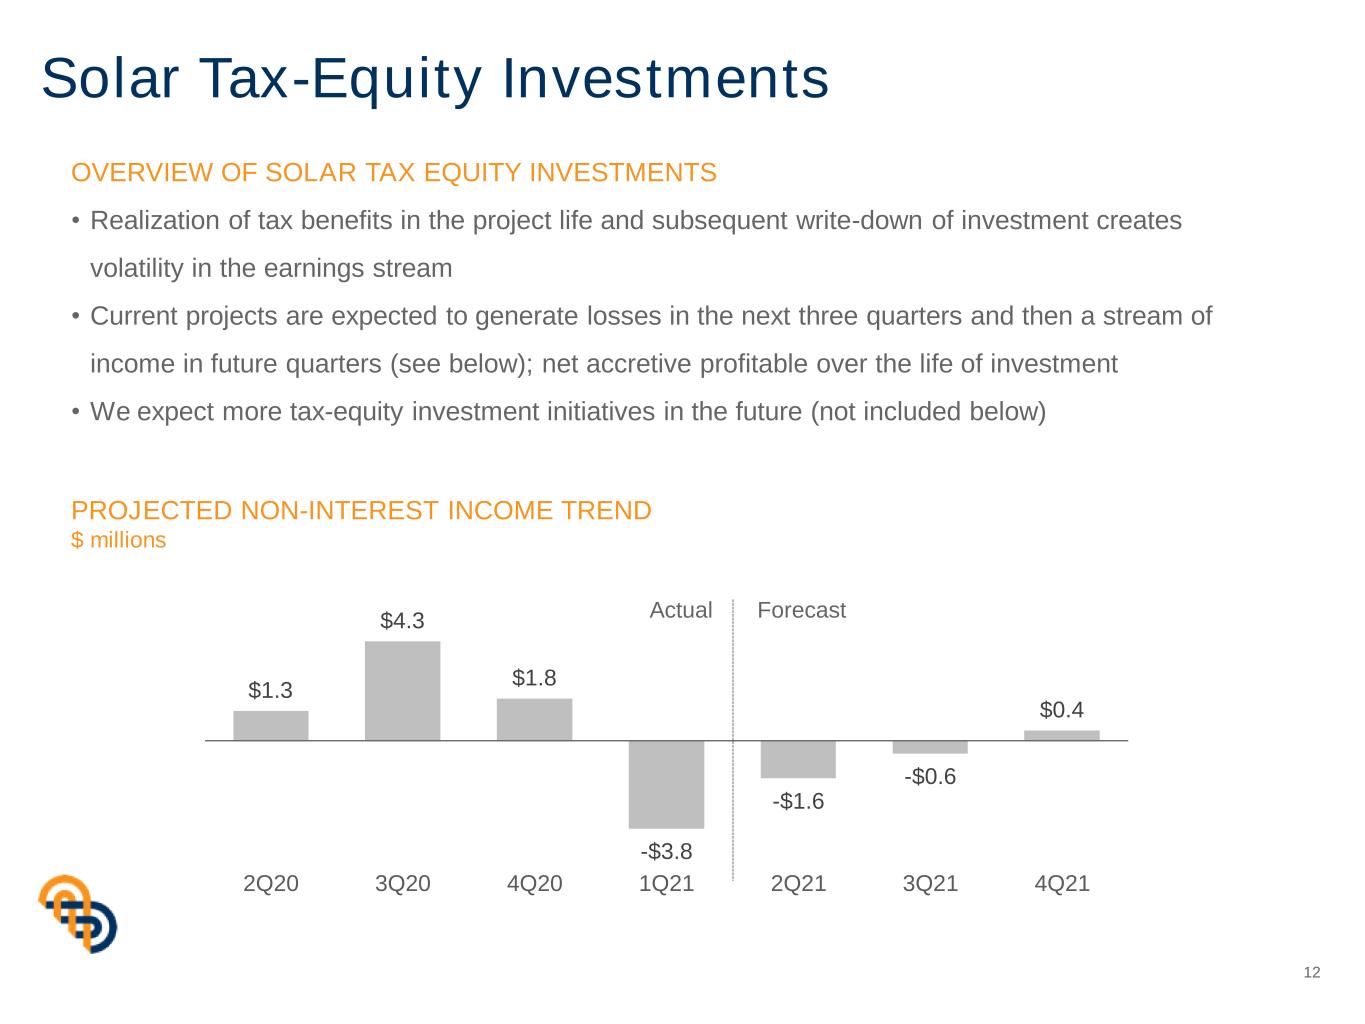
Solar Tax-Equity Investments OVERVIEW OF SOLAR TAX EQUITY INVESTMENTS • Realization of tax benefits in the project life and subsequent write-down of investment creates volatility in the earnings stream • Current projects are expected to generate losses in the next three quarters and then a stream of income in future quarters (see below); net accretive profitable over the life of investment • We expect more tax-equity investment initiatives in the future (not included below) PROJECTED NON-INTEREST INCOME TREND $ millions 12 Actual Forecast $1.3 $4.3 $1.8 -$3.8 -$1.6 -$0.6 $0.4 (5.0) (3.0) (1.0) 1.0 3.0 5.0 7.0 2Q20 3Q20 4Q20 1Q21 2Q21 3Q21 4Q21

$30.8 $30.4 $31.5 $32.7 $31.7$32.3 $31.1 $37.9 $32.7 $32.8 59.4% 57.7% 54.8% 58.7% 69.2% 60.0% 58.5% 65.3% 58.7% 71.5% 40.00% 50.00% 60.00% 70.00% 80.00% 90.00% 100.00% 0.0 5.0 10.0 15.0 20.0 25.0 30.0 35.0 40.0 45.0 50.0 1Q20 2Q20 3Q20 4Q20 1Q21 Core NIX NIX Core Eff Ratio Eff Ratio Non-Interest Expense and Efficiency 13 NON-INTEREST EXPENSE ($ millions) • Efficiency ratio of 71.5% for 1Q21 • Core efficiency ratio of 69.2% for 1Q21(1) • Non-interest expense for 1Q21 is $32.8 million • Non-interest expense for 1Q21 is $0.1 million higher compared to 4Q20 primarily due to a $1.1 million severance related to the modernization of our Trust Department, partially offset by lower advertising and professional service expenses • Efficiency ratio excluding equity method investments in solar initiatives is 66.2% for 1Q21 and 60.6% for 4Q20 1Q21 HIGHLIGHTS (1) See non-GAAP disclosures on pages 20-21

1.19% 1.36% 1.34% 1.19% 1.13% 1Q20 2Q20 3Q20 4Q20 1Q21 Allowance for Loan Losses 14 ALLOWANCE FOR LOAN LOSSES / TOTAL LOANS ALLOWANCE FOR LOAN LOSSES (ALLL) CHANGE FROM 4Q19 TO 1Q21 ($ millions) • Allowance for loan losses totals $36.7 million in 1Q21, or $4.9 million lower compared to 4Q20 due to lower loan balances and changes in credit quality • 1Q21 allowance is $5.7 million lower than 1Q20 due to release of specific reserves, partially offset by COVID-19 factors 1Q21 HIGHLIGHTS 4Q19 ALLL 33.8 COVID-19 factors 6.2 Indirect C&I 4.7 Growth / other 3.3 Specific reserves (6.5) 4Q20 ALLL 41.6 Loan balances (2.4) Changes in credit quality (1.9) Qualitative factors (0.6) 1Q21 ALLL 36.7

Credit Quality Portfolio 15 NPA / TOTAL ASSETS NCO / AVERAGE LOANS (1) (Quarter trend) 1Q21 HIGHLIGHTS • Nonperforming assets are $81.0 million as of 1Q21, compared to $82.2 million in 4Q20 • Net charge-offs of 0.20% in 1Q21 is 104 bps lower than 4Q20 due to $6.0 million in charge-offs primarily related to hotel and construction loans • Loan deferrals of $9 million represent 0.26% of portfolio (1) Annualized 0.01% 0.06% 0.59% 1.24% 0.20% 1Q20 2Q20 3Q20 4Q20 1Q21 1.14% 1.15% 1.22% 1.38% 1.27% 1Q20 2Q20 3Q20 4Q20 1Q21 as of 3/31/21: % of Total Loans Deferrals Portfolio Multifamily $882 - -% CRE & Construction 415 - -% C&I 613 3 0.41% Residential 1,138 5 0.43% Consumer & Student 206 1 0.55% Total $3,254 $9 0.26% COVID-19 LOAN DEFERRALS ($ millions)

7.6% 8.6% 9.6% 10.3% 9.1% 7.7% 9.1% 13.4% 10.7% 10.1% 0.00% 2.00% 4.00% 6.00% 8.00% 10.00% 12.00% 14.00% 16.00% 18.00% 20.00% 1Q20 2Q20 3Q20 4Q20 1Q21 ROAE CORE ROATCE Returns 16 (1) See non-GAAP disclosures on pages 20-21 ROAE & CORE ROATCE (1)

Capital 17 TIER 1 LEVERAGE RATIO COMMON EQUITY TIER 1 RATIO • Regulatory capital ratios remain strong • Tier 1 leverage ratio of 8.06% as of 1Q21 • Common Equity Tier 1 Capital of 13.70% • Tier 1 leverage ratio is 25 bps lower due to approximately $380 million in excess cash from strong deposit growth 1Q21 HIGHLIGHTS 8.47% 7.69% 7.39% 7.97% 8.06% 1Q20 2Q20 3Q20 4Q20 1Q21 12.74% 12.32% 12.76% 13.11% 13.70% 1Q20 2Q20 3Q20 4Q20 1Q21

2021 Guidance 18 2021 FINANCIAL OUTLOOK • Core Pre-tax pre-provision earnings of $72 to $88 million • Excludes impact of solar tax equity income/(loss) and any future non-core items • Year-end 2020 yield curve with no change in Fed rate targets • Approximately 10% balance sheet growth, driven by deposits • Core expenses expected to run higher in Q1 and Q2 due to strategic projects and investments and then lower in the second half of 2021 2021 INITIATIVES • Strategic repositioning of custody services • Launch of ESG ResponsiFunds (sub-advised by Invesco) • CEO Transition • Explore the opening of Los Angeles office in second half of 2021 NO CHANGE TO ANNUAL GUIDANCE - PREVIOUSLY PROVIDED

Appendix

Reconciliation of Non-GAAP Financials 20 As of and for the Three Months Ended March 31, December 31, March 31, (in thousands) 2021 2020 2020 Core operating revenue Net Interest income $ 41,844 $ 45,655 $ 44,689 Non-interest income 4,000 10,040 9,118 Less: Branch sale loss (gain) (1) - - (1,428) Less: Securities gain, net (18) - (499) Core operating revenue $ 45,826 $ 55,695 $ 51,880 Core non-interest expenses Non-interest expense $ 32,793 $ 32,670 $ 32,270 Less: Branch closure expense (2) - - (1,356) Less: Severance (3) (1,090) - (76) Core non-interest expense $ 31,703 $ 32,670 $ 30,838 Core net income Net Income (GAAP) $ 12,189 $ 13,790 $ 9,545 Less: Branch sale (gain)(1) - - (1,428) Less: Securities loss (gain) (18) - (499) Add: Branch closure expense(2) - - 1,356 Add: Severance(3) 1,090 - 76 Less: Tax on notable items (271) - 130 Core net income (non-GAAP) $ 12,990 $ 13,790 $ 9,180 (1) Fixed Asset branch sale in March 2020 (2) Occupancy and other expense related to closure of branches during our branch rationalization (3) Salary and COBRA expense reimbursement expense for positions eliminated
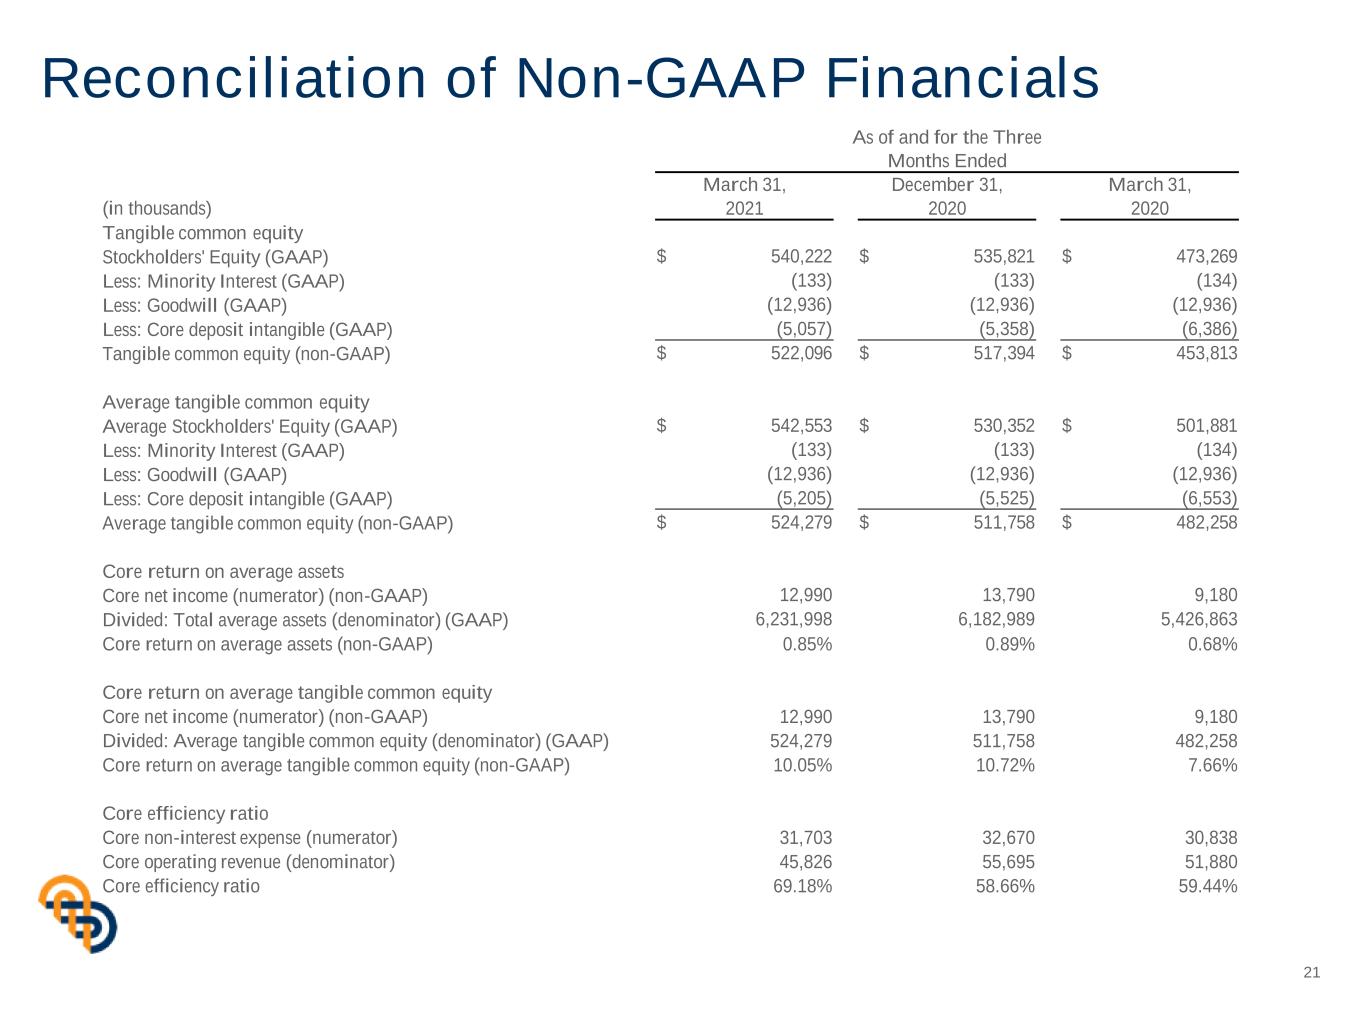
Reconciliation of Non-GAAP Financials 21 As of and for the Three Months Ended March 31, December 31, March 31, (in thousands) 2021 2020 2020 Tangible common equity Stockholders' Equity (GAAP) $ 540,222 $ 535,821 $ 473,269 Less: Minority Interest (GAAP) (133) (133) (134) Less: Goodwill (GAAP) (12,936) (12,936) (12,936) Less: Core deposit intangible (GAAP) (5,057) (5,358) (6,386) Tangible common equity (non-GAAP) $ 522,096 $ 517,394 $ 453,813 Average tangible common equity Average Stockholders' Equity (GAAP) $ 542,553 $ 530,352 $ 501,881 Less: Minority Interest (GAAP) (133) (133) (134) Less: Goodwill (GAAP) (12,936) (12,936) (12,936) Less: Core deposit intangible (GAAP) (5,205) (5,525) (6,553) Average tangible common equity (non-GAAP) $ 524,279 $ 511,758 $ 482,258 Core return on average assets Core net income (numerator) (non-GAAP) 12,990 13,790 9,180 Divided: Total average assets (denominator) (GAAP) 6,231,998 6,182,989 5,426,863 Core return on average assets (non-GAAP) 0.85% 0.89% 0.68% Core return on average tangible common equity Core net income (numerator) (non-GAAP) 12,990 13,790 9,180 Divided: Average tangible common equity (denominator) (GAAP) 524,279 511,758 482,258 Core return on average tangible common equity (non-GAAP) 10.05% 10.72% 7.66% Core efficiency ratio Core non-interest expense (numerator) 31,703 32,670 30,838 Core operating revenue (denominator) 45,826 55,695 51,880 Core efficiency ratio 69.18% 58.66% 59.44%

Thank You amalgamatedbank.com Member FDIC
