Attached files
| file | filename |
|---|---|
| 8-K - CURRENT REPORT - Katapult Holdings, Inc. | ea139732-8k_finserv.htm |
Exhibit 99.1

The leading e - commerce FinTech platform focused on nonprime consumers ANALYST DAY PRESENTATION APRIL 2021
Contents 05 MEET KATAPULT 13 MARKET INSIGHTS 18 THE KATAPULT SOLUTION 36 GROWTH STRATEGY 41 FINANCIAL PERFORMANCE 47 APPENDIX 28 TECHNOLOGY POWERING KATAPULT / 2

This presentation (this “Presentation”) is provided for informational purposes only and has been prepared to assist intereste d p arties in making their own evaluation with respect to a potential business combination between Katapult Holdings, Inc. (“Katapult”) and FinServ Acquisition Corp. (“FinServ”) and related transactions (the “Proposed Business Combination”) and for no other purpose. No representations or warranties, express or implied are given in, or in respect of, this Presentation. To the fullest extent pe rmitted by law in no circumstances will FinServ, Katapult or any of their respective subsidiaries, stockholders, affiliates, representatives, partners, directors, officers, employees, advisers or agents be responsible or liable for any direct, indire ct or consequential loss or loss of profit arising from the use of this Presentation, its contents, its omissions, reliance on t he information contained within it, or on opinions communicated in relation thereto or otherwise arising in connection therewith. Industry a nd market data used in this Presentation have been obtained from third - party industry publications and sources as well as from research reports prepared for other purposes. None of FinServ or Katapult has independently verified the data obtained from t hes e sources and cannot assure you of the data’s accuracy or completeness. This data is subject to change. In addition, this Presentation does not purport to be all - inclusive or to contain all of the information that may be required to make a full analy sis of Katapult or the Proposed Business Combination. Viewers of this Presentation should each make their own evaluation of Katapult and of the relevance and adequacy of the information and should make such other investigations as they deem necessar y. Forward Looking Statements Certain statements included in this Presentation that are not historical facts are forward - looking statements for purposes of th e safe harbor provisions under the United States Private Securities Litigation Reform Act of 1995. Forward - looking statements generally are accompanied by words such as “believe,” “may,” “will,” “estimate,” “continue,” “anticipate,” “intend,” “expect, ” “ should,” “would,” “plan,” “predict,” “potential,” “seem,” “seek,” “future,” “outlook,” and similar expressions that predict o r indicate future events or trends or that are not statements of historical matters. These forward - looking statements include, but are not limited to, statements regarding estimates and forecasts of other financial and performance metrics and projections o f market opportunity. These statements are based on various assumptions, whether or not identified in this Presentation, and on th e current expectations of Katapult’s and FinServ’s management and are not predictions of actual performance. These forward - looking statements are provided for illustrative purposes only and are not intended to serve as, and must not be relied on by an y investor as, a guarantee, an assurance, a prediction or a definitive statement of fact or probability. Actual events and circumstances are difficult or impossible to predict and will differ from assumptions. Many actual events and circumstances a re beyond the control of Katapult and FinServ. These forward - looking statements are subject to a number of risks and uncertainties, including changes in domestic and foreign business, market, financial, political and legal conditions; the inability of the p art ies to successfully or timely consummate the Proposed Business Combination, including the risk that any required regulatory a ppr ovals are not obtained, are delayed or are subject to unanticipated conditions that could adversely affect the combined company or the expected benefits of the Proposed Business Combination or that the approval of the stockholders of FinServ or Katapult is not obtained; failure to realize the anticipated benefits of the Proposed Business Combination; risks relating to the uncertainty of the projected financial information with respect to Katapult; risks related to the concentration of Katapult’s business among a relatively small number of merchants; the effects of competition on Katapult’s future business; the impact of the COVID - 19 pande mic on Katapult’s business; the ability of FinServ or the combined company to issue equity or equity - linked securities or obtain debt financing in connection with the Proposed Business Combination or in the future, and those factors discussed in FinServ’ s f inal prospectus dated October 31, 2019 and Annual Report on Form 10 - K for the fiscal year ended December 31, 2019, in each case, under the heading “Risk Factors,” and other documents of FinServ filed, or to be filed, with the Securities and Exchang e C ommission (“SEC”). If any of these risks materialize or our assumptions prove incorrect, actual results could differ material ly from the results implied by these forward - looking statements. There may be additional risks that none of FinServ or Katapult presentl y know or that FinServ or Katapult currently believe are immaterial that could also cause actual results to differ from those contained in the forward - looking statements. In addition, forward - looking statements reflect FinServ’s and Katapult’s expectatio ns, plans or forecasts of future events and views as of the date of this Presentation. FinServ and Katapult anticipate that subsequent events and developments will cause FinServ’s and Katapult’s assessments to change. However, while FinServ and Kata pul t may elect to update these forward - looking statements at some point in the future, FinServ and Katapult specifically disclaim any obligation to do so. These forward - looking statements should not be relied upon as representing FinServ’s and Katap ult’s assessments as of any date subsequent to the date of this Presentation. Accordingly, undue reliance should not be place d upon the forward - looking statements. Certain market data information in this Presentation is based on the estimates of Katapult and FinServ management. Katapult and FinServ obtained the industry, market and competitive position data used throughout this Presentation from internal estimates and research as well as from industry publications and research, surveys and studie s c onducted by third parties. Katapult and FinServ believe their estimates to be accurate as of the date of this Presentation. H owe ver, this information may prove to be inaccurate because of the method by which Katapult or FinServ obtained some of the data for its estimates or because this information cannot always be verified due to the limits on the availability and reliability of raw da ta, the voluntary nature of the data gathering process. Use of Projections This Presentation contains projected financial information with respect to Katapult. Such projected financial information con sti tutes forward - looking information, and is for illustrative purposes only and should not be relied upon as necessarily being indi cative of future results. The assumptions and estimates underlying such financial forecast information are inherently uncertain and are subject to a wide variety of significant business, economic, competitive and other risks and uncertainties. See “Forward - Lookin g Statements” above. Actual results may differ materially from the results contemplated by the financial forecast information c ont ained in this Presentation, and the inclusion of such information in this Presentation should not be regarded as a representa tio n by any person that the results reflected in such forecasts will be achieved. DISCLAIMER / 3

Important Information And Where To Find It In connection with the Proposed Business Combination, FinServ intends to file a registration statement on Form S - 4, including a proxy statement/prospectus (the “Registration Statement”), with the Securities and Exchange Commission (the “SEC”), which wil l include a preliminary proxy statement to be distributed to holders of FinServ’s common stock in connection with FinServ’s sol ici tation of proxies for the vote by FinServ’s stockholders with respect to the Proposed Business Combination and other matters as described in the Registration Statement, and a prospectus relating to the offer of the securities to be issued to Katapult’s sto ckholders in connection with the Proposed Business Combination. After the Registration Statement has been declared effective, FinServ will mail a definitive proxy statement/prospectus, when available, to its stockholders and Katapult’s stockholders. I nve stors and security holders and other interested parties are urged to read the proxy statement/prospectus, and any amendments thereto and any other documents filed with the SEC when they become available, carefully and in their entirety because they c ont ain important information about FinServ, Katapult and the Proposed Business Combination. Investors and security holders may obtain free copies of the preliminary proxy statement/prospectus and definitive proxy statement/prospectus (when available) a nd other documents filed with the SEC by FinServ through the website maintained by the SEC at http://www.sec.gov. No Offer Or Solicitation This communication does not constitute an offer to sell or a solicitation of an offer to buy, or the solicitation of any vote or approval in any jurisdiction in connection with a proposed potential business combination among Katapult and FinServ or any r el ated transactions, nor shall there be any sale, issuance or transfer of securities in any jurisdiction where, or to any person to who m, such offer, solicitation or sale may be unlawful. Any offering of securities or solicitation of votes regarding the propos ed transaction will be made only by means of a proxy statement/prospectus that complies with applicable rules and regulations promulgated un der the Securities Act of 1933, as amended (the “Securities Act”) and Securities Exchange Act of 1934, as amended or pursuant to an exemption from the Securities Act or in a transaction not subject to the registration requirements of the Securities Ac t. Participants In The Solicitation FinServ and Katapult and their respective directors and certain of their respective executive officers and other members of m ana gement and employees may be considered participants in the solicitation of proxies with respect to the Proposed Business Combination. Information about the directors and executive officers of FinServ in its Annual Report on Form 10 - K, filed with the SEC on March 27, 2020. Additional information regarding the participants in the proxy solicitation and a description of their d irect interests, by security holdings or otherwise, will be set forth in the Registration Statement and other relevant materials to be filed with the SEC regarding the Proposed Business Combination. Stockholders, potential investors and other interested person s should read the Registration Statement carefully before making any voting or investment decisions. These documents, when avai lab le, can be obtained free of charge from the sources indicated above. Financial Information; Non - GAAP Financial Measures The financial information and data contained in this Presentation are unaudited and do not conform to Regulation S - X. Accordingl y, such information and data may not be included in, may be adjusted in or may be presented differently in, the Registration Statement or any other document to be filed by FinServ with the SEC. Some of the financial information and data contained in thi s Presentation, such as earnings before income taxes, depreciation and amortization (“EBITDA”), have not been prepared in accordance with United States generally accepted accounting principles (“GAAP”). FinServ and Katapult believe these non - GAAP mea sures of financial results provide useful information to management and investors regarding certain financial and business trends relating to Katapult’s financial condition and results of operations. Katapult’s management uses these non - GAAP measures for trend analyses and for budgeting and planning purposes. FinServ and Katapult believe that the use of these non - GAAP financial measures provides an additional tool for investors to use in evaluating projected operating results and trends in a nd in comparing Katapult’s financial measures with other similar companies, many of which present similar non - GAAP financial measures to investors. Katapult is not able to forecast net income on a forward - looking basis without unreasonable efforts due t o the high variability and difficulty in predicting certain items that affect GAAP, and therefore has not provided a reconcil iat ion for forward - looking EBITDA. Management does not consider these non - GAAP measures in isolation or as an alternative to financial meas ures determined in accordance with GAAP. The principal limitation of these non - GAAP financial measures is that they exclude significant expenses and income that are required by GAAP to be recorded in Katapult’s financial statements. In addit ion , they are subject to inherent limitations as they reflect the exercise of judgments by management about which expense and income are excluded or included in determining these non - GAAP financial measures. In order to compensate for these limitations, management presents non - GAAP financial measures in connection with GAAP results. You should review Katapult’s audited financial statements, which will be included in the Registration Statement. Trademarks And Intellectual Property All trademarks, service marks, and trade names of Katapult or FinServ or their respective affiliates used herein are trademar ks, service marks, or registered trade names of Katapult or FinServ, respectively, as noted herein. Any other product, company na me s, or logos mentioned herein are the trademarks and/or intellectual property of their respective owners, and their use is not in ten ded to, and does not imply, a relationship with Katapult or FinServ, or an endorsement or sponsorship by or of Katapult or Fi nSe rv. Solely for convenience, the trademarks, service marks and trade names referred to in this presentation may appear without the ®, TM or SM symbols, but such references are not intended to indicate, in any way, that Katapult or FinServ will not assert, to th e fullest extent under applicable law, their rights or the right of the applicable licensor to these trademarks, service marks and trade names. DISCLAIMER / 4

/ 5

Presenters ORLANDO ZAYAS Katapult CEO KARISSA CUPITO Katapult CFO DEREK MEDLIN Katapult COO ROLANDO DE GRACIA Katapult CCO / 6

Katapult is an e - commerce focused FinTech company offering an innovative lease financing solution to consumers and enabling essential transactions at the merchant point of sale → Merchants gain access to a new customer base driving material revenue growth → Consumers gain access to high quality e - commerce retailers and the ability to obtain the items they need QUICK FACTS CUSTOMER SATISFACTION Net Promoter Score Return of +58 SPEED & CONVENIENCE Decisioning in less than 5 seconds SOLID PROFITABILITY 2020 Adj EBITDA of $41M ACCELERATED GROWTH 100%+ revenue growth for 3 consecutive years GROWING CONSUMER BASE 1.5 Million+ Approved E - COMMERCE LEADER Over 150 online merchants on platform / 7

Katapult provides underserved nonprime consumers the flexibility they deserve to access the durable goods they need E - COMMERCE MERCHANTS UNDERSERVED CONSUMERS Recurring lease payments over time Upfront funding 38% of US Consumers 1 Nonprime and Underserved Next - Generation Tech Machine Learning Powered Financing Program $180 Billion in 2020 2 2020E E - Commerce Durable Goods Spend 1. Federal Reserve Bank of New York, Unequal Access to Credit: The Hidden Impact of Credit Constraints, September 2019; 10.5% of US adult population does not have credit and 30.5% of the formal credit economy (89.5% of adult population) have subprime credit; 97 million consumers with non - prime credit out of adult population of 252 million. 2. Wall Street equity research, June 2020. Includes Home & Furniture, Electronics, and Automotive categories. / 8

Clear and Compelling Value to Consumers POWERED BY KATAPULT’S PROPRIETARY END - TO - END TECHNOLOGY PLATFORM Enables the lease - purchase of durable goods No credit score required Fully - automated approval in <5 seconds Digitally native platform, anyone, anywhere access Simplified ‘click - to - ship’ lease process Flexible and transparent payment options, no late fees / 9
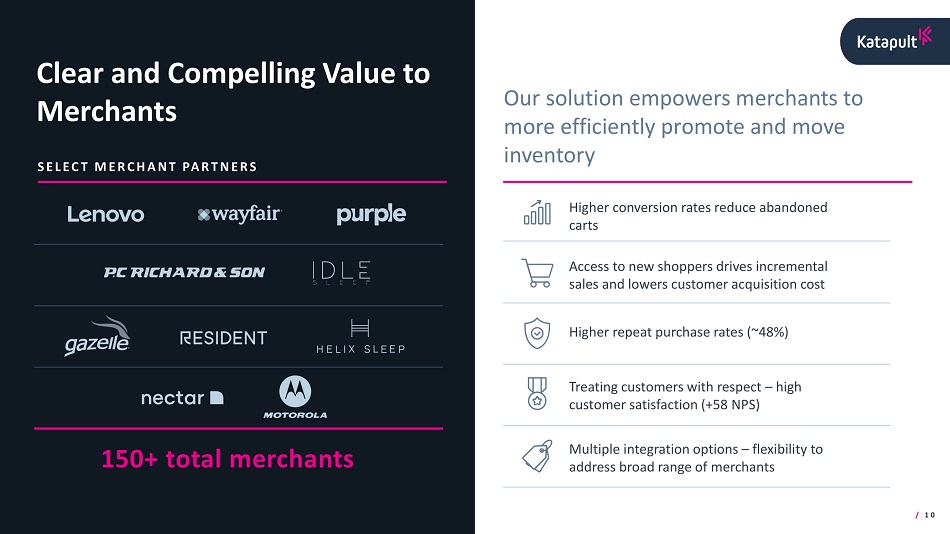
Access to new shoppers drives incremental sales and lowers customer acquisition cost Higher repeat purchase rates (~48%) Multiple integration options – flexibility to address broad range of merchants Treating customers with respect – high customer satisfaction (+58 NPS) SELECT MERCHANT PARTNERS 150+ total merchants Clear and Compelling Value to Merchants Our solution empowers merchants to more efficiently promote and move inventory Higher conversion rates reduce abandoned carts / 10

Key Investment Highlights Massive, Underserved Addressable Market Supported by powerful consumer and retail trends Proprietary Technology Platform Platform provides scalability, operational efficiency and competitive differentiation Proven Management Team Experienced leadership team Clear And Compelling Value Proposition 2 - sided value proposition to both merchants & consumers Embedded In E - commerce Ecosystem Significant e - commerce merchant and partner penetration Unique Financial Profile Attractive financial profile featuring scale, growth & profitability / 11

($15) ($5) $41 ($24) ($19) $23 2018 2019 2020 $43 $92 $247 2018 2019 2020 $49 $88 $192 2018 2019 2020 Financial Overview BLUE - CHIP MERCHANTS INDUSTRY - LEADING PARTNERS & PLATFORMS SCALED, FINTECH COMPANY STRONG GROWTH TRAJECTORY LEADING PROFITABILITY LTO Originations $Millions ‘18 - ’20 CAGR 98% Revenue $Millions $Millions NM 16% / 9% Adjusted EBITDA / Net Income Margins Source: Company estimates. ’18 - ’20 CAGR 139% NM / 12 2018 - 2019: BUILD 2020 ONWARD: GROW

/ 13

E - Commerce Born & Bred Sole e - commerce financing platform focused on nonprime consumers Robust Consumer, Merchant & Partner Ecosystem Solving critical consumer pain points and driving significant upside for merchants Proprietary Technology Platform Flexible, automated and customizable tech increases efficiency and supports merchant and consumer preferences Highly Predictive Risk Model Proprietary risk models significantly outperform industry standards Katapult is the only nonprime consumer POS lease financing platform focused on e - commerce WHY WE WIN PRIMARILY IN - STORE PRIMARILY ONLINE PRIME FOCUSED NONPRIME FOCUSED Our highly scalable platform driven by proprietary technology delivers unmatched value to both consumers and merchants / 14

Massive Segment of Essential Consumer Spend DURABLE GOODS E - COMMERCE MARKET 1 <1% of 2020E durable goods e - commerce market currently captured by Katapult 5 1. Wall Street equity research, June 2020. Includes Home & Furniture, Electronics, and Automotive categories. 2. Federal Reserve Bank of New York, Unequal Access to Credit: The Hidden Impact of Credit Constraints, September 2019; 10.5% of US adult population does not have credit and 30.5% of the formal credit economy (89.5% of adult population ) have subprime credit; 97 million consumers with non non - prime credit out of adult population of 252 million. 3. FDIC National Survey of Unbanked and Underbanked Households, 2017. 4. Calculated by multiplying ~$180 billion market for online retail across electronics, furniture, appliances and other durables (Wall Street research, June 2020) by 38% of the US consumers underserved by prime credit products (see footnote 1) by 67% of those with FICO <700 need pay - over - time financing option (see footnote 2). 5. Based on 2020E originations. UNDERSERVED CONSUMERS NEED “PAY OVER TIME” OPTIONS 38% of U.S. consumers underserved by prime credit products 2 67% of those with a FICO score <700 need a pay - over - time financing option $40 - 50 Billion ~$180B ~$300B 2020E 2023E E - commerce durable goods market opportunity targeting an underserved population 3 4 / 15

$154 $170 $201 $397 $439 $482 12% 12% 14% 30% 31% 33% 2017E 2018E 2019E 2020E 2021E 2022E $99 $120 $146 $231 $236 $253 30% 33% 35% 53% 52% 54% 2017E 2018E 2019E 2020E 2021E 2022E $50 $63 $66 $75 $91 $106 2% 3% 3% 4% 5% 5% 2017E 2018E 2019E 2020E 2021E 2022E Market Trends Supporting E - Commerce Growth 1. Wall Street equity research, January 2021. 2. The Ascent, Study: Buy Now, Pay Later Services Continue Explosive Growth, March 2021. HOME FURNITURE E - COMMERCE ‘17 - ’22E CAGR 26% We are well positioned in fast - growing consumer sector experiencing powerful market shifts CONSUMER ELECTRONICS E - COMMERCE 56% of Americans have used a buy now, pay later service, an increase of 48% in less than a year 1 ‘17 - ’22E CAGR 21% AUTO PARTS E - COMMERCE 13% 62% of buy now, pay later users think it could replace their credit cards 2 ‘17 - ’22E CAGR 16% / 16 E - Commerce Sales – $Millions % Penetration E - Commerce Sales – $Millions % Penetration E - Commerce Sales – $Millions % Penetration

Gen Z & Y 52% 57% 59% 36% 34% 31% 13% 10% 9% 2019 2020 2021 1 Providing Solutions to the Next Generation 42% of adult consumers in the U.S. are Gen Z & Gen Y Gen Z and Gen Y use lease - to - own financing not as last resort, but rather as part of an assortment of flexible financing tools they can access. Gen Z consumers will increase their per capita spending by more than 70% over the next five years 55+ 1. Year - to - date. 2. Boston Consulting Group, How Marketers Can Win with Gen Z and Millennials Post - COVID - 19. KATAPULT LTO ORIGINATIONS BY DEMOGRAPHIC GENERATIONS 41 - 55 <40 / 17 Accessing a growing segment…

/ 18

E - Commerce Born and Bred 1 Pure Click to Ship Simple application and transparent checkout process makes our lease - to - own financing option easy and understandable 2 100% Digital Systems, interactions and payments are all digital, giving customers and merchants flexibility while enabling growth at scale 3 Seamless and Efficient Process Entire experience is efficient, transparent and seamless / 19

Our proprietary tech solution drives a virtuous cycle of engagement between consumers and merchants Our platform solves critical consumer pain points and drives higher conversion for merchants. We are transforming the way nonprime consumers shop and how merchants access this underserved segment. CONSUMER CHECKOUT MERCHANT INTEGRATION LOYALTY MARKETING Off - the - shelf solutions Platform plugins Prime lender partnerships / 20

Katapult’s tech - powered platform delivers superior pricing to consumers for necessary goods MAXIMUM FINANCED COST CASH PRICE GE Top Mount Refrigerator P.C. Richard & Son Price: $639 $716 1 $1,323 2 Katapult $1,146 3 $1,819 4 Legacy, Branch - based LTO Competitor $639 5 $1,838 6 Private Label Credit Card Note: Katapult offers a lease - to - own solution, not traditional financing or credit; 1. Includes $45 initial fee and 5% fee; 2. Assumes 2.0x multiple on original $639 price and $45 inital fee; 3. Cash price listed on LTO competitor website for comparable refrigerator using Plano, TX as customer location; 4. Cost - to - own price listed on LTO competitor website for comparable refrigerator using Plano, TX as customer location; 5. Assumes credit card balance is paid off; 6. Assumes interest rate of 29 .99 % and consumer pays minimum monthly payment of 3% until balance paid off. / 21

FIRST 90 DAYS → During the first 90 days an option is available to buyout for the cash price plus 5% fee 1 Flexible & Transparent Payment Options Drive Customer Loyalty POST 90 DAYS → An early purchase option is available anytime after the initial 90 days allowing consumer to purchase for significantly less than the full - term cost to own FULL TERM → Payments made over the full lease term equal on average 2x the lease origination amount No late fees. Ever. 1. Except in California where same - as - cash price is offered during 90 days pursuant to applicable law. / 22

$1,000 Lease 1. Includes $45 initial fee. Illustrative Pricing Timeline EXAMPLE LEASE ORIGINATION / 23 LEASE ORIGINATION 90 DAYS AVG. TIME IN LEASE 7 MONTHS FULL TERM 12 MONTHS $45 $1,095 1 $1,753 1 $2,045 1 Initial Fee $45 90 - Day Buyout 5% Fee on Lease Amount Post 90 - Day Buyout 65% of Remaining Payments Paid - in - Full with 2x Lease Origination Amount First 90 Day Buyout Option at 5% of Lease Cost Early Buyout Options are 65% of Your Remaining Payments

1. Merchants with >$5mm revenue in relevant goods segments. Differentiated technology and integration capabilities wins merchants DIRECT INTEGRATION → Off - the - shelf & custom integration options → Self - identifying customers easily find their purchasing option PLATFORM INTEGRATION → Plugins with all leading e - commerce platforms → Integrations as fast as 30 minutes for merchants Partner # of Eligible Merchants 1 ~600 ~1,600 ~70 ~100 ~1,900 ~1,400 SELECT PARTNER INTEGRATIONS Low single digit penetration provides significant embedded upside potential / 24 ~900
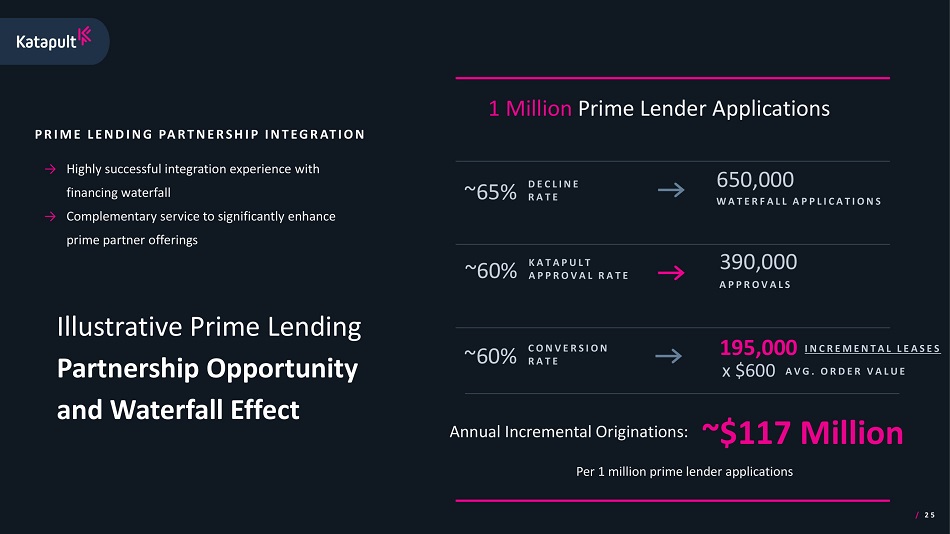
Illustrative Prime Lending Partnership Opportunity and Waterfall Effect PRIME LENDING PARTNERSHIP INTEGRATION → Highly successful integration experience with financing waterfall → Complementary service to significantly enhance prime partner offerings 1 Million Prime Lender Applications 650,000 WATERFALL APPLICATIONS ~65% DECLINE RATE 390,000 APPROVALS ~60% KATAPULT APPROVAL RATE ~60% CONVERSION RATE / 25 x $600 AVG. ORDER VALUE 195,000 INCREMENTAL LEASES ~$117 Million Per 1 million prime lender applications Annual Incremental Originations:

/ 26 Katapult Welcomes Simply Mac Simply Mac, an Apple Premier Partner, partners with Katapult to give their customers a no credit required, lease to own option when shopping in every channel. 31% OF ORIGINATED LEASES by existing Katapult customers who are new to Simply Mac TIMELINE DAY 1 Signed agreement DAY 11 Platform launch (Shopify) DAY 35 DAY 50 Prime Lending launch (Affirm) In - store launch + Full omni - channel integration in less than 60 days

/ 27

PRE - DECISIONING POST - DECISIONING Identity and Fraud Decisioning Engine POS Integration Behavioral Learning Model (proprietary Katapult Score) Payment System Real - time Insights Security Proprietary Customer Scoring Merchant Portal Customer Portal Digital Customer Support End - to - End Technology Enabled E - Commerce Platform Robust API Library / 28

INTUITIVE USER INTERFACE A Seamless Digital Consumer Experience FLEXIBLE & TRANSPARENT PAYMENT OPTIONS → Digitally native, mobile - ready → Easy 3 - step application → Simple information requirements → Multiple payment options available → Immediate shipping after initial payment → On - demand access to lease management portal / 29

Product Demonstration

Our proprietary risk model translates to higher approval rates and higher contribution margin → Lease history → Prior payment behavior → Behavioral biometrics → Shopping behavior → Mobile device information → Cart information SELECTED ATTRIBUTES FOR DECISIONING UNDERWRITING INPUTS 7 Min. User Inputs Gathered User Attributes ~100 3 rd Party Data Elements ~2,000 UNDERWRITING PROCESS → Sophisticated behavioral learning mitigates credit and fraud risks → Behavioral biometrics, device and location recognition → <5 seconds approval decision using AI inspired machine learning → Proprietary real time performance data and tracking → Flexibility and concentration risk mitigation in changing credit environments and economic cycles / 31

x Machine - learning and AI - driven approach x Flexible decision engine x Proprietary modeling for non - prime and Cx dynamics x Performance management and data x Lifecycle approach FRAUD & IDENTITY DETECTION CUSTOMIZED UNDERWRITING PAYMENT TOOLS COLLECTIONS STRATEGY EXISTING CUSTOMER MGMT REPEAT CUSTOMER PROGRAMS / 32 Layered Data and AI Driving Scale and Returns
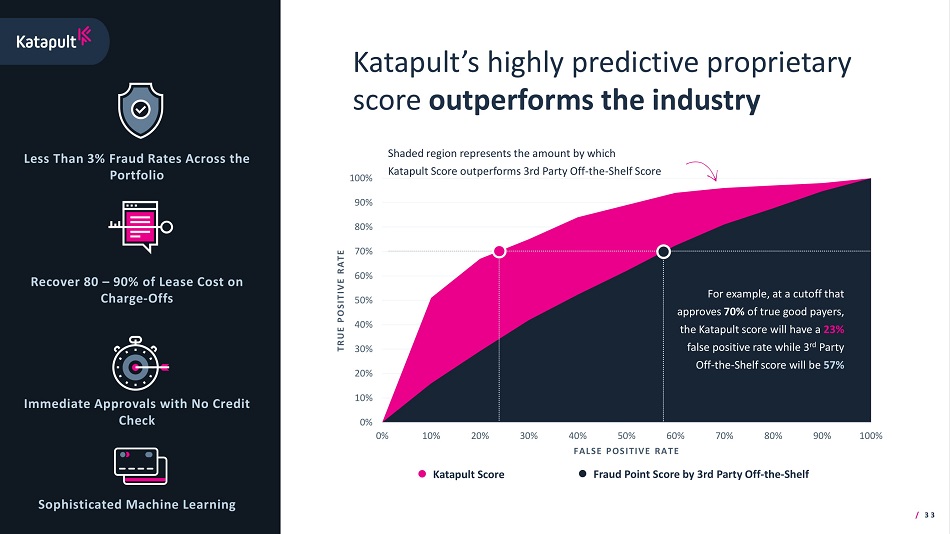
0% 10% 20% 30% 40% 50% 60% 70% 80% 90% 100% 0% 10% 20% 30% 40% 50% 60% 70% 80% 90% 100% TRUE POSITIVE RATE FALSE POSITIVE RATE Katapult’s highly predictive proprietary score outperforms the industry Immediate Approvals with No Credit Check Less Than 3% Fraud Rates Across the Portfolio Recover 80 – 90% of Lease Cost on Charge - Offs Sophisticated Machine Learning Katapult Score Fraud Point Score by 3rd Party Off - the - Shelf Shaded region represents the amount by which Katapult Score outperforms 3rd Party Off - the - Shelf Score For example, at a cutoff that approves 70% of true good payers, the Katapult score will have a 23% false positive rate while 3 rd Party Off - the - Shelf score will be 57% / 33

/ 34

CUSTOMER MARKETING SUPPORT Our technology powers our commercial strategy - simplifying the financing process and driving repeat transactions MERCHANT INTEGRATION Flexible API Options Platform Extensions Omni - channel Portal Hosted Portal Acquisition Retention Conversion Repeat as fast as <30 min Initial Merchant Integration ~48% Repeat Customer Rate and Growing / 35

Investing in Business Development → Expansion of business development team → Deploying referral and connector programs → Strengthening sales relationships with platforms >2x # OF MERCHANT LAUNCHES in Q1 2021 vs. Q1 2020 / 36

/ 37 ~75% INCREASE IN Q1 YOY ORIGINATIONS for Top 10 merchants 1.9 Driving Growth through Communications & Marketing → Increasing expertise & capabilities → Best - in - class CRM and promotions platforms → Focus on lifecycle marketing & lifetime value → Bringing our merchants new customers AVG. LEASES PER CUSTOMER* * Based on unique users originated at active merchants between May 2019 and April 2020.

Strategic Growth Investment Opportunities / 38 ENTERPRISE SALES TECHNOLOGY SALES & MARKETING → Improve our commercial offering to primary lenders and merchants → Optimize customer promotions → Enhance marketplace cross - shopping → Invest in additional capabilities, partnerships, and staffing → Focused on competitive capture of “anchor tenant” enterprise accounts → Upfront investments in incentives, rebates, and integration investments offset by material revenue growth → Cash outlays tied to performance targets → Continue to invest in e - commerce platforms and lender integrations → Continuous improvement of digital and in - store customer experiences → Invest in additional developers and engineers Overview Multi - Year Investment Opportunities ~$8 ⎼ $12 million ~$5 ⎼ $10 million ~$4 ⎼ $6 million Potential Benefits → Accelerate lease origination volume → Build merchant and consumer loyalty → Significant revenue increase from winning large enterprise accounts → Maintain customer experience competitive advantage → Increase target pool of merchants

DEEPEN RELATIONSHIPS WITH EXISTING MERCHANTS CONTINUED E - COMMERCE ADOPTION PRODUCT ENHANCEMENTS AND NEW PRODUCT DIVERSIFICATION NEW MERCHANT & PARTNER POS INTEGRATIONS MERCHANT CO - MARKETING & DYNAMIC CONSUMER SCORING MODELS We have already achieved significant scale and are just getting started Significant Levers For Continued Organic Growth FURTHER PARTNER PLATFORM PENETRATION DATA ANALYTICS SERVICES TO MERCHANTS & PARTNERS / 39

/ 40

($15) ($5) $41 ($24) ($19) $23 2018 2019 2020 $43 $92 $247 2018 2019 2020 $49 $88 $192 2018 2019 2020 ORIGINATIONS $Millions ’18 - ’20 CAGR 98 % ’18 - ’20 CAGR 139% REVENUE $Millions ADJUSTED EBITDA & NET INCOME $Millions Highly Attractive Scale, Growth and Profitability Source: Company estimates. Adj. EBITDA Net Income / 41 2018 - 2019: BUILD 2020 ONWARD: GROW

LTO Originations Growth Q1 '18 Q2 '18 Q3 '18 Q4 '18 Q1 '19 Q2 '19 Q3 '19 Q4 '19 Q1 '20 Q2 '20 Q3 '20 Q4 '20 Distribution % ORIGINATIONS $Millions 22% 18% 21% 39% 13% 22% 26% 39% 16% 33% 25% 26% Q2 ‘20 LTO originations driven by COVID stimulus and “stay - at - home” shopping Q4 ‘20 LTO originations were flat and did not follow the historical holiday trend, which we attribute to the unique circumstances surrounding COVID / 42

→ Our expectations for the financial performance of our business remain unchanged → Originations and new merchants coming online are tracking to plan → We see an opportunity to accelerate investment in key growth areas of the business, including sales and marketing, business development and technology Financial Overview ORIGINATIONS ($Millions) ADJUSTED EBITDA ($Millions) / 43 1. Adjusted for $5 million of D&O insurance premiums. 2. Adjusted for $$10 million of accelerated investment. 3. Net income items include vesting of transaction - related stock options/RSU’s, and other one - time expenses related to the SPAC transaction . GENERAL COMMENTARY $192 $375 - $425 2020A 2021E REVENUE ($Millions) $247 $425 - $475 2020A 2021E → 2020 revenue reflects a reclassification of lease recoveries of $3 million from revenue to bad debt expense → If we qualify as a large accelerated filer, our 2021E revenue could be impacted by adoption of ASC 842 that may result in a non - cash income statement reclassification → Original EBITDA projections did not contemplate $5 million of incremental D&O insurance premiums, driven by broad - based D&O rate increases for SPAC’s → SPAC transaction is providing $50 million of incremental capital that was not originally contemplated in projections. We expect to deploy approximately $10 million in 2021 to accelerated growth investments (see slides #38 and #44 for details) → 2021E Net Income will be impacted by one - time transaction expenses and other non - cash related items 3 REVENUE COMMENTARY ADJUSTED EBITDA COMMENTARY $41 $60 - $70 $50 - $60 2020A 2021E 2021E Reflects impact of D&O Insurance Reflects Impact of Accelerated Investment 1 2
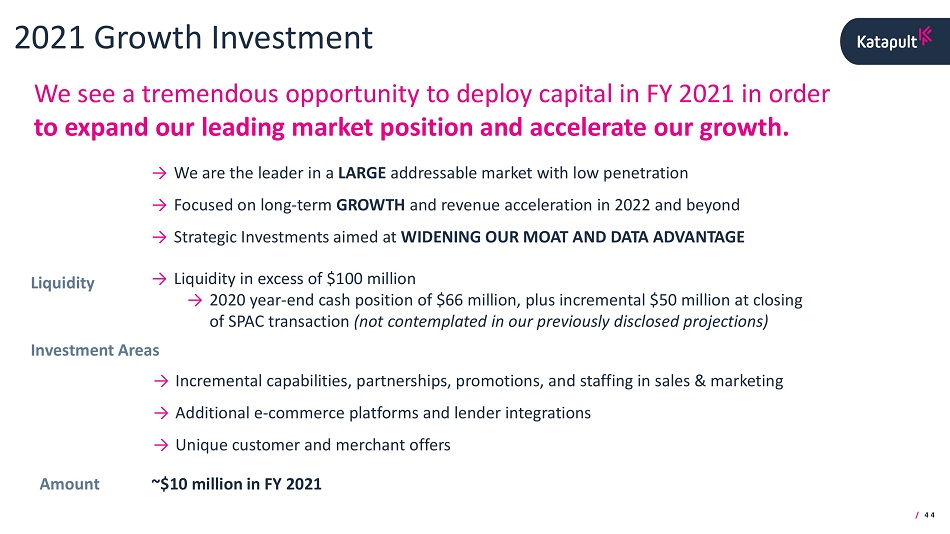
2021 Growth Investment Amount → We are the leader in a LARGE addressable market with low penetration → Focused on long - term GROWTH and revenue acceleration in 2022 and beyond → Strategic Investments aimed at WIDENING OUR MOAT AND DATA ADVANTAGE Investment Areas → Incremental capabilities, partnerships, promotions, and staffing in sales & marketing → Additional e - commerce platforms and lender integrations → Unique customer and merchant offers ~$10 million in FY 2021 We see a tremendous opportunity to deploy capital in FY 2021 in order to expand our leading market position and accelerate our growth. Liquidity → Liquidity in excess of $100 million → 2020 year - end cash position of $66 million, plus incremental $50 million at closing of SPAC transaction (not contemplated in our previously disclosed projections) / 44

LIQUIDITY (1) 2020 year - end cash position of $66 million Total committed credit facilities of $175 million with accordion feature for an additional $125 million borrowing capacity → First lien asset backed facility of $125 million with $74 million drawn at 12/31/2020 → Additional accordion feature for an additional $125 million borrowing capacity → Term note of $50 million No incremental leverage expected going forward except for asset backed facility supporting growth in lease portfolio Liquidity Framework and Capital Allocation CAPITAL ALLOCATION STRATEGY Continued investment to accelerate growth in the business and working capital requirements New product and development launches Incremental acquisition opportunities for complementary capabilities Excess cash available for reduction of debt and/or capital return to shareholders (1) As of 12/31/20. / 45

/ 46

Historical Income Statement Twelve Months Ended December 31, $Millions 2018A 2019A 2020A Selected Income Statement Total Revenue 1 $43 $92 $247 Cost of Revenue $39 $71 $167 Gross Profit $4 $21 $80 Servicing Costs & Underwriting Fees $2 $5 $6 Operating Expenses 2 $19 $25 $36 Income (Loss) from Operations ($17) ($9) $37 Interest Expense & Other 3 $7 $9 $14 Net Income (Loss) ($24) ($19) $23 Note: All figures rounded to the nearest million; 1. Revenue includes rental revenue, other fees and service fees; 2. Operating expenses include professional & consulting fees, t ech nology & data analytics costs, bad debt expense and general & administrative expense; 3. Other includes loss on extinguishment of debt , p rovision for income taxes and other income / fees. / 47

Historical Balance Sheet As Of $Millions 12/31/2018 12/31/2019 12/31/2020 Selected Balance Sheet Cash $1 $8 $66 Restricted Cash $1 $5 $4 Property Held for Sale, Net of Accumulated Depreciation & Impairment $16 $35 $67 Other Assets 1 $2 $2 $3 Total Assets $21 $49 $140 Revolving Line of Credit $20 $40 $74 Other Debt $15 $23 $36 Other Liabilities 2 $7 $10 $30 Total Liabilities $41 $73 $141 Total Shareholders Equity / Deficit (Including Preferred Shares) ($20) ($24) ($1) Note: All figures rounded to the nearest million; 1. Includes accounts receivable, prepaid expenses, other current assets, property & equipment, security deposits and capitalized so ftware & intangible assets; 2. Includes accounts payable, accrued liabilities, unearned revenue and other liabilities. / 48

Katapult’s Proven Leadership Team ORLANDO ZAYAS Chief Executive Officer → Joined Katapult in Sept 2017 → Past: CEO of TEMPOE & DRB Financial Solutions → Executive at General Electric for 15 years KARISSA CUPITO Chief Financial Officer → Joined Katapult in Dec 2017 → Past: CFO of TEMPOE → 10+ years in financial leadership → CPA & Masters in Accountancy DEREK MEDLIN Chief Operations Officer → Joined Katapult in Jul 2017 → Past: Executive Director at J.P. Morgan and Chase → 10+ years in operations and strategy ROLANDO DE GRACIA Chief Commercial Officer → Joined Katapult in Dec 2020 → Past: Business Development Executive at Alliance Data → 15+ years in corporate development CHANDAN CHOPRA Chief Technology Officer → Joined Katapult in Apr 2018 → Founder of KlevrLend → Past: CTO of Balance Credit and Essential Lending FANGQIU SUN Chief Credit Officer → Joined Katapult in Oct 2018 → Past: Executive Director of Strategic Analytics & Risk Management at J.P. Morgan → VP of Credit Risk Management & Decision Science at CNG Holdings, Inc. / 49

Katapult’s Board of Directors ORLANDO ZAYAS Chief Executive Officer → Joined Katapult in Sept 2017 → Past: CEO of TEMPOE & DRB Financial Solutions → Executive at General Electric for 15 years BRIAN HIRSCH Director → Co - founder & Managing Partner of Tribeca Venture Partners → Past: Founder & Managing Director of the venture arm of Greenhill & Co (NYSE: GHL) GENE LOCKHART Director → Chairman & Managing Partner of MissionOG → Past: President & CEO of MasterCard International DON GAYHARDT Director → President & CEO of Curo → 25+ years of experience in short - term credit with a history of completing large acquisitions and complex financial transactions BRUCE K. TARAGIN Director → Managing director at Blumberg Capital → Past: Co - founded and held senior management positions within several technology companies / 50
