Attached files
| file | filename |
|---|---|
| 8-K - 8-K - Silvergate Capital Corp | si8-k4202021earningsrelease.htm |
| EX-99.1 - EX-99.1 - Silvergate Capital Corp | ex991siq12021earningsrelea.htm |

Silvergate Capital Corporation 1Q21 Earnings Presentation April 20, 2021 Exhibit 99.2

1 5 0 41 42 44 221 228 231 146 183 188 0 107 183 0 175 220 2 #010500 #DDE4E7 #919498 #92B7BC #00AFDC #006BB7 #292A2C Forward Looking Statements This presentation contains forward looking statements within the meaning of the Securities and Exchange Act of 1934, as amended, including statements of goals, intentions, and expectations as to future trends, plans, events or results of Company operations and policies and regarding general economic conditions. In some cases, forward-looking statements can be identified by use of words such as “may,” “will,” “anticipates,” “believes,” “expects,” “plans,” “estimates,” “potential,” “continue,” “should,” and similar words or phrases. These statements are based upon current and anticipated economic conditions, nationally and in the Company’s market, interest rates and interest rate policy, competitive factors and other conditions which by their nature, are not susceptible to accurate forecast and are subject to significant uncertainty. For details on factors that could affect these expectations, see the risk factors and other cautionary language included in the Company’s periodic and current reports filed with the U.S. Securities and Exchange Commission. Because of these uncertainties and the assumptions on which this discussion and the forward-looking statements are based, actual future operations and results may differ materially from those indicated herein. Readers are cautioned against placing undue reliance on any such forward- looking statements. The Company’s past results are not necessarily indicative of future performance. Further, given its ongoing and dynamic nature, it is difficult to predict the full impact of the COVID-19 outbreak on our business. The extent of such impact will depend on future developments, which are highly uncertain, including when the coronavirus can be controlled and abated and when and how the economy may be fully reopened. As the result of the COVID-19 pandemic and the related adverse local and national economic consequences, we could be subject to any of the following risks, any of which could have a material, adverse effect on our business, financial condition, liquidity, and results of operations: the demand for our products and services may decline, making it difficult to grow assets and income; if the economy is unable to fully reopen as planned, and high levels of unemployment continue for an extended period of time, loan delinquencies, problem assets, and foreclosures may increase, resulting in increased charges and reduced income; collateral for loans, especially real estate, may decline in value, which could cause loan losses to increase; our allowance for loan losses may increase if borrowers experience financial difficulties, which will adversely affect our net income; the net worth and liquidity of loan guarantors may decline, impairing their ability to honor commitments to us; as the result of the decline in the Federal Reserve Board’s target federal funds rate to near 0%, the yield on our assets may decline to a greater extent than the decline in our cost of interest-bearing liabilities, reducing our net interest margin and spread and reducing net income; our cyber security risks are increased as the result of an increase in the number of employees working remotely; and FDIC premiums may increase if the agency experiences additional resolution costs. The Company does not undertake to publicly revise or update forward-looking statements in this presentation to reflect events or circumstances that arise after the date of this presentation, except as may be required under applicable law. The Company makes no representation that subsequent to delivery of the presentation it was not altered. For the most current, accurate information, please refer to the investor relations section of the Company's website at https://ir.silvergatebank.com. Silvergate “Silvergate Bank” and its logos and other trademarks referred to and included in this presentation belong to us. Solely for convenience, we refer to our trademarks in this presentation without the ® or the ™ or symbols, but such references are not intended to indicate that we will not fully assert under applicable law our trademark rights. Other service marks, trademarks and trade names referred to in this presentation, if any, are the property of their respective owners, although for presentational convenience we may not use the ® or the ™ symbols to identify such trademarks. In this presentation, we refer to Silvergate Capital Corporation as “Silvergate” or the “Company” and to Silvergate Bank as the “Bank”.

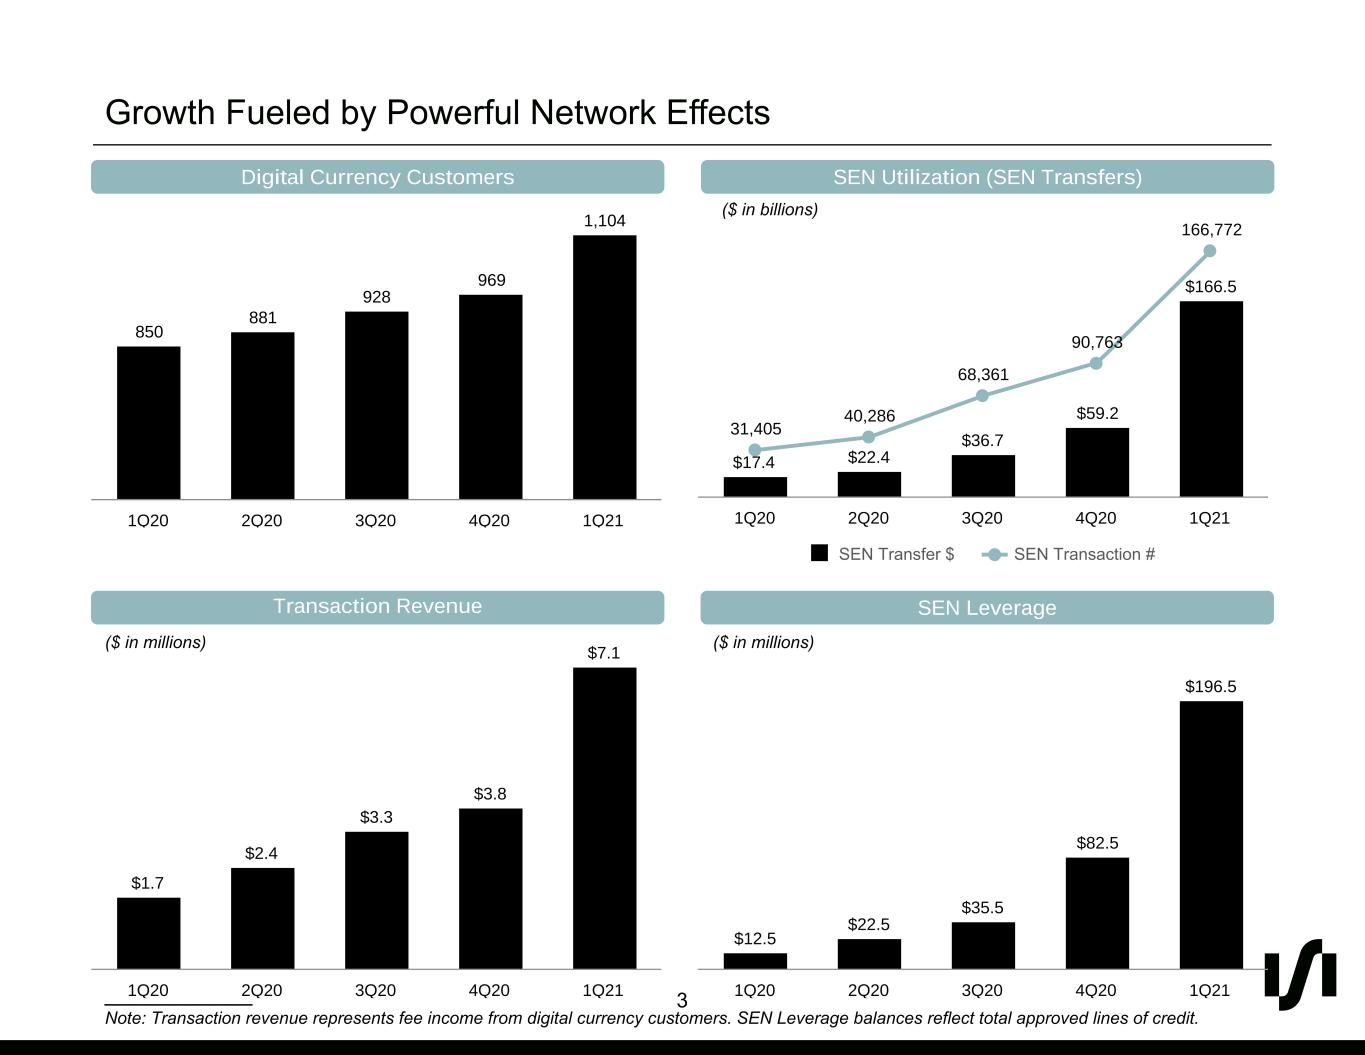
1 5 0 41 42 44 221 228 231 146 183 188 0 107 183 0 175 220 3 #010500 #DDE4E7 #919498 #92B7BC #00AFDC #006BB7 #292A2C Growth Fueled by Powerful Network Effects Digital Currency Customers SEN LeverageTransaction Revenue SEN Utilization (SEN Transfers) 850 881 928 969 1,104 1Q20 2Q20 3Q20 4Q20 1Q21 $17.4 $22.4 $36.7 $59.2 $166.5 31,405 40,286 68,361 90,763 166,772 SEN Transfer $ SEN Transaction # 1Q20 2Q20 3Q20 4Q20 1Q21 $1.7 $2.4 $3.3 $3.8 $7.1 1Q20 2Q20 3Q20 4Q20 1Q21 $12.5 $22.5 $35.5 $82.5 $196.5 1Q20 2Q20 3Q20 4Q20 1Q21___________ Note: Transaction revenue represents fee income from digital currency customers. SEN Leverage balances reflect total approved lines of credit. ($ in billions) ($ in millions)($ in millions)

1 5 0 41 42 44 221 228 231 146 183 188 0 107 183 0 175 220 4 #010500 #DDE4E7 #919498 #92B7BC #00AFDC #006BB7 #292A2C 1Q21 Financial Results (In millions, except per share data) ___________ Note: N/M - Not meaningful. Balance sheet data as of March 31, 2021, except for weighted average diluted shares. Totals may not foot due to rounding. 1Q21 vs Highlights 1Q21 4Q20 1Q20 % Inc / (Dec) Income Statement Net interest income $ 23.0 5 % 49 % Increase driven by higher balances of interest earning assets Provision for loan losses — N/M N/M Noninterest income 8.1 67 % 64 % Grew fee income from digital currency customers Noninterest expense 19.6 11 % 41 % Investments for strategic growth and higher FDIC insurance expense related to deposit growth Pre-tax income 11.5 28 % 86 % Income tax benefit (1.2) 759 % (168) % Tax benefit related to stock option exercises Net income $ 12.7 39 % 189 % Diluted EPS $ 0.55 Balance Sheet Securities available-for-sale $ 1,717 83 % 78 % Total loans $ 1,626 1 % 46 % Total assets $ 7,757 39 % 236 % Digital currency related deposits $ 6,793 35 % 301 % Total shareholders' equity $ 714 142 % 192 % Book value per share $ 28.75 84 % 119 % Outstanding shares 24.8 Weighted average diluted shares 23.0

1 5 0 41 42 44 221 228 231 146 183 188 0 107 183 0 175 220 5 #010500 #DDE4E7 #919498 #92B7BC #00AFDC #006BB7 #292A2C Deposits Digital Currency and Other Deposit Trends Commentary • Digital currency deposits ended 1Q21 at $6.8 billion, with increased client activity evidenced by the record volume of SEN transactions during the quarter • Other deposits represent deposits from non-digital currency customers, including demand deposits, savings, money market and time deposits and callable brokered CDs • The cost of deposits was 0.00% in 1Q21, reflecting the Company's digital currency deposit gathering strategy ___________ Note: Ratios have been annualized. Totals may not foot due to rounding. $2,003 $1,671 $2,281 $5,248 $7,002 $1,693 $1,509 $2,095 $5,039 $6,793 $1,878 $1,802 $2,044 $2,847 $6,644 Digital Currency Deposits Other Deposits Average total deposits 1Q20 2Q20 3Q20 4Q20 1Q21 0.87% 0.37% 0.01% 0.01% 0.00% Cost of Deposits ($ in millions)

1 5 0 41 42 44 221 228 231 146 183 188 0 107 183 0 175 220 6 #010500 #DDE4E7 #919498 #92B7BC #00AFDC #006BB7 #292A2C Yields, Cost of Funds and Net Interest Margin Trends • Net interest margin decrease was driven by a greater proportion of lower yielding cash and cash equivalents as a percentage of total interest earning assets, as a result of the increase in noninterest bearing digital currency customer deposits • Yield on securities impacted by interest rates on new securities purchases in 1Q21 Yields, Cost of Deposits and Net Interest Margin Trends Commentary ___________ Note: Ratios have been annualized. NIM and yield on securities are presented on a taxable equivalent basis. 2.86% 3.14% 3.19% 2.85% 1.33% 5.15% 4.67% 4.45% 4.42% 4.31% 2.70% 2.67% 2.49% 2.43% 2.08% 1.24% 0.97% 0.32% 0.18% 0.12%0.94% 0.42% 0.07% 0.04% 0.02% NIM Yield on Loans Yield on Securities Yield on Cash Cost of Funds 1Q20 2Q20 3Q20 4Q20 1Q21

1 5 0 41 42 44 221 228 231 146 183 188 0 107 183 0 175 220 7 #010500 #DDE4E7 #919498 #92B7BC #00AFDC #006BB7 #292A2C Noninterest Income Commentary Noninterest Income • 1Q21 fee income from digital currency customers was up 317% year over year driven by increased transactional volume and related demand for cash management services • Other noninterest income in 1Q21 is made up primarily of mortgage warehouse fee income of $1.0 million, up 150% from 1Q20 $4.9 $5.4 $4.0 $4.8 $8.1 $1.7 $2.4 $3.3 $3.8 $7.1 $1.1 $0.5 $0.7 $1.1 $1.0 $2.1 $2.6 Gain on sale of securities and extinguishment of debt, net Other noninterest income, net Fee income from digital currency customers 1Q20 2Q20 3Q20 4Q20 1Q21 ($ in millions) ___________ Note: Totals may not foot due to rounding.

1 5 0 41 42 44 221 228 231 146 183 188 0 107 183 0 175 220 8 #010500 #DDE4E7 #919498 #92B7BC #00AFDC #006BB7 #292A2C Noninterest Expense Noninterest Expense • 1Q21 noninterest expense up 11% versus 4Q20 and 41% versus 1Q20 driven by investments related to strategic growth initiatives and increased FDIC insurance expense resulting from the growth in digital currency deposits • Headcount was 222 as of March 31, 2021 compared to 218 at December 31, 2020 and 211 at March 31, 2020 Commentary $13.9 $14.0 $14.1 $17.6 $19.6 $9.0 $9.0 $8.9 $9.6 $11.0 $0.9 $0.9 $0.8 $3.0 $0.6 $1.3 $1.3 $1.4 $1.4 $1.6 $1.0 $1.1 $1.2 $1.2 $1.7 $1.8 $1.7 $1.8 $2.3 $4.7 Salaries/Employee Benefits Occupancy/Equipment Communications/Data Professional Services Other 1Q20 2Q20 3Q20 4Q20 1Q21 ($ in millions) ___________ Note: Totals may not foot due to rounding.

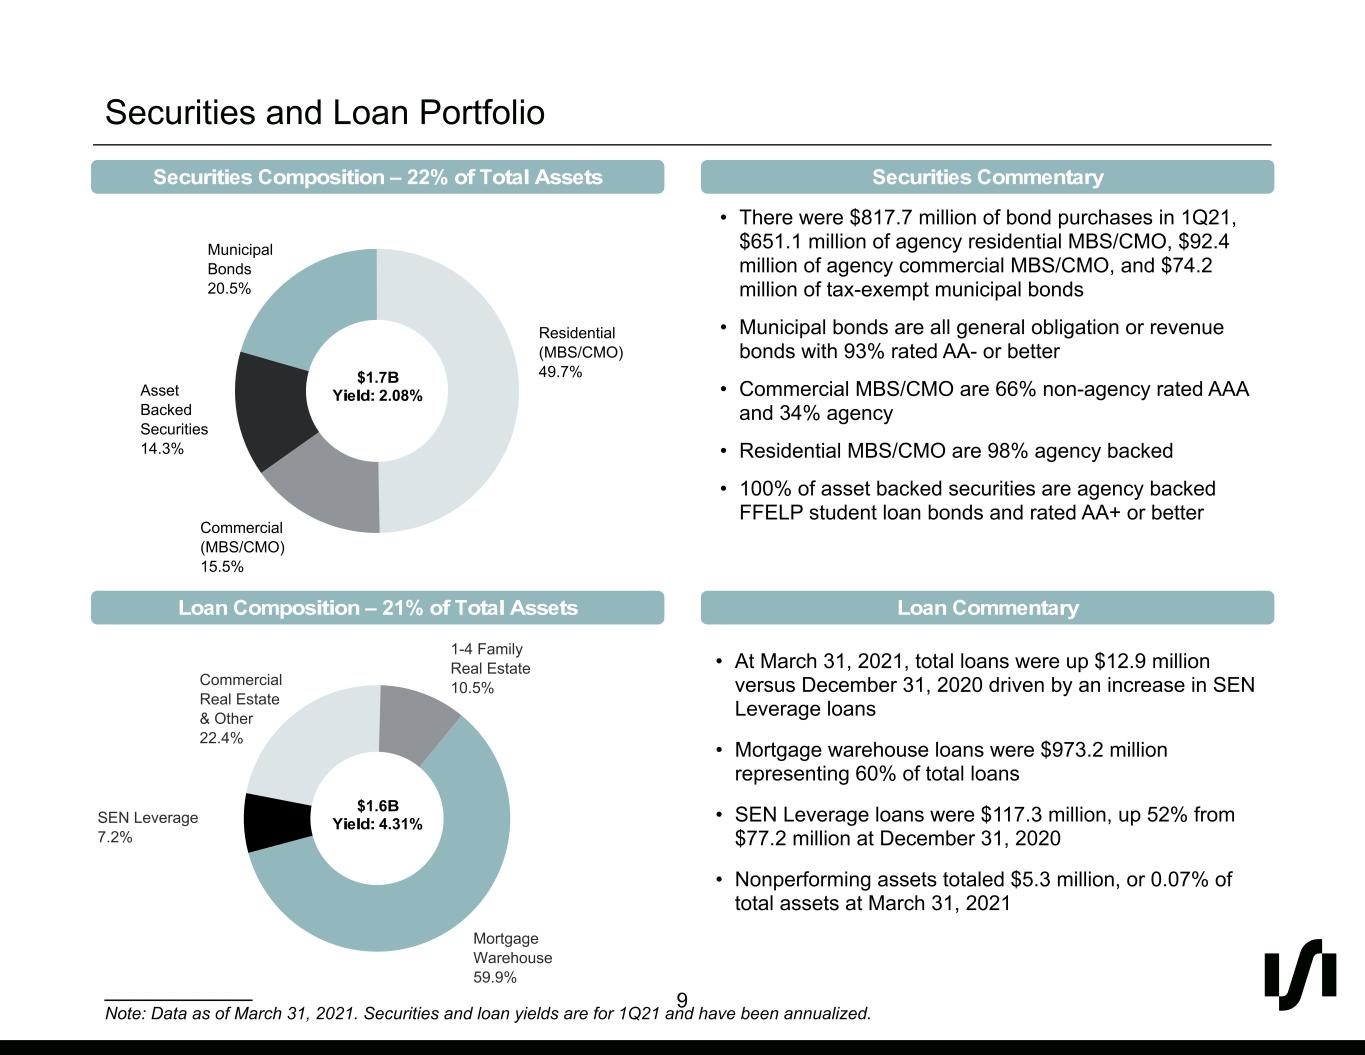
1 5 0 41 42 44 221 228 231 146 183 188 0 107 183 0 175 220 9 #010500 #DDE4E7 #919498 #92B7BC #00AFDC #006BB7 #292A2C Securities and Loan Portfolio Securities Composition – 22% of Total Assets Securities Commentary Loan Composition – 21% of Total Assets ___________ Note: Data as of March 31, 2021. Securities and loan yields are for 1Q21 and have been annualized. • At March 31, 2021, total loans were up $12.9 million versus December 31, 2020 driven by an increase in SEN Leverage loans • Mortgage warehouse loans were $973.2 million representing 60% of total loans • SEN Leverage loans were $117.3 million, up 52% from $77.2 million at December 31, 2020 • Nonperforming assets totaled $5.3 million, or 0.07% of total assets at March 31, 2021 Loan Commentary • There were $817.7 million of bond purchases in 1Q21, $651.1 million of agency residential MBS/CMO, $92.4 million of agency commercial MBS/CMO, and $74.2 million of tax-exempt municipal bonds • Municipal bonds are all general obligation or revenue bonds with 93% rated AA- or better • Commercial MBS/CMO are 66% non-agency rated AAA and 34% agency • Residential MBS/CMO are 98% agency backed • 100% of asset backed securities are agency backed FFELP student loan bonds and rated AA+ or better Residential (MBS/CMO) 49.7% Commercial (MBS/CMO) 15.5% Asset Backed Securities 14.3% Municipal Bonds 20.5% $1.7B Yield: 2.08% Commercial Real Estate & Other 22.4% 1-4 Family Real Estate 10.5% Mortgage Warehouse 59.9% SEN Leverage 7.2% $1.6B Yield: 4.31%

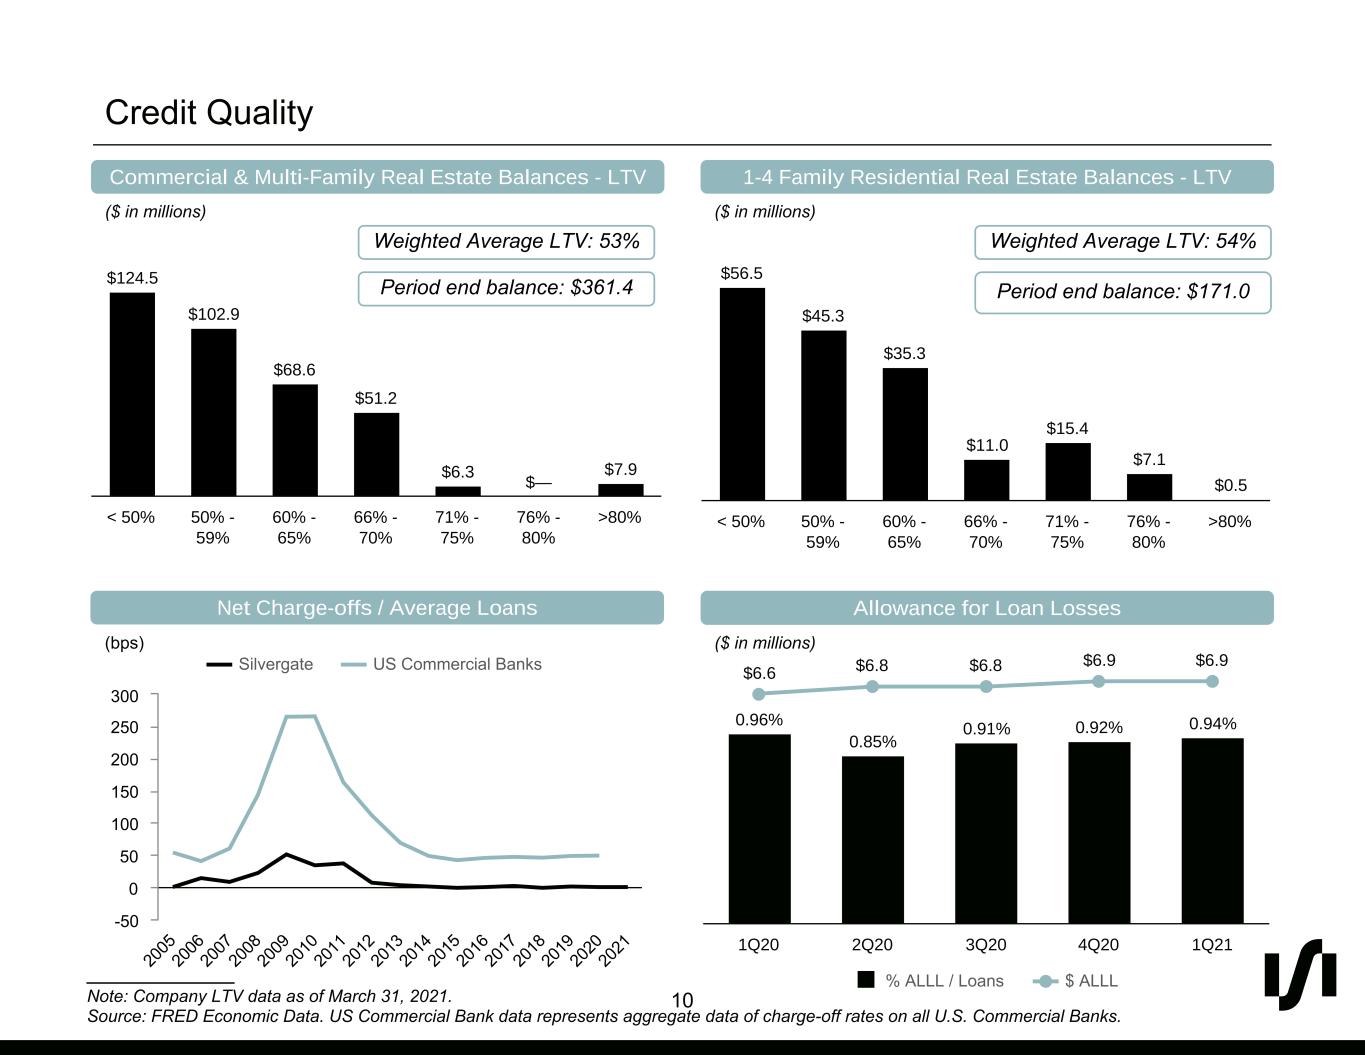
1 5 0 41 42 44 221 228 231 146 183 188 0 107 183 0 175 220 10 #010500 #DDE4E7 #919498 #92B7BC #00AFDC #006BB7 #292A2C Credit Quality Net Charge-offs / Average Loans Commercial & Multi-Family Real Estate Balances - LTV ($ in millions) ___________ Note: Company LTV data as of March 31, 2021. Source: FRED Economic Data. US Commercial Bank data represents aggregate data of charge-off rates on all U.S. Commercial Banks. 1-4 Family Residential Real Estate Balances - LTV Allowance for Loan Losses 0.96% 0.85% 0.91% 0.92% 0.94% $6.6 $6.8 $6.8 $6.9 $6.9 % ALLL / Loans $ ALLL 1Q20 2Q20 3Q20 4Q20 1Q21 Silvergate US Commercial Banks 20 05 20 06 20 07 20 08 20 09 20 10 20 11 20 12 20 13 20 14 20 15 20 16 20 17 20 18 20 19 20 20 20 21 -50 0 50 100 150 200 250 300 (bps) $124.5 $102.9 $68.6 $51.2 $6.3 $— $7.9 < 50% 50% - 59% 60% - 65% 66% - 70% 71% - 75% 76% - 80% >80% $56.5 $45.3 $35.3 $11.0 $15.4 $7.1 $0.5 < 50% 50% - 59% 60% - 65% 66% - 70% 71% - 75% 76% - 80% >80% Weighted Average LTV: 53% Weighted Average LTV: 54% Period end balance: $361.4 Period end balance: $171.0 ($ in millions) ($ in millions)

1 5 0 41 42 44 221 228 231 146 183 188 0 107 183 0 175 220 11 #010500 #DDE4E7 #919498 #92B7BC #00AFDC #006BB7 #292A2C Loan Portfolio (HFI) & COVID-19 Related Modifications • 8.9% of loan balances are in modification with either full payment deferral or resumed partial interest only payments as of March 31, 2021 compared to 8.5% as of December 31, 2020 • Both commercial and one-to four family borrowers, on a case by case basis, were provided payment deferral based on demonstrated need from the effects of COVID-19 • Other includes SEN Leverage, reverse mortgage and mortgage warehouse loans, not subject to loan modifications Commentary ___________ Note: COVID-19 loan modifications represent loans with payment deferrals as of March 31, 2021. Totals may not foot due to rounding. ($ in millions) Loan Segments at March 31, 2021 COVID-19 Loan Modifications Loan Segment Loan Balance WA LTV % of Total Loans HFI Real estate loans: One-to-four family $ 171 54 % 23.3 % Multi-family 74 51 % 10.1 % Commercial: Retail 76 54 % 10.3 % Hospitality 47 44 % 6.4 % Office 48 64 % 6.5 % Industrial 64 60 % 8.7 % Other 54 43 % 7.3 % Total commercial 287 53 % 39.2 % Construction 5 56 % 0.7 % Other 196 N/A 26.7 % Total gross loans HFI $ 734 N/A 100.0 % In Modification Loan Balance % of Total Loans HFI Real estate loans: One-to-four family $ 7 0.9 % Multi-family — — Commercial: Retail 10 1.4 % Hospitality 40 5.5 % Office 8 1.1 % Industrial — — Other — — Total commercial 58 8.0 % Construction — — Other — — Total modifications $ 65 8.9 %

1 5 0 41 42 44 221 228 231 146 183 188 0 107 183 0 175 220 12 #010500 #DDE4E7 #919498 #92B7BC #00AFDC #006BB7 #292A2C Capital and Liquidity Ratios Tier 1 Leverage Ratio Total Risk-Based Capital Ratio • The Bank had a tier 1 leverage ratio of 9.50%, a common equity tier 1 capital ratio of 53.36%, a tier 1 risk-based capital ratio of 53.36% and a total risk-based capital ratio of 53.93% at March 31, 2021 • Bank capital ratios each exceeded the “well capitalized” standards defined by the federal banking regulations • Decrease in loan to deposits ratio and increase in total risk-based capital ratio driven by the increase in digital currency deposits • Increase in tier 1 leverage ratio driven by higher capital as a result of equity raised during 1Q21 CommentaryLoans to Deposits ___________ Note: March 31, 2021 capital ratios are preliminary. 26.05% 25.54% 24.68% 23.49% 54.91% 1Q20 2Q20 3Q20 4Q20 1Q21 55.64% 66.75% 61.45% 30.73% 23.22% 1Q20 2Q20 3Q20 4Q20 1Q21 10.98% 11.57% 10.36% 8.29% 9.68% 1Q20 2Q20 3Q20 4Q20 1Q21

1 5 0 41 42 44 221 228 231 146 183 188 0 107 183 0 175 220 13 #010500 #DDE4E7 #919498 #92B7BC #00AFDC #006BB7 #292A2C The network effects of the SEN reinforce the strength of our product offerings, create a platform to launch new customer solutions, and enable high-quality revenues Silvergate Exchange Network Payments Lending Funding Stablecoin Infrastructure Foreign Exchange Cash Management SEN Leverage Digital Asset Custody Deposit Account Services Asset Management Network Effects of the SEN Create Multiple Avenues for Growth
