Attached files
| file | filename |
|---|---|
| 8-K - 8-K - SMARTFINANCIAL INC. | smbk-20210420x8k.htm |
| EX-99.1 - EX-99.1 - SMARTFINANCIAL INC. | smbk-20210420xex99d1.htm |
Exhibit 99.2
| INVESTOR CALL 1Q 2021 April 21, 2021, 10:00am Webcast: www.smartbank.com (Investor Relations) Audio Only: 888-317-6003 Confirmation #: 6293687 Miller Welborn Chairman of the Board Billy Carroll President & CEO |

| Legal Disclaimer 2 Forward-Looking Statements This presentation may contain statements that are based on management’s current estimates or expectations of future events or future results, and that may be deemed to constitute forward- looking statements as defined under the Private Securities Litigation Reform Act of 1995. These statements, including statements regarding the effects of the COVID-19 pandemic on SmartFinancial’s business and financial results and conditions, are not historical in nature and can generally be identified by such words as “expect,” “anticipate,” “intend,” “plan,” “believe,” “seek,” “may,” “estimate,” and similar expressions. All forward-looking statements are subject to risks, uncertainties, and other factors that may cause the actual results of SmartFinancial to differ materially from future results expressed or implied by such forward-looking statements. Such risks, uncertainties, and other factors include, among others, (1) the risk of litigation and reputational risk associated with historic acquisition activity;(2) the risk that cost savings and revenue synergies from recently completed acquisitions may not be realized or may take longer than anticipated to realize;(3) disruption from recently completed acquisitions with customer, supplier, employee, or other business relationships;(4) our ability to successfully integrate the businesses acquired as part of previous acquisitions with the business of SmartBank;(5) risks related to the proposed acquisition of Sevier County Bancshares (“SCB”);(6) the risk that the anticipated benefits from the proposed acquisition of SCB may not be realized in the time frame anticipated;(7) changes in management’s plans for the future;(8) prevailing, or changes in, economic or political conditions, particularly in our market areas;(9) credit risk associated with our lending activities;(10) changes in interest rates, loan demand, real estate values, or competition; (11) changes in accounting principles, policies, or guidelines;(12) changes in applicable laws, rules, or regulations, including changes to statutes, regulations or regulatory policies or practices as a result of, or in response to, COVID-19;(13) adverse results from current or future litigation, regulatory examinations or other legal and/or regulatory actions, including as a result of the Company’s participation in and execution of government programs related to the COVID-19 pandemic;(14) the impact of the COVID-19 pandemic on the Company’s assets, business, cash flows, financial condition, liquidity, prospects and results of operations;(15) potential increases in the provision for loan losses resulting from the COVID-19 pandemic; and (16) other general competitive, economic, political, and market factors, including those affecting our business, operations, pricing, products, or services. These and other factors that could cause results to differ materially from those described in the forward-looking statements can be found in SmartFinancial’s most recent annual report on Form 10-K, quarterly reports on Form 10-Q, and current reports on Form 8-K, in each case filed with or furnished to the Securities and Exchange Commission (the “SEC”) and available on the SEC’s website (www.sec.gov). Undue reliance should not be placed on forward-looking statements. SmartFinancial disclaims any obligation to update or revise any forward-looking statements contained in this release, which speak only as of the date hereof, whether as a result of new information, future events, or otherwise. Non-GAAP Financial Measures Statements included in this presentation include Non-GAAP financial measures and should be read along with the accompanying tables, which provide a reconciliation of Non-GAAP financial measures to GAAP financial measures. SmartFinancial management uses several Non-GAAP financial measures, including:(i) operating earnings, (ii) operating return on average assets, (iii) operating return on average shareholder equity, (iv) return on average tangible common equity, (v) operating return on average tangible common equity, (vi) operating efficiency ratio;(vii) tangible common equity;(viii) average tangible common equity;(ix) tangible book value;(x) operating pre-tax pre-provision earnings;(xi) operating noninterest income;(xii) operating noninterest expense;(xiii) tangible assets; and ratios derived therefrom, in its analysis of the company's performance. Operating earnings excludes the following from net income: securities gains and losses, proceeds related to the termination of an Alabama Department of Economic and Community Affairs (“ADECA”) loan program, merger related and restructuring expenses, and the income tax effect of adjustments. Operating return on average assets is the annualized operating earnings (Non-GAAP) divided by average assets. Operating return on average shareholder equity is the annualized operating earnings (Non- GAAP) divided by average equity. Return on average tangible common equity is the annualized net income divided by average tangible common equity (Non-GAAP). Operating return on average tangible common equity is the annualized operating earnings (Non-GAAP) divided by average tangible common equity (Non- GAAP). The operating efficiency ratio includes an adjustment for taxable equivalent yields and excludes securities gains and losses and merger related and restructuring expenses from the efficiency ratio. Tangible common equity and average tangible common equity excludes goodwill and other intangible assets from shareholders’ equity and average shareholders’ equity. Tangible book value excludes goodwill and other intangible assets less shareholders’ equity divided by common shares outstanding. Operating pre-tax pre- provision earnings is net interest income plus operating noninterest income (Non-GAAP) less operating noninterest expense (Non-GAAP). Operating noninterest income excludes the following from noninterest income: securities gains and losses, proceeds related to the termination of the ADECA loan program. Operating noninterest expense excludes the following from noninterest expense: prior year adjustments to salaries, merger related and restructuring expenses and certain franchise tax true-up expenses. Tangible assets excludes goodwill and other intangibles from total assets. Management believes that Non-GAAP financial measures provide additional useful information that allows investors to evaluate the ongoing performance of the company and provide meaningful comparisons to its peers. Management believes these non-GAAP financial measures also enhance investors' ability to compare period-to-period financial results and allow investors and company management to view our operating results excluding the impact of items that are not reflective of the underlying operating performance. Non-GAAP financial measures should not be considered as an alternative to any measure of performance or financial condition as promulgated under GAAP, and investors should consider SmartFinancial's performance and financial condition as reported under GAAP and all other relevant information when assessing the performance or financial condition of the company. Non-GAAP financial measures have limitations as analytical tools, and investors should not consider them in isolation or as a substitute for analysis of the results or financial condition as reported under GAAP. |
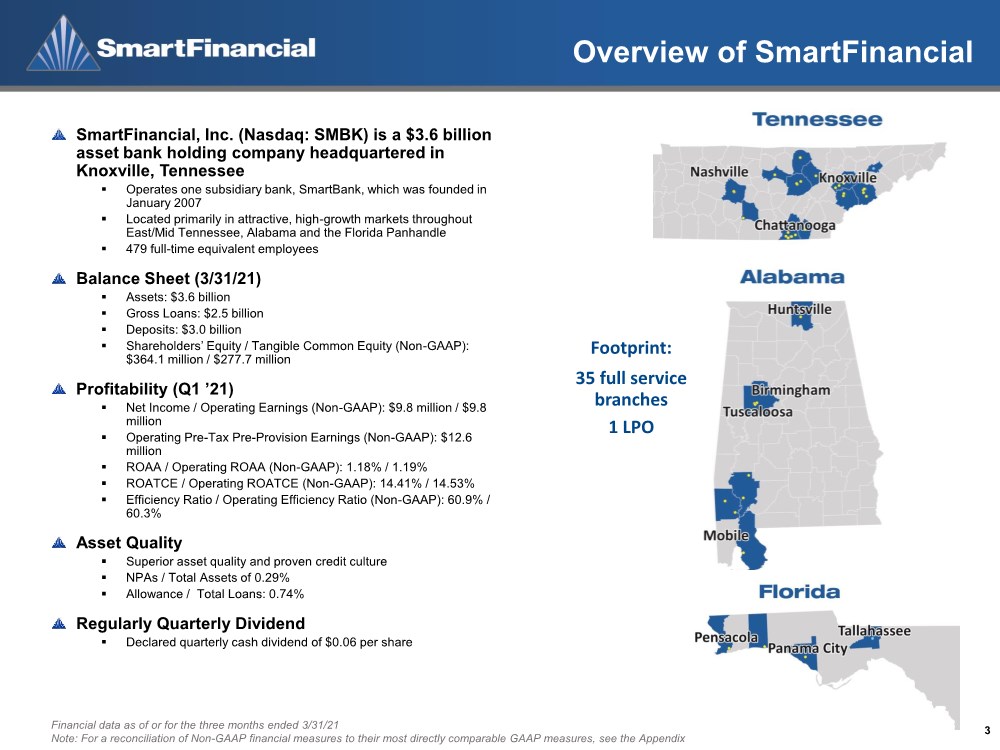
| Overview of SmartFinancial 3 Financial data as of or for the three months ended 3/31/21 Note: For a reconciliation of Non-GAAP financial measures to their most directly comparable GAAP measures, see the Appendix SmartFinancial, Inc. (Nasdaq: SMBK) is a $3.6 billion asset bank holding company headquartered in Knoxville, Tennessee ▪ Operates one subsidiary bank, SmartBank, which was founded in January 2007 ▪ Located primarily in attractive, high-growth markets throughout East/Mid Tennessee, Alabama and the Florida Panhandle ▪ 479 full-time equivalent employees Balance Sheet (3/31/21) ▪ Assets: $3.6 billion ▪ Gross Loans: $2.5 billion ▪ Deposits: $3.0 billion ▪ Shareholders’ Equity / Tangible Common Equity (Non-GAAP): $364.1 million / $277.7 million Profitability (Q1 ’21) ▪ Net Income / Operating Earnings (Non-GAAP): $9.8 million / $9.8 million ▪ Operating Pre-Tax Pre-Provision Earnings (Non-GAAP): $12.6 million ▪ ROAA / Operating ROAA (Non-GAAP): 1.18% / 1.19% ▪ ROATCE / Operating ROATCE (Non-GAAP): 14.41% / 14.53% ▪ Efficiency Ratio / Operating Efficiency Ratio (Non-GAAP): 60.9% / 60.3% Asset Quality ▪ Superior asset quality and proven credit culture ▪ NPAs / Total Assets of 0.29% ▪ Allowance / Total Loans: 0.74% Regularly Quarterly Dividend ▪ Declared quarterly cash dividend of $0.06 per share Footprint: 35 full service branches 1 LPO |
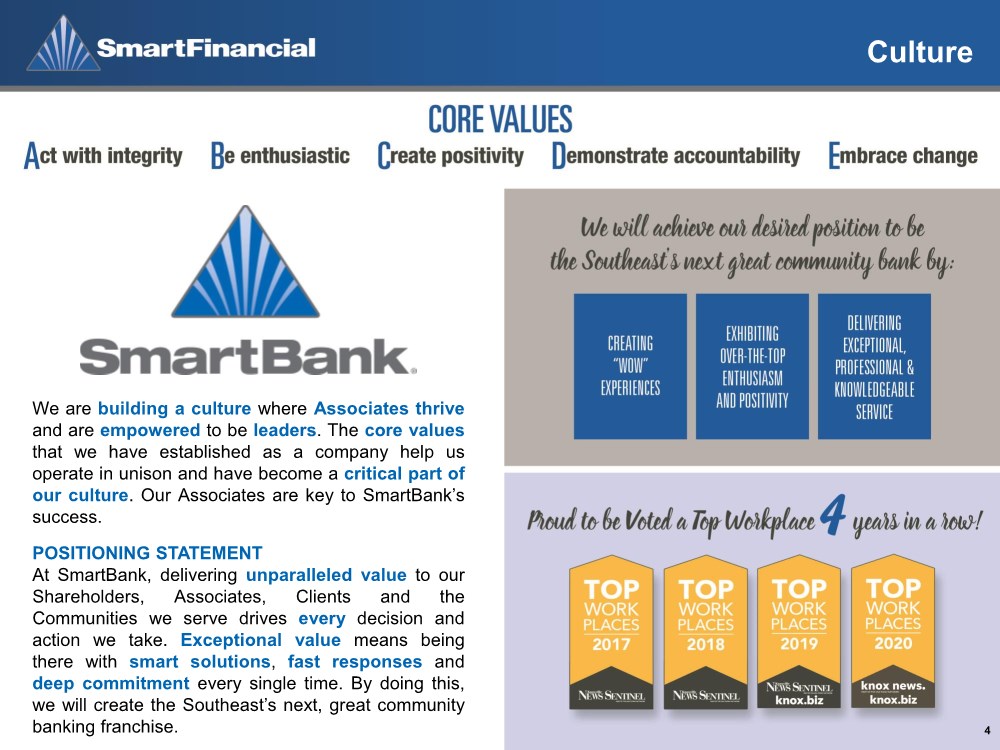
| Culture We are building a culture where Associates thrive and are empowered to be leaders. The core values that we have established as a company help us operate in unison and have become a critical part of our culture. Our Associates are key to SmartBank’s success. POSITIONING STATEMENT At SmartBank, delivering unparalleled value to our Shareholders, Associates, Clients and the Communities we serve drives every decision and action we take. Exceptional value means being there with smart solutions, fast responses and deep commitment every single time. By doing this, we will create the Southeast’s next, great community banking franchise. 4 |
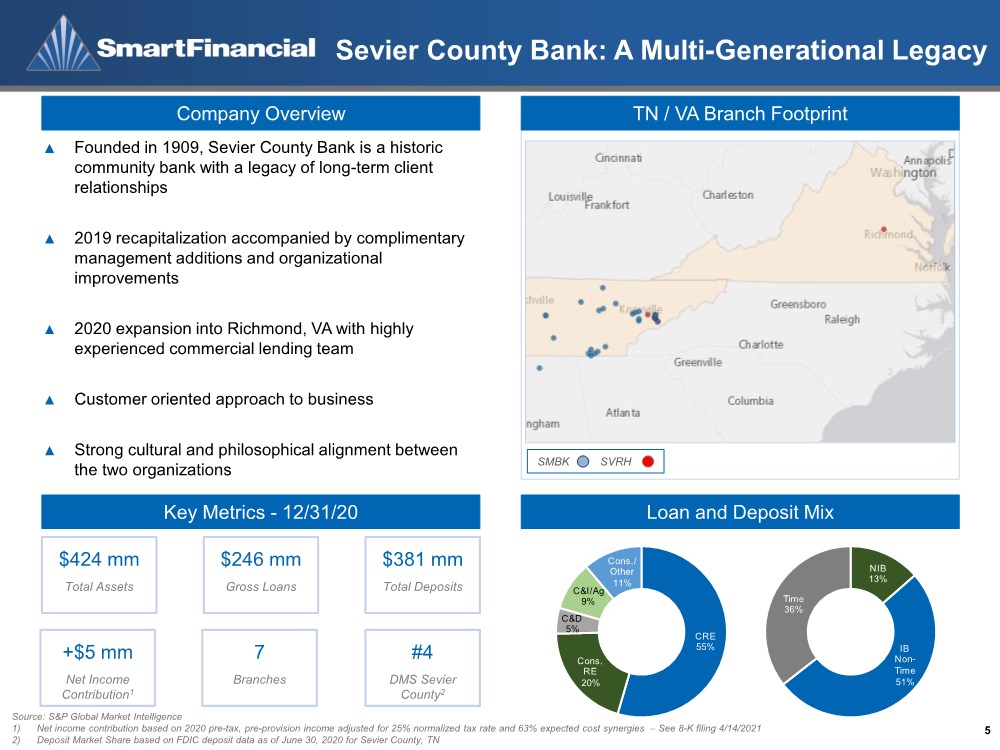
| Sevier County Bank: A Multi-Generational Legacy 5 CRE 55% Cons. RE 20% C&D 5% C&I/Ag 9% Cons./ Other 11% NIB 13% IB Non- Time 51% Time 36% ▲ Founded in 1909, Sevier County Bank is a historic community bank with a legacy of long-term client relationships ▲ 2019 recapitalization accompanied by complimentary management additions and organizational improvements ▲ 2020 expansion into Richmond, VA with highly experienced commercial lending team ▲ Customer oriented approach to business ▲ Strong cultural and philosophical alignment between the two organizations Company Overview Key Metrics - 12/31/20 Loan and Deposit Mix $424 mm Total Assets $246 mm Gross Loans $381 mm Total Deposits +$5 mm Net Income Contribution1 7 Branches #4 DMS Sevier County2 Source: S&P Global Market Intelligence 1) Net income contribution based on 2020 pre-tax, pre-provision income adjusted for 25% normalized tax rate and 63% expected cost synergies – See 8-K filing 4/14/2021 2) Deposit Market Share based on FDIC deposit data as of June 30, 2020 for Sevier County, TN SMBK SVRH TN / VA Branch Footprint |
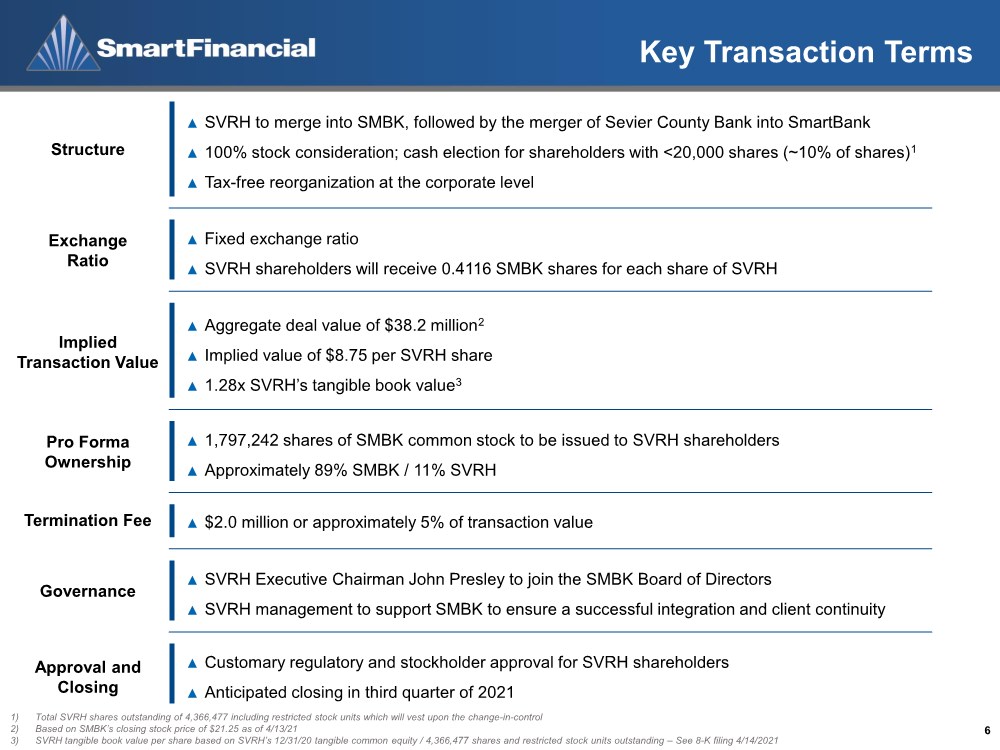
| Key Transaction Terms 6 ▲ SVRH to merge into SMBK, followed by the merger of Sevier County Bank into SmartBank ▲ 100% stock consideration; cash election for shareholders with <20,000 shares (~10% of shares)1 ▲ Tax-free reorganization at the corporate level ▲ Fixed exchange ratio ▲ SVRH shareholders will receive 0.4116 SMBK shares for each share of SVRH ▲ Aggregate deal value of $38.2 million2 ▲ Implied value of $8.75 per SVRH share ▲ 1.28x SVRH’s tangible book value3 ▲ 1,797,242 shares of SMBK common stock to be issued to SVRH shareholders ▲ Approximately 89% SMBK / 11% SVRH ▲ $2.0 million or approximately 5% of transaction value ▲ SVRH Executive Chairman John Presley to join the SMBK Board of Directors ▲ SVRH management to support SMBK to ensure a successful integration and client continuity ▲ Customary regulatory and stockholder approval for SVRH shareholders ▲ Anticipated closing in third quarter of 2021 1) Total SVRH shares outstanding of 4,366,477 including restricted stock units which will vest upon the change-in-control 2) Based on SMBK’s closing stock price of $21.25 as of 4/13/21 3) SVRH tangible book value per share based on SVRH’s 12/31/20 tangible common equity / 4,366,477 shares and restricted stock units outstanding – See 8-K filing 4/14/2021 Structure Exchange Ratio Implied Transaction Value Pro Forma Ownership Governance Approval and Closing Termination Fee |
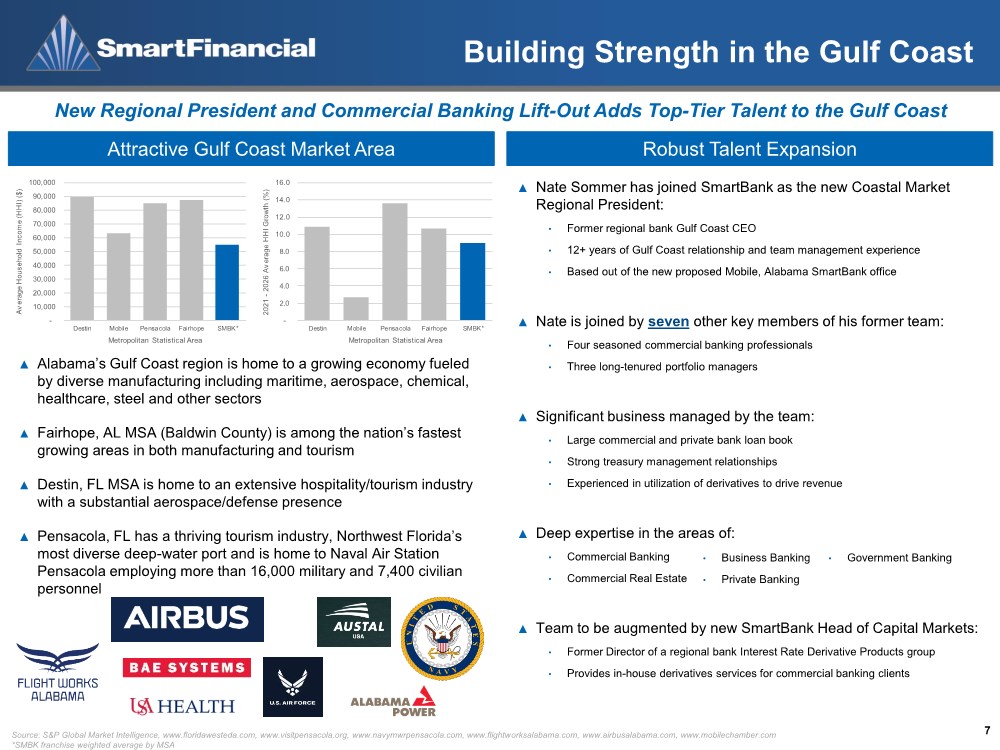
| 7 New Regional President and Commercial Banking Lift-Out Adds Top-Tier Talent to the Gulf Coast Attractive Gulf Coast Market Area Robust Talent Expansion - 2.0 4.0 6.0 8.0 10.0 12.0 14.0 16.0 Destin Mobile Pensacola Fairhope SMBK* 2021 - 2026 Av erage HHI Growth (%) Metropolitan Statistical Area - 10,000 20,000 30,000 40,000 50,000 60,000 70,000 80,000 90,000 100,000 Destin Mobile Pensacola Fairhope SMBK* Av erage Household Income (HHI) ($) Metropolitan Statistical Area ▲ Nate Sommer has joined SmartBank as the new Coastal Market Regional President: • Former regional bank Gulf Coast CEO • 12+ years of Gulf Coast relationship and team management experience • Based out of the new proposed Mobile, Alabama SmartBank office ▲ Nate is joined by seven other key members of his former team: • Four seasoned commercial banking professionals • Three long-tenured portfolio managers ▲ Significant business managed by the team: • Large commercial and private bank loan book • Strong treasury management relationships • Experienced in utilization of derivatives to drive revenue ▲ Deep expertise in the areas of: • Commercial Banking • Commercial Real Estate ▲ Team to be augmented by new SmartBank Head of Capital Markets: • Former Director of a regional bank Interest Rate Derivative Products group • Provides in-house derivatives services for commercial banking clients ▲ Alabama’s Gulf Coast region is home to a growing economy fueled by diverse manufacturing including maritime, aerospace, chemical, healthcare, steel and other sectors ▲ Fairhope, AL MSA (Baldwin County) is among the nation’s fastest growing areas in both manufacturing and tourism ▲ Destin, FL MSA is home to an extensive hospitality/tourism industry with a substantial aerospace/defense presence ▲ Pensacola, FL has a thriving tourism industry, Northwest Florida’s most diverse deep-water port and is home to Naval Air Station Pensacola employing more than 16,000 military and 7,400 civilian personnel Source: S&P Global Market Intelligence, www.floridawesteda.com, www.visitpensacola.org, www.navymwrpensacola.com, www.flightworksalabama.com, www.airbusalabama.com, www.mobilechamber.com *SMBK franchise weighted average by MSA Building Strength in the Gulf Coast • Business Banking • Private Banking • Government Banking |
| First Quarter Financial Highlights |

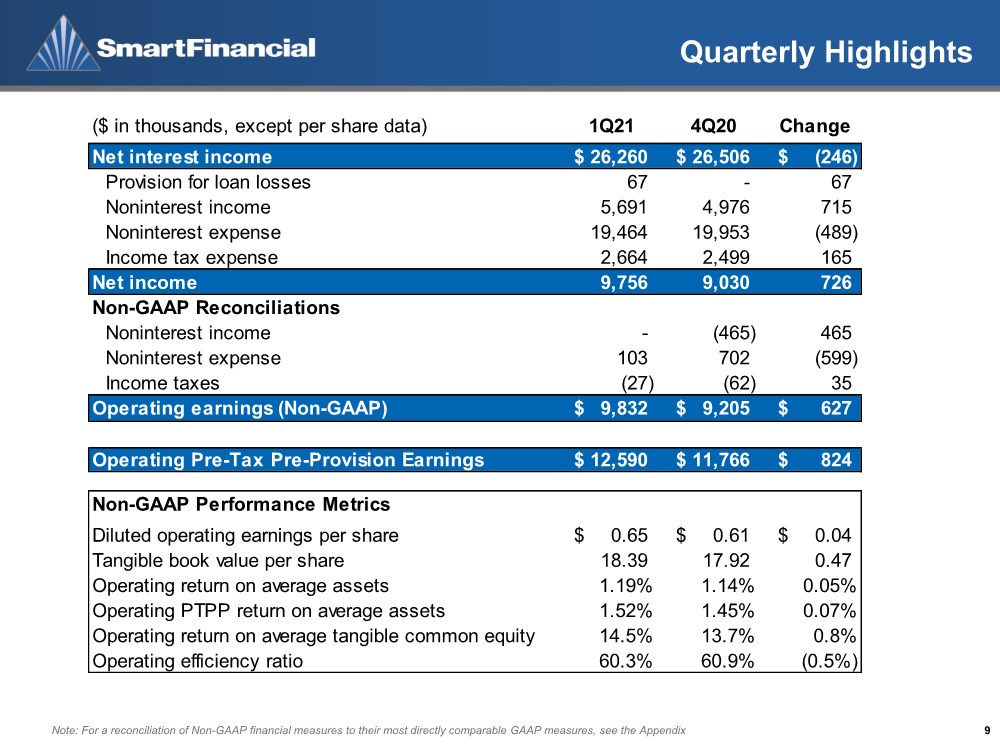
| Quarterly Highlights 9 Note: For a reconciliation of Non-GAAP financial measures to their most directly comparable GAAP measures, see the Appendix ($ in thousands, except per share data) 1Q21 4Q20 Change Net interest income 26,260 $ 26,506 $ (246) $ Provision for loan losses 67 - 67 Noninterest income 5,691 4,976 715 Noninterest expense 19,464 19,953 (489) Income tax expense 2,664 2,499 165 Net income 9,756 9,030 726 Non-GAAP Reconciliations Noninterest income - (465) 465 Noninterest expense 103 702 (599) Income taxes (27) (62) 35 Operating earnings (Non-GAAP) 9,832 $ 9,205 $ 627 $ Operating Pre-Tax Pre-Provision Earnings 12,590 $ 11,766 $ 824 $ Non-GAAP Performance Metrics Diluted operating earnings per share 0.65 $ 0.61 $ 0.04 $ Tangible book value per share 18.39 17.92 0.47 Operating return on average assets 1.19% 1.14% 0.05% Operating PTPP return on average assets 1.52% 1.45% 0.07% Operating return on average tangible common equity 14.5% 13.7% 0.8% Operating efficiency ratio 60.3% 60.9% (0.5%) |
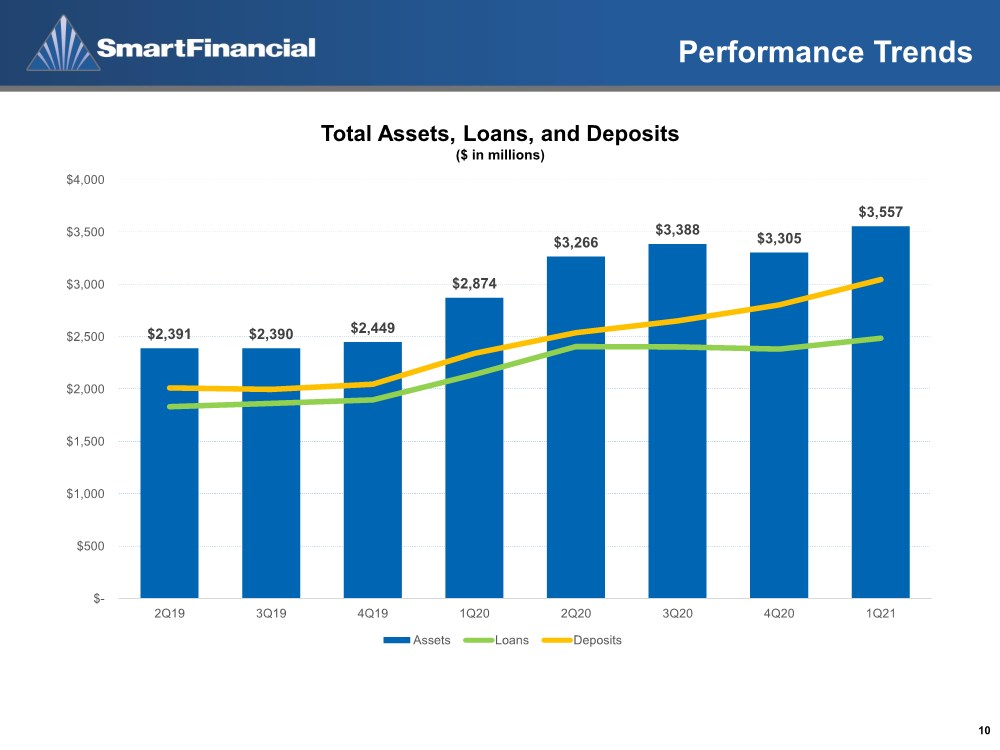
| Performance Trends 10 $2,391 $2,390 $2,449 $2,874 $3,266 $3,388 $3,305 $3,557 $- $500 $1,000 $1,500 $2,000 $2,500 $3,000 $3,500 $4,000 2Q19 3Q19 4Q19 1Q20 2Q20 3Q20 4Q20 1Q21 Assets Loans Deposits Total Assets, Loans, and Deposits ($ in millions) |
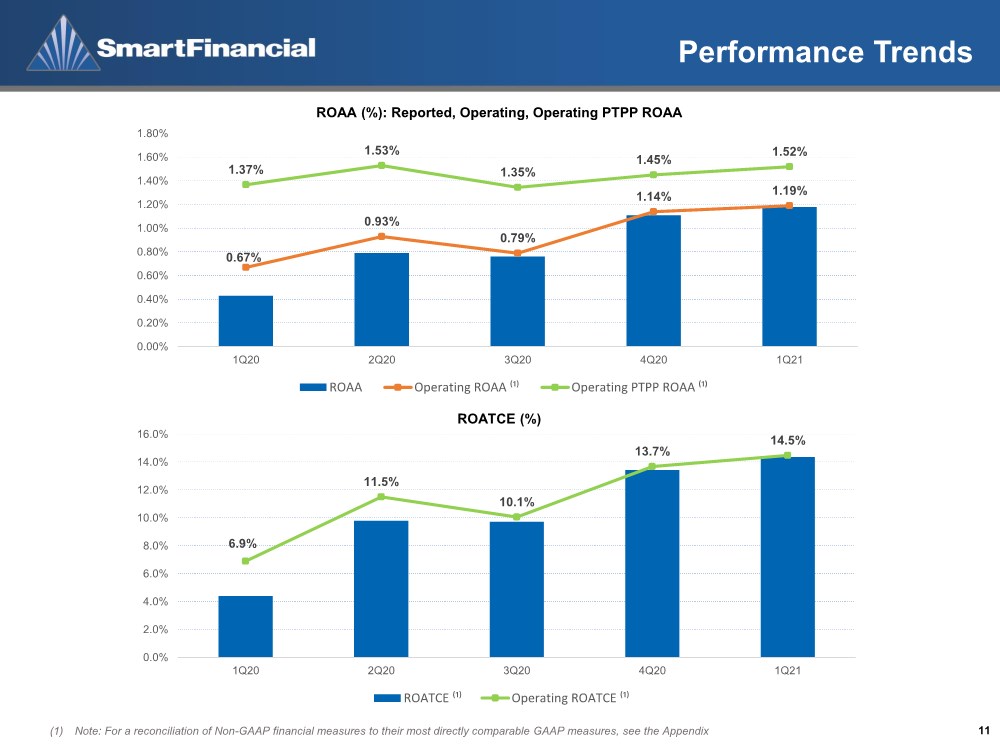
| Performance Trends 11 (1) Note: For a reconciliation of Non-GAAP financial measures to their most directly comparable GAAP measures, see the Appendix 0.67% 0.93% 0.79% 1.14% 1.19% 1.37% 1.53% 1.35% 1.45% 1.52% 0.00% 0.20% 0.40% 0.60% 0.80% 1.00% 1.20% 1.40% 1.60% 1.80% 1Q20 2Q20 3Q20 4Q20 1Q21 ROAA Operating ROAA ⁽¹⁾ Operating PTPP ROAA ⁽¹⁾ 6.9% 11.5% 10.1% 13.7% 14.5% 0.0% 2.0% 4.0% 6.0% 8.0% 10.0% 12.0% 14.0% 16.0% 1Q20 2Q20 3Q20 4Q20 1Q21 ROATCE ⁽¹⁾ Operating ROATCE ⁽¹⁾ ROAA (%): Reported, Operating, Operating PTPP ROAA ROATCE (%) |
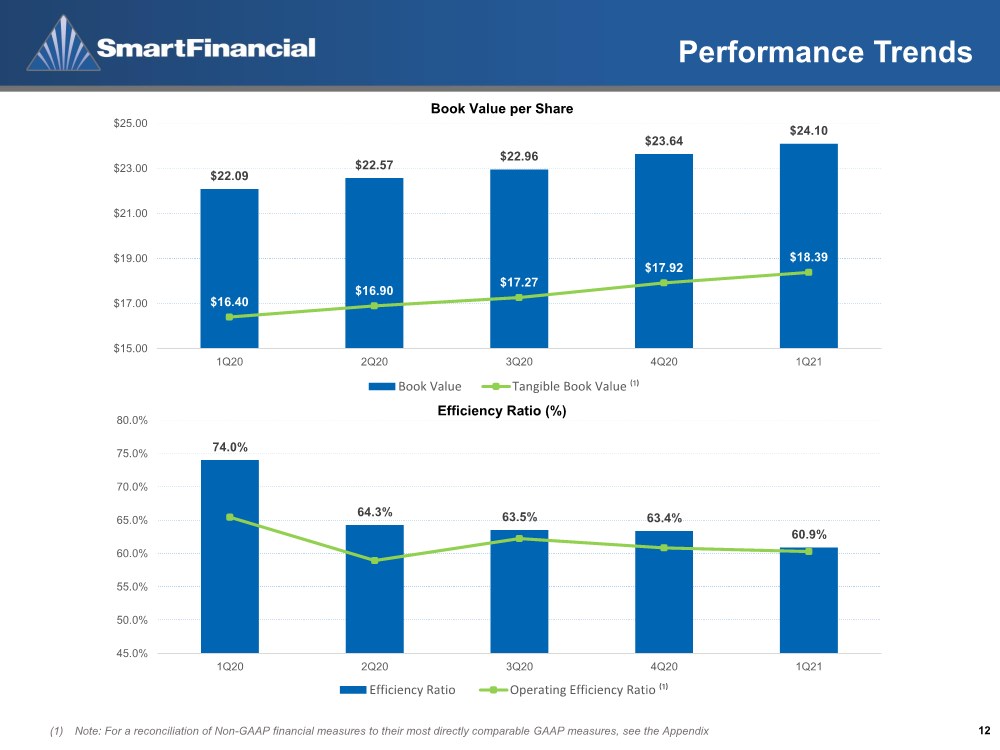
| Performance Trends 12 (1) Note: For a reconciliation of Non-GAAP financial measures to their most directly comparable GAAP measures, see the Appendix $22.09 $22.57 $22.96 $23.64 $24.10 $16.40 $16.90 $17.27 $17.92 $18.39 $15.00 $17.00 $19.00 $21.00 $23.00 $25.00 1Q20 2Q20 3Q20 4Q20 1Q21 Book Value Tangible Book Value ⁽¹⁾ 74.0% 64.3% 63.5% 63.4% 60.9% 45.0% 50.0% 55.0% 60.0% 65.0% 70.0% 75.0% 80.0% 1Q20 2Q20 3Q20 4Q20 1Q21 Efficiency Ratio Operating Efficiency Ratio ⁽¹⁾ Book Value per Share Efficiency Ratio (%) |
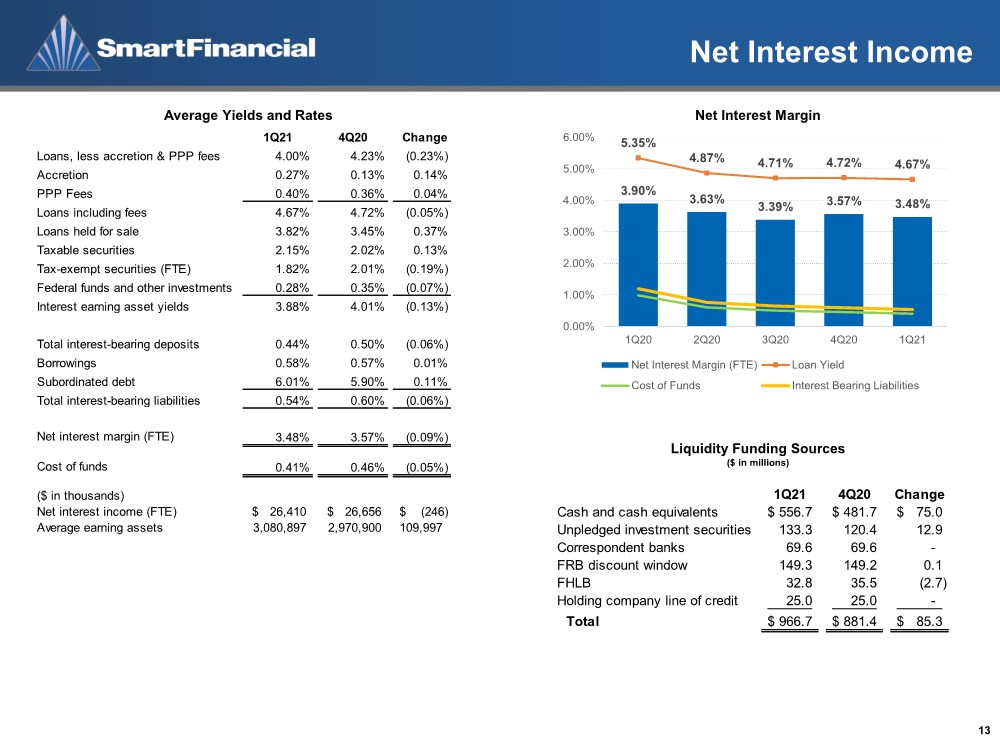
| Net Interest Income 13 3.90% 3.63% 3.39% 3.57% 3.48% 5.35% 4.87% 4.71% 4.72% 4.67% 0.00% 1.00% 2.00% 3.00% 4.00% 5.00% 6.00% 1Q20 2Q20 3Q20 4Q20 1Q21 Net Interest Margin (FTE) Loan Yield Cost of Funds Interest Bearing Liabilities Average Yields and Rates Net Interest Margin Liquidity Funding Sources ($ in millions) 1Q21 4Q20 Change Loans, less accretion & PPP fees 4.00% 4.23% (0.23%) Accretion 0.27% 0.13% 0.14% PPP Fees 0.40% 0.36% 0.04% Loans including fees 4.67% 4.72% (0.05%) Loans held for sale 3.82% 3.45% 0.37% Taxable securities 2.15% 2.02% 0.13% Tax-exempt securities (FTE) 1.82% 2.01% (0.19%) Federal funds and other investments 0.28% 0.35% (0.07%) Interest earning asset yields 3.88% 4.01% (0.13%) Total interest-bearing deposits 0.44% 0.50% (0.06%) Borrowings 0.58% 0.57% 0.01% Subordinated debt 6.01% 5.90% 0.11% Total interest-bearing liabilities 0.54% 0.60% (0.06%) Net interest margin (FTE) 3.48% 3.57% (0.09%) Cost of funds 0.41% 0.46% (0.05%) ($ in thousands) Net interest income (FTE) 26,410 $ 26,656 $ (246) $ Average earning assets 3,080,897 2,970,900 109,997 1Q21 4Q20 Change Cash and cash equivalents 556.7 $ 481.7 $ 75.0 $ Unpledged investment securities 133.3 120.4 12.9 Correspondent banks 69.6 69.6 - FRB discount window 149.3 149.2 0.1 FHLB 32.8 35.5 (2.7) Holding company line of credit 25.0 25.0 - Total 966.7 $ 881.4 $ 85.3 $ |
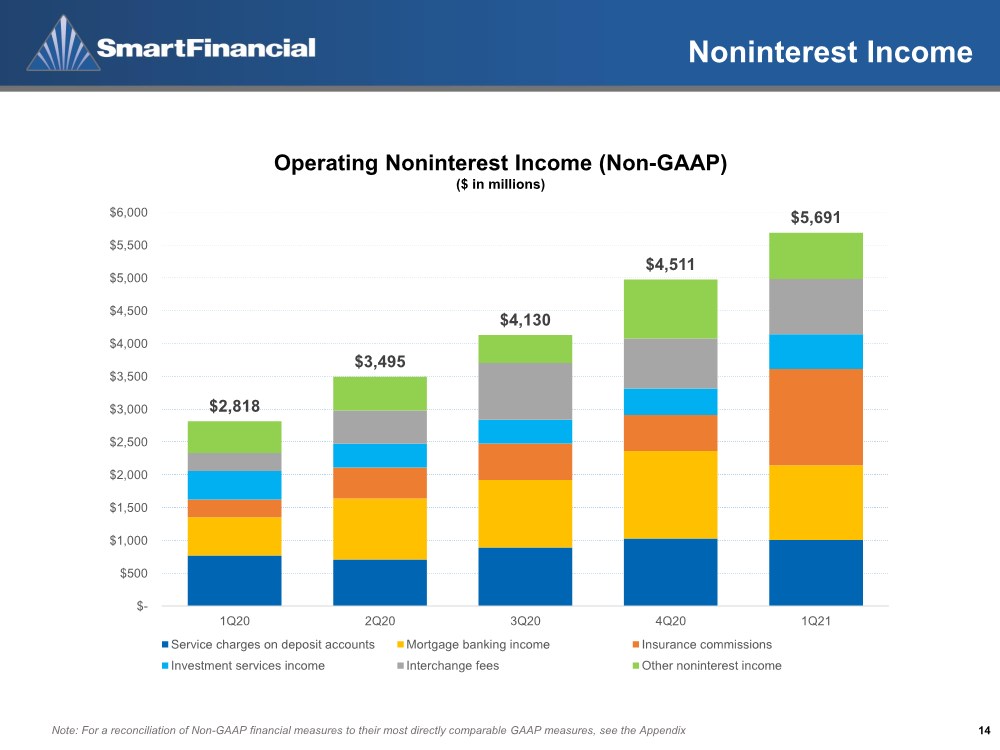
| Noninterest Income 14 Note: For a reconciliation of Non-GAAP financial measures to their most directly comparable GAAP measures, see the Appendix $2,818 $3,495 $4,130 $4,511 $5,691 $- $500 $1,000 $1,500 $2,000 $2,500 $3,000 $3,500 $4,000 $4,500 $5,000 $5,500 $6,000 1Q20 2Q20 3Q20 4Q20 1Q21 Service charges on deposit accounts Mortgage banking income Insurance commissions Investment services income Interchange fees Other noninterest income Operating Noninterest Income (Non-GAAP) ($ in millions) |
| Noninterest Income Strategic Goals 15 Enhanced CRM and synergy initiatives for increased revenues Increased efficiency across all units Digital innovation to enhance customer experience |
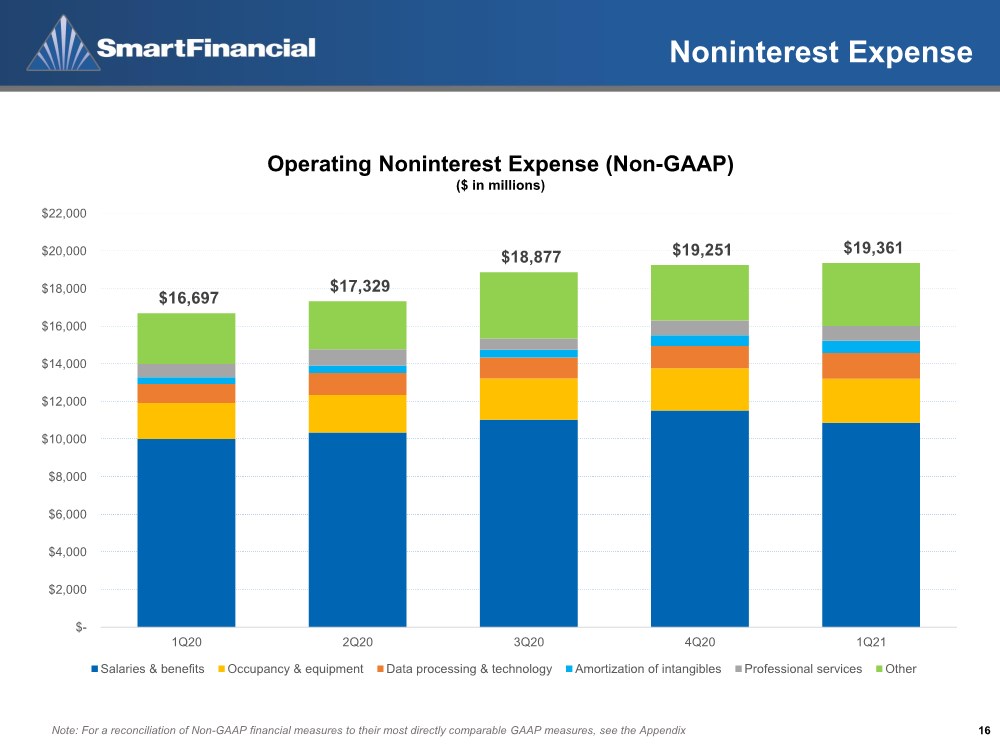
| Noninterest Expense 16 Note: For a reconciliation of Non-GAAP financial measures to their most directly comparable GAAP measures, see the Appendix Operating Noninterest Expense (Non-GAAP) ($ in millions) $16,697 $17,329 $18,877 $19,251 $19,361 $- $2,000 $4,000 $6,000 $8,000 $10,000 $12,000 $14,000 $16,000 $18,000 $20,000 $22,000 1Q20 2Q20 3Q20 4Q20 1Q21 Salaries & benefits Occupancy & equipment Data processing & technology Amortization of intangibles Professional services Other |
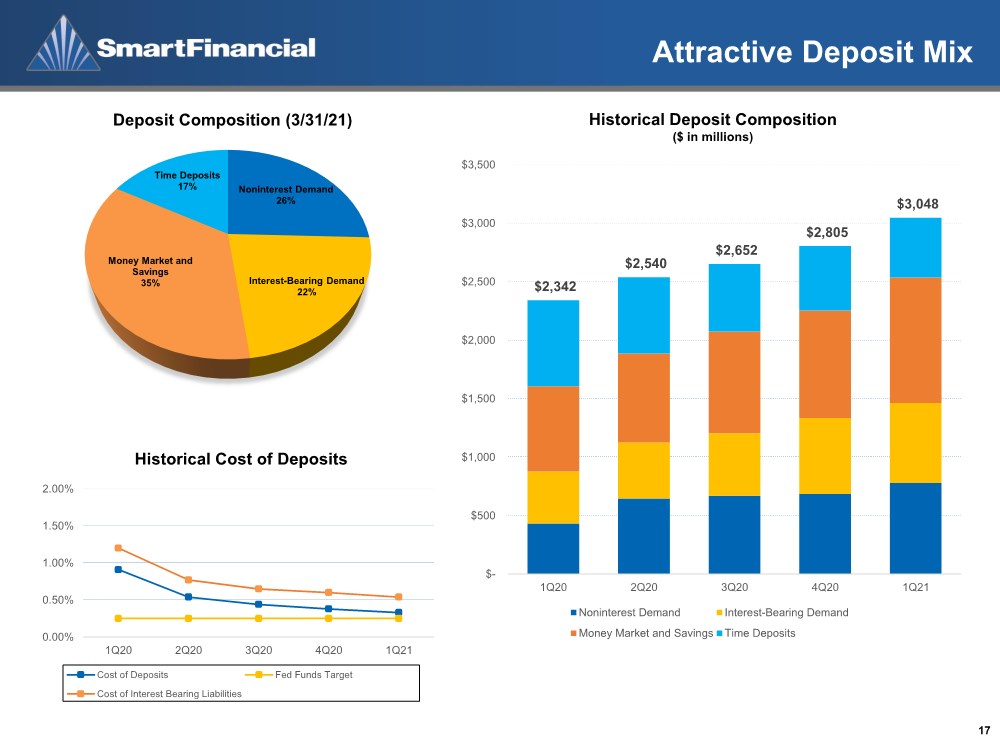
| Attractive Deposit Mix 17 Noninterest Demand 26% Interest-Bearing Demand 22% Money Market and Savings 35% Time Deposits 17% Deposit Composition (3/31/21) $2,342 $2,540 $2,652 $2,805 $3,048 $- $500 $1,000 $1,500 $2,000 $2,500 $3,000 $3,500 1Q20 2Q20 3Q20 4Q20 1Q21 Noninterest Demand Interest-Bearing Demand Money Market and Savings Time Deposits Historical Deposit Composition ($ in millions) 0.00% 0.50% 1.00% 1.50% 2.00% 1Q20 2Q20 3Q20 4Q20 1Q21 Cost of Deposits Fed Funds Target Cost of Interest Bearing Liabilities Historical Cost of Deposits |
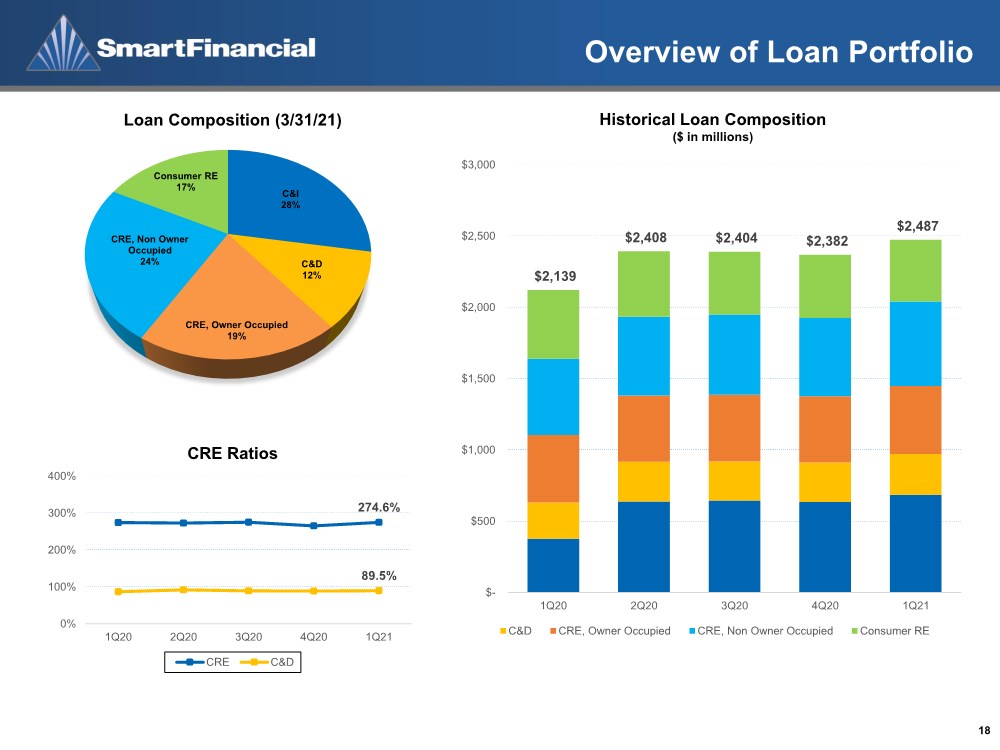
| Overview of Loan Portfolio 18 Loan Composition (3/31/21) Historical Loan Composition ($ in millions) CRE Ratios C&I 28% C&D 12% CRE, Owner Occupied 19% CRE, Non Owner Occupied 24% Consumer RE 17% $2,139 $2,408 $2,404 $2,382 $2,487 $- $500 $1,000 $1,500 $2,000 $2,500 $3,000 1Q20 2Q20 3Q20 4Q20 1Q21 C&D CRE, Owner Occupied CRE, Non Owner Occupied Consumer RE 274.6% 89.5% 0% 100% 200% 300% 400% 1Q20 2Q20 3Q20 4Q20 1Q21 CRE C&D |
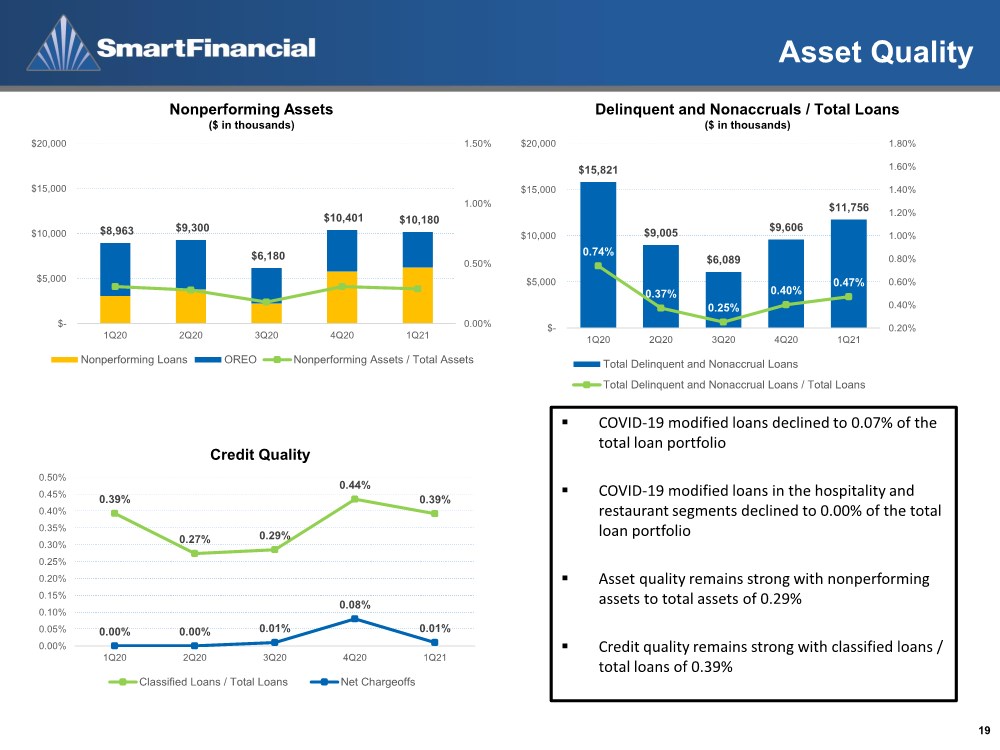
| Asset Quality 19 Credit Quality ▪ COVID-19 modified loans declined to 0.07% of the total loan portfolio ▪ COVID-19 modified loans in the hospitality and restaurant segments declined to 0.00% of the total loan portfolio ▪ Asset quality remains strong with nonperforming assets to total assets of 0.29% ▪ Credit quality remains strong with classified loans / total loans of 0.39% $15,821 $9,005 $6,089 $9,606 $11,756 0.74% 0.37% 0.25% 0.40% 0.47% 0.20% 0.40% 0.60% 0.80% 1.00% 1.20% 1.40% 1.60% 1.80% $- $5,000 $10,000 $15,000 $20,000 1Q20 2Q20 3Q20 4Q20 1Q21 Total Delinquent and Nonaccrual Loans Total Delinquent and Nonaccrual Loans / Total Loans Delinquent and Nonaccruals / Total Loans ($ in thousands) 0.39% 0.27% 0.29% 0.44% 0.39% 0.00% 0.00% 0.01% 0.08% 0.01% 0.00% 0.05% 0.10% 0.15% 0.20% 0.25% 0.30% 0.35% 0.40% 0.45% 0.50% 1Q20 2Q20 3Q20 4Q20 1Q21 Classified Loans / Total Loans Net Chargeoffs $8,963 $9,300 $6,180 $10,401 $10,180 0.00% 0.50% 1.00% 1.50% $- $5,000 $10,000 $15,000 $20,000 1Q20 2Q20 3Q20 4Q20 1Q21 Nonperforming Loans OREO Nonperforming Assets / Total Assets Nonperforming Assets ($ in thousands) |
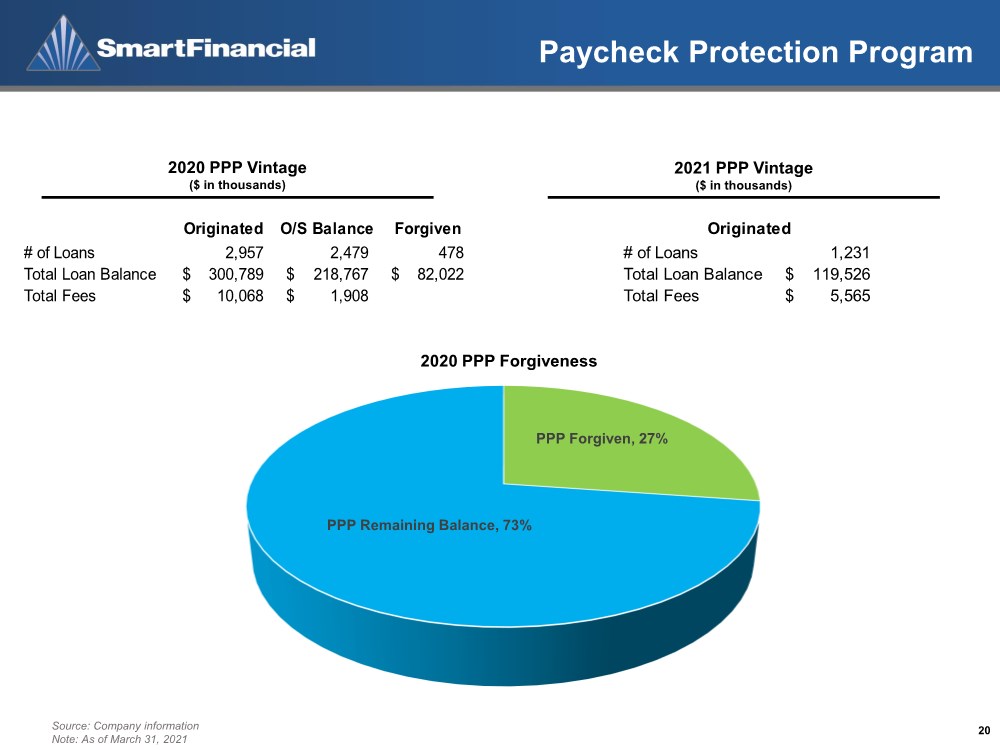
| Paycheck Protection Program 20 2020 PPP Vintage ($ in thousands) 2021 PPP Vintage ($ in thousands) Source: Company information Note: As of March 31, 2021 PPP Forgiven, 27% PPP Remaining Balance, 73% Originated O/S Balance Forgiven # of Loans 2,957 2,479 478 Total Loan Balance 300,789 $ 218,767 $ 82,022 $ Total Fees 10,068 $ 1,908 $ # of Loans 1,231 Total Loan Balance 119,526 $ Total Fees 5,565 $ Originated 2020 PPP Forgiveness |
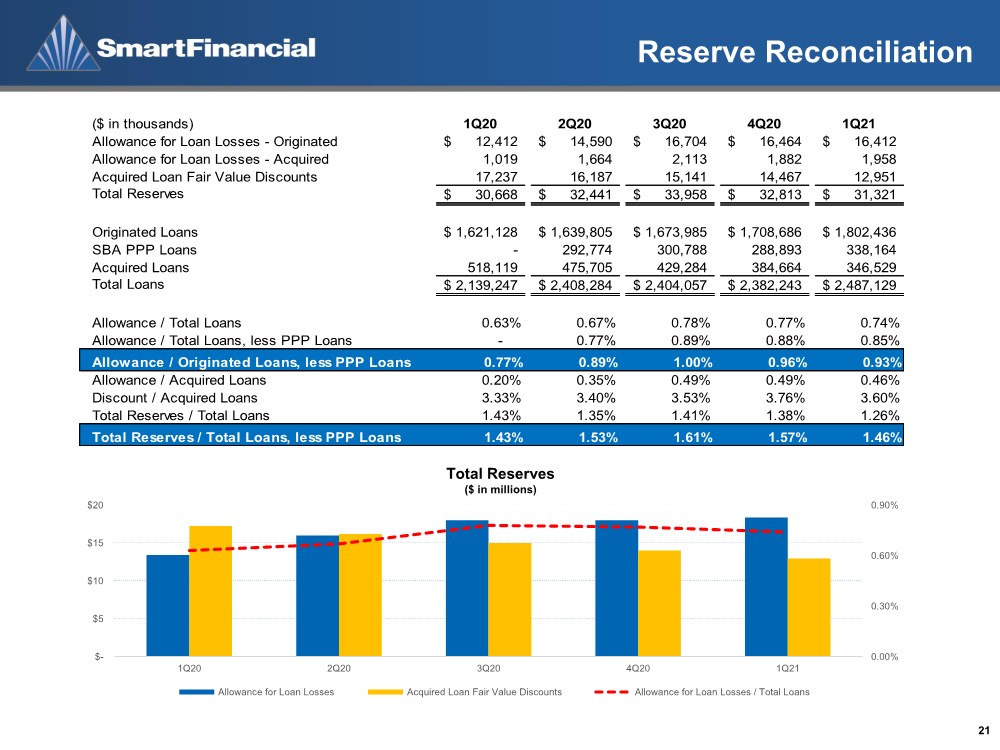
| Reserve Reconciliation 21 0.00% 0.30% 0.60% 0.90% $- $5 $10 $15 $20 1Q20 2Q20 3Q20 4Q20 1Q21 Allowance for Loan Losses Acquired Loan Fair Value Discounts Allowance for Loan Losses / Total Loans Total Reserves ($ in millions) ($ in thousands) 1Q20 2Q20 3Q20 4Q20 1Q21 Allowance for Loan Losses - Originated 12,412 $ 14,590 $ 16,704 $ 16,464 $ 16,412 $ Allowance for Loan Losses - Acquired 1,019 1,664 2,113 1,882 1,958 Acquired Loan Fair Value Discounts 17,237 16,187 15,141 14,467 12,951 Total Reserves 30,668 $ 32,441 $ 33,958 $ 32,813 $ 31,321 $ Originated Loans 1,621,128 $ 1,639,805 $ 1,673,985 $ 1,708,686 $ 1,802,436 $ SBA PPP Loans - 292,774 300,788 288,893 338,164 Acquired Loans 518,119 475,705 429,284 384,664 346,529 Total Loans 2,139,247 $ 2,408,284 $ 2,404,057 $ 2,382,243 $ 2,487,129 $ Allowance / Total Loans 0.63% 0.67% 0.78% 0.77% 0.74% Allowance / Total Loans, less PPP Loans - 0.77% 0.89% 0.88% 0.85% Allowance / Originated Loans, less PPP Loans 0.77% 0.89% 1.00% 0.96% 0.93% Allowance / Acquired Loans 0.20% 0.35% 0.49% 0.49% 0.46% Discount / Acquired Loans 3.33% 3.40% 3.53% 3.76% 3.60% Total Reserves / Total Loans 1.43% 1.35% 1.41% 1.38% 1.26% Total Reserves / Total Loans, less PPP Loans 1.43% 1.53% 1.61% 1.57% 1.46% |
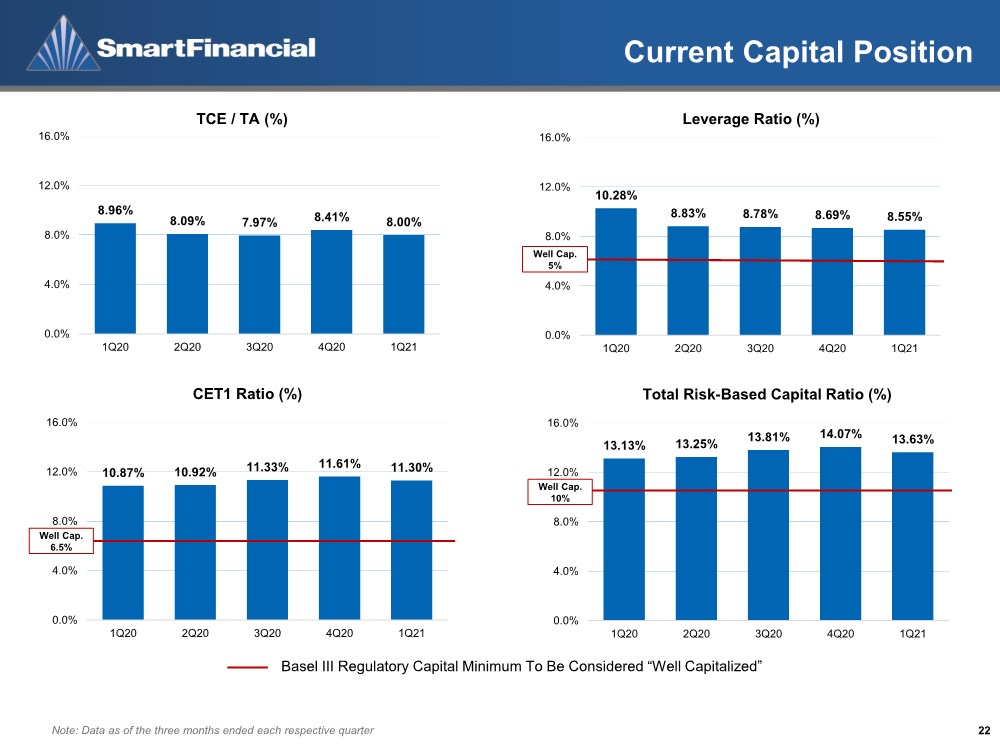
| Current Capital Position 22 CET1 Ratio (%) Basel III Regulatory Capital Minimum To Be Considered “Well Capitalized” Note: Data as of the three months ended each respective quarter 8.96% 8.09% 7.97% 8.41% 8.00% 0.0% 4.0% 8.0% 12.0% 16.0% 1Q20 2Q20 3Q20 4Q20 1Q21 TCE / TA (%) 10.28% 8.83% 8.78% 8.69% 8.55% 0.0% 4.0% 8.0% 12.0% 16.0% 1Q20 2Q20 3Q20 4Q20 1Q21 Leverage Ratio (%) Well Cap. 5% 10.87% 10.92% 11.33% 11.61% 11.30% 0.0% 4.0% 8.0% 12.0% 16.0% 1Q20 2Q20 3Q20 4Q20 1Q21 Well Cap. 6.5% 13.13% 13.25% 13.81% 14.07% 13.63% 0.0% 4.0% 8.0% 12.0% 16.0% 1Q20 2Q20 3Q20 4Q20 1Q21 Total Risk-Based Capital Ratio (%) Well Cap. 10% |
| Appendix |
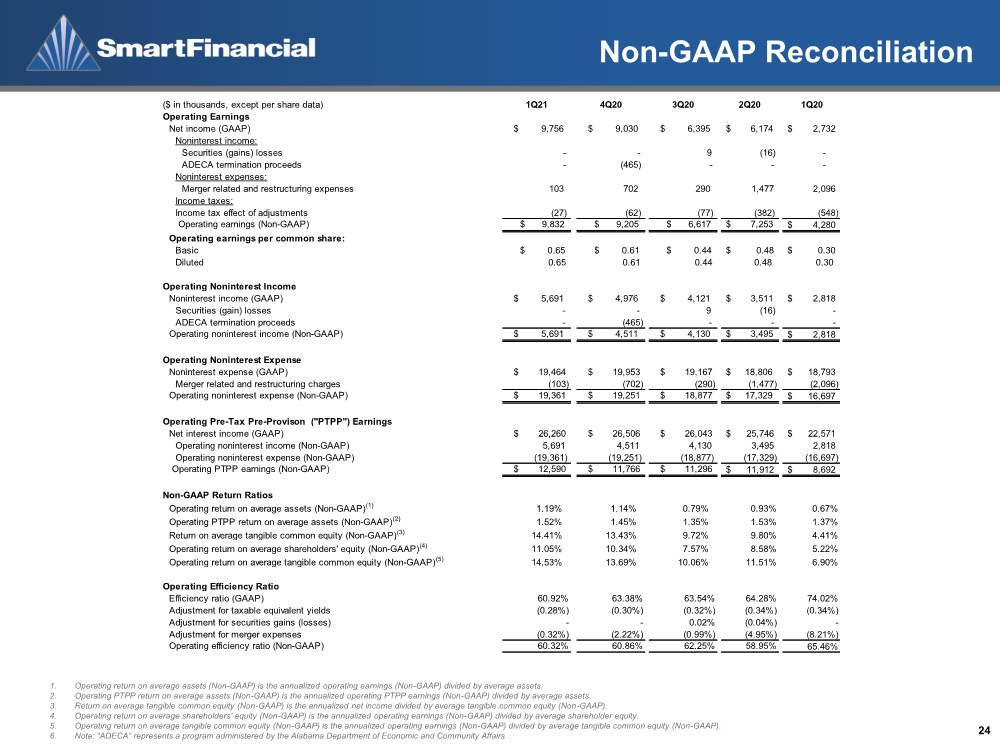
| Non-GAAP Reconciliation 24 1. Operating return on average assets (Non-GAAP) is the annualized operating earnings (Non-GAAP) divided by average assets. 2. Operating PTPP return on average assets (Non-GAAP) is the annualized operating PTPP earnings (Non-GAAP) divided by average assets. 3. Return on average tangible common equity (Non-GAAP) is the annualized net income divided by average tangible common equity (Non-GAAP). 4. Operating return on average shareholders’ equity (Non-GAAP) is the annualized operating earnings (Non-GAAP) divided by average shareholder equity. 5. Operating return on average tangible common equity (Non-GAAP) is the annualized operating earnings (Non-GAAP) divided by average tangible common equity (Non-GAAP). 6. Note: “ADECA” represents a program administered by the Alabama Department of Economic and Community Affairs ($ in thousands, except per share data) 1Q21 4Q20 3Q20 2Q20 1Q20 Operating Earnings Net income (GAAP) $ 9,756 $ 9,030 $ 6,395 $ 6,174 2,732 $ Noninterest income: Securities (gains) losses - - 9 (16) - ADECA termination proceeds - (465) - - - Noninterest expenses: Merger related and restructuring expenses 103 702 290 1,477 2,096 Income taxes: Income tax effect of adjustments (27) (62) (77) (382) (548) Operating earnings (Non-GAAP) $ 9,832 $ 9,205 $ 6,617 $ 7,253 4,280 $ Operating earnings per common share: Basic $ 0.65 $ 0.61 $ 0.44 $ 0.48 $ 0.30 Diluted 0.65 0.61 0.44 0.48 0.30 Operating Noninterest Income Noninterest income (GAAP) $ 5,691 $ 4,976 $ 4,121 $ 3,511 2,818 $ Securities (gain) losses - - 9 (16) - ADECA termination proceeds - (465) - - - Operating noninterest income (Non-GAAP) $ 5,691 $ 4,511 $ 4,130 $ 3,495 2,818 $ Operating Noninterest Expense Noninterest expense (GAAP) $ 19,464 $ 19,953 $ 19,167 $ 18,806 18,793 $ Merger related and restructuring charges (103) (702) (290) (1,477) (2,096) Operating noninterest expense (Non-GAAP) $ 19,361 $ 19,251 $ 18,877 $ 17,329 16,697 $ Operating Pre-Tax Pre-Provison ("PTPP") Earnings Net interest income (GAAP) $ 26,260 $ 26,506 $ 26,043 25,746 $ 22,571 $ Operating noninterest income (Non-GAAP) 5,691 4,511 4,130 3,495 2,818 Operating noninterest expense (Non-GAAP) (19,361) (19,251) (18,877) (17,329) (16,697) Operating PTPP earnings (Non-GAAP) $ 12,590 $ 11,766 $ 11,296 11,912 $ 8,692 $ Non-GAAP Return Ratios Operating return on average assets (Non-GAAP)(1) 1.19% 1.14% 0.79% 0.93% 0.67% Operating PTPP return on average assets (Non-GAAP)(2) 1.52% 1.45% 1.35% 1.53% 1.37% Return on average tangible common equity (Non-GAAP)(3) 14.41% 13.43% 9.72% 9.80% 4.41% Operating return on average shareholders' equity (Non-GAAP)(4) 11.05% 10.34% 7.57% 8.58% 5.22% Operating return on average tangible common equity (Non-GAAP)(5) 14.53% 13.69% 10.06% 11.51% 6.90% Operating Efficiency Ratio Efficiency ratio (GAAP) 60.92% 63.38% 63.54% 64.28% 74.02% Adjustment for taxable equivalent yields (0.28%) (0.30%) (0.32%) (0.34%) (0.34%) Adjustment for securities gains (losses) -- 0.02% (0.04%) - Adjustment for merger expenses (0.32%) (2.22%) (0.99%) (4.95%) (8.21%) Operating efficiency ratio (Non-GAAP) 60.32% 60.86% 62.25% 58.95% 65.46% |
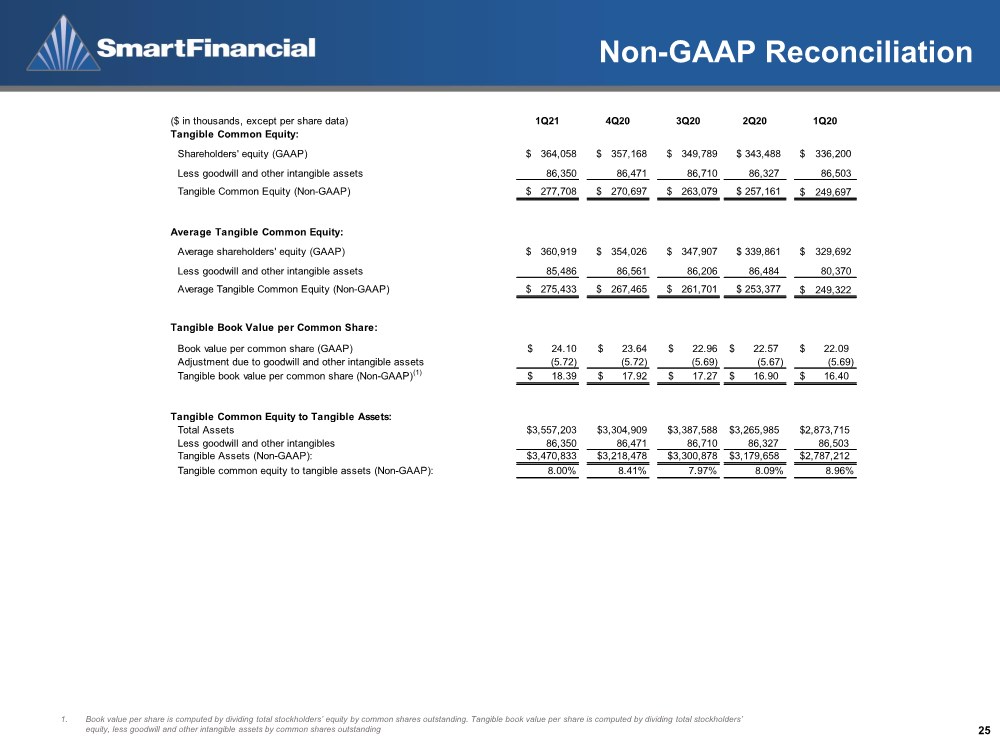
| Non-GAAP Reconciliation 25 1. Book value per share is computed by dividing total stockholders’ equity by common shares outstanding. Tangible book value per share is computed by dividing total stockholders’ equity, less goodwill and other intangible assets by common shares outstanding ($ in thousands, except per share data) 1Q21 4Q20 3Q20 2Q20 1Q20 Tangible Common Equity: Shareholders' equity (GAAP) $ 364,058 $ 357,168 $ 349,789 $ 343,488 336,200 $ Less goodwill and other intangible assets 86,350 86,471 86,710 86,327 86,503 Tangible Common Equity (Non-GAAP) $ 277,708 $ 270,697 $ 263,079 $ 257,161 249,697 $ Average Tangible Common Equity: Average shareholders' equity (GAAP) $ 360,919 $ 354,026 $ 347,907 $ 339,861 329,692 $ Less goodwill and other intangible assets 85,486 86,561 86,206 86,484 80,370 Average Tangible Common Equity (Non-GAAP) $ 275,433 $ 267,465 $ 261,701 $ 253,377 249,322 $ Tangible Book Value per Common Share: Book value per common share (GAAP) $ 24.10 $ 23.64 $ 22.96 $ 22.57 $ 22.09 Adjustment due to goodwill and other intangible assets (5.72) (5.72) (5.69) (5.67) (5.69) Tangible book value per common share (Non-GAAP)(1) $ 18.39 $ 17.92 $ 17.27 $ 16.90 $ 16.40 Tangible Common Equity to Tangible Assets: Total Assets $3,557,203 $3,304,909 $3,387,588 $3,265,985 $2,873,715 Less goodwill and other intangibles 86,350 86,471 86,710 86,327 86,503 Tangible Assets (Non-GAAP): $3,470,833 $3,218,478 $3,300,878 $3,179,658 $2,787,212 Tangible common equity to tangible assets (Non-GAAP): 8.00% 8.41% 7.97% 8.09% 8.96% |
| Investor Contact 26 Billy Carroll President & CEO 865.868.0613 billy.carroll@smartbank.com Miller Welborn Chairman 423.385.3067 miller.welborn@smartbank.com 5401 Kingston Pike, Suite 600 Knoxville, TN 37919 |
|