Attached files
| file | filename |
|---|---|
| 8-K - 8-K - CNB FINANCIAL CORP/PA | d162756d8k.htm |

Exhibit 99.1 DISCUSSIONMATERIALS ANNUAL SHAREHOLDER MEETING PRESENTATION APRIL 20, 2021

CERTAIN IMPORTANT INFORMATION CAUTION REGARDING FORWARD LOOKING STATEMENTS This presentation includes forward-looking statements within the meaning of Section 27A of the Securities Act of 1933, as amended, and Section 21E of the Securities Exchange Act of 1934, as amended, with respect to CNB’s financial condition, liquidity, results of operations, future performance and business. These forward-looking statements are intended to be covered by the safe harbor for “forward-looking statements” provided by the Private Securities Litigation Reform Act of 1995. Forward-looking statements are those that are not historical facts. Forward-looking statements include statements with respect to beliefs, plans, objectives, goals, expectations, anticipations, estimates and intentions that are subject to significant risks and uncertainties and are subject to change based on various factors (some of which are beyond CNB’s control). Forward-looking statements often include the words “believes,” “expects,” “anticipates,” “estimates,” “forecasts,” “intends,” “plans,” “targets,” “potentially,” “probably,” “projects,” “outlook” or similar expressions or future conditional verbs such as “may,” “will,” “should,” “would” and “could.” CNB’s actual results may differ materially from those contemplated by the forward-looking statements, which are neither statements of historical fact nor guarantees or assurances of future performance. Such known and unknown risks, uncertainties and other factors that could cause the actual results to differ materially from the statements, include, but are not limited to, (i) the duration and scope of the COVID-19 pandemic and the local; national and global impact of COVID-19; (ii) actions governments, businesses and individuals take in response to the pandemic; (iii) the speed and effectiveness of vaccine and treatment developments and deployment; (iv) the pace of recovery when the COVID-19 pandemic subsides; (v) changes in general business, industry or economic conditions or competition; (vi) changes in any applicable law, rule, regulation, policy, guideline or practice governing or affecting financial holding companies and their subsidiaries or with respect to tax or accounting principles or otherwise; (vii) adverse changes or conditions in capital and financial markets; (viii) changes in interest rates; (ix) higher than expected costs or other difficulties related to integration of combined or merged businesses; (x) the effects of business combinations and other acquisition transactions, including the inability to realize our loan and investment portfolios; (xi) changes in the quality or composition of our loan and investment portfolios; (xii) adequacy of loan loss reserves; (xiii) increased competition; (xiv) loss of certain key officers; (xv) deposit attrition; (xvi) rapidly changing technology; (xvii) unanticipated regulatory or judicial proceedings and liabilities and other costs; (xviii) changes in the cost of funds, demand for loan products or demand for financial services; and (xix) other economic, competitive, governmental or technological factors affecting our operations, markets, products, services and prices. Such developments could have an adverse impact on CNB's financial position and results of operations. For more information about factors that could cause actual results to differ from those discussed in the forward-looking statements, please refer to the “Risk Factors” and “Management’s Discussion and Analysis of Financial Condition and Results of Operations” sections of and the forward-looking statement disclaimers in CNB’s annual and quarterly reports. The forward-looking statements are based upon management’s beliefs and assumptions and are made as of the date of this presentation. CNB undertakes no obligation to publicly update or revise any forward-looking statements included in this presentation or to update the reasons why actual results could differ from those contained in such statements, whether as a result of new information, future events or otherwise, except to the extent required by law. In light of these risks, uncertainties and assumptions, the forward-looking events discussed in this presentation might not occur and you should not put undue reliance on any forward-looking statements. NON-GAAP FINANCIAL MEASURES This presentation contains references to financial measures that are not defined in GAAP. Management uses non-GAAP financial information in its analysis of the Corporation’s performance. Management believes that these non-GAAP measures provide a greater understanding of ongoing operations, enhance comparability of results of operations with prior periods and show the effects of significant gains and charges in the periods presented. The Corporation’s management believes that investors may use these non-GAAP measures to analyze the Corporation’s financial performance without the impact of unusual items or events that may obscure trends in the Corporation’s underlying performance. This non-GAAP data should be considered in addition to results prepared in accordance with GAAP, and is not a substitute for, or superior to, GAAP results. Limitations associated with non-GAAP financial measures include the risks that persons might disagree as to the appropriateness of items included in these measures and that different companies might calculate these measures differently. Non-GAAP measures reflected within the presentation include evaluations on the impact of merger costs, branch closure costs and FHLB prepayment penalties on various metrics of the Corporation’s financial performance, including calculations related to: (1) Return on average assets and return on average tangible common equity, (2) Efficiency ratio, and (3) Pre-tax pre-provision income. 2
2021 ANNUAL SHAREHOLDER MEETING

VISION 4

STRATEGIC INITIATIVES § CNB strives to be a financially independent company. Through these key principles, we believe we will remain financially viable and relevant: § Be the source of exceptional experiences for our customers, employees and communities; § Foster an environment of leadership in our Company, communities and industry; § Embrace adaptable technology to provide more services that are easy to use while continuing to enhance access security; § Position for long-term organic growth while remaining opportunistic to strategic merger/acquisition possibilities. 5

2020 AT A GLANCE § During 2020, the onset of the novel coronavirus, or COVID-19, pandemic had a significant, negative impact on economic activity across our regions: § CNB took a proactive approach in assisting our customers and communities: § Participated in delivering 2,044, or $231 million, in Paycheck Protection Program (“PPP”) Loans, helping over 30,000 jobs in our communities; § In 2021, CNB also participated in PPP with an additional 1,100 loans, or $116 million to local businesses; § Provided loan payment assistance to borrowers affected by the COVID-19 pandemic on 1,463 loans or $626 million. § In the 3rd quarter of 2020 we completed the acquisition of Bank of Akron, further strengthening one of our most successful bank franchises - BankOnBuffalo: § Loans totaling approximately $319 million; § Deposits totaling approximately $419 million; § Addition of an experienced management team who will work side by side with our existing team in capitalizing on a strong growth opportunity in our BankOnBuffalo region. 6

LOOKING INTO 2021 § We continue to expand our ERIEBANK franchise into northeast Ohio, with two full-service SMART Center locations anticipated in 2021 and 2022. § FCBank continues to position itself as a premier community bank in Central Ohio. We are expanding our presence in the Columbus area through the addition of a SMART Financial Center in Westerville, OH. § Under our BankOnBuffalo brand, we joined the Northland Workforce Training initiative in Buffalo, NY to not only provide much needed banking products and services to local residents, but also to enhance employment opportunities for the “under-employed” through training programs that will position participants to obtain desirable, higher paying jobs. § With over $1 billion in assets under management, our Wealth and Asset business provides competitive solutions to our customers while diversifying our revenue sources: § New underwriting and documentation platform to enhance customer service; § New asset management platform to provide more solutions and ease of client use. § In 2020 and 2021, we are investing in excess of $10 million in various technology initiatives, such as business online banking, which will propel us forward at a faster pace, in our goal of providing our customers with excellence and speed in their experience with us. 7
ENVIRONMENTAL, SOCIAL AND GOVERNANCE
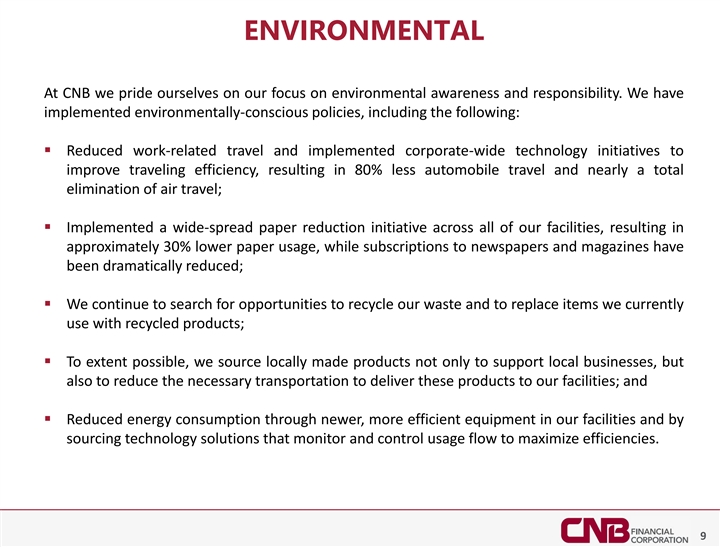
ENVIRONMENTAL At CNB we pride ourselves on our focus on environmental awareness and responsibility. We have implemented environmentally-conscious policies, including the following: § Reduced work-related travel and implemented corporate-wide technology initiatives to improve traveling efficiency, resulting in 80% less automobile travel and nearly a total elimination of air travel; § Implemented a wide-spread paper reduction initiative across all of our facilities, resulting in approximately 30% lower paper usage, while subscriptions to newspapers and magazines have been dramatically reduced; § We continue to search for opportunities to recycle our waste and to replace items we currently use with recycled products; § To extent possible, we source locally made products not only to support local businesses, but also to reduce the necessary transportation to deliver these products to our facilities; and § Reduced energy consumption through newer, more efficient equipment in our facilities and by sourcing technology solutions that monitor and control usage flow to maximize efficiencies. 9

SOCIAL Our Human Capital management objective is to attract, develop and promote a deep and diverse bench of talent. To that end, we’ve taken the following actions, among others: § Implemented Employee Experience programs designed to develop talent to prepare our employees for critical roles and leadership responsibilities; § Increased focus on fostering and promoting a culture of diversity and inclusion: § Enhanced our talent recruiting approach to include representation across the communities in which we live and operate. § During 2020, our employees donated approximately 3,800 hours of their personal time in support of 310 organizations across our region; and § CNB has an established history of being a positive force in the communities it serves. We continue to promote economic development through investments in community-strengthening initiatives such as affordable housing – at the end of 2020, CNB had approximately $5.4 million in investments in affordable housing, with an additional commitment of $3.6 million. 10

GOVERNANCE § It is the goal of CNB’s Corporate Governance and Nominating Committee of the Board to achieve diversity of geography, thought and background amongst our Board of Directors, Advisory Board Members, Management and our entire staff: § We rely on our Advisory Boards’ local knowledge and expertise as key components of our growth strategy. § On March 1, 2021, we welcomed Mr. Michael Obi to CNB Bank’s Board of Directors; § Experienced, entrepreneur in Cleveland, one of our fastest growth regions; § Extensive background in the financial services industry as well as various other ventures. § The Board of Directors continuously evaluates their skill sets and breadth of experience with a focus on maintaining strength in their governance of CNB. § The Board of Directors and Management are committed to continuing our shareholder outreach approach to gain a greater understanding of our shareholders’ investment objectives. 11

FINANCIAL HIGHLIGHTS

FINANCIAL TRENDS TOTAL ASSETS ($M) TOTAL GROSS LOANS ($M) $5,000 $5,000 $4,729 $4,000 $4,000 $3,764 $3,000 $3,372 $3,222 $3,000 $2,769 $2,804 $2,574 $2,475 $2,000 $2,000 $2,146 $1,874 $1,000 $1,000 $0 $0 2016Y 2017Y 2018Y 2019Y 2020Y 2016Y 2017Y 2018Y 2019Y 2020Y TOTAL DEPOSITS ($M) $5,000 $4,000 $4,182 $3,000 $3,102 $2,611 $2,000 $2,168 $2,018 $1,000 $0 2016Y 2017Y 2018Y 2019Y 2020Y 13

EARNINGS POWER (1) RETURN ON AVERAGE ASSETS RECENT EFFICIENCY INITIATIVES 1.40% § Achieved expected cost reductions associated with 1.18% 1.12% 1.20% Bank of Akron acquisition 0.99% 0.95% 1.00% 0.89% § Prepaid CNB’s entire FHLB borrowings totaling 0.80% approximately $190 million 0.60% 0.40% § Raised $57.8 million in Preferred Equity in support 0.20% of long-term growth objectives 0.00% 2016 2017 2018 2019 2020 § Consolidated 3 existing branches in support of efficiency initiatives RETURN ON AVERAGE (1) (1) TANGIBLE COMMON EQUITY EFFICIENCY RATIO 18.00% 100.0% 16.27% 16.28% 14.10% 15.00% 80.0% 12.81% 11.97% 61.7% 61.4% 60.7% 12.00% 60.1% 57.4% 60.0% 9.00% 40.0% 6.00% 20.0% 3.00% 0.00% 0.0% 2016 2017 2018 2019 2020 2016 2017 2018 2019 2020 14 (1) Return on average assets, return on tangible common equity and efficiency ratio are a non-GAAP financial measure; see appendix for reconciliation.

NET INTEREST MARGIN AND PRE-TAX PRE-PROVISION (2) NET INTEREST MARGIN PRE-TAX PRE-PROVISION ($000) (1) Net interest margin and pre-tax pre-provision are non-GAAP financial measures; see appendix for reconciliation. 15 (2) Excludes applicable merger and acquisition, FHLB prepayment and branch closure costs.

CAPITAL RATIOS CNB FINANCIAL CORPORATION – CAPITAL RATIOS (1) 16

DIVIDEND HISTORY HISTORICAL DIVIDEND PER COMMON SHARE 17
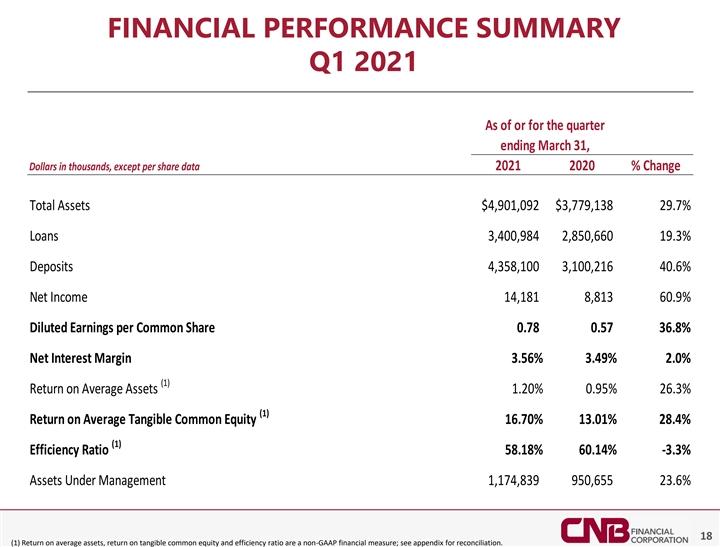
FINANCIAL PERFORMANCE SUMMARY Q1 2021 As of or for the quarter ending March 31, Dollars in thousands, except per share data 2021 2020 % Change Total Assets $4,901,092 $3,779,138 29.7% Loans 3 ,400,984 2,850,660 19.3% Deposits 4 ,358,100 3,100,216 40.6% Net Income 14,181 8,813 60.9% Diluted Earnings per Common Share 0.78 0.57 36.8% Net Interest Margin 3.56% 3.49% 2.0% (1) Return on Average Assets 1.20% 0.95% 26.3% (1) Return on Average Tangible Common Equity 16.70% 13.01% 28.4% (1) Efficiency Ratio 58.18% 60.14% -3.3% Assets Under Management 1,174,839 950,655 23.6% 18 (1) Return on average assets, return on tangible common equity and efficiency ratio are a non-GAAP financial measure; see appendix for reconciliation.

THANK YOU FOR ATTENDING OUR 2021 ANNUAL SHAREHOLDER MEETING. 19 (1) Return on average assets, Tangible common equity and Efficiency ratio are a non-GAAP financial measure; see appendix for reconciliation

APPENDIX

NON-GAAP RECONCILIATION As of or for the year ending December 31, Year-to-Date Dollars in thousands, except per share data 2016 2017 2018 2019 2020 3/31/2020 3/31/2021 Net Income $20,540 $23,860 $33,719 $40,081 $32,743 $8,813 $14,181 ADD: Merger Costs, Core Conversion, Prepayment Penalties and Branch Closure C osts (n 2e ,3 t 9 o5 f tax ) - - 134 10,168 57 - Net Income + Merger, Core, Prepayment and Branch Costs $22,935 $23,860 $33,719 $40,215 $42,911 $8,870 $14,181 A Average Assets $2,420,240 $2,677,531 $3,008,302 $3,413,737 $4,347,142 $3,746,718 $4,781,217 B Return on Average Assets 0.95% 0.89% 1.12% 1.18% 0.99% 0.95% 1.20% (A / B) As of or for the year ending December 31, Year-to-Date Dollars in thousands, except per share data 2016 2017 2018 2019 2020 3/31/2020 3/31/2021 Average Common Equity $212,058 $239,223 $250,496 $285,324 $337,963 $313,127 $362,664 LESS: Average Intangibles 34,072 40,941 39,877 39,145 41,821 38,861 44,306 Average Tangible common equity (non-GAAP) $177,986 $198,282 $210,619 $246,179 $296,142 $274,266 $318,358 A Net Income Available to Common 20,411 23,725 33,569 39,934 31,596 8,813 13,106 ADD: Merger Costs, Core Conversion, Prepayment Penalties and Branch Closure Costs (net of tax) 2,395 - - 134 10,168 57 - Net Income + Merger, Core, Prepayment and Branch Costs $22,806 $23,725 $33,569 $40,068 $41,764 $8,870 $13,106 B Return on Average Tangible Common Equity 12.81% 11.97% 16.27% 16.28% 14.10% 13.01% 16.70% (B / A) 21

NON-GAAP RECONCILIATION As of or for the year ending December 31, Year-to-Date Dollars in thousands, except per share data 2016 2017 2018 2019 2020 3/31/2020 3/31/2021 Non-Interest Expense $67,118 $70,037 $79,342 $87,508 $107,326 $21,742 $27,804 LESS: Core Deposit Intangible Amortization 1,125 1,229 898 567 206 83 28 LESS: Merger Costs, Core Conversion, Prepayment Penalties and Branch Closure Costs 3,685 - - - 12,642 72 - Adjusted Non-Interest Expense $62,308 $68,808 $78,444 $86,941 $94,478 $21,587 $27,776 A Non-Interest Income 17,691 21,435 20,723 25,975 28,059 5,364 8,239 B Net Interest Income 81,287 91,509 104,920 116,198 134,711 29,994 39,121 LESS: Tax Exempt Investment and Loan Income, net of TEFRA (non-GAAP) 5,894 6,063 6,572 6,664 5,703 1,536 1,304 ADD: Tax Exempt Investment and Loan Income (non-GAAP) (tax-equivalent) 9,380 7,930 8,759 8,945 7,490 2,070 1,689 Adjusted Net Interest Income (non-GAAP) 84,773 93,376 107,107 118,479 136,498 30,528 39,506 C Adjusted Net Revenue (non-GAAP) (tax-equivalent) 102,464 114,811 127,830 144,454 164,557 35,892 47,745 D (B + C) Adjusted Efficiency Ratio, net of Merger Costs, Conversion Costs, Prepayment Penalties and Branch Closure Costs 60.81% 59.93% 61.37% 60.19% 57.41% 60.14% 58.18% E (A / D) As of or for the quarter ending, Dollars in thousands, except per share data 12/31/2019 3/31/2020 6/30/2020 9/30/2020 12/31/2020 3/31/2021 Interest Income (fully tax equivalent basis) (non-GAAP) $40,970 $40,425 $38,435 $42,692 $46,977 $44,619 LESS: Interest Expense (fully tax equivalent basis) (non-GAAP) 1 0,863 10,096 8,135 7,692 6,533 5,174 Net Interest Income (fully tax equivalent basis) (non-GAAP) 30,107 30,329 30,300 35,000 4 0,444 3 9,445 A Average Total Earning Assets $3,390,416 $3,505,061 $3,903,207 $4,441,326 $4,508,257 $4,509,662 LESS: Average Mark to Market Adjustment on Investments 12,116 1 2,206 21,665 21,859 19,765 1 7,310 Adjusted Total Earning Assets 3,378,300 3,492,855 3 ,881,542 4,419,467 4,488,492 4 ,492,352 B Net Interest Margin, fully tax equivalent basis (non-GAAP) (annualized) 3.54% 3.49% 3.14% 3.15% 3.58% 3.56% A / B 22

NON-GAAP RECONCILIATION As of or for the year ending December 31, Dollars in thousands, except per share data 2019 2020 Total stockholder's equity (GAAP) $304,966 $416,137 LESS: preferred equity - 57,785 LESS: goodwill and other intangible assets 38,890 44,316 Tangible common equity (non-GAAP) $266,076 $314,036 A Total assets (GAAP) $3,763,659 $4,729,399 B LESS: goodwill and other intangible assets 38,890 44,316 C Tangible assets (Non-GAAP) $3,724,769 $4,685,083 D (B - C) LESS: PPP-related Loans, net of Deferred PPP Processing Fees - 155,529 E LESS: Excess liquidity at the Federal Reserve 145,375 482,503 F Adjusted Tangible assets (Non-GAAP) 3,579,394 4 ,047,051 G (D - E - F) Tangible common equity to tangible assets (GAAP) 7.14% 6.70% H (A / D) Adjusted Tangible common equity to tangible assets (GAAP) 7.43% 7.76% I (A / G) 23
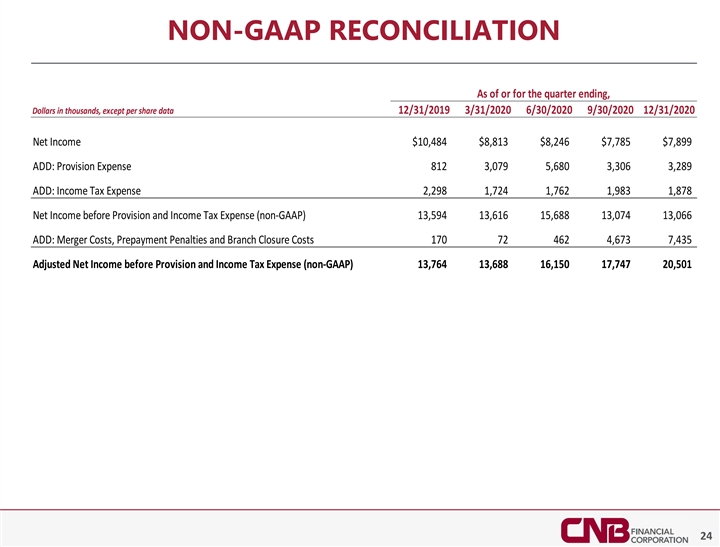
NON-GAAP RECONCILIATION As of or for the quarter ending, Dollars in thousands, except per share data 12/31/2019 3/31/2020 6/30/2020 9/30/2020 12/31/2020 Net Income $10,484 $8,813 $8,246 $7,785 $7,899 ADD: Provision Expense 812 3 ,079 5,680 3 ,306 3,289 ADD: Income Tax Expense 2 ,298 1,724 1 ,762 1,983 1 ,878 Net Income before Provision and Income Tax Expense (non-GAAP) 1 3,594 13,616 15,688 13,074 13,066 ADD: Merger Costs, Prepayment Penalties and Branch Closure Costs 170 72 462 4,673 7 ,435 Adjusted Net Income before Provision and Income Tax Expense (non-GAAP) 13,764 13,688 16,150 17,747 20,501 24