Attached files
| file | filename |
|---|---|
| EX-99.2 - EX-99.2 - INTERNATIONAL BUSINESS MACHINES CORP | ibm-20210419xex99d2.htm |
| EX-99.1 - EX-99.1 - INTERNATIONAL BUSINESS MACHINES CORP | ibm-20210419xex99d1.htm |
| 8-K - 8-K - INTERNATIONAL BUSINESS MACHINES CORP | ibm-20210419x8k.htm |
Exhibit 99.3
| IBM 1Q 2021 Earnings April 19, 2021 ibm.com/investor |
| Forward Looking Statements and Non-GAAP Information Certain comments made in this presentation may be In an effort to provide additional and useful information regarding characterized as forward looking under the Private Securities the company’s financial results and other financial information as Litigation Reform Act of 1995. Forward-looking statements aredetermined by generally accepted accounting principles (GAAP), the based on the company’s current assumptions regarding future company also discusses, in its earnings press release and earnings business and financial performance. Those statements by their presentation materials, certain non-GAAP information including year nature address matters that are uncertain to different degrees.to year change in revenue for Red Hat and Cloud & Data Platforms Those statements involve a number of factors that could causenormalized for historical comparability, revenue adjusting for actual results to differ materially. Additional information divested businesses and currency, operating earnings, other concerning these factors is contained in the Company’s filings “operating” financial measures, including free cash flow, adjusted with the SEC. Copies are available from the SEC, from the IBMfree cash flow, net cash from operating activities excluding Global website, or from IBM Investor Relations. Any forward-looking Financing receivables, and adjustments for currency. The rationale statement made during this presentation speaks only as of the for management’s use of this non-GAAP information is included as date on which it is made. The company assumes no obligation to Exhibit 99.2 to the company’s Form 8-K submitted to the SEC on update or revise any forward-looking statements except asApril 19, 2021. The reconciliation of non-GAAP information to GAAP required by law; these charts and the associated remarks andis included on the slides entitled “Non-GAAP Supplemental comments are integrally related, and are intended to be Materials” in this presentation, as well as in Exhibit 99.1 to the presented and understood together. company’s Form 8-K submitted to the SEC on April 19, 2021. For other related information please visit the Company’s investor relations website at: https://www.ibm.com/investor/events/earnings-1q21 2 |
| Arvind Krishna Chairman and Chief Executive Officer James Kavanaugh Senior Vice President and Chief Financial Officer 3 |

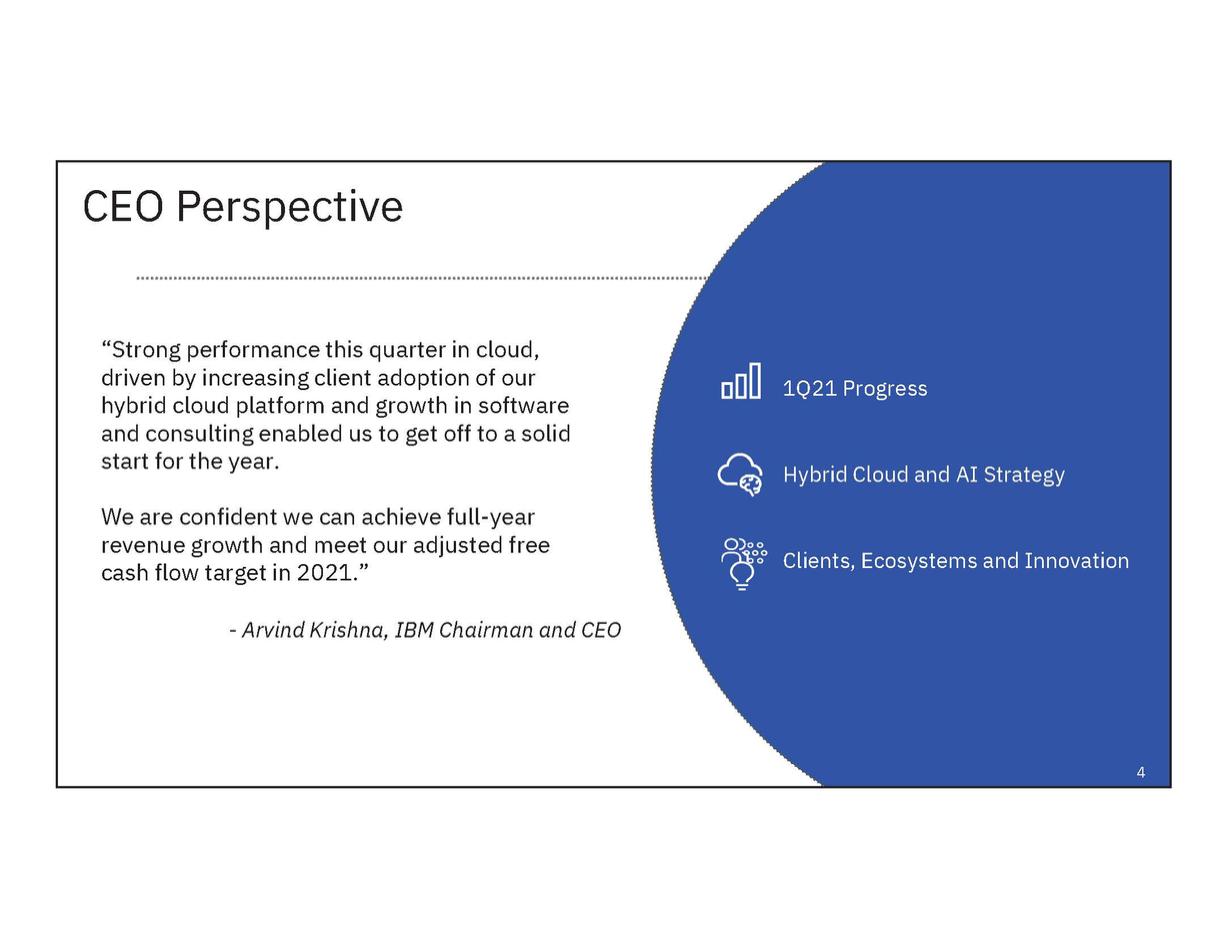
| hybrid cloud platform and growth in software Clients, Ecosystems and Innovation cash flow target in 2021.” CEO Perspective “Strong performance this quarter in cloud, driven by increasing client adoption of our 1Q21 Progress and consulting enabled us to get off to a solid start for the year.Hybrid Cloud and AI Strategy We are confident we can achieve full-year revenue growth and meet our adjusted free - Arvind Krishna, IBM Chairman and CEO 4 |
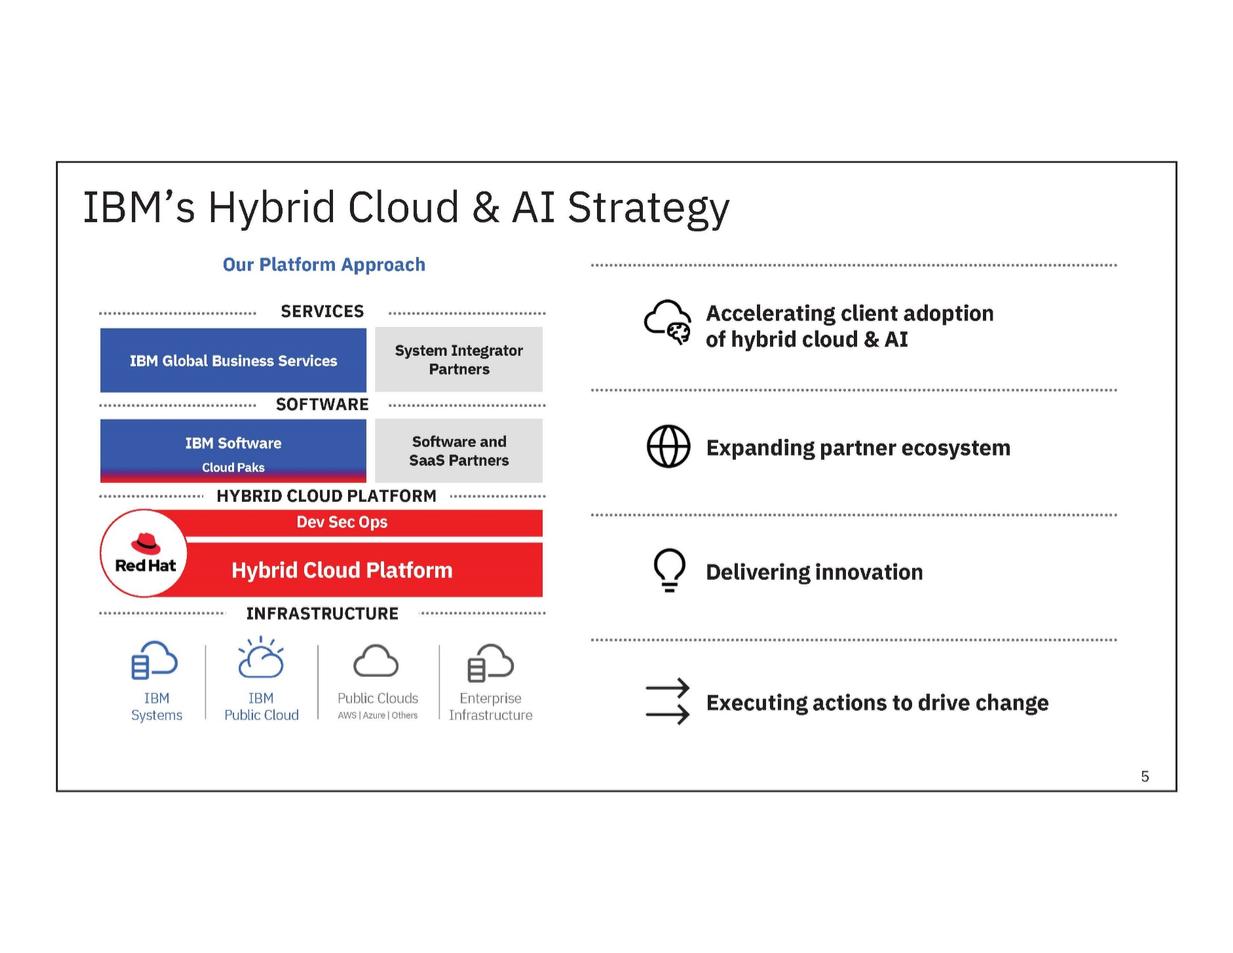
| Cloud Paks Systems Public Cloud Infrastructure AWS | Azure | Others IBM’s Hybrid Cloud & AI Strategy Our Platform Approach SERVICES Accelerating client adoption of hybrid cloud & AI Partners SOFTWARE IBM Software Expanding partner ecosystem HYBRID CLOUD PLATFORM Delivering innovation INFRASTRUCTURE IBM IBM Public CloudsEnterprise Executing actions to drive change 5 Hybrid Cloud Platform Dev Sec Ops Software and SaaS Partners System Integrator IBM Global Business Services |
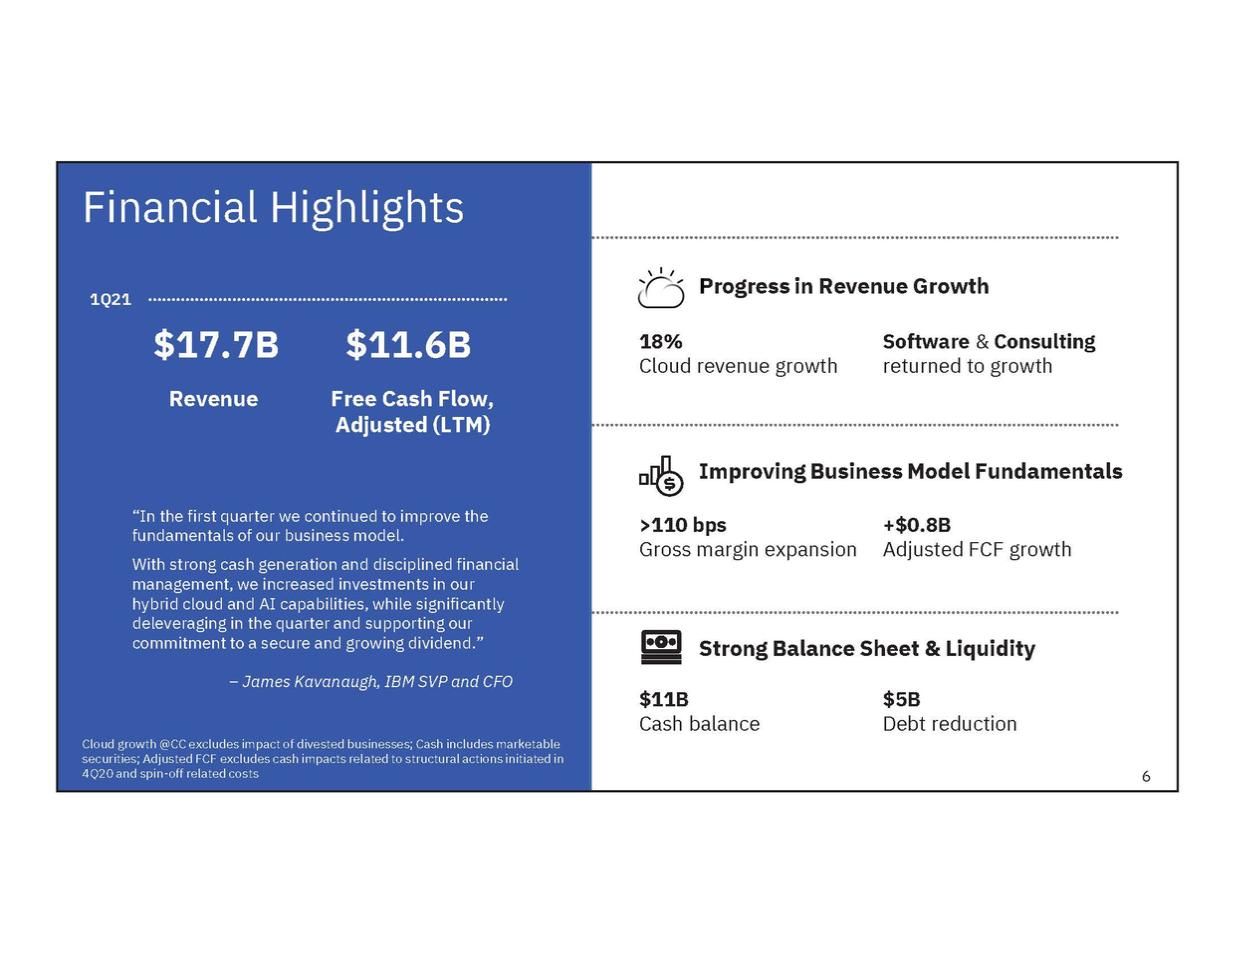
| Cloud revenue growth returned to growth Fundamentals Financial Highlights 1Q21 $17.7B $11.6B RevenueFree Cash Flow, Adjusted (LTM) “In the first quarter we continued to improve the fundamentals of our business model. With strong cash generation and disciplined financial management, we increased investments in our hybrid cloud and AI capabilities, while significantly deleveraging in the quarter and supporting our commitment to a secure and growing dividend.” – James Kavanaugh, IBM SVP and CFO Cloud growth @CC excludes impact of divested businesses; Cash includes marketable securities; Adjusted FCF excludes cash impacts related to structural actions initiated in 4Q20 and spin-off related costs 6 Progress in Revenue Growth 18% Software & Consulting Improving Business Model >110 bps+$0.8B Gross margin expansionAdjusted FCF growth Strong Balance Sheet & Liquidity $11B $5B Cash balance Debt reduction |
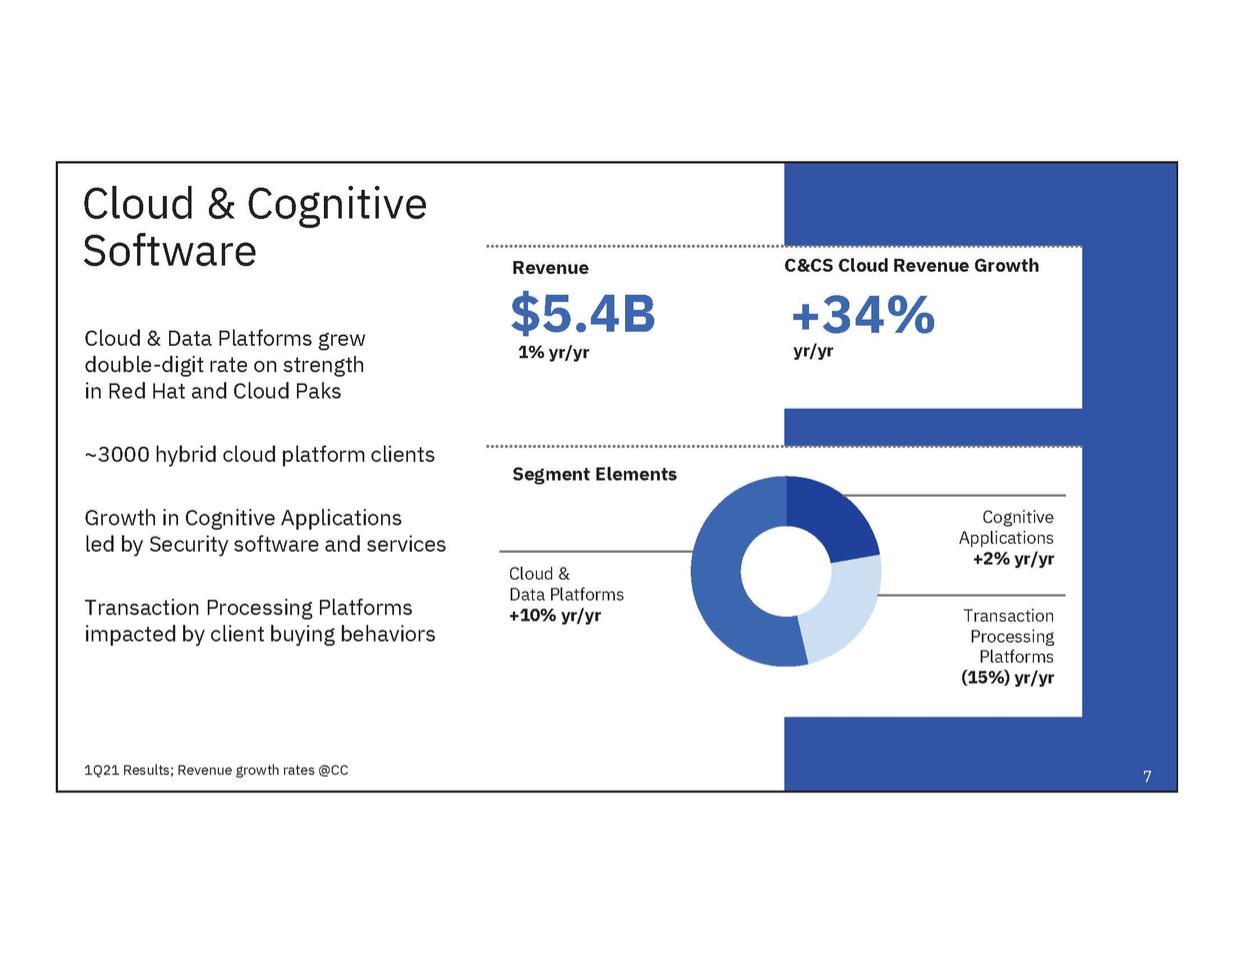
| Cloud & Data Platforms grew yr/yr 1% yr/yr Segment Elements +2% yr/yr Transaction Processing Platforms +10% yr/yr Transaction Cloud & Cognitive Software RevenueC&CS Cloud Revenue Growth $5.4B +34% double-digit rate on strength in Red Hat and Cloud Paks ~3000 hybrid cloud platform clients Growth in Cognitive Applications Cognitive led by Security software and servicesApplications Cloud & Data Platforms impacted by client buying behaviors Processing Platforms (15%) yr/yr 1Q21 Results; Revenue growth rates @CC7 |
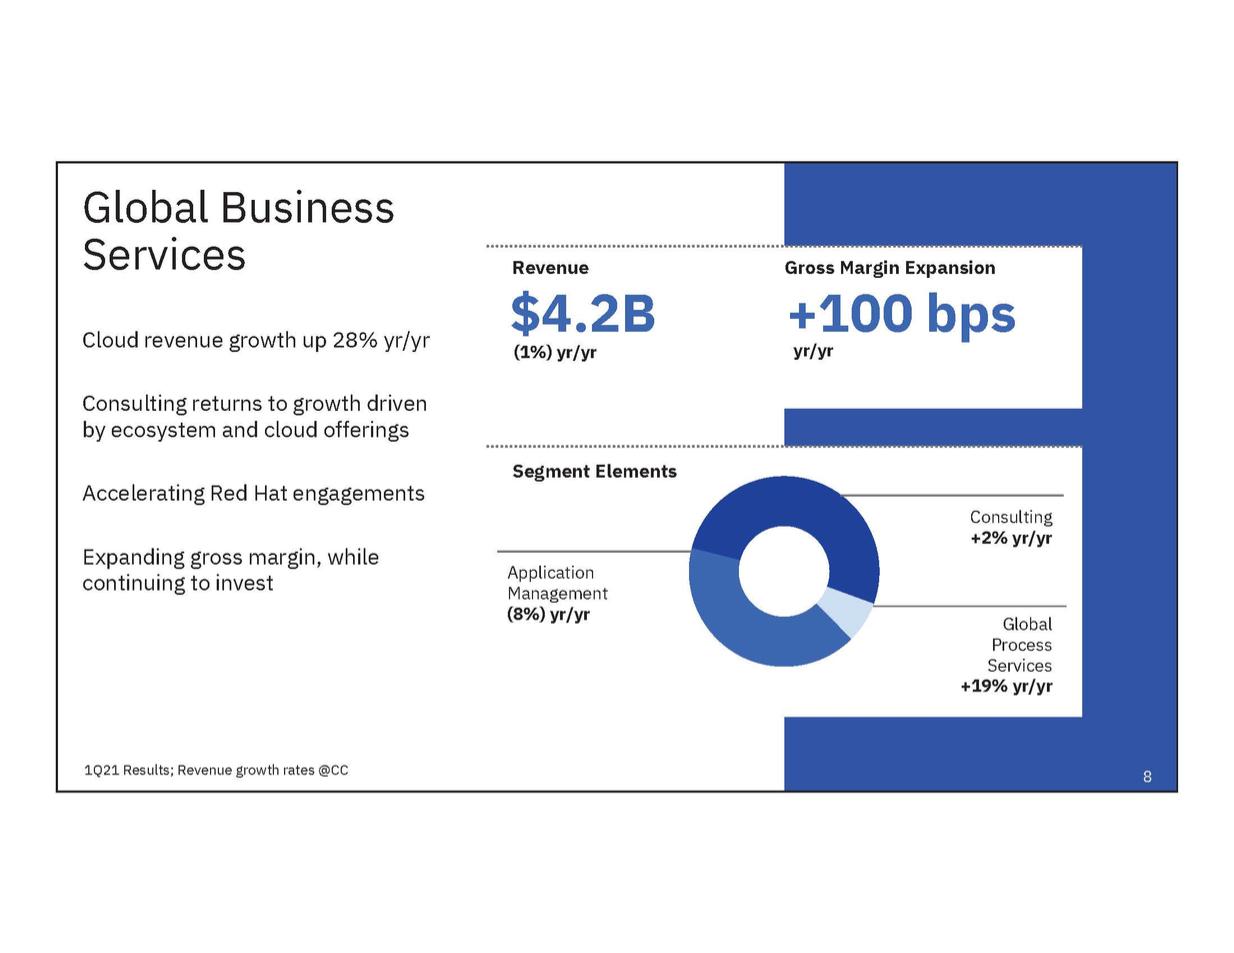
| Cloud revenue growth up 28% yr/yr yr/yr (1%) yr/yr Expanding gross margin, while Management Global Business ServicesRevenueGross Margin Expansion $4.2B +100 bps Consulting returns to growth driven by ecosystem and cloud offerings Segment Elements Accelerating Red Hat engagements Consulting +2% yr/yr continuing to invest Application (8%) yr/yr Global Process Services +19% yr/yr 1Q21 Results; Revenue growth rates @CC8 |
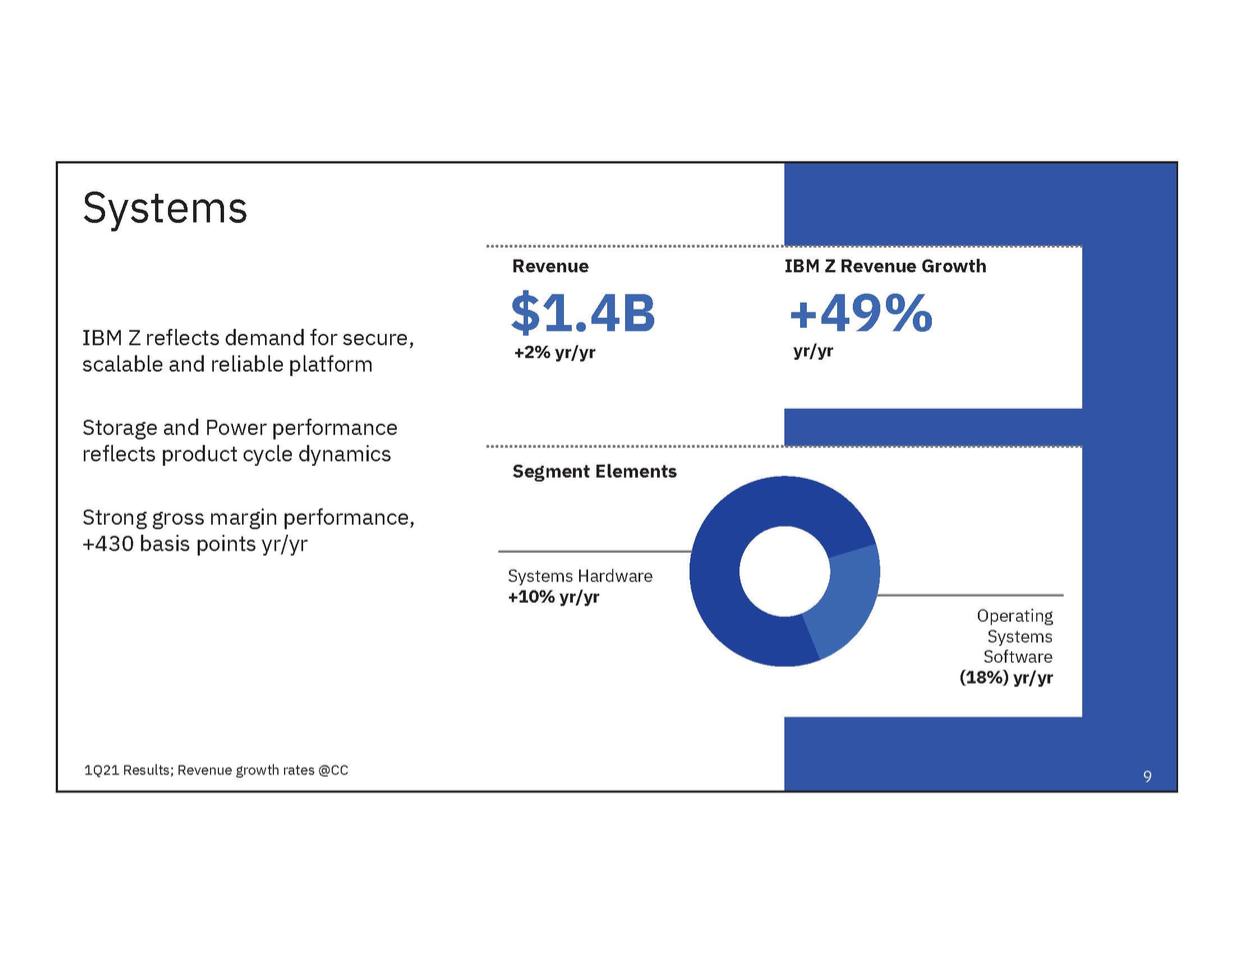
| IBM Z reflects demand for secure, Segment Elements Systems RevenueIBM Z Revenue Growth $1.4B +49% scalable and reliable platform +2% yr/yr yr/yr Storage and Power performance reflects product cycle dynamics Strong gross margin performance, +430 basis points yr/yr Systems Hardware +10% yr/yr Operating Systems Software (18%) yr/yr 1Q21 Results; Revenue growth rates @CC9 |
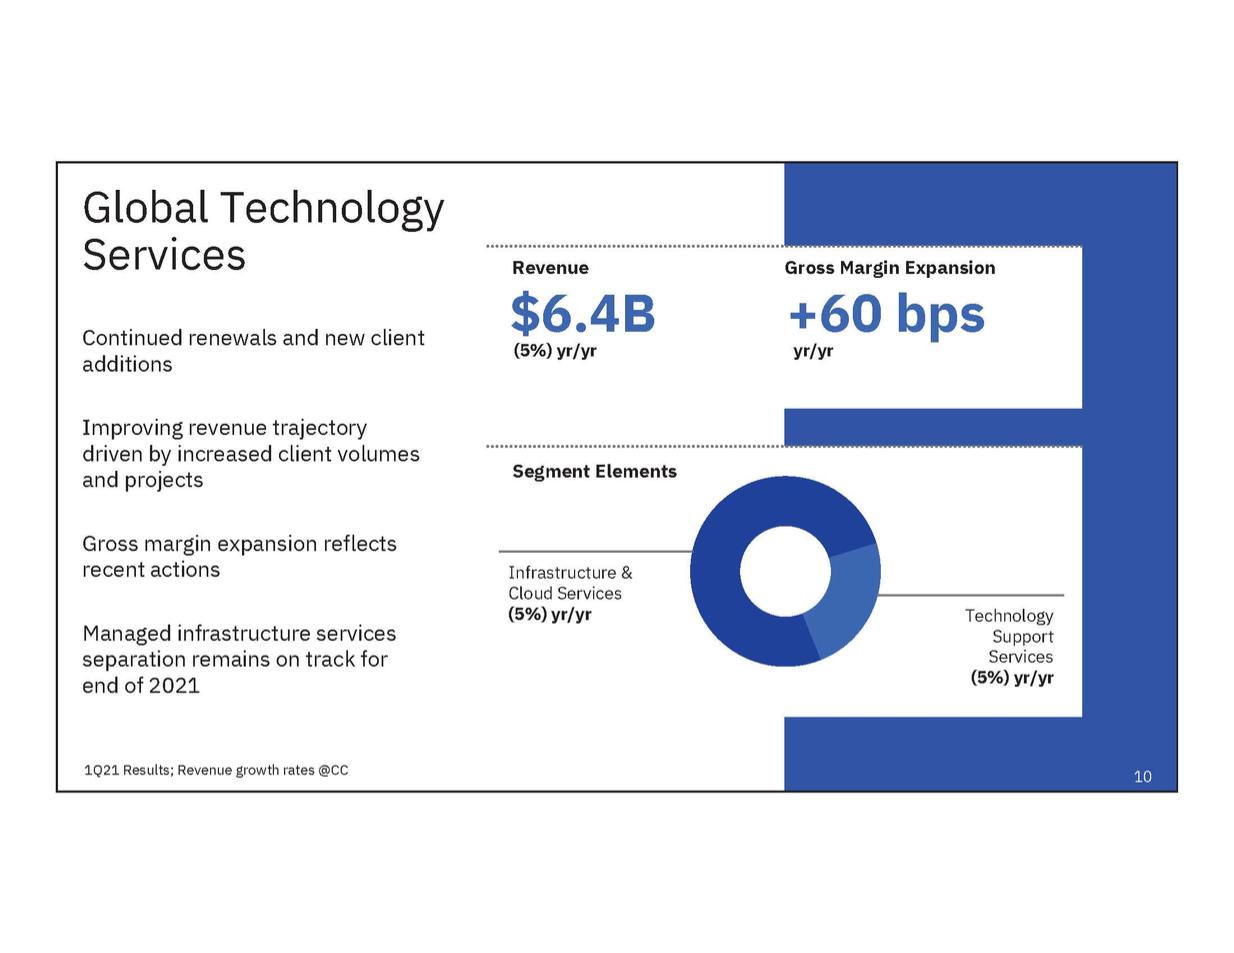
| Continued renewals and new client (5%) yr/yr yr/yr Segment Elements and projects Managed infrastructure services Support (5%) yr/yr end of 2021 Global Technology ServicesRevenueGross Margin Expansion $6.4B +60 bps additions Improving revenue trajectory driven by increased client volumes Gross margin expansion reflects recent actions Infrastructure & Cloud Services (5%) yr/yr Technology separation remains on track for Services 1Q21 Results; Revenue growth rates @CC10 |
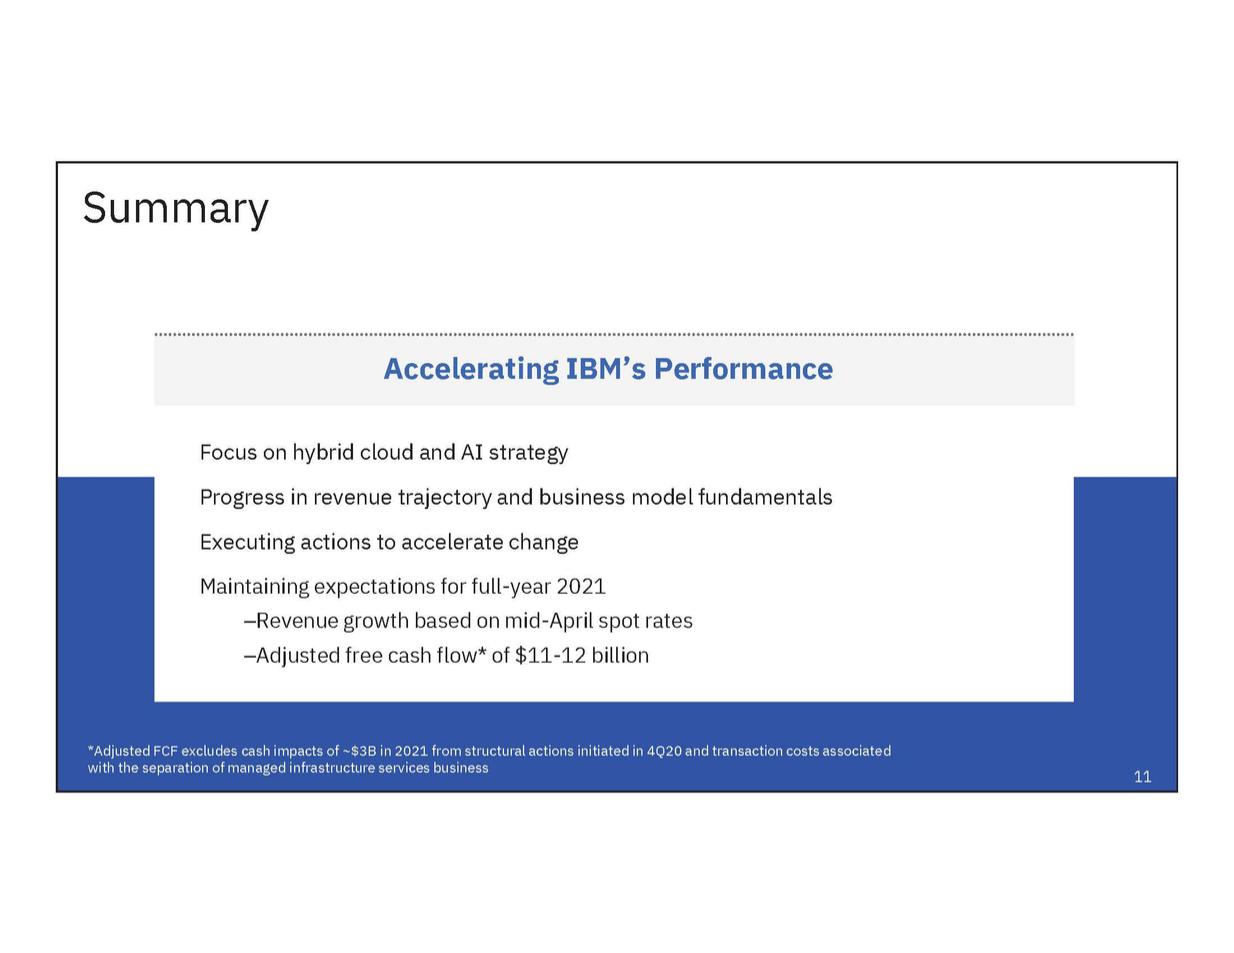
| Summary Focus on hybrid cloud and AI strategy Progress in revenue trajectory and business model fundamentals Executing actions to accelerate change Maintaining expectations for full-year 2021 –Revenue growth based on mid-April spot rates –Adjusted free cash flow* of $11-12 billion *Adjusted FCF excludes cash impacts of ~$3B in 2021 from structural actions initiated in 4Q20 and transaction costs associated with the separation of managed infrastructure services business 11 Accelerating IBM’s Performance |
| ibm.com/investor |

| Supplemental Materials ● Revenue and P&L Highlights ● Cash Flow and Balance Sheet Highlights ● Currency – Impact on Revenue Growth ● Services Segments Details ● Software and Systems Segment Details ● Expense Summary ● Balance Sheet Summary ● Cash Flow Summary ● Cash Flow (ASC 230) ● Non-GAAP Supplemental Materials Some columns and rows in these materials, including the supplemental exhibits, may not add due to rounding Supplemental Materials 13 |
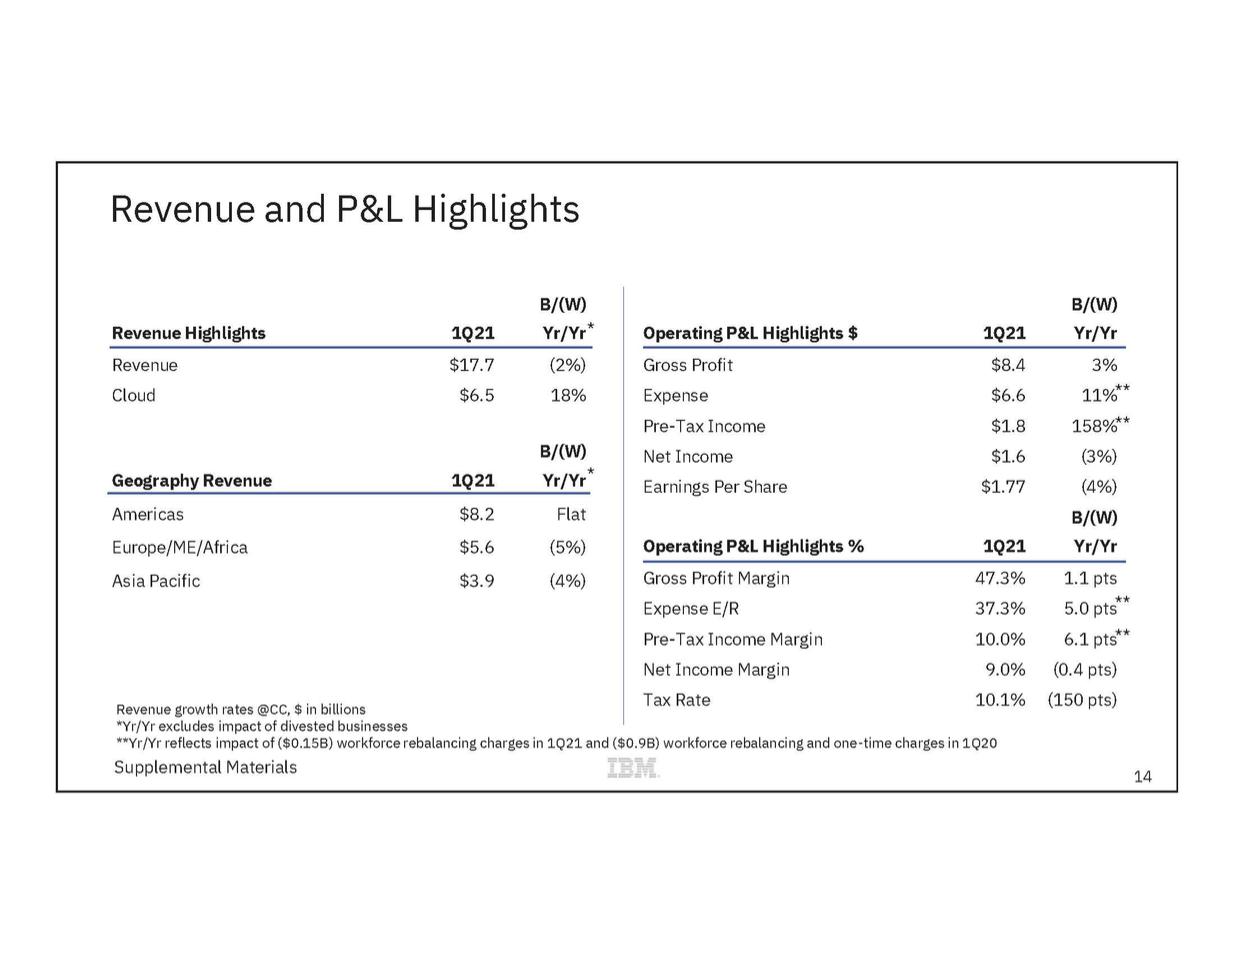
| Revenue and P&L Highlights B/(W) B/(W) Revenue Highlights1Q21 Yr/Yr*Operating P&L Highlights $ 1Q21 Yr/Yr Revenue$17.7 (2%) Gross Profit $8.4 3% Cloud $6.5 18% Expense$6.6 11%** Pre-Tax Income$1.8 158%** B/(W)Net Income$1.6 (3%) Geography Revenue1Q21 Yr/Yr* Earnings Per Share$1.77 (4%) Americas $8.2 FlatB/(W) Europe/ME/Africa$5.6 (5%) Operating P&L Highlights % 1Q21 Yr/Yr Asia Pacific $3.9 (4%) Gross Profit Margin47.3% 1.1 pts Expense E/R37.3% 5.0 pts** Pre-Tax Income Margin10.0% 6.1 pts** Net Income Margin9.0% (0.4 pts) Revenue growth rates @CC, $ in billions Tax Rate10.1% (150 pts) *Yr/Yr excludes impact of divested businesses **Yr/Yr reflects impact of ($0.15B) workforce rebalancing charges in 1Q21 and ($0.9B) workforce rebalancing and one-time charges in 1Q20 Supplemental Materials 14 |
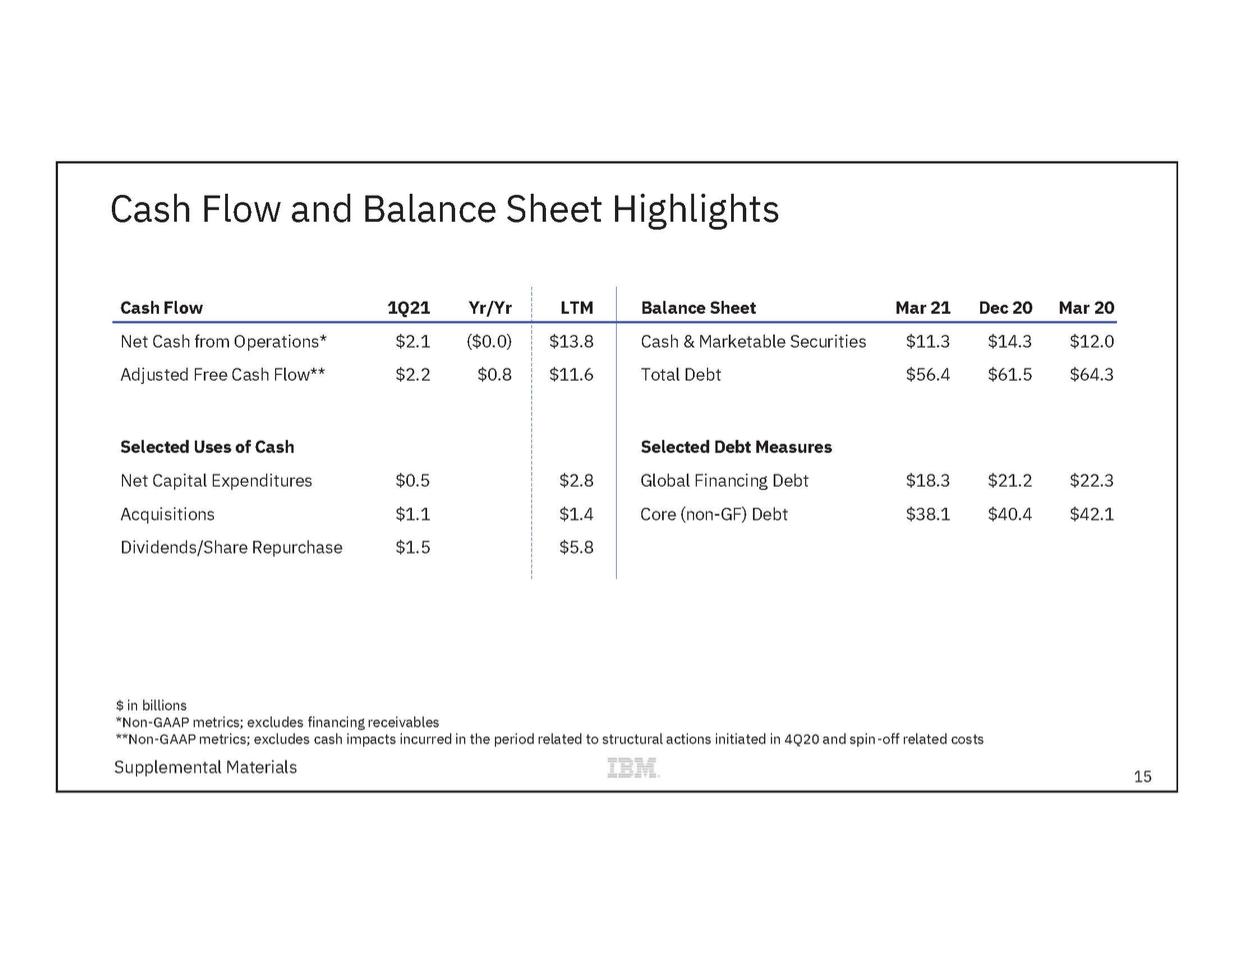
| Cash Flow and Balance Sheet Highlights $ in billions *Non-GAAP metrics; excludes financing receivables **Non-GAAP metrics; excludes cash impacts incurred in the period related to structural actions initiated in 4Q20 and spin-off related costs Supplemental Materials 15 Cash Flow 1Q21 Yr/Yr LTM Balance SheetMar 21 Dec 20 Mar 20 Net Cash from Operations* $2.1 ($0.0) Adjusted Free Cash Flow** $2.2 $0.8 Selected Uses of Cash Net Capital Expenditures $0.5 Acquisitions $1.1 Dividends/Share Repurchase$1.5 $13.8 $11.6 $2.8 $1.4 $5.8 Cash & Marketable Securities $11.3 $14.3 $12.0 Total Debt $56.4 $61.5 $64.3 Selected Debt Measures Global Financing Debt $18.3 $21.2 $22.3 Core (non-GF) Debt $38.1 $40.4 $42.1 |
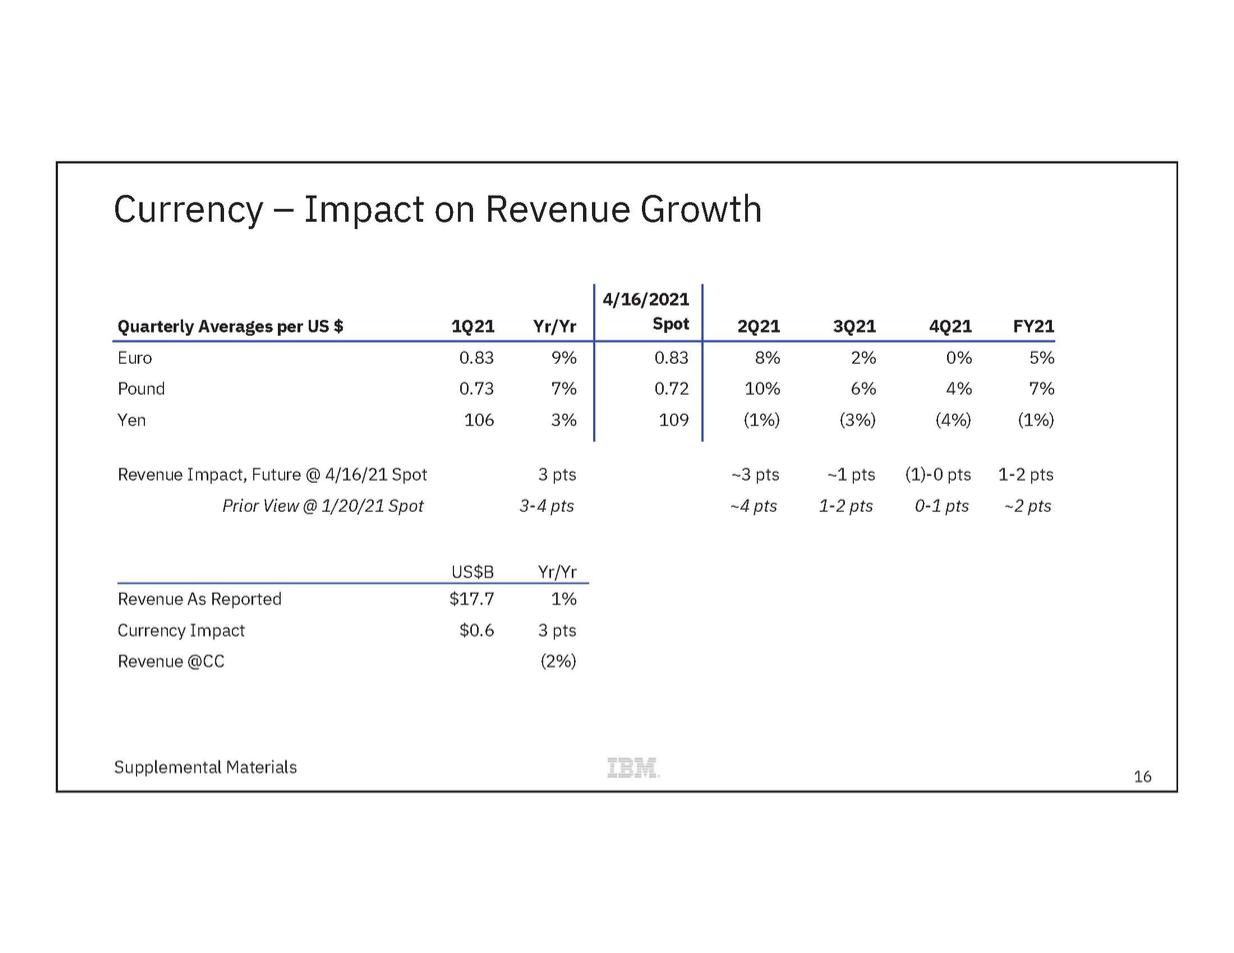
| Currency – Impact on Revenue Growth Revenue Impact, Future @ 4/16/21 Spot3 pts ~3 pts ~1 pts (1)-0 pts 1-2 pts Prior View @ 1/20/21 Spot3-4 pts ~4 pts 1-2 pts 0-1 pts ~2 pts US$B Yr/Yr Revenue As Reported $17.7 1% Currency Impact $0.6 3 pts Revenue @CC(2%) Supplemental Materials 16 Quarterly Averages per US $ 1Q21 Yr/Yr 4/16/2021 Spot 2Q21 3Q21 4Q21 FY21 Euro 0.83 9% Pound 0.73 7% Yen 106 3% 0.83 0.72 109 8% 2% 0% 5% 10% 6% 4% 7% (1%) (3%) (4%) (1%) |
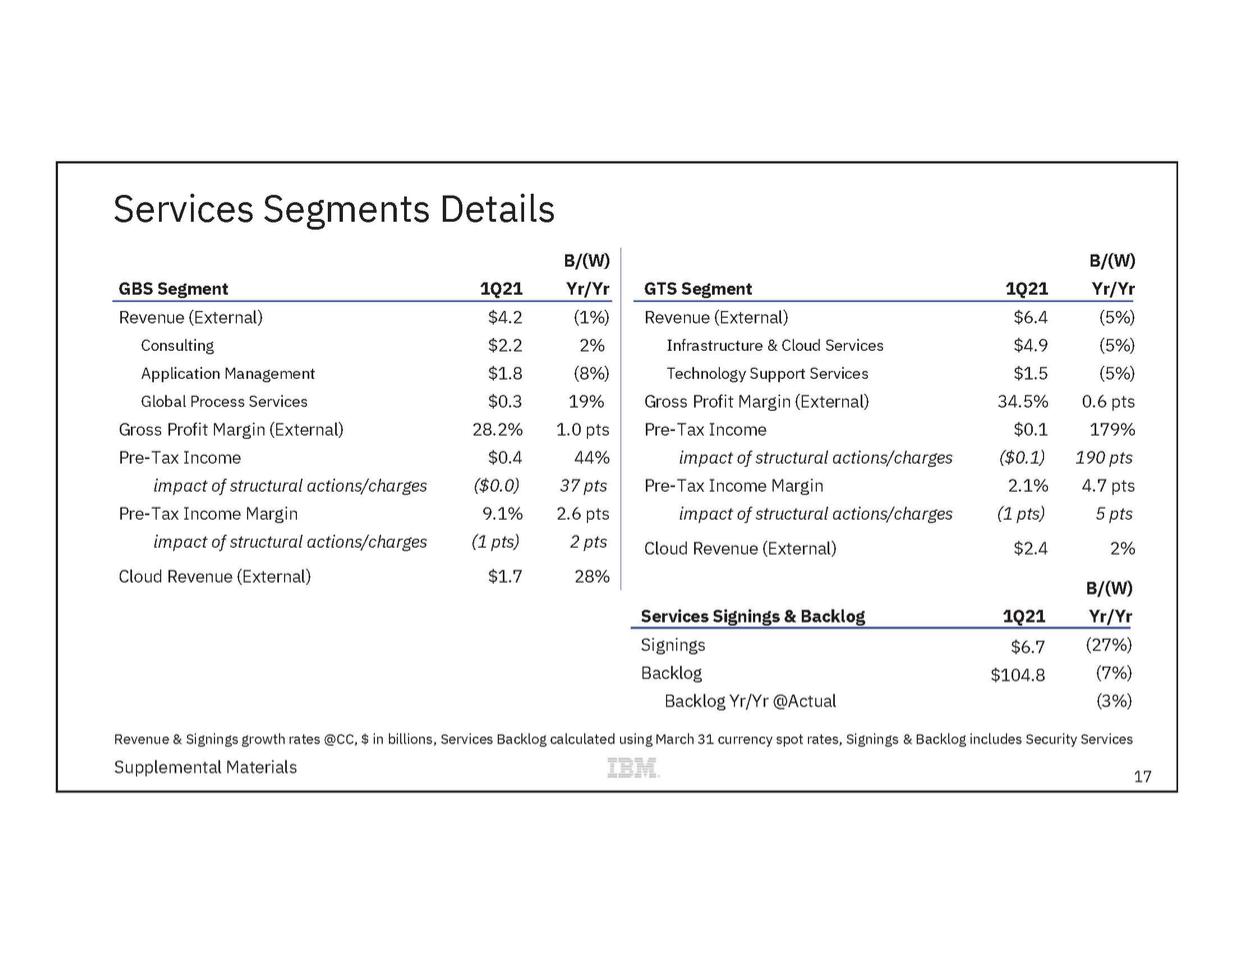
| B/(W) Services Segments Details B/(W) B/(W) GBS Segment 1Q21 Yr/YrGTS Segment 1Q21 Yr/Yr Revenue (External) $4.2 (1%) Revenue (External) $6.4 (5%) Consulting $2.2 2% Infrastructure & Cloud Services$4.9 (5%) Application Management$1.8 (8%) Technology Support Services$1.5 (5%) Global Process Services$0.3 19% Gross Profit Margin (External) 34.5% 0.6 pts Gross Profit Margin (External) 28.2% 1.0 pts Pre-Tax Income$0.1 179% Pre-Tax Income$0.4 44% impact of structural actions/charges($0.1) 190 pts impact of structural actions/charges($0.0) 37 pts Pre-Tax Income Margin2.1% 4.7 pts Pre-Tax Income Margin9.1% 2.6 pts impact of structural actions/charges(1 pts) 5 pts impact of structural actions/charges(1 pts) 2 pts Cloud Revenue (External) $2.4 2% Cloud Revenue (External) $1.7 28% Services Signings & Backlog 1Q21 Yr/Yr Signings $6.7 (27%) Backlog $104.8 (7%) Backlog Yr/Yr @Actual(3%) Revenue & Signings growth rates @CC, $ in billions, Services Backlog calculated using March 31 currency spot rates, Signings & Backlog includes Security Services Supplemental Materials 17 |
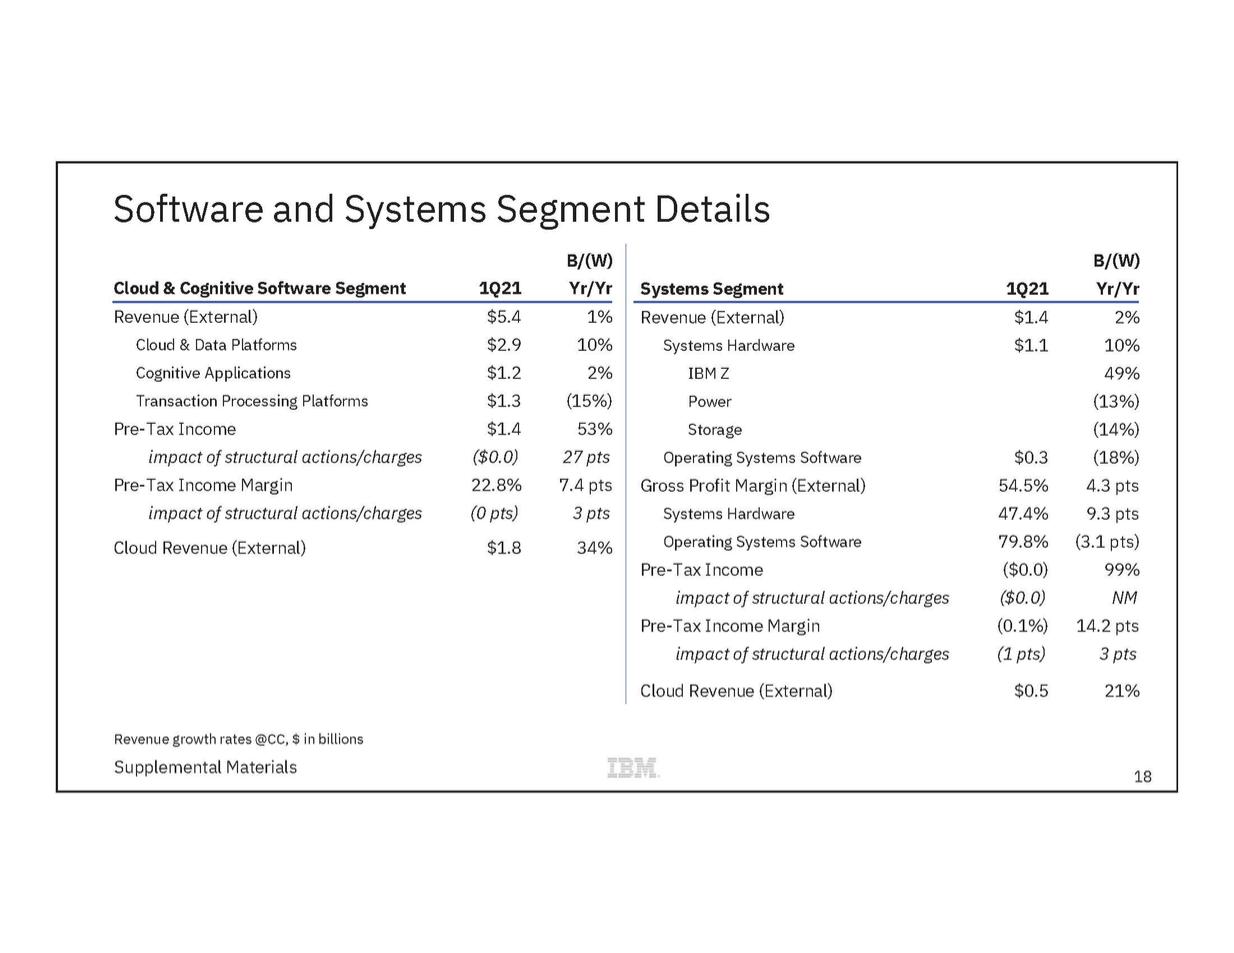
| Software and Systems Segment Details B/(W) B/(W) Cloud & Cognitive Software Segment1Q21 Yr/Yr Systems Segment1Q21 Yr/Yr Revenue (External) $5.4 1% Revenue (External) $1.4 2% Cloud & Data Platforms $2.9 10% Systems Hardware $1.1 10% Cognitive Applications $1.2 2% IBM Z49% Transaction Processing Platforms $1.3 (15%) Power (13%) Pre-Tax Income$1.4 53% Storage(14%) impact of structural actions/charges ($0.0) 27 pts Operating Systems Software $0.3 (18%) Pre-Tax Income Margin22.8% 7.4 pts Gross Profit Margin (External) 54.5% 4.3 pts impact of structural actions/charges(0 pts) 3 pts Systems Hardware 47.4% 9.3 pts Cloud Revenue (External) $1.8 34% Operating Systems Software 79.8% (3.1 pts) Pre-Tax Income ($0.0) 99% impact of structural actions/charges ($0.0) NM Pre-Tax Income Margin(0.1%) 14.2 pts impact of structural actions/charges(1 pts) 3 pts Cloud Revenue (External)$0.521% Revenue growth rates @CC, $ in billions Supplemental Materials 18 |
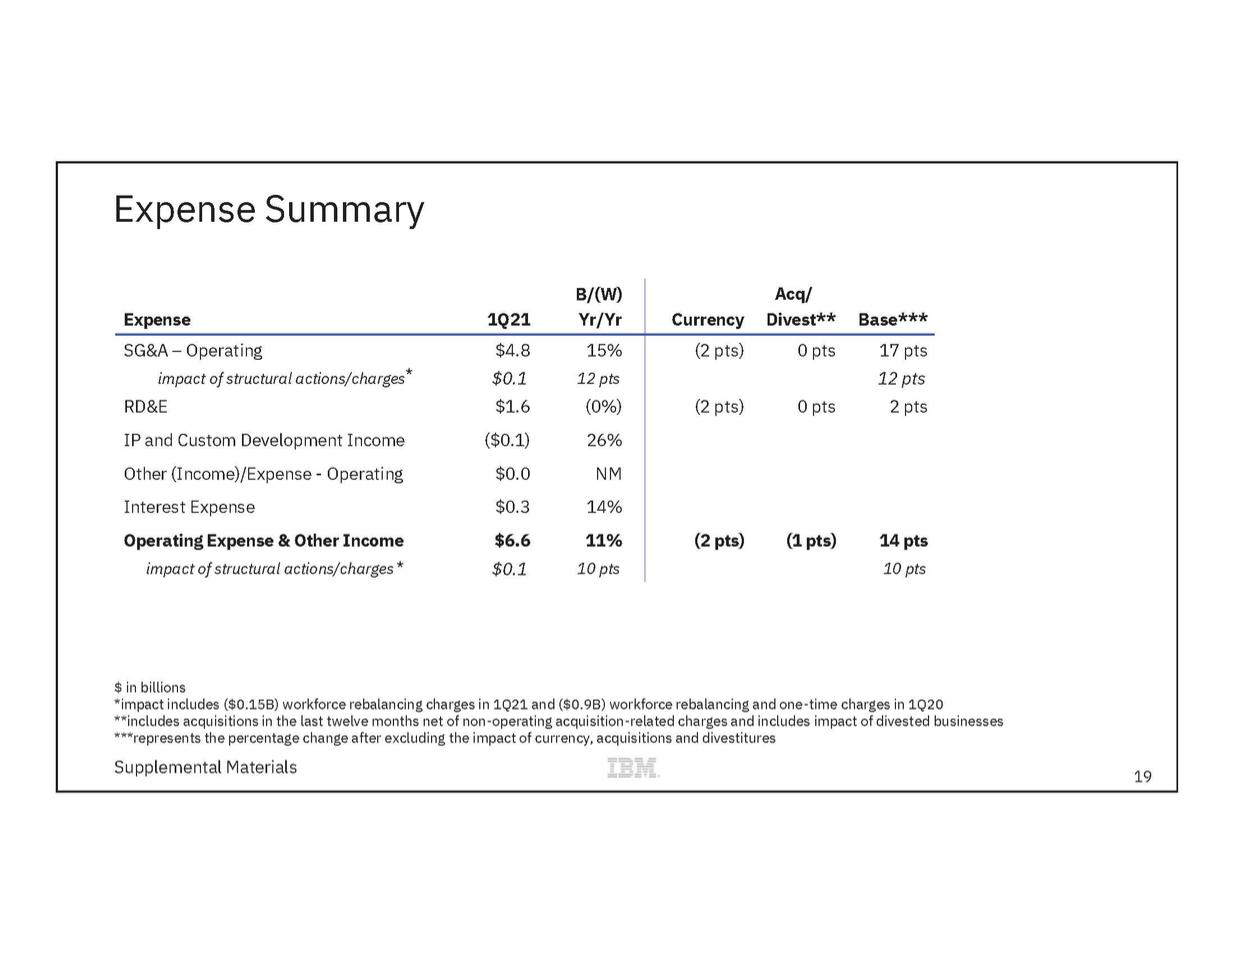
| Expense Summary $ in billions *impact includes ($0.15B) workforce rebalancing charges in 1Q21 and ($0.9B) workforce rebalancing and one-time charges in 1Q20 **includes acquisitions in the last twelve months net of non-operating acquisition-related charges and includes impact of divested businesses ***represents the percentage change after excluding the impact of currency, acquisitions and divestitures Supplemental Materials 19 B/(W) Expense1Q21 Yr/Yr Acq/ CurrencyDivest**Base*** SG&A – Operating$4.8 15% impact of structural actions/charges*$0.1 12 pts RD&E$1.6 (0%) IP and Custom Development Income ($0.1) 26% Other (Income)/Expense - Operating $0.0 NM Interest Expense $0.3 14% Operating Expense & Other Income $6.6 11% impact of structural actions/charges * $0.1 10 pts (2 pts)0 pts17 pts 12 pts (2 pts)0 pts 2 pts (2 pts)(1 pts)14 pts 10 pts |
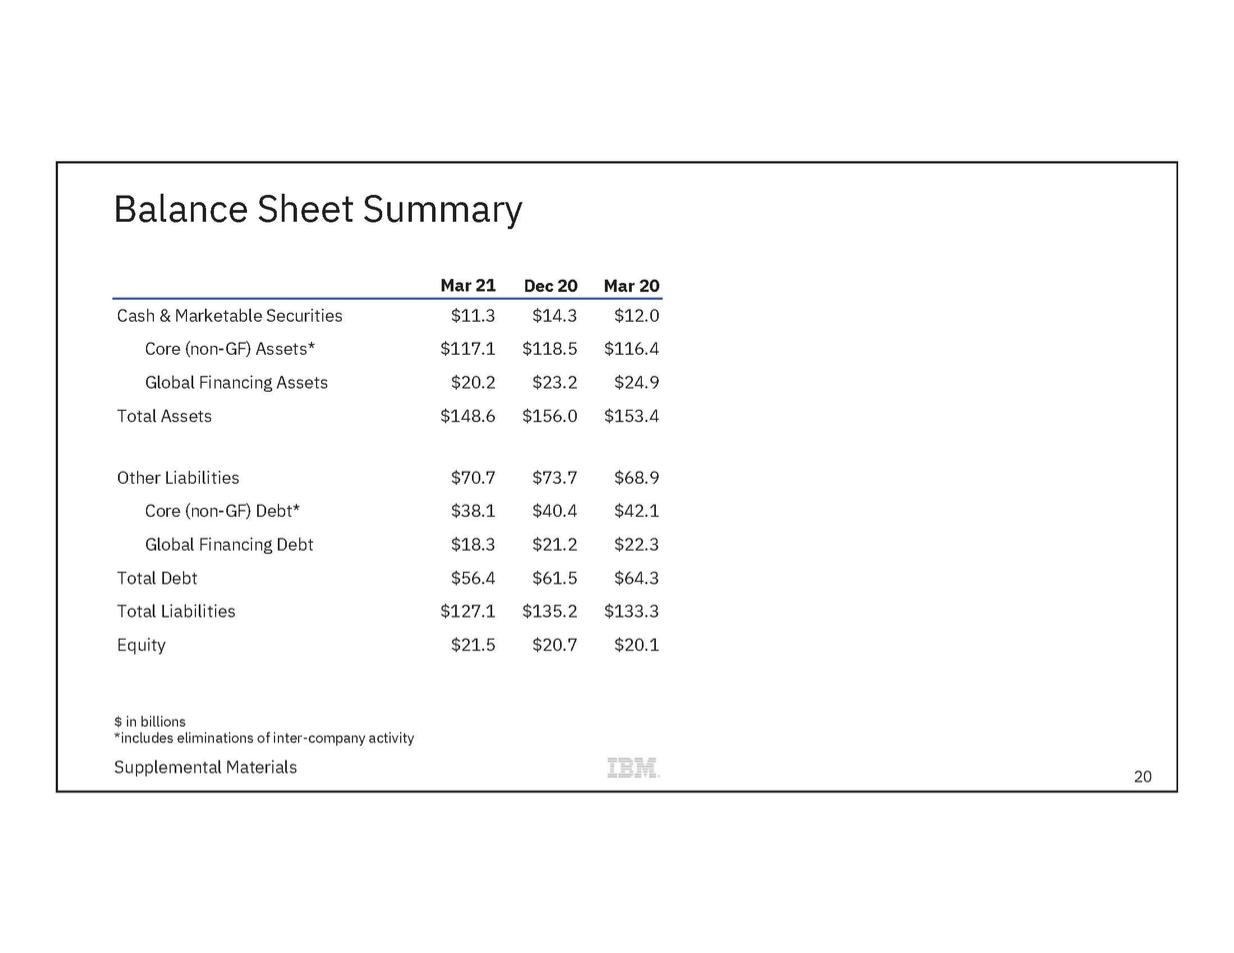
| Balance Sheet Summary Mar 21 Dec 20 Mar 20 Cash & Marketable Securities $11.3 $14.3 $12.0 Core (non-GF) Assets* $117.1 $118.5 $116.4 Global Financing Assets$20.2 $23.2 $24.9 Total Assets$148.6 $156.0 $153.4 Other Liabilities $70.7 $73.7 $68.9 Core (non-GF) Debt* $38.1 $40.4 $42.1 Global Financing Debt $18.3 $21.2 $22.3 Total Debt $56.4 $61.5 $64.3 Total Liabilities $127.1 $135.2 $133.3 Equity $21.5 $20.7 $20.1 $ in billions *includes eliminations of inter-company activity Supplemental Materials 20 |
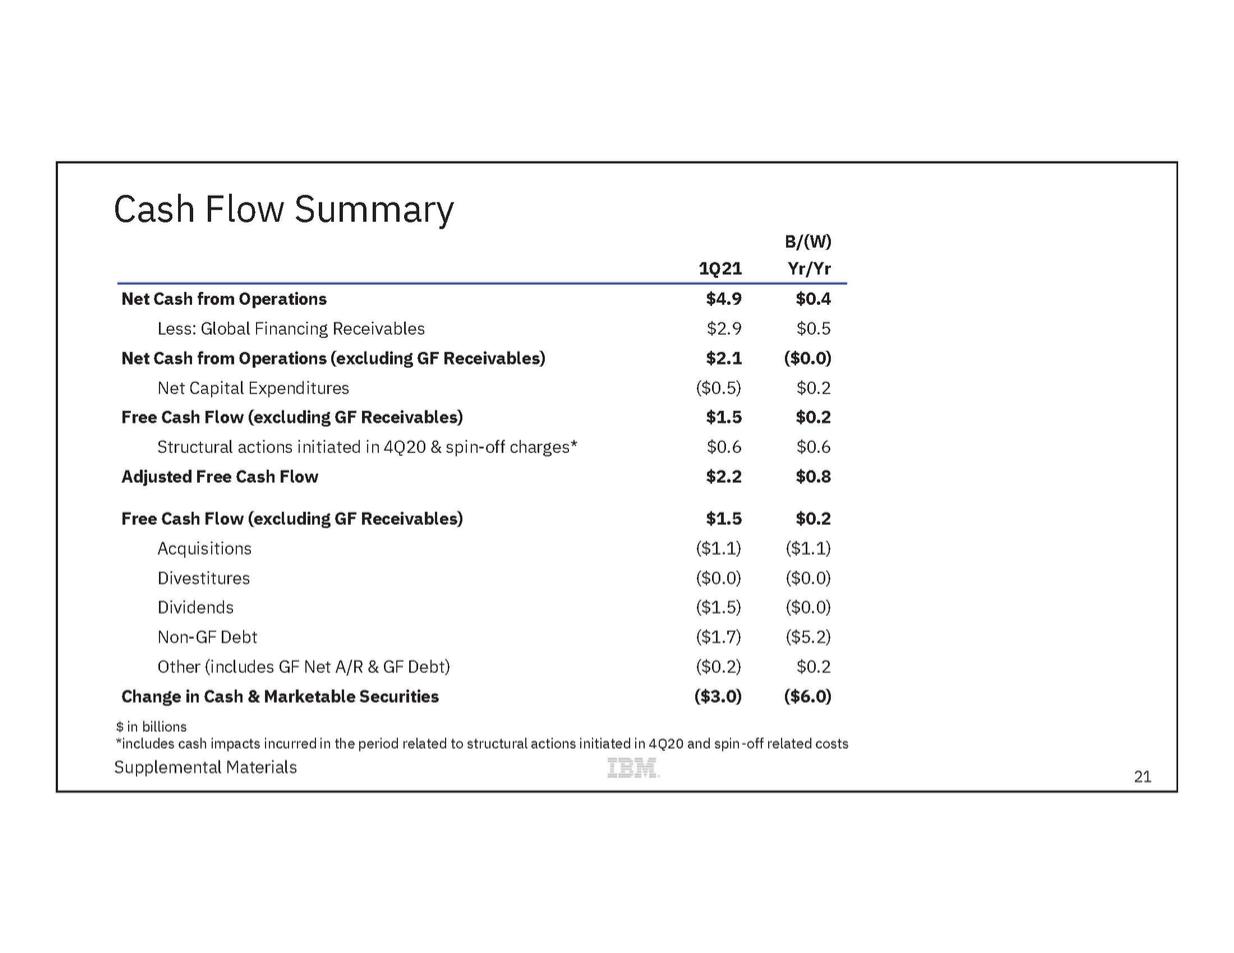
| Cash Flow Summary B/(W) 1Q21 Yr/Yr Net Cash from Operations$4.9 $0.4 Less: Global Financing Receivables $2.9 $0.5 Net Cash from Operations (excluding GF Receivables)$2.1 ($0.0) Net Capital Expenditures ($0.5) $0.2 Free Cash Flow (excluding GF Receivables)$1.5 $0.2 Structural actions initiated in 4Q20 & spin-off charges* $0.6 $0.6 Adjusted Free Cash Flow $2.2 $0.8 Free Cash Flow (excluding GF Receivables)$1.5 $0.2 Acquisitions ($1.1) ($1.1) Divestitures ($0.0) ($0.0) Dividends ($1.5) ($0.0) Non-GF Debt ($1.7) ($5.2) Other (includes GF Net A/R & GF Debt) ($0.2) $0.2 Change in Cash & Marketable Securities($3.0) ($6.0) $ in billions *includes cash impacts incurred in the period related to structural actions initiated in 4Q20 and spin-off related costs Supplemental Materials 21 |
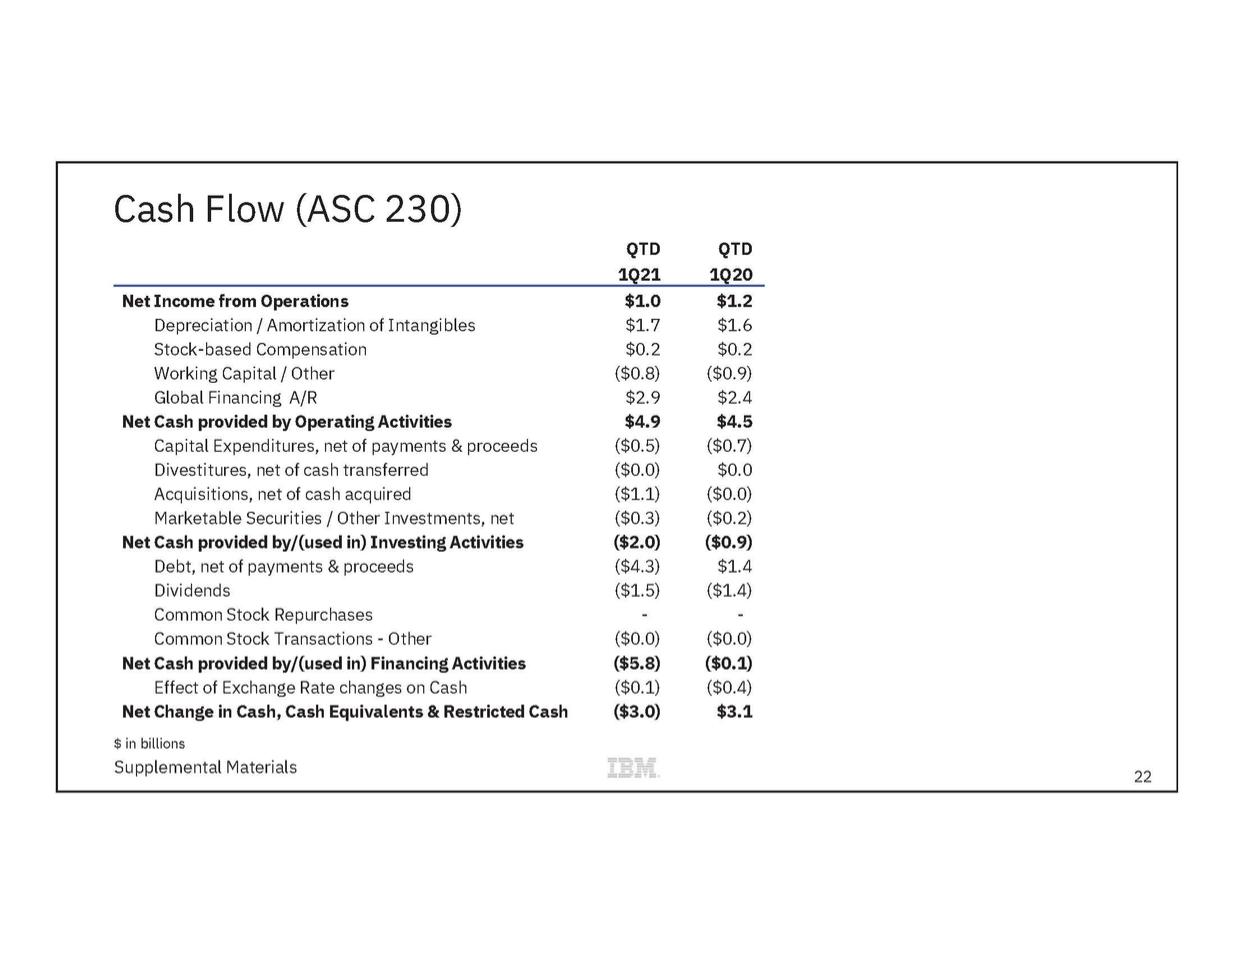
| Cash Flow (ASC 230) QTDQTD 1Q21 1Q20 Net Income from Operations$1.0 $1.2 Depreciation / Amortization of Intangibles$1.7 $1.6 Stock-based Compensation$0.2 $0.2 Working Capital / Other ($0.8) ($0.9) Global Financing A/R$2.9 $2.4 Net Cash provided by Operating Activities$4.9 $4.5 Capital Expenditures, net of payments & proceeds ($0.5) ($0.7) Divestitures, net of cash transferred ($0.0) $0.0 Acquisitions, net of cash acquired ($1.1) ($0.0) Marketable Securities / Other Investments, net ($0.3) ($0.2) Net Cash provided by/(used in) Investing Activities($2.0) ($0.9) Debt, net of payments & proceeds ($4.3) $1.4 Dividends ($1.5) ($1.4) Common Stock Repurchases-- Common Stock Transactions - Other ($0.0) ($0.0) Net Cash provided by/(used in) Financing Activities($5.8) ($0.1) Effect of Exchange Rate changes on Cash($0.1) ($0.4) Net Change in Cash, Cash Equivalents & Restricted Cash($3.0) $3.1 $ in billions Supplemental Materials 22 |
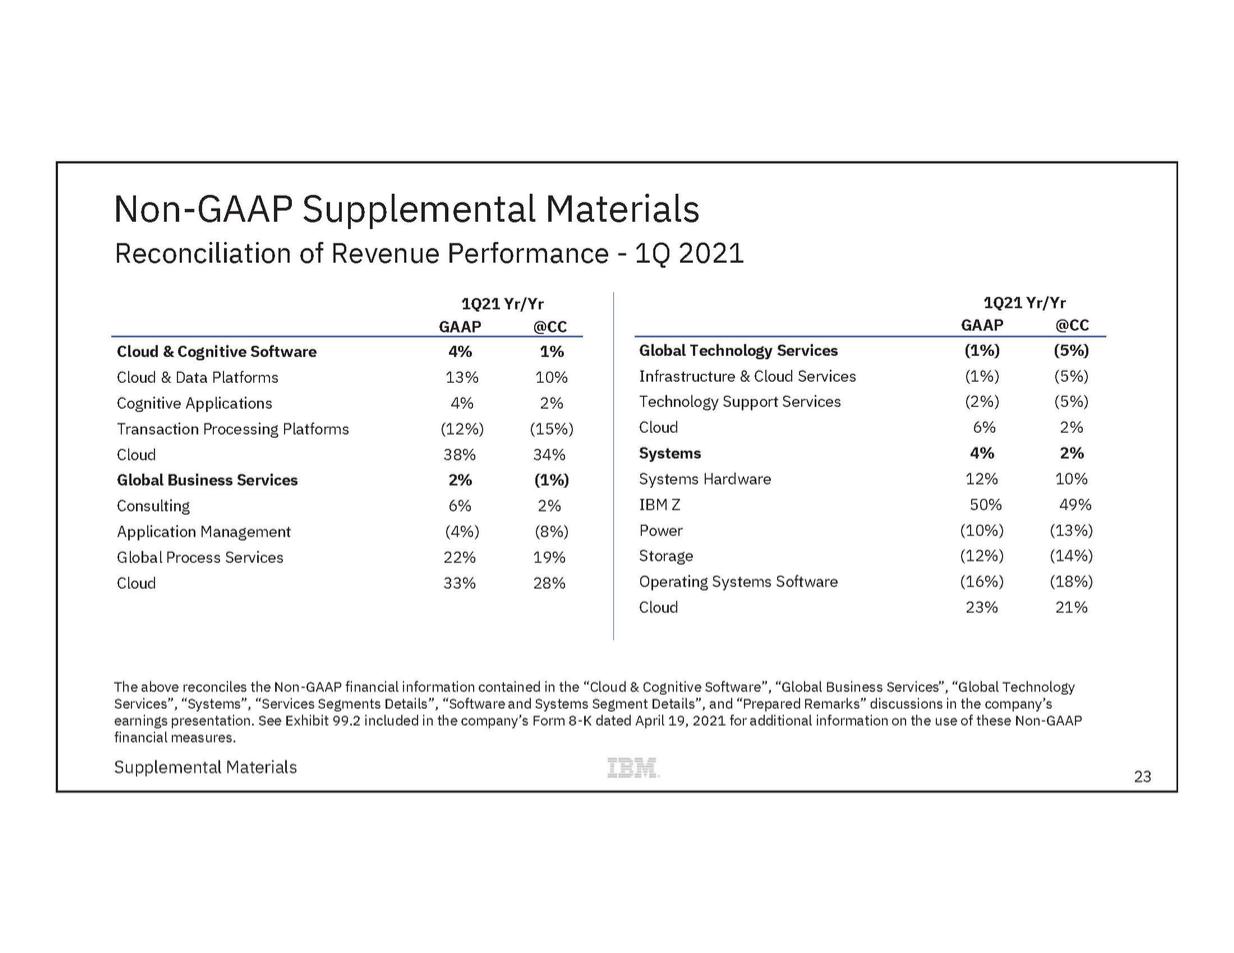
| Non-GAAP Supplemental Materials Reconciliation of Revenue Performance - 1Q 2021 1Q21 Yr/Yr1Q21 Yr/Yr GAAP @CC GAAP @CC Cloud & Cognitive Software 4% 1% Global Technology Services (1%) (5%) Cloud & Data Platforms 13% 10% Infrastructure & Cloud Services (1%) (5%) Cognitive Applications 4% 2% Technology Support Services (2%) (5%) Transaction Processing Platforms (12%) (15%) Cloud 6% 2% Cloud 38% 34% Systems 4% 2% Global Business Services2% (1%) Systems Hardware 12% 10% Consulting 6% 2% IBM Z 50% 49% Application Management (4%) (8%) Power(10%) (13%) Global Process Services 22% 19% Storage(12%) (14%) Cloud 33% 28% Operating Systems Software (16%) (18%) Cloud23% 21% The above reconciles the Non-GAAP financial information contained in the “Cloud & Cognitive Software”, “Global Business Services”, “Global Technology Services”, “Systems”, “Services Segments Details”, “Software and Systems Segment Details”, and “Prepared Remarks” discussions in the company’s earnings presentation. See Exhibit 99.2 included in the company’s Form 8-K dated April 19, 2021 for additional information on the use of these Non-GAAP financial measures. Supplemental Materials 23 |
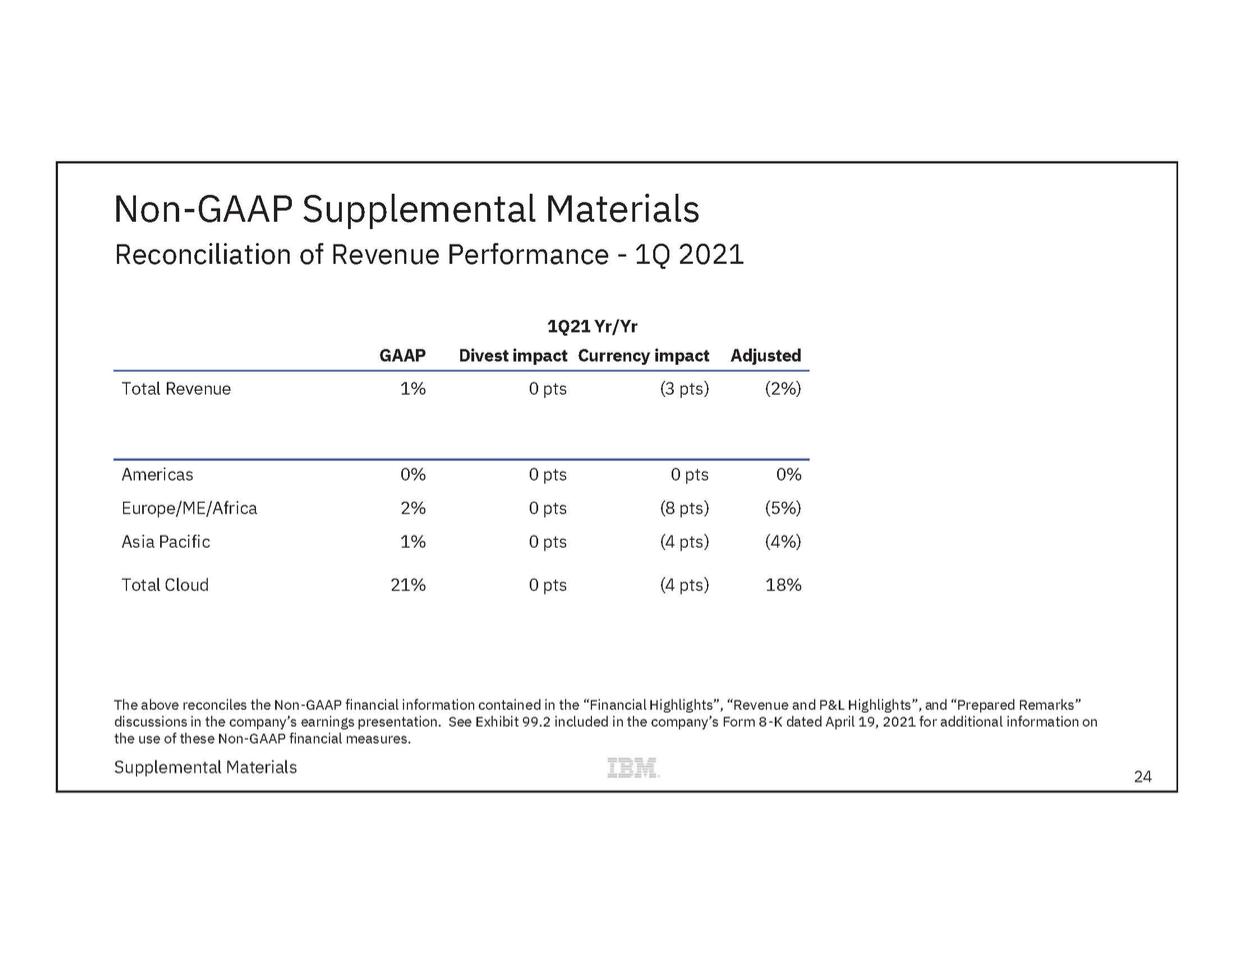
| Non-GAAP Supplemental Materials Reconciliation of Revenue Performance - 1Q 2021 1Q21 Yr/Yr GAAPDivest impact Currency impact Adjusted Total Revenue1% 0 pts (3 pts) (2%) Americas 0% 0 pts 0 pts 0% Europe/ME/Africa 2% 0 pts (8 pts) (5%) Asia Pacific 1% 0 pts (4 pts) (4%) Total Cloud21% 0 pts (4 pts) 18% The above reconciles the Non-GAAP financial information contained in the “Financial Highlights”, “Revenue and P&L Highlights”, and “Prepared Remarks” discussions in the company’s earnings presentation. See Exhibit 99.2 included in the company’s Form 8-K dated April 19, 2021 for additional information on the use of these Non-GAAP financial measures. Supplemental Materials 24 |
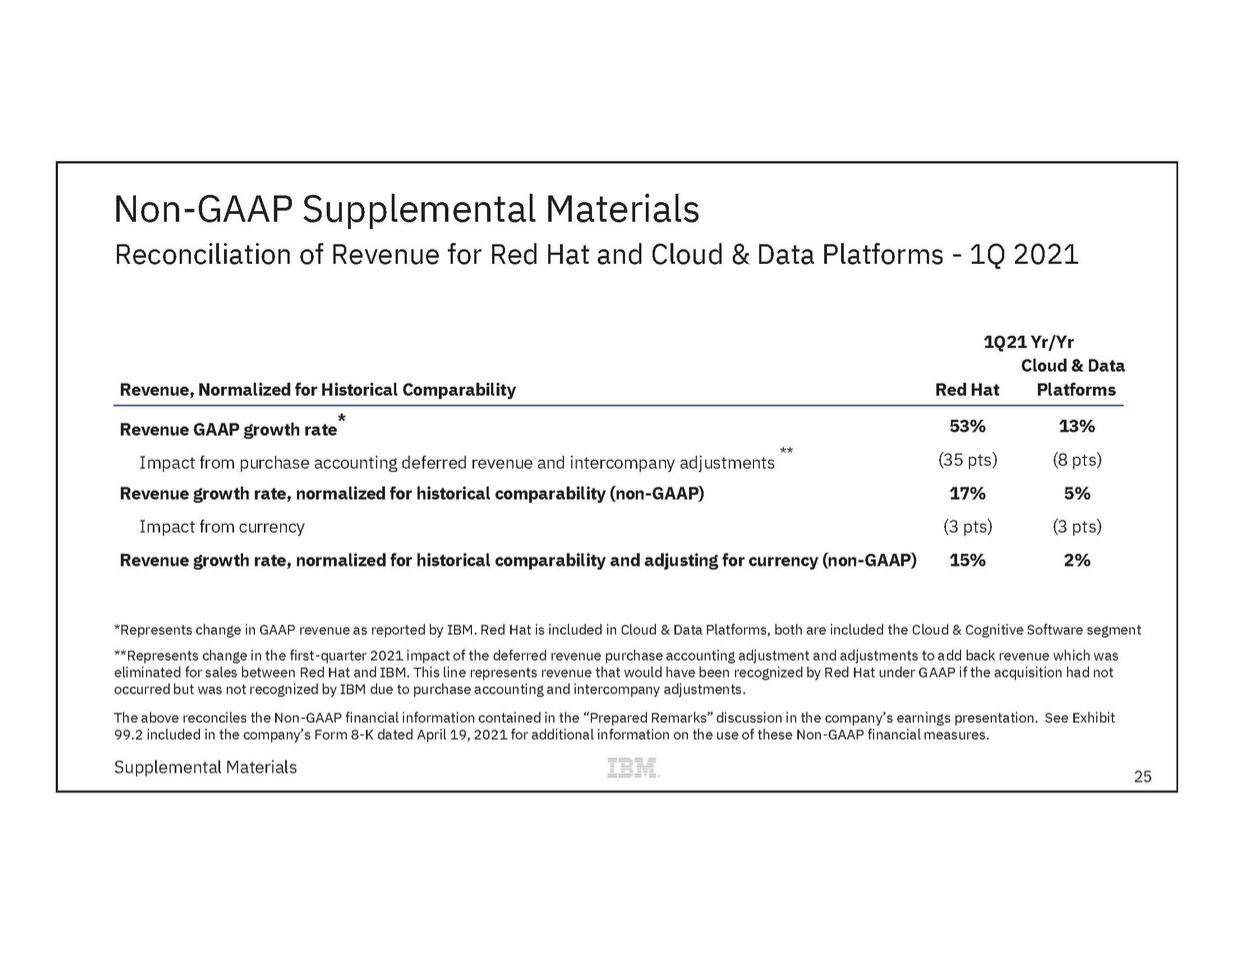
| Non-GAAP Supplemental Materials Reconciliation of Revenue for Red Hat and Cloud & Data Platforms - 1Q 2021 1Q21 Yr/Yr Cloud & Data Revenue, Normalized for Historical ComparabilityRed Hat Platforms Revenue GAAP growth rate*53% 13% Impact from purchase accounting deferred revenue and intercompany adjustments ** (35 pts) (8 pts) Revenue growth rate, normalized for historical comparability (non-GAAP)17% 5% Impact from currency (3 pts) (3 pts) Revenue growth rate, normalized for historical comparability and adjusting for currency (non-GAAP)15% 2% *Represents change in GAAP revenue as reported by IBM. Red Hat is included in Cloud & Data Platforms, both are included the Cloud & Cognitive Software segment **Represents change in the first-quarter 2021 impact of the deferred revenue purchase accounting adjustment and adjustments to add back revenue which was eliminated for sales between Red Hat and IBM. This line represents revenue that would have been recognized by Red Hat under GAAP if the acquisition had not occurred but was not recognized by IBM due to purchase accounting and intercompany adjustments. The above reconciles the Non-GAAP financial information contained in the “Prepared Remarks” discussion in the company’s earnings presentation. See Exhibit 99.2 included in the company’s Form 8-K dated April 19, 2021 for additional information on the use of these Non-GAAP financial measures. Supplemental Materials 25 |
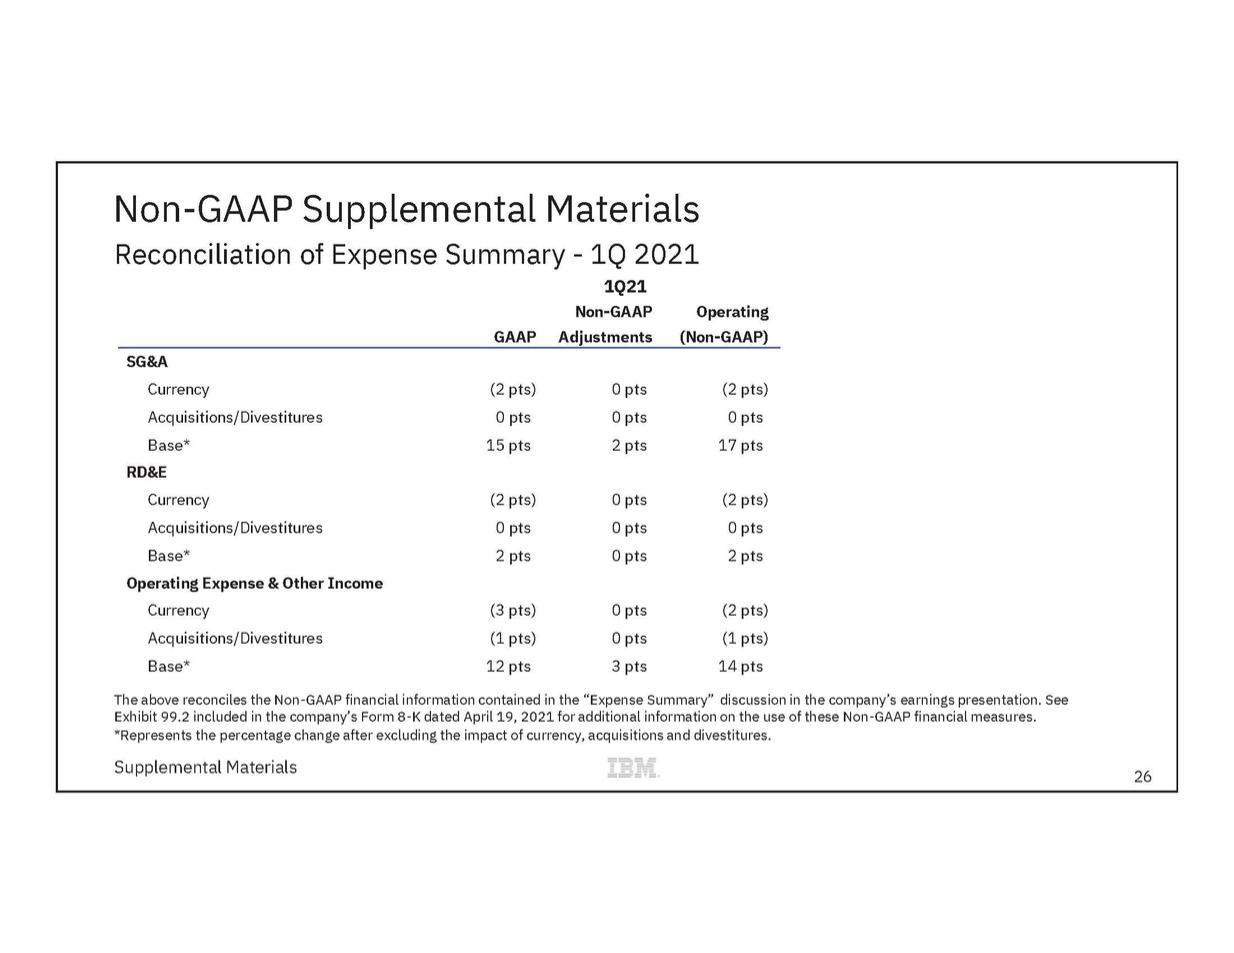
| Non-GAAP Supplemental Materials Reconciliation of Expense Summary - 1Q 2021 1Q21 Non-GAAPOperating GAAPAdjustments(Non-GAAP) SG&A Currency (2 pts) 0 pts (2 pts) Acquisitions/Divestitures0 pts 0 pts 0 pts Base*15 pts 2 pts 17 pts RD&E Currency(2 pts) 0 pts (2 pts) Acquisitions/Divestitures0 pts 0 pts 0 pts Base*2 pts 0 pts 2 pts Operating Expense & Other Income Currency (3 pts) 0 pts (2 pts) Acquisitions/Divestitures (1 pts) 0 pts (1 pts) Base* 12 pts 3 pts 14 pts The above reconciles the Non-GAAP financial information contained in the “Expense Summary” discussion in the company’s earnings presentation. See Exhibit 99.2 included in the company’s Form 8-K dated April 19, 2021 for additional information on the use of these Non-GAAP financial measures. *Represents the percentage change after excluding the impact of currency, acquisitions and divestitures. Supplemental Materials 26 |
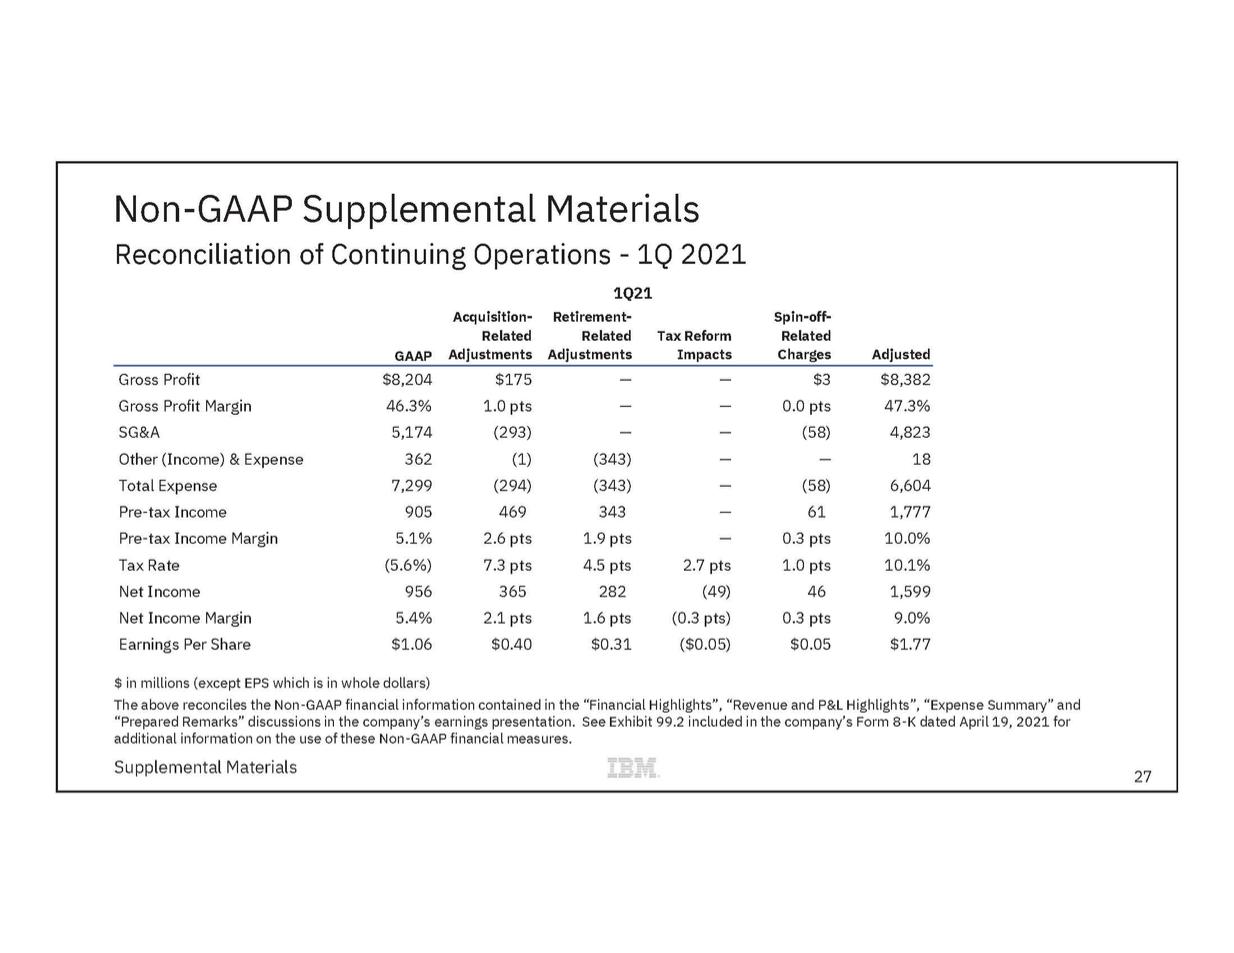
| Non-GAAP Supplemental Materials Reconciliation of Continuing Operations - 1Q 2021 1Q21 Acquisition-Retirement-Spin-off-Related Related Tax Reform Related GAAPAdjustmentsAdjustmentsImpactsChargesAdjusted Gross Profit $8,204 $175 ——$3 $8,382 Gross Profit Margin46.3% 1.0 pts ——0.0 pts 47.3% SG&A 5,174 (293) ——(58) 4,823 Other (Income) & Expense362 (1) (343) ——18 Total Expense7,299 (294) (343) —(58) 6,604 Pre-tax Income 905 469 343 —61 1,777 Pre-tax Income Margin 5.1% 2.6 pts 1.9 pts — 0.3 pts 10.0% Tax Rate (5.6%) 7.3 pts 4.5 pts 2.7 pts 1.0 pts 10.1% Net Income 956 365 282 (49) 46 1,599 Net Income Margin 5.4% 2.1 pts 1.6 pts (0.3 pts) 0.3 pts 9.0% Earnings Per Share$1.06 $0.40 $0.31 ($0.05) $0.05 $1.77 $ in millions (except EPS which is in whole dollars) The above reconciles the Non-GAAP financial information contained in the “Financial Highlights”, “Revenue and P&L Highlights”, “Expense Summary” and “Prepared Remarks” discussions in the company’s earnings presentation. See Exhibit 99.2 included in the company’s Form 8-K dated April 19, 2021 for additional information on the use of these Non-GAAP financial measures. Supplemental Materials 27 |
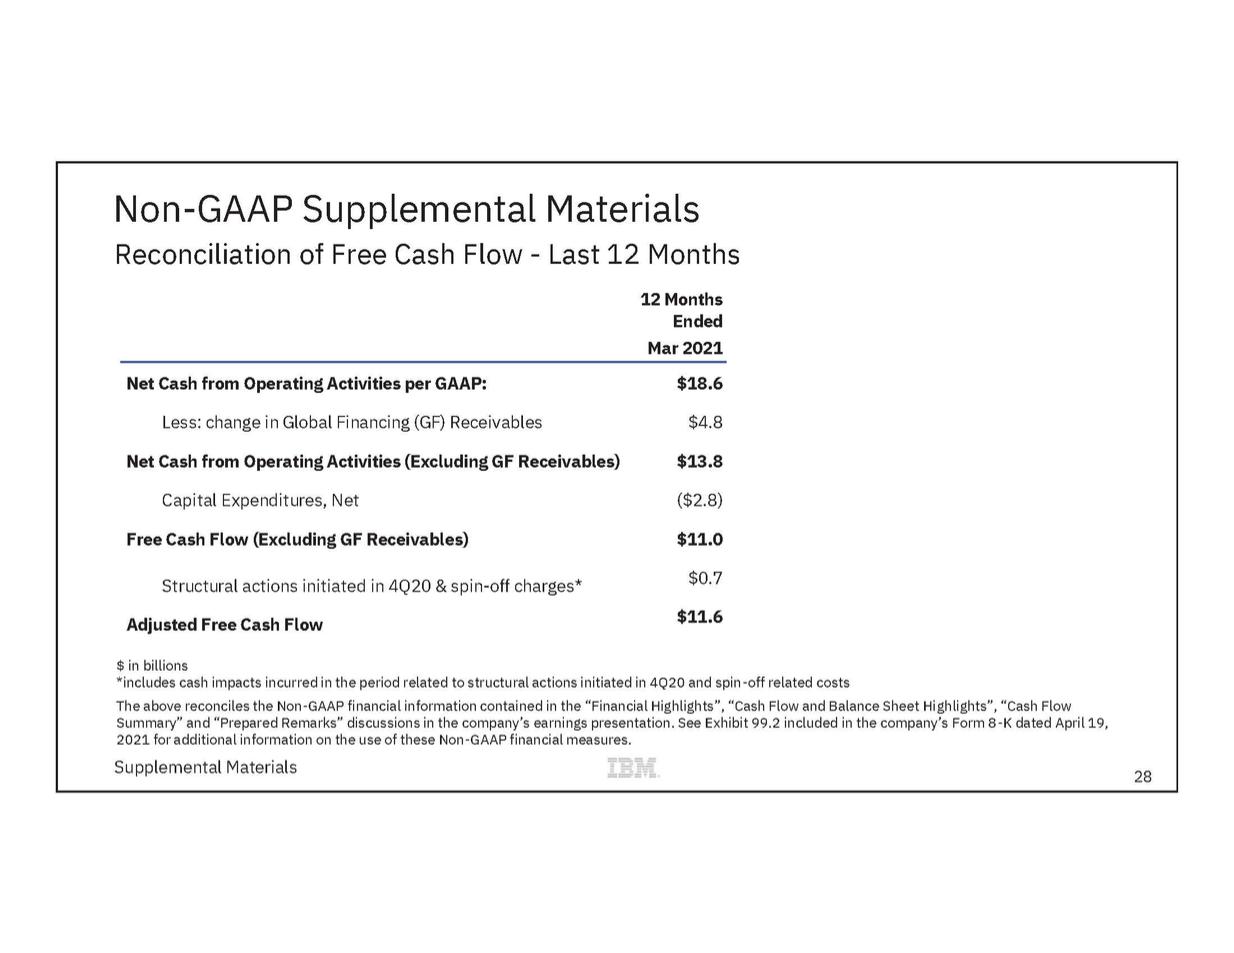
| Non-GAAP Supplemental Materials Reconciliation of Free Cash Flow - Last 12 Months 12 Months Ended Mar 2021 Net Cash from Operating Activities per GAAP:$18.6 Less: change in Global Financing (GF) Receivables$4.8 Net Cash from Operating Activities (Excluding GF Receivables)$13.8 Capital Expenditures, Net ($2.8) Free Cash Flow (Excluding GF Receivables)$11.0 Structural actions initiated in 4Q20 & spin-off charges* $0.7 Adjusted Free Cash Flow $11.6 $ in billions *includes cash impacts incurred in the period related to structural actions initiated in 4Q20 and spin-off related costs The above reconciles the Non-GAAP financial information contained in the “Financial Highlights”, “Cash Flow and Balance Sheet Highlights”, “Cash Flow Summary” and “Prepared Remarks” discussions in the company’s earnings presentation. See Exhibit 99.2 included in the company’s Form 8 -K dated April 19, 2021 for additional information on the use of these Non-GAAP financial measures. Supplemental Materials 28 |
| ibm.com/investor |