Attached files
| file | filename |
|---|---|
| EX-99.1 - EXHIBIT 99.1 - RITE AID CORP | tm2112843d1_ex99-1.htm |
| 8-K - FORM 8-K - RITE AID CORP | tm2112843d1_8k.htm |
Exhibit 99.2
April 15, 2021 Heyward Donigan Chief Executive Officer Jim Peters Chief Operating Officer Matt Schroeder Chief Financial Officer
2 Cautionary Statement Regarding Forward Looking Statements Statements in this presentation that are not historical, are forward - looking statements made pursuant to the safe harbor provisions of the Private Securities Litigation Reform Act of 1995 . Such statements include, but are not limited to, statements regarding Rite Aid Corporation’s (the “Company”) guidance for fiscal 2022 ; the continued impact of the global coronavirus (COVID - 19 ) pandemic on the Company’s business ; the ability to accelerate key initiatives and improve and modernize the operating performance of the Company’s stores ; timing for launching all new member portal ; and any assumptions underlying any of the foregoing . Words such as “anticipate,” “believe,” “continue,” “could,” “estimate,” “expect,” “intend,” “may,” “plan,” “predict,” “project,” “should,” and “will” and variations of such words and similar expressions are intended to identify such forward - looking statements . These forward - looking statements are not guarantees of future performance and involve risks, assumptions and uncertainties, including, but not limited to : the continued impact of COVID - 19 on the Company’s workforce, operations, stores, expenses and supply chain, and the operations of the Company’s customers, suppliers and business partners ; the Company’s ability to successfully implement its RxEvolution strategy ; Company’s high level of indebtedness and its ability to satisfy its obligations and the other covenants contained in the Company’s debt agreements ; general competitive, economic, industry, market, political (including healthcare reform) and regulatory conditions, the severity and resulting impact of the cough, cold and flu season, as well as other factors specific to the markets in which we operate ; the impact of private and public third - party payers continued reduction in prescription drug reimbursements and efforts to encourage mail order ; the Company’s ability to manage expenses and its investments in working capital ; the Company’s ability to achieve the benefits of the Company’s efforts to reduce the costs of its generic and other drugs ; the Company’s ability to achieve cost savings and other benefits of its organizational restructuring within the Company’s anticipated timeframe, if at all ; and outcomes of legal and regulatory matters ; the Company’s ability to partner and have relationships with health plans and health systems . These and other risks, assumptions and uncertainties are more fully described in Item 1 A (Risk Factors) of the Company’s most recent Annual Report on Form 10 - K, in Item 1 A (Risk Factors) of the Company’s Quarterly Report on Form 10 - Q filed on July 2 , 2020 and in other documents that it files or furnishes with the Securities and Exchange Commission (the “SEC”), which you are encouraged to read . To the extent that COVID - 19 adversely affects the Company’s business and financial results, it may also have the effect of heightening many of such risk factors . Should one or more of these risks or uncertainties materialize, or should underlying assumptions prove incorrect, actual results may vary materially from those indicated or anticipated by such forward - looking statements . Accordingly, you are cautioned not to place undue reliance on these forward - looking statements, which speak only as of the date they are made . The degree to which COVID - 19 may adversely the Company’s results and operations, including its ability to achieve its outlook for the first fiscal quarter of 2022 or fiscal 2022 guidance, will depend on numerous evolving factors and future developments, which are highly uncertain, including, but not limited to, the duration and spread of the outbreak, its severity, the actions to contain the virus or treat its impact (such as travel bans and restrictions, quarantines, shelter - in - place orders and shutdowns), including the reinstitution of more stringent regulations (including mandatory stay at home orders, the availability and rollout of vaccines to treat the virus), how quickly and to what extent normal economic and operating conditions can resume and the impact on front - end purchases and engaging in voluntary or elective procedures . As a result, the impact on the Company’s financial and operating results cannot be reasonably estimated with specificity at this time, but the impact could be material . The Company expressly disclaims any current intention to update publicly any forward - looking statement after the distribution of this presentation, whether as a result of new information, future events, changes in assumptions or otherwise .
3 The following presentation includes the non - GAAP financial measures, Adjusted EBITDA, Adjusted Net Income (Loss), Adjusted Net Income (Loss) per Diluted Share, Adjusted EBITDA Gross Profit, and Adjusted EBITDA SG&A . The Company defines Adjusted EBITDA as net income (loss) excluding the impact of income taxes, interest expense, depreciation and amortization, LIFO adjustments, charges or credits for facility closing and impairment, goodwill and intangible asset impairment charges, inventory write - downs related to store closings, gains or losses on debt modifications and retirements, the WBA merger termination fee, and other items (including stock - based compensation expense, merger and acquisition - related costs, non - recurring litigation settlement, severance, restructuring - related costs and costs related to facility closures, the gain on Bartell acquisition and gain or loss on sale of assets) . The presentation includes a reconciliation of Adjusted EBITDA to net income (loss), which is the most directly comparable GAAP financial measure . Adjusted Net Income (Loss) and Adjusted Net Income (Loss) per Diluted Share exclude amortization expense, merger and acquisition - related costs, non - recurring litigation settlement, gains or losses on debt modifications and retirements, LIFO adjustments, goodwill and intangible asset impairment charges, restructuring - related costs, the gain on Bartell acquisition and the WBA merger termination fee . Additionally , the add back of LIFO (credit) charge when calculating Adjusted EBITDA, Adjusted Net Income (Loss) and Adjusted Net Income (Loss) per Diluted Share removes the entire impact of LIFO (credits) charges, and effectively reflects the Company’s results as if the Company was on a FIFO inventory basis . The presentation includes a reconciliation of Adjusted Net Income (Loss) to net income (loss), which is the most directly comparable GAAP financial measure . Adjusted EBITDA Gross Profit includes LIFO adjustments, depreciation and amortization (COGS portion only) and other items . The presentation includes a reconciliation of Adjusted EBITDA Gross Profit to Revenue, which is the most directly comparable GAAP financial measure . Adjusted EBITDA SG&A excludes depreciation and amortization (SG&A portion only), stock - based compensation expense, merger and acquisition - related costs, litigation settlement and other items . The presentation includes a reconciliation of Adjusted EBITDA SG&A to Revenue, which is the most directly comparable GAAP financial measure . Non - GAAP Financial Measures
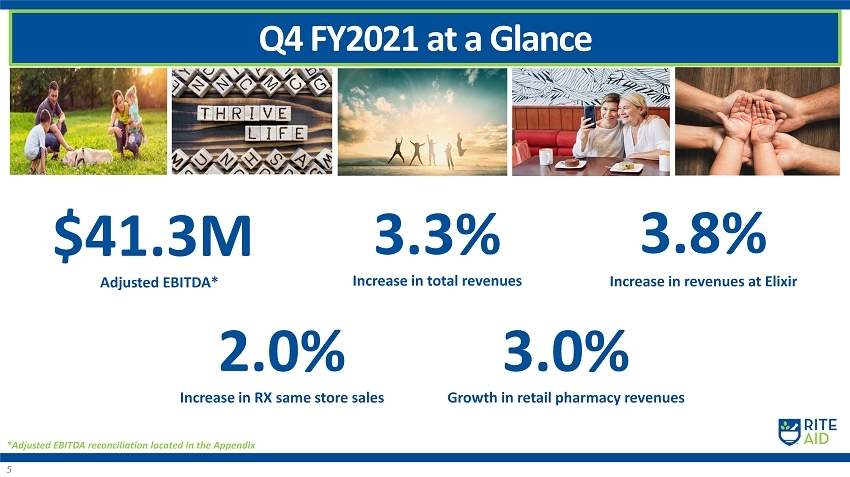
5 $41.3M Adjusted EBITDA* 3.8% Increase in revenues at Elixir 3.3% Increase in total revenues 3.0% Growth in retail pharmacy revenues 2.0% Increase in RX same store sales *Adjusted EBITDA reconciliation located in the Appendix Q4 FY2021 at a Glance
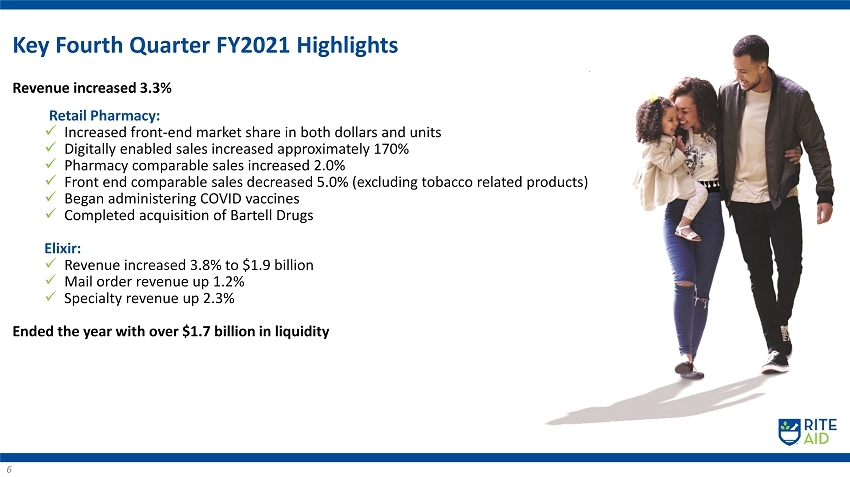
6 Key Fourth Quarter FY2021 Highlights Revenue increased 3.3% Retail Pharmacy: x Increased front - end market share in both dollars and units x Digitally enabled sales increased approximately 170% x Pharmacy comparable sales increased 2.0% x Front end comparable sales decreased 5.0% (excluding tobacco related products) x Began administering COVID vaccines x Completed acquisition of Bartell Drugs Elixir: x Revenue increased 3.8% to $1.9 billion x Mail order revenue up 1.2% x Specialty revenue up 2.3% Ended the year with over $1.7 billion in liquidity
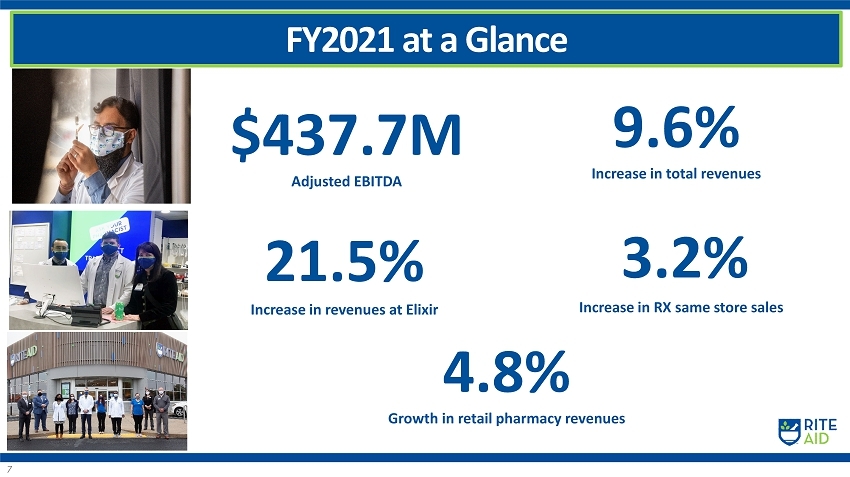
7 FY2021 at a Glance $437.7M Adjusted EBITDA 9.6% Increase in total revenues Increase in RX same store sales 21.5% Increase in revenues at Elixir 4.8% Growth in retail pharmacy revenues 3.2%
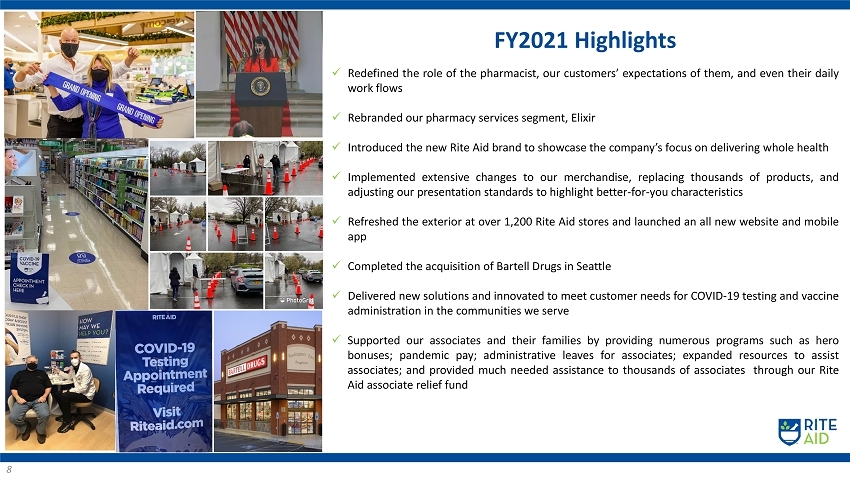
8 FY2021 Highlights x Redefined the role of the pharmacist, our customers’ expectations of them, and even their daily work flows x Rebranded our pharmacy services segment, Elixir x Introduced the new Rite Aid brand to showcase the company’s focus on delivering whole health x Implemented extensive changes to our merchandise, replacing thousands of products, and adjusting our presentation standards to highlight better - for - you characteristics x Refreshed the exterior at over 1 , 200 Rite Aid stores and launched an all new website and mobile app x Completed the acquisition of Bartell Drugs in Seattle x Delivered new solutions and innovated to meet customer needs for COVID - 19 testing and vaccine administration in the communities we serve x Supported our associates and their families by providing numerous programs such as hero bonuses ; pandemic pay ; administrative leaves for associates ; expanded resources to assist associates ; and provided much needed assistance to thousands of associates through our Rite Aid associate relief fund
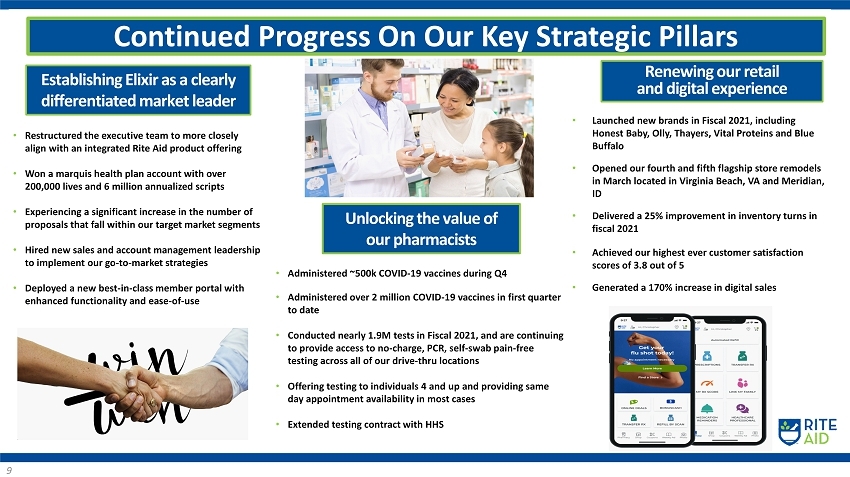
9 • Restructured the executive team to more closely align with an integrated Rite Aid product offering • Won a marquis health plan account with over 200,000 lives and 6 million annualized scripts • Experiencing a significant increase in the number of proposals that fall within our target market segments • Hired new sales and account management leadership to implement our go - to - market strategies • Deployed a new best - in - class member portal with enhanced functionality and ease - of - use Establishing Elixir as a clearly differentiated market leader Continued Progress On Our Key Strategic Pillars Unlocking the value of our pharmacists • Administered ~ 500k COVID - 19 vaccines during Q4 • Administered over 2 million COVID - 19 vaccines in first quarter to date • Conducted nearly 1.9M tests in Fiscal 2021, and are continuing to provide access to no - charge, PCR, self - swab pain - free testing across all of our drive - thru locations • Offering testing to individuals 4 and up and providing same day appointment availability in most cases • Extended testing contract with HHS Renewing our retail and digital experience • Launched new brands in Fiscal 2021, including Honest Baby, Olly, Thayers, Vital Proteins and Blue Buffalo • Opened our fourth and fifth flagship store remodels in March located in Virginia Beach, VA and Meridian, ID • Delivered a 25% improvement in inventory turns in fiscal 2021 • Achieved our highest ever customer satisfaction scores of 3.8 out of 5 • Generated a 170% increase in digital sales
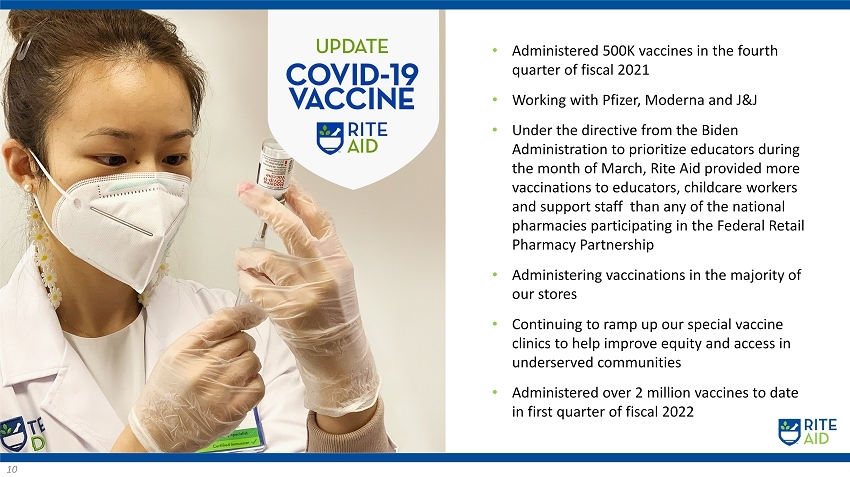
10 • Administered 500K vaccines in the fourth quarter of fiscal 2021 • Working with Pfizer, Moderna and J&J • Under the directive from the Biden Administration to prioritize educators during the month of March, Rite Aid provided more vaccinations to educators, childcare workers and support staff than any of the national pharmacies participating in the Federal Retail Pharmacy Partnership • Administering vaccinations in the majority of our stores • Continuing to ramp up our special vaccine clinics to help improve equity and access in underserved communities • Administered over 2 million vaccines to date in first quarter of fiscal 2022
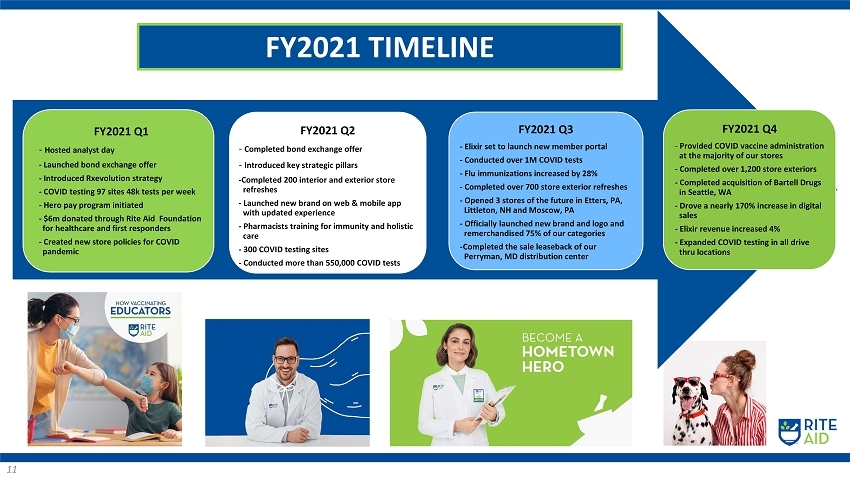
11 FY2021 Q1 - Hosted analyst day - Launched bond exchange offer - Introduced Rxevolution strategy - COVID testing 97 sites 48k tests per week - Hero pay program initiated - $6m donated through Rite Aid Foundation for healthcare and first responders - Created new store policies for COVID pandemic FY2021 Q2 - Completed bond exchange offer - Introduced key strategic pillars - Completed 200 interior and exterior store refreshes - Launched new brand on web & mobile app with updated experience - Pharmacists training for immunity and holistic care - 300 COVID testing sites - Conducted more than 550,000 COVID tests FY2021 Q3 - Elixir set to launch new member portal - Conducted over 1M COVID tests - Flu immunizations increased by 28% - Completed over 700 store exterior refreshes - Opened 3 stores of the future in Etters, PA, Littleton, NH and Moscow, PA - Officially launched new brand and logo and remerchandised 75% of our categories - Completed the sale leaseback of our Perryman, MD distribution center FY2021 Q4 - Provided COVID vaccine administration at the majority of our stores - Completed over 1,200 store exteriors - Completed acquisition of Bartell Drugs in Seattle, WA - Drove a nearly 170% increase in digital sales - Elixir revenue increased 4% - Expanded COVID testing in all drive thru locations FY2021 TIMELINE
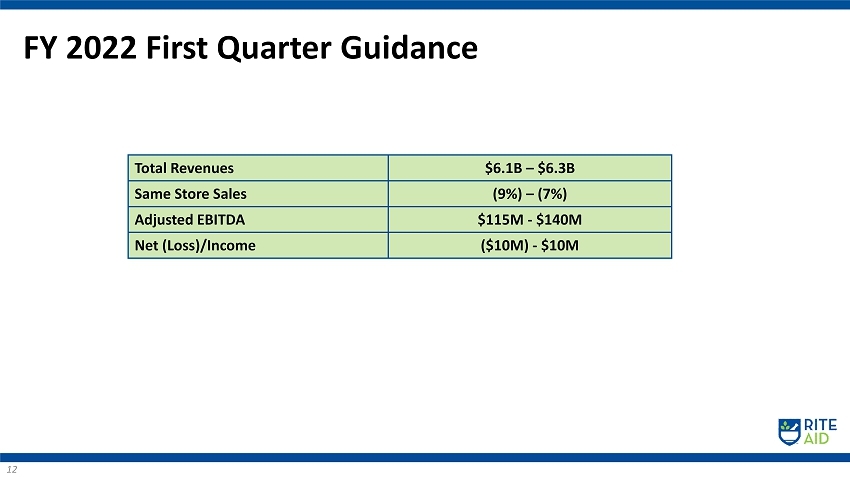
12 Total Revenues $6.1B – $6.3B Same Store Sales (9%) – (7%) Adjusted EBITDA $115M - $140M Net (Loss)/Income ($10M) - $10M FY 2022 First Quarter Guidance
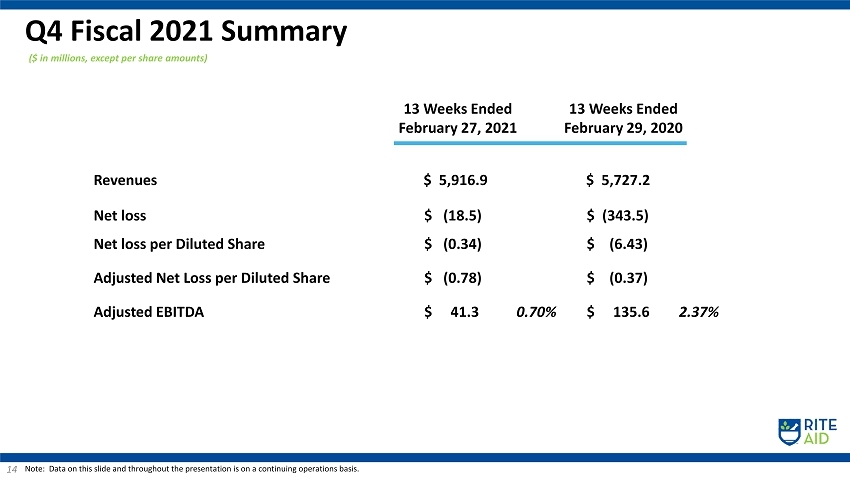
($ in millions, except per share amounts) Q4 Fiscal 2021 Summary 14 Note: Data on this slide and throughout the presentation is on a continuing operations basis. 13 Weeks Ended February 27, 2021 13 Weeks Ended February 29, 2020 Revenues $ 5,916.9 $ 5,727.2 Net loss $ (18.5) $ (343.5) Net loss per Diluted Share $ (0.34) $ ( 6 .43) Adjusted Net Loss per Diluted Share $ (0 .78) $ ( 0.37) Adjusted EBITDA $ 41.3 0.70% $ 135.6 2.37%
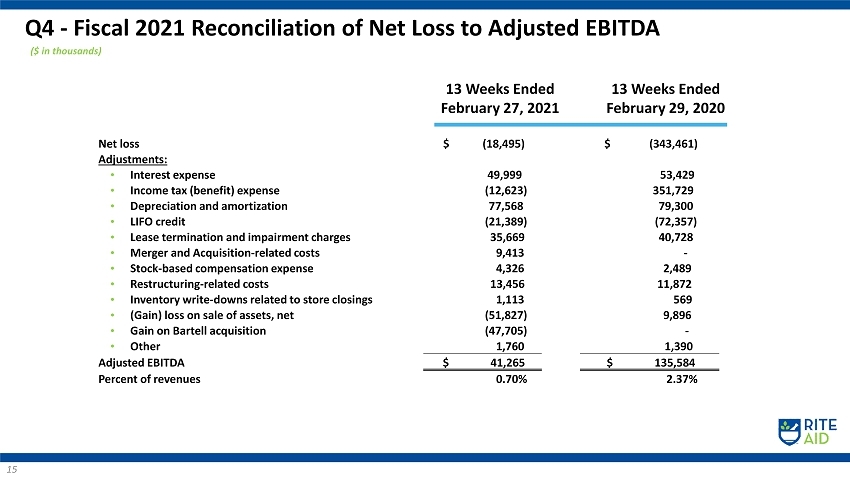
($ in thousands) Q 4 - Fiscal 2021 Reconciliation of Net Loss to Adjusted EBITDA 15 13 Weeks Ended February 27, 2021 13 Weeks Ended February 29, 2020 Net loss $ (18,495) $ (343,461) Adjustments: • Interest expense 49,999 53,429 • Income tax (benefit) expense (12,623) 3 51,729 • Depreciation and amortization 77,568 79,300 • LIFO credit (21,389) (72,357) • Lease termination and impairment charges 35,669 40,728 • Merger and Acquisition - related costs 9,413 - • Stock - based compensation expense 4,326 2,489 • Restructuring - related costs 13,456 11,872 • Inventory write - downs related to store closings 1,113 56 9 • (Gain) loss on sale of assets, net (51 ,827) 9,896 • Gain on Bartell acquisition (47,705 ) - • Other 1,760 1,390 Adjusted EBITDA $ 41,265 $ 135,584 Percent of revenues 0.70% 2.37%
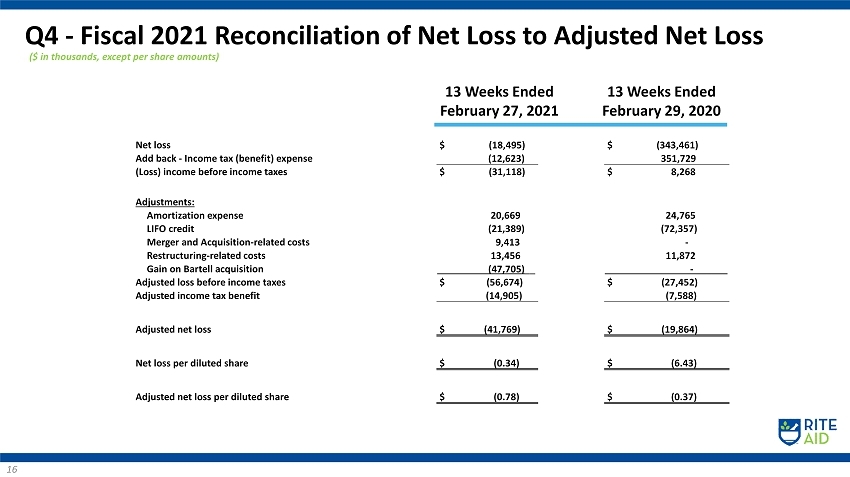
($ in thousands, except per share amounts) Q4 - Fiscal 2021 Reconciliation of Net Loss to Adjusted Net Loss 16 13 Weeks Ended February 27, 2021 13 Weeks Ended February 29, 2020 Net loss $ (18,495) $ (343 ,461) Add back - Income tax (benefit) expense (12,623) 351, 729 (Loss) income before income taxes $ (31,118) $ 8,268 Adjustments: Amortization expense 20,669 24,765 LIFO credit (21,389) (72,357) Merger and Acquisition - related costs 9,413 - Restructuring - related costs 13,456 11,872 Gain on Bartell acquisition (47,705) __ - ______ Adjusted loss before income taxes $ (56,674) $ (27,452) Adjusted income tax benefit (14,905) (7 ,588) Adjusted net loss $ (41,769) $ (19 ,864) Net loss per diluted share $ (0.34) $ (6.43) Adjusted net loss per diluted share $ (0.78) $ ( 0.37)
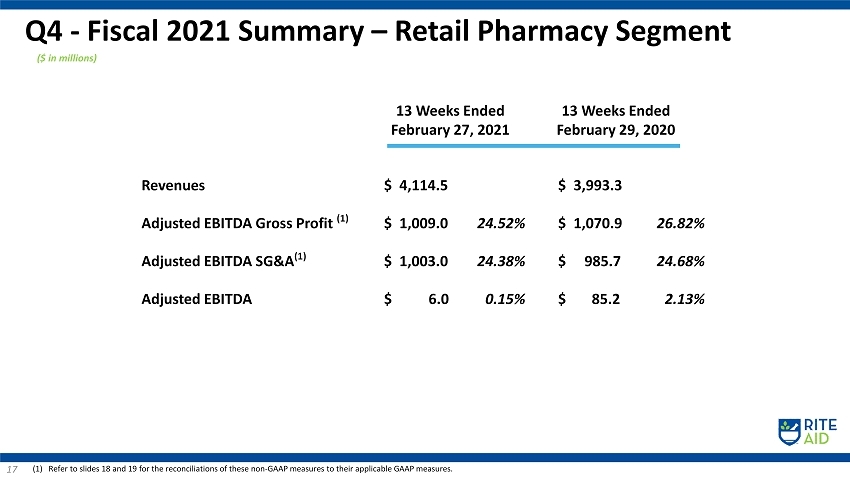
Q4 - Fiscal 2021 Summary – Retail Pharmacy Segment 17 (1) Refer to slides 18 and 19 for the reconciliations of these non - GAAP measures to their applicable GAAP measures. ($ in millions) 13 Weeks Ended February 27, 2021 13 Weeks Ended February 29, 2020 Revenues $ 4,114.5 $ 3,993.3 Adjusted EBITDA Gross Profit (1) $ 1,009.0 24.52% $ 1,070.9 26.82% Adjusted EBITDA SG&A (1) $ 1,003 .0 24.38% $ 985.7 24.68% Adjusted EBITDA $ 6.0 0.15% $ 85.2 2.13%
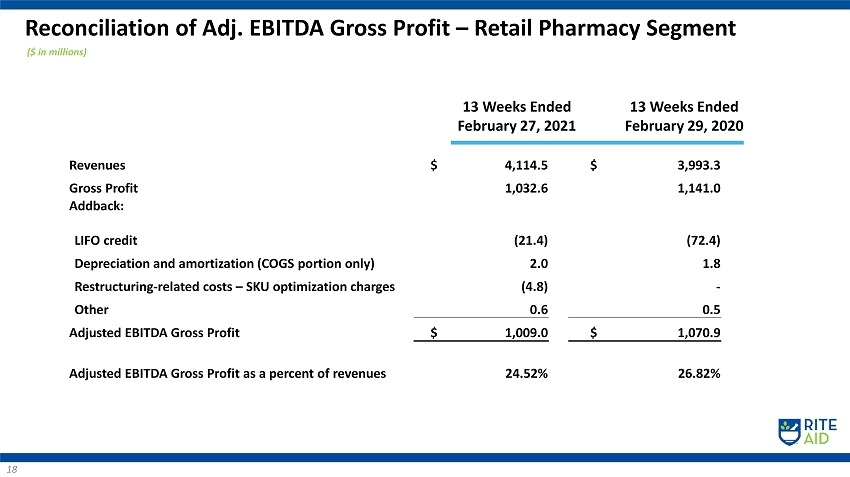
($ in millions) Reconciliation of Adj. EBITDA Gross Profit – Retail Pharmacy Segment 18 13 Weeks Ended February 27, 2021 13 Weeks Ended February 29, 2020 Revenues $ 4,114.5 $ 3,993.3 Gross Profit 1,032.6 1,141.0 Addback: LIFO credit (21.4) (72.4) Depreciation and amortization (COGS portion only) 2.0 1.8 Restructuring - related costs – SKU optimization charges (4.8) - Other 0.6 0.5 Adjusted EBITDA Gross Profit $ 1,009.0 $ 1,070.9 Adjusted EBITDA Gross Profit as a percent of revenues 24.52% 26.82%
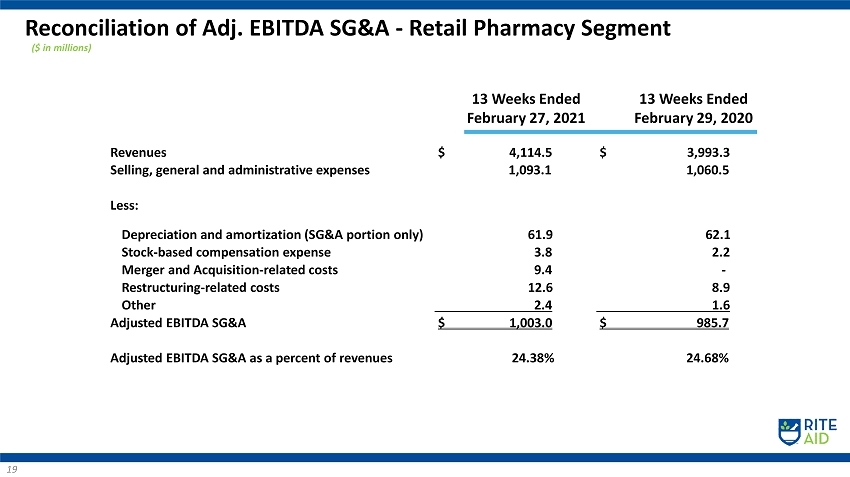
($ in millions) Reconciliation of Adj. EBITDA SG&A - Retail Pharmacy Segment 19 13 Weeks Ended February 27, 2021 13 Weeks Ended February 29, 2020 Revenues $ 4,114.5 $ 3,993.3 Selling, general and administrative expenses 1,093.1 1,060.5 Less: Depreciation and amortization (SG&A portion only) 61.9 62.1 Stock - based compensation expense 3.8 2.2 Merger and Acquisition - related costs 9.4 - Restructuring - related costs 12 .6 8.9 Other 2.4 1.6 Adjusted EBITDA SG&A $ 1,003.0 $ 985.7 Adjusted EBITDA SG&A as a percent of revenues 24.38% 24.68%
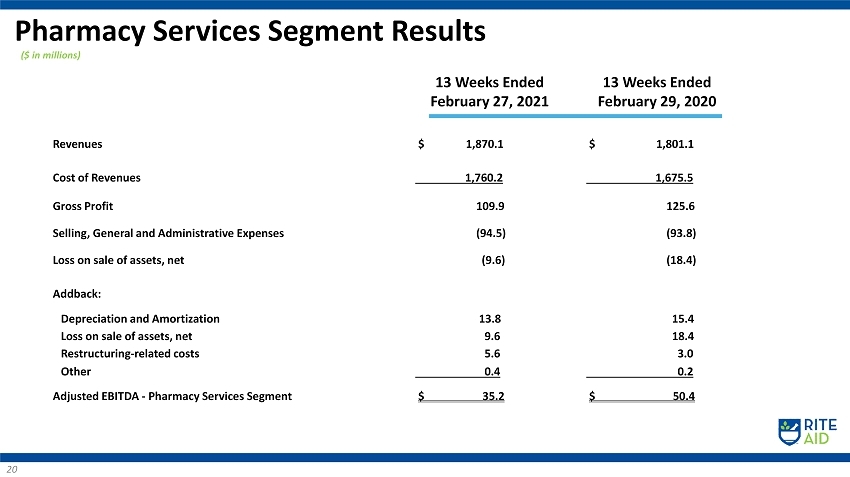
Pharmacy Services Segment Results 20 13 Weeks Ended February 27, 2021 13 Weeks Ended February 29, 2020 Revenues $ 1,870.1 $ 1,801.1 Cost of Revenues 1,760.2 1,675.5 Gross Profit 109 .9 125.6 Selling, General and Administrative Expenses (94.5) (93.8) Loss on sale of assets, net (9.6) (18.4) Addback: Depreciation and Amortization 13.8 15.4 Loss on sale of assets, net 9.6 18.4 Restructuring - related costs 5.6 3.0 Other 0.4 0.2 Adjusted EBITDA - Pharmacy Services Segment $ 35.2 $ 50.4 ($ in millions)
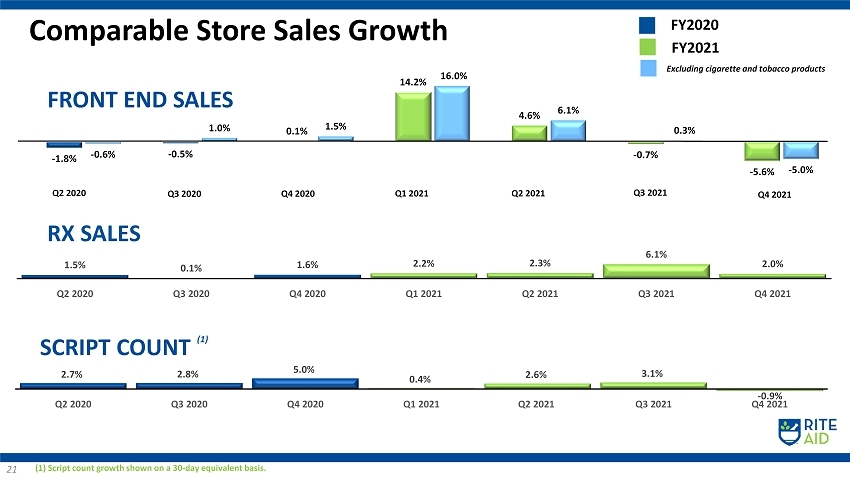
21 2.7% 2.8% 5.0% 0.4% 2.6% 3.1% - 0.9% Q2 2020 Q3 2020 Q4 2020 Q1 2021 Q2 2021 Q3 2021 Q4 2021 SCRIPT COUNT (1) Excluding cigarette and tobacco products Comparable Store Sales Growth Q2 2020 Q4 2020 Q3 2020 (1) Script count growth shown on a 30 - day equivalent basis. Q1 2021 Q2 2021 Q3 2021 1.5% 0.1% 1.6% 2.2% 2.3% 6.1% 2.0% Q2 2020 Q3 2020 Q4 2020 Q1 2021 Q2 2021 Q3 2021 Q4 2021 RX SALES - 1.8% - 0.5% 0.1% 14.2% 4.6% - 0.7% - 5.6% - 0.6% 1.0% 1.5% 16.0% 6.1% 0.3% - 5.0% FRONT END SALES Q4 2021 FY2020 FY2021
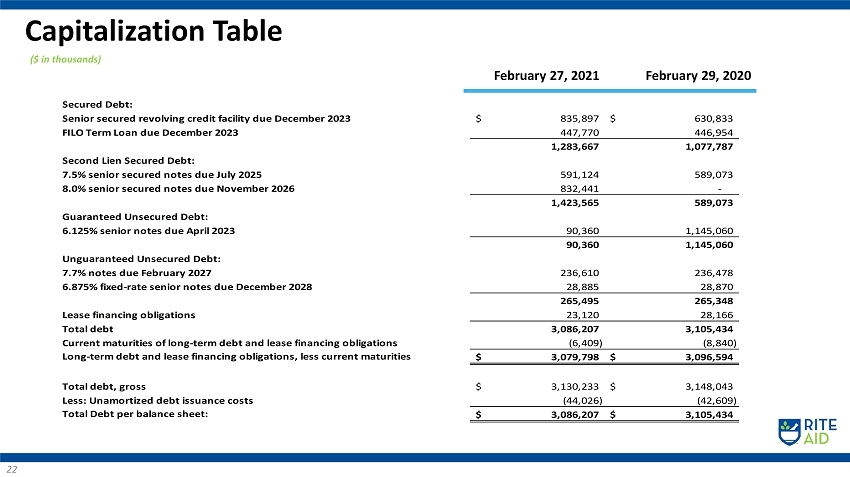
($ in thousands) Capitalization Table 22 February 27, 2021 February 29, 2020 Secured Debt: Senior secured revolving credit facility due December 2023 835,897$ 630,833$ FILO Term Loan due December 2023 447,770 446,954 1,283,667 1,077,787 Second Lien Secured Debt: 7.5% senior secured notes due July 2025 591,124 589,073 8.0% senior secured notes due November 2026 832,441 - 1,423,565 589,073 Guaranteed Unsecured Debt: 6.125% senior notes due April 2023 90,360 1,145,060 90,360 1,145,060 Unguaranteed Unsecured Debt: 7.7% notes due February 2027 236,610 236,478 6.875% fixed-rate senior notes due December 2028 28,885 28,870 265,495 265,348 Lease financing obligations 23,120 28,166 Total debt 3,086,207 3,105,434 Current maturities of long-term debt and lease financing obligations (6,409) (8,840) Long-term debt and lease financing obligations, less current maturities 3,079,798$ 3,096,594$ Total debt, gross 3,130,233$ 3,148,043$ Less: Unamortized debt issuance costs (44,026) (42,609) Total Debt per balance sheet: 3,086,207$ 3,105,434$

($ in thousands) Leverage Ratio 23 Total Debt: $ 3,086,207 Less: Cash and cash equivalents (160,902) Net Debt $ 2,925,305 LTM Adjusted EBITDA: Retail Pharmacy Segment 279,896 Pharmacy Services Segment 157,769 LTM Adjusted EBITDA $ 437,665 Leverage Ratio 6.68 February 27, 2021