Attached files
| file | filename |
|---|---|
| EX-99.1 - EX-99.1 - Matson, Inc. | matx-20210415xex99d1.htm |
| 8-K - 8-K - Matson, Inc. | matx-20210415x8k.htm |
Exhibit 99.2
| 1 Preliminary First Quarter 2021 Earnings Supplement First Quarter 2021 Preliminary Earnings Supplement April 15, 2021 |
| 2 Preliminary First Quarter 2021 Earnings Supplement Forward-Looking Statements Statements made during this presentation that set forth expectations, predictions, projections or are about future events are based on facts and situations that are known to us as of April 15, 2021. We believe that our expectations and assumptions are reasonable. Actual results may differ materially, due to risks and uncertainties, such as those described on pages 12-21 of our Form 10-K filed on February 26, 2021 and other subsequent filings by Matson with the SEC. Statements made during this presentation are not guarantees of future performance. We do not undertake any obligation to update our forward-looking statements. |
| 3 Preliminary First Quarter 2021 Earnings Supplement Preliminary First Quarter 2021 Results • Off to a strong start to 2021 with continued solid performance in Ocean Transportation and Logistics • China service, consisting of CLX and CLX+, continued to see significant demand – Volume for e-commerce and other high demand goods remained elevated – resulted in very strong pre- and post- Lunar New Year volumes – Was the primary driver of the increase in consolidated operating income year-over-year • Expect significant demand for our expedited CLX and CLX+ services to remain throughout peak season into late October – Significant supply chain congestion continues, particularly at the California ports – will most likely persist through the second quarter and into the traditional peak season – Expect demand in the Transpacific tradelane to remain favorable as elevated consumption trends, including heightened e-commerce activity, are expected to continue beyond the second quarter • Ocean Transportation – China strength – CLX+ voyages and increased capacity in the CLX service – In other core tradelanes, continued to see steady demand for sustenance and home improvement goods with higher year-over-year volumes • Logistics – Continued elevated goods consumption and inventory restocking in addition to favorable supply and demand fundamentals in our core markets |
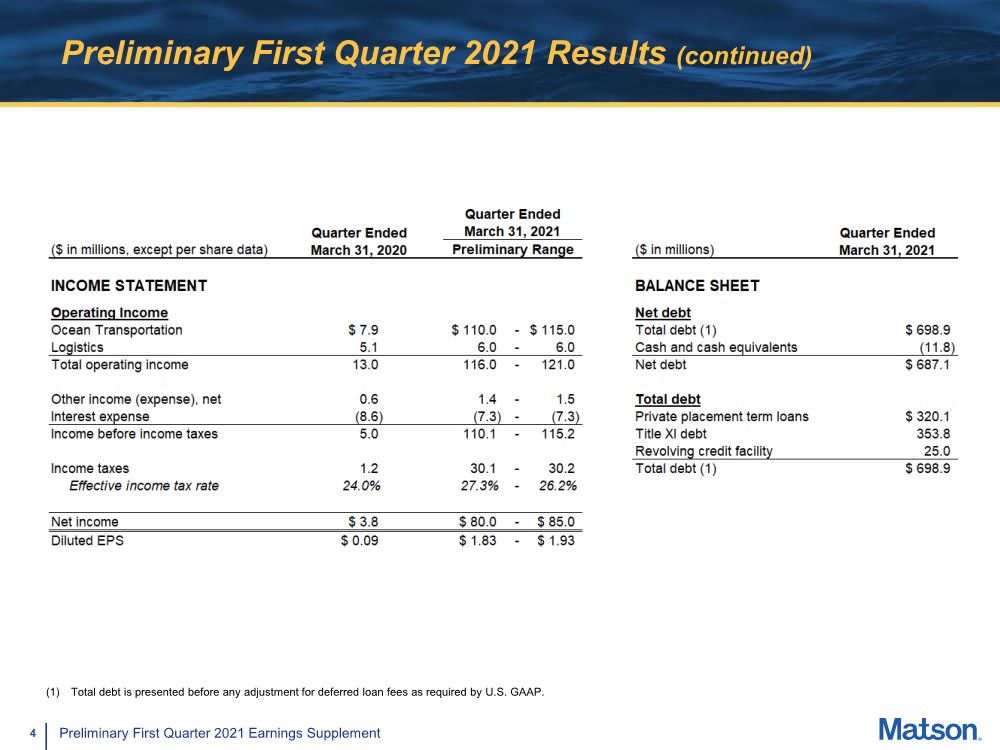
| 4 Preliminary First Quarter 2021 Earnings Supplement Preliminary First Quarter 2021 Results (continued) (1) Total debt is presented before any adjustment for deferred loan fees as required by U.S. GAAP. |
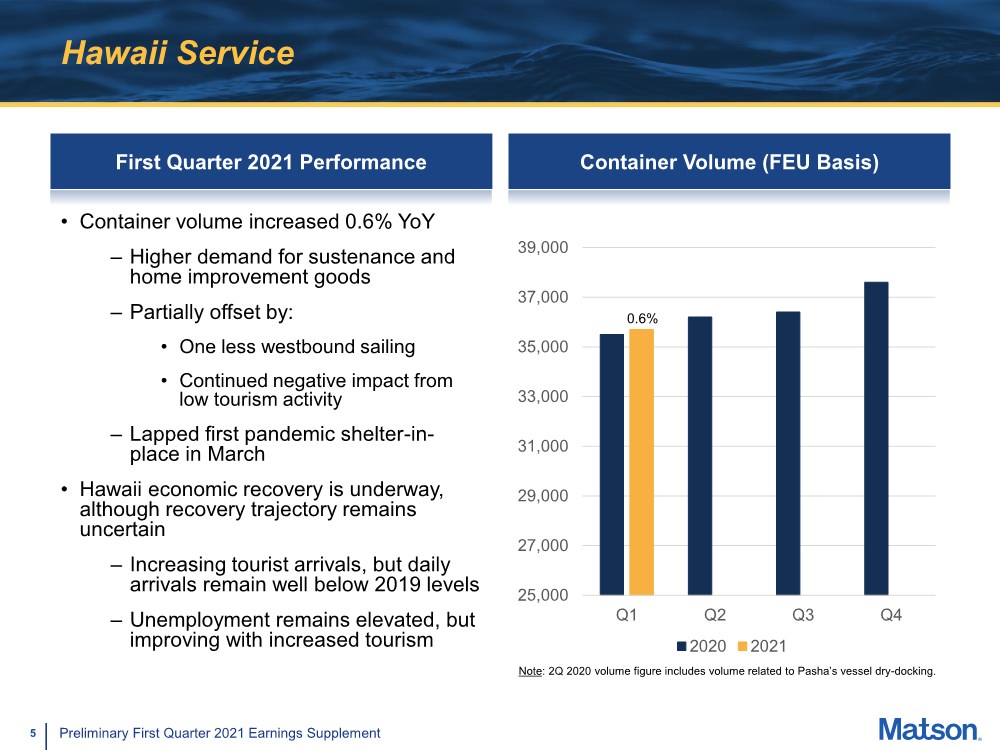
| 5 Preliminary First Quarter 2021 Earnings Supplement Hawaii Service First Quarter 2021 Performance • Container volume increased 0.6% YoY – Higher demand for sustenance and home improvement goods – Partially offset by: • One less westbound sailing • Continued negative impact from low tourism activity – Lapped first pandemic shelter-in- place in March • Hawaii economic recovery is underway, although recovery trajectory remains uncertain – Increasing tourist arrivals, but daily arrivals remain well below 2019 levels – Unemployment remains elevated, but improving with increased tourism Container Volume (FEU Basis) 25,000 27,000 29,000 31,000 33,000 35,000 37,000 39,000 Q1 Q2 Q3 Q4 2020 2021 Note: 2Q 2020 volume figure includes volume related to Pasha’s vessel dry-docking. 0.6% |
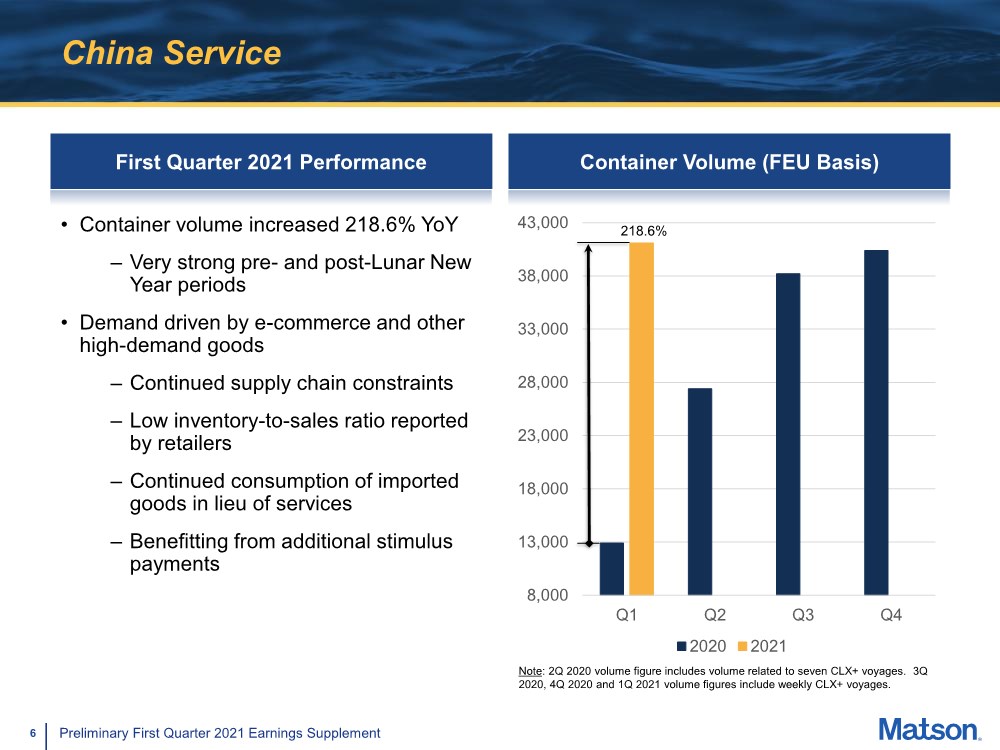
| 6 Preliminary First Quarter 2021 Earnings Supplement China Service First Quarter 2021 Performance Container Volume (FEU Basis) 8,000 13,000 18,000 23,000 28,000 33,000 38,000 43,000 Q1 Q2 Q3 Q4 2020 2021 Note: 2Q 2020 volume figure includes volume related to seven CLX+ voyages. 3Q 2020, 4Q 2020 and 1Q 2021 volume figures include weekly CLX+ voyages. 218.6% • Container volume increased 218.6% YoY – Very strong pre- and post-Lunar New Year periods • Demand driven by e-commerce and other high-demand goods – Continued supply chain constraints – Low inventory-to-sales ratio reported by retailers – Continued consumption of imported goods in lieu of services – Benefitting from additional stimulus payments |
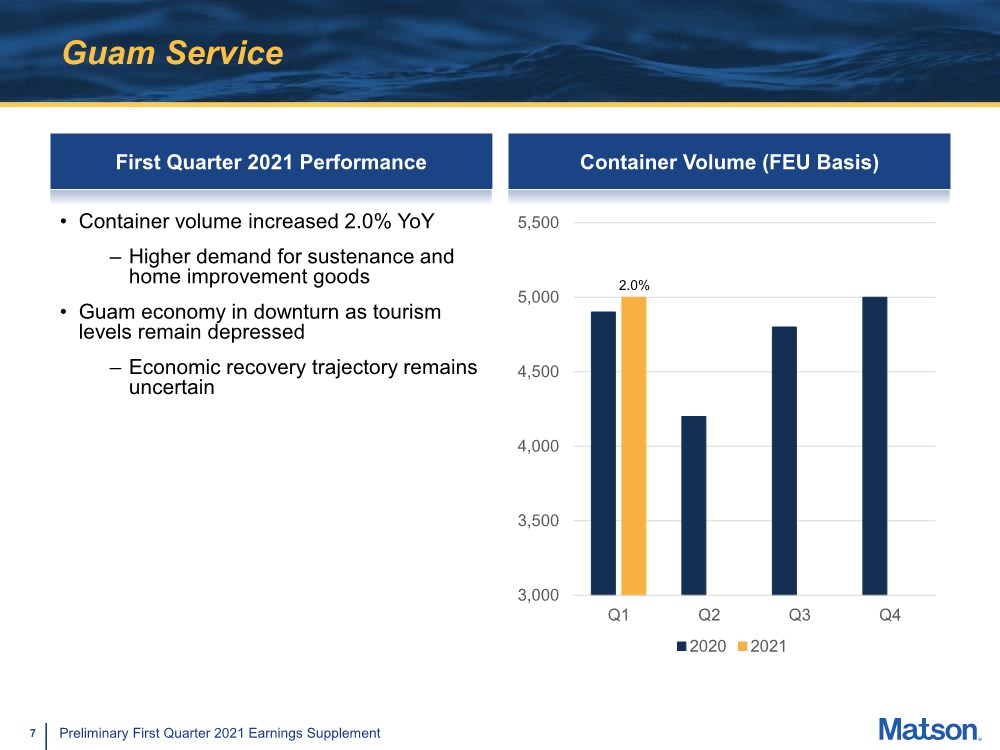
| 7 Preliminary First Quarter 2021 Earnings Supplement Guam Service First Quarter 2021 Performance Container Volume (FEU Basis) 3,000 3,500 4,000 4,500 5,000 5,500 Q1 Q2 Q3 Q4 2020 2021 2.0% • Container volume increased 2.0% YoY – Higher demand for sustenance and home improvement goods • Guam economy in downturn as tourism levels remain depressed – Economic recovery trajectory remains uncertain |
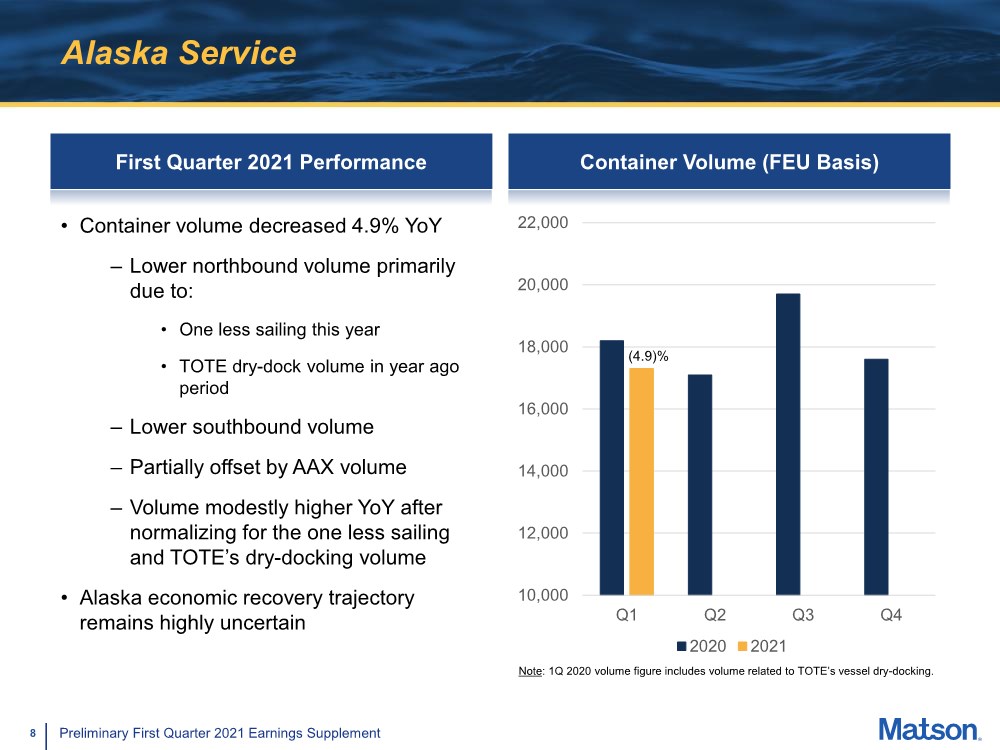
| 8 Preliminary First Quarter 2021 Earnings Supplement Alaska Service First Quarter 2021 Performance • Container volume decreased 4.9% YoY – Lower northbound volume primarily due to: • One less sailing this year • TOTE dry-dock volume in year ago period – Lower southbound volume – Partially offset by AAX volume – Volume modestly higher YoY after normalizing for the one less sailing and TOTE’s dry-docking volume • Alaska economic recovery trajectory remains highly uncertain Container Volume (FEU Basis) 10,000 12,000 14,000 16,000 18,000 20,000 22,000 Q1 Q2 Q3 Q4 2020 2021 (4.9)% Note: 1Q 2020 volume figure includes volume related to TOTE’s vessel dry-docking. |
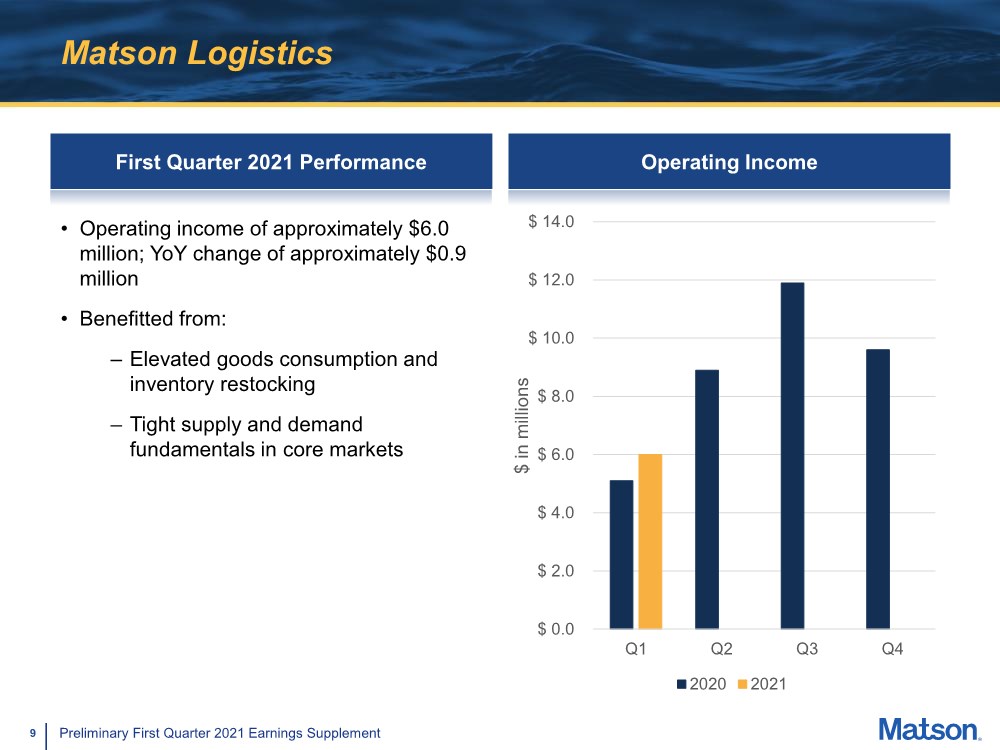
| 9 Preliminary First Quarter 2021 Earnings Supplement Matson Logistics First Quarter 2021 Performance Operating Income $ 0.0 $ 2.0 $ 4.0 $ 6.0 $ 8.0 $ 10.0 $ 12.0 $ 14.0 Q1 Q2 Q3 Q4 $ in millions 2020 2021 • Operating income of approximately $6.0 million; YoY change of approximately $0.9 million • Benefitted from: – Elevated goods consumption and inventory restocking – Tight supply and demand fundamentals in core markets |