Attached files
| file | filename |
|---|---|
| EX-99.1 - EX-99.1 - GOLDMAN SACHS GROUP INC | d150080dex991.htm |
| 8-K - 8-K - GOLDMAN SACHS GROUP INC | d150080d8k.htm |

Exhibit 99.2 First Quarter 2021 Earnings Results Presentation April 14, 2021
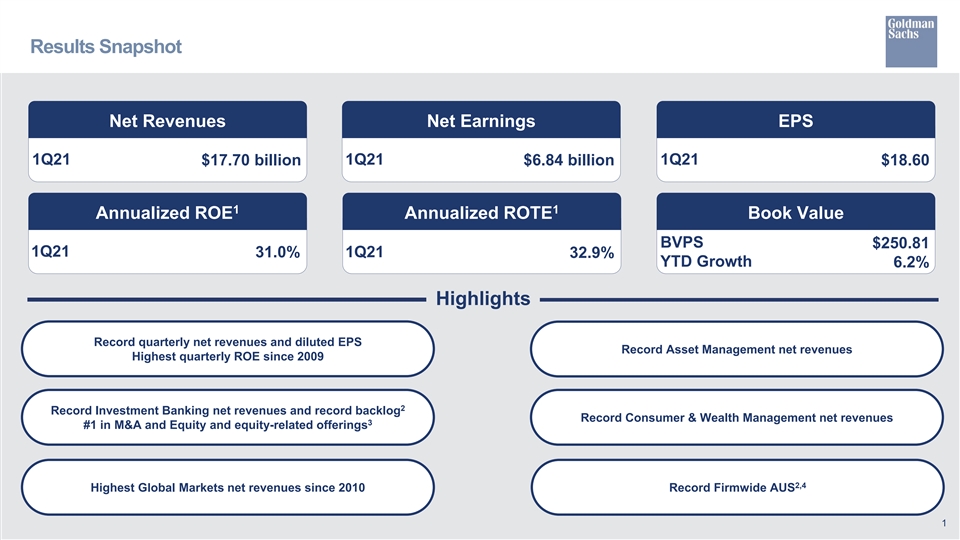
Results Snapshot Net Revenues Net Earnings EPS 1Q21 $17.70 billion 1Q21 $6.84 billion 1Q21 $18.60 1 1 Annualized ROE Annualized ROTE Book Value BVPS $250.81 1Q21 31.0% 1Q21 32.9% YTD Growth 6.2% Highlights Record quarterly net revenues and diluted EPS Record Asset Management net revenues Highest quarterly ROE since 2009 2 Record Investment Banking net revenues and record backlog Record Consumer & Wealth Management net revenues 3 #1 in M&A and Equity and equity-related offerings 2,4 Highest Global Markets net revenues since 2010 Record Firmwide AUS 1
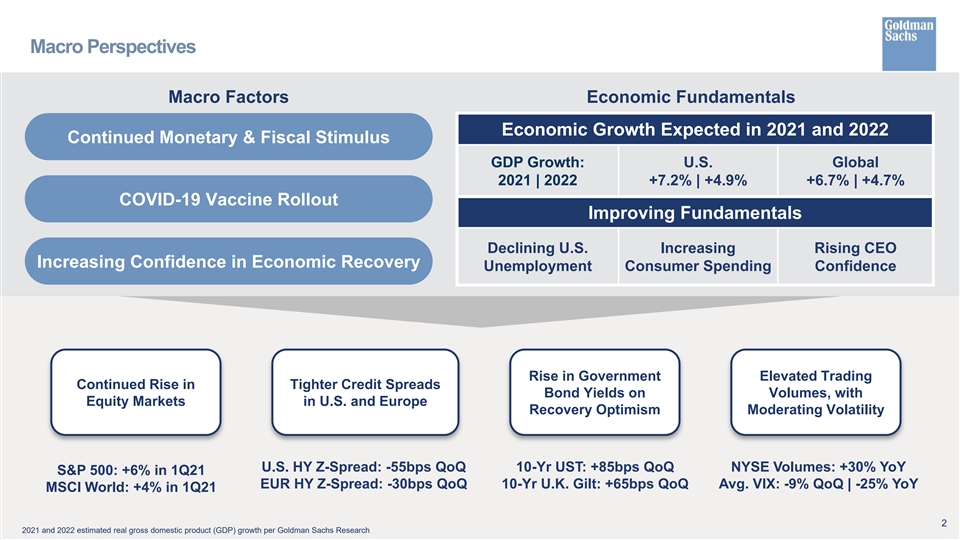
Macro Perspectives Macro Factors Economic Fundamentals Economic Growth Expected in 2021 and 2022 Continued Monetary & Fiscal Stimulus GDP Growth: U.S. Global 2021 | 2022 +7.2% | +4.9% +6.7% | +4.7% COVID-19 Vaccine Rollout Improving Fundamentals Declining U.S. Increasing Rising CEO Increasing Confidence in Economic Recovery Unemployment Consumer Spending Confidence Rise in Government Elevated Trading Continued Rise in Tighter Credit Spreads Bond Yields on Volumes, with Equity Markets in U.S. and Europe Recovery Optimism Moderating Volatility U.S. HY Z-Spread: -55bps QoQ 10-Yr UST: +85bps QoQ NYSE Volumes: +30% YoY S&P 500: +6% in 1Q21 EUR HY Z-Spread: -30bps QoQ 10-Yr U.K. Gilt: +65bps QoQ Avg. VIX: -9% QoQ | -25% YoY MSCI World: +4% in 1Q21 2 2021 and 2022 estimated real gross domestic product (GDP) growth per Goldman Sachs Research
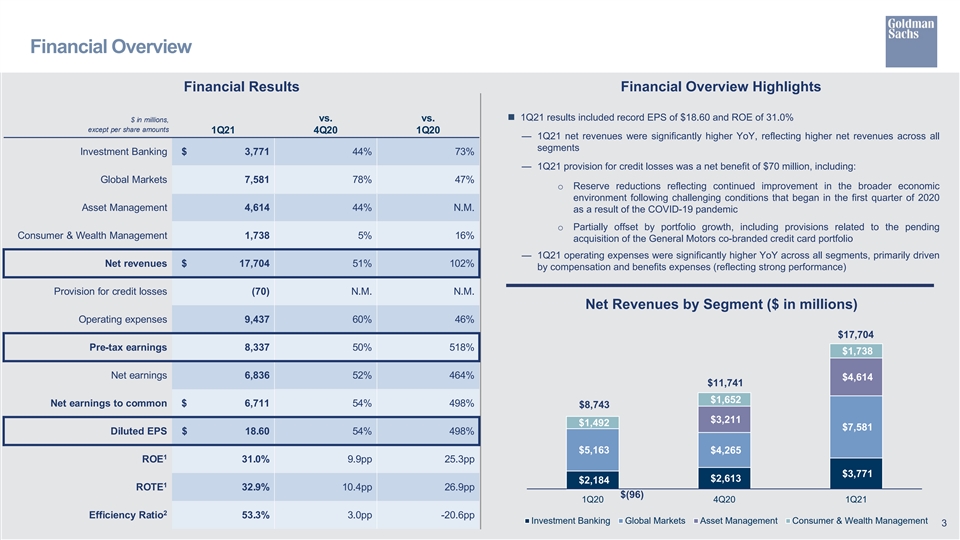
Financial Overview Financial Results Financial Overview Highlights n 1Q21 results included record EPS of $18.60 and ROE of 31.0% $ in millions, vs. vs. except per share amounts 1Q21 4Q20 1Q20 — 1Q21 net revenues were significantly higher YoY, reflecting higher net revenues across all segments Investment Banking $ 3,771 44% 73% — 1Q21 provision for credit losses was a net benefit of $70 million, including: Global Markets 7,581 78% 47% o Reserve reductions reflecting continued improvement in the broader economic environment following challenging conditions that began in the first quarter of 2020 Asset Management 4,614 44% N.M. as a result of the COVID-19 pandemic o Partially offset by portfolio growth, including provisions related to the pending Consumer & Wealth Management 1,738 5% 16% acquisition of the General Motors co-branded credit card portfolio — 1Q21 operating expenses were significantly higher YoY across all segments, primarily driven Net revenues $ 17,704 51% 102% by compensation and benefits expenses (reflecting strong performance) Provision for credit losses (70) N.M. N.M. Net Revenues by Segment ($ in millions) Operating expenses 9,437 60% 46% $17,704 Pre-tax earnings 8,337 50% 518% $1,738 Net earnings 6,836 52% 464% $4,614 $11,741 $1,652 Net earnings to common $ 6,711 54% 498% $8,743 $3,211 $1,492 $7,581 Diluted EPS $ 18.60 54% 498% $5,163 $4,265 1 ROE 31.0% 9.9pp 25.3pp $3,771 $2,613 $2,184 1 32.9% 10.4pp 26.9pp ROTE $(96) 1Q20 4Q20 1Q21 2 Efficiency Ratio 53.3% 3.0pp -20.6pp Investment Banking Global Markets Asset Management Consumer & Wealth Management 3
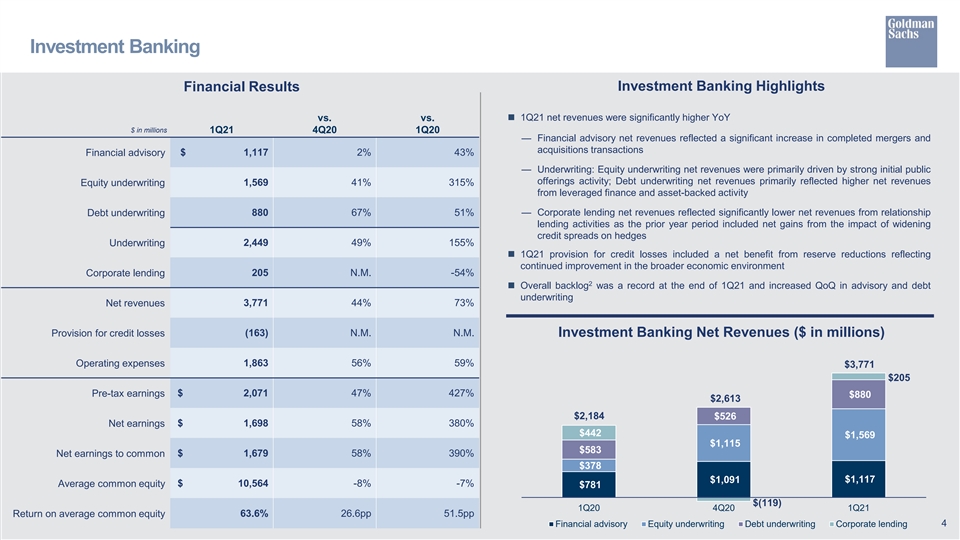
Investment Banking Financial Results Investment Banking Highlights vs. vs.n 1Q21 net revenues were significantly higher YoY $ in millions 1Q21 4Q20 1Q20 — Financial advisory net revenues reflected a significant increase in completed mergers and acquisitions transactions Financial advisory $ 1,117 2% 43% — Underwriting: Equity underwriting net revenues were primarily driven by strong initial public offerings activity; Debt underwriting net revenues primarily reflected higher net revenues Equity underwriting 1,569 41% 315% from leveraged finance and asset-backed activity Debt underwriting 880 67% 51% — Corporate lending net revenues reflected significantly lower net revenues from relationship lending activities as the prior year period included net gains from the impact of widening credit spreads on hedges Underwriting 2,449 49% 155% n 1Q21 provision for credit losses included a net benefit from reserve reductions reflecting continued improvement in the broader economic environment Corporate lending 205 N.M. -54% 2 n Overall backlog was a record at the end of 1Q21 and increased QoQ in advisory and debt underwriting 3,771 44% 73% Net revenues (163) N.M. N.M. Provision for credit losses Investment Banking Net Revenues ($ in millions) 1,863 56% 59% Operating expenses $3,771 $205 $ 2,071 47% 427% Pre-tax earnings $880 $2,613 $2,184 $526 Net earnings $ 1,698 58% 380% $442 $1,569 $1,115 $583 Net earnings to common $ 1,679 58% 390% $378 $1,091 $1,117 Average common equity $ 10,564 -8% -7% $781 $(119) 1Q20 4Q20 1Q21 Return on average common equity 63.6% 26.6pp 51.5pp Financial advisory Equity underwriting Debt underwriting Corporate lending 4
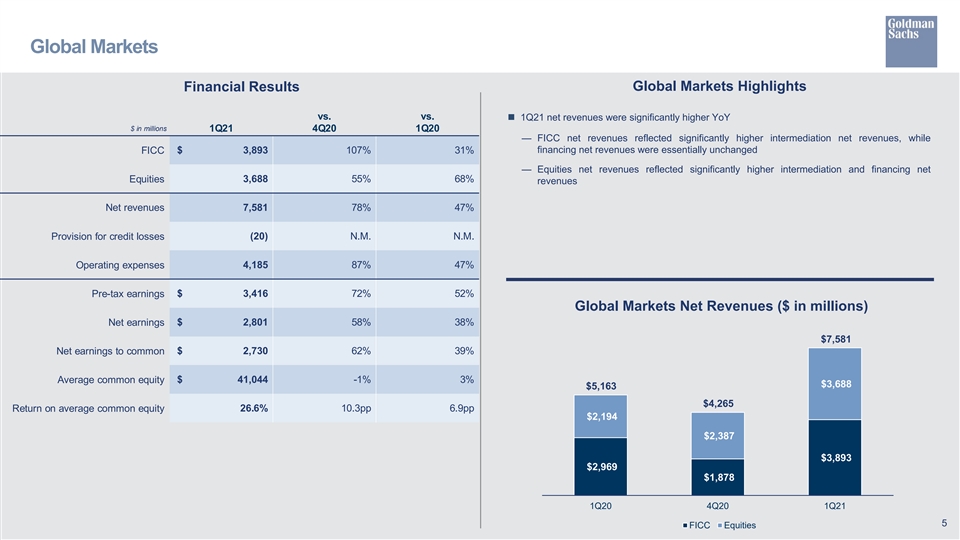
Global Markets Financial Results Global Markets Highlights vs. vs. n 1Q21 net revenues were significantly higher YoY $ in millions 1Q21 4Q20 1Q20 — FICC net revenues reflected significantly higher intermediation net revenues, while financing net revenues were essentially unchanged FICC $ 3,893 107% 31% — Equities net revenues reflected significantly higher intermediation and financing net 3,688 55% 68% Equities revenues Net revenues 7,581 78% 47% Provision for credit losses (20) N.M. N.M. 4,185 87% 47% Operating expenses Pre-tax earnings $ 3,416 72% 52% Global Markets Net Revenues ($ in millions) Net earnings $ 2,801 58% 38% $7,581 $ 2,730 62% 39% Net earnings to common Average common equity $ 41,044 -1% 3% $3,688 $5,163 $4,265 Return on average common equity 26.6% 10.3pp 6.9pp $2,194 $2,387 $3,893 $2,969 $1,878 1Q20 4Q20 1Q21 5 FICC Equities
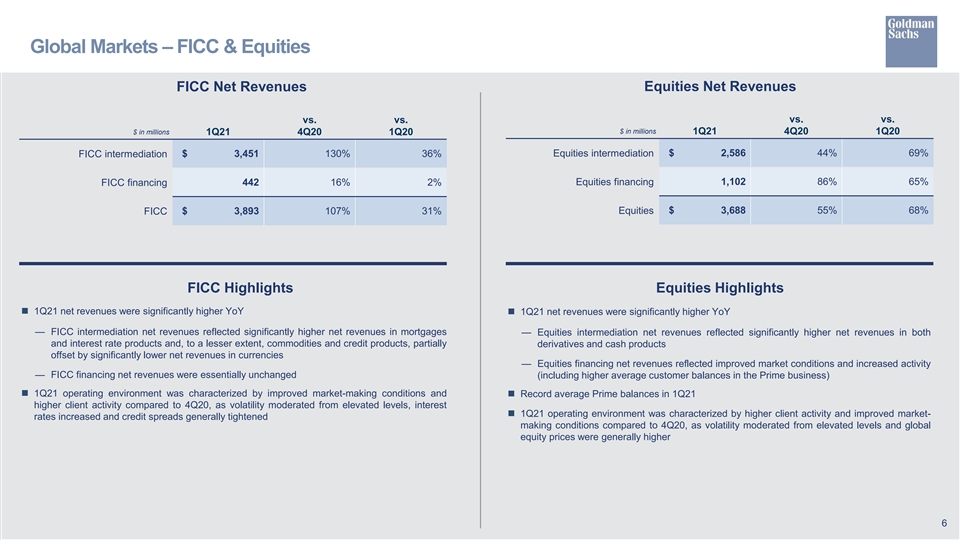
Global Markets – FICC & Equities FICC Net Revenues Equities Net Revenues vs. vs. vs. vs. $ in millions $ in millions 1Q21 4Q20 1Q20 1Q21 4Q20 1Q20 $ 2,586 44% 69% FICC intermediation $ 3,451 130% 36% Equities intermediation Equities financing 1,102 86% 65% FICC financing 442 16% 2% $ 3,893 107% 31% Equities $ 3,688 55% 68% FICC FICC Highlights Equities Highlights n 1Q21 net revenues were significantly higher YoY n 1Q21 net revenues were significantly higher YoY — FICC intermediation net revenues reflected significantly higher net revenues in mortgages — Equities intermediation net revenues reflected significantly higher net revenues in both and interest rate products and, to a lesser extent, commodities and credit products, partially derivatives and cash products offset by significantly lower net revenues in currencies — Equities financing net revenues reflected improved market conditions and increased activity — FICC financing net revenues were essentially unchanged (including higher average customer balances in the Prime business) n 1Q21 operating environment was characterized by improved market-making conditions andn Record average Prime balances in 1Q21 higher client activity compared to 4Q20, as volatility moderated from elevated levels, interest n 1Q21 operating environment was characterized by higher client activity and improved market- rates increased and credit spreads generally tightened making conditions compared to 4Q20, as volatility moderated from elevated levels and global equity prices were generally higher 6
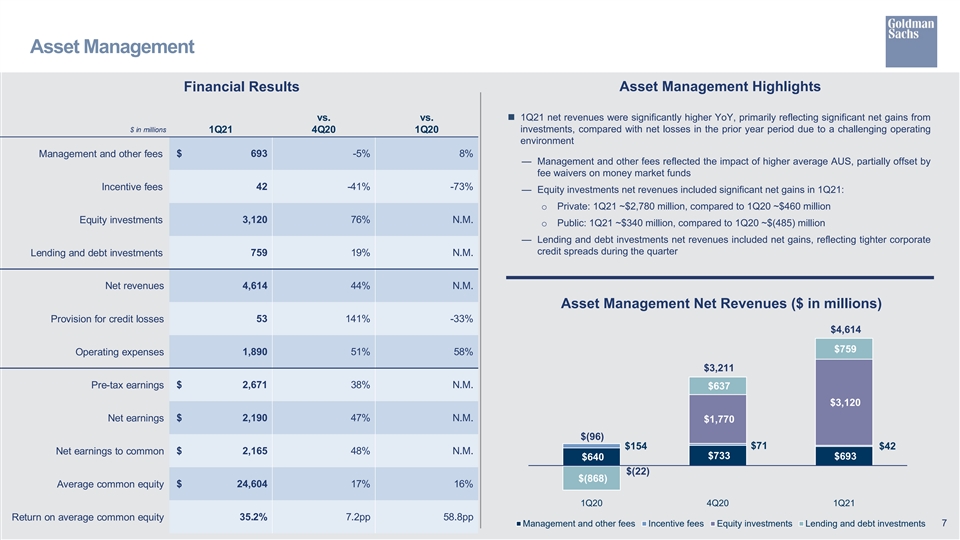
Asset Management Financial Results Asset Management Highlights vs. vs.n 1Q21 net revenues were significantly higher YoY, primarily reflecting significant net gains from $ in millions investments, compared with net losses in the prior year period due to a challenging operating 1Q21 4Q20 1Q20 environment Management and other fees $ 693 -5% 8% — Management and other fees reflected the impact of higher average AUS, partially offset by fee waivers on money market funds Incentive fees 42 -41% -73% — Equity investments net revenues included significant net gains in 1Q21: o Private: 1Q21 ~$2,780 million, compared to 1Q20 ~$460 million Equity investments 3,120 76% N.M. o Public: 1Q21 ~$340 million, compared to 1Q20 ~$(485) million — Lending and debt investments net revenues included net gains, reflecting tighter corporate credit spreads during the quarter Lending and debt investments 759 19% N.M. Net revenues 4,614 44% N.M. Asset Management Net Revenues ($ in millions) Provision for credit losses 53 141% -33% $4,614 $759 Operating expenses 1,890 51% 58% $3,211 Pre-tax earnings $ 2,671 38% N.M. $637 $3,120 $ 2,190 47% N.M. Net earnings $1,770 $(96) $71 $154 $42 $ 2,165 48% N.M. Net earnings to common $733 $640 $693 $(22) $(868) $ 24,604 17% 16% Average common equity 1Q20 4Q20 1Q21 35.2% 7.2pp 58.8pp Return on average common equity 7 Management and other fees Incentive fees Equity investments Lending and debt investments
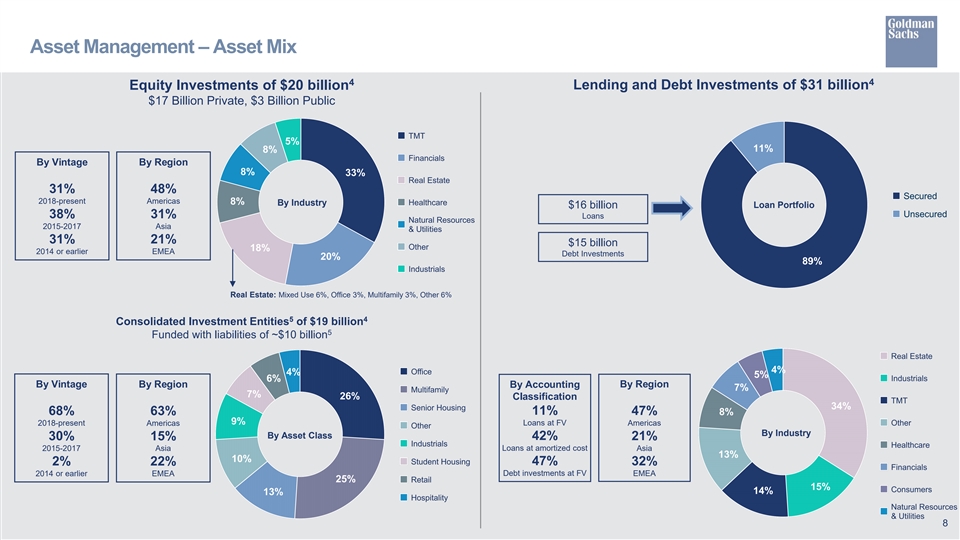
Asset Management – Asset Mix 4 4 Equity Investments of $20 billion Lending and Debt Investments of $31 billion $17 Billion Private, $3 Billion Public 5% 11% 8% By Vintage By Region 8% 33% 31% 48% 2018-present Americas 8% By Industry Loan Portfolio $16 billion 38% 31% Loans 2015-2017 Asia 31% 21% $15 billion 18% 2014 or earlier EMEA Debt Investments 20% 89% Real Estate: Mixed Use 6%, Office 3%, Multifamily 3%, Other 6% 5 4 Consolidated Investment Entities of $19 billion 5 Funded with liabilities of ~$10 billion 4% 4% 5% 6% By Vintage By Region By Accounting By Region 7% 7% 26% Classification 34% 68% 63% 11% 47% 8% 9% 2018-present Americas Loans at FV Americas By Industry By Asset Class 30% 15% 42% 21% 2015-2017 Asia Loans at amortized cost Asia 13% 10% 47% 32% 2% 22% 2014 or earlier EMEA Debt investments at FV EMEA 25% 15% 14% 13% 8
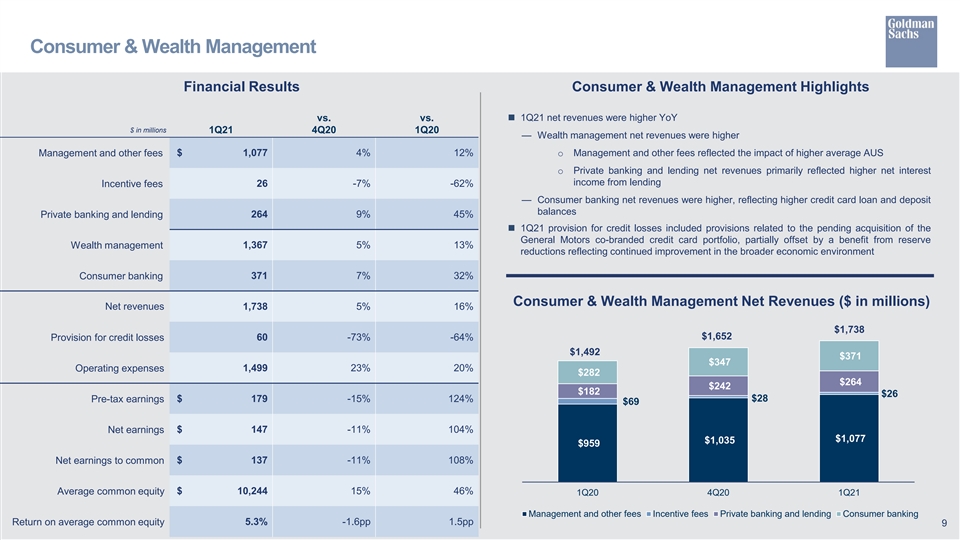
Consumer & Wealth Management Financial Results Consumer & Wealth Management Highlights vs. vs.n 1Q21 net revenues were higher YoY $ in millions 1Q21 4Q20 1Q20 — Wealth management net revenues were higher Management and other fees $ 1,077 4% 12% o Management and other fees reflected the impact of higher average AUS o Private banking and lending net revenues primarily reflected higher net interest income from lending Incentive fees 26 -7% -62% — Consumer banking net revenues were higher, reflecting higher credit card loan and deposit balances Private banking and lending 264 9% 45% n 1Q21 provision for credit losses included provisions related to the pending acquisition of the General Motors co-branded credit card portfolio, partially offset by a benefit from reserve 1,367 5% 13% Wealth management reductions reflecting continued improvement in the broader economic environment Consumer banking 371 7% 32% Consumer & Wealth Management Net Revenues ($ in millions) Net revenues 1,738 5% 16% $1,738 $1,652 Provision for credit losses 60 -73% -64% $1,492 $371 $347 1,499 23% 20% Operating expenses $282 $264 $242 $182 $26 Pre-tax earnings $ 179 -15% 124% $28 $69 Net earnings $ 147 -11% 104% $1,077 $1,035 $959 Net earnings to common $ 137 -11% 108% $ 10,244 15% 46% Average common equity 1Q20 4Q20 1Q21 Management and other fees Incentive fees Private banking and lending Consumer banking Return on average common equity 5.3% -1.6pp 1.5pp 9
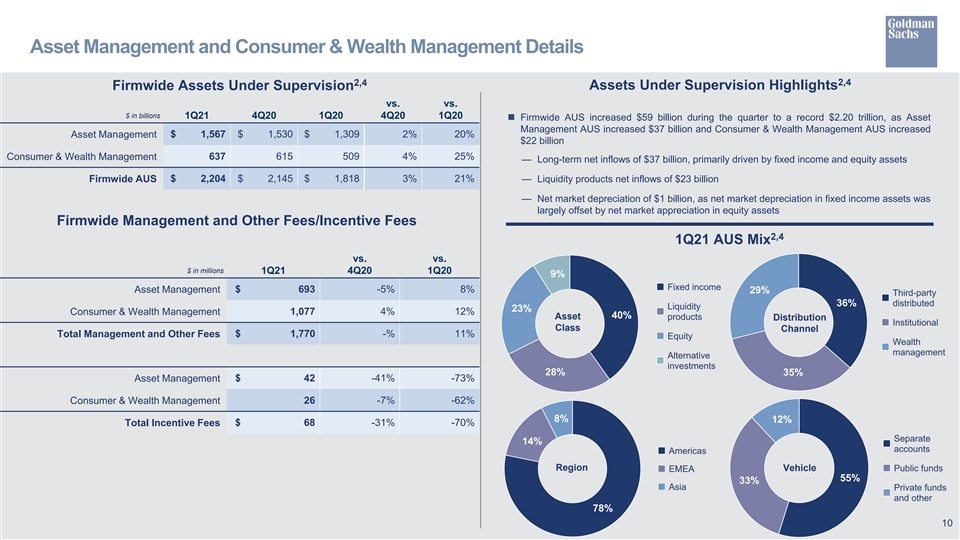
Asset Management and Consumer & Wealth Management Details 2,4 2,4 Firmwide Assets Under Supervision Assets Under Supervision Highlights vs. vs. $ in billions 1Q21 4Q20 1Q20 4Q20 1Q20 n Firmwide AUS increased $59 billion during the quarter to a record $2.20 trillion, as Asset Management AUS increased $37 billion and Consumer & Wealth Management AUS increased Asset Management $ 1,567 $ 1,530 $ 1,309 2% 20% $22 billion Consumer & Wealth Management 637 615 509 4% 25% — Long-term net inflows of $37 billion, primarily driven by fixed income and equity assets Firmwide AUS $ 2,204 $ 2,145 $ 1,818 3% 21% — Liquidity products net inflows of $23 billion — Net market depreciation of $1 billion, as net market depreciation in fixed income assets was largely offset by net market appreciation in equity assets Firmwide Management and Other Fees/Incentive Fees 2,4 1Q21 AUS Mix vs. vs. $ in millions 1Q21 4Q20 1Q20 9% Asset Management $ 693 -5% 8% 29% 36% 23% Consumer & Wealth Management 1,077 4% 12% 40% Asset Distribution Class Channel Total Management and Other Fees $ 1,770 -% 11% 28% 35% Asset Management $ 42 -41% -73% Consumer & Wealth Management 26 -7% -62% 8% 12% Total Incentive Fees $ 68 -31% -70% 14% Region Vehicle 55% 33% 78% 10
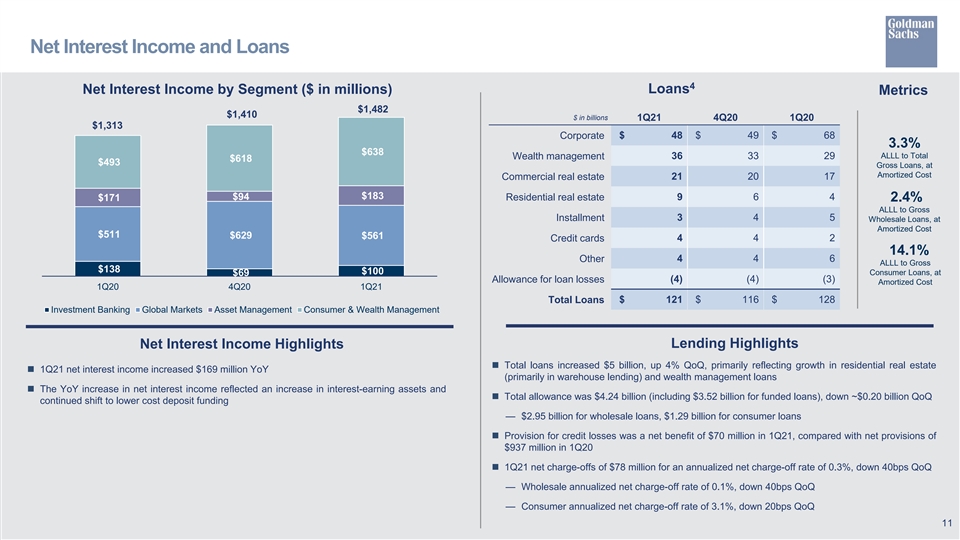
Net Interest Income and Loans 4 Loans Net Interest Income by Segment ($ in millions) Metrics $1,482 $1,410 $ in billions 1Q21 4Q20 1Q20 $1,313 Corporate $ 48 $ 49 $ 68 3.3% $638 36 33 29 ALLL to Total Wealth management $618 $493 Gross Loans, at Amortized Cost Commercial real estate 21 20 17 $183 $94 9 6 4 $171 Residential real estate 2.4% ALLL to Gross Installment 3 4 5 Wholesale Loans, at Amortized Cost $511 $629 $561 4 4 2 Credit cards 14.1% Other 4 4 6 ALLL to Gross $138 $100 Consumer Loans, at $69 (4) (4) (3) Allowance for loan losses Amortized Cost 1Q20 4Q20 1Q21 Total Loans $ 121 $ 116 $ 128 Investment Banking Global Markets Asset Management Consumer & Wealth Management Lending Highlights Net Interest Income Highlights n Total loans increased $5 billion, up 4% QoQ, primarily reflecting growth in residential real estate n 1Q21 net interest income increased $169 million YoY (primarily in warehouse lending) and wealth management loans n The YoY increase in net interest income reflected an increase in interest-earning assets and n Total allowance was $4.24 billion (including $3.52 billion for funded loans), down ~$0.20 billion QoQ continued shift to lower cost deposit funding — $2.95 billion for wholesale loans, $1.29 billion for consumer loans n Provision for credit losses was a net benefit of $70 million in 1Q21, compared with net provisions of $937 million in 1Q20 n 1Q21 net charge-offs of $78 million for an annualized net charge-off rate of 0.3%, down 40bps QoQ — Wholesale annualized net charge-off rate of 0.1%, down 40bps QoQ — Consumer annualized net charge-off rate of 3.1%, down 20bps QoQ 11

Expenses Expense Highlights Financial Results n 1Q21 total operating expenses increased significantly YoY vs. vs. 1Q21 4Q20 1Q20 $ in millions — Compensation and benefits expenses up 87% (reflecting strong performance) — Non-compensation expenses up 5%, reflecting: Compensation and benefits $ 6,043 144% 87% o Significantly higher transaction based expenses (reflecting an increase in activity levels) Transaction based 1,256 16% 22% o Higher technology expenses o Lower net provisions for litigation and regulatory proceedings 80 -10% -48% Market development o Lower travel and entertainment expenses (included in market development expenses) and lower expenses related to consolidated investments (including 375 10% 17% Communications and technology impairments) n 1Q21 effective income tax rate was 18.0%, down from the full year rate of 24.2% for 2020, 498 -% 14% Depreciation and amortization primarily due to the impact of non-deductible litigation in 2020 and the impact of tax benefits on the settlement of employee share-based awards in the first quarter of 2021 Occupancy 247 -3% 4% 2 Efficiency Ratio Professional fees 360 3% 4% 73.9% Other expenses 578 -29% -17% 53.3% Total operating expenses $ 9,437 60% 46% Provision for taxes $ 1,501 45% N.M. Effective Tax Rate 18.0% 1Q20 1Q21 12
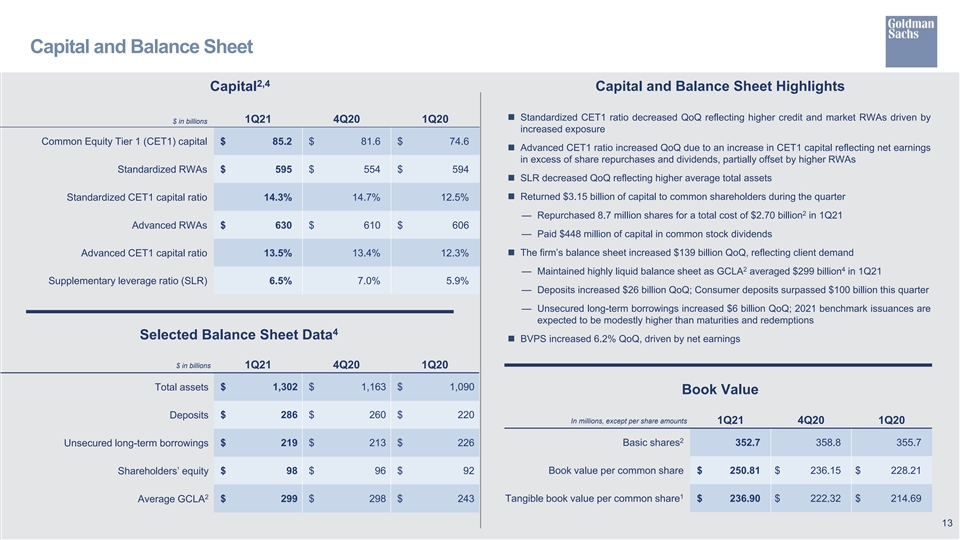
Capital and Balance Sheet 2,4 Capital Capital and Balance Sheet Highlights n Standardized CET1 ratio decreased QoQ reflecting higher credit and market RWAs driven by 1Q21 4Q20 1Q20 $ in billions increased exposure Common Equity Tier 1 (CET1) capital $ 85.2 $ 81.6 $ 74.6 n Advanced CET1 ratio increased QoQ due to an increase in CET1 capital reflecting net earnings in excess of share repurchases and dividends, partially offset by higher RWAs Standardized RWAs $ 595 $ 554 $ 594 n SLR decreased QoQ reflecting higher average total assets n Returned $3.15 billion of capital to common shareholders during the quarter Standardized CET1 capital ratio 14.3% 14.7% 12.5% 2 — Repurchased 8.7 million shares for a total cost of $2.70 billion in 1Q21 Advanced RWAs $ 630 $ 610 $ 606 — Paid $448 million of capital in common stock dividends Advanced CET1 capital ratio 13.5% 13.4% 12.3%n The firm’s balance sheet increased $139 billion QoQ, reflecting client demand 2 4 — Maintained highly liquid balance sheet as GCLA averaged $299 billion in 1Q21 Supplementary leverage ratio (SLR) 6.5% 7.0% 5.9% — Deposits increased $26 billion QoQ; Consumer deposits surpassed $100 billion this quarter — Unsecured long-term borrowings increased $6 billion QoQ; 2021 benchmark issuances are expected to be modestly higher than maturities and redemptions 4 Selected Balance Sheet Data n BVPS increased 6.2% QoQ, driven by net earnings $ in billions 1Q21 4Q20 1Q20 $ 1,302 $ 1,163 $ 1,090 Total assets Book Value $ 286 $ 260 $ 220 Deposits In millions, except per share amounts 1Q21 4Q20 1Q20 2 Unsecured long-term borrowings $ 219 $ 213 $ 226 Basic shares 352.7 358.8 355.7 Shareholders’ equity $ 98 $ 96 $ 92 Book value per common share $ 250.81 $ 236.15 $ 228.21 2 1 Average GCLA $ 299 $ 298 $ 243 Tangible book value per common share $ 236.90 $ 222.32 $ 214.69 13
Cautionary Note Regarding Forward-Looking Statements This presentation contains “forward-looking statements” within the meaning of the safe harbor provisions of the U.S. Private Securities Litigation Reform Act of 1995. Forward-looking statements are not historical facts or statements of current conditions, but instead represent only the firm’s beliefs regarding future events, many of which, by their nature, are inherently uncertain and outside of the firm’s control. It is possible that the firm’s actual results, financial condition and liquidity may differ, possibly materially, from the anticipated results, financial condition and liquidity in these forward-looking statements. For information about some of the risks and important factors that could affect the firm’s future results, financial condition and liquidity and the forward-looking statements below, see “Risk Factors” in Part I, Item 1A of the firm’s Annual Report on Form 10-K for the year ended December 31, 2020. Information regarding the firm’s assets under supervision, capital ratios, risk-weighted assets, supplementary leverage ratio, balance sheet data and global core liquid assets (GCLA) consists of preliminary estimates. These estimates are forward-looking statements and are subject to change, possibly materially, as the firm completes its financial statements. Statements regarding (i) estimated GDP growth, (ii) the impact of the COVID-19 pandemic on the firm’s business, results, financial position and liquidity, (iii) the timing, profitability, benefits and other prospective aspects of business initiatives and the achievability of medium- and long-term targets and goals, (iv) the future state of the firm’s liquidity and regulatory capital ratios, (v) the firm’s prospective capital distributions (including dividends and repurchases), (vi) the firm’s future effective income tax rate, (vii) the firm’s investment banking transaction backlog, and (viii) the firm’s planned 2021 debt benchmark issuances are forward-looking statements. Statements regarding estimated GDP growth are subject to the risk that actual GDP growth may differ, possibly materially, due to, among other things, changes in general economic conditions. Statements about the effects of the COVID-19 pandemic on the firm’s business, results, financial position and liquidity are subject to the risk that the actual impact may differ, possibly materially, from what is currently expected. Statements about the timing, profitability, benefits and other prospective aspects of business initiatives and the achievability of medium and long-term targets and goals are based on the firm’s current expectations regarding the firm’s ability to implement these initiatives and achieve these targets and goals and may change, possibly materially, from what is currently expected. Statements about the future state of the firm’s liquidity and regulatory capital ratios, as well as its prospective capital distributions, are subject to the risk that the firm’s actual liquidity, regulatory capital ratios and capital distributions may differ, possibly materially, from what is currently expected. Statements about the firm’s future effective income tax rate are subject to the risk that the firm’s future effective income tax rate may differ from the anticipated rate indicated, possibly materially, due to, among other things, changes in the tax rates applicable to the firm, the firm’s earnings mix or profitability, the entities in which the firm generates profits and the assumptions made in forecasting the firm’s expected tax rate, and potential future guidance from the U.S. IRS. Statements about the firm’s investment banking transaction backlog are subject to the risk that transactions may be modified or may not be completed at all and related net revenues may not be realized or may be materially less than expected. Important factors that could have such a result include, for underwriting transactions, a decline or weakness in general economic conditions, an outbreak of hostilities, volatility in the securities markets or an adverse development with respect to the issuer of the securities and, for financial advisory transactions, a decline in the securities markets, an inability to obtain adequate financing, an adverse development with respect to a party to the transaction or a failure to obtain a required regulatory approval. Statements regarding the firm’s planned 2021 debt benchmark issuances are subject to the risk that actual issuances may differ, possibly materially, due to changes in market conditions, business opportunities or the firm’s funding needs. 14
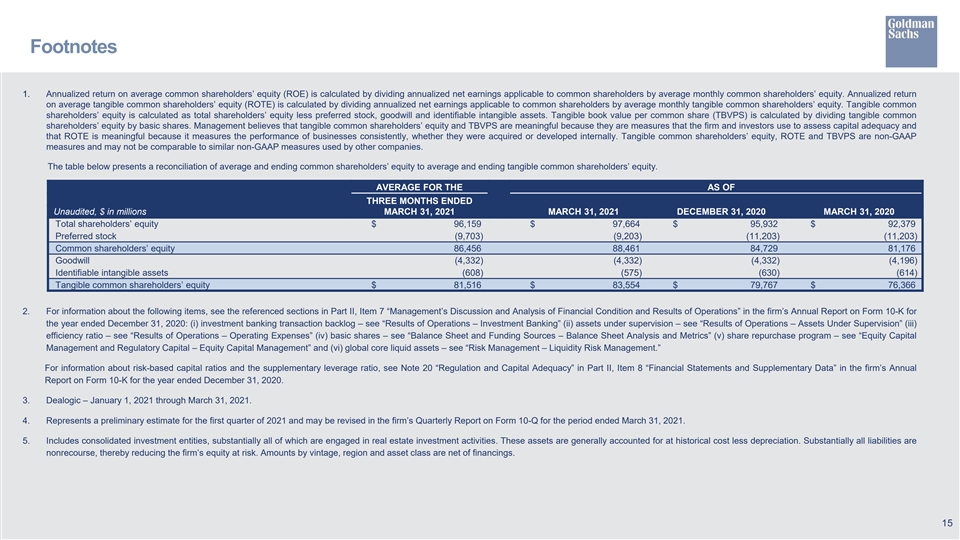
Footnotes 1. Annualized return on average common shareholders’ equity (ROE) is calculated by dividing annualized net earnings applicable to common shareholders by average monthly common shareholders’ equity. Annualized return on average tangible common shareholders’ equity (ROTE) is calculated by dividing annualized net earnings applicable to common shareholders by average monthly tangible common shareholders’ equity. Tangible common shareholders’ equity is calculated as total shareholders’ equity less preferred stock, goodwill and identifiable intangible assets. Tangible book value per common share (TBVPS) is calculated by dividing tangible common shareholders’ equity by basic shares. Management believes that tangible common shareholders’ equity and TBVPS are meaningful because they are measures that the firm and investors use to assess capital adequacy and that ROTE is meaningful because it measures the performance of businesses consistently, whether they were acquired or developed internally. Tangible common shareholders’ equity, ROTE and TBVPS are non-GAAP measures and may not be comparable to similar non-GAAP measures used by other companies. The table below presents a reconciliation of average and ending common shareholders’ equity to average and ending tangible common shareholders’ equity. AVERAGE FOR THE AS OF THREE MONTHS ENDED Unaudited, $ in millions MARCH 31, 2021 MARCH 31, 2021 DECEMBER 31, 2020 MARCH 31, 2020 Total shareholders’ equity $ 96,159 $ 97,664 $ 95,932 $ 92,379 Preferred stock (9,703) (9,203) (11,203) (11,203) Common shareholders’ equity 86,456 88,461 84,729 81,176 Goodwill (4,332) (4,332) (4,332) (4,196) Identifiable intangible assets (608) (575) (630) (614) Tangible common shareholders’ equity $ 81,516 $ 83,554 $ 79,767 $ 76,366 2. For information about the following items, see the referenced sections in Part II, Item 7 “Management’s Discussion and Analysis of Financial Condition and Results of Operations” in the firm’s Annual Report on Form 10-K for the year ended December 31, 2020: (i) investment banking transaction backlog – see “Results of Operations – Investment Banking” (ii) assets under supervision – see “Results of Operations – Assets Under Supervision” (iii) efficiency ratio – see “Results of Operations – Operating Expenses” (iv) basic shares – see “Balance Sheet and Funding Sources – Balance Sheet Analysis and Metrics” (v) share repurchase program – see “Equity Capital Management and Regulatory Capital – Equity Capital Management” and (vi) global core liquid assets – see “Risk Management – Liquidity Risk Management.” For information about risk-based capital ratios and the supplementary leverage ratio, see Note 20 “Regulation and Capital Adequacy” in Part II, Item 8 “Financial Statements and Supplementary Data” in the firm’s Annual Report on Form 10-K for the year ended December 31, 2020. 3. Dealogic – January 1, 2021 through March 31, 2021. 4. Represents a preliminary estimate for the first quarter of 2021 and may be revised in the firm’s Quarterly Report on Form 10-Q for the period ended March 31, 2021. 5. Includes consolidated investment entities, substantially all of which are engaged in real estate investment activities. These assets are generally accounted for at historical cost less depreciation. Substantially all liabilities are nonrecourse, thereby reducing the firm’s equity at risk. Amounts by vintage, region and asset class are net of financings. 15