Attached files
| file | filename |
|---|---|
| EX-99.2 - EX-99.2 - BED BATH & BEYOND INC | exhibit992-q4fy20irprese.htm |
| 8-K - 8-K - BED BATH & BEYOND INC | bbby-20210414.htm |
Exhibit 99.1
BED BATH & BEYOND INC. REPORTS FISCAL 2020 FOURTH QUARTER & FULL YEAR RESULTS
DELIVERS 3RD CONSECUTIVE QUARTER OF COMPARABLE SALES AND PROFIT GROWTH
COMPLETES FISCAL YEAR 2020, A YEAR OF FAST-PACED TRANSFORMATION
ENHANCES STRATEGIC POSITIONING FOR FISCAL 2021; STRENGTHENS 3-YEAR PLAN
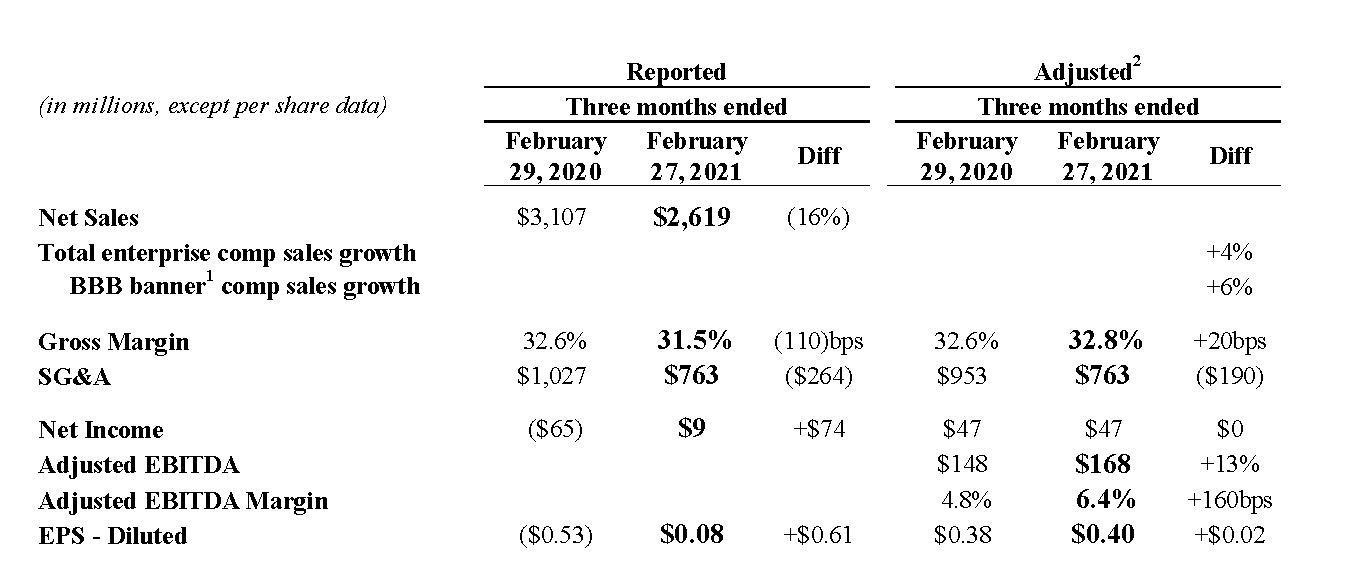
•3rd Consecutive Quarter of Comparable Sales Growth, +4% (Total Enterprise); +6% (BBB banner1)
•Q4 GAAP Net Income of $9 Million; Adjusted Net Income of $47 Million
•Q4 GAAP EPS - Diluted $0.08; Adjusted EPS - Diluted $0.40
•Q4 Adjusted EBITDA Increases 13% to $168 Million; Adjusted EBITDA Margin Increases 160 bps to 6.4%
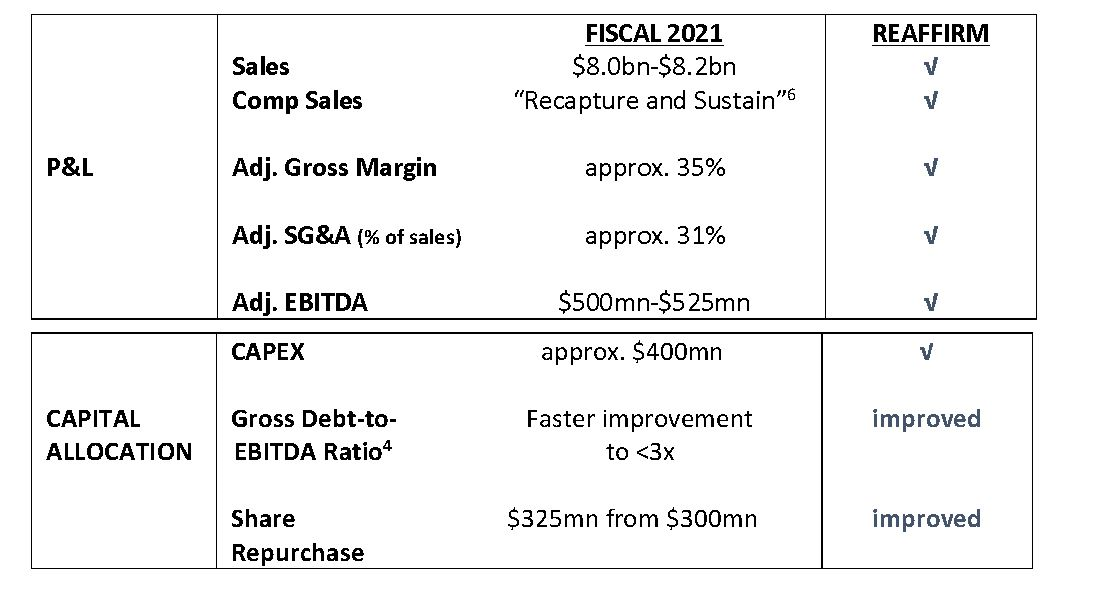
•Reaffirms Fiscal 2021 Outlook on Net Sales of $8.0-$8.2 Billion and Adjusted EBITDA of $500-$525 Million
•Projects Faster Improvement of Gross Debt-to-EBITDA Ratio of <3x in Fiscal 2021
•Increases 3-Year Share Repurchase Program to $1 Billion from $825 Million
•Continues Positive Net Sales Trends In Early Fiscal 2021; Expects Q1 Core Banner1 Sales Growth of +65 to +70%
UNION, New Jersey, April 14, 2021 --- Bed Bath & Beyond Inc. (Nasdaq: BBBY) today reported financial results for the fourth quarter of fiscal 2020 ended February 27, 2021.
Mark Tritton, Bed Bath & Beyond’s President and CEO said, “Fiscal 2020 was a year of fast-paced transformation in which we reformed the past, overcame extraordinary circumstances of the present, and established a firm foundation for the future. Despite the challenges created by the COVID-19 pandemic, we relentlessly focused on taking purposeful and bold steps to transform our entire organization and remained true to our plans to rebuild our authority in Home and restore this iconic Company. Importantly, we prioritized the health and wellbeing of our associate teams, customers and communities and I am so proud of how our people have come together to deliver for one another and the millions of people who count on us.
“We are excited to start fresh in 2021 with our sharpened size and scale, a healthier portfolio of core banners and a stronger financial position to execute the first phase of our 3-year transformation journey. As our transformation continues to take hold, we will show up differently for our customers with enhanced omnichannel experiences and modern stores, new communications and differentiated Owned Brands that will elevate the shopping experience and make it even easier to shop with the new Bed Bath & Beyond.”
Q4 Highlights
•3rd Consecutive Quarter of Comparable Sales Growth
◦+4% Comp Sales growth on Total Enterprise, including digital comp growth of +86%
◦+6% Comp Sales growth on Bed Bath & Beyond banner, including digital comp growth of +99%
◦+12% Comp Sales growth in Bed Bath & Beyond’s Top 5 destination categories combined
•Consistent Execution of Transformation Strategy Drives Earnings Growth
◦31.5% Gross Margin; Adjusted Gross Margin increases 20bps to 32.8%
◦13% increase in Adjusted EBITDA2 to $168 million; 160bps expansion in Adjusted EBITDA Margin2 to 6.4%
◦$9 million of GAAP Net Income; Adjusted Net Income of $47 million
◦$0.08 of Reported Net Earnings per Diluted Share; excluding special items, Adjusted Net Earnings per Diluted
Share2 of $0.40
Fiscal 2020 Highlights
•Demonstrated business agility and financial strength during year of unprecedented challenges; Built robust foundation to successfully execute 3-year growth plan
◦3 consecutive quarters of comparable sales growth and adjusted gross margin improvement
◦$3+ billion in digital sales
◦+10.6 million new digital customers (+95% vs fiscal 2019), of which 5 million are new to brand
◦37% of digital revenue fulfilled by stores; including 14% Buy Online Pickup In Store (BOPIS)
◦$1 billion approximate reduction in gross debt3
◦$375 million in capital return to shareholders through accelerated share repurchases of approximately 16 million shares, representing approximately 13% of shares outstanding, at an estimated average share price of $23 per share
◦$2.1 billion in liquidity4
◦144 Bed Bath & Beyond stores closed as part of network optimization program, ahead of schedule
◦5th non-core banner divested (Cost Plus World Market); portfolio transformation complete
Fiscal 2021 Outlook
•Year of Fast-Paced Transformation Expected to Enhance Strategic Position for Sustained Success
•Reaffirming fiscal 2021 outlook for Net Sales and Adjusted EBITDA of between $8.0 - $8.2 billion and between $500 - $525 million, respectively
•Expecting to launch at least 8 customer-inspired Owned Brands, including first quarter launches of Nestwell™, Haven™ and Simply Essential™
•Projecting faster improvement in gross debt-to-EBITDA ratio to <3x in fiscal 2021
•Investing in growth and transformation with CAPEX spend of approximately $400 million
•Strengthening capital return to shareholders by increasing 3-year share repurchase authorization program to $1 billion from $825 million; increasing fiscal 2021 share repurchases to $325 million from $300 million
Fiscal 2020 Fourth Quarter Highlights (December-January-February)
•Comparable sales increased for the third consecutive quarter, with Total Enterprise comparable sales growth of 4%, led by strong digital growth of approximately 86%. Comparable store sales decreased 20%.
▪The Bed Bath & Beyond banner had comparable sales growth of 6%, benefitting from strong digital growth of approximately 99%, and was driven by key destination categories including Bedding, Bath, Kitchen Food Prep, Indoor Décor and Home Organization. These top 5 categories had strong comp sales growth of 12% (combined) and represented almost two-thirds of total Bed Bath & Beyond banner sales in the fourth quarter.
▪The buybuy BABY banner returned to delivering comparable sales growth in the quarter, led by strong digital growth of over 50%, which represented almost two-thirds of BABY banner sales.
•Net sales of $2.6 billion decreased 16% compared to the prior year period, driven by impacts from previously planned non-core banner divestitures and permanent store closures. Excluding these impacts of approximately 12%, Core banner1 net sales decreased approximately 3%, primarily due to store closing activity consistent with the Company’s network optimization program. Total store net sales decreased 27%, and total digital net sales increased 86%.
•Gross margin of 31.5% decreased 110 basis points compared to the prior year period. Excluding special items, adjusted gross margin2 increased 20 basis points to 32.8%, primarily driven by optimization of promotion and markdowns, favorable product mix and leverage of distribution and fulfillment costs, partially offset by higher digital channel mix, including significant industrywide freight cost increases.
•SG&A expense of $763 million decreased $264 million compared to the prior year period. Adjusted SG&A2 expense decreased $190 million compared to the prior year period, driven primarily by reductions from the non-core banner divestitures and lower occupancy expense on a smaller base of stores.
•Net earnings per diluted share of $0.08 includes approximately $38 million from special items. Excluding special items, adjusted net earnings per diluted share2 was $0.40. Special items include the net loss on sale of businesses, non-cash impairment charges related to certain store-level assets, charges recorded in connection with the restructuring and transformation initiatives, which includes markdowns and inventory reserves related to the planned assortment transition to Owned Brands and the income tax impact of these items.
•Adjusted EBITDA2 increased 13% to $168 million, primarily due to higher comparable sales coupled with adjusted gross margin expansion and SG&A expense reduction.
•Cash flow from operations of $76 million and $14 million used in cash flow from investing, inclusive of $66 million of capital expenditures. Positive free cash flow2 of $62 million.
•Cash, cash equivalents and restricted cash balance of approximately $1.4 billion increased $384 million compared to the prior year period.
•Total Liquidity4 of approximately $2.1 billion, including the Company’s asset based revolving credit facility.
Fiscal 2021 Outlook
During the Company’s fiscal fourth quarter conference call with analysts and investors, it will discuss its outlook for fiscal 2021 and its long-term financial goals to strengthen and accelerate growth and unlock and drive sustainable total shareholder return. With the non-core banner divestitures now complete, the Company is reaffirming its previously communicated fiscal 2021 Net Sales and Adjusted EBITDA outlook of between $8.0 - $8.2 billion and between $500 - $525 million, respectively. The Company also announced an increase in its 3-year share repurchase program to $1 billion from $825 million.
Fiscal 2021 Full-Year Outlook:
Fiscal 2021 First Quarter Outlook:
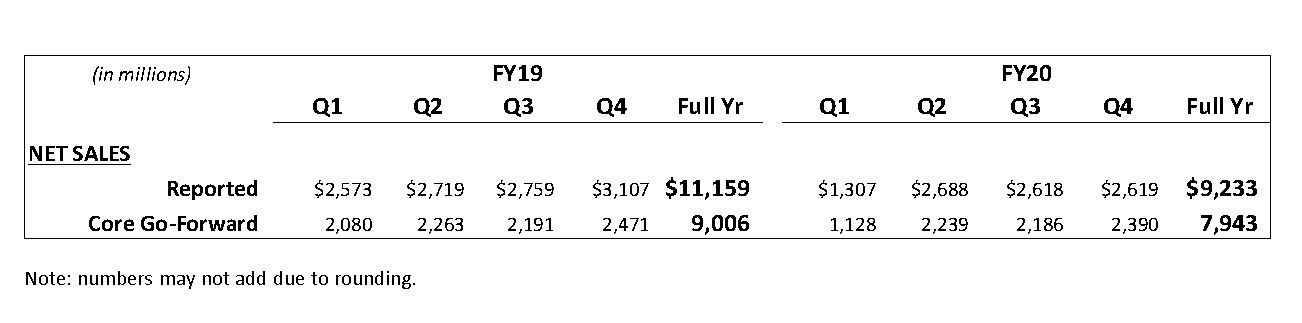
The Company’s fiscal 2021 first quarter net sales will be impacted by comparisons to last year when the majority of its stores were closed due to the COVID-19 pandemic, as well as by non-core banner divestitures and its ongoing fleet optimization program. To provide further perspective on its portfolio transformation and the quarterly comparisons of Core Go-Forward
banners, the Company has provided below a quarterly summary of fiscal 2019 and 2020 net sales, on both a reported basis and on a Core Go-Forward basis. The Core Go-Forward banners include Bed Bath & Beyond, buybuy BABY, Harmon Face Values and Decorist.
Directionally, the Company expects its fiscal 2021 first quarter net sales, on a reported basis, to increase by over 40% versus the prior year period when the vast majority of its stores were closed due to the COVID-19 pandemic and in spite of non-core banner divestitures. Excluding the impact from divested businesses in both periods, the Company expects first quarter net sales growth of its Core Go-Forward banners to be much higher by approximately +65 to +70%.
The Company expects to show sequential improvement in gross margin as the fiscal year progresses. Directionally, it expects adjusted gross margin in the fiscal 2021 first quarter to be in the 34% range and expects to deliver between $80 and $90 million in adjusted EBITDA.
Additional details on the Company’s fiscal 2021 outlook and visibility on the first quarter will be provided during its conference call as well as in its investor presentation available on the investor relations section of the Company’s website at http://bedbathandbeyond.gcs-web.com/investor-relations.
Additional Information – Quarterly Summary of Fiscal 2019 and Fiscal 2020 Net Sales
The following table shows a quarterly summary of the Company’s fiscal 2019 and 2020 net sales on both a reported basis and on a Core Go-Forward basis, which excludes sales from divested banners.
The Company is providing this additional transparency to help analysts and investors gain further perspective on the Company’s recent portfolio transformation and the quarterly comparisons of the Core Go-Forward banners which include Bed Bath & Beyond, buybuy BABY, Harmon Face Values and Decorist.
Fiscal 2020 Fourth Quarter Conference Call and Investor Presentation
Bed Bath & Beyond Inc.’s fiscal 2020 fourth quarter conference call with analysts and investors will be held today at 8:00am EDT and may be accessed by dialing 1-888-424-8151, or if international, 1-847-585-4422, using passcode number 9775756#. A live audio webcast of the conference call, along with the earnings press release, investor presentation and supplemental financial disclosures, will also be available on the investor relations section of the Company's website at http://bedbathandbeyond.gcs-web.com/investor-relations. The webcast will be available for replay after the call for a period of at least one year.
The Company has also made available an Investor Presentation on the investor relations section of the Company's website at http://bedbathandbeyond.gcs-web.com/events-and-presentations.
(1)The Company’s four Core banners include Bed Bath & Beyond, buybuy BABY, Harmon Face Values and Decorist.
(2)Adjusted Gross Margin, Adjusted SG&A, Adjusted EBITDA, Adjusted EBITDA Margin, and Adjusted Diluted EPS are non-GAAP financial measures. For more information about non-GAAP financial measures, see “Non-GAAP Information” below.
(3)Gross debt includes bonds, borrowings under the Company’s asset-based revolving credit facility and operating and finance lease liabilities.
(4)Total Liquidity includes cash & investments and availability under the Company’s asset-based revolving credit facility.
(5)Leverage ratio calculated using Moody’s gross debt/EBITDA ratios.
(6)The Company expects to “Recapture” sales in the fiscal 2021 first quarter that were lost in the prior year period due to temporary store closures. In the subsequent quarters of fiscal 2021, the Company expects to “Sustain” comparable sales levels relative to the solid comparable sales base it experienced in these same quarters during fiscal 2020. For financial planning purposes, the Company expects total enterprise comparable sales in its fiscal 2021 second quarter through fourth quarter to be flat versus a strong fiscal 2020 base during the prior year periods of fiscal 2020.
About the Company
Bed Bath & Beyond Inc. and subsidiaries (the "Company") is an omnichannel retailer that makes it easy for our customers to feel at home. The Company sells a wide assortment of merchandise in the Home, Baby, Beauty and Wellness markets. Additionally, the Company is a partner in a joint venture which operates retail stores in Mexico under the name Bed Bath & Beyond.
The Company operates websites at bedbathandbeyond.com, bedbathandbeyond.ca, buybuybaby.com, buybuybaby.ca, harmondiscount.com, facevalues.com, and decorist.com. As of February 27, 2021, the Company had a total of 1,020 stores, including 834 Bed Bath & Beyond stores in all 50 states, the District of Columbia, Puerto Rico and Canada, 132 buybuy BABY stores and 54 stores under the names Harmon, Harmon Face Values or Face Values. During the fiscal 2020 fourth quarter, the Company opened 3 buybuy BABY stores, 1 Bed Bath & Beyond store, and 1 Harmon Face Values store and closed 118 Bed Bath & Beyond stores. The joint venture to which the Company is a partner operates 10 stores in Mexico under the name Bed Bath & Beyond.
Non-GAAP Information
This press release contains certain non-GAAP information, including adjusted earnings before interest, income taxes, depreciation and amortization ("EBITDA"), adjusted EBITDA margin, adjusted gross margin, adjusted net earnings per diluted share, and free cash flow. Non-GAAP information is intended to provide visibility into the Company’s core operations and excludes special items, including the effects of the net loss on the sale of businesses, charges recorded in connection with the restructuring and transformation initiatives, which includes markdowns and inventory reserves related to the planned assortment transition to Owned Brands, non-cash impairment charges related to tradenames and certain long-lived assets and the income tax impact of these items. The Company’s definition and calculation of non-GAAP measures may differ from that of other companies. Non-GAAP financial measures should be viewed in addition to, and not as an alternative for, the Company’s reported GAAP financial results. For a reconciliation to the most directly comparable US GAAP measures and certain information relating to the Company’s use of Non-GAAP financial measures, see “Non-GAAP Financial Measures” below.
Forward-Looking Statements
This press release contains forward-looking statements within the meaning of Section 21 E of the Securities Exchange Act of 1934 including, but not limited to, the Company’s progress and anticipated progress towards its long-term objectives, as well as more generally the status of its future liquidity and financial condition and its outlook for the Company’s fiscal 2021 first quarter and for its 2021 fiscal year. Many of these forward-looking statements can be identified by use of words such as may, will, expect, anticipate, approximate, estimate, assume, continue, model, project, plan, goal, preliminary, and similar words and phrases, although the absence of those words does not necessarily mean that statements are not forward-looking. The Company’s actual results and future financial condition may differ materially from those expressed in any such forward-looking statements as a result of many factors. Such factors include, without limitation: general economic conditions including the housing market, a challenging overall macroeconomic environment and related changes in the retailing environment; risks associated with the COVID-19 pandemic and the governmental responses to it, including its impacts across the Company’s businesses on demand and operations, as well as on the operations of the Company’s suppliers and other business partners, and the effectiveness of the Company’s actions taken in response to these risks; consumer preferences, spending habits and adoption of new technologies; demographics and other macroeconomic factors that may impact the level of spending for the types of merchandise sold by the Company; civil disturbances and terrorist acts; unusual weather patterns and natural disasters; competition from existing and potential competitors across all channels; pricing pressures; liquidity; the ability to achieve anticipated cost savings, and to not exceed anticipated costs, associated with organizational changes and investments, including the Company’s strategic restructuring program and store network optimization strategies; the ability to attract and retain qualified employees in all areas of the organization; the cost of labor, merchandise and other costs and expenses; potential supply chain disruption due to trade restrictions, and other factors such as natural disasters, pandemics, including the COVID-19 pandemic, political instability, labor disturbances, product recalls, financial or operational instability of suppliers or carriers, and other items; the ability to find suitable locations at acceptable occupancy costs and other terms to support the Company’s plans for new stores; the ability to establish and profitably maintain the appropriate mix of digital and physical presence in the markets it serves; the ability to assess and implement technologies in support of the Company’s development of its omnichannel capabilities; the ability to effectively and timely adjust the Company’s plans in the face of the rapidly changing retail and economic environment, including in response to the COVID-19 pandemic; uncertainty in financial markets; volatility in the price of the Company’s common stock and its effect, and the effect of other factors, including the COVID-19 pandemic, on the Company’s capital allocation strategy; risks associated with the ability to achieve a successful outcome for the Company’s business concepts and to otherwise achieve its business strategies; the impact of intangible asset and other impairments; disruptions to the Company’s information technology systems, including but not limited to security breaches of systems protecting consumer and employee information or other types of cybercrimes or cybersecurity attacks; reputational risk arising from challenges to the Company’s or a third party product or service supplier’s compliance with various laws, regulations or standards, including those related to labor, health, safety, privacy or the environment; reputational risk arising from third-party merchandise or service vendor performance in direct home delivery or assembly of product for customers; changes to statutory, regulatory and legal requirements, including without limitation proposed changes affecting international trade; changes to, or new, tax laws or interpretation of existing tax laws; new, or developments in existing, litigation, claims or assessments; changes to, or new,
accounting standards; and foreign currency exchange rate fluctuations. Except as required by law, the Company does not undertake any obligation to update its forward-looking statements.
CONTACTS:
INVESTORS: Janet M. Barth, (908) 613-5820 OR IR@bedbath.com
MEDIA: Eric Mangan, eric.mangan@bedbath.com OR Public.Relations@bedbath.com
BED BATH & BEYOND INC. AND SUBSIDIARIES
Consolidated Statements of Operations
(in thousands, except per share data)
(unaudited)
| Three Months Ended | Twelve Months Ended | ||||||||||||||||||||||
| February 27, 2021 | February 29, 2020 | February 27, 2021 | February 29, 2020 | ||||||||||||||||||||
| Net sales | $ | 2,619,141 | $ | 3,106,822 | $ | 9,233,028 | $ | 11,158,580 | |||||||||||||||
| Cost of sales | 1,793,653 | 2,093,166 | 6,114,947 | 7,616,920 | |||||||||||||||||||
| Gross profit | 825,488 | 1,013,656 | 3,118,081 | 3,541,660 | |||||||||||||||||||
| Selling, general and administrative expenses | 762,998 | 1,027,041 | 3,224,363 | 3,732,498 | |||||||||||||||||||
| Goodwill and other impairments | 8,883 | 67,821 | 127,341 | 509,226 | |||||||||||||||||||
| Restructuring and transformation initiative expenses | 54,554 | — | 102,202 | — | |||||||||||||||||||
| Loss on sale of businesses, including impairment of assets held for sale | 22,705 | — | 1,062 | — | |||||||||||||||||||
| Operating loss | (23,652) | (81,206) | (336,887) | (700,064) | |||||||||||||||||||
| Interest expense, net | 18,566 | 15,370 | 76,913 | 64,789 | |||||||||||||||||||
| Gain on extinguishment of debt | — | — | (77,038) | — | |||||||||||||||||||
| Loss before benefit for income taxes | (42,218) | (96,576) | (336,762) | (764,853) | |||||||||||||||||||
| Benefit for income taxes | (51,277) | (31,162) | (185,989) | (151,037) | |||||||||||||||||||
| Net income (loss) | $ | 9,059 | $ | (65,414) | $ | (150,773) | $ | (613,816) | |||||||||||||||
| Net income (loss) per share - Basic | $ | 0.08 | $ | (0.53) | $ | (1.24) | $ | (4.94) | |||||||||||||||
| Net income (loss) per share - Diluted | $ | 0.08 | $ | (0.53) | $ | (1.24) | $ | (4.94) | |||||||||||||||
| Weighted average shares outstanding - Basic | 115,055 | 123,347 | 121,446 | 124,352 | |||||||||||||||||||
| Weighted average shares outstanding - Diluted | 117,286 | 123,347 | 121,446 | 124,352 | |||||||||||||||||||
| Dividends declared per share | $ | — | $ | 0.17 | $ | — | $ | 0.68 | |||||||||||||||
Non-GAAP Financial Measures
The following table reconciles non-GAAP financial measures presented in this press release or that may be presented on the Company’s fourth quarter conference call with analysts and investors. The Company believes that these non-GAAP financial measures provide management, analysts, investors and other users of the Company’s financial information with meaningful supplemental information regarding the performance of the Company’s business. These non-GAAP financial measures should not be considered superior to, but in addition to other financial measures prepared by the Company in accordance with GAAP, including the year-to-year results. The Company’s method of determining these non-GAAP financial measures may be different from other companies’ methods and, therefore, may not be comparable to those used by other companies and the Company does not recommend the sole use of this non-GAAP measure to assess its financial and earnings performance. For reasons noted above, the Company is presenting certain non-GAAP financial measures for its fiscal 2020 fourth quarter. In order for investors to be able to more easily compare the Company’s performance across periods, the Company has included comparable reconciliations for the 2019 period in the reconciliation tables below. The Company is not providing a reconciliation of its guidance with respect to Adjusted EBITDA because the Company is unable to provide this reconciliation without unreasonable effort due to the uncertainty and inherent difficulty of predicting the occurrence, the financial impact, and the periods in which the adjustments may be recognized. For the same reasons, the Company is unable to address the probable significance of the unavailable information, which could be material to future results.
Non-GAAP Reconciliation
(in thousands, except per share data)
(unaudited)
| Three Months Ended February 27, 2021 | ||||||||||||||||||||||||||||||||||||||||||||||||||
| Excluding | ||||||||||||||||||||||||||||||||||||||||||||||||||
| Reported | Loss on Sale of Businesses | Loss on sale-leaseback, including transaction fees | Restructuring and Transformation Expenses | Impairment charges | Total income tax impact | Total Impact | Adjusted | |||||||||||||||||||||||||||||||||||||||||||
| Gross Profit | $ | 825,488 | $ | — | $ | — | $ | 33,198 | $ | — | $ | — | $ | 33,198 | $ | 858,686 | ||||||||||||||||||||||||||||||||||
| Gross margin | 31.5 | % | — | % | — | % | 1.3 | % | — | % | — | % | 1.3 | % | 32.8 | % | ||||||||||||||||||||||||||||||||||
| Restructuring and transformation initiative expenses | 54,554 | — | — | (54,554) | — | — | (54,554) | — | ||||||||||||||||||||||||||||||||||||||||||
| (Loss) earnings before (benefit) provision for income taxes | (42,218) | 22,705 | — | 87,752 | 8,883 | — | 119,340 | 77,122 | ||||||||||||||||||||||||||||||||||||||||||
| Tax (benefit) provision | (51,277) | — | — | — | — | 81,297 | 81,297 | 30,020 | ||||||||||||||||||||||||||||||||||||||||||
| Effective tax rate | 121.5 | % | (82.6) | % | (82.6) | % | 38.9 | % | ||||||||||||||||||||||||||||||||||||||||||
| Net income (loss) | $ | 9,059 | $ | 22,705 | $ | — | $ | 87,752 | $ | 8,883 | $ | (81,297) | $ | 38,043 | $ | 47,102 | ||||||||||||||||||||||||||||||||||
| Net earnings per share - Diluted | $ | 0.08 | $ | 0.40 | ||||||||||||||||||||||||||||||||||||||||||||||
| Weighted average shares outstanding- Basic | 115,055 | 115,055 | ||||||||||||||||||||||||||||||||||||||||||||||||
| Weighted average shares outstanding- Diluted | 117,286 | (1) | 117,286 | |||||||||||||||||||||||||||||||||||||||||||||||
| Reconciliation of Net Income (loss) to EBITDA and Adjusted EBITDA | ||||||||||||||||||||||||||||||||||||||||||||||||||
| Net income (loss) | $ | 9,059 | $ | 22,705 | $ | — | $ | 87,752 | $ | 8,883 | $ | (81,297) | $ | 38,043 | $ | 47,102 | ||||||||||||||||||||||||||||||||||
| Depreciation and amortization | 78,328 | — | — | (6,141) | — | — | (6,141) | 72,187 | ||||||||||||||||||||||||||||||||||||||||||
| Interest expense | 18,566 | — | — | — | — | — | — | 18,566 | ||||||||||||||||||||||||||||||||||||||||||
| Tax (benefit) provision | (51,277) | — | — | — | — | 81,297 | 81,297 | 30,020 | ||||||||||||||||||||||||||||||||||||||||||
| EBITDA | $ | 54,676 | $ | 22,705 | $ | — | $ | 81,611 | $ | 8,883 | $ | — | $ | 113,199 | $ | 167,875 | ||||||||||||||||||||||||||||||||||
| EBITDA as % of net sales | 6.4 | % | ||||||||||||||||||||||||||||||||||||||||||||||||
| (1) If a company is in a net loss position, then for earnings per share purposes, diluted weighted average shares outstanding are equivalent to basic weighted average shares outstanding. | ||||||||||||||||||||||||||||||||||||||||||||||||||
| Three Months Ended February 29, 2020 | ||||||||||||||||||||||||||||||||||||||||||||||||||
| Excluding | ||||||||||||||||||||||||||||||||||||||||||||||||||
| Reported | Loss on Sale of Businesses | Loss on sale-leaseback, including transaction fees | Restructuring and Transformation Expenses | Impairment Charges | Total income tax impact | Total Impact | Adjusted | |||||||||||||||||||||||||||||||||||||||||||
| Gross Profit | $ | 1,013,656 | $ | — | $ | — | $ | — | $ | — | $ | — | $ | — | $ | 1,013,656 | ||||||||||||||||||||||||||||||||||
| Gross margin | 32.6 | % | — | % | — | % | — | % | — | % | — | % | — | % | 32.6 | % | ||||||||||||||||||||||||||||||||||
| (Loss) earnings before (benefit) provision for income taxes | (96,576) | — | 32,840 | 41,308 | 67,821 | — | 141,969 | 45,393 | ||||||||||||||||||||||||||||||||||||||||||
| Tax (benefit) provision | (31,162) | — | — | — | — | 29,666 | 29,666 | (1,496) | ||||||||||||||||||||||||||||||||||||||||||
| Effective tax rate | 32.3 | % | (35.6) | % | (35.6) | % | (3.3) | % | ||||||||||||||||||||||||||||||||||||||||||
| Net (loss) income | $ | (65,414) | $ | — | $ | 32,840 | $ | 41,308 | $ | 67,821 | $ | (29,666) | $ | 112,303 | $ | 46,889 | ||||||||||||||||||||||||||||||||||
| Net (loss) earnings per share - Diluted | $ | (0.53) | $ | 0.38 | ||||||||||||||||||||||||||||||||||||||||||||||
| Weighted average shares outstanding- Basic | 123,347 | 123,347 | ||||||||||||||||||||||||||||||||||||||||||||||||
| Weighted average shares outstanding- Diluted | 123,347 | (1) | 123,754 | |||||||||||||||||||||||||||||||||||||||||||||||
| Reconciliation of Net (Loss) Income to EBITDA and Adjusted EBITDA | ||||||||||||||||||||||||||||||||||||||||||||||||||
| Net (loss) income | $ | (65,414) | $ | — | $ | 32,840 | $ | 41,308 | $ | 67,821 | $ | (29,666) | $ | 112,303 | $ | 46,889 | ||||||||||||||||||||||||||||||||||
| Depreciation and amortization | 87,390 | — | — | — | — | — | — | 87,390 | ||||||||||||||||||||||||||||||||||||||||||
| Interest expense | 15,370 | — | — | — | — | — | — | 15,370 | ||||||||||||||||||||||||||||||||||||||||||
| Tax (benefit) provision | (31,162) | — | — | — | — | 29,666 | 29,666 | (1,496) | ||||||||||||||||||||||||||||||||||||||||||
| EBITDA | $ | 6,184 | $ | — | $ | 32,840 | $ | 41,308 | $ | 67,821 | $ | — | $ | 141,969 | $ | 148,153 | ||||||||||||||||||||||||||||||||||
| EBITDA as % of net sales | 4.8 | % | ||||||||||||||||||||||||||||||||||||||||||||||||
| (1) If a company is in a net loss position, then for earnings per share purposes, diluted weighted average shares outstanding are equivalent to basic weighted average shares outstanding. | ||||||||||||||||||||||||||||||||||||||||||||||||||
BED BATH & BEYOND INC. AND SUBSIDIARIES
Condensed Consolidated Balance Sheets
(in thousands, except per share data)
(unaudited)
| February 27, 2021 | November 28, 2020 | February 29, 2020 | |||||||||||||||
| Assets | |||||||||||||||||
| Current assets: | |||||||||||||||||
| Cash and cash equivalents | $ | 1,352,984 | $ | 1,462,612 | $ | 1,000,340 | |||||||||||
| Short term investment securities | — | — | 385,642 | ||||||||||||||
| Merchandise inventories | 1,671,909 | 1,780,891 | 2,093,869 | ||||||||||||||
| Prepaid expenses and other current assets | 595,152 | 196,487 | 248,342 | ||||||||||||||
| Assets held-for-sale | — | 524,551 | 98,092 | ||||||||||||||
| Total current assets | 3,620,045 | 3,964,541 | 3,826,285 | ||||||||||||||
| Long term investment securities | 19,545 | 19,847 | 20,380 | ||||||||||||||
| Property and equipment, net | 918,418 | 905,251 | 1,430,604 | ||||||||||||||
| Operating lease assets | 1,587,101 | 1,615,969 | 2,006,966 | ||||||||||||||
| Other assets | 311,821 | 486,002 | 506,280 | ||||||||||||||
| Total Assets | $ | 6,456,930 | $ | 6,991,610 | $ | 7,790,515 | |||||||||||
| Liabilities and Shareholders' Equity | |||||||||||||||||
| Current liabilities: | |||||||||||||||||
| Accounts payable | $ | 986,045 | $ | 865,418 | $ | 944,194 | |||||||||||
| Accrued expenses and other current liabilities | 636,329 | 698,827 | 675,776 | ||||||||||||||
| Merchandise credit and gift card liabilities | 312,486 | 304,530 | 340,407 | ||||||||||||||
| Current operating lease liabilities | 360,061 | 390,875 | 463,005 | ||||||||||||||
| Liabilities related to assets held-for-sale | — | 448,805 | 43,144 | ||||||||||||||
| Total current liabilities | 2,294,921 | 2,708,455 | 2,466,526 | ||||||||||||||
| Other liabilities | 82,279 | 123,067 | 204,926 | ||||||||||||||
| Operating lease liabilities | 1,509,767 | 1,531,830 | 1,818,783 | ||||||||||||||
| Income taxes payable | 102,664 | 38,034 | 46,945 | ||||||||||||||
| Long term debt | 1,190,363 | 1,190,265 | 1,488,400 | ||||||||||||||
| Total liabilities | 5,179,994 | 5,591,651 | 6,025,580 | ||||||||||||||
| Shareholders' equity: | |||||||||||||||||
Preferred stock - $0.01 par value; authorized - 1,000 shares; no shares issued or outstanding | — | — | — | ||||||||||||||
Common stock - $0.01 par value; authorized - 900,000 shares; issued 343,241, 343,484 and 343,683 shares, respectively; outstanding 109,621, 121,215 and 126,528 shares, respectively | 3,432 | 3,434 | 3,436 | ||||||||||||||
Additional paid-in capital | 2,152,135 | 2,058,358 | 2,167,337 | ||||||||||||||
Retained earnings | 10,225,253 | 10,215,743 | 10,374,826 | ||||||||||||||
Treasury stock, at cost; 233,620, 222,269 and 217,155 shares, respectively | (11,048,284) | (10,812,841) | (10,715,755) | ||||||||||||||
Accumulated other comprehensive loss | (55,600) | (64,735) | (64,909) | ||||||||||||||
| Total shareholders' equity | 1,276,936 | 1,399,959 | 1,764,935 | ||||||||||||||
| Total liabilities and shareholders' equity | $ | 6,456,930 | $ | 6,991,610 | $ | 7,790,515 | |||||||||||
BED BATH & BEYOND INC. AND SUBSIDIARIES
Consolidated Statements of Cash Flows
(in thousands, unaudited)
| Three Months Ended | Twelve Months Ended | ||||||||||||||||||||||
| February 27, 2021 | February 29, 2020 | February 27, 2021 | February 29, 2020 | ||||||||||||||||||||
| Cash Flows from Operating Activities: | |||||||||||||||||||||||
| Net earnings (loss) | $ | 9,059 | $ | (65,414) | $ | (150,773) | $ | (613,816) | |||||||||||||||
| Adjustments to reconcile net earnings (loss) to net cash provided by operating activities: | |||||||||||||||||||||||
| Depreciation and amortization | 78,328 | 87,390 | 340,912 | 342,511 | |||||||||||||||||||
| Loss on sale-leaseback transaction | — | 27,357 | — | 27,357 | |||||||||||||||||||
| Goodwill and other impairments | 8,883 | 67,821 | 127,341 | 509,226 | |||||||||||||||||||
| Gain on debt extinguishment | — | — | (77,038) | — | |||||||||||||||||||
| Loss on sale of businesses, including impairment of assets held for sale | 22,705 | — | 1,062 | — | |||||||||||||||||||
| Stock-based compensation | 8,530 | 9,564 | 31,594 | 45,676 | |||||||||||||||||||
| Deferred income taxes | 192,095 | (59,917) | 148,741 | (145,543) | |||||||||||||||||||
| Other | (524) | 225 | (396) | (3,446) | |||||||||||||||||||
| Decrease (increase) in assets: | |||||||||||||||||||||||
| Merchandise inventories | 156,182 | 430,547 | 64,947 | 506,334 | |||||||||||||||||||
| Trading investment securities | — | 21 | — | 21 | |||||||||||||||||||
| Other current assets | (385,492) | 108,674 | (387,172) | (4,781) | |||||||||||||||||||
| Other assets | 1,196 | 4,247 | 1,519 | 218 | |||||||||||||||||||
| Increase (decrease) increase in liabilities: | |||||||||||||||||||||||
| Accounts payable | 70,843 | (270,194) | 168,556 | (124,206) | |||||||||||||||||||
| Accrued expenses and other current liabilities | (82,217) | (7,967) | 15,538 | 61,864 | |||||||||||||||||||
| Merchandise credit and gift card liabilities | 9,089 | 2,971 | (12,110) | 1,154 | |||||||||||||||||||
| Income taxes payable | 63,834 | 5,089 | 54,958 | (22,783) | |||||||||||||||||||
| Operating lease assets and liabilities, net | (43,621) | (17,139) | (32,813) | (2,899) | |||||||||||||||||||
| Other liabilities | (33,184) | 10,539 | (26,758) | 14,054 | |||||||||||||||||||
| Net cash provided by operating activities | 75,706 | 333,814 | 268,108 | 590,941 | |||||||||||||||||||
| Cash Flows from Investing Activities: | |||||||||||||||||||||||
| Purchase of held-to-maturity investment securities | — | (386,500) | — | (443,500) | |||||||||||||||||||
| Redemption of held-to-maturity investment securities | — | — | 386,500 | 545,000 | |||||||||||||||||||
| Capital expenditures | (65,761) | (89,049) | (183,077) | (277,401) | |||||||||||||||||||
| Proceeds from sale-leaseback transaction | — | 267,277 | — | 267,277 | |||||||||||||||||||
| Net proceeds from sale of businesses | 51,748 | — | 534,457 | — | |||||||||||||||||||
| Net cash (used in) provided by investing activities | (14,013) | (208,272) | 737,880 | 91,376 | |||||||||||||||||||
| Cash Flows from Financing Activities: | |||||||||||||||||||||||
| Borrowing of long-term debt | — | — | 236,400 | — | |||||||||||||||||||
| Repayments of long-term debt | — | — | (457,827) | — | |||||||||||||||||||
| Repurchase of common stock, including fees | (102,828) | (578) | (332,529) | (99,710) | |||||||||||||||||||
| Prepayment under share repurchase agreement | (47,550) | — | (47,550) | — | |||||||||||||||||||
| Payment of dividends | (45) | (21,142) | (23,108) | (85,482) | |||||||||||||||||||
| Payment of deferred financing fees | — | — | (7,690) | — | |||||||||||||||||||
| Proceeds from exercise of stock options | — | 2,346 | — | 2,346 | |||||||||||||||||||
| Net cash used in financing activities | (150,423) | (19,374) | (632,304) | (182,846) | |||||||||||||||||||
| Effect of exchange rate changes on cash, cash equivalents and restricted cash | 1,747 | (1,090) | 5,075 | (977) | |||||||||||||||||||
| Net (decrease) increase in cash, cash equivalents and restricted cash, including cash balances classified as assets held-for-sale | (86,983) | 105,078 | 378,759 | 498,494 | |||||||||||||||||||
| Change in cash balances classified as held-for-sale | — | (4,815) | 4,815 | (4,815) | |||||||||||||||||||
| Net (decrease) increase in cash, cash equivalents and restricted cash | (86,983) | 100,263 | 383,574 | 493,679 | |||||||||||||||||||
| Cash, cash equivalents and restricted cash: | |||||||||||||||||||||||
| Beginning of period | 1,494,207 | 923,387 | 1,023,650 | 529,971 | |||||||||||||||||||
| End of period | $ | 1,407,224 | $ | 1,023,650 | $ | 1,407,224 | $ | 1,023,650 | |||||||||||||||