Attached files
| file | filename |
|---|---|
| 8-K - 8-K - Bank of New York Mellon Corp | d102871d8k.htm |

2021 Annual Meeting of Stockholders April 13, 2021 Exhibit 99.1
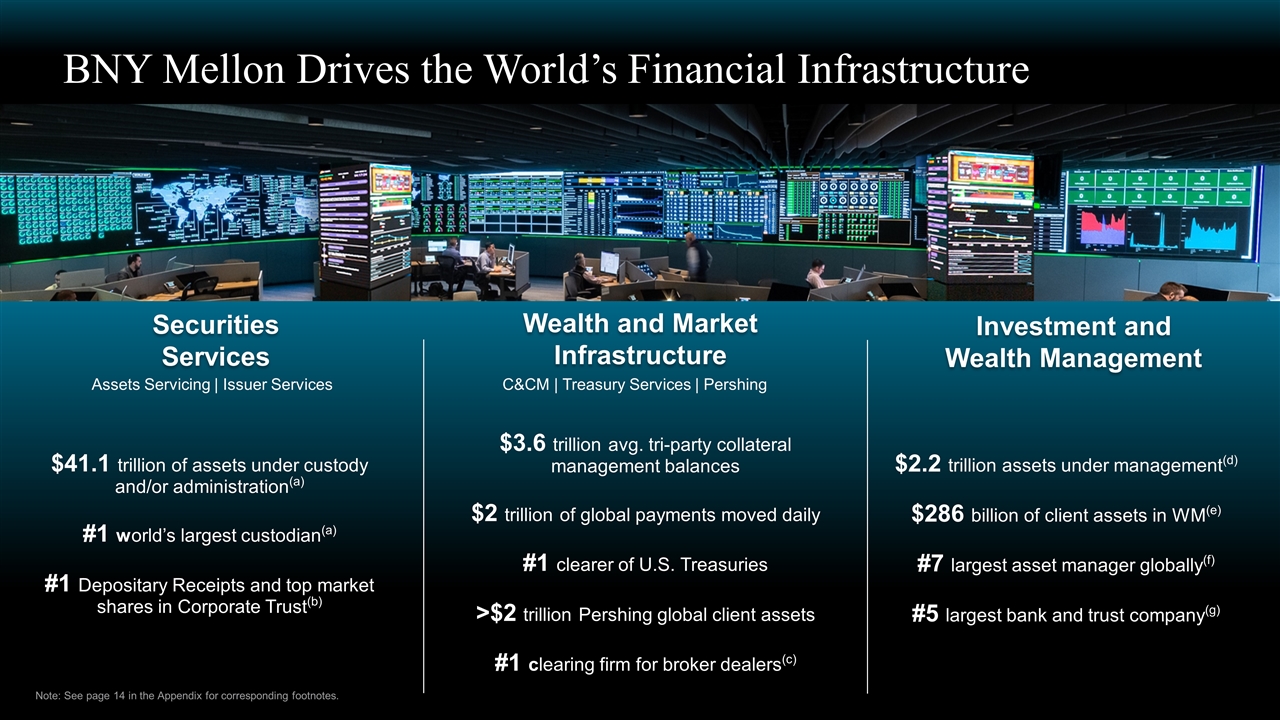
BNY Mellon Drives the World’s Financial Infrastructure Note: See page 14 in the Appendix for corresponding footnotes. $41.1 trillion of assets under custody and/or administration(a) #1 world’s largest custodian(a) #1 Depositary Receipts and top market shares in Corporate Trust(b) $3.6 trillion avg. tri-party collateral management balances $2 trillion of global payments moved daily #1 clearer of U.S. Treasuries >$2 trillion Pershing global client assets #1 clearing firm for broker dealers(c) $2.2 trillion assets under management(d) $286 billion of client assets in WM(e) #7 largest asset manager globally(f) #5 largest bank and trust company(g) Securities Services Wealth and Market Infrastructure Investment and Wealth Management Assets Servicing | Issuer Services C&CM | Treasury Services | Pershing
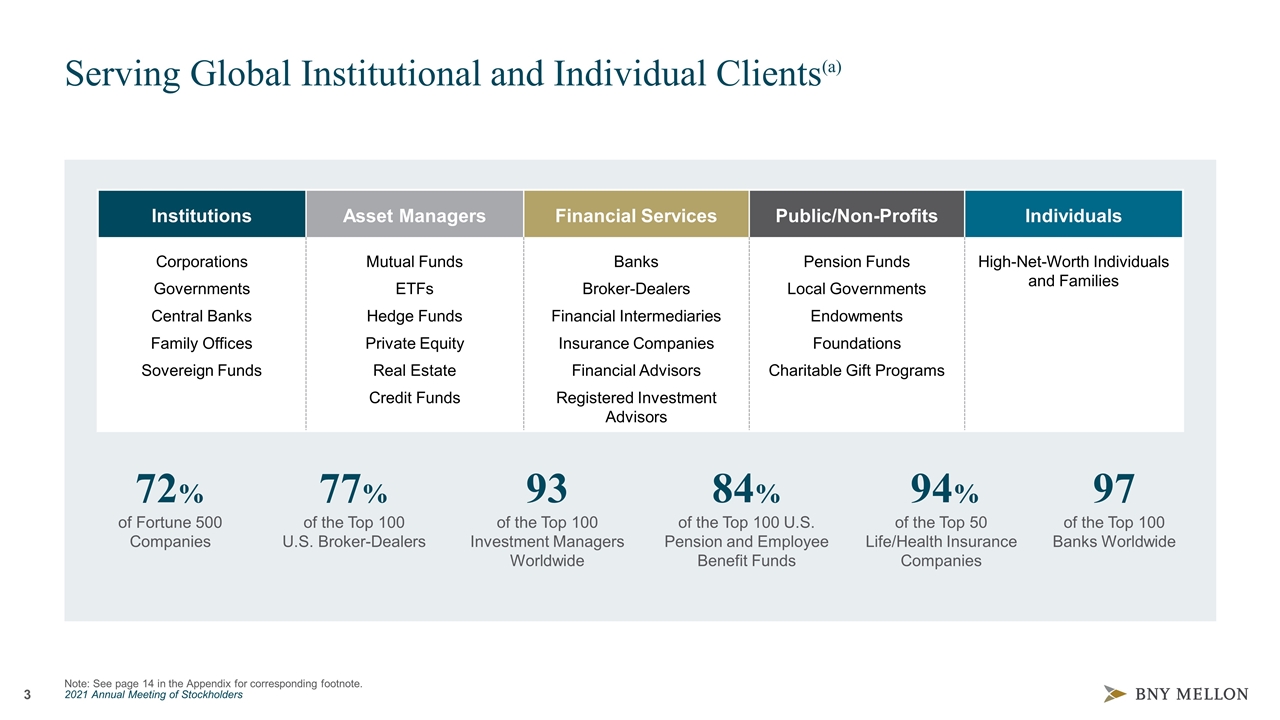
Serving Global Institutional and Individual Clients(a) Institutions Asset Managers Financial Services Public/Non-Profits Individuals Corporations Governments Central Banks Family Offices Sovereign Funds Mutual Funds ETFs Hedge Funds Private Equity Real Estate Credit Funds Banks Broker-Dealers Financial Intermediaries Insurance Companies Financial Advisors Registered Investment Advisors Pension Funds Local Governments Endowments Foundations Charitable Gift Programs High-Net-Worth Individuals and Families of Fortune 500 Companies 72% of the Top 100 U.S. Broker-Dealers 77% of the Top 100 Investment Managers Worldwide 93 of the Top 100 U.S. Pension and Employee Benefit Funds 84% of the Top 50 Life/Health Insurance Companies 94% of the Top 100 Banks Worldwide 97 Note: See page 14 in the Appendix for corresponding footnote.
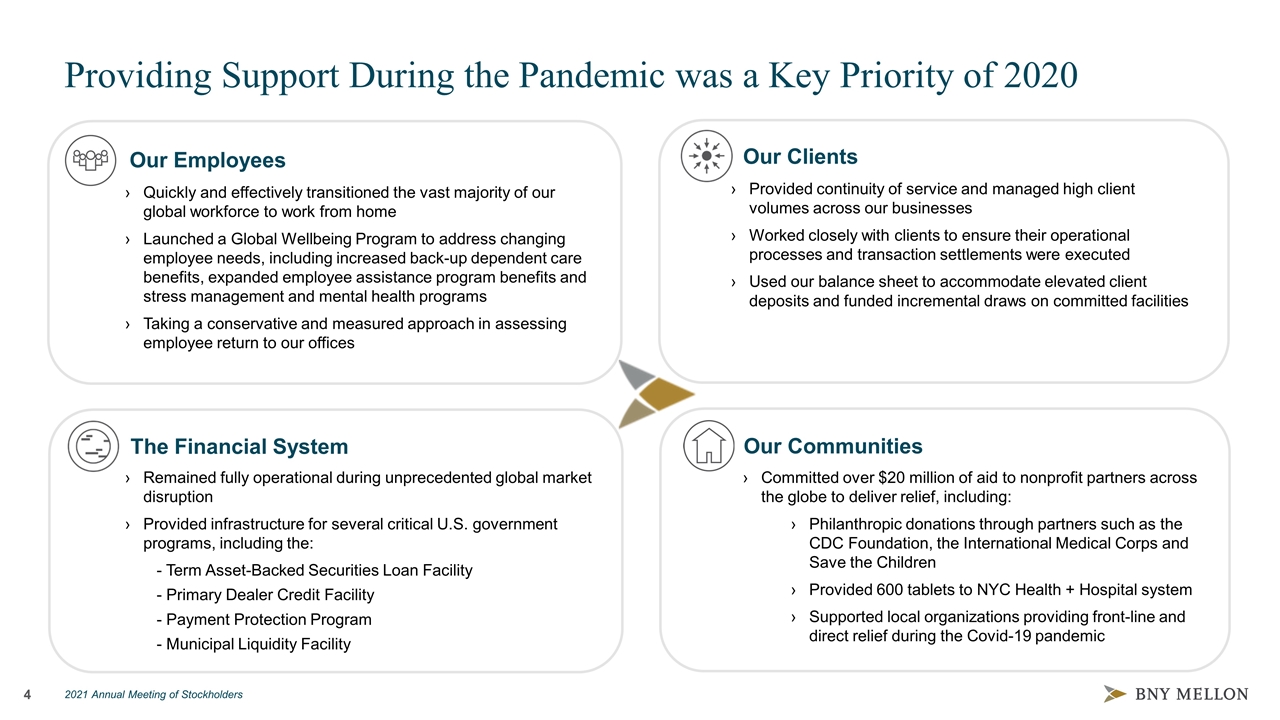
Our Employees Our Clients The Financial System Our Communities Quickly and effectively transitioned the vast majority of our global workforce to work from home Launched a Global Wellbeing Program to address changing employee needs, including increased back-up dependent care benefits, expanded employee assistance program benefits and stress management and mental health programs Taking a conservative and measured approach in assessing employee return to our offices Provided continuity of service and managed high client volumes across our businesses Worked closely with clients to ensure their operational processes and transaction settlements were executed Used our balance sheet to accommodate elevated client deposits and funded incremental draws on committed facilities Remained fully operational during unprecedented global market disruption Provided infrastructure for several critical U.S. government programs, including the: - Term Asset-Backed Securities Loan Facility - Primary Dealer Credit Facility - Payment Protection Program - Municipal Liquidity Facility Committed over $20 million of aid to nonprofit partners across the globe to deliver relief, including: Philanthropic donations through partners such as the CDC Foundation, the International Medical Corps and Save the Children Provided 600 tablets to NYC Health + Hospital system Supported local organizations providing front-line and direct relief during the Covid-19 pandemic Providing Support During the Pandemic was a Key Priority of 2020
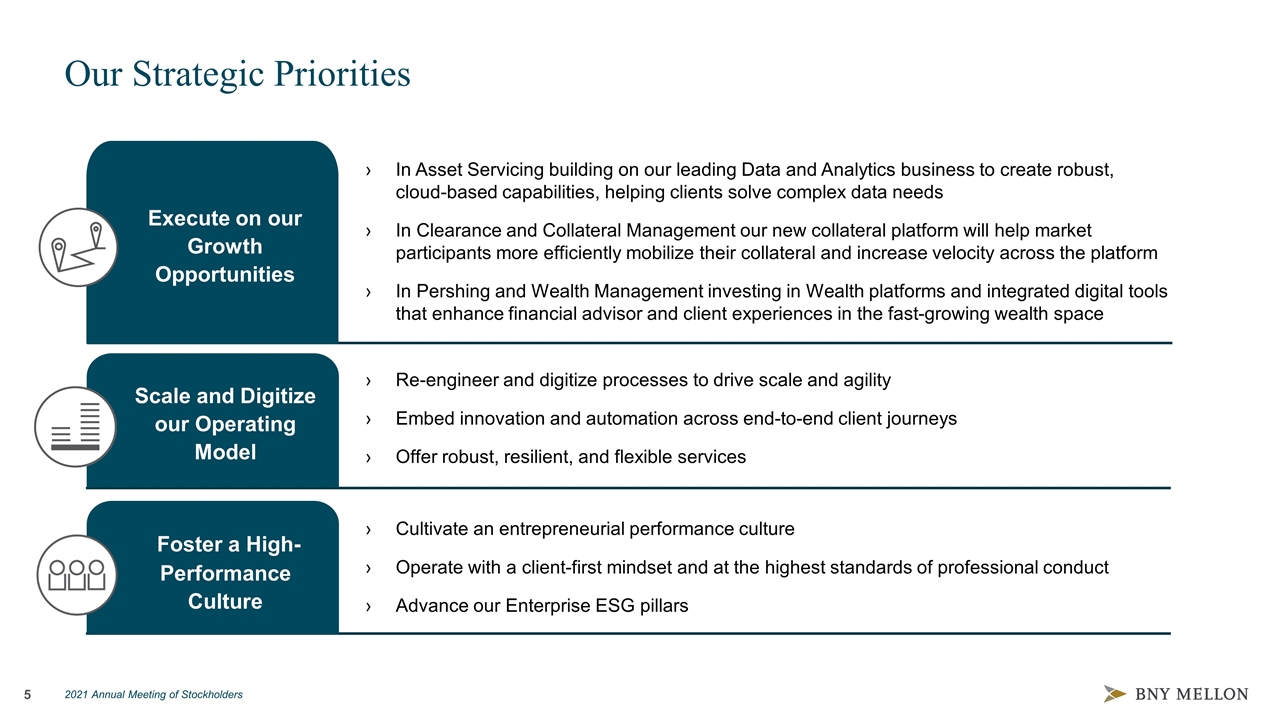
Our Strategic Priorities Execute on our Growth Opportunities In Asset Servicing building on our leading Data and Analytics business to create robust, cloud-based capabilities, helping clients solve complex data needs In Clearance and Collateral Management our new collateral platform will help market participants more efficiently mobilize their collateral and increase velocity across the platform In Pershing and Wealth Management investing in Wealth platforms and integrated digital tools that enhance financial advisor and client experiences in the fast-growing wealth space Re-engineer and digitize processes to drive scale and agility Embed innovation and automation across end-to-end client journeys Offer robust, resilient, and flexible services Cultivate an entrepreneurial performance culture Operate with a client-first mindset and at the highest standards of professional conduct Advance our Enterprise ESG pillars Scale and Digitize our Operating Model Foster a High-Performance Culture
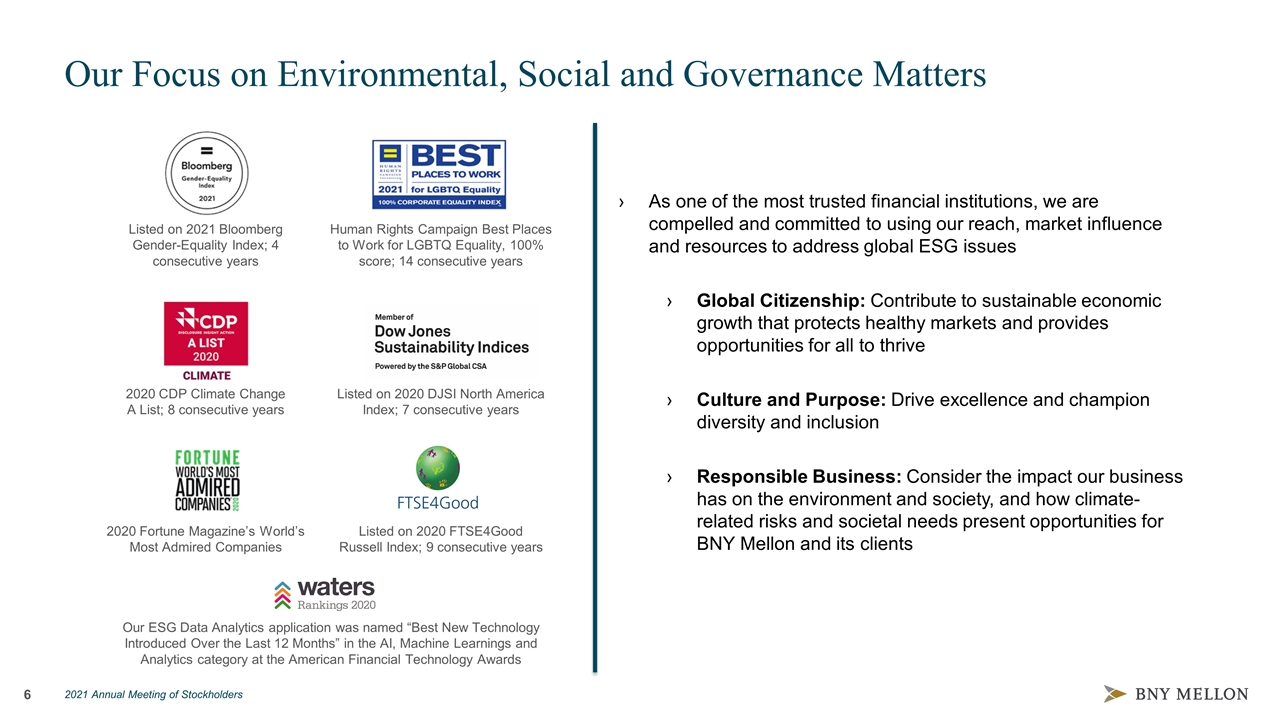
Our Focus on Environmental, Social and Governance Matters 2020 CDP Climate Change A List; 8 consecutive years Listed on 2021 Bloomberg Gender-Equality Index; 4 consecutive years Human Rights Campaign Best Places to Work for LGBTQ Equality, 100% score; 14 consecutive years Listed on 2020 DJSI North America Index; 7 consecutive years 2020 Fortune Magazine’s World’s Most Admired Companies Listed on 2020 FTSE4Good Russell Index; 9 consecutive years Our ESG Data Analytics application was named “Best New Technology Introduced Over the Last 12 Months” in the AI, Machine Learnings and Analytics category at the American Financial Technology Awards As one of the most trusted financial institutions, we are compelled and committed to using our reach, market influence and resources to address global ESG issues Global Citizenship: Contribute to sustainable economic growth that protects healthy markets and provides opportunities for all to thrive Culture and Purpose: Drive excellence and champion diversity and inclusion Responsible Business: Consider the impact our business has on the environment and society, and how climate-related risks and societal needs present opportunities for BNY Mellon and its clients
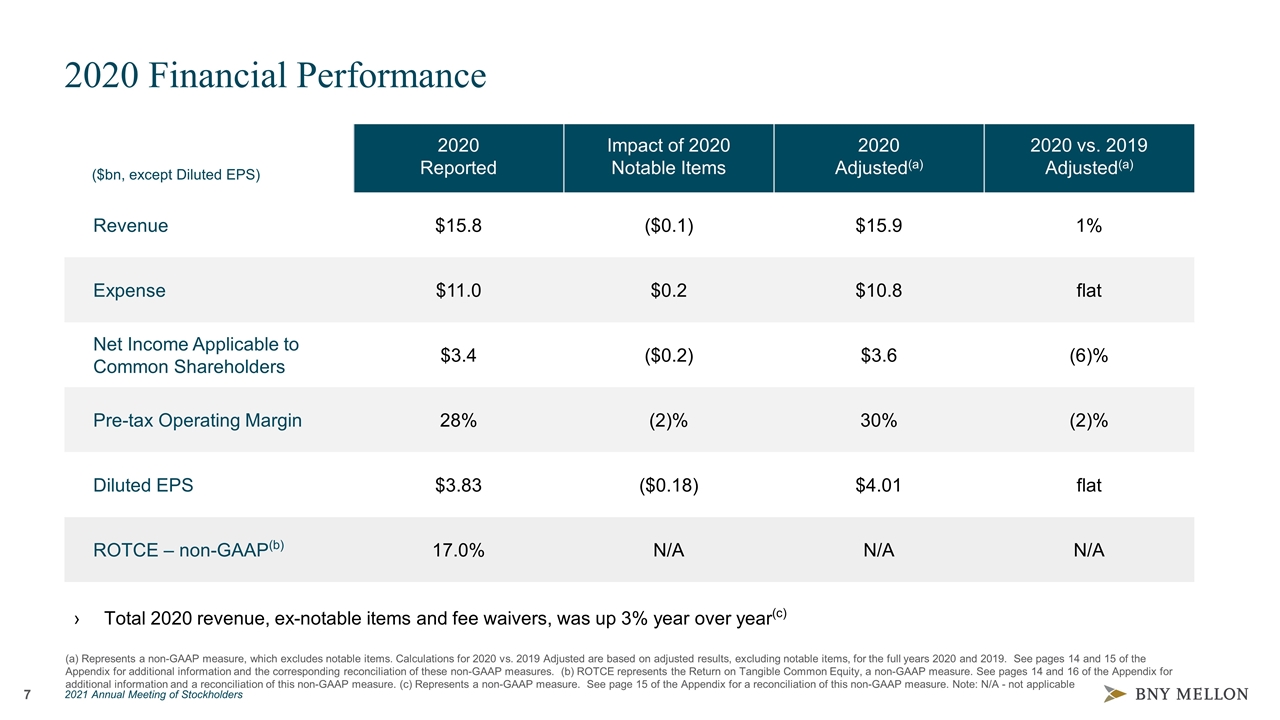
2020 Financial Performance (a) Represents a non-GAAP measure, which excludes notable items. Calculations for 2020 vs. 2019 Adjusted are based on adjusted results, excluding notable items, for the full years 2020 and 2019. See pages 14 and 15 of the Appendix for additional information and the corresponding reconciliation of these non-GAAP measures. (b) ROTCE represents the Return on Tangible Common Equity, a non-GAAP measure. See pages 14 and 16 of the Appendix for additional information and a reconciliation of this non-GAAP measure. (c) Represents a non-GAAP measure. See page 15 of the Appendix for a reconciliation of this non-GAAP measure. Note: N/A - not applicable ($bn, except Diluted EPS) 2020 Reported Impact of 2020 Notable Items 2020 Adjusted(a) 2020 vs. 2019 Adjusted(a) Revenue $15.8 ($0.1) $15.9 1% Expense $11.0 $0.2 $10.8 flat Net Income Applicable to Common Shareholders $3.4 ($0.2) $3.6 (6)% Pre-tax Operating Margin 28% (2)% 30% (2)% Diluted EPS $3.83 ($0.18) $4.01 flat ROTCE – non-GAAP(b) 17.0% N/A N/A N/A Total 2020 revenue, ex-notable items and fee waivers, was up 3% year over year(c)
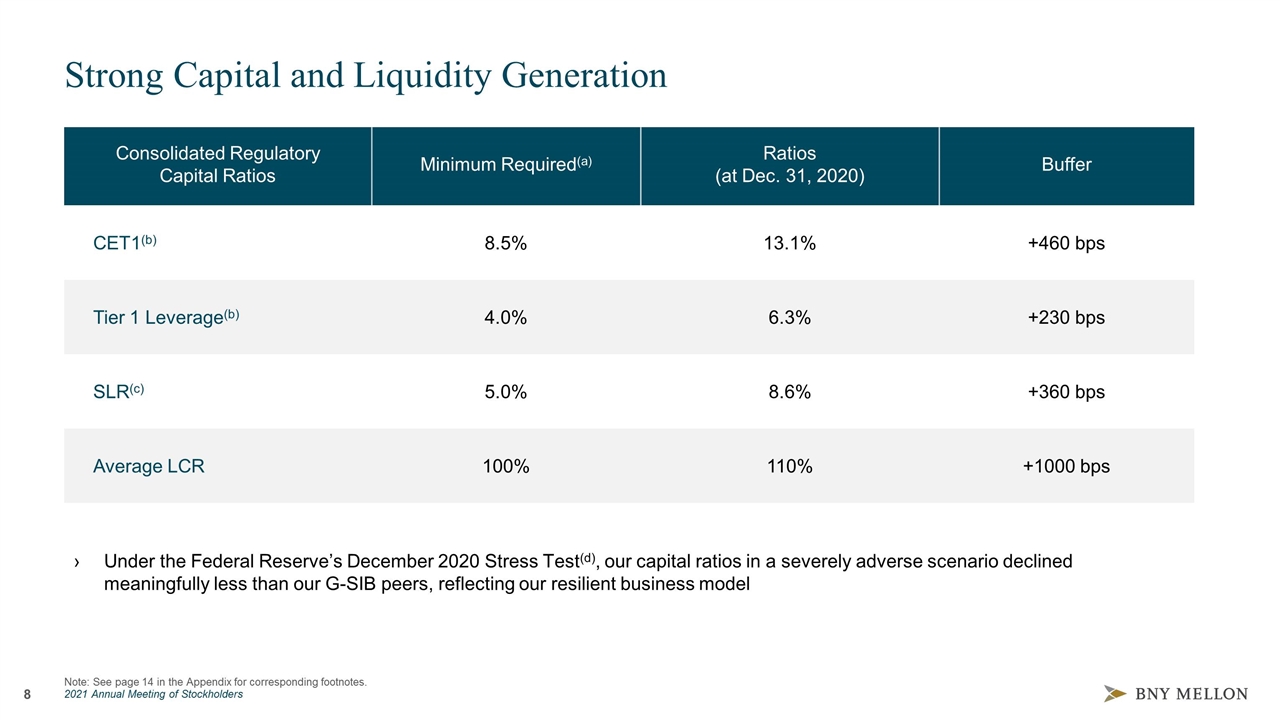
Strong Capital and Liquidity Generation Consolidated Regulatory Capital Ratios Minimum Required(a) Ratios (at Dec. 31, 2020) Buffer CET1(b) 8.5% 13.1% +460 bps Tier 1 Leverage(b) 4.0% 6.3% +230 bps SLR(c) 5.0% 8.6% +360 bps Average LCR 100% 110% +1000 bps Under the Federal Reserve’s December 2020 Stress Test(d), our capital ratios in a severely adverse scenario declined meaningfully less than our G-SIB peers, reflecting our resilient business model Note: See page 14 in the Appendix for corresponding footnotes.
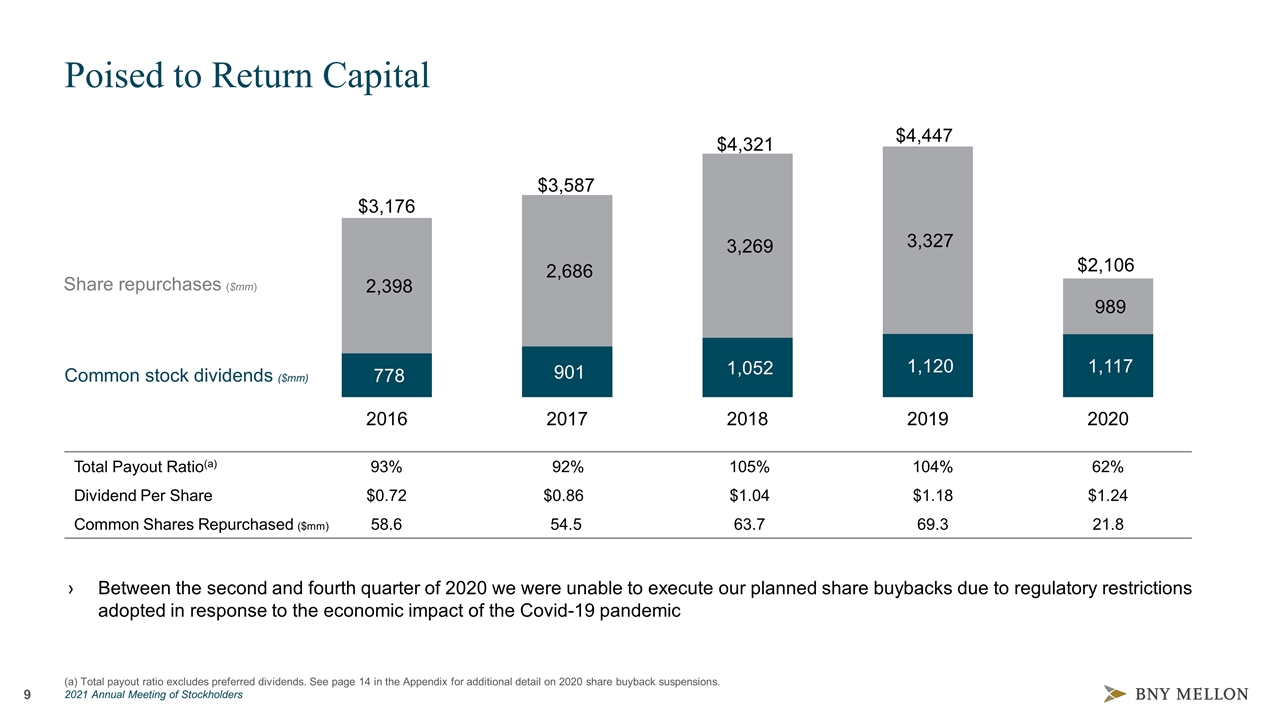
(a) Total payout ratio excludes preferred dividends. See page 14 in the Appendix for additional detail on 2020 share buyback suspensions. Poised to Return Capital $3,176 $3,587 $4,321 $2,106 Total Payout Ratio(a) 93% 92% 105% 104% 62% Dividend Per Share $0.72 $0.86 $1.04 $1.18 $1.24 Common Shares Repurchased ($mm) 58.6 54.5 63.7 69.3 21.8 Common stock dividends ($mm) Share repurchases ($mm) $4,447 Between the second and fourth quarter of 2020 we were unable to execute our planned share buybacks due to regulatory restrictions adopted in response to the economic impact of the Covid-19 pandemic
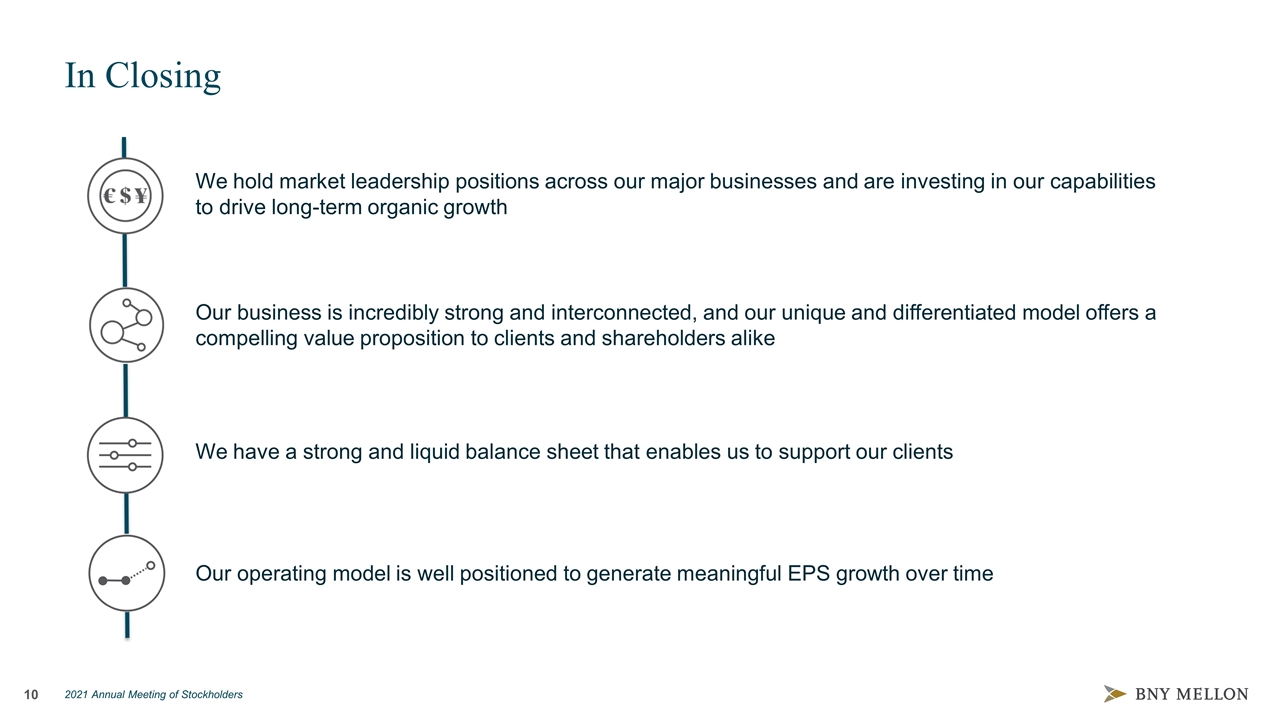
In Closing We hold market leadership positions across our major businesses and are investing in our capabilities to drive long-term organic growth Our business is incredibly strong and interconnected, and our unique and differentiated model offers a compelling value proposition to clients and shareholders alike We have a strong and liquid balance sheet that enables us to support our clients Our operating model is well positioned to generate meaningful EPS growth over time

Q&A 2021 ANNUAL MEETING OF STOCKHOLDERS
Cautionary Statement A number of statements in The Bank of New York Mellon Corporation’s (the “Corporation”) presentations, the accompanying slides and the responses to your questions are “forward-looking statements.” Words such as “estimate,” “forecast,” “project,” “anticipate,” “likely,” “target,” “expect,” “intend,” “continue,” “seek,” “believe,” “plan,” “goal,” “could,” “should,” “would,” “may,” “might,” “will,” “strategy,” “synergies,” “opportunities,” “trends,” “ambition,” “objective,” “aim,” “future”, “potentially”, “outlook” and words of similar meaning may signify forward-looking statements. These statements relate to, among other things, the Corporation’s expectations regarding: capital plans, strategic priorities, financial goals, organic growth, performance, organizational quality and efficiency, investments, including in technology and product development, capabilities, resiliency, revenue, net interest revenue, money market fee waivers, fees, expenses, cost discipline, sustainable growth, company management, human capital management (including related ambitions, objectives, aims and goals), deposits, interest rates and yield curves, securities portfolio, taxes, business opportunities, divestments, volatility, preliminary business metrics and regulatory capital ratios and statements regarding the Corporation's aspirations, as well as the Corporation’s overall plans, strategies, goals, objectives, expectations, outlooks, estimates, intentions, targets, opportunities, focus and initiatives, including the potential effects of the coronavirus pandemic on any of the foregoing. These forward-looking statements are based on assumptions that involve risks and uncertainties and that are subject to change based on various important factors (some of which are beyond the Corporation’s control). Actual outcomes may differ materially from those expressed or implied as a result of the factors described under “Forward Looking Statements” and “Risk Factors” in the Corporation’s Annual Report on Form 10-K for the year ended December 31, 2020 (the “2020 Annual Report”) and in other filings of the Corporation with the Securities and Exchange Commission (the “SEC”). Statements about the effects of the current and near-term market and macroeconomic outlook on the Corporation, including on its business, operations, financial performance and prospects, may constitute forward-looking statements, and are based on assumptions that involve risks and uncertainties and that are subject to change based on various important factors (some of which are beyond the Corporation’s control), including the scope and duration of the pandemic, actions taken by governmental authorities and other third parties in response to the pandemic, the availability, use and effectiveness of vaccines and the direct and indirect impact of the pandemic on the Corporation, its clients, customers and third parties. All forward-looking statements speak only as of April 13, 2021, and the Corporation undertakes no obligation to update any forward-looking statement to reflect events or circumstances after that date or to reflect the occurrence of unanticipated events. For additional information regarding the Corporation, please refer to the Corporation's SEC filings available at www.bnymellon.com/investorrelations. Non-GAAP Measures: In this presentation we discuss certain non-GAAP measures in detailing the Corporation’s performance, which exclude certain items or otherwise include components that differ from GAAP. We believe these measures are useful to the investment community in analyzing the financial results and trends of ongoing operations. We believe they facilitate comparisons with prior periods and reflect the principal basis on which the Corporation’s management monitors financial performance. Additional disclosures relating to non-GAAP measures are contained in the Corporation’s reports filed with the SEC, including the 2020 Annual Report, and are available at www.bnymellon.com/investorrelations.

Appendix 2021 ANNUAL MEETING OF STOCKHOLDERS
Page 2 As of December 31, 2020. Consists of AUC/A primarily from the Asset Servicing business and, to a lesser extent, the Clearance and Collateral Management, Issuer Services, Pershing and Wealth Management businesses. Includes the AUC/A of CIBC Mellon Global Securities Services Company, a joint venture with the Canadian Imperial Bank of Commerce of $1.5 trillion at December 31, 2020. Source of ranking based on peer group company filing as of December 31, 2020. Peer group included in ranking analysis: STT, JPM, C, BNP, HSBC, NTRS and RBC. Corporate Trust source rankings as of December 31, 2020: Thomson Reuters/Refinitiv, Dealogic, Asset-Backed Alert, Concept ABS and Artemis; #1 in Straight debt based on deal count source Dealogic and Thomson Reuters/Refinitiv, #2 in Structured based on deal size source Asset-Backed Alert and Concept ABS, #2 in U.S. municipal debt based on deal count source Thomson Reuters/Refinitiv, and #1 in Catastrophe bonds based on deal size source Artemis. Depositary Receipts ranking as of December 31, 2020: ranked #1 based on market share sourced from BNY internal analysis. Ranked #1 in clearing firms by number of broker dealer clients source LaRoche Database, Pershing, introducing firm accounts only as of June 30, 2020. Assets on leading corresponding clearing platforms and RIA custodians as of December 31, 2019. As of December 31, 2020. Excludes securities lending cash management assets and assets managed in the Investment Services business. As of December 31, 2020. Includes AUM and AUC/A in the Wealth Management business. 7th Largest Asset Manager Worldwide: Pensions & Investments, June 1, 2020. Ranked by total worldwide institutional assets under management as of December 31, 2019. Cerulli Associates, The Cerulli Report—U.S. High-Net-Worth and Ultra-High-Net-Worth Markets 2020: Implications of Wealth Concentration. Assets under management as of December 31, 2019. Page 3 Fortune 500: Fortune, Time Inc. ©2020. BNY Mellon data as of December 31, 2020. Broker-Dealers: Investment News, InvestmentNews LLC ©2020. BNY Mellon data as of September 30, 2020. Investment Managers: Pensions & Investments, P&I Crain Communications Inc. ©2020. BNY Mellon data as of December 31, 2019. Pensions and Employee Benefits: Pensions & Investments, P&I Crain Communications Inc. ©2020. Pensions and Investments. BNY Mellon data as of September 30, 2020. Life and Health Insurance Companies: A.M. Best, A.M. Best Company, Inc. ©2020. BNY Mellon data as of December 31, 2019. Banks: relbanks.com, Relbanks.com ©2011-2018. BNY Mellon data as of December 31, 2019. Page 7 Compared to 2019, on a reported basis, 2020 revenue decreased 4%, noninterest expense increased 1%, net income applicable to common shareholders decreased 20%, pre-tax operating margin decreased 6% and diluted EPS decreased 15%. For 2020, return on common shareholders' equity was 8.7%. Page 8 Minimum requirements for December 31, 2020 include minimum thresholds plus currently applicable buffers. The U.S. global systemically important banks (“G-SIB”) surcharge of 1.5% is subject to change. The countercyclical capital buffer is currently set to 0%. Effective October 1, 2020, the SCB requirement is 2.5%, equal to the regulatory minimum, and replaces the current 2.5% capital conservation buffer for Standardized Approach capital ratios. For our CET1 ratio, our effective capital ratios under U.S. capital rules are the lower of the ratios as calculated under the Standardized and Advanced Approaches. The Tier 1 leverage ratio is based on Tier 1 capital and quarterly average total assets. The SLR is based on Tier 1 capital and total leverage exposure, which includes certain off-balance sheet exposures. The SLR at December 31, 2020 reflects the exclusion of certain central bank placements from total leverage exposure. The consolidated SLR at December 31, 2020 reflects the temporary exclusion of U.S. Treasury securities from total leverage exposure which increased our consolidated SLR by 72 basis points. Federal Reserve Comprehensive Capital Analysis and Review. December 2020 Stress Test. BNY Mellon capital drawdown of 0.8% versus G-SIB average of 2.5%, excluding BNY Mellon. Page 9 In March of 2020 we temporarily suspended share repurchases jointly with the Financial Services Forum through 2Q 2020. In June 2020, participating CCAR firms, including us, were not permitted to increase their common stock dividends or conduct open market common stock repurchases in 3Q 2020 due to the Federal Reserve’s restrictions which were extended through 4Q 2020.
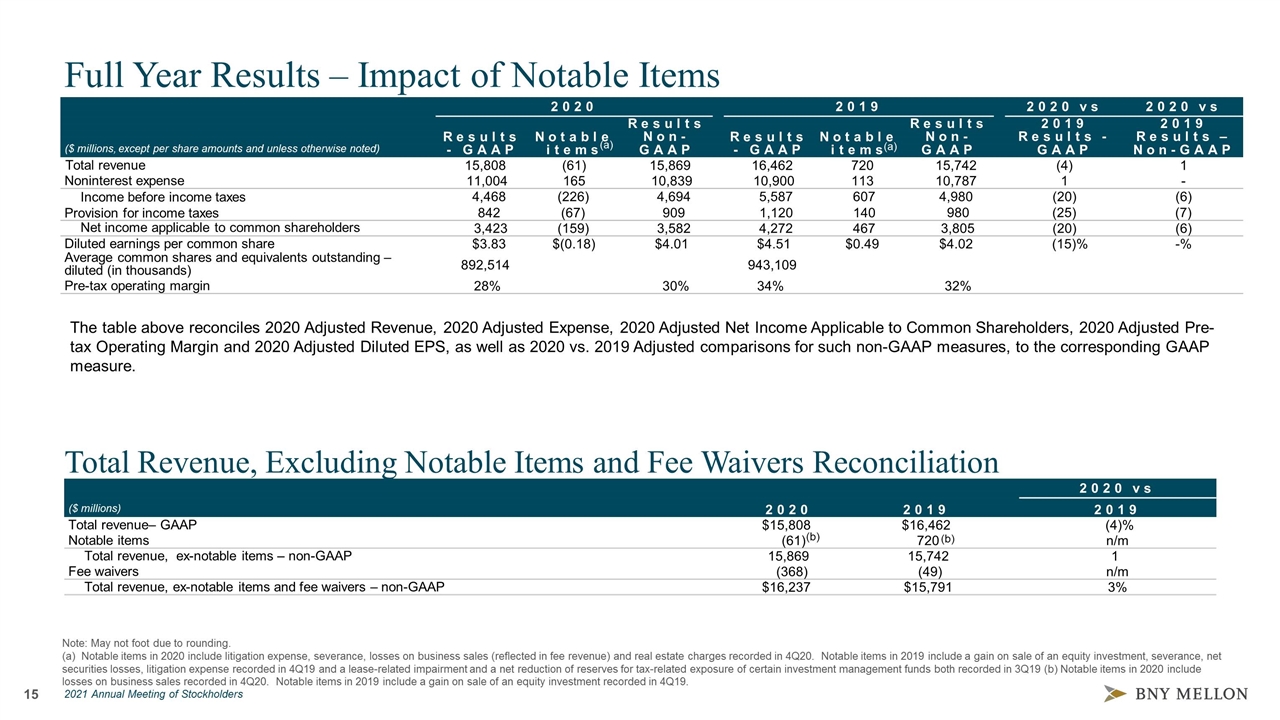
Full Year Results – Impact of Notable Items 2020 2019 2020 vs 2020 vs ($ millions, except per share amounts and unless otherwise noted) Results - GAAP Notable items Results Non-GAAP Results - GAAP Notable items Results Non-GAAP 2019 Results - GAAP 2019 Results – Non-GAAP Total revenue 15,808 (61) 15,869 16,462 720 15,742 (4) 1 Noninterest expense 11,004 165 10,839 10,900 113 10,787 1 - Income before income taxes 4,468 (226) 4,694 5,587 607 4,980 (20) (6) Provision for income taxes 842 (67) 909 1,120 140 980 (25) (7) Net income applicable to common shareholders 3,423 (159) 3,582 4,272 467 3,805 (20) (6) Diluted earnings per common share $3.83 $(0.18) $4.01 $4.51 $0.49 $4.02 (15)% -% Average common shares and equivalents outstanding – diluted (in thousands) 892,514 943,109 Pre-tax operating margin 28% 30% 34% 32% (a) (a) Note: May not foot due to rounding. (a) Notable items in 2020 include litigation expense, severance, losses on business sales (reflected in fee revenue) and real estate charges recorded in 4Q20. Notable items in 2019 include a gain on sale of an equity investment, severance, net securities losses, litigation expense recorded in 4Q19 and a lease-related impairment and a net reduction of reserves for tax-related exposure of certain investment management funds both recorded in 3Q19 (b) Notable items in 2020 include losses on business sales recorded in 4Q20. Notable items in 2019 include a gain on sale of an equity investment recorded in 4Q19. 2020 vs ($ millions) 2020 2019 2019 Total revenue– GAAP $15,808 $16,462 (4)% Notable items (61) 720 n/m Total revenue, ex-notable items – non-GAAP 15,869 15,742 1 Fee waivers (368) (49) n/m Total revenue, ex-notable items and fee waivers – non-GAAP $16,237 $15,791 3% Total Revenue, Excluding Notable Items and Fee Waivers Reconciliation (b) (b) The table above reconciles 2020 Adjusted Revenue, 2020 Adjusted Expense, 2020 Adjusted Net Income Applicable to Common Shareholders, 2020 Adjusted Pre-tax Operating Margin and 2020 Adjusted Diluted EPS, as well as 2020 vs. 2019 Adjusted comparisons for such non-GAAP measures, to the corresponding GAAP measure.
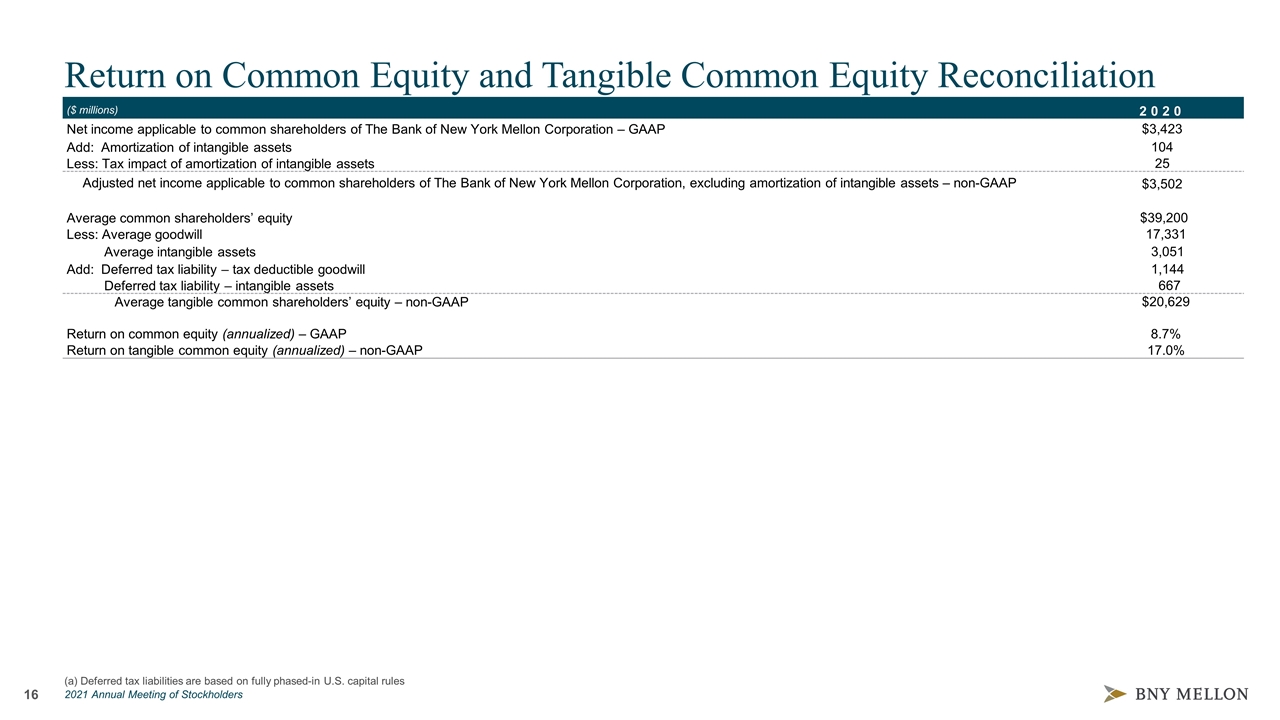
Return on Common Equity and Tangible Common Equity Reconciliation (a) Deferred tax liabilities are based on fully phased-in U.S. capital rules ($ millions) 2020 Net income applicable to common shareholders of The Bank of New York Mellon Corporation – GAAP $3,423 Add: Amortization of intangible assets 104 Less: Tax impact of amortization of intangible assets 25 Adjusted net income applicable to common shareholders of The Bank of New York Mellon Corporation, excluding amortization of intangible assets – non-GAAP $3,502 Average common shareholders’ equity $39,200 Less: Average goodwill 17,331 Average intangible assets 3,051 Add: Deferred tax liability – tax deductible goodwill 1,144 Deferred tax liability – intangible assets 667 Average tangible common shareholders’ equity – non-GAAP $20,629 Return on common equity (annualized) – GAAP 8.7% Return on tangible common equity (annualized) – non-GAAP 17.0%
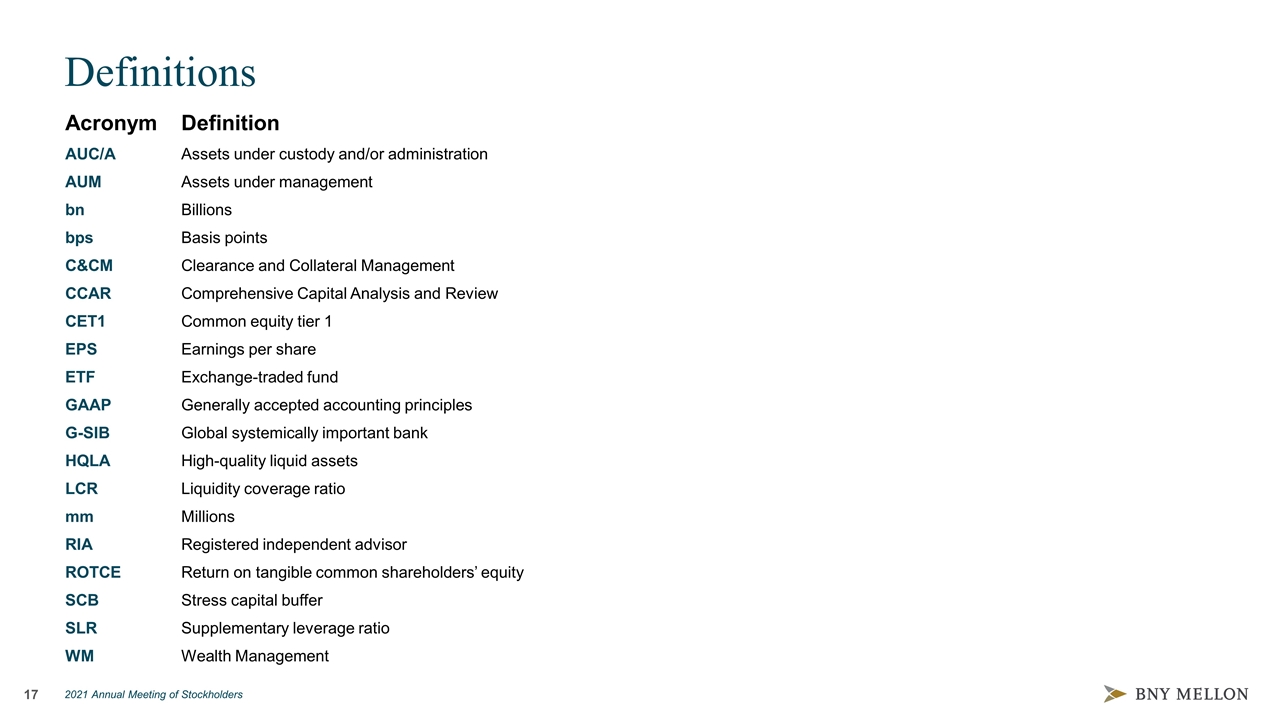
Definitions Acronym Definition AUC/A Assets under custody and/or administration AUM Assets under management bn Billions bps Basis points C&CM Clearance and Collateral Management CCAR Comprehensive Capital Analysis and Review CET1 Common equity tier 1 EPS Earnings per share ETF Exchange-traded fund GAAP Generally accepted accounting principles G-SIB Global systemically important bank HQLA High-quality liquid assets LCR Liquidity coverage ratio mm Millions RIA Registered independent advisor ROTCE Return on tangible common shareholders’ equity SCB Stress capital buffer SLR Supplementary leverage ratio WM Wealth Management

