Attached files
| file | filename |
|---|---|
| 8-K - 8-K - ZUORA INC | zuo-20210412.htm |
| EX-99.1 - EX-99.1 - ZUORA INC | a202104128-kexhibit991.htm |

Investor Day April 12, 2021 Exhibit 99.2

Statements in this presentation and the accompanying oral presentation include “forward looking statements” within the meaning of the Private Securities Litigation Reform Act of 1995. These forward-looking statements may be identified by the use of words such as "anticipate," "expect," "intend," "goal," "plan," "believe," "seek," "estimate," "continue," "may," "will," “would,” "should," “could,” and variations of such words and similar expressions. All statements other than statements of historical fact could be deemed forward-looking. Statements that refer to or are based on estimates, forecasts, projections, uncertain events or assumptions, including statements relating to total addressable market (TAM) or market opportunity, future products and the expected availability and benefits of such products, and anticipated trends in our businesses or the markets relevant to them, also identify forward-looking statements. These expectations or any of the forward looking statements involve many risks and uncertainties that could prove to be incorrect, and actual results or outcomes could differ materially from those projected or assumed in the forward looking statements. Additional information regarding these and other risks and uncertainties is included in Zuora’s Annual Report on Form 10-K (2021 Form 10-K) filed with the Securities and Exchange Commission (SEC) on March 31, 2021, as well as other documents that may be filed or furnished by us from time to time with the SEC. This presentation also contains estimates and other statistical data made by independent parties and by us relating to market size and growth and other information about our industry. This data involves a number of assumptions and limitations, and you are cautioned not to give undue weight to such estimates. In addition, projections, assumptions and estimates of our future performance and future performance of the markets in which we operate are necessarily subject to a high degree of uncertainty and risk and actual events or circumstances may differ materially from events and circumstances reflected in this information. This presentation contains non-GAAP financial measures. You can find the reconciliation of these measures to the most directly comparable GAAP financial measure in the Appendix at the end of this presentation. The non-GAAP financial measures disclosed by Zuora should not be considered a substitute for, or superior to, the financial measures prepared in accordance with GAAP. Please refer to “Non-GAAP Financial Measures” disclosure in our 2021 Form 10-K for a detailed explanation of the adjustments made to the comparable GAAP measures, the ways management uses the non-GAAP measures and the reasons why management believes the non-GAAP measures provide investors with useful supplemental information. The forward-looking statements included in this presentation reflects our views as of April 12, 2021, unless an earlier date is indicated. Zuora does not undertake and expressly disclaims any obligation to update any statement made in this presentation, whether as a result of new information, new developments or otherwise, except to the extent that disclosure may be required by law. In addition, a glossary of terms is provided in the Appendix at the end of this presentation. Zuora, the Zuora logo, Zuora Revenue, Zuora Billing, Zuora Central Platform, Subscription Economy, Powering the Subscription Economy, and Subscription Economy Index and other registered or common law trade names, trademarks, or service marks of ours appearing in this presentation are our property. This presentation also contains trade names, trademarks, and service marks of other companies, including, but not limited to, our customers, technology partners, and competitors that are the property of their respective owners. We do not intend our use of other companies’ trade names, trademarks, or service marks to imply a relationship with, or endorsement or sponsorship of us by, these companies. Disclosures

Time (PT) Subject Presenters 10:00am PT What is Our Market Opportunity? Tien Tzuo, Chief Executive Officer of Zuora 10:14am PT Customer Interview: Jug Bath, CTO, Chegg Learning Services Moderator: Tien Tzuo, CEO of Zuora 10:26am PT Product: A Platform to Deliver Enterprise Subscription Experiences Sri Srinivasan, Chief Product & Engineering Officer of Zuora 10:55am PT Customer Interview: Velchamy Sankarlingam, President of Product and Engineering, Zoom Video Communications Moderator: Tien Tzuo, CEO of Zuora 11:05am PT Break 11:15am PT GTM: Driving Growth with Enterprise Transformation Robbie Traube, Chief Revenue Officer of Zuora 11:33am PT Partner Interview: Matt Candy, Global Managing Partner, IBM Moderator: Robbie Traube, CRO of Zuora 11:45am PT How Will This Result in Strong and Sustainable Growth? Todd McElhatton, Chief Financial Officer of Zuora 12:00pm PT Q&A All Zuora Executives Zuora Investor Day 2021 - Agenda 3

The Opportunity Tien Tzuo, Founder & Ceo

8 OF TOP 10 AUTO MANUFACTURERS powered by Zuora 21 MAJOR NEWSPAPER PUBLISHING GROUPS powered by Zuora 600+ INNOVATORS IN HIGH TECH powered by Zuora 26 OF FORTUNE 100 powered by Zuora OUR VISION: The World. Subscribed. OUR MISSION: To help the world’s best companies win in the subscription economy.
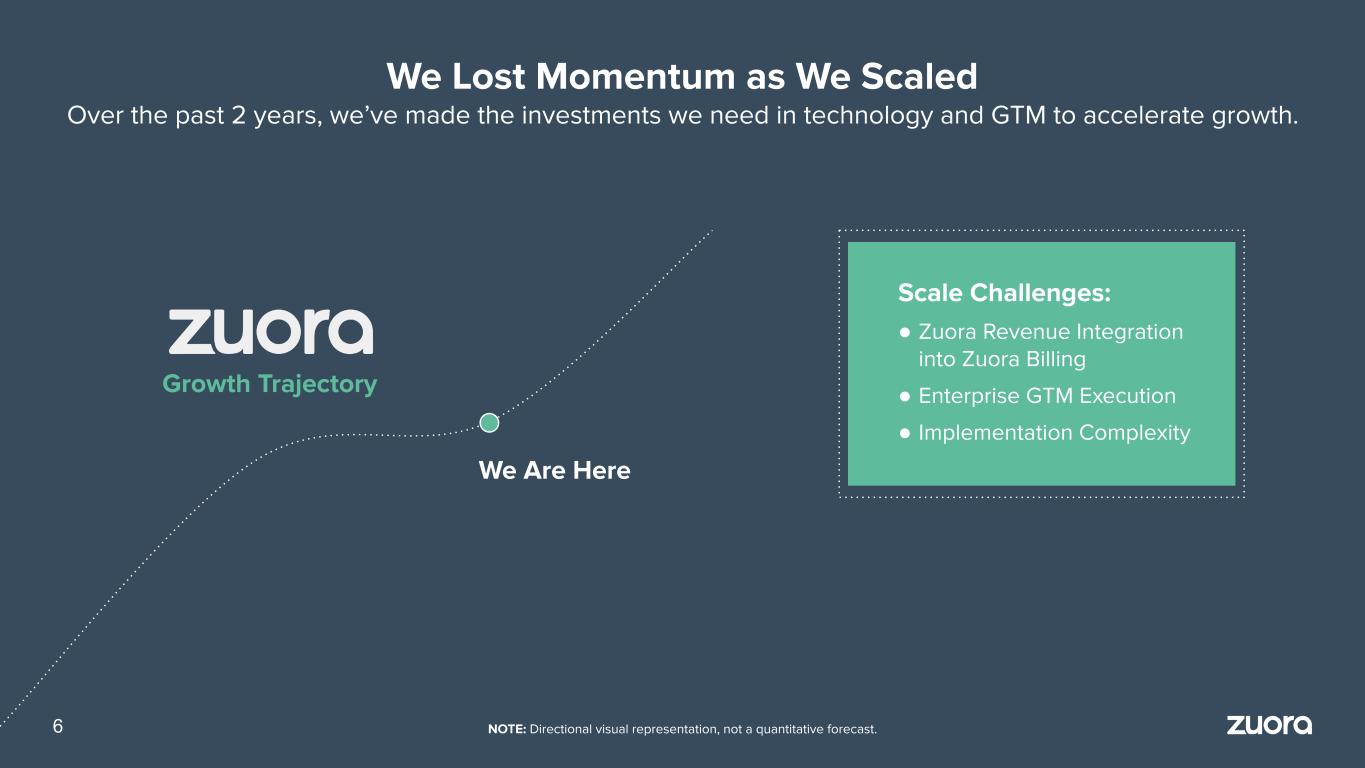
We Lost Momentum as We Scaled Over the past 2 years, we’ve made the investments we need in technology and GTM to accelerate growth. Growth Trajectory NOTE: Directional visual representation, not a quantitative forecast.6 We Are Here Scale Challenges: ● Zuora Revenue Integration into Zuora Billing ● Enterprise GTM Execution ● Implementation Complexity

Today You’ll Hear from the Team Driving Our Evolution Robbie Traube Chief Revenue Officer Joined November 2019 Sri Srinivasan Chief Product & Engineering Officer Joined January 2021 Todd Mcelhatton Chief Financial Officer Joined June 2020 7

Source: The Harris Report, “The End of Ownership Report”, 2021. https://www.zuora.com/resource/the-end-of-ownership/ 8 Is a person’s status no longer defined by what they own? 65% U.S. 68% France 69% U.K. 65% Netherlands 58% Germany 65% Spain 68% Italy 75% China 77% Singapore 72% Japan 67% Australia 66% New Zealand The World’s Economic Value Has Shifted from Ownership to Usership % of population who would prefer to own fewer things.

Technology Usership Has Created the Subscription Economy Transformation impacting every industry. Software as a service Mobility as a service Patient outcomes Subscribers Finance as a service “Pay as you throw” Automobile Medical Media Hardware Car ownership Health care Ad sold Financial Insurance Government Waste 9

Subscriptions Will Inevitably Become the Dominant Business Model 10 1By 2023, IDC estimates that products and services from digitally determined organizations will make up over 50% of the global GDP. Source: IDC report titled IDC FutureScape: Worldwide Monetization 2021 Predictions, Mark Thomason, October 2020, IDC #US4624692. 2Source: https://www.ey.com/en_us/performance-improvement/how-to-holistically-plan-for-switching-to-a-subscription-selling-model 3Source:https://gtnr.it/3mxG0ow 4Source: https://www.businesswire.com/news/home/20201208005393/en Tomorrow Broad Subscription Adoption Source: Gartner3 Now Default for Leading Edge Source: Ernst & Young2 The Future A Subscriber-Centric World Source: IDC4 75% of all consumer facing companies will deliver subscription services >50% of all global Gross domestic product (GDP)1 90% of tech companies are embracing subscriptions

Incumbents Are Now Moving with Disruptors 100 year old companies began to finally embrace subscription models. Incumbents 11 Disruptors
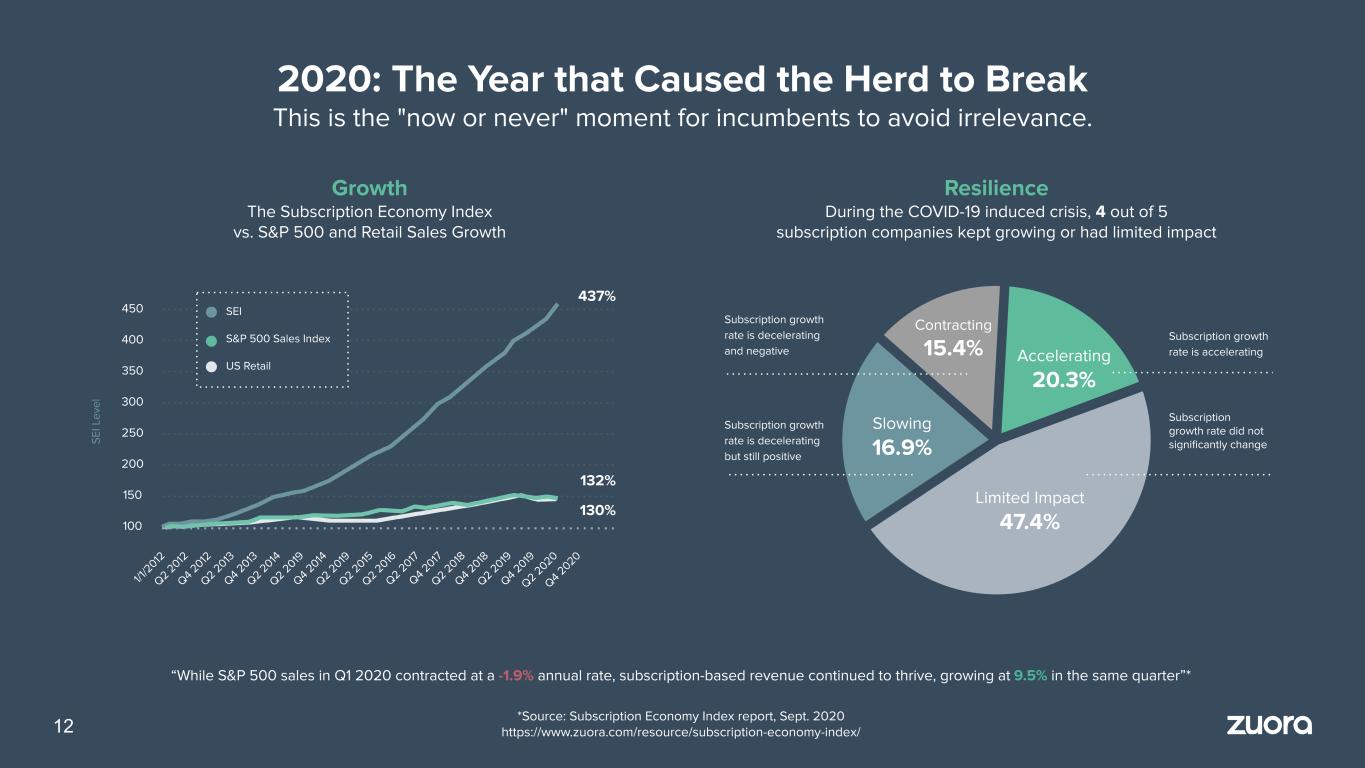
2020: The Year that Caused the Herd to Break This is the "now or never" moment for incumbents to avoid irrelevance. “While S&P 500 sales in Q1 2020 contracted at a -1.9% annual rate, subscription-based revenue continued to thrive, growing at 9.5% in the same quarter”* *Source: Subscription Economy Index report, Sept. 2020 https://www.zuora.com/resource/subscription-economy-index/ Growth The Subscription Economy Index vs. S&P 500 and Retail Sales Growth Resilience During the COVID-19 induced crisis, 4 out of 5 subscription companies kept growing or had limited impact Subscription growth rate is decelerating and negative Subscription growth rate is decelerating but still positive Subscription growth rate is accelerating Subscription growth rate did not significantly change 12 1/1 /2 01 2 Q 2 20 12 Q 4 20 12 Q 2 20 13 Q 4 20 13 Q 2 20 14 Q 4 20 14 Q 2 20 15 Q 2 20 16 Q 2 20 17 Q 4 20 17 Q 2 20 18 Q 4 20 18 Q 2 20 19 Q 4 20 19 Q 2 20 20 Q 4 20 20 Q 2 20 19 Q 2 20 19 450 400 350 300 250 200 150 100 437% Slowing 16.9% Limited Impact 47.4% Accelerating 20.3% Contracting 15.4% 132% 130% SEI S&P 500 Sales Index US Retail S E I L e ve l

2020: The Best Companies Were Prepared Zoom launches free offerings, including for K-12 and grows users by 30X Resy provides billing relief for restaurants Fender extends free trials to 1 million customers 13 *Source: Zoom growth between Dec 19 and April 2020 https://blog.zoom.us/how-to-use-zoom-for-online-learning/

They’re Transforming the Nature of Their Business Models Product-Centric Business Model Customer-Centric Business Model Channels Experience Service Subscriber Customer Product Channels One-time product purchase Products as-a-service Revenue tied to product sales Revenue tied to customer usage Growth through unit margins Growth over customer lifetime 14

Building the Dominant Subscriber Experience for Every Industry Re-imagine the Healthcare Experience 15 Re-imagine the Financial Services Experience Re-imagine the Transportation Experience
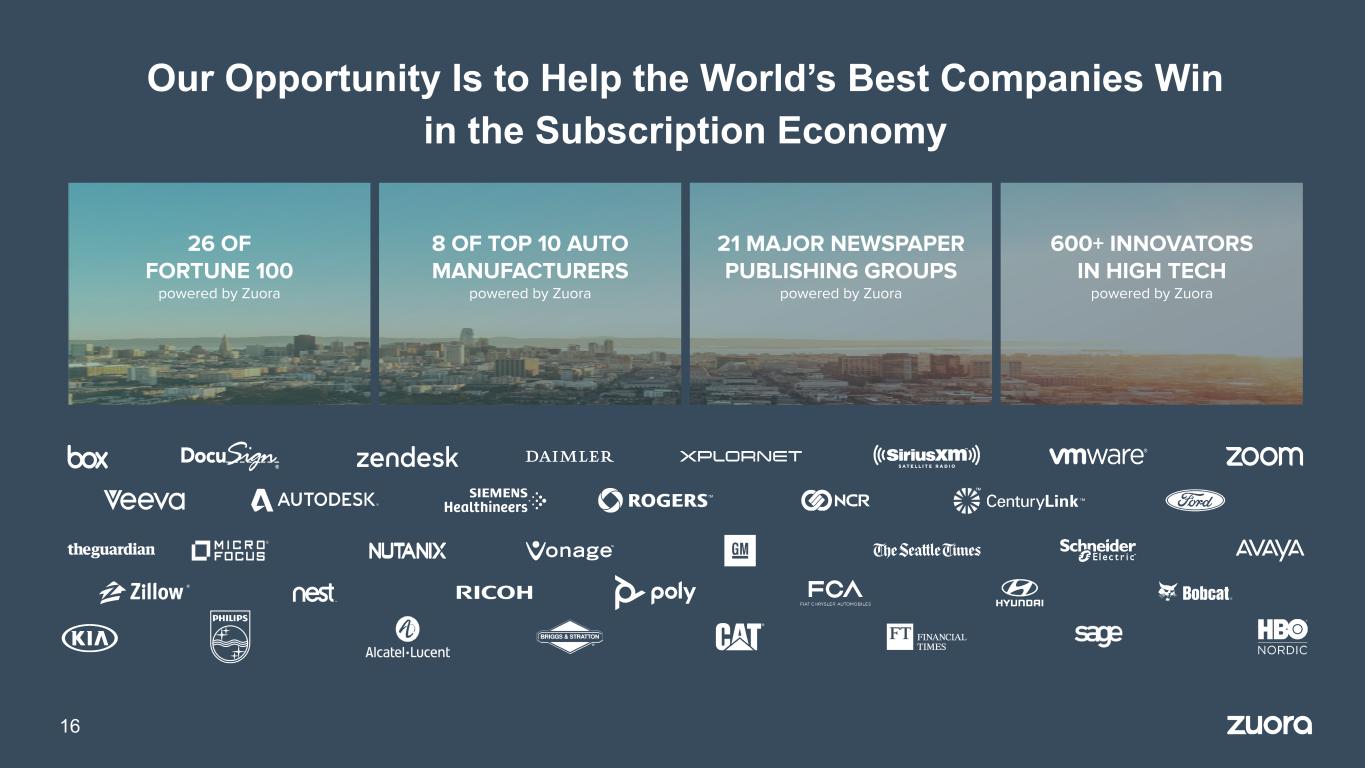
16 Our Opportunity Is to Help the World’s Best Companies Win in the Subscription Economy 8 OF TOP 10 AUTO MANUFACTURERS powered by Zuora 21 MAJOR NEWSPAPER PUBLISHING GROUPS powered by Zuora 600+ INNOVATORS IN HIGH TECH powered by Zuora 26 OF FORTUNE 100 powered by Zuora
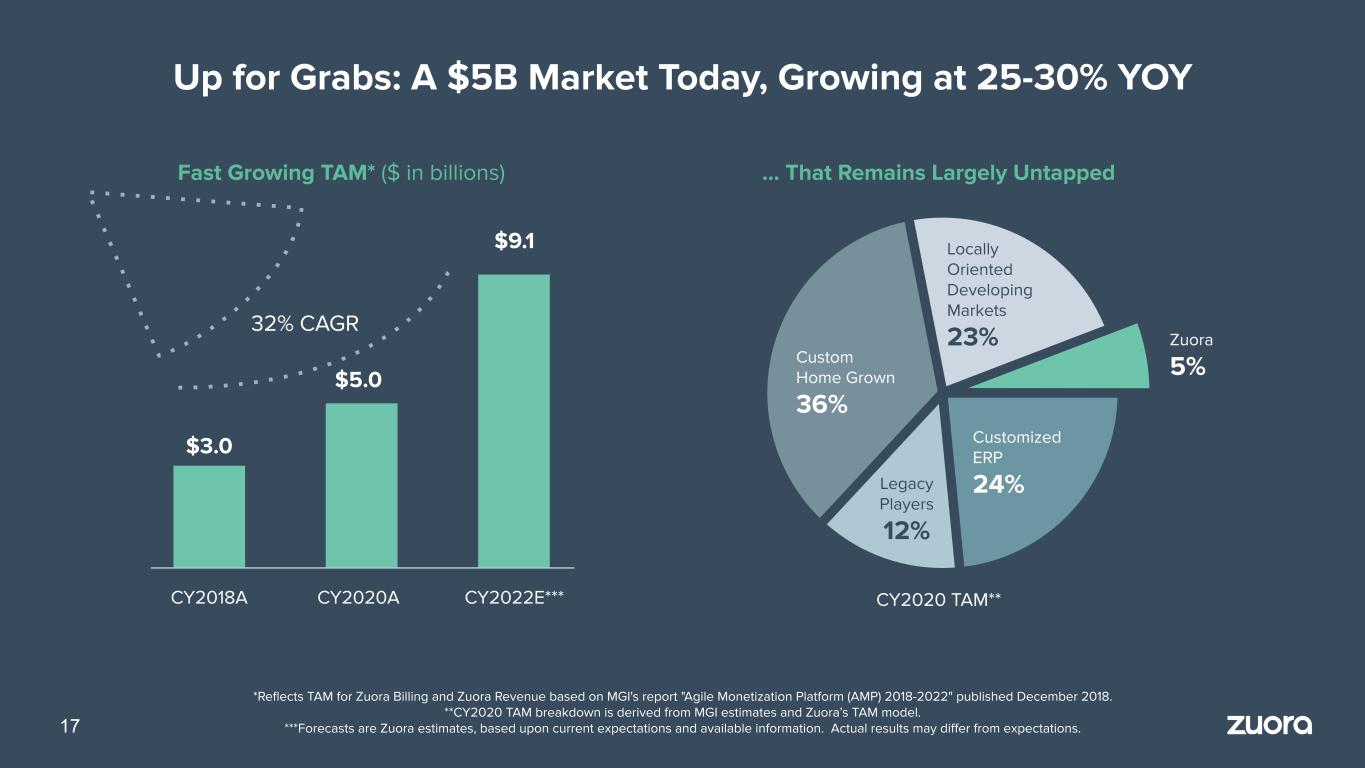
Zuora 5% $9.1 $5.0 $3.0 CY2022E***CY2020ACY2018A 32% CAGR 17 *Reflects TAM for Zuora Billing and Zuora Revenue based on MGI's report "Agile Monetization Platform (AMP) 2018-2022" published December 2018. **CY2020 TAM breakdown is derived from MGI estimates and Zuora’s TAM model. ***Forecasts are Zuora estimates, based upon current expectations and available information. Actual results may differ from expectations. Up for Grabs: A $5B Market Today, Growing at 25-30% YOY Fast Growing TAM* ($ in billions) … That Remains Largely Untapped CY2020 TAM** Custom Home Grown 36% Customized ERP 24% Locally Oriented Developing Markets 23% Legacy Players 12%

Evolution in Company Mix Disruptors and now enterprise incumbents, racing to stay relevant and re-invent themselves for the next 100 years Evolution in Technology Needs Solutions to help transform business models, and to deliver holistic, differentiated experiences to customers over time Evolution in Business Needs A partner who can guide and support them throughout their journey Subscription Economy Evolution Zuora Evolution Disruptors + Incumbents From supporting any disruptor, to focusing on companies with enterprise potential and transforming the incumbents Platform Supporting Transformation From best-in-class, back-office applications to a platform that drives business transformation Enterprise GTM From selling apps, to guiding enterprise companies on their Journey to Usership 18

The Forrester Wave: SaaS Billing Solutions, Q4 2019 The Forrester Wave™ is copyrighted by Forrester Research, Inc. Forrester and Forrester Wave are trademarks of Forrester Research, Inc. The Forrester Wave is a graphical representation of Forrester's call on a market and is plotted using a detailed spreadsheet with exposed scores, weightings, and comments. Forrester does not endorse any company, product, or service depicted in the Forrester Wave. Information is based on best available resources. Opinions reflect judgment at the time and are subject to change. IDC: Worldwide Subscription Management Marketscape, 2019-2020 DC MarketScape vendor assessment model is designed to provide an overview of the competitive fitness of ICT (information and communications technology) suppliers in a given market. The research methodology utilizes a rigorous scoring methodology based on both qualitative and quantitative criteria that results in a single graphical illustration of each vendor’s position within a given market. IDC MarketScape provides a clear framework in which the product and service offerings, capabilities and strategies, and current and future market success factors of IT and telecommunications vendors can be meaningfully compared. The framework also provides technology buyers with a 360-degree assessment of the strengths and weaknesses of current and prospective vendors. Our Starting Point: Best in Class Applications 19

These Experiences Span the Full Customer Lifecycle Example Customer 1.0 Subscriber Journey (outside-in view) Example Customer 1.0 Delivery System (inside-out view) Discovers Registers Accesses Uses/Adjusts Troubleshoots Renews ExpandsExplores Bills CollectsRates Closes ReportsRecognizePromotes Onboards Engages Supports Incentivizes Up/Cross Sells Accessibility is inconsistent across markets Registration process feels too rigid, while the pricing schema is hard to understand Only basic user dashboard capabilities It is unclear where, when and how memberships and subscriptions connect Subscribers have very limited ability to adjust their subscriptions Unclear if [CUSTOMER] has dedicated support channels for subscribers This is the only chance existing subscribers have to adjust their plans Currently no options for subscribers to pivot from/to or expand their subscriptions 20

Now, We’ve Built the Platform to Deliver these Differentiated Customer Experiences Organizes the data, orchestrates the complexity, and delivers the agility required for modern subscriber experiences. ZUORA SUBSCRIPTION EXPERIENCE CLOUD 21

Our Platform Strategy Supports 3 Beachhead Applications to Start Unlocking New Growth Vectors Zuora Billing Zuora Revenue Zuora Collect Strong differentiation accelerating cross-sell ROI that sells itself one-click deployment Hands-down leader unlocking TAM expansion 22
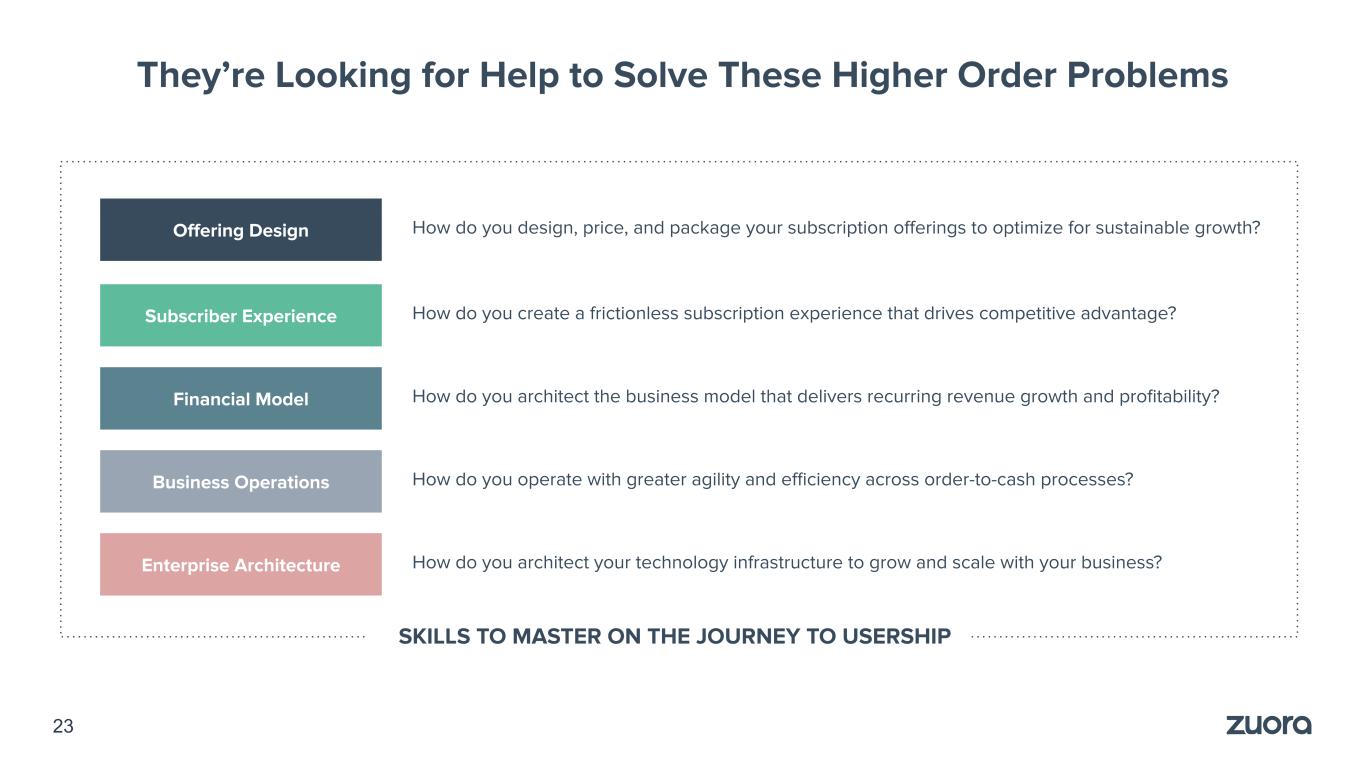
They’re Looking for Help to Solve These Higher Order Problems Offering Design Subscriber Experience Enterprise Architecture Financial Model How do you design, price, and package your subscription offerings to optimize for sustainable growth? How do you create a frictionless subscription experience that drives competitive advantage? How do you architect your technology infrastructure to grow and scale with your business? How do you architect the business model that delivers recurring revenue growth and profitability? Business Operations How do you operate with greater agility and efficiency across order-to-cash processes? SKILLS TO MASTER ON THE JOURNEY TO USERSHIP 23
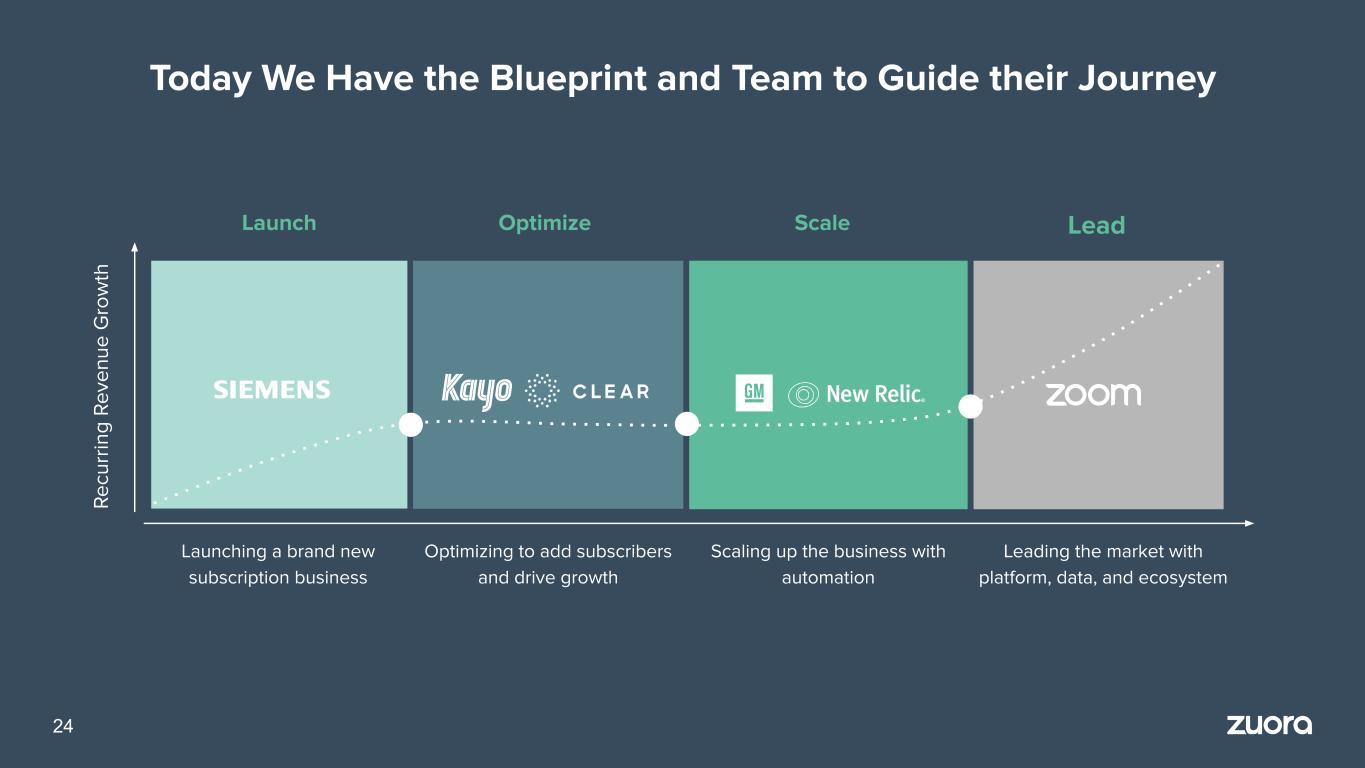
24 Today We Have the Blueprint and Team to Guide their Journey Launch Optimize LeadScale R e cu rr in g R e ve n u e G ro w th Leading the market with platform, data, and ecosystem Scaling up the business with automation Optimizing to add subscribers and drive growth Launching a brand new subscription business

The “S” Curve (Cumulative Free-to-Fee Conversion Rate) Days After Customer Sign-up C u m u la tiv e C o n ve rs at io n R at e Can [CUSTOMER] push the “S” curve UP AND LEFT? Source: Zuora SSG and Close Research, 2019 Benchmark “S” Curve (10 SaaS Companies) [CUSTOMER] Connected Services “S” Curve (10% Conversion Assumption) 25 100,0% 75.0% 50.0% 25.0% 0.0% 10 30 50 70 90 110 130 150 170 Example Customer Engagement Our Data Helps Us Guide Customers in Ways No One Else Can
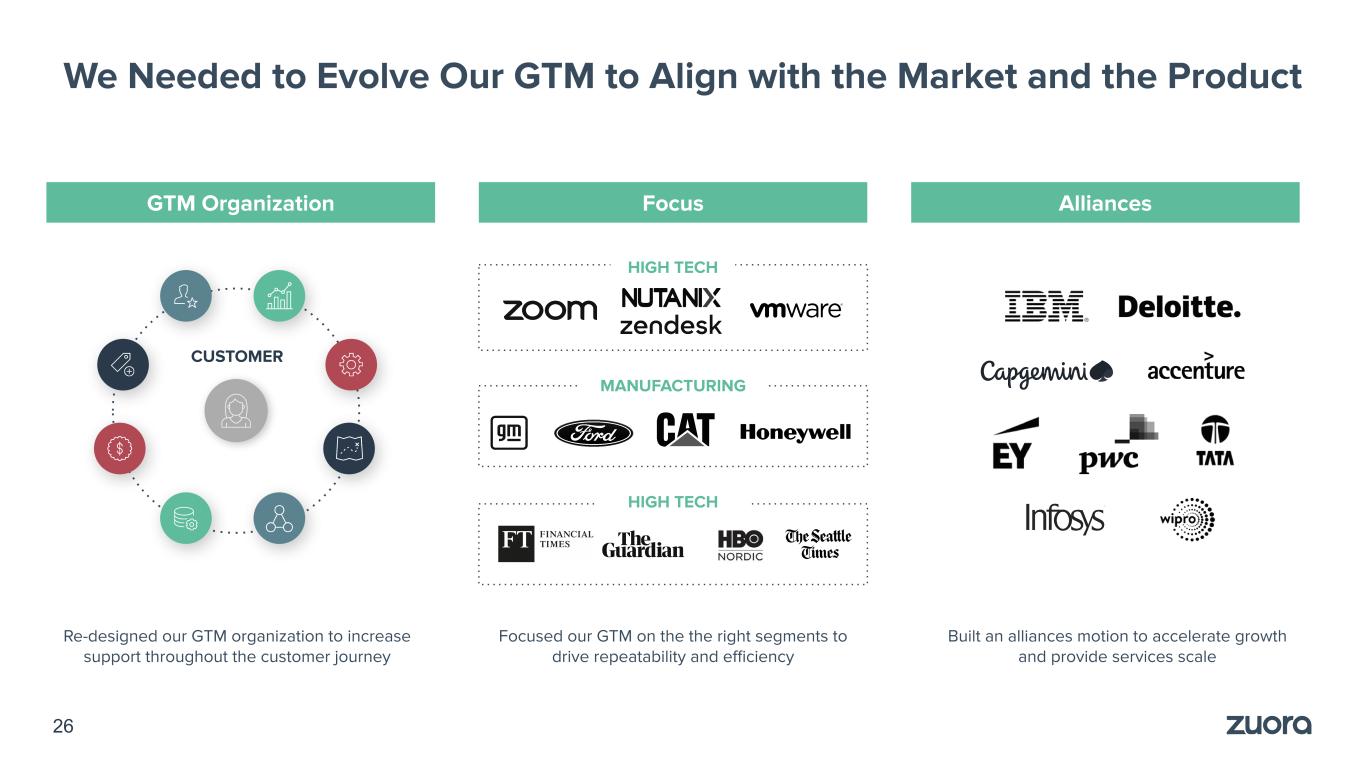
HIGH TECH We Needed to Evolve Our GTM to Align with the Market and the Product FocusGTM Organization Alliances HIGH TECH MANUFACTURING Focused our GTM on the the right segments to drive repeatability and efficiency Built an alliances motion to accelerate growth and provide services scale Re-designed our GTM organization to increase support throughout the customer journey CUSTOMER 26
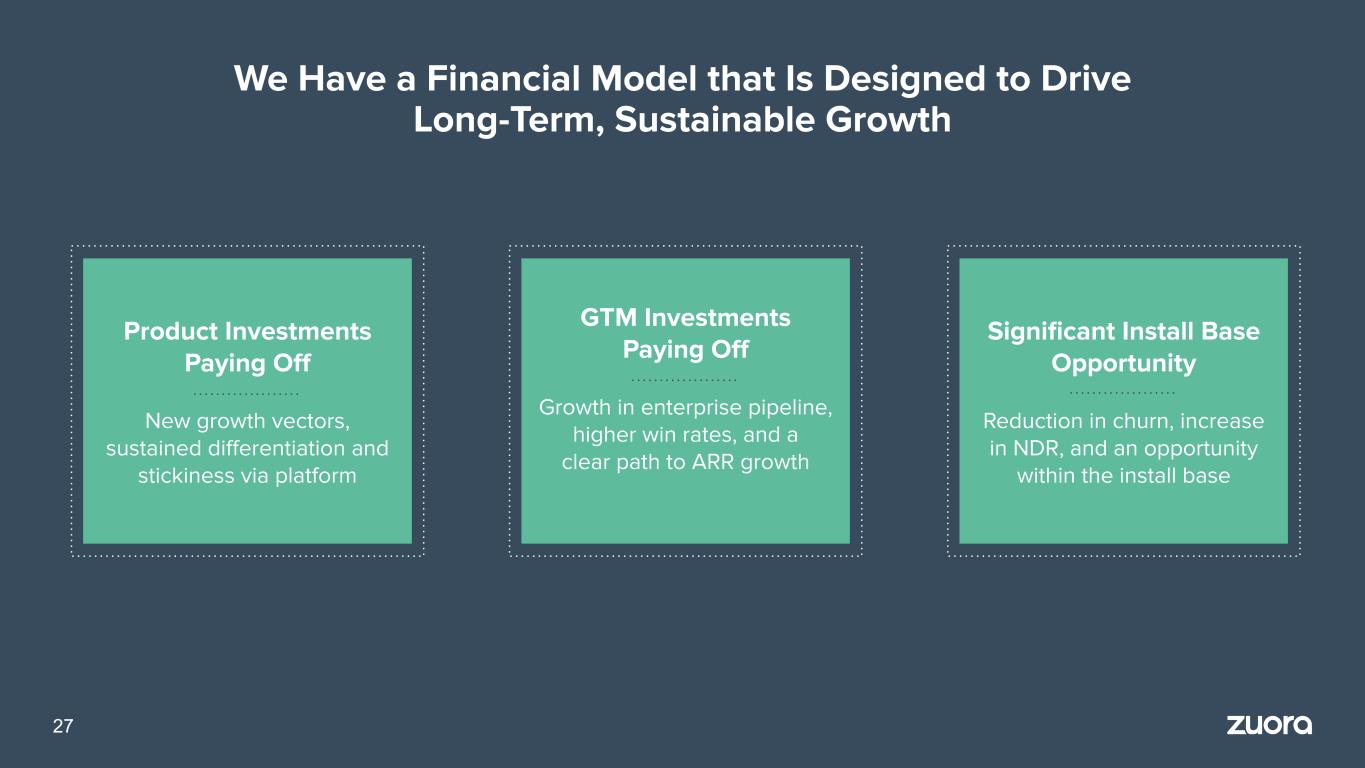
We Have a Financial Model that Is Designed to Drive Long-Term, Sustainable Growth 27 Product Investments Paying Off New growth vectors, sustained differentiation and stickiness via platform GTM Investments Paying Off Growth in enterprise pipeline, higher win rates, and a clear path to ARR growth Significant Install Base Opportunity Reduction in churn, increase in NDR, and an opportunity within the install base

Jug Bath CTO of Chegg Customer Interview

The Product Sri Srinivasan, Chief Product & Engineering Officer

The Core Tenants of Our Product Strategy 30 1 Purpose built with subscription as the fulcrum 2 Central Platform is the key to our future 3 Transforming into a multi-product company 4 Multi-vector land-and-expand strategy

The Subscription Economy Has Changed the Way Businesses Think and Operate One-Time Purchase Ongoing Experience 31 Access Safety Navigation Music Diagnostics

Data: Businesses Need Insights Oriented Around Subscribers, Not Products Product-Centric Data Subscriber-Centric Insights Units Sold Inventory Margin Revenue Unit Price COGS Returns ✘ Who is the customer and what do they want next? Subscriber data has 100X more volume than product data Price Plan Lifetime Value Favorite Music Potential Upgrades Monthly Miles Driving Incidents Geographic Location Churn Signals 32

Processes: Businesses Need to Orchestrate Dynamic Subscriber Experiences, Not Linear Product Workflows Linear Product Workflows Dynamic Subscriber Experiences Order Pick Pack Replenish 60% of all subscriptions change after the initial sign-up and average 4 changes per subscription per year* Order Car Ship Track Invoice PayShip Car Return Diagnose Repair ScrapReturn Car Subscribe to Mobility Add Music Package Upgrade Security Downgrade GPS Tracking ✘ Is it the same customer? ✘ How was their experience? ✘ What value did they gain or lose? Suspend Diagnostics Resume Diagnostics Renew Subscription Add Driver 33 *Source: Subscribed Institute Benchmark: Subscription Changes
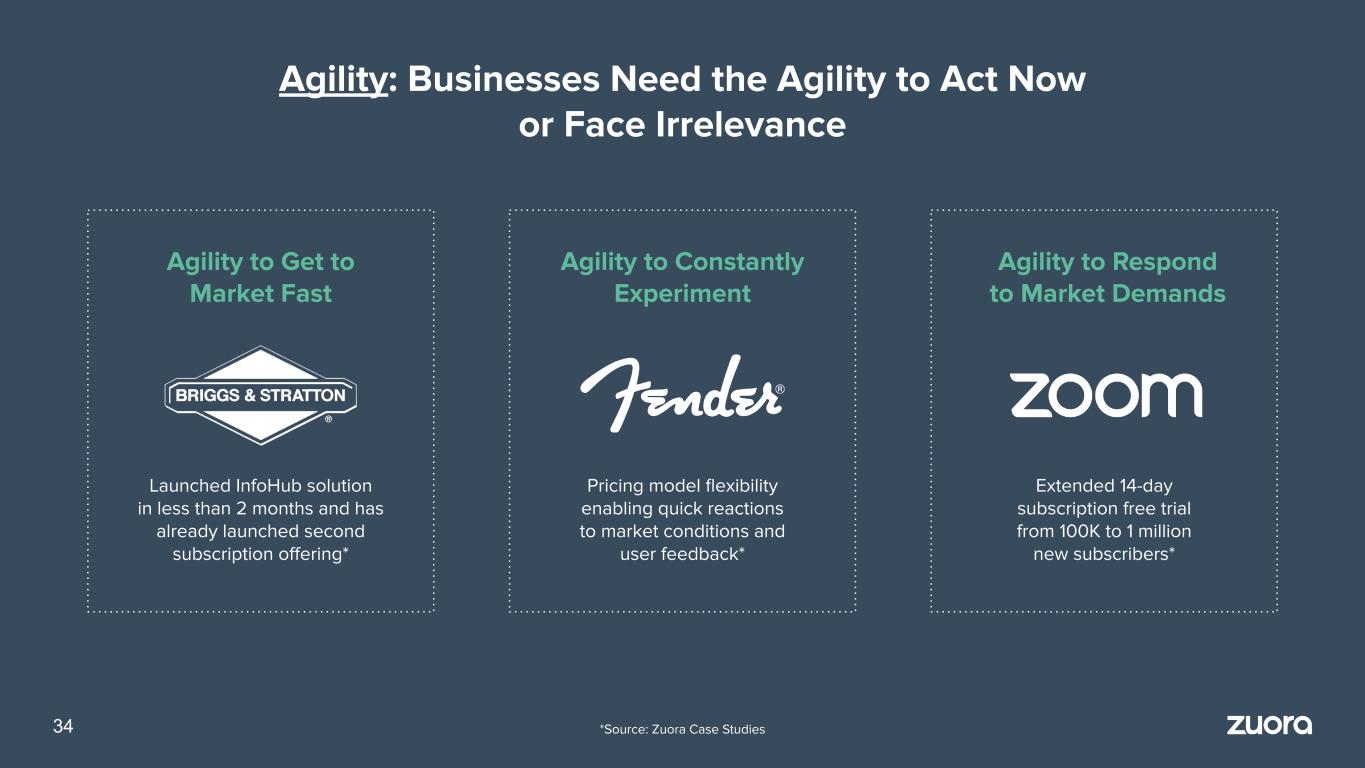
Agility: Businesses Need the Agility to Act Now or Face Irrelevance Agility to Get to Market Fast Launched InfoHub solution in less than 2 months and has already launched second subscription offering* Agility to Respond to Market Demands Extended 14-day subscription free trial from 100K to 1 million new subscribers* Agility to Constantly Experiment Pricing model flexibility enabling quick reactions to market conditions and user feedback* 34 *Source: Zuora Case Studies
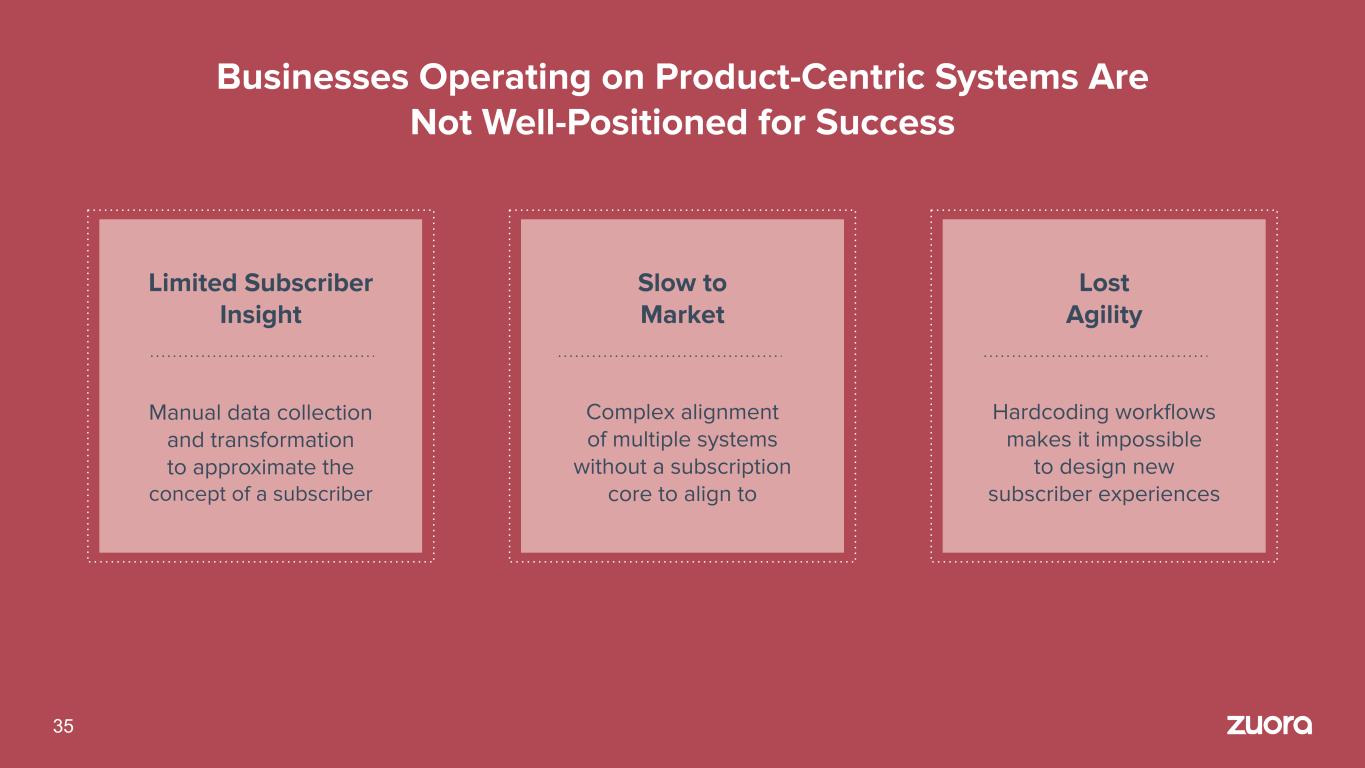
Businesses Operating on Product-Centric Systems Are Not Well-Positioned for Success 35 Limited Subscriber Insight Slow to Market Lost Agility Manual data collection and transformation to approximate the concept of a subscriber Complex alignment of multiple systems without a subscription core to align to Hardcoding workflows makes it impossible to design new subscriber experiences

Zuora Subscription Experience Cloud The only solution built to power the entire subscriber experience. 36

37 Disparate Product Systems of Record

38 Each System of Record Is a Data Silo

39 Zuora Subscription Graph Unifies Data Silos around the Subscriber
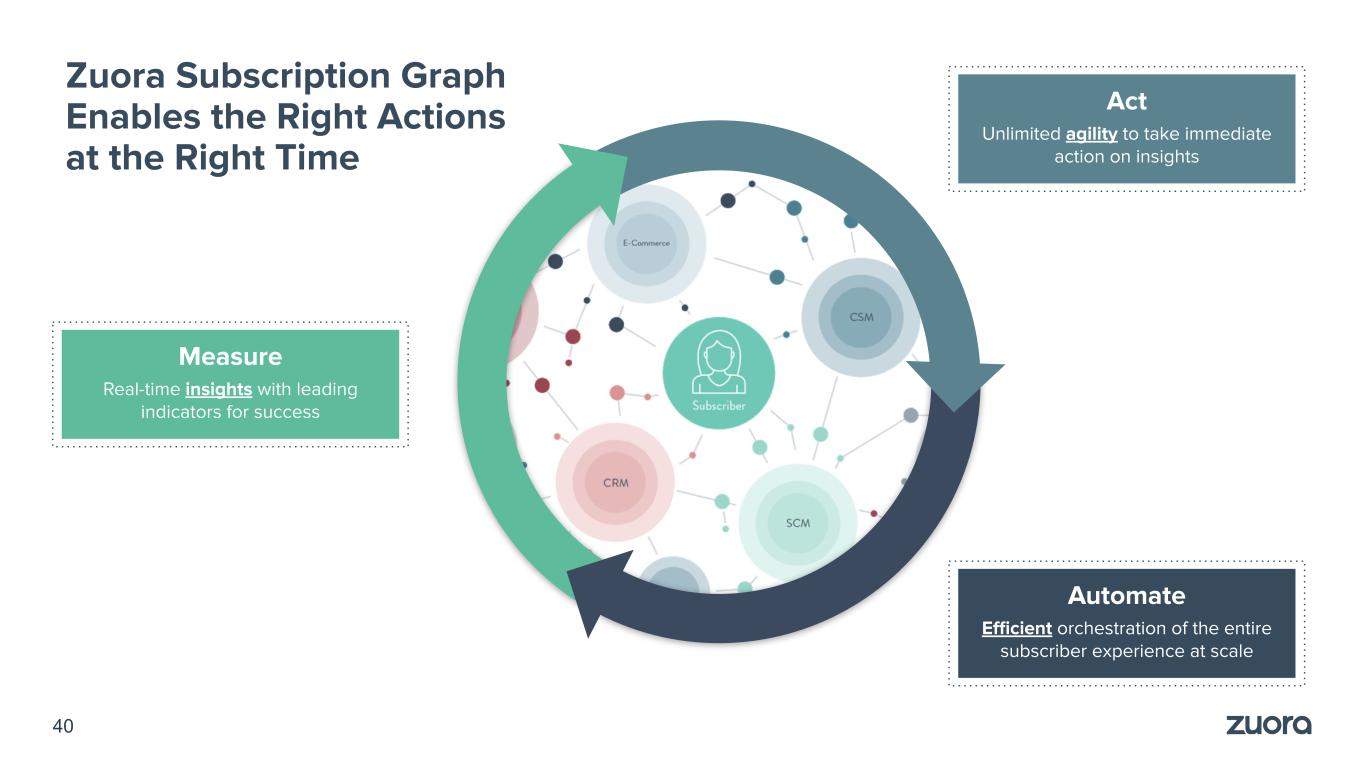
40 Zuora Subscription Graph Enables the Right Actions at the Right Time Automate Efficient orchestration of the entire subscriber experience at scale Measure Real-time insights with leading indicators for success Act Unlimited agility to take immediate action on insights

Orchestration Engine Designs and Automates Subscriber Experiences Examples: Device Network Provisioning & Entitlement Tracking & Fulfillment Usage Mediation 41 Zuora Central Platform executed 1.4B callouts to external systems in FY21

Example Applications ● Monitor usage of connected services ● Track device provisioning & entitlements ● Track product shipments ● Upload and aggregate usage Future Zuora Applications Future Customer Applications Future Partner Applications 42 Purpose-Built Subscription Application Builder

+73% Subscription Data FY20 to FY21 Zuora Central Platform Shows Strong Momentum +44% Active Subscribers +35% Subscription Transactions +279% Workflows Executed +186% Workflow Tasks Executed +99% Notification Callouts 0 80M Custom Objects Stored 0 3.9M Data Queries Executed 0 85 Central Sandbox Customers 43 Source: Zuora

Multi-Application Strategy Expands Entry Points to the Subscription Experience Cloud 44

Billing: Expanding Market Opportunity with a “Subscription First, Not Subscription Only” Strategy *Source: IDC MarketScape: Worldwide Subscription Management Applications 2019-2020, Forrester Wave: SaaS Billing Solutions 2019 **Source: Zuora Example Benefit: Companies are launching new subscription services in 90 days, changing pricing in weeks, scaling operations to 8.8M invoices in a single day ● Market leading application named by Forrester, IDC* ● 30% growth in FY21 Net Billing Volume** ● Only platform powering high volume and high complexity scale for B2B and B2C businesses ● Unlocking new enterprise market share in existing customers and new business opportunities 45
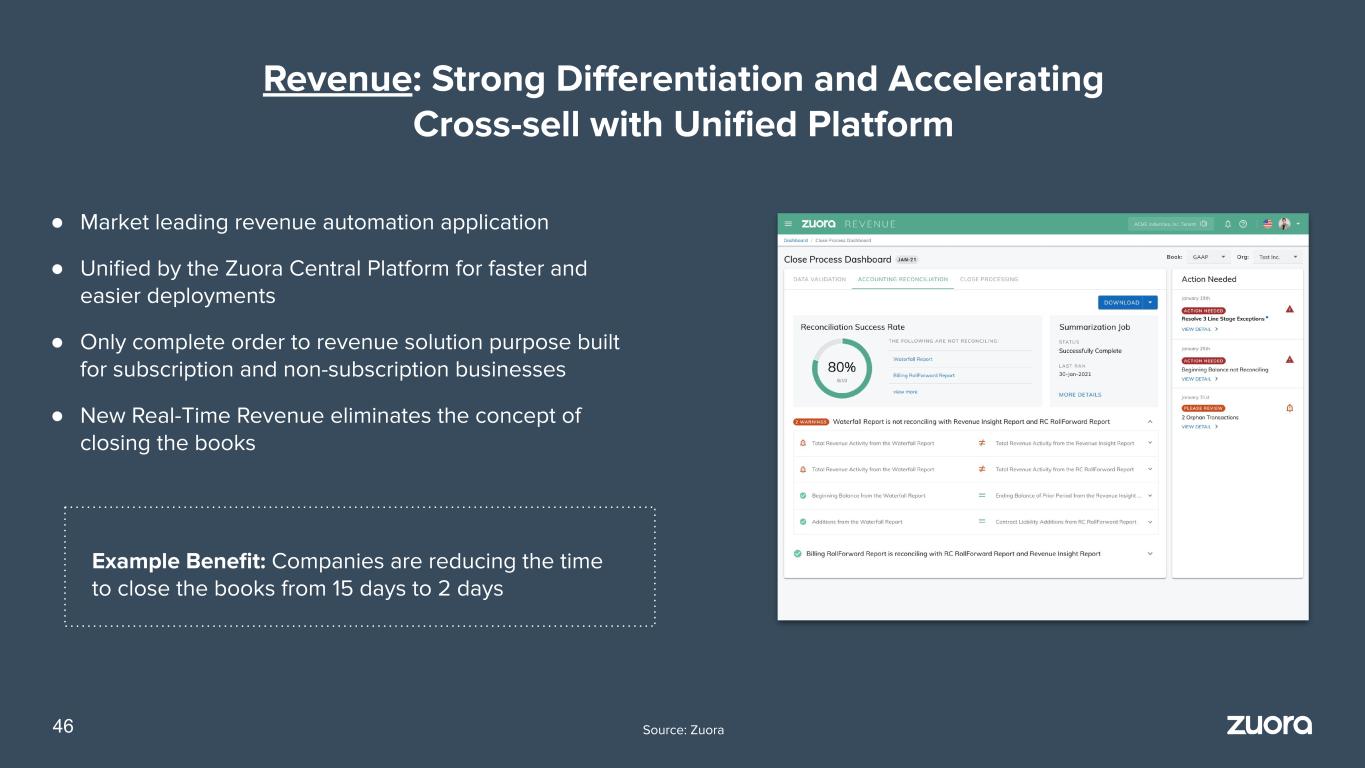
Revenue: Strong Differentiation and Accelerating Cross-sell with Unified Platform Example Benefit: Companies are reducing the time to close the books from 15 days to 2 days ● Market leading revenue automation application ● Unified by the Zuora Central Platform for faster and easier deployments ● Only complete order to revenue solution purpose built for subscription and non-subscription businesses ● New Real-Time Revenue eliminates the concept of closing the books 46 Source: Zuora

Collect: Significant Customer ROI Driving Material Attach Rate Opportunities for New and Existing Customers Example Benefit: Companies are recovering up to 20% more revenue ● New AI application powered by Zuora Central Platform ● Most robust training dataset in the Subscription Economy ● Massive ROI in an application that pays for itself ● Easily attach new application with one click deployments 47 Source: Zuora
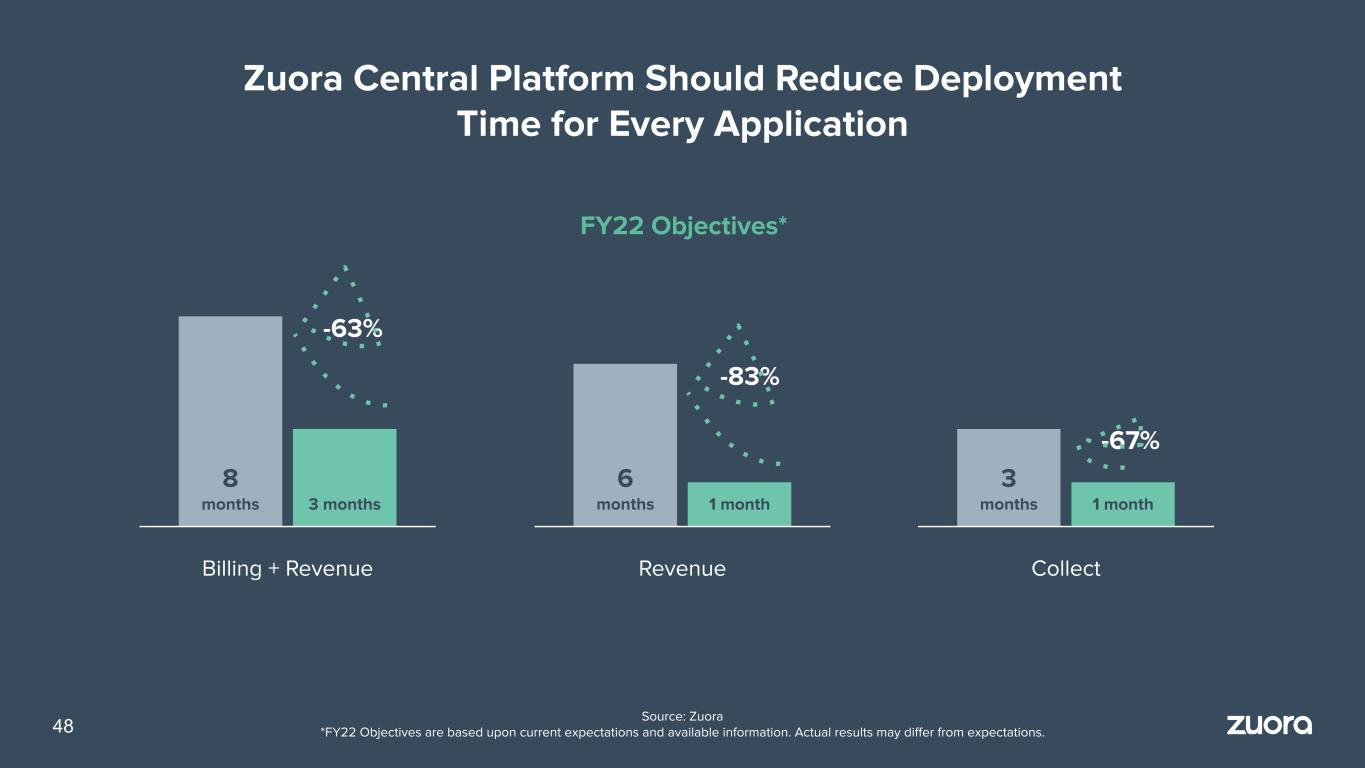
Zuora Central Platform Should Reduce Deployment Time for Every Application 8 months 3 months Billing + Revenue 6 months 1 month Revenue 3 months Collect -63% -83% -67% 1 month FY22 Objectives* 48 Source: Zuora *FY22 Objectives are based upon current expectations and available information. Actual results may differ from expectations.

Our Multi-Product Strategy Unlocks Multiple Land and Expand Opportunities 49 Central Platform Billing: Volume Billing: Advanced Billing: Volume Billing: Base Revenue: Volume Revenue: SSP Revenue: Base Collect: AI Collect: Base Platform: Workflow Platform: Sandbox Platform: Analytics

Product Strategy Creates Three Durable Growth Vectors 50 Billing Revenue Collect Future Central Platform D ri ve U p se ll G ro w th Expand Market Penetration of Beachheads Cross-sell New Products 1 3 2

New Product Strategy From best-in-class, back-office applications to a platform that drives business transformation. Platform for Business Transformation 1 Products purpose-built with subscription as the fulcrum2 Delivering faster time-to-value3 4 Back-Office Applications Product Investments 51 Central Platform powers the entire subscription experience Multi-product portfolio unlocking multiple land and expand vectors

Velchamy Sankarlingam President of Product and Engineering, Zoom Video Communications Customer Interview

Go to Market Robbie Traube, Chief Revenue Officer

54 Our Track Record Gives Us Unparalleled Access to the C-suite 8 OF TOP 10 AUTO MANUFACTURERS powered by Zuora 21 MAJOR NEWSPAPER PUBLISHING GROUPS powered by Zuora 600+ INNOVATORS IN HIGH TECH powered by Zuora 26 OF FORTUNE 100 powered by Zuora

An Evolution in Our Approach to GTM We’ve made significant investments in our GTM motion to execute against the opportunity. Lead Enterprise Transformation 1 Right Organization Right Focus2 Right Partners Right Expertise 3 4 Sell Applications GTM Investments 55

We’ve Set Up Our GTM to Drive Enterprise Growth at Scale Media Provider Energy Services Company High Tech Company $130K of Billing ARR Oct. 2015 2016 – 2017 2017 2018 – 2019 Sep. 2018 Oct. 2019 Jan. 2021 April 2021 Initial Sale Today Contracted Ramp of Volume New Product: Zuora Collect Additional Volume Purchased Add-on Modules Platform Upgrades Additional Tenant Purchased $3.9M of Total ARR 30x ARR Expansion $150K of Billing ARR April 2016 Dec. 2019 2016 – 2021 Dec. 2020 2016 – 2021 April 2021 Initial Sale Today New Product: Zuora Revenue Additional Volume Purchased Additional Revenue Volume Purchased Add-on Modules $1.3M of Total ARR 8.5x ARR Expansion $100K of Billing ARR April 2015 2015 – 2021 2015 – 2021 2015 – 2021 April 2021 Initial Sale Today New Product: Zuora Collect Add-on Modules Additional Volume Purchased Additional Tenants and Platform Upgrades $2.4M of Total ARR 24x ARR Expansion 56 Source: Zuora
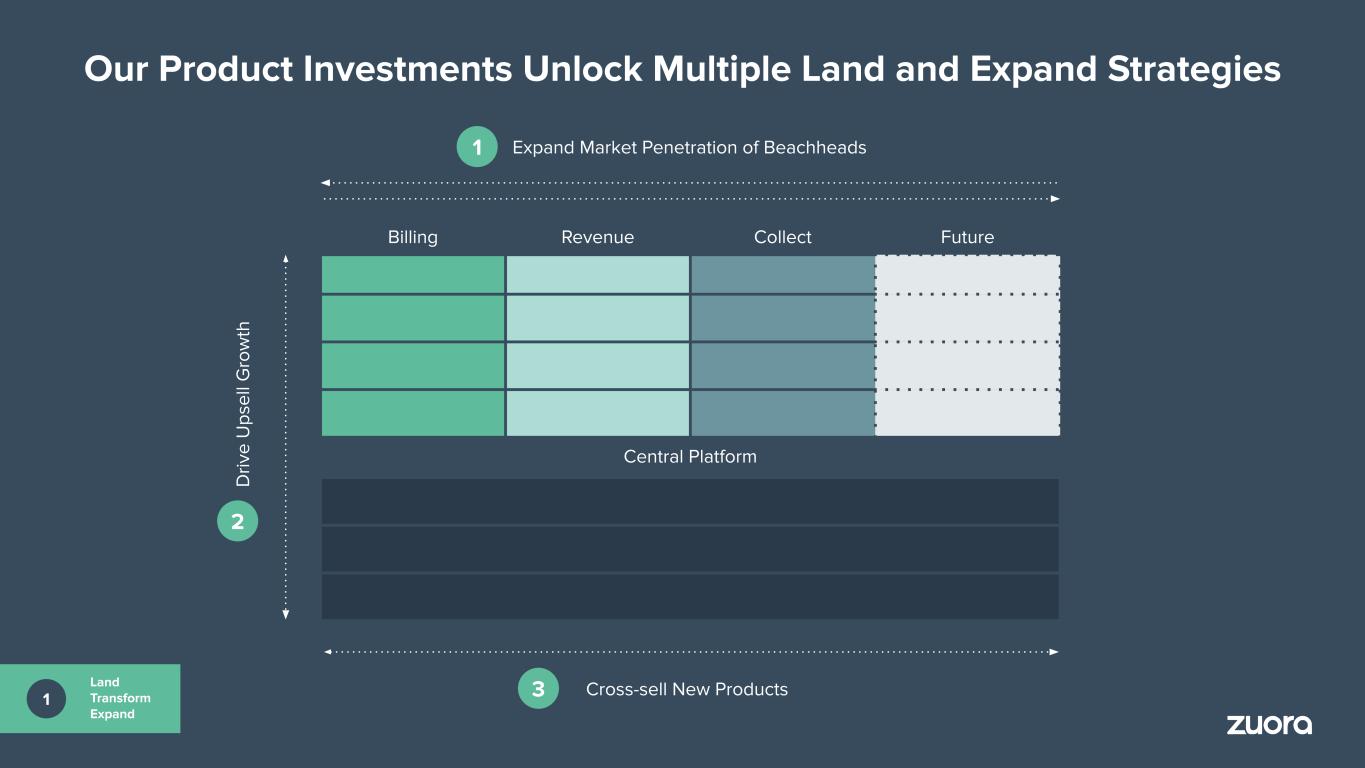
Our Product Investments Unlock Multiple Land and Expand Strategies 57 Billing Revenue Collect Future Central Platform D ri ve U p se ll G ro w th Expand Market Penetration of Beachheads Cross-sell New Products 1 3 2 1 Land Transform Expand

New Organization Designed to Land, Transform, Expand Restructured the organization, with new functions, supporting enterprise customer lifecycle. Account Executive Resource Quarterback & POC Sales Engineer Technical pre-sales support, demos, new product add-ons Customer Success Manager Primary client satisfaction and experience resource Customer Success Architect Technical expert that provides tailored solutioning, best practices guidance, architectural advice to prospects and customers SSG Strategist Industry expert and evangelist that provides thought leadership on use cases, supports ROI building Regional Alliance Manager Focused on implementation success and partner relationships Client Manager Primary Global Services contact for proposal, SOW, implementation and GSI engagement CustomerRevenue Advisor Technical pre-sales accountant expert for complex revenue recognition 58 1 Land Transform Expand
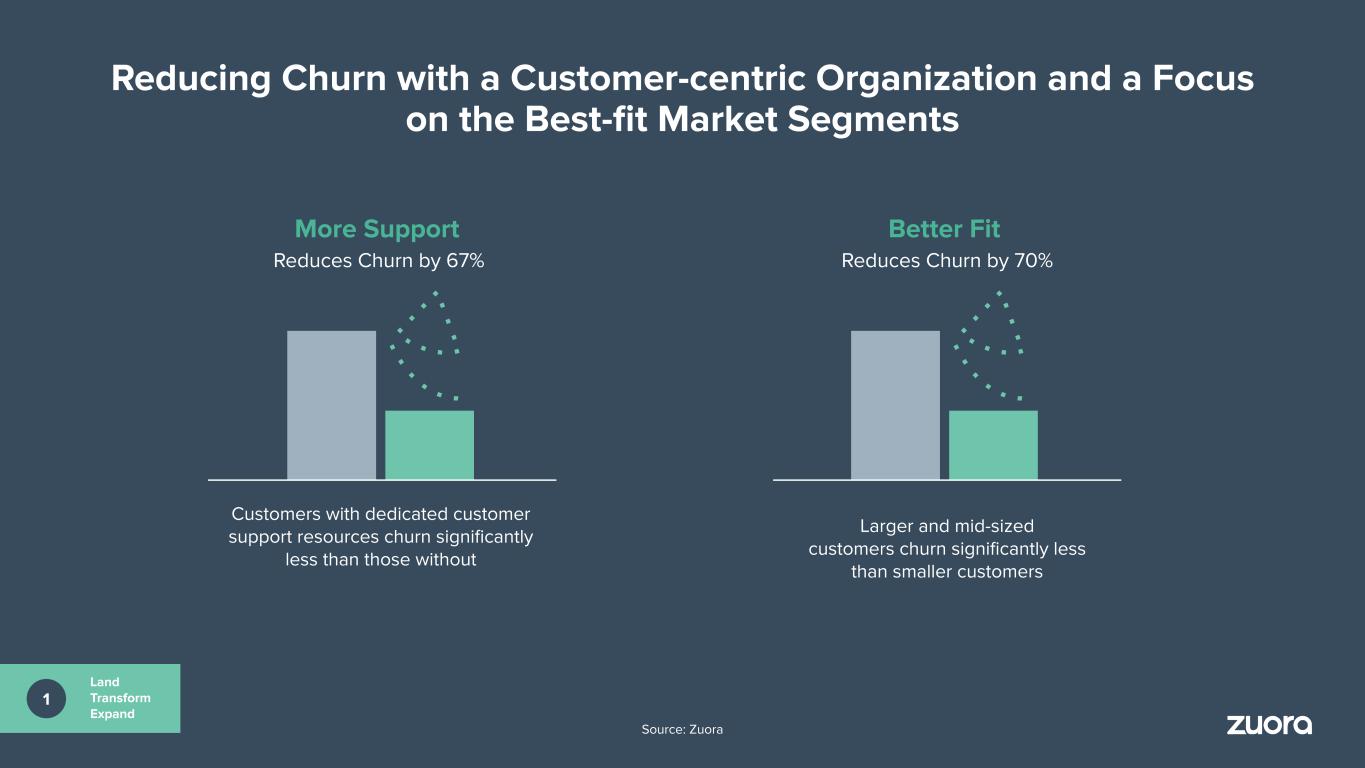
59 Reducing Churn with a Customer-centric Organization and a Focus on the Best-fit Market Segments Reduces Churn by 67% Customers with dedicated customer support resources churn significantly less than those without Reduces Churn by 70% More Support Better Fit Larger and mid-sized customers churn significantly less than smaller customers Source: Zuora 1 Land Transform Expand

*Source: Zuora Focus on Key Verticals and Segments Igniting Growth Allows more efficient pipeline creation and higher win rates. HIGH TECH MANUFACTURING MEDIA 2 Strategic Segment Focus FY21 YoY Win Rate in $100k+ Customers* Vertical Focus 80+% +400 bps FY21 YoY Pipeline Growth*

61 Playbook that We Expect will Scale to Other Sectors Over Time HIGH TECH MANUFACTURING MEDIA Today Tomorrow FINSERV RETAIL / MEMBERSHIP HEALTHCARE Strategic Segment Focus 2

GLOBAL SYSTEM INTEGRATORS Making Alliances Programmatic to Adding Scale & Accelerating Growth ● Source new opportunities & accelerate deals ● Develop joint product solutions ● Provide robust product delivery ● Bring deep industry expertise ● Support transformation of professional services organization 62 REGIONAL SYSTEM INTEGRATORS How SIs Enhance Our Capabilities Alliances Scale & Acceleration 3

Example FY’21 Partner Primed Projects Partners Provide New Access, Accelerating Growth “Transformation” mission closely aligned with GSI needs. ● Partners supported 80% of Q4’21 deals* ● More partner primed deals in Q4’21 than all of FY’20 combined* ● Multiple joint solutions now in market *Source: Zuora Partner Traction Working Alliances Scale & Acceleration 3

64 Allows Zuora to Scale without Adding Services Expense Zuora GS Organization becomes more focused, expert services arm. *Forecasts are Zuora’s estimates based upon current expectation and available information. Actual results may differ from expectations. FY21 FY22E* FY23E* FY24E* P S F o re ca st R e ve n u e Zuora GS Delivers End-to-End Deployment Today Zuora GS Delivers Predominantly Expert Services to the SIs SI Partner Zuora GS 3 Alliances Scale & Acceleration

65 SI Partnership Strategy Scaling Quickly Q4FY21 results reflect an inflection point that will accelerate going forward. Partner Sourced Pipeline, 2x QoQ Growth Q4 over Q3 Partner Influenced Bookings, 2x QoQ Growth Q4 over Q3 Source: Zuora Q1 21 Q2 21 Q3 21 Q4 21 Q1 21 Q2 21 Q3 21 Q4 21 3 Alliances Scale & Acceleration Certified Partner Consultants: 0 100+ From beginning of 2020 until today.
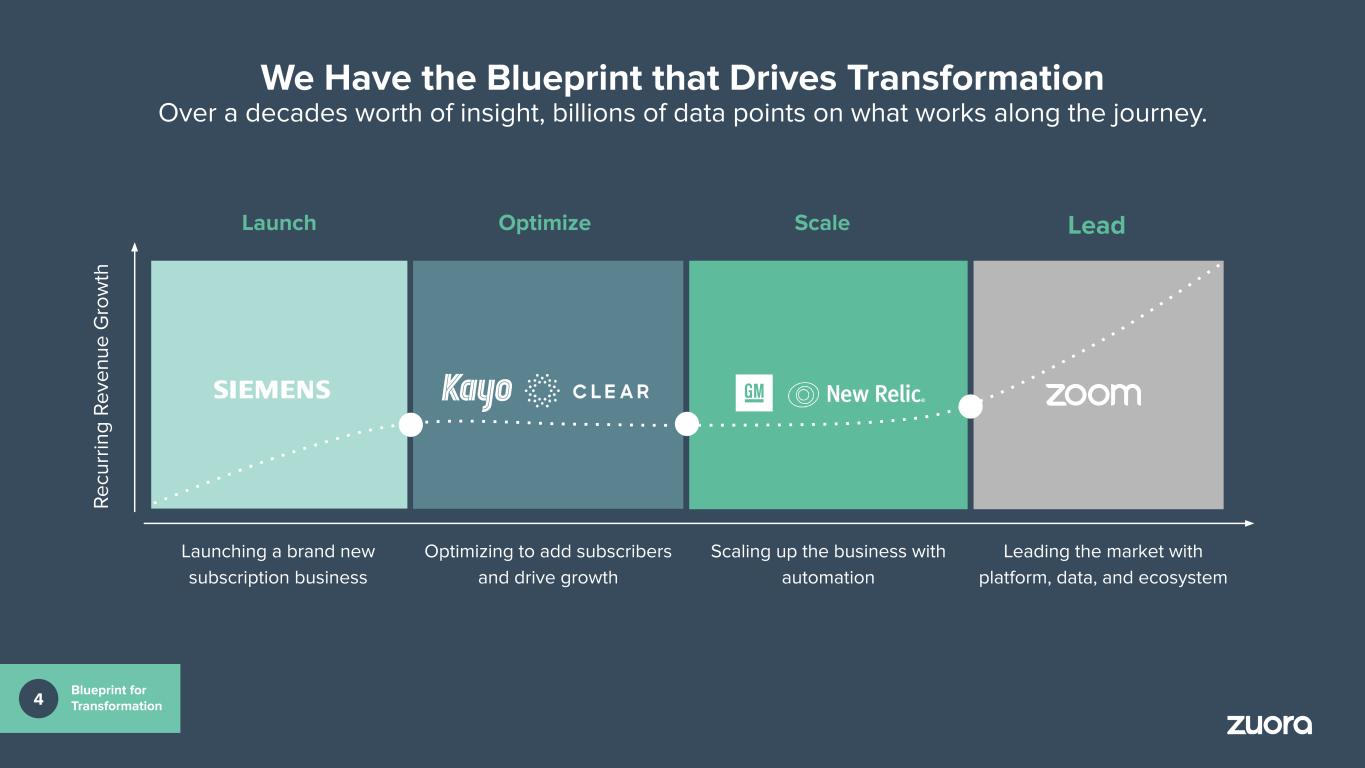
66 We Have the Blueprint that Drives Transformation Over a decades worth of insight, billions of data points on what works along the journey. 4 Blueprint for Transformation Launch Optimize LeadScale R e cu rr in g R e ve n u e G ro w th Leading the market with platform, data, and ecosystem Scaling up the business with automation Optimizing to add subscribers and drive growth Launching a brand new subscription business

We Can Engage and Support Anywhere along the Journey We’ve architected the teams, with tools and knowledge to insert and support at every point. Launch Optimize LeadScale R e cu rr in g R e ve n u e G ro w th 4 Blueprint for Transformation

4 Blueprint for Transformation Product Insights Support Customers in Conjunction with GTM Teams and Vertical Blueprints Performance insight direct from product Applied with proven, repeatable frameworks to each stage and vertical Robbie Traube 9:05 AM Today Analytics driven from the platform - SSG uses

An Evolution in Our Approach to GTM We’ve made significant investments in our GTM motion to execute against the opportunity. Lead Enterprise Transformation 1 Organization to land, transform, expand Focus on the right customer segments2 Alliances strategy to drive scale and acceleration A blueprint to guide our customers with our differentiated expertise 3 4 Sell Applications GTM Investments 69

Partner Interview Matthew Candy Global Managing Partner of IBM iX

Business Model & Financials Todd Mcelhatton, Chief Financial Officer

Long-Term Financial Success ● Sustainable topline acceleration ● Plan to grow subscription revenue ● Long-term model delivering “Rule of 40” 72 Key Pillars of Our Growth Strategy Superior Execution ● NDR improvement taking shape ○ Upsell momentum; lower churn ○ Sustainable expansion within current base ● Accelerating new business at large enterprises ● Favorable services mix expanding gross margin Market Vision and Leadership ● Rapidly expanding TAM in Subscription Cloud ● Scalable Zuora Central platform driving product-focused ARR expansion ● Powerful customer economics

Investment Key Investments Showing Results: Product 73 Central Platform with Analytics launched with new features and functionalities1. Revenue integration with Zuora Billing 2. Released Zuora Collect AI3. Driving adoption, reason we win larger deals, improves retention, and allows us to monetize add-on capabilities 1. Increased cross-sell opportunity; differentiates us from ERP and CRM players2. Beachhead to enable customers to improve collection rates on their $57B volume transacted in FY213. Outcome

Opportunity to Nearly Triple Current ARR* Source: Zuora *Forecasts are Zuora’s estimates based upon current expectation and available information. Actual results may differ from expectations.74 Path to Sustainable Expansion with Current Product Portfolio ● Grow as they Grow ● Business Unit Expansion ● Penetration of Advanced Capabilities Drive Upsell Growth +$250M Potential within our existing base* ● Revenue to Billing ● Billing to Revenue ● Collect to All Cross-sell To New Products +$200M Potential within our existing base* Cross-Sell to Existing Base Upsell to Existing Base Existing ARR 3X 2X 1X

USAGE Central Sandbox Analytics Workflow Orchestration AppBuilder <10% Cross Sell Advanced features AI/Machine Learning <20% BU expansions Cross Sell Advanced features Add-ons Cross Sell Add-ons <10% Source: Zuora *Potential are Zuora’s estimates based upon current expectations and available information. Actual results may differ from expectations. 75 Fueled by Multiple Products that Each Could Be >$100M in ARR Billing Revenue Collect Platform USAGE Revenue Penetration of customer base

Source: Zuora *FY22 Target is a Zuora estimate based upon current expectations and available information. Actual results may differ from expectations. 104% 103% 99% 99% 100% 105%+ NDR Improvement Taking Shape 76 Q4 20 Q1 21 Q2 21 Q3 21 Q4 21 FY22 Target*

Source: Zuora CAGR FY16 FY17 FY18 FY19 FY20 FY21 Powerful Customer Economics Customer Cohort ASP (Customers at or > $100k) 77 FY2020 Cohort FY2019 Cohort FY2018 Cohort FY2017 Cohort 24% 21% 21% 18%

Source: Zuora CAGR FY16 FY17 FY18 FY19 FY20 FY21 78 FY2020 Cohort FY2019 Cohort FY2018 Cohort FY2017 Cohort 30% 22% 29% 23% Powerful Customer Economics Customer Cohort ASP (Top 15 Customers per Cohort)

Investment Key Investments Showing Results: GTM 79 Alliance development & pipeline creation1. Customer success integration with Zuora Billing and improve capabilities2. Strategic Account Teams3. Pipeline up 40% YoY in 2H’FY21 with improved win rates for large accounts1. Churn returned to historical levels and upsell growth accelerated to 20% in 2H’FY212. More experienced salesforce driving ~24% productivity improvement in FY21 over FY203. Outcome Subscribed Strategy Group4. Driving demand from C-level executives seeking out our expertise4. Source: Zuora

Our SI Partnership Strategy Is Scaling Quickly and Beginning to Show Results Source: Zuora80 Benefits to Zuora ● Provide robust product delivery ● Bring deep industry expertise ● Global reach ● Improve time to go-live ● Improve overall GMs SIs are investing in Prime practices ● FY21 prime SI deals more than doubled over FY20 ● SIs are investing: increasing the number of Zuora certified consultants SIs are influencing and sourcing new opportunities; generating pipeline ● Partner Sourced Pipeline 2x QoQ Growth Q4 over Q3 FY21 ● Partner Influenced Bookings 2x QoQ Growth Q4 over Q3 FY21

Source: Zuora FY20 FY21 +400 bps700 bps FY20 FY21FY20 FY21 23% Strategy Driving Effective & Scalable Growth 81 FY20 FY21 24% Average Bookings / Rep New Business ASP % of Reps Meeting Quota Win Rate >$100K ACV

New Business ASP Growing New Business at Large Enterprises Source: Zuora82 +23% FY20 FY21FY19 +2%

Source: Zuora *Presented on a non-GAAP basis. Refer to the Appendix for a reconciliation of these non-GAAP measures. Gross Margin Leverage 83 FY20 FY21 Professional Services (% of Total Revenue) FY19 25% 20%30% FY20 FY21 Subscription Gross Margin* FY19 78% 79%77% FY20 FY21 Blended Gross Margin* FY19 57% 63%55% +190 bps +790 bps-940 bps

FY21A Cash & Short-Term Investment $187M Total Debt $6M Capex (FY21 Total) $12M Strong Balance Sheet Capital Allocation Strategy FCF positive on an annual basis going forward Continued organic investment in the business Significant cash position and minimal debt provide flexibility to pursue opportunistic acquisitions to further product roadmap Source: Zuora84

FY17A** FY18A** FY19A FY20A FY21A Total Revenue Growth 23% 51% 37% 17% 11% Subscription Revenue Growth 32% 36% 35% 25% 17% Non-GAAP Subscription Gross Margin* 76% 78% 77% 78% 79% Total Non-GAAP Gross Margin* 59% 57% 55% 57% 63% Non-GAAP Operating Margin* (32%) (16%) (18%) (15%) (4%) Free Cash Flow Margin* (25%) (17%) (16%) (9%) (0%) 85 Source: Zuora *Refer to the Appendix for a reconciliation of these non-GAAP measures. **Zuora restated FY18, FY19 and FY20 financial data upon adoption of ASC 606 in FY20. FY16 and FY17 data remain under ASC 605. Historical Financial Performance

FY21A FY22E* FY25E* Subscription Revenue Growth 17% 12% – 14% 25%+ Professional Services (as a % of Total Revenue) 21% 18% – 19% <15% Non-GAAP Subscription Gross Margin** 79% 80% 82%+ Non-GAAP Operating Margin** (4%) (4%) – (2%) 10%+ Free Cash Flow Margin** (0%) 0% – 4% 10% – 15% Source: Zuora *Forecasts are Zuora estimates, based upon current expectations and available information. Actual results may differ from expectations. **Refer to the Appendix for a reconciliation of these non-GAAP measures. *Presented on a non-GAAP basis. Refer to the Appendix for a reconciliation of these non-GAAP measures 86 FY22 and FY25 Financial Targets

Metric Definition FY21A FY22E* FY25E* ARR Growth Current period annualized value of all subscription contracts compared to same period of prior year 12% 17% 25%-30% Net Dollar Retention Current period ARR compared to prior year’s ARR from existing customers 100% 105%+ 112%-115% Rule of 40 Sum of subscription revenue growth rate + free cash flow margin (YoY) 17% 15%+ 40%+ Source: Zuora *Forecasts are Zuora estimates, based upon current expectations and available information. Actual results may differ from expectations.87 Introduction of New KPIs to Track Progress

Zuora Investment Highlights Zuora is Recognized as the Clear Leader 1 Accelerate ARR Growth to 25-30% NDR of 112-115% 2 Achieve the Rule of 403 Large and Growing Opportunity FY25 Objectives 88 New, Seasoned Senior Management Team GTM Initiatives Driving Adoption and Expansion Lead Enterprise Transformation Attractive Gross Margins, Improving Operating Leverage

Q & A

Thank you.

Appendix

RECONCILIATION OF NON-GAAP (Dollars in Thousands) FY17 FY18 FY19 FY20 FY21 GAAP subscription revenue $89,836 $122,482 $164,805 $206,555 $242,340 GAAP total revenue $113,008 $171,106 $234,989 $276,057 $305,420 GAAP cost of subscription revenue $22,840 $31,077 $42,993 $53,036 $58,808 Subtract: Stock-based compensation expense (326) (747) (1,967) (2,772) (4,849) Amortization of acquired intangibles (715) (2,056) (2,250) (1,776) (1,692) Internal-use software (520) (1,134) (1,286) (2,560) (1,781) New headquarters costs - - - (75) - Non-GAAP cost of subscription revenue $21,279 $27,140 $37,490 $45,853 $50,486 Gross profit $64,846 $91,200 $118,399 $141,876 $174,650 Add: Stock-based compensation expense 909 2,868 7,867 10,037 14,801 Amortization of acquired intangibles 715 2,056 2,250 1,776 1,692 Internal-use software 520 1,134 1,260 2,560 1,781 New headquarters costs - - - 169 - Non-GAAP gross profit $66,990 $97,258 $129,776 $156,418 $192,924 GAAP operating loss ($39,033) ($38,078) ($70,417) ($85,665) ($73,862) Add / (Subtract): Stock-based compensation expense 4,383 8,990 25,357 45,046 59,283 Amortization of acquired intangibles 715 2,056 2,250 1,776 1,692 Internal-use software (1,743) 8 (962) (1,946) (2,428) Charitable donations - - 1,000 - 1,000 New headquarters costs - - - 482 - Certain litigation - - - - 3,252 Non-GAAP operating loss ($35,678) ($27,024) ($42,772) ($40,307) ($11,063) Non-GAAP subscription gross margin 76% 78% 77% 78% 79% Non-GAAP gross margin 59% 57% 55% 57% 63% Non-GAAP operating margin (32%) (16%) (18%) (15%) (4%) Net cash (used in) provided by operating activities ($24,975) ($24,776) ($23,581) ($3,590) $11,286 Subtract: Purchases of property and equipment, net of insurance recoveries (3,776) (4,698) (13,412) (21,424) (12,156) Free cash flow ($28,751) ($29,474) ($36,993) ($25,014) ($870) Free cash flow margin (25%) (17%) (16%) (9%) (0%) Source: Zuora For a more detailed discussion of our Non-GAAP Financial Measures, refer to Item 7. Management’s Discussion and Analysis of Financial Condition and Results of Operations of Zuora’s Form 10-K filed with the SEC on March 31, 2021. Forward-looking non-GAAP measures relating to fiscal years 2022 and beyond represent targets and are based on internal forecasts subject to significant uncertainty. We are unable to provide a full reconciliation of such measures to GAAP measures without unreasonable effort as we cannot predict the amount or timing of future GAAP results. In addition, we have not provided reconciliations for ARR Growth, Net Dollar Retention, or the Rule of 40 metrics that are described in this presentation because these metrics do not have comparable GAAP measures.

ACV Annual Contract Value GSI Global System Integrators AE Account Executive GTM Go-To-Market AI Artificial Intelligence LTV Lifetime Value ARR Annual Recurring Revenue MRR Monthly Recurring Revenue ASP Average Selling Price NDR Net Dollar Retention CAC Customer Acquisition Cost NPS Net Promoter Score CAGR Compounded Annual Growth Rate P&L Profit and Loss (statement) COGS Cost of Goods Sold POC Proof-of-Concept CSMs Customer Success Managers QoQ Quarter over Quarter FCF Free Cash Flow ROI Return-on-Investment FY Fiscal Year R&D Research and Development G&A General and Administrative SI System Integrators GAAP Generally Accepted Accounting Principles TAM Total Addressable Market GS Global Services YoY Year over Year Acronyms 93
