Attached files
| file | filename |
|---|---|
| EX-99.2 - EX-99.2 - Eastern Bankshares, Inc. | d134323dex992.htm |
| EX-99.1 - EX-99.1 - Eastern Bankshares, Inc. | d134323dex991.htm |
| EX-2.1 - EX-2.1 - Eastern Bankshares, Inc. | d134323dex21.htm |
| 8-K - 8-K - Eastern Bankshares, Inc. | d134323d8k.htm |
Exhibit 99.3 Acquisition of APRIL 7 | 2021Exhibit 99.3 Acquisition of APRIL 7 | 2021
Forward-looking statements This press release contains forward-looking statements. Forward-looking statements include statements regarding anticipated future events and can be identified by the fact that they do not relate strictly to historical or current facts. They often include words such as “believe,” “expect,” “anticipate,” “estimate,” and “intend” or future or conditional verbs such as “will,” “would,” “should,” “could,” or “may.” Forward-looking statements, by their nature, are subject to risks and uncertainties. Factors relating to the proposed merger that could cause or contribute to actual results differing materially from expected results include, but are not limited to, the possibility that revenue or expense synergies or the other expected benefits of the transaction may not materialize for Eastern in the timeframe expected or at all, or may be more costly to achieve; that the transaction may not be timely completed, if at all; that prior to the completion of the transaction or thereafter, Eastern’s or Century’s businesses may not perform as expected due to transaction-related uncertainty or other factors; that Eastern is unable to successfully implement integration strategies; that required regulatory, shareholder or other approvals are not obtained or other closing conditions are not satisfied in a timely manner or at all; that the timing of completion of the proposed merger is dependent on various factors that cannot be predicted with precision at this point; reputational risks and the reaction of the companies’ customers to the transaction; the inability to implement onboarding plans and other consequences associated with mergers; and diversion of management time on merger-related issues. These forward-looking statements are also subject to the risks and uncertainties applicable to our businesses generally that are disclosed in Eastern’s and Century’s 2020 Annual Reports on Form 10-K. Eastern and Century’s SEC filings are accessible on the SEC's website at www.sec.gov and on their respective corporate websites at investor.easternbank.com and investors.centurybank.com. These web addresses are included as inactive textual references only. Information on these websites is not part of this document. For any forward-looking statements made in this press release, Eastern and Century claim the protection of the safe harbor for forward-looking statements contained in the Private Securities Litigation Reform Act of 1995. Except as required by law, each company specifically disclaims any obligation to update any forward-looking statements as a result of developments occurring after the date of this press release, even if its estimates change, and you should not rely on those statements as representing either company’s views as of any date subsequent to the date hereof. Annualized, projected and estimated numbers are used for illustrative purpose only, are not forecasts and may not reflect actual results. 1Forward-looking statements This press release contains forward-looking statements. Forward-looking statements include statements regarding anticipated future events and can be identified by the fact that they do not relate strictly to historical or current facts. They often include words such as “believe,” “expect,” “anticipate,” “estimate,” and “intend” or future or conditional verbs such as “will,” “would,” “should,” “could,” or “may.” Forward-looking statements, by their nature, are subject to risks and uncertainties. Factors relating to the proposed merger that could cause or contribute to actual results differing materially from expected results include, but are not limited to, the possibility that revenue or expense synergies or the other expected benefits of the transaction may not materialize for Eastern in the timeframe expected or at all, or may be more costly to achieve; that the transaction may not be timely completed, if at all; that prior to the completion of the transaction or thereafter, Eastern’s or Century’s businesses may not perform as expected due to transaction-related uncertainty or other factors; that Eastern is unable to successfully implement integration strategies; that required regulatory, shareholder or other approvals are not obtained or other closing conditions are not satisfied in a timely manner or at all; that the timing of completion of the proposed merger is dependent on various factors that cannot be predicted with precision at this point; reputational risks and the reaction of the companies’ customers to the transaction; the inability to implement onboarding plans and other consequences associated with mergers; and diversion of management time on merger-related issues. These forward-looking statements are also subject to the risks and uncertainties applicable to our businesses generally that are disclosed in Eastern’s and Century’s 2020 Annual Reports on Form 10-K. Eastern and Century’s SEC filings are accessible on the SEC's website at www.sec.gov and on their respective corporate websites at investor.easternbank.com and investors.centurybank.com. These web addresses are included as inactive textual references only. Information on these websites is not part of this document. For any forward-looking statements made in this press release, Eastern and Century claim the protection of the safe harbor for forward-looking statements contained in the Private Securities Litigation Reform Act of 1995. Except as required by law, each company specifically disclaims any obligation to update any forward-looking statements as a result of developments occurring after the date of this press release, even if its estimates change, and you should not rely on those statements as representing either company’s views as of any date subsequent to the date hereof. Annualized, projected and estimated numbers are used for illustrative purpose only, are not forecasts and may not reflect actual results. 1

Non-GAAP financial measures * Denotes a Non-GAAP Financial Measure. Each company presents tangible book value, a non-GAAP financial measure, which excludes the impact of goodwill and other intangible assets, as their respective management believes this financial measure provides investors with the ability to further assess the applicable company’s performance, identify trends in its core business and provide a comparison of its capital adequacy to other companies. For a reconciliation of Century’s tangible book value to its total stockholders’ equity, please see the table at the end of this press release. This non-GAAP financial measure should not be considered an alternative or substitute for financial results or measures determined in accordance with GAAP. An item which a company’s management considers to be non-core and excludes when computing this non-GAAP financial measure can be of substantial importance to such company’s results for any particular period. In addition, a company’s management’s methodology for calculating a non-GAAP financial measure may differ from the methodologies employed by other banking companies to calculate the same or similar performance measures, and accordingly, a company’s reported non-GAAP financial measure may not be comparable to the same or similar performance measures reported by other banking companies. 2Non-GAAP financial measures * Denotes a Non-GAAP Financial Measure. Each company presents tangible book value, a non-GAAP financial measure, which excludes the impact of goodwill and other intangible assets, as their respective management believes this financial measure provides investors with the ability to further assess the applicable company’s performance, identify trends in its core business and provide a comparison of its capital adequacy to other companies. For a reconciliation of Century’s tangible book value to its total stockholders’ equity, please see the table at the end of this press release. This non-GAAP financial measure should not be considered an alternative or substitute for financial results or measures determined in accordance with GAAP. An item which a company’s management considers to be non-core and excludes when computing this non-GAAP financial measure can be of substantial importance to such company’s results for any particular period. In addition, a company’s management’s methodology for calculating a non-GAAP financial measure may differ from the methodologies employed by other banking companies to calculate the same or similar performance measures, and accordingly, a company’s reported non-GAAP financial measure may not be comparable to the same or similar performance measures reported by other banking companies. 2

The next step in our journey ü Increases Boston deposits by ~$5bn to ~$16bn in total Bolsters scale and density of ü Solidifies position as the #1 community bank in the Boston MSA our Boston franchise ü ~96% of branches within 3-miles of an Eastern branch ü ~55% earnings per share accretion Deploys capital in a strategic ü ~17%+ internal rate of return and financially attractive ü ~20%+ pro forma CET1 provides ample capital flexibility going forward opportunity ü Concurrently announcing a 33% increase in dividend per share to $0.08 ü Reduces efficiency ratio by ~600bps Enhances our financial profile with substantial upside ü Increases ROAA by ~10bps potential ü Opportunity to expand customer relationships with broader offering ü Low risk balance sheet; Robust due diligence process Low risk, in-market ü Familiar community markets, bankers and customers transaction ü Eastern is a seasoned acquirer: 7 bank acquisitions since 1999 Highly compelling opportunity to deploy capital and create shareholder value Note: Eastern’s projections are based on consensus estimates; Century’s projections are based on Eastern’s internal forecast 3The next step in our journey ü Increases Boston deposits by ~$5bn to ~$16bn in total Bolsters scale and density of ü Solidifies position as the #1 community bank in the Boston MSA our Boston franchise ü ~96% of branches within 3-miles of an Eastern branch ü ~55% earnings per share accretion Deploys capital in a strategic ü ~17%+ internal rate of return and financially attractive ü ~20%+ pro forma CET1 provides ample capital flexibility going forward opportunity ü Concurrently announcing a 33% increase in dividend per share to $0.08 ü Reduces efficiency ratio by ~600bps Enhances our financial profile with substantial upside ü Increases ROAA by ~10bps potential ü Opportunity to expand customer relationships with broader offering ü Low risk balance sheet; Robust due diligence process Low risk, in-market ü Familiar community markets, bankers and customers transaction ü Eastern is a seasoned acquirer: 7 bank acquisitions since 1999 Highly compelling opportunity to deploy capital and create shareholder value Note: Eastern’s projections are based on consensus estimates; Century’s projections are based on Eastern’s internal forecast 3
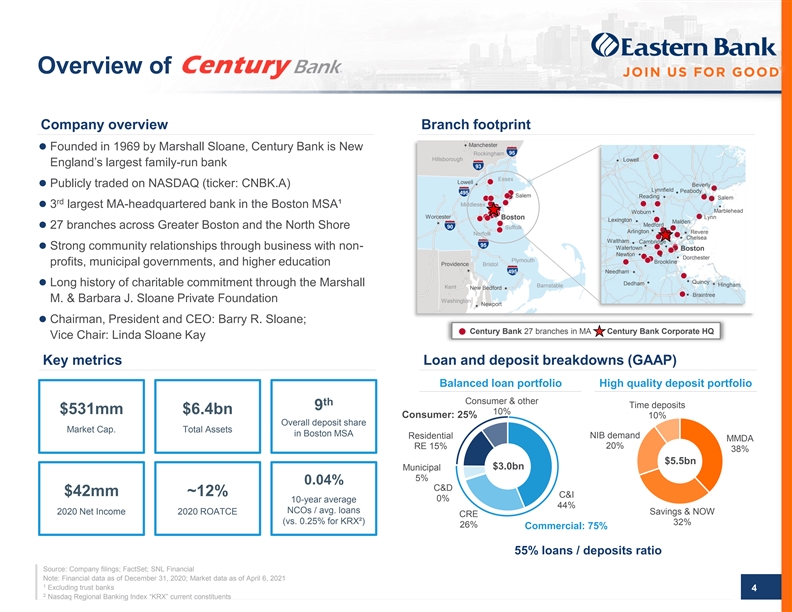
Overview of Company overview Branch footprint Manchester l Founded in 1969 by Marshall Sloane, Century Bank is New 95 Rockingham Hillsborough Lowell England’s largest family-run bank 93 Essex Lowell l Publicly traded on NASDAQ (ticker: CNBK.A) Beverly Lynnfield Peabody 495 Salem Reading Salem rd Middlesex l 3 largest MA-headquartered bank in the Boston MSA¹ Marblehead Woburn Worcester Lynn Boston Lexington Malden Medford l 27 branches across Greater Boston and the North Shore 90 Suffolk Arlington Revere Norfolk Chelsea Waltham Cambridge 95 l Strong community relationships through business with non- Watertown Boston Newton Dorchester Plymouth Brookline profits, municipal governments, and higher education Providence Bristol 495 Needham Quincy Dedham l Long history of charitable commitment through the Marshall Hingham Barnstable Kent New Bedford Braintree M. & Barbara J. Sloane Private Foundation Washington Newport l Chairman, President and CEO: Barry R. Sloane; Century Bank 27 branches in MA Century Bank Corporate HQ Vice Chair: Linda Sloane Kay Key metrics Loan and deposit breakdowns (GAAP) Balanced loan portfolio High quality deposit portfolio Consumer & other th Time deposits 9 $531mm $6.4bn 10% Consumer: 25% 10% Overall deposit share Market Cap. Total Assets in Boston MSA NIB demand Residential MMDA RE 15% 20% 38% $5.5bn $3.0bn Municipal 5% 0.04% C&D $42mm ~12% C&I 0% 10-year average 44% NCOs / avg. loans 2020 Net Income 2020 ROATCE Savings & NOW CRE (vs. 0.25% for KRX²) 32% 26% Commercial: 75% 55% loans / deposits ratio Source: Company filings; FactSet; SNL Financial Note: Financial data as of December 31, 2020; Market data as of April 6, 2021 1 Excluding trust banks 4 2 Nasdaq Regional Banking Index “KRX” current constituentsOverview of Company overview Branch footprint Manchester l Founded in 1969 by Marshall Sloane, Century Bank is New 95 Rockingham Hillsborough Lowell England’s largest family-run bank 93 Essex Lowell l Publicly traded on NASDAQ (ticker: CNBK.A) Beverly Lynnfield Peabody 495 Salem Reading Salem rd Middlesex l 3 largest MA-headquartered bank in the Boston MSA¹ Marblehead Woburn Worcester Lynn Boston Lexington Malden Medford l 27 branches across Greater Boston and the North Shore 90 Suffolk Arlington Revere Norfolk Chelsea Waltham Cambridge 95 l Strong community relationships through business with non- Watertown Boston Newton Dorchester Plymouth Brookline profits, municipal governments, and higher education Providence Bristol 495 Needham Quincy Dedham l Long history of charitable commitment through the Marshall Hingham Barnstable Kent New Bedford Braintree M. & Barbara J. Sloane Private Foundation Washington Newport l Chairman, President and CEO: Barry R. Sloane; Century Bank 27 branches in MA Century Bank Corporate HQ Vice Chair: Linda Sloane Kay Key metrics Loan and deposit breakdowns (GAAP) Balanced loan portfolio High quality deposit portfolio Consumer & other th Time deposits 9 $531mm $6.4bn 10% Consumer: 25% 10% Overall deposit share Market Cap. Total Assets in Boston MSA NIB demand Residential MMDA RE 15% 20% 38% $5.5bn $3.0bn Municipal 5% 0.04% C&D $42mm ~12% C&I 0% 10-year average 44% NCOs / avg. loans 2020 Net Income 2020 ROATCE Savings & NOW CRE (vs. 0.25% for KRX²) 32% 26% Commercial: 75% 55% loans / deposits ratio Source: Company filings; FactSet; SNL Financial Note: Financial data as of December 31, 2020; Market data as of April 6, 2021 1 Excluding trust banks 4 2 Nasdaq Regional Banking Index “KRX” current constituents
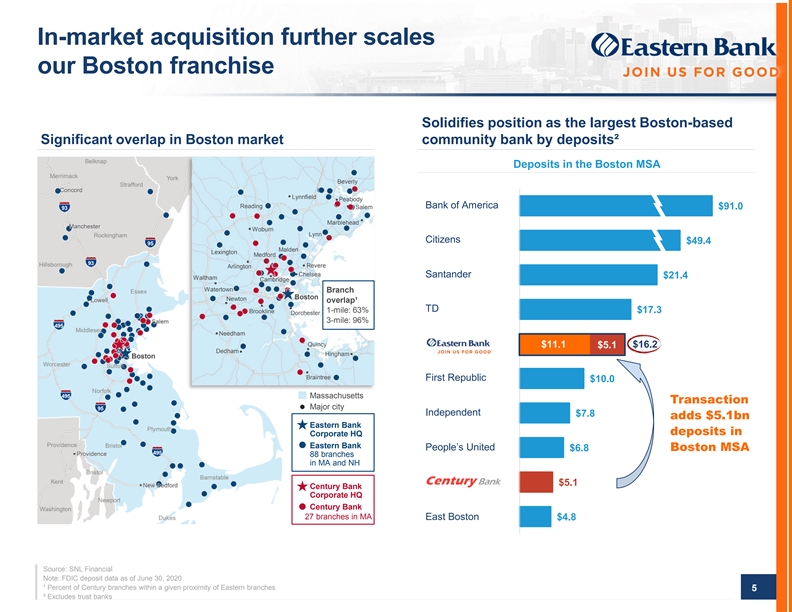
In-market acquisition further scales our Boston franchise Solidifies position as the largest Boston-based Significant overlap in Boston market community bank by deposits² Deposits in the Boston MSA Beverly Lynnfield Peabody Reading Bank of America Salem 93 $91.0 Marblehead Woburn Lynn Citizens $49.4 95 Malden Lexington Medford 93 Revere Arlington Chelsea Santander $21.4 Waltham Cambridge Watertown Branch Boston Newton overlap¹ TD Brookline 1-mile: 63% $17.3 Dorchester 3-mile: 96% 495 Needham Quincy $11.1 $5.1 $16.2 Dedham Hingham Boston Braintree First Republic $10.0 495 Massachusetts Transaction 95 Major city Independent $7.8 adds $5.1bn Eastern Bank deposits in Corporate HQ Eastern Bank People’s United $6.8 Boston MSA 495 88 branches in MA and NH $5.1 Century Bank Corporate HQ Century Bank 27 branches in MA East Boston $4.8 Source: SNL Financial Note: FDIC deposit data as of June 30, 2020 ¹ Percent of Century branches within a given proximity of Eastern branches 5 ² Excludes trust banksIn-market acquisition further scales our Boston franchise Solidifies position as the largest Boston-based Significant overlap in Boston market community bank by deposits² Deposits in the Boston MSA Beverly Lynnfield Peabody Reading Bank of America Salem 93 $91.0 Marblehead Woburn Lynn Citizens $49.4 95 Malden Lexington Medford 93 Revere Arlington Chelsea Santander $21.4 Waltham Cambridge Watertown Branch Boston Newton overlap¹ TD Brookline 1-mile: 63% $17.3 Dorchester 3-mile: 96% 495 Needham Quincy $11.1 $5.1 $16.2 Dedham Hingham Boston Braintree First Republic $10.0 495 Massachusetts Transaction 95 Major city Independent $7.8 adds $5.1bn Eastern Bank deposits in Corporate HQ Eastern Bank People’s United $6.8 Boston MSA 495 88 branches in MA and NH $5.1 Century Bank Corporate HQ Century Bank 27 branches in MA East Boston $4.8 Source: SNL Financial Note: FDIC deposit data as of June 30, 2020 ¹ Percent of Century branches within a given proximity of Eastern branches 5 ² Excludes trust banks

Boston area is one of the most dynamic banking markets in the country Boston is one of the most attractive urban areas in the U.S. Best in business and education, resulting in prime demographics $94k median annual household income in Boston Fortune 500 Diversified industry employment⁹ exceeds the national median by $29k per year¹ 14 companies 3% 8th largest deposit market in the U.S.², with 4% 4% ~$250bn deposits 23% 4% 6% 50% of Bostonians over 25 hold at least a Bachelor’s degree, vs. 32% across the U.S.³ 9% 22% >3k small and mid-sized businesses based in Boston, 11% ranking 10th most amongst American cities⁴ 14% Colleges & universities >100 9% of Venture Capital investments in 2018 Education and health services funded companies headquartered in MA (third to CA and NY)⁵ Professional and business services Trade, transportation and utilities Government STEM jobs are projected to grow by 11% from ’16–’26 Financial activities in Massachusetts, with ~$100k / yr salary⁶ Leisure and hospitality Manufacturing Mining, logging and construction Top 3 hospitals and cancer centers in the world are in Information Boston⁷, and 4 Boston hospitals are in the top 6 of Other services NIH funds received⁸ ¹ U.S. Census Bureau—Household Income: 2019; ² SNL Financial, data as of June 2020; $10bn deposit cap; ³ U.S. Census Bureau; 2020 American Community Survey; ⁴ U.S. Census Bureau – Statistics of U.S. Businesses – 2017; ⁵ National Venture Capital Association, data as of 2018; ⁶ Commonwealth Corporation—STEM Brief 2019; ⁷ Boston.gov/amazon-hq2; ⁸ National Institute of Health data as of 2020; ⁹ Bureau of Labor Statistics data as of January 2021 6Boston area is one of the most dynamic banking markets in the country Boston is one of the most attractive urban areas in the U.S. Best in business and education, resulting in prime demographics $94k median annual household income in Boston Fortune 500 Diversified industry employment⁹ exceeds the national median by $29k per year¹ 14 companies 3% 8th largest deposit market in the U.S.², with 4% 4% ~$250bn deposits 23% 4% 6% 50% of Bostonians over 25 hold at least a Bachelor’s degree, vs. 32% across the U.S.³ 9% 22% >3k small and mid-sized businesses based in Boston, 11% ranking 10th most amongst American cities⁴ 14% Colleges & universities >100 9% of Venture Capital investments in 2018 Education and health services funded companies headquartered in MA (third to CA and NY)⁵ Professional and business services Trade, transportation and utilities Government STEM jobs are projected to grow by 11% from ’16–’26 Financial activities in Massachusetts, with ~$100k / yr salary⁶ Leisure and hospitality Manufacturing Mining, logging and construction Top 3 hospitals and cancer centers in the world are in Information Boston⁷, and 4 Boston hospitals are in the top 6 of Other services NIH funds received⁸ ¹ U.S. Census Bureau—Household Income: 2019; ² SNL Financial, data as of June 2020; $10bn deposit cap; ³ U.S. Census Bureau; 2020 American Community Survey; ⁴ U.S. Census Bureau – Statistics of U.S. Businesses – 2017; ⁵ National Venture Capital Association, data as of 2018; ⁶ Commonwealth Corporation—STEM Brief 2019; ⁷ Boston.gov/amazon-hq2; ⁸ National Institute of Health data as of 2020; ⁹ Bureau of Labor Statistics data as of January 2021 6

Transaction summary l Fixed purchase price of $115.28 per share of Century Bancorp, Inc. common stock Class A and Class B Structurel 100% cash consideration l $642mm aggregate transaction value l Market premium: 21% Pricing and l P / TBVPS*: 1.75x implied l P / LTM EPS: 15.2x multiples¹ l P / LTM fully synergized EPS: 9.2x l Customary regulatory approvals Required l Century shareholder approval (Class A and Class B shareholders) approvals and n Sloane Family Enterprises, L.P., owner of 90%+ of Class B shares, has entered into a customary expected voting agreement to vote its shares in favor of the transaction closing th l Expected closing in the 4 quarter of 2021 l ~55% EPS accretion l ~10bps improvement to pro forma ROAA Attractive financial l ~600bps improvement to pro forma efficiency ratio returns¹ l ~9% TBVPS* dilution; manageable earnback of 4 years (cross over) l ~17%+ IRR Source: Company filings; FactSet; SNL Financial; Note: Market data as of April 6, 2021; * Tangible book value is a non-GAAP financial measure ¹ Eastern’s projections are based on consensus estimates; Century’s projections are based on Eastern’s internal forecast 7Transaction summary l Fixed purchase price of $115.28 per share of Century Bancorp, Inc. common stock Class A and Class B Structurel 100% cash consideration l $642mm aggregate transaction value l Market premium: 21% Pricing and l P / TBVPS*: 1.75x implied l P / LTM EPS: 15.2x multiples¹ l P / LTM fully synergized EPS: 9.2x l Customary regulatory approvals Required l Century shareholder approval (Class A and Class B shareholders) approvals and n Sloane Family Enterprises, L.P., owner of 90%+ of Class B shares, has entered into a customary expected voting agreement to vote its shares in favor of the transaction closing th l Expected closing in the 4 quarter of 2021 l ~55% EPS accretion l ~10bps improvement to pro forma ROAA Attractive financial l ~600bps improvement to pro forma efficiency ratio returns¹ l ~9% TBVPS* dilution; manageable earnback of 4 years (cross over) l ~17%+ IRR Source: Company filings; FactSet; SNL Financial; Note: Market data as of April 6, 2021; * Tangible book value is a non-GAAP financial measure ¹ Eastern’s projections are based on consensus estimates; Century’s projections are based on Eastern’s internal forecast 7

Key transaction assumptions l 45% of Century’s operating non-interest expense base (~$37mm pre-tax) Synergiesl Phase-in of 50% in 2022 and 100% thereafter l Revenue synergies have been identified, but not modeled l Gross credit mark ~1.3% of total loans, consistent with Century’s current reserve levels (ex-PPP) Credit mark l Eastern will implement CECL on January 1, 2022, and preliminary estimates indicate this will have an immaterial impact on Century’s reserve vs. the incurred loss methodology l ~$17mm securities write-up, amortized over 4 years using sum-of-year-digits methodology ~$2mm deposits write-up, amortized over 4 years using sum-of-year-digits methodology l Fair value marks l ~$9mm FHLB write-up, amortized over 4 years using sum-of-year-digits methodology l ~$10mm write-down of other assets One-time merger related l Approximately $64mm pre-tax ($53mm after-tax) charges Core deposit l 0.50% of all non-time deposits, amortized over 10 years sum-of-year-digits methodology intangibles Additional l Durbin adjustment: 40% reduction in Century’s 2020 debit interchange fees (~$0.5mm after-tax) adjustments Source: Company filings; FactSet; SNL Financial 8Key transaction assumptions l 45% of Century’s operating non-interest expense base (~$37mm pre-tax) Synergiesl Phase-in of 50% in 2022 and 100% thereafter l Revenue synergies have been identified, but not modeled l Gross credit mark ~1.3% of total loans, consistent with Century’s current reserve levels (ex-PPP) Credit mark l Eastern will implement CECL on January 1, 2022, and preliminary estimates indicate this will have an immaterial impact on Century’s reserve vs. the incurred loss methodology l ~$17mm securities write-up, amortized over 4 years using sum-of-year-digits methodology ~$2mm deposits write-up, amortized over 4 years using sum-of-year-digits methodology l Fair value marks l ~$9mm FHLB write-up, amortized over 4 years using sum-of-year-digits methodology l ~$10mm write-down of other assets One-time merger related l Approximately $64mm pre-tax ($53mm after-tax) charges Core deposit l 0.50% of all non-time deposits, amortized over 10 years sum-of-year-digits methodology intangibles Additional l Durbin adjustment: 40% reduction in Century’s 2020 debit interchange fees (~$0.5mm after-tax) adjustments Source: Company filings; FactSet; SNL Financial 8

Financially and strategically compelling opportunity to deploy capital Equivalent share Century acquisition vs. Century acquisition¹ repurchase² share repurchase ~10% of CET1 ~10% of CET1 Capital deployed Neutral ~$630mm capital deployed ~$985mm capital deployed Significantly more EPS ~55% accretive ~40% accretive ü earnings accretion Similar TBVPS TBVPS earnback* 4 years 4 years ü earnback* Efficiency ratio ~600bps improvement No improvement Improves efficiency ü Improves longer-term Enhances franchise None Strategic rationale ü competitive position value Deploys capital By 4Q 2021 Timing of capital deployment 3+ years³ ü faster Source: FactSet; SNL Financial; Note: Financial data as of December 31, 2020; Market data as of April 6, 2021; Metrics shown are fully synergized; * Tangible book value is a non-GAAP financial measure 1 Eastern’s projections are based on consensus estimates; Century’s are projections based on Eastern’s internal forecast ² lllustratively assumes shares are repurchased at current price of $19.39 9 ³ Share repurchase prohibited within the first year after conversion (completed on October 14, 2020), and limited until three years after the conversion Financially and strategically compelling opportunity to deploy capital Equivalent share Century acquisition vs. Century acquisition¹ repurchase² share repurchase ~10% of CET1 ~10% of CET1 Capital deployed Neutral ~$630mm capital deployed ~$985mm capital deployed Significantly more EPS ~55% accretive ~40% accretive ü earnings accretion Similar TBVPS TBVPS earnback* 4 years 4 years ü earnback* Efficiency ratio ~600bps improvement No improvement Improves efficiency ü Improves longer-term Enhances franchise None Strategic rationale ü competitive position value Deploys capital By 4Q 2021 Timing of capital deployment 3+ years³ ü faster Source: FactSet; SNL Financial; Note: Financial data as of December 31, 2020; Market data as of April 6, 2021; Metrics shown are fully synergized; * Tangible book value is a non-GAAP financial measure 1 Eastern’s projections are based on consensus estimates; Century’s are projections based on Eastern’s internal forecast ² lllustratively assumes shares are repurchased at current price of $19.39 9 ³ Share repurchase prohibited within the first year after conversion (completed on October 14, 2020), and limited until three years after the conversion
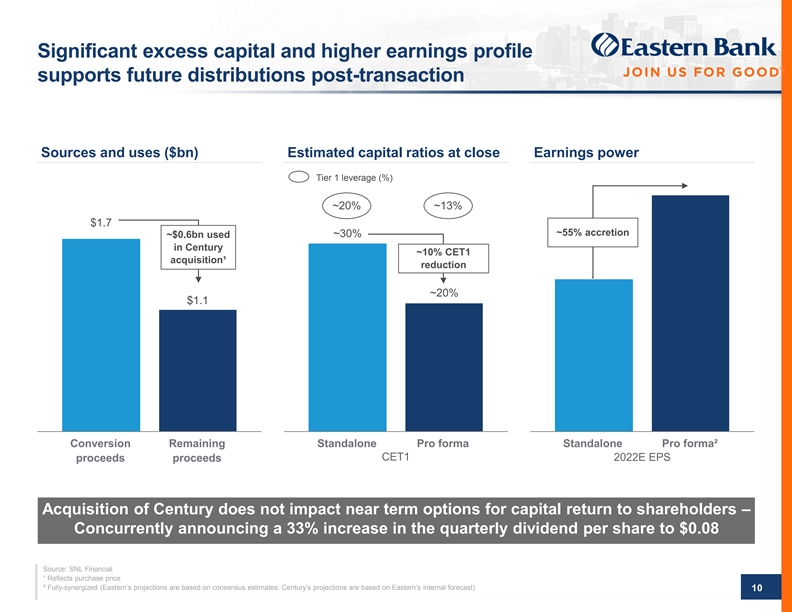
Significant excess capital and higher earnings profile supports future distributions post-transaction Sources and uses ($bn) Estimated capital ratios at close Earnings power Tier 1 leverage (%) ~20% ~13% $1.7 ~55% accretion ~30% ~$0.6bn used in Century ~10% CET1 acquisition¹ reduction ~20% $1.1 Conversion Remaining Standalone Pro forma Standalone Pro forma² CET1 2022E EPS proceeds proceeds Acquisition of Century does not impact near term options for capital return to shareholders – Concurrently announcing a 33% increase in the quarterly dividend per share to $0.08 Source: SNL Financial ¹ Reflects purchase price ² Fully-synergized (Eastern’s projections are based on consensus estimates; Century’s projections are based on Eastern’s internal forecast) 10Significant excess capital and higher earnings profile supports future distributions post-transaction Sources and uses ($bn) Estimated capital ratios at close Earnings power Tier 1 leverage (%) ~20% ~13% $1.7 ~55% accretion ~30% ~$0.6bn used in Century ~10% CET1 acquisition¹ reduction ~20% $1.1 Conversion Remaining Standalone Pro forma Standalone Pro forma² CET1 2022E EPS proceeds proceeds Acquisition of Century does not impact near term options for capital return to shareholders – Concurrently announcing a 33% increase in the quarterly dividend per share to $0.08 Source: SNL Financial ¹ Reflects purchase price ² Fully-synergized (Eastern’s projections are based on consensus estimates; Century’s projections are based on Eastern’s internal forecast) 10

Prudent pricing, with the value of cost synergies exceeding the premium P / TBVPS* for regional banks¹ since Value of net cost synergies exceeds the market January 1, 2015 premium paid for Century ($mm) KRX¹ P / TBVPS* over time 2.60x Since 1/1/2015 1.83x Pre-COVID (until 2/19/20) 1.87x 2.40x ~$330 YTD median 1.52x Current 1.66x 2.20x ~$220 value creation for Eastern 2.00x shareholders 1.80x Transaction P / TBV*: 1.60x 1.75x ~$110 1.40x 1.20x 1.00x 0.80x Premium over Century's Capitalized value Jan-15 Apr-16 Jul-17 Oct-18 Jan-20 Apr-21 market cap. of synergies² 100% cash transaction will allow Eastern shareholders to capture any potential upside Source: SNL Financial; Note: Market data as of April 6, 2021; * Tangible book value is a non-GAAP financial measure 1 Nasdaq Regional Banking Index “KRX” current constituents ² Based on 2022E after-tax cost synergies ($30mm) net of Durbin impact ($0.5mm) capitalized at 13.0x (long-term KRX median), net of after-tax one-time merger related charges ($53mm) 11Prudent pricing, with the value of cost synergies exceeding the premium P / TBVPS* for regional banks¹ since Value of net cost synergies exceeds the market January 1, 2015 premium paid for Century ($mm) KRX¹ P / TBVPS* over time 2.60x Since 1/1/2015 1.83x Pre-COVID (until 2/19/20) 1.87x 2.40x ~$330 YTD median 1.52x Current 1.66x 2.20x ~$220 value creation for Eastern 2.00x shareholders 1.80x Transaction P / TBV*: 1.60x 1.75x ~$110 1.40x 1.20x 1.00x 0.80x Premium over Century's Capitalized value Jan-15 Apr-16 Jul-17 Oct-18 Jan-20 Apr-21 market cap. of synergies² 100% cash transaction will allow Eastern shareholders to capture any potential upside Source: SNL Financial; Note: Market data as of April 6, 2021; * Tangible book value is a non-GAAP financial measure 1 Nasdaq Regional Banking Index “KRX” current constituents ² Based on 2022E after-tax cost synergies ($30mm) net of Durbin impact ($0.5mm) capitalized at 13.0x (long-term KRX median), net of after-tax one-time merger related charges ($53mm) 11

Comprehensive due diligence and integration plan Diligence focus areas Process and integration timeline l Due diligence Commercial Credit Bankingn 85+ employees, business leaders, advisors and specialists participated n In-depth review of Lending and Credit: substantially all loans over $10mm, including commercial, residential and consumer Risk, BSA and Retail n Focus on Education and Health Care specialties Compliance Banking n Extensive work on combining branch networks. EBC increasing network by 9 branches although retaining significant number of Clarion branches n Operations and Compliance review covering Lockbox business, Cyber Information Municipal Security, AML/BSA Technology Finance l 4Q21—1Q22 integration n Continued involvement of senior management Human n Fully onboard onto Eastern IT systems Lockbox Resources n Lean on extensive acquisition experience to unify operations n Proactively reach out to clients and minimize business disruption l Eastern has a proven track record of integration, having integrated 7 bank Finance & Tax acquisitions since 1999 Accounting Low integration risk 12Comprehensive due diligence and integration plan Diligence focus areas Process and integration timeline l Due diligence Commercial Credit Bankingn 85+ employees, business leaders, advisors and specialists participated n In-depth review of Lending and Credit: substantially all loans over $10mm, including commercial, residential and consumer Risk, BSA and Retail n Focus on Education and Health Care specialties Compliance Banking n Extensive work on combining branch networks. EBC increasing network by 9 branches although retaining significant number of Clarion branches n Operations and Compliance review covering Lockbox business, Cyber Information Municipal Security, AML/BSA Technology Finance l 4Q21—1Q22 integration n Continued involvement of senior management Human n Fully onboard onto Eastern IT systems Lockbox Resources n Lean on extensive acquisition experience to unify operations n Proactively reach out to clients and minimize business disruption l Eastern has a proven track record of integration, having integrated 7 bank Finance & Tax acquisitions since 1999 Accounting Low integration risk 12
The next step in our journey Bolsters scale and density of our Boston franchise Deploys capital in a strategic and financially attractive opportunity Enhances our financial profile with substantial upside potential Low risk, in-market transaction Pro forma excess capital and higher earnings support future distributions Highly compelling opportunity to deploy capital and create shareholder value 13The next step in our journey Bolsters scale and density of our Boston franchise Deploys capital in a strategic and financially attractive opportunity Enhances our financial profile with substantial upside potential Low risk, in-market transaction Pro forma excess capital and higher earnings support future distributions Highly compelling opportunity to deploy capital and create shareholder value 13

AppendixAppendix

Century Bancorp, Inc. historical financials Fiscal year ended 12/31/2016 12/31/2017 12/31/2018 12/31/2019 12/31/2020 Total assets $4,463 $4,786 $5,164 $5,492 $6,359 Gross loans 1,924 2,176 2,286 2,426 2,996 Total deposits 3,653 3,917 4,407 4,400 5,452 Tangible common equity 237 258 298 330 368 Loans / deposits 53% 56% 52% 55% 55% Net income $25 $22 $36 $40 $42 ROAA 0.57% 0.48% 0.74% 0.76% 0.70% ROATCE 10.9% 8.8% 13.2% 12.5% 12.1% NIM 2.12% 2.25% 2.18% 2.10% 2.00% Efficiency ratio 63% 58% 59% 58% 55% Fee income 18% 16% 15% 16% 15% Cost of deposits 0.39% 0.52% 0.88% 1.24% 0.69% Yield on loans 3.82% 3.86% 3.92% 4.13% 3.36% NPLs / total loans 0.24% 0.20% 0.17% 0.18% 0.21% Reserves / loans 1.27% 1.21% 1.25% 1.22% 1.18% NCOs / average loans (0.00%) (0.00%) (0.04%) 0.01% (0.00%) TCE / TA 5.3% 5.4% 5.8% 6.0% 5.8% CET1 10.4% 10.7% 11.3% 11.8% 11.4% Source: SNL Financial 15 Asset Capital Profitability Balance sheet qualityCentury Bancorp, Inc. historical financials Fiscal year ended 12/31/2016 12/31/2017 12/31/2018 12/31/2019 12/31/2020 Total assets $4,463 $4,786 $5,164 $5,492 $6,359 Gross loans 1,924 2,176 2,286 2,426 2,996 Total deposits 3,653 3,917 4,407 4,400 5,452 Tangible common equity 237 258 298 330 368 Loans / deposits 53% 56% 52% 55% 55% Net income $25 $22 $36 $40 $42 ROAA 0.57% 0.48% 0.74% 0.76% 0.70% ROATCE 10.9% 8.8% 13.2% 12.5% 12.1% NIM 2.12% 2.25% 2.18% 2.10% 2.00% Efficiency ratio 63% 58% 59% 58% 55% Fee income 18% 16% 15% 16% 15% Cost of deposits 0.39% 0.52% 0.88% 1.24% 0.69% Yield on loans 3.82% 3.86% 3.92% 4.13% 3.36% NPLs / total loans 0.24% 0.20% 0.17% 0.18% 0.21% Reserves / loans 1.27% 1.21% 1.25% 1.22% 1.18% NCOs / average loans (0.00%) (0.00%) (0.04%) 0.01% (0.00%) TCE / TA 5.3% 5.4% 5.8% 6.0% 5.8% CET1 10.4% 10.7% 11.3% 11.8% 11.4% Source: SNL Financial 15 Asset Capital Profitability Balance sheet quality

Pro forma loans and deposits Consumer & other Consumer & other Consumer & other 12% 10% 11% C&I¹ C&I¹ C&I¹ 38% 48% 34% Residential Residential Residential RE RE RE 15% 14% 14% Loans C&D $9.7bn $3.0bn $12.7bn C&D (GAAP) C&D 0% 2% 3% CRE CRE CRE 34% 26% 37% CDs CDs CDs 2% 5% 10% Non-interest Non-interest Non-interest bearing Money bearing bearing 20% market 40% 34% 28% Money market Deposits $12.2bn $5.5bn $17.6bn 31% (GAAP) Money market 38% Interest checking Interest checking Interest checking & savings & savings & savings 30% 30% 32% Source: Company filings Note: Financial data as of December 31, 2020; Pro forma represents weighted average of standalone metrics, excludes impacts from purchase accounting ¹ Includes Municipal loans for Century and Business banking loans for Eastern 16Pro forma loans and deposits Consumer & other Consumer & other Consumer & other 12% 10% 11% C&I¹ C&I¹ C&I¹ 38% 48% 34% Residential Residential Residential RE RE RE 15% 14% 14% Loans C&D $9.7bn $3.0bn $12.7bn C&D (GAAP) C&D 0% 2% 3% CRE CRE CRE 34% 26% 37% CDs CDs CDs 2% 5% 10% Non-interest Non-interest Non-interest bearing Money bearing bearing 20% market 40% 34% 28% Money market Deposits $12.2bn $5.5bn $17.6bn 31% (GAAP) Money market 38% Interest checking Interest checking Interest checking & savings & savings & savings 30% 30% 32% Source: Company filings Note: Financial data as of December 31, 2020; Pro forma represents weighted average of standalone metrics, excludes impacts from purchase accounting ¹ Includes Municipal loans for Century and Business banking loans for Eastern 16

Reconciliation of non-GAAP capital metrics Century Bancorp, Inc. and Subsidiaries (Unaudited, dollars in thousands, except per share data) As of Dec 31, 2020 Calculation of tangible book value per share Total shareholders' equity (GAAP) $370,409 Less: Goodwill and other intangibles 2,714 Tangible shareholders' equity (non-GAAP) $367,695 Common shares outstanding 5,567,909 Tangible book value per share (non-GAAP) $66.04 Source: Company filings 17Reconciliation of non-GAAP capital metrics Century Bancorp, Inc. and Subsidiaries (Unaudited, dollars in thousands, except per share data) As of Dec 31, 2020 Calculation of tangible book value per share Total shareholders' equity (GAAP) $370,409 Less: Goodwill and other intangibles 2,714 Tangible shareholders' equity (non-GAAP) $367,695 Common shares outstanding 5,567,909 Tangible book value per share (non-GAAP) $66.04 Source: Company filings 17

GOOD INVESTS. GOOD ADVISES. GOOD LENDS. GOOD HELPS FEED HUNGRY KIDS. GOOD FUELS THE HUNGRY STARTUP. GOOD HELPS KIDS LEARN TO PAINT. AND DANCE. AND REALIZE HOW SPECIAL THEY ARE. GOOD BUILDS PLAYGROUNDS. AND REBUILDS LIVES. GOOD INSURES. GOOD ENDURES. GOOD FIGHTS DISCRIMINATION. GOOD STANDS UP FOR EQUAL OPPORTUNITY. GOOD INNOVATES. GOOD EDUCATES. GOOD ADVOCATES. GOOD HELPS PEOPLE BEAT ADDICTIONS. GOOD PAYS CLOSE ATTENTION. GOOD PAYS IT FORWARD. 18GOOD INVESTS. GOOD ADVISES. GOOD LENDS. GOOD HELPS FEED HUNGRY KIDS. GOOD FUELS THE HUNGRY STARTUP. GOOD HELPS KIDS LEARN TO PAINT. AND DANCE. AND REALIZE HOW SPECIAL THEY ARE. GOOD BUILDS PLAYGROUNDS. AND REBUILDS LIVES. GOOD INSURES. GOOD ENDURES. GOOD FIGHTS DISCRIMINATION. GOOD STANDS UP FOR EQUAL OPPORTUNITY. GOOD INNOVATES. GOOD EDUCATES. GOOD ADVOCATES. GOOD HELPS PEOPLE BEAT ADDICTIONS. GOOD PAYS CLOSE ATTENTION. GOOD PAYS IT FORWARD. 18