Attached files
| file | filename |
|---|---|
| 8-K - CURRENT REPORT - Proterra Inc | ea139248-8k_arclightclean.htm |
Exhibit 99.1

Revolutionizing Commercial Vehicle Electrification Analyst Day - April 8, 2021

Disclaimer This presentation (together with oral statements made in connection herewith, the “ Presentation ”) is for informational purposes only to assist interested parties in making their own evaluation with respect to the proposed business combination (the “ Business Combination ”) between ArcLight Clean Transition Corp. (“ ArcLight ”) and Proterra Inc. (“ Proterra ” or the “ Company ”).. The information contained herein does not purport to be all - inclusive and none of ArcLight, the Company nor any of their respective subsidiaries, stockholders, shareholders, affiliates, representatives, control persons, partners, directors, officers, employees, advisers or agents make any representation or warranty, express or implied, as to the accuracy, completeness or reliability of the information contained in this Presentation. You should consult your own counsel and tax and financial advisors as to legal and related matters concerning the matters described herein, and, by accepting this Presentation, you confirm that you are not relying upon the information contained herein for any purpose or to make any decision. . To the fullest extent permitted by law, in no circumstances will ArcLight, the Company, or any of their respective subsidiaries, stockholders, shareholders, affiliates, representatives, control persons, partners, directors, officers, employees, advisers or agents be responsible or liable for any direct, indirect or consequential loss or loss of profit arising from the use of this Presentation, its contents, its omissions, reliance on the information contained within it, or on opinions communicated in relation thereto or otherwise arising in connection therewith. In addition, this Presentation does not purport to be all - inclusive or to contain all of the information that may be required to make a full analysis of the Company or the Business Combination. Use of Data Certain information contained in this Presentation relates to or is based on studies, publications, surveys and the Company’s own internal estimates and research. In addition, all of the market data included in this Presentation involves a number of assumptions and limitations, and there can be no guarantee as to the accuracy or reliability of such assumptions; neither the Company, ArcLight nor their representatives or affiliates assumes any responsibility for updating this Presentation based on facts learned following its use. Finally, while the Company believes its internal research is reliable, such research has not been verified by any independent source and none of ArcLight or the Company, nor any of their respective affiliates nor any of its or their control persons, officers, directors, employees or representatives make any representation or warranty with respect to the accuracy of such information. Forward - Looking Statements Certain statements in this Presentation may be considered forward - looking statements. Forward - looking statements generally relate to future events or ArcLight’s or the Company’s future financial or other performance metrics. For example (and without limitation), statements concerning the following include forward - looking statements: summary financial forecast; projections of operating performance, revenues, gross margin, expenses, capital expenditures, total cost of goods sold, gross (loss) profit; estimates and projections regarding future manufacturing capacity; projections and estimates of market opportunity and market share; future profitability; the Company’s business plan; market acceptance of the Company’s offerings, the Company’s ability to further attract, retain, and expand its customer base; the Company’s ability to timely and effectively scale its production and manufacturing processes; the Company’s ability to develop new products and services and bring them to market in a timely manner; the Company’s expectations concerning relationships with strategic partners, suppliers, and other third parties; the Company’s ability to maintain, protect, and enhance its intellectual property; future acquisitions, ventures or investments in companies or products, services, or technologies; the Company’s ability to attract and retain qualified employees; continuation of favorable regulations and government incentives affecting the markets in which the Company operates; the proceeds of the Business Combination and the Company’s expected cash runway; and the potential effects of the Business Combination on Arclight and the Company. In some cases, you can identify forward - looking statements by terminology such as “believe,” “may,” “will,” “potentially,” “estimate,” “continue,” “anticipate,” “intend,” “could,” “would,” “project,” “target,” “plan,” “expect,” or the negatives of these terms or variations of them or similar terminology. Such forward - looking statements are subject to risks, uncertainties, and other factors which could cause actual results to differ materially from those expressed or implied by such forward looking statements. These forward - looking statements are based upon estimates and assumptions that, while considered reasonable by ArcLight and its management, and the Company and its management, as the case may be, are inherently uncertain and subject to material change. New risks and uncertainties may emerge from time to time, and it is not possible to predict all risks and uncertainties. Factors that may cause actual results to differ materially from current expectations include, but are not limited to, various factors beyond management’s control, including general economic conditions and other risks, uncertainties and factors set forth in the section entitled “Risk Factors” and “Cautionary Note Regarding Forward - Looking Statements” in ArcLight’s final prospectus relating to its initial public offering, dated September 22, 2020, and other filings with the Securities and Exchange Commission (SEC), as well as factors associated with companies, such as the Company, that are engaged in commercial electric vehicle technology, including anticipated trends, growth rates, and challenges in those businesses and in the markets in which they operate; macroeconomic conditions related to the global COVID - 19 pandemic; trends with respect to government funding for public transit; the willingness of corporate and other public transportation providers to adopt and fund the purchase of electric vehicles for mass transit; expected adoption of electrification technologies for commercial vehicles; the size and growth of the market for alternative energy vehicles in general and medium - and heavy - duty electric vehicles, including transit buses and other commercial vehicles, in particular; the effects of increased competition; the ability to stay in compliance with laws and regulations that currently apply or become applicable to the commercial electric vehicle technology business and government contractors; the failure to realize the anticipated benefits of the Business Combination; the amount of redemption requests made by ArcLight’s public stockholders; the ability of the issuer that results from the Business Combination to issue equity or equity - linked securities or obtain debt financing in connection with the Business Combination or in the future. Nothing in this Presentation should be regarded as a representation by any person that the forward - looking statements set forth herein will be achieved or that any of the contemplated results of such forward - looking statements will be achieved. You should not place undue reliance on forward - looking statements in this Presentation, which speak only as of the date they are made and are qualified in their entirety by reference to the cautionary statements herein. Neither ArcLight nor the Company undertakes any duty to update these forward - looking statements. Use of Projections This Presentation contains projected financial information with respect to Proterra. Such projected financial information constitutes forward - looking information, and is for illustrative purposes only and should not be relied upon as necessarily being indicative of future results. The assumptions and estimates underlying such financial forecast information are inherently uncertain and are subject to a wide variety of significant business, economic, competitive and other risks and uncertainties that could cause actual results to differ materially from those contained in the prospective financial information. See “Forward - Looking Statements” paragraph above. Actual results may differ materially from the results contemplated by the financial forecast information contained in this Presentation, and the inclusion of such information in this Presentation should not be regarded as a representation by any person that the results reflected in such forecasts will be achieved. Neither ArcLight’s nor the Company’s independent auditors have audited, reviewed, compiled or performed any procedures with respect to the projections for the purpose of their inclusion in this Presentation, and accordingly, neither of them expressed an opinion or provided any other form of assurance with respect thereto for the purpose of this Presentation. In preparing and making certain forward - looking statements contained in this presentation, Proterra and ArcLight made a number of economic, market and operational assumptions. Notably, statements regarding the Company’s 2025 vision, and summary financial forecast are, without limitation, subject to material assumptions regarding the Company’s ability to economically manufacture and distribute its products at scale and meet its customers’ business needs, the Company’s ability to successfully execute its growth strategy, the Company’s ability to maintain required strategic supply arrangements, rates of adoption of battery electric vehicles by customers in the markets in which the Company operates, and continuation of favorable regulations and government incentives affecting the markets in which the Company operates. The Company cautions that its assumptions may not materialize and that current economic conditions render such assumptions, although believed reasonable at the time they were made, subject to greater uncertainty. I N T R O D U C T I O N 2 April 8, 2021

Disclaimer (Cont’d) Additional Information In connection with the proposed Business Combination, ArcLight s filed on February 2, 2021 with the SEC a registration statement on Form S - 4 containing a preliminary proxy statement/prospectus of ArcLight, and after the registration statement is declared effective, ArcLight will mail a definitive proxy statement/prospectus relating to the proposed Business Combination to its shareholders. This Presentation does not contain all the information that should be considered concerning the proposed Business Combination and is not intended to form the basis of any investment decision or any other decision in respect of the Business Combination. ArcLight’s shareholders and other interested persons are advised to read the preliminary proxy statement/prospectus and, when available, the amendments thereto and the definitive proxy statement/prospectus and other documents filed in connection with the proposed Business Combination, as these materials will contain important information about the Company, ArcLight and the Business Combination. When available, the definitive proxy statement/prospectus and other relevant materials for the proposed Business Combination will be mailed to shareholders of ArcLight as of a record date to be established for voting on the proposed Business Combination. Shareholders will also be able to obtain copies of the preliminary proxy statement/prospectus, the definitive proxy statement/prospectus and other documents filed with the SEC, without charge, once available, at the SEC’s website at www.sec.gov, or by directing a request to: ArcLight Clean Transition Corp., 200 Clarendon Street, 55th Floor, Boston, MA 02116. Financial Information Certain of the financial information and data contained in this Presentation is unaudited and does not conform to Regulation S - X promulgated under the Securities Act of 1933, as amended (the “Securities Act”). Accordingly, such information and data may not be included in, may be adjusted in or may be presented differently in, the registration statement filed by ArcLight and Proterra with the SEC. Participants in the Solicitation ArcLight, the Company and their respective directors and executive officers may be deemed participants in the solicitation of proxies from ArcLight’s shareholders with respect to the proposed Business Combination. A list of the names of ArcLight’s directors and executive officers and a description of their interests in ArcLight is contained in ArcLight’s final prospectus relating to its initial public offering, dated September 22, 2020, which was filed with the SEC and is available free of charge at the SEC’s web site at www.sec.gov, or by directing a request to ArcLight Clean Transition Corp., 200 Clarendon Street, 55th Floor, Boston, MA 02116. Additional information regarding the interests of the participants in the solicitation of proxies from ArcLight’s shareholders with respect to the proposed Business Combination will be contained in the definitive proxy statement/prospectus for the proposed Business Combination when available. No Offer or Solicitation This Presentation shall not constitute a “solicitation” as defined in Section 14 of the Securities Exchange Act of 1934, as amended. This Presentation does not constitute an offer, or a solicitation of an offer, to buy or sell any securities, investment or other specific product, or a solicitation of any vote or approval, nor shall there be any sale of securities, investment or other specific product in any jurisdiction in which such offer, solicitation or sale would be unlawful prior to registration or qualification under the securities laws of any such jurisdiction. No offer of securities shall be made except by means of a prospectus meeting the requirements of the Securities Act. Trademarks and Trade Names Proterra and ArcLight own or have rights to various trademarks, service marks and trade names that they use in connection with the operation of their respective businesses. This Presentation also contains trademarks, service marks and trade names of third parties, which are the property of their respective owners. The use or display of third parties’ trademarks, service marks, trade names or products in this Presentation is not intended to, and does not imply, a relationship with the Company or ArcLight, or an endorsement or sponsorship by or of the Company or ArcLight. Solely for convenience, the trademarks, service marks and trade names referred to in this Presentation may appear with the ®, TM or SM symbols, but such references are not intended to indicate, in any way, that the Company or ArcLight will not assert, to the fullest extent under applicable law, their rights or the right of the applicable licensor to these trademarks, service marks and trade names. Summary of Contracts Insofar as this Presentation contains summaries of existing agreements and documents, such summaries are qualified in their entirety by reference to the agreements and documents being summarized. I N T R O D U C T I O N 3 April 8, 2021
I N T R O D U C T I O N S i gn i f i c an t TAM Profitable Growth Financial Profile Di f f e r en t i a ted Technology R ea l - W o rl d Validation Our Mission Advancing Electric Vehicle Technology to Deliver the World’s Best Performing Commercial Vehicles I n n o v a t i o n DNA 4 April 8, 2021

Proterra Overview 5 April 8, 2021 Who We Are P R O T E R R A

P R O T E R R A O V E R V I E W Proterra’s Business Is Built Around Our Battery and Drivetrain Technology 6 April 8, 2021 High - Performance Batteries, Drivetrains and High Voltage Systems & Components for Heavy - Duty Applications

P R O T E R R A O V E R V I E W Proterra Transit: North America’s #1 Electric Transit Bus OEM 7 April 8, 2021 The Initial Application of Our Technology Was in Our Flagship North American Transit Bus Market

P R O T E R R A O V E R V I E W Proterra Powered: Battery & Drivetrain Supplier to Commercial Vehicle OEMs 8 April 8, 2021 Providing our Technology to Other Commercial Vehicle Segments Is a Much Larger, Capital - Efficient Opportunity

P R O T E R R A O V E R V I E W Proterra Energy: Fleet Charging & Energy Management Solutions 9 April 8, 2021 1. Through December 31, 2020 Additional Upside and Opportunity Evolved Out of Our Unique Insights into Fleet Charging’s Underserved Needs

P R O T E R R A O V E R V I E W Integrated Technology Ecosystem Enables Optimized Product Offering 10 April 8, 2021 Electrification Platform Provides Continuous Iteration and Improvement as well as Product Validation

April 8, 2021 P R O T E R R A O V E R V I E W 1 1 1. Over 600 vehicles on the road and over 450 vehicles in backlog as of December 2020 2. Includes commercial vehicles and charging; refer to Index on page 66 for additional information 3. From 2010 to 2019; refer to Index on page 66 for additional information 4. Versus diesel; refer to Index on page 66 for additional information 5 4 3 2 1 Integrated Technology Ecosystem Proven, Real - World Validation S i g n i f i c a n t A d d r e ss a b l e Market Today Strategic Partnerships Premier Strategic and Financial Investors ~$260Bn+ Global Commercial Electric Vehicle Market 2 ~85% Decline in Electric B a t t e r y Co s t s 3 Proven Track Record and Solid Foundation for Growth 1,000+ V ehi c l e s Sold 1 ~18M Real - World S e r v i ce M i le s 300 MWh Batteries P r odu c e d 46 MW C h a r g i n g Installed 6 Real Revenue, Rapid Growth, Clear Visibility ~40% Lower Vehicle O pe r a t i n g C o s t s 4 100% Zero Emissions by 2050 1 5 St a te Ta r ge t s 5 5. Medium - duty and heavy - duty truck market; refer to Index on page 66 for additional information 6. As of December 2020; represents Proterra Transit backlog and Proterra Powered orders signed and under advanced negotiation 68% ’20 - ’25E Revenue CAGR $750MM+ O r de r s an d B a c k lo g 6 25% ’ 2 5 E G r o ss Margin $197MM ’20 Revenue

April 8, 2021 P R O T E R R A O V E R V I E W 1 2 Battery - Electric Is Projected to Dominate Medium - Duty and Be Large Player in Heavy - Duty The Dawn of Commercial Vehicle Electrification Has Arrived 0% 20 2 0 20 22 20 2 4 20 26 20 2 8 20 3 0 20 3 2 20 3 4 20 3 6 20 3 8 20 4 0 25 % 50 % 75 % 10 0 % Morgan Stanley Forecasts for Commercial Vehicle Battery Electric Penetration 4 N o r th A m e r i c a n Medium - Duty 7 4 % European M e d i u m - D u t y 9 0 % N o r th A m e r i c a n Heavy - Duty 3 0 % 1. Versus diesel; refer to Index on page 66 for additional information 2. From 2010 to 2019; refer to Index on page 66 for additional information 3. Medium - duty and heavy - duty truck market; refer to Index on page 66 for additional information 4. Morgan Stanley forecasts from March 2, 2021 report, “Mapping Alternative Powertrain Adoption” Total cost of ownership is crossing the tipping point: • 40% lower fuel/maintenance costs 1 • 85% decline in battery costs 2 Government / corporate targets are tightening: • 15 states: 100% zero - emission trucks by 2050 3 • Fed - Ex: 100% electric vehicles by 2030 • Amazon: 50% zero carbon shipments by 2030 • UPS: 12% lower ground emissions by 2025
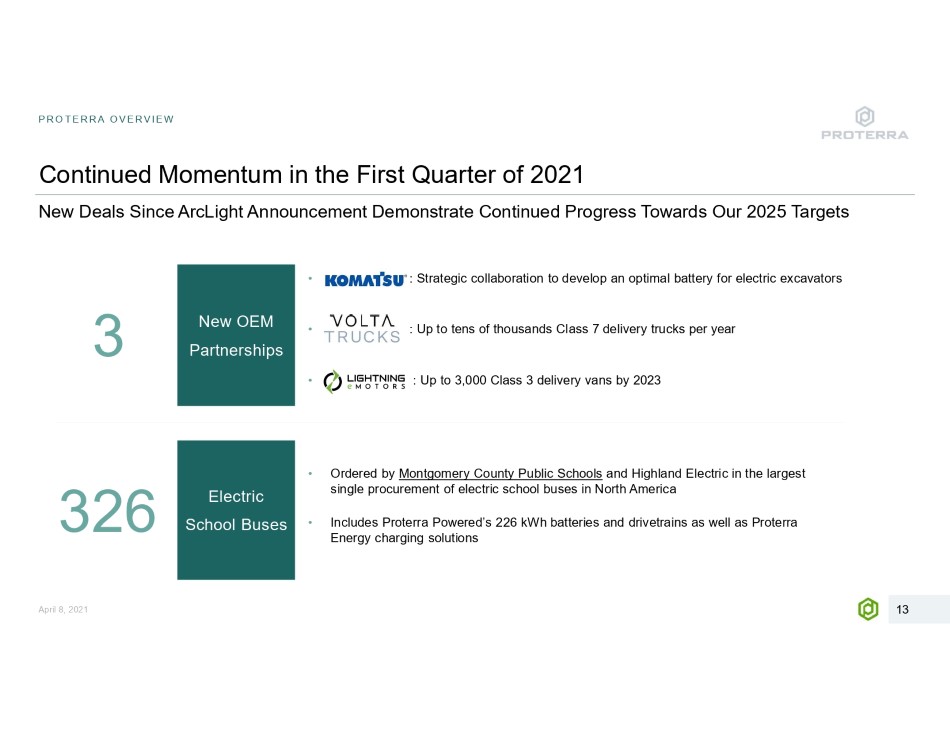
April 8, 2021 New OEM Pa r t nersh i p s • : Strategic collaboration to develop an optimal battery for electric excavators • : Up to tens of thousands Class 7 delivery trucks per year • : Up to 3,000 Class 3 delivery vans by 2023 Continued Momentum in the First Quarter of 2021 P R O T E R R A O V E R V I E W 1 3 New Deals Since ArcLight Announcement Demonstrate Continued Progress Towards Our 2025 Targets 3 • Ordered by Montgomery County Public Schools and Highland Electric in the largest single procurement of electric school buses in North America • Includes Proterra Powered’s 226 kWh batteries and drivetrains as well as Proterra Energy charging solutions Electric School Buses 3 2 6

April 8, 2021 Biden’s Jobs Plan P R O T E R R A O V E R V I E W 1 4 Proterra Provides Potential Solutions to Help Achieve the Electrification Targets of the American Jobs Plan ~100,000 sc h o o l b u se s electrified 500,000 EV Chargers “ To spur domestic supply chains from raw materials to parts… and support American workers to make batteries and EVs ” 50,000 diesel transit vehicles replaced Note: Numbers cited are overall goals set forth in the American Jobs Plan. The American Jobs Plan’s EV charging goals includes passenger vehicle charging, while Proterra’s solution is directed to commercial vehicle fleet charging only

April 8, 2021 Battery Cell Supply Secured through 2022 P R O T E R R A O V E R V I E W 1 5 In Discussions to Invest in Domestic Cell Manufacturing to Lock - in Long - Term Supply x End - market analysis in 2018 spurred internal initiative to secure long - term battery cell supply x Contract with LG Energy Solutions ensures cell supply at competitive prices through a critical growth phase x Active discussions to partner on an investment in U.S. - based cell manufacturing

April 8, 2021 P R O T E R R A O V E R V I E W 1 6 Strategically Positioned for a Total Addressable Market of ~$260 Billion ~$37 Billion Global Commercial Vehicle Charging Investment 2 C urren t Proterra Vehicle C a t e gor i e s ~$225 Billion Global Commercial Vehicle Powertrain Market 1 ~4.4 Million Vehicles 1 40 TWh Annual Energy Need by 2030+ 2 1. Estimated 2023 addressable market and number of vehicles for long - haul, medium - duty, construction / mining and buses; refer to Index on page 66 for additional information 2. Estimated 2030 addressable market and energy need excluding passenger cars; refer to Index on page 66 for additional information

Commercial Vehicle Batteries Must Overcome Significant Technical Challenges P R O T E R R A O V E R V I E W Proterra’s Battery Technology Is Optimized to Excel on the Factors Most Critical to Commercial Vehicles • 4,000 cycles • Designed to outlast the 12 - year life of a vehicle L i fe • C o m p e l l i n g T C O t oda y • <$20M Capex per GWh C ost • Maximizes passenger/cargo capacity • Increases range and vehicle efficiency Energy D e n s i ty • 675 MWh capacity • G W h pe r 5 0 k s q . f t . Ma n u f a c t u r a b il i ty • ISO 26262 • P a ss i ve p r opaga t i o n resistant Safety • Extended 12 - year warranty • Ballistic - grade enclosure Reliability 17 April 8, 2021

Pa r t ne rs h i p Model Offering Provided to OEMs Existing Commercial Vehicle Segments Served B a tt e r y S y s t e m EV C o mp on e n t s High Voltage Systems & Controls Dr i v e t ra i n End - t o - En d Powertrain Energy System Integration Battery / EV Components Bat t e r y Supply P R O T E R R A O V E R V I E W Range of Offerings from Battery Supply to Complete Powertrain Integration to Seamlessly Electrify Vehicles Proterra Powered Technology Spans the Electric Drivetrain Ecosystem Coach Bus Stepvan T rans i t B u s S ch o ol B u s T rans i t Bus S hutt l e Bus E x c avator Cl as s 7 Truck Cl as s 3 Van 18 April 8, 2021

P R O T E R R A O V E R V I E W 1 9 Product Year Opened M a x . A n n u a l C ap ac i ty Battery 2020 675 MWh 1 Los Angeles, CA Bus 2017 280 Vehicles Battery 2017 345 MWh 2 Burlingame, CA Bus 2011 400 Vehicles Greenville, SC Modular, Scalable Manufacturing Enables Expansion at Customer Sites April 8, 2021 55% Reduction in Labor and Overhead 3 1. Represents capacity of our newest - generation 2170 cells 2. Represents capacity of our prior - generation 18650 cells 3. Per Bus x Replicable: Template for co - location at customer sites Since 2017 86% Reduction in Battery Unit Cost Advanced R&D, 81 Patents, and Manufacturing Capabilities In - Place and At - Scale Demonstrated Ability to Efficiently Scale Capacity Established Footprint in Technology and Manufacturing Hubs Los Angeles Battery Factory Is a Template for Future Sites x Rapid Deployment: Built in under 12 months x Cost Effective: Sub - $20MM invested, 50K sq. ft. per GWh x Automated: ~50% labor cost reduction

P R O T E R R A O V E R V I E W 2 0 U.S. - Based Europe - Based China - Based Competitor Competitor Competitor Complete Drivetrain Offering x x Vehicle Integration Expertise and Experience x Integrated Fleet - Level Charging Solutions x Domestic U.S. Production (Buy America - eligible) x x Modular Manufacturing x Vertically - Integrated Portfolio and First - Hand Vehicle and Charging Experience Provide Distinct Advantage Our Integrated Role throughout the Electrification Eco - System Enhances Our Offering and Is Difficult to Replicate Proterra Provides a More Complete Solution than Its Battery Competitors April 8, 2021

April 8, 2021 P R O T E R R A O V E R V I E W 2 1 x Deliveries expected to begin in 2021 x Existing Industry Fleet in U.S.: 300,000+ vehicles 2 x In production since Q2 2020 x Existing Industry Fleet in U.S.: 480,000+ vehicles 3 • World’s largest commercial vehicle manufacturer with unmatched global scale • ~ $50 b i l li on i n ann u al r e v en u e and ~ 5 2 0,0 0 0 a n nu a l v eh i cl e s s o l d 1 Meaningful Shareholder and Senior Executive Commitment S i z ab l e , E x i st i n g C o mm e r c i a l A g r ee m en ts Daimler Strategic Partnership Validates Our Technology in Multiple Segments World’s Largest Commercial Vehicle Manufacturer is a Customer and Investor • In September 2018, Daimler Trucks & Buses co - led investment in Proterra • Anchor investor in the current $415MM PIPE 1. Fiscal Year 2019 2. Refer to Index on page 66 for additional information 3. Refer to Index on page 66 for additional information Jochen Goetz Head of Finance & Controlling, Daimler Trucks & Buses Proterra Director Seven Iconic Commercial Vehicle Brands Under One Roof

P R O T E R R A O V E R V I E W Gareth Joyce President, Proterra Powered & Energy Rick Huibregtse Sr. VP, Engineering Josh Ensign Chief Operating Officer J oA nn C o v i n g t o n Chief Legal Officer J oh n W a l sh Sr. VP of Sales Leade rs h i p T ea m Public Company - Ready Leadership Team and Board J a c k A ll e n Chief Executive Officer A m y A r d Chief Financial Officer J a c k A ll e n Chairman Ryan Popple Director Jochen Goetz Director C o n s t a n ce S k i d m o r e Director Mike Smith Director Brook Porter Director Jeannine Sargent Director B oa r d o f D ir e c t o r s Dustin Grace Chief Technology Officer J a k e E r h a r d D i r e c t o r N o m ine e 22 April 8, 2021

Proterra Business Units 23 April 8, 2021 How We Win P R O T E R R A

P R O T E R R A B U S I N E S S U N I T S Lower Cost of Ownership Wins • Charging hardware • Design & installation • Ongoing energy usage • Battery cost/kWh • Drivetrain efficiency • Degradation and lifespan • Fuel efficiency • Uptime • Maintenance costs 24 April 8, 2021

Battery Cost Declines Are Tipping the TCO Scales for Electric Trucks & Buses P R O T E R R A B U S I N E S S U N I T S Total Cost of Ownership Is Increasingly a Critical Driver of Commercial Vehicle Demand Beyond Regulation Transit Buses Can Offer TCO Advantage vs. Diesel Today School Bus TCO Can Be Significantly Higher with V2G Benefits Lawrence Berkeley National Laboratory Study Forecasts Electric Long - Haul Trucks Will Have 50% Lower TCO than Diesel by 2030 2020 2025 1. Electric transit bus assumes 40k miles/year and 12 - year life, 2.5 kWh usable energy per mile, $0.12/kWh electricity price, $0.50/mile maintenance costs, and ~65% price premium; 2025 assumes (30 - 40%) reduction in battery cost, ~(5%) reduction in vehicle price, 2. Electric stepvans assume 20k miles/year and 15 - year life, 1.6 kWh usable energy per mile, $0.12/kWh electricity price, $0.40 mile maintenance costs, and ~100% price premium vs. diesel; 2025 assumes (30 - 40%) reduction in battery cost and (15 - 20%) reduction in vehicle price 3. Diesel parity assumes fuel costs of $3/gallon; diesel transit bus assumes 40k miles/year and 12 - year life, 3.3 mpg, and $1.00/mile maintenance costs; diesel stepvan assumes 20k miles/year and 15 - year life, 10 mpg, and $0.60/mile maintenance costs; 2025 assumes 5% increase in vehicle price TCO vs. Diesel Diesel Pa rity 3 % Wo rs e % B e t t e r Electric S t e p va ns 2 Electric Transit Bus 1 + 17 % ( 4% ) + 7 % + 14 % 2020 2025 4. Vehicle to grid assumes additional net benefit of ~$5k per year per vehicle, approximately one - third of the V2G revenue potential of ~$15k per electric school bus estimated by a 2014 University of Delaware study, “A Cost Benefit Analysis of a V2G - Capable Electric School Bus Compared to a Traditional Diesel School Bus” 5. Electric school bus assumes 13.5k miles/year and 15 - year life, 1.6 kWh per mile, $0.12/kWh electricity price, $0.40/mile maintenance costs, and ~170% price premium; 2025 assumes (30 - 40%) reduction in battery cost and (15 - 20%) reduction in vehicle price 6. Diesel parity assumes 13.5k miles/year and 15 - year life, fuel costs of $3/gallon, 7.5 mpg, and $1.10/mile maintenance costs; 2025 assumes 5% increase in vehicle price TCO vs. Diesel Diesel Pa rity 6 % Wo rs e % B e t t e r Electric School Buses w/No V2G 5 Electric School Buses w/V2G 4 ( 8% ) 25 April 8, 2021 + 8 % + 8 % + 23 % Note: All analyses assume 5% discount rate and do not incorporate energy infrastructure costs or demand charges nor incentives or carbon credits

April 8, 2021 Short - Haul Segments Offer Large and Viable Electrification Opportunity Today P R O T E R R A B U S I N E S S U N I T S 2 6 > 5 k > 3 5k > 5 0k > 7 5k > 9 0k > 1 0 0 k > 1 4 0 k > 3 0 0 k North American North American International Bus European North American North American North American G l o b a l Annual Unit Volumes 1. Refer to Index on page 66 for sources 2. School Bus Fleet (2018): Type C and D school buses only 3. Freedonia (2018): International includes transit and coach buses in Europe, Australia, and Japan 4. LMC Automotive (2019) Per Year 1 (lbs.) Miles Traveled ~40k 12k - 15k ~40k 20k - 30k 10k - 25k 12k - 30k 12k - 20k NM Gross Weight 30k - 45k ~30k 50 - 55k 14k - 32k 33k+ 10k - 16k 14k - 32k 14k - 90k+ Transit Bus School Bus 2 + North American Medium - Duty Straight Class 8 Cutaway Chassis 6 Medium - Duty Excavators C o a c h B u s 3 T r u c k s 4 T r u c k s 5 Trucks 7 Vehicles with High Mileage, Low Fuel Efficiency, and Fixed Depot - Based Routes Are Ideal for Electrification 5. Allison Transmissions (2019) 6. Ford Authority and Good Car Bad Car: Cutaway chassis includes Ford E - Series, Ram Promaster, GMC Savana and includes applications including cargo vans, shuttle buses, Type A school buses 7. LMC Automotive (2019). Excludes school bus and cutaway chassis broken out separately 8. Cuimmins (2020) 8

P R O T E R R A B U S I N E S S U N I T S 2 7 Proterra Powered Overview April 8, 2021 Providing the Performance, Lifespan and Costs Required for Heavy - Duty Fleet Electrification

April 8, 2021 Outsourcing Likely to Remain a Major Component of OEMs’ Battery Strategies P R O T E R R A B U S I N E S S U N I T S 2 8 OEMs Typically Outsource Most, if Not All, Diesel/CNG Powertrains Across Most Commercial Vehicle Segments Already 1 0 0% 1 0 0% 3 r d - Par t y S u p p lier > 75% < 25% 7 5 % 2 5 % Vertically - Integrated > 15% < 85% Transit & S c h o o l B u s es 1 Cutaway C h a s s is 2 Straight Class 8 Trucks 3 M e d i u m - Dut y Trucks 4 E x c ava t o r s 5 Three Critical Elements of the Value that Proterra Powered Provides to OEMs in their Electrification Initiatives Technology leadership Speed to market Scale and Flexibility 1 2 3 1. North American market. Based on product spec sheets from New Flyer, Nova Bus, Bluebird, Navistar, and Thomas Built Buses 2. North American market. While cutaway chassis include powertrains produced by "first - stage" manufacturers, they are by definition sold to "second - stage" manufacturers who build bodies on top of them 3. North American market. Based on Allison Transmission’s 2019 and 2020 market share 4. Based on Cummins’ reported share of the North American medium - duty market in 2020 5. Based on Cummins’ reported share of the global excavator market in 2020

OEM Partner Model Saf - T - Liner C2 Jouley CX45E ZDI - P450 E1 Applications Served School buses (Type C) Commuter coach buses Transit buses (Australia) Cutaway chassis Vehicle Class Class 7 Class 8 Class 8 Class 4 Battery Size 226 kWh 676 kWh 452 kWh 113 kWh Range up to 135 miles up to 310 miles up to ~200 miles up to 125 miles Production Volumes Deliveries began in Q2 2020 First deliveries in 1H 2021 Initial production targeted for 2021 Initial production targeted for 2021 P R O T E R R A B U S I N E S S U N I T S Initial Partnerships Established a Foundation for our Growth 29 April 8, 2021

P R O T E R R A B U S I N E S S U N I T S OEM Partner Model Volta Zero MT50e Transit Van Hydraulic Excavator Applications Served Last - Mile Urban Delivery Step Vans Cargo vans, ambulances, shuttle buses 10 – 20 ton Vehicle Class Class 7 Class 4 - 6 Class 3 Construction Equipment Battery Size 225 kWh 226 kWh Confidential Confidential Range up to 125 miles > 125 miles up to ~200 miles NM Production Volumes First deliveries targeted for 2022 Initial production targeted for 2021 Initial production of ~100 in 2021; Targeting ~3k in 2023 First prototype in 2021; commercial production planned for 2023 - 24 New Partnerships Have Expanded into Truck and Off - Highway Categories 30 April 8, 2021
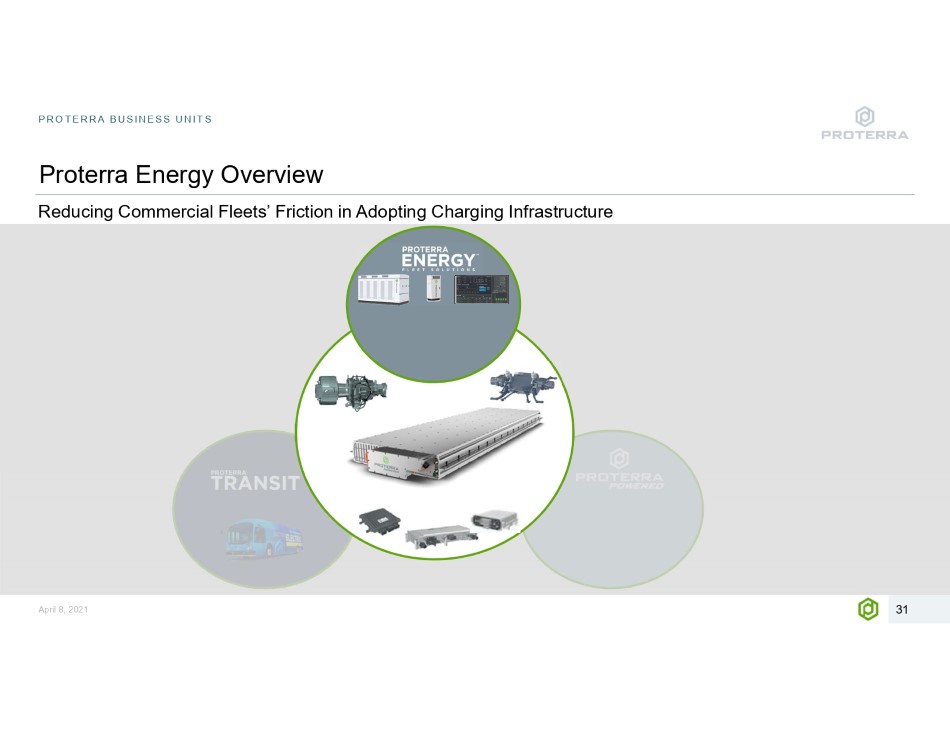
P R O T E R R A B U S I N E S S U N I T S Proterra Energy Overview 31 April 8, 2021 Reducing Commercial Fleets’ Friction in Adopting Charging Infrastructure

P R O T E R R A B U S I N E S S U N I T S 3 2 Proterra Energy: Commercial Vehicle Charging is Challenging and Underserved $37Bn of Annual Investment Expected in Global Charging Infrastructure by the End of the Decade 1 Charging is Key to Electrify Commercial Vehicle Fleets… …and Represents a Large, Underserved Market Op e r a t i o n a l Constraints • Must conform to existing high - density fleet yard layouts • Must support grid stability • Must seamlessly integrate into normal - course operations D est i n a t i o n Charging • Over 250,000 warehouses in the U.S. 4 • Focus: integration of charging with logistical activities Hi g h P o w er Needs • Hundreds of vehicles per depot, each requiring 75 – 300 kW of charging power • Peak power of up to ~30 MW per depot, multiples of typical interconnection Fleet D e p o t s • Over 1.4MM vehicles managed by US fleet operators 2 • Focus: lowering TCO across vehicles and chargers C o n t i nu o u s Service • Commercial vehicles operate every day, with consistently high charging needs • 99%+ uptime is expected, reliability is a must even with untrained operators E n - R o u t e Top - Ups Significant Market Opportunity Requiring a Multidisciplinary Approach April 8, 2021 1. Refer to Index on page 66 for additional information 2. Refer to Index on page 66 for additional information 3. Refer to Index on page 66 for additional information 4. Refer to Index on page 66 for additional information • Over 300,000 truck parking spaces across the U.S. 3 • Focus: integration with existing infrastructure

P R O T E R R A B U S I N E S S U N I T S Proterra Energy: Pioneering High - Power, Fleet - Scale Charging Solutions Early Leadership in Electric Buses Has Provided First - Mover Advantage in Commercial Vehicle Fleet Charging 4 .3 2 .5 2 .4 2 .0 1 .8 1 .6 1 .5 1 .5 1 .4 1 .3 1 .3 1 .1 1 .1 1 .1 MW Charging Installed 15 customers with >1 MW charging installed 46 MW charging infrastructure installed 45 0 + charging infrastructure installed > 80% Transit customers have purchased our charging solutions 13% of 2020 revenue 33 April 8, 2021

• Fleet modeling & planning • Utility interface • Turnkey infrastructure installation • Project management • 2nd life battery fleet expansion • Agreement with recycling leader Redwood Materials • High density behind - the - fence solutions • Medium voltage interface • Energy storage integration capability • Exclusive partnership with: • EaaS financing & battery leasing • In - house developed SaaS platform • Fleet monitoring • V 2 G D E RMS integration P R O T E R R A B U S I N E S S U N I T S Proterra Energy: Integrated Fleet Charging Solutions Charging Modeling, Hardware, Installation, and Management Provide an End - to - End Solution E ng i ne e r e d Planning Energy S ou r c i ng Storage / R e s ili en cy Charging I n f r a st r u ct u r e Energy M a nage m en t Reuse / R e c y c li n g 34 April 8, 2021

P R O T E R R A B U S I N E S S U N I T S Proterra Energy: Apex Software Aims to Optimize Charging & Energy Usage BUS & CHARGER SCHEDULE PO W E R D E M A N D ON GRID $17.4 M 5 MW 4 5 Power (kW) Hypothetical project cost : Max. power demand : # of 150 kW chargers: Unmanaged Charging Model Managed Charging Model $9 M 1.3 MW 1 2 Power (kW) D e m an d charge threshold D e m an d charge threshold S c h e duled M ai n t e na n c e 35 April 8, 2021 Charging In Operation

Proterra Vehicle - to - Grid Applications Can Transform Electric Vehicles Into Utility Grid Assets and Lower TCO P R O T E R R A B U S I N E S S U N I T S Vehicle Data ( k W h, mi l es, SO H ) Electrical Grid CLOUD ENERGY MANAGEMENT Mobile Energy Storage Bi - Directional Charger Distributed Energy Resource Management System Bi - Directional Power Flow (AC) Command Charge / D i sch a r ge Charge Sess i on Metrics Bi - Directional Power Flow (DC) ENERGY P R O V I D E R Proterra Energy: Vehicle - to - Grid Platform Unlocks New Revenue Opportunities Command & Schedule Charge Session Metrics D a ta E ne r g y Initial Customers: Dominion Energy Beverly, Massachusetts 36 April 8, 2021

Proterra Energy: Eliminating the Friction to Electric Fleet - Scale Charging P R O T E R R A B U S I N E S S U N I T S Efficient Charging and Energy Management Solutions Can Lower the Total Cost of Ownership of Electrification Capital Costs Capital Costs • Reduction in chargers per vehicle of 50%+ • Eliminates need for switchgear and transformer upgrades C o m pa t i b ili ty Compatibility S pa t i a l Spatial Energy Costs Energy Costs • Charges Proterra and other electric vehicles • Compliance with SAE universal standards; CCS1 industrial dispenser • Universal plug - in and pantograph options • Only ~1,100 sq. ft. per MW of charging • 34% reduction in equipment square footage • Optimizes charge scheduling and control • Minimizes utility demand charges Fleet Charging Constraint Fleet Charging Constraint Our Proprietary Software Algorithms Analyze Fleets and Utility Rates to Optimize Scheduling and Charging 37 April 8, 2021

P R O T E R R A B U S I N E S S U N I T S Proterra Transit Overview 38 April 8, 2021 Validating our Technology with a Purpose - Built Vehicle in the Segment Early to Electrify

April 8, 2021 P R O T E R R A B U S I N E S S U N I T S 3 9 1. Refer to Index on page 66 for additional information 2. Reflects seven North American city and state mandates (California, NYC, Toronto, Chicago, Seattle, Minneapolis and Miami); refer to Index on page 66 for additional information 3. NFI Group’s active North American transit bus bid universe; refer to Index on page 66 for additional information 4. Refer to Index on page 66 for additional information P r o te r r a C ust o m er Proterra Transit: North American Bus Market Is Rapidly Electrifying 50% 2% 2017 2018 2019 2020 2021 2022 2023 2024 2025 25K+ North American Buses Must be 100% Zero Emission by 2040 2 Zero Emission Buses Now 26% of Active Bid Universe 3 130+ Communities in 43 States and Provinces Choose Proterra Frost & Sullivan Project 50% Electric Penetration by 2025 1 Proterra’s Customers Operate Over 30% of the N.A. Transit Bus Fleet 4 % of Total North American Bus Market (Annual Sales) $ 4 50MM + Cumulative Revenue 450+ Vehicles in Backlog 600+ Vehicles on the Road

P R O T E R R A B U S I N E S S U N I T S 4 0 Battery/Drivetrain Technology Has Driven Leadership in Flagship Validation Market with 50%+ Market Share 1 Purpose - Built Electric Transit Bus Technology Platform Proterra Transit: North America’s #1 Electric Transit Bus OEM CLEAN & QUIET 5 th GENERATION P r o v e n V a l i da t i o n • 50% Market Share • 18 Million Real - World Service Miles • 10+ Year Vehicle Service Track Record • Successfully Completed 8 Altoona Tests April 8, 2021 S u pe r i o r P e r f o r m a n ce • Long Range • High Fuel Efficiency • F ast e r Acc e l e r a t i o n th a n d i es e l • Greater Horsepower than diesel S i gn i f i c an t S a v i ng s • Low Operating Costs • High Uptime • Zero Tailpipe Emissions 1. 2012 - 2019 Proterra electric transit bus market share in North America; refer to Index on page 66 for additional information

Customer Highlights Customer Case Studies in Fully Integrated Proterra Solutions P R O T E R R A B U S I N E S S U N I T S Electric Bus, Charging Infrastructure and Charge Management Software Deployment • Proterra Transit: 40 electric transit buses • Proterra Powered: 660 kWh batteries and DuoPower drivetrains • Proterra Energy: 4.3 MW of charging hardware x Fully integrated charging solutions x First - of - its - kind depot layout and software control systems x Optimizes scheduling while lowering demand charges x Dominion Energy is seeking state approval for additional 1,000+ electric school buses over next 5 years x Bus batteries utilized as grid resource x Provides backup power, stabilization and load shifting Customer Highlights Batteries, Drivetrains, Vehicle Controls, and V2G Services Deployment • Proterra Powered: End - to - end electric powertrains for 50 Thomas - built school buses • Proterra Powered: 220 kWh batteries, drivetrains and vehicle controls • Proterra Energy: Charging infrastructure and V2G services 41 April 8, 2021

Proterra T e c h n o l o g y 42 April 8, 2021 Why We Win P R O T E R R A

P R O T E R R A T E C H N O L O G Y 4 3 Proterra’s Innovation DNA Premier and Innovative Product Development DNA Deep and Diversified Engineering Expertise • Core engineering team has deep automotive battery engineering experience and dedication to first - principles engineering • Expertise across multiple engineering disciplines: mechanical, electrical, chemical, software Strong Professional Backgrounds with Industry Leaders 81 Patents Across Our Integrated Technology Ecosystem 1 1. As of December 2020; key patent families are Battery Configuration and Energy Management, Powertrain and Vehicle Controls, Charging Interface and Methods, Composite Body and Vehicle Design, and Vehicle Controls April 8, 2021

Energy System Battery Pack Module C e ll s P R O T E R R A T E C H N O L O G Y 3 rd Party 3 rd Party Engineered, Validated and Manufactured by Proterra in California Engineered, Validated and Manufactured by Proterra in California • ~2 GWh contract secures cell supply from 2020 to 2022 • In - house cycle testing, safety testing, modeling, and algorithm development • Plan to co - invest in cell manufacturing capacity Small Format Cylindrical Cells • Liquid cooled module beams make - up entirety of internal pack structure • Capable of impact energy absorption • Cell fusing & interconnection made via high - speed fiber laser processing Highly Integrated Thermal and Structural Architecture • Functional safety certified (ISO 26262) battery management system developed with strategic partner • Flexible software and hardware architecture enables up to 1200 V strings • Patented thermal event mitigation • Ruggedized enclosure Flexible Battery M an a ge m e nt S y st e m • Internally - developed software, vehicle control unit, charge controller, and telemetry gateway • Advanced system enables seamless integration of batteries and powertrains into partner vehicles • Capable of over - the - air software flash updates Battery System: Vertically Integrated Development and Manufacturing Enhances Performance and Lowers Cost World - Class Cell Supply Deep Vertical Integration Approach Seamless Software Integration 44 April 8, 2021

P R O T E R R A T E C H N O L O G Y Scalable Lengths Configurable Voltage Battery System: Modular and Scalable for Many Commercial Vehicle Segments 1 , 00 0 Versatile Design Elements Can Enable Applications Across Commercial Vehicle Market KWh 113 Stackable Multiple Widths and Heights Modu l e Voltage Options • 17V / 25V / 35V / 50V Ba t t er y Pack • Up to 1200V • Up to 16 parallel strings B a tt er y S y s t em V e h i c l e 45 April 8, 2021

P R O T E R R A T E C H N O L O G Y Proterra Battery Core Attributes 46 April 8, 2021 Real - World Customer Benefit Intelligent Battery Management System x Hundreds of sensors delivering continuous monitoring and diagnostics Gravimetric Energy Density x Extended range, higher cargo / occupant capacity, and increased vehicle efficiency Volumetric Energy Density x Minimizes battery space requirements with packaging designed for safety Ruggedized, Commercial Grade Enclosure x Ballistic - grade materials designed to withstand the toughest conditions over vehicle lifecycle Functional Safety Certified x Redundant sensing and processing designed to ensure safe and reliable operation Resiliency to Cell Defects and Failures x Long life span, intrinsically resistant to cell propagation Multi - Layered Passive and Active Safety Systems x State - of - the - art testing, certification & compliance programs Designed to Excel in Medium and Heavy - Duty Vehicle Applications Battery System: State - of - the - Art Technology

P R O T E R R A T E C H N O L O G Y Battery System: Continuous Research and Development Excellence Battery Program Guiding Principles • Increase Energy Density • Lower Costs • Further Advance Safety Leadership Next Generation 25%+ e s t i m a t e d cost reduction S i g n i f i c a nt I n c r e ase i n Scale to 5+ GWh Pursue Investment in D e d i cat e d D o m es t i c Cell Capacity Continued M o du l e D e s i g n Enhancement D e e p en i ng o f Vertical Integration of Electrical Components Next Generation Battery Targeting Commercial Vehicle Powertrain Cost Parity by Mid - Decade Confidential 5 th Generation 20%+ e s t i m a t e d cost reduction 2 0 2 2 10% increase in Energy Density Vertical Integration of Sub - Components Greater Scale and Continued L e a r n i ng C u r ve 4 th Generation 2 0 2 1 Higher Ene r gy D en s i ty 2170 Cells Flexible Module Platform (7 Variants) 3 rd Generatio n 2 0 1 7 1 As compared to the 2 nd generation battery 47 April 8, 2021 First to Market with NCM 811 18650 Cells New Core S i n g l e M od u l e Architecture Ramp of Team Testing, and Integration 20%+ e s t i m a t e d cost reduction 80%+ cost reduction 1

P R O T E R R A T E C H N O L O G Y Technology Wheel T ra n s m iss io n T orqu e Co n t i nuou s Power Proterra DuoPower eAxle Dual 2 - Speed 22,00 0 N m 37 0 k W Next Generation (In Development) Confidential 4 - Speed 25,40 0 N m 20 0 k W Proterra Pr o Dr i v e 2 - Speed 19,70 0 N m 18 0 k W Proterra is Well - Positioned with a Strong Portfolio of Multi - Speed Drivetrain Solutions Best - in - Class Integrated Drivetrains: Proven, Advanced Performance Purpose - Built to Optimize Torque and Efficiency Industry - Leading Drivetrain Capabilities x Longest range with 5x the efficiency and 2x the acceleration of a diesel bus x Designed to outperform direct - drive systems in all conditions x Dedicated team performs system integration, software & controls, testing & validation x Next generation drivetrain unlocks new commercial vehicles Portfolio Serves Multiple Commercial Vehicle Applications 48 April 8, 2021

Unit Size 75 kW 150 kW 250 kW 500 kW 1.5 MW 1.5 MW Configuration Up to 4 vehicles Up to 2 vehicles Scalable up to 40 vehicles 1 st life or 2 nd life Status In Production In Development O v e r n i ght C ha r g er Automatic Charger Fleet Charger Fleet Battery P R O T E R R A T E C H N O L O G Y Open Source Communications Protocol V2G Bi - directional Power Flow Microgrid Ready Telematics Enabled Remote PCS Can Be Up to 500 Feet from Dispenser Intelligent Smart - Charging Capable Scalable & Adaptable Wall, Ceiling or Pedestal Installations Universal Using Industry - Standard Connections Fleet Charger Minimizes Footprint and Lowers Cost to the Customer Energy Solutions: Integrated Charging Applications for Fleets of All Sizes 49 April 8, 2021

Proterra F i na n c i a l s 50 April 8, 2021 How We Grow P R O T E R R A

P R O T E R R A F I N A N C I A L S 5 1 Proterra Transit Proterra Powered & Energy Setting the Stage for Our 2025 Revenue Target of ~$2.5 Billion April 8, 2021 $ 1 . 8 B $ 0 . 8 B + 1 1 4% • Buses delivered: ~1,000 • Avg. price per vehicle: $700k - $750k 1 • Proterra Powered vehicle sets delivered: 20 - 25k • Proterra Energy: 25 - 30% Transit/Powered end customers purchase charging solutions • Avg. price per vehicle: $50k - $150k for Powered and $30k - $100k+ for Energy 2 1. Blended bus pricing can vary on list price, customization, and product mix 2. Blended Proterra Powered pricing can vary on battery price, battery size, and attach rate of drivetrain and other components; blended charging solutions pricing can vary on product mix as well as additional infrastructure services that may be provided +39% Revenue 2020 - 25 CAGR Assumptions

P R O T E R R A F I N A N C I A L S Proterra Transit Forecasts Assume Higher Penetration and Moderation in Share Electric Penetration: 40 - 45% Battery - Electric Penetration Assumptions in 2025 Total North American Transit Bus Market: 5,500 – 6,000 Units Proterra’s Market Share Assumptions in 2025 North American Electric Transit Bus Sales: 2,200 – 2,700 Units Proterra share: ~40% 52 April 8, 2021

P R O T E R R A F I N A N C I A L S School, Shuttle, & Coach Buses 53 April 8, 2021 Medium - Duty Last - Mile Delivery Trucks/Vans Int'l Buses & Other Potential Vehicle Sets from Existing Partnerships P o t e n t i a l V e h i c l e Sets from New Partnerships 2025 Proterra Powered Unit Forecast 2025 Proterra Powered Vehicle Set Deliveries Proterra Powered Forecasts Are Built Bottom - Up by Partnership 2 0 - 25k 10 - 12k <1 - 2k 1 2 - 14k 5 - 8k 5 - 8k

April 8, 2021 Positive Gross Margin Today Paves the Path for Our 25% Target by 2025 P R O T E R R A F I N A N C I A L S 5 4 8 6 % r e d u ct i o n i n b a t t e ry c o st / k W h 54% reduction in labor and overhead 2 ~26% Gross Margin Expansion in Under Three Years 1 … …with Roadmap to ~25% Gross Margins at Scale 4 8 % r e d u ct i o n i n f r e i gh t c o st p e r b u s 4 % + 1 8% + 2 4% ( 2 1%) 2 5% G r o ss M a r g i n 2020 M a n u f a c t u r i ng Efficiency Bill of M a t e r i a l s Price Reduction, Market Expansion G r o ss M a r g i n 2025E Redesign • Battery pack • Drive train Resource / R enego ti a t e • Cells • V er t i c a l i nt e gra t io n (non - cell battery components, harnesses) Design for Manu f a c t u ra b i l i t y • Automation of battery module and pack line • Modularized design of products Proven Ability to Reduce Costs 1. Proterra cost reductions since 2017 2. Unit costs

April 8, 2021 Revenue and Cost Targets Point to ~$500 Million in EBITDA in 2025 P R O T E R R A F I N A N C I A L S 5 5 2025 Assumptions : ▪ R eve nu e o f ~ $ 2 . 5 B a n d Gr o s s M a r g i n o f ~ 2 5% ▪ Operating Expenses decline from ~50% of revenue today to <8% ▪ D&A rises from $15M+ today to ~$40M ▪ EBITDA Margins of ~20%

P R O T E R R A F I N A N C I A L S 5 6 Macro Uncertainties Add New Dimension of Variability to Our 2021 - 22 Outlook ▪ Acceleration in new Proterra Powered partnerships in 2021 YTD ▪ Early discussions with prospective Proterra Energy standalone customers Supply Chain and Transit Budget Delays in 2021 Likely to Have a Spillover Effect in 2022 ▪ Order cycles of municipal transit agencies have become prolonged ▪ Production restrained by lingering Covid complications, primarily related to global logistics ▪ Moderate increase in growth investment in response to accelerating adoption of commercial electric vehicles: • Capex for cell supply and earlier ramp in battery/bus capacity • R&D in battery, drivetrain, and software development • SG&A to build out Proterra Powered team and infrastructure

Use of Transaction Proceeds Expands Proterra’s Moat and Accelerates Growth P R O T E R R A F I N A N C I A L S Research & D e v e l op me n t Capital Investments Investments in Next - Generation Battery Program Target Powertrain Parity Projected Strategic Priorities Use of Proceeds • Continue to optimize battery performance and costs • Further develop drivetrain platform • Fortify software and energy - as - a - service offerings • Expand battery capacity to 5+ GWh • Broaden vertical integration • Co - locate factories at customers’ sites • Guarantee cell supply • Lower cell prices • Access to next - generation cell technology $200MM – $300MM $150MM – $225MM $100MM – $120MM Growth Capex Growth Capex Domestic Cell Capacity Investment Domestic Cell Capacity Investment 57 April 8, 2021

Transaction Positions Us to Fully Fund Growth Targets P R O T E R R A F I N A N C I A L S Positive EBITDA Estimated during 2023 and Positive Free Cash Flow in 2024 2021 - 2024 Assumptions : ▪ Cash Balance of $800M+ pro forma for the closing of the ArcLight transaction ▪ Capital Expenditure program from 2021 to 2024 of <$250M ▪ E BI T D A Lo s s e s o f < $ 200M b e f o r e t u rn i n g p o s i t i ve i n 2 0 2 3 ▪ W or k in g C a pi t a l U s a g e o f ~ $ 2 25M b e t w e e n 2 0 2 1 a n d 2 0 2 4 58 April 8, 2021
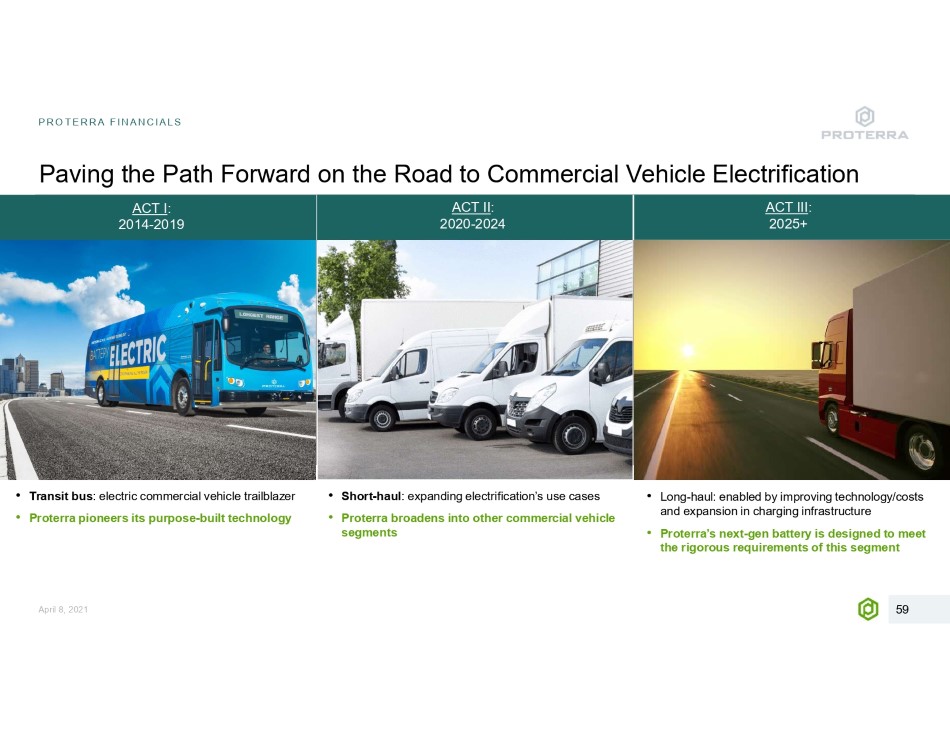
Paving the Path Forward on the Road to Commercial Vehicle Electrification P R O T E R R A F I N A N C I A L S • Transit bus : electric commercial vehicle trailblazer • Proterra pioneers its purpose - built technology ACT I : 20 1 4 - 2 0 1 9 ACT II : 20 2 0 - 2 0 2 4 A C T III : 2025+ • Short - haul : expanding electrification’s use cases • Proterra broadens into other commercial vehicle segments 59 April 8, 2021 • Long - haul: enabled by improving technology/costs and expansion in charging infrastructure • Proterra’s next - gen battery is designed to meet the rigorous requirements of this segment

Clean, Quiet Transportation for All 60 April 8, 2021

T r a n s a ct i o n Summary P R O T E R R A 61 April 8, 2021

April 8, 2021 • Proterra to combine with ArcLight Clean Transition Corp. (“ArcLight”), a publicly listed special purpose acquisition company with ~$278MM cash currently held in trust and a focus on leading companies enabling the transition to a sustainable future • Jake Erhard from ArcLight to join Proterra Board, adding substantial experience in transportation logistics, power and fueling infrastructure, and a focus on accelerating Proterra Energy business unit • Transaction reflects a $1.6Bn enterprise value for Proterra – Proterra to receive ~$648MM cash at closing based on the $415MM committed PIPE and current cash in trust levels – Proceeds will be used to continue to fund R&D and capex investments in next - generation battery program to unlock commercial vehicle powertrain parity – Existing Proterra shareholders to roll 100% of their stakes, expected to own ~69% of the pro forma company at closing • Pro forma company well - positioned and well - capitalized – $2.4Bn pro forma equity value 1 – $1.6Bn pro forma enterprise value • 3.7x 2022E revenue of $439MM • 0.6x 2025E revenue of $2,566MM • Strong balance sheet with ~$828MM of cash at close 2 Proterra and ArcLight Combination to Create Publicly Listed, Commercial Electric Vehicle Technology Leader I N T R O D U C T I O N 6 2 P r o t e rr a T ea m T r an s a c t i o n O v e r v i e w Jac k Allen Chairman and Chief Executive Officer A m y A r d Chief Financial Officer Dustin Grace Chief Technology Officer Aaron Chew VP, Investor Relations A rc L i gh t Cl ea n T r an si t i o n T ea m Jake Erhard President, Chief Executive Officer and Director Marco Gatti Chief Financial Officer 1. Amounts presented on this slide assume (1) there are no redemptions from the trust account, (2) the holders of Proterra’s 2020 Convertible Notes receive 30.3MM shares for the conversion in full of $200MM principal amount of their notes (interest calculations and conversion of same not included) and (3) $24MM of other liabilities. If not voluntarily converted at the time of the Closing of the business combination, the 2020 Convertible Notes will convert if Proterra’s common stock price exceeds ~$9.89 per share for 20 consecutive trading days after at least six months following the closing of the business combination. Amounts also exclude (1) outstanding out - of - the - money equity awards and outstanding unvested equity awards rolling over in the transaction and (2) the impact of any equity awards issued at or after the closing of the business combination 2. Assumes Proterra receives $648MM of cash at closing

• ArcLight Clean Transition Corp. is a SPAC listed on the Nasdaq Capital Market that priced its IPO on September 22, 2020 • ArcLight management team and board of directors bring significant experience in: x Transportation logistics x Renewable infrastructure x Power networks x Batteries x Electric vehicles • Sponsored by an affiliate of ArcLight Capital Partners, a leading private equity firm focused on power and energy infrastructure, and partnered with CAMS, a leading provider of operational and asset management services for infrastructure assets ArcLight Clean Transition Corp. Overview A R C L I G H T T R A N S A C T I O N O V E R V I E W 6 3 Positioned to Help Proterra Accelerate Commercial Vehicle Electrification Top - Tier Leadership ArcLight Clean Transition Corp. Overview Daniel Revers Chairman and Founder, ArcLight Capital Partners Arno Harris Director Audrey Lee Director Steven Berkenfeld Director Brian Goncher Director • ArcLight Clean Transition Corp. due diligence on Proterra includes: x In - depth strategy reviews of the company’s strategy across each business unit x Discussions with key customers x Multiple site visits to the Burlingame and Los Angeles factories x Independent review of Proterra’s battery technology by The Battery Lab A rc L i gh t ’ s D u e D il i gen c e o n P r o t e rr a April 8, 2021

Detailed Transaction Overview A R C L I G H T T R A N S A C T I O N O V E R V I E W 6 4 K e y T r an s a c t i o n T e r m s I l l u s t r a t i v e P r o F o r m a V a l ua t i o n • $1.6Bn pro forma enterprise value with strong balance sheet – 3.7x 2022E Revenue of $439MM • Earn - out of 2% of total shares outstanding at close issued to existing Proterra shareholders at illustrative pro forma share prices of $15.00 and an additional 2.5% at $20.00, $25.00 and $30.00 (or upon a change of control transaction at that valuation) I l l u s t r a t i v e Sou r c e s an d Us e s • 10% of ArcLight founder shares withheld at close subject to earn - out at $15.00 per share P r o F o r m a O w ne rs h i p @ $10 . 0 0 / Sha r e • Proterra and ArcLight entered into a business combination agreement on January 11, 2021 • ArcLight currently has $278MM in cash held in trust account 1 1 1. Amounts presented on this slide assume (1) there are no redemptions from the trust account, (2) the holders of Proterra’s 2020 Convertible Notes receive 30.3MM shares for the conversion in full of $200MM principal amount of their notes (interest calculations and conversion of same not included) and (3) $24MM of other liabilities. If not voluntarily converted at the time of the Closing of the business combination, the 2020 Convertible Notes will convert if Proterra’s common stock price exceeds ~$9.89 per share for 20 consecutive trading days after at least six months following the closing of the business combination. Amounts also exclude (1) outstanding out - of - the - money equity awards and outstanding unvested equity awards rolling over in the transaction and (2) the impact of any equity awards issued at or after the closing of the business combination April 8, 2021

I n de x 65 April 8, 2021 P R O T E R R A

I N D E X Index of Source Page 11 2. Based on $225Bn Global Commercial Vehicle Market and $37Bn Global Commercial Vehicle Charging Investment (see page 16 notes) 3. Source: BloombergNEF “Battery Pack Prices Fall As Market Ramps Up With Market Average At $156/kWh In 2019” (December 2019); The percentage decline discussed in this footnote is expressed in real dollars 4. Source: Goldman Sachs “Outlook for Alternative Powertrain Technologies in Global Truck Markets” (October 2020) 5. Source: California Air Resources Board “15 states and the District of Columbia join forces to accelerate bus and truck electrification” (July 2020 Press Release) Page 12 1. Source: Goldman Sachs “Outlook for Alternative Powertrain Technologies in Global Truck Markets” (October 2020) 2. Source: BloombergNEF “Battery Pack Prices Fall As Market Ramps Up With Market Average At $156/kWh In 2019” (December 2019); The percentage decline discussed in this footnote is expressed in real dollars 3. Source: California Air Resources Board “15 states and the District of Columbia join forces to accelerate bus and truck electrification” (July 2020 Press Release) Page 16 1. Total Addressable Market is based on management estimates of the assumed price of an electric powertrain, and the number of vehicles per the following sources: LMC, “Global Commercial Vehicle Forecast World Query – MHCV”, Q3 2020; Freedonia, “Global Buses Industry Study 6th Edition”, June 2019; Frost & Sullivan, “Global Electric Bus Market Opportunity Analysis, 2017 – 2025”, December 2018; Frost & Sullivan, “Global Earth Moving, Construction and Mining Equipment Market, Forecast to 2026”, December 2017. Bloomberg NEF, “Charging Infrastructure Forecast Model (CIFM)”, August 27, 2020. Estimates in 2023 are based on battery and drivetrain for all segments except North American transit, which includes assumed vehicle price 2. Source: BloombergNEF “Electric Vehicle Outlook 2020” Charging Infrastructure Forecast Model (August 2020) Page 21 3. Source: Propane Education & Resource Council’s Chief Business Development Officer Tucker Perkins quoted in LPGas Magazine “Industry Partners in place for propane to penetrate step - van market” (October 2014) 4. Source: American School Bus Council (December 2020) 66 April 8, 2021 P a ge 26 P a ge 32 P a ge 39 1. Source: Transit (U.S. Department of Energy’s Energy Efficiency & Renewable Energy: Alternative Fuels Data Center), school bus (U.S. Department of Energy’s Energy Efficiency & Renewable Energy: Alternative Fuels Data Center and the Environmental Defense Fund), coach bus (United Motor Coach Association), European bus (NEA Transport Research and Training), European medium - duty trucks (Roland Berger’s “Trends in the Truck & Trailer Market (August 2018)), Straight Class 8 trucks (U.S. Department of Energy’s Energy Efficiency & Renewable Energy: Alternative Fuels Data Center, U.S. Census Bureau, and Arizona State University’s “Compressed Natural Gas as a Fuel for Concrete Mixer Trucks: The Business Case”), cutaway chassis (U.S. Department of Energy’s Energy Efficiency & Renewable Energy: Alternative Fuels Data Center), and North American medium - duty trucks (U.S. Department of Energy’s Energy Efficiency & Renewable Energy: Alternative Fuels Data Center and NREL’s "Thirty - Six Month Evaluation of UPS Diesel Hybrid - Electric Delivery Vans”). 1. Source: BloombergNEF “Electric Vehicle Outlook 2020” Charging Infrastructure Forecast Model (August 2020) 2. Source: FleetOwner “FleetOwner 500 Top Private Fleets” (April 15, 2019) 3. Source: US. Department of Transportation Federal Highway Administration, Office of Freight Management and Operations "Jason’s Law Truck Parking Survey Results and Comparative Analysis“ (April 2015) 4. Source: Wonder “US Warehouses and Distribution Hubs” (March 14, 2020) 1. Source: Frost & Sullivan “Global Electric Bus Market Opportunity Analysis, 2017 - 2025” (December 2018) 2. Source: California Air Resources Board “California transitioning to all - electric public bus fleet by 2040” (December 14, 2018), the City of Chicago Resolution R2019 - 157, King County, "Metro is transitioning to a zero - emissions bus fleet” (August 2019), Miami - Dade County Board of County Commissioners Resolution R - 1034 - 18, Minnesota Metropolitan Council Transportation Committee “Bus Fleet Strategy” (December 10, 2018). Coalition for Clean Transportation, MTA 2020 - 2024 MTA Capital Program (September 2019), Toronto Transit Commission “TTC Green Initiatives” (December 2020), and Yale Environment 360, Yale School of the Environment (December 14, 2018) 3. Source: NFI Group Company Materials (3Q 2020); represents NFI Group’s North America transit bus active bid universe 4. Source: Total North American Bus Fleet size reached through the addition of the United States total bus fleet size of 66,116 (American Public Transportation Association “2019 Public Transportation Fact Book,” (2019)) to the Canadian total bus fleet size of 18,604 (Motor Carrier Passenger Council of Canada, “Labor Market Report 2019: Business and Financial” (2019) Page 40 1. Source: Federal Transit Administration's 2019 Annual Database Revenue Vehicle Inventory; share of electric b us es ≥3 5 - ft

April 8, 2021