Attached files
| file | filename |
|---|---|
| EX-99.1 - EX-99.1 - MMA Capital Holdings, LLC | mmac-20210331xex99d1.htm |
| 8-K - 8-K - MMA Capital Holdings, LLC | mmac-20210331x8k.htm |
Exhibit 99.2
| Shareholder Presentation April 1, 2021 Nasdaq: MMAC www.mmacapitalholdings.com 3600 O’Donnell Street, Suite 600, Baltimore, MD 21224 (443) 263-2900 |
| Disclaimer • This presentation and any related oral statements contain forward-looking statements intended to qualify for the safe harbor contained in Section 27A of the Securities Act of 1933, as amended, and Section 21E of the Securities Exchange Act of 1934, as amended. Forward-looking statements often include words such as “anticipate,” “believe,” “continue,” “could,” “estimate,” “expect,” “focus,” “intend,” ”may,” “plan,” “potential,” “project,” “see,” “seek,” “should,” “will,” “would,” and similar words or expressions and are made in connection with discussions of future events and future operating or financial performance. • Forward-looking statements reflect our management’s expectations at the date of this presentation regarding future conditions, events or results. They are not guarantees of future performance. By their nature, forward-looking statements are subject to risks and uncertainties, including the risks and uncertain aspects of the novel strain of the coronavirus (“COVID-19”) pandemic. Our actual results and financial condition may differ materially from what is anticipated in the forward-looking statements. There are many factors that could cause actual conditions, events or results to differ from those anticipated by the forward-looking statements contained in this presentation. Readers are cautioned not to place undue reliance on forward-looking statements in this presentation or that we may make from time to time, and to consider carefully the factors discussed in Part I, Item 1A. “Risk Factors” in our Annual Report on Form 10-K for the year ended December 31, 2020, which was filed with the Securities and Exchange Commission (“SEC”) on March 31, 2021. We do not undertake to update any forward-looking statements contained herein. • This presentation should be read in conjunction with the Company’s Annual Report filed on Form 10-K with the SEC. MMA Capital Holdings, Inc. 2 |
| Mission MMA Capital Holdings, Inc. (“MMAC”) focuses on infrastructure-related investments that generate positive environmental and social impacts and deliver attractive risk-adjusted total returns to our shareholders. MMA Capital Holdings, Inc. 3 |
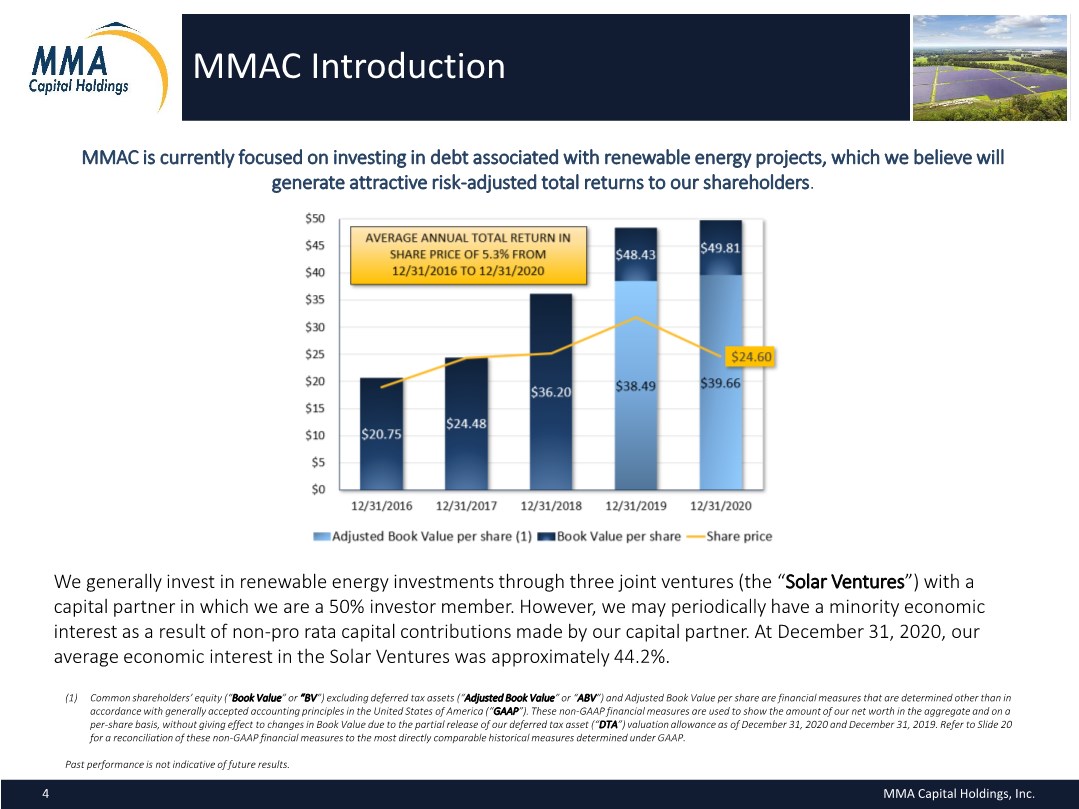
| MMAC Introduction MMAC is currently focused on investing in debt associated with renewable energy projects, which we believe will generate attractive risk-adjusted total returns to our shareholders. (1) Common shareholders’ equity (“Book Value” or “BV”) excluding deferred tax assets (“Adjusted Book Value” or “ABV”) and Adjusted Book Value per share are financial measures that are determined other than in accordance with generally accepted accounting principles in the United States of America (“GAAP”). These non-GAAP financial measures are used to show the amount of our net worth in the aggregate and on a per-share basis, without giving effect to changes in Book Value due to the partial release of our deferred tax asset (“DTA”) valuation allowance as of December 31, 2020 and December 31, 2019. Refer to Slide 20 for a reconciliation of these non-GAAP financial measures to the most directly comparable historical measures determined under GAAP. Past performance is not indicative of future results. MMA Capital Holdings, Inc. 4 We generally invest in renewable energy investments through three joint ventures (the “Solar Ventures”) with a capital partner in which we are a 50% investor member. However, we may periodically have a minority economic interest as a result of non-pro rata capital contributions made by our capital partner. At December 31, 2020, our average economic interest in the Solar Ventures was approximately 44.2%. |
| Impact of Electric Reliability Council of Texas (“ERCOT”) Market Exposure • At December 31, 2020, 55.9% of the total unpaid principal balance (“UPB”) of outstanding loans of the Solar Ventures were associated with a single sponsor and were secured by three projects located in Texas’ ERCOT service area. These projects are in different stages of their life cycle with one project operational, one in the construction phase and one in the development phase. • On February 24, 2021, our economic interest in loans related to these three projects became 45.0% and is expected to remain as such, based upon a non-pro rata capital contribution agreement executed with our capital partner. • During the second and third weeks of February 2021, a severe winter storm occurred in the ERCOT service area that impaired the operational capabilities of numerous fossil fuel and renewable energy generating assets in the region. This storm caused significant supply and demand imbalances, as well as power production deficiencies, resulting in demand for electricity to surge to unprecedented levels, driving the market price of power to the maximum price permitted by ERCOT for multiple days. • The financed operating project entered into a recapitalization in 4Q 2020. In 1Q 2021, it suffered a net power delivery shortfall during this weather event, resulting in a net settlement cost of $22.5 million pursuant to various energy supply and pricing agreements. As of March 31, 2021, the Solar Ventures expect to provide additional advances to the project to satisfy this net shortfall obligation and other payment obligations that may be required to facilitate the final closing of the recapitalization of the project. • Assuming that the Company was unable to recover any of the additional advances made to the operating project, when taken into account with loan-related interest income that is not expected to be accrued and other loan-related concessions granted in the first quarter of 2021 to secure a take-out commitment for the project in development, the Company’s allocable share of losses in the first quarter would be $23.3 million, or approximately $4.00 per share (such losses would be reported as a reduction to equity in income of the Solar Ventures). • However, it is difficult to estimate first quarter impacts related to these exposures in absence of, among other things, the completion of fair value measurements of loans outstanding at the Solar Ventures at March 31, 2021. • The projects that are in construction and development were not directly impacted by this weather event. However, the ERCOT market remains volatile and uncertain due to this weather event. There is litigation among various market participants, and potential legislative reform is being considered. This dynamic could lead to supply and demand imbalances in the market, impact the availability and pricing of tax equity and lead to a deterioration of the underlying project value. • The Solar Ventures’ concentration in the ERCOT service area could further impact when invested capital is repaid and available for reinvestment. MMA Capital Holdings, Inc. 5 |
| Impact of COVID-19 and the General Economy • During the year ended December 31, 2020, COVID-19 has not prevented us from operating our business and making investments, and the Company was in compliance with all of its debt covenants as of year end. • As of December 31, 2020, most of the renewable energy projects that have been financed through loans made by the Solar Ventures were not significantly impacted by COVID-19, and the projects did not experience any significant supply chain issues or construction delays during the year. • During the year ended December 31, 2020, origination activity at the Solar Ventures was not meaningfully impacted by COVID-19. • However, certain components of the national and some local renewable energy finance markets, such as the ERCOT market, have been and may further be affected by changing market dynamics, resulting in supply and demand imbalances. • Due to the downturn in the economy and local and state restrictions on retail tenants stemming from COVID- 19, the Company determined that its 80% ownership interest in a joint venture, which owns a mixed-use town center development, was impaired at June 30, 2020 and again at December 31, 2020. Consequently, this investment was written down to its fair value at each reporting date, and the Company recognized $12.7 million of related impairment losses for the year ended December 31, 2020. • Although we have not recognized impairment charges other than for the 80% ownership interest discussed above, it is reasonably possible that, as a result of COVID-19 and general economic conditions in the markets we serve, we may be required to recognize one or more material impairment charges over the next 12 months. • The long-term impact of COVID-19 will depend on future developments, which remain uncertain and difficult to predict. The adverse impact on our business, results of operations, financial condition and cash flows could be material. MMA Capital Holdings, Inc. 6 |
| 2020 Key Updates FINANCIAL RESULTS ▪ BV increased $8.8 million in 2020 to $289.9 million at December 31, 2020, and BV per share increased $1.38 in 2020 to $49.81 at December 31, 2020 ▪ This increase was primarily driven by strong returns on renewable energy investments ▪ BV includes $59.1 million of net DTAs at December 31, 2020 ▪ ABV increased $7.4 million in 2020 to $230.8 million at December 31, 2020, and ABV per share increased $1.17 in 2020 to $39.66 at December 31, 2020 RENEWABLE ENERGY INVESTING ▪ The Company generated an unlevered net return on investment from our renewable energy investments, as measured on a twelve-month trailing basis, of 11.5% and 11.4% for the periods ended December 31, 2020 and December 31, 2019, respectively(1) ▪ Most of our investments were made through the Solar Ventures, which closed $1.1 billion of commitments across 35 loans during 2020 ▪ At December 31, 2020, loans funded through the Solar Ventures had an aggregate UPB of $701.2 million and fair value (“FV”) of $702.6 million, a weighted-average (“WA”) remaining maturity of 17 months and a WA coupon of 12.4% ▪ The Company generated a leveraged net return on investment from our renewable energy investments, as measured on a twelve-month trailing basis, of 14.6% and 13.9% for the periods ended December 31, 2020 and December 31, 2019, respectively(2) DEBT CAPITALIZATION ▪ At December 31, 2020, the Company had debt with a UPB of $231.2 million, a reported carrying value of $237.8 million, an estimated FV of $197.7 million and a WA effective interest rate of 3.8% ▪ Based on carrying values, at December 31, 2020, senior debt to BV was 0.50x, total debt to BV was 0.82x, senior debt to ABV was 0.63x and total debt to ABV was 1.03x MMA Capital Holdings, Inc. 7 (1) Measured on a trailing four quarter basis at each reporting period by dividing total income from renewable energy investments by the average carrying value of renewable energy investments. (2) Measured on a trailing four quarter basis at each reporting period by dividing net income from renewable energy investments less attributed cost of funding by a net average value that incorporates the carrying value of renewable energy investments, the UPB of attributed funding and restricted cash associated with attributed funding (where the UPB of attributed funding partially reduces the other two components in such net value). |
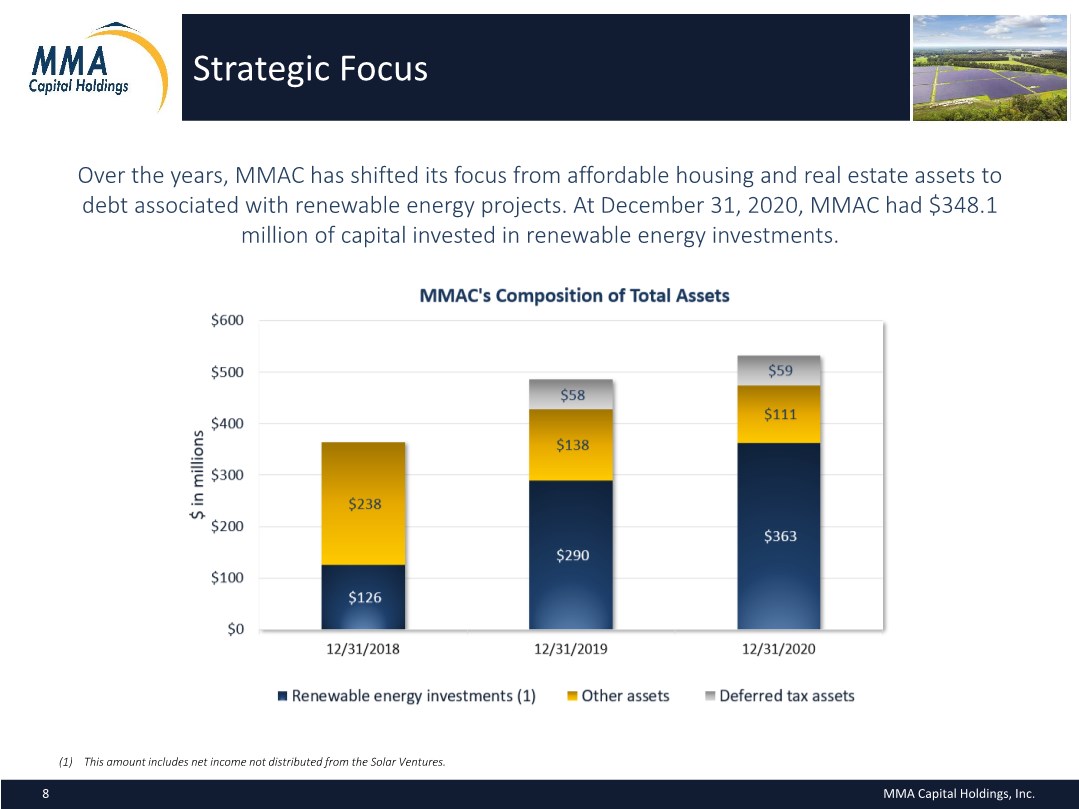
| Strategic Focus Over the years, MMAC has shifted its focus from affordable housing and real estate assets to debt associated with renewable energy projects. At December 31, 2020, MMAC had $348.1 million of capital invested in renewable energy investments. MMA Capital Holdings, Inc. 8 (1) This amount includes net income not distributed from the Solar Ventures. |
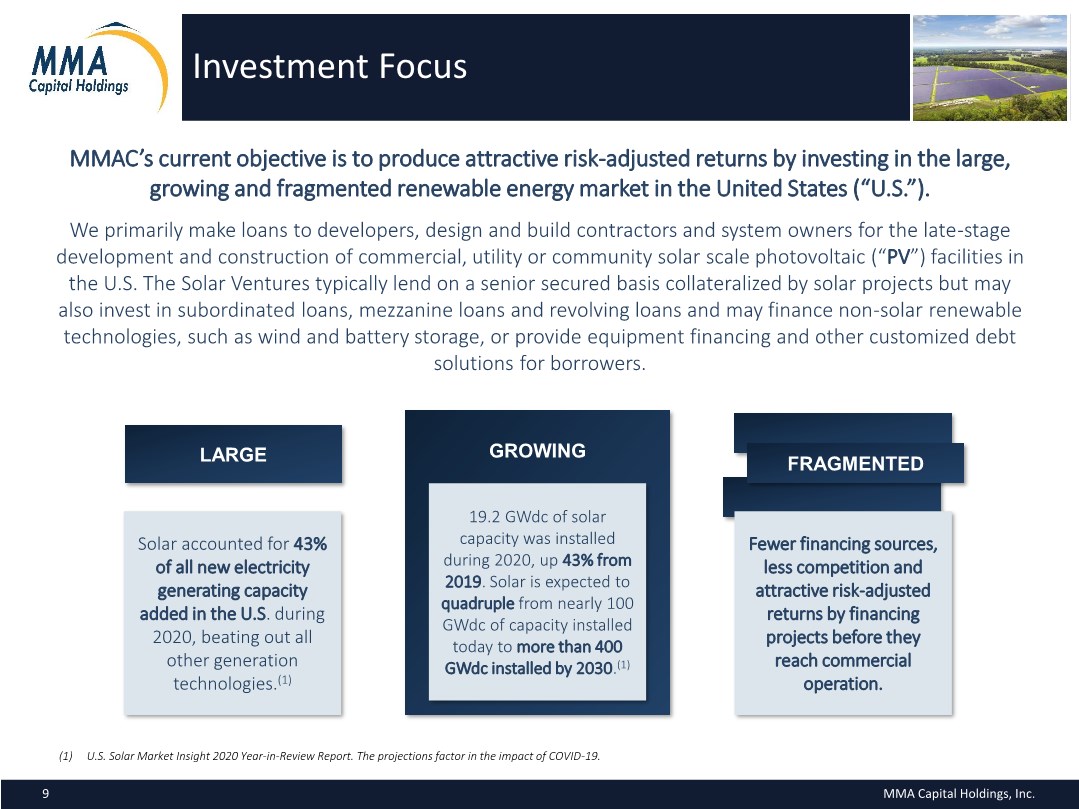
| GROWING MMAC’s current objective is to produce attractive risk-adjusted returns by investing in the large, growing and fragmented renewable energy market in the United States (“U.S.”). We primarily make loans to developers, design and build contractors and system owners for the late-stage development and construction of commercial, utility or community solar scale photovoltaic (“PV”) facilities in the U.S. The Solar Ventures typically lend on a senior secured basis collateralized by solar projects but may also invest in subordinated loans, mezzanine loans and revolving loans and may finance non-solar renewable technologies, such as wind and battery storage, or provide equipment financing and other customized debt solutions for borrowers. Investment Focus (1) U.S. Solar Market Insight 2020 Year-in-Review Report. The projections factor in the impact of COVID-19. 19.2 GWdc of solar capacity was installed during 2020, up 43% from 2019. Solar is expected to quadruple from nearly 100 GWdc of capacity installed today to more than 400 GWdc installed by 2030.(1) Solar accounted for 43% of all new electricity generating capacity added in the U.S. during 2020, beating out all other generation technologies.(1) LARGE Fewer financing sources, less competition and attractive risk-adjusted returns by financing projects before they reach commercial operation. FRAGMENTED MMA Capital Holdings, Inc. 9 |
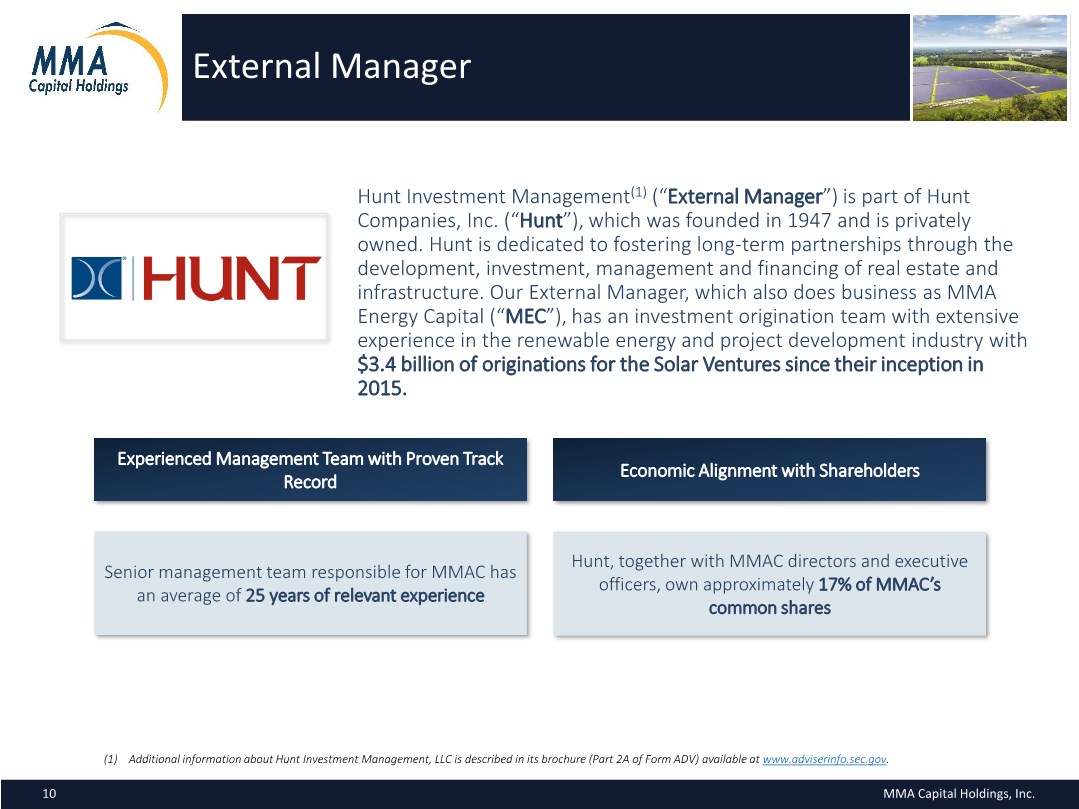
| Hunt Investment Management(1) (“External Manager”) is part of Hunt Companies, Inc. (“Hunt”), which was founded in 1947 and is privately owned. Hunt is dedicated to fostering long-term partnerships through the development, investment, management and financing of real estate and infrastructure. Our External Manager, which also does business as MMA Energy Capital (“MEC”), has an investment origination team with extensive experience in the renewable energy and project development industry with $3.4 billion of originations for the Solar Ventures since their inception in 2015. External Manager Economic Alignment with Shareholders Hunt, together with MMAC directors and executive officers, own approximately 17% of MMAC’s common shares (1) Additional information about Hunt Investment Management, LLC is described in its brochure (Part 2A of Form ADV) available at www.adviserinfo.sec.gov. Senior management team responsible for MMAC has an average of 25 years of relevant experience Experienced Management Team with Proven Track Record MMA Capital Holdings, Inc. 10 |
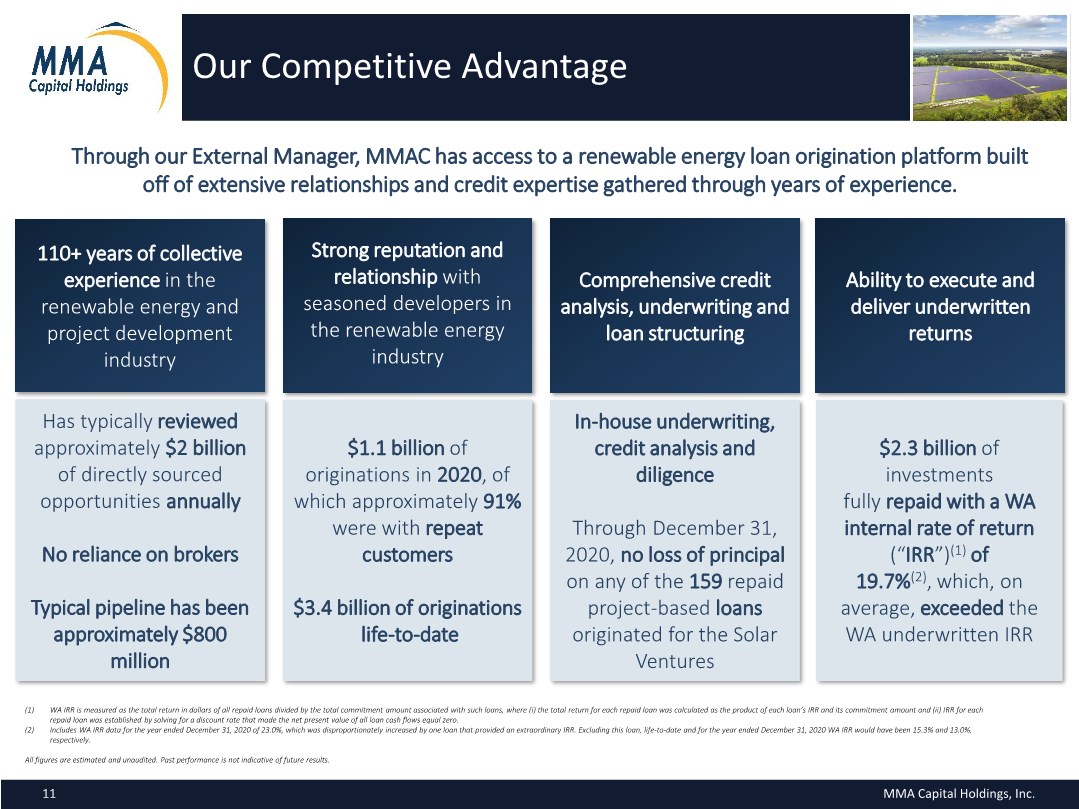
| Our Competitive Advantage Has typically reviewed approximately $2 billion of directly sourced opportunities annually No reliance on brokers Typical pipeline has been approximately $800 million $2.3 billion of investments fully repaid with a WA internal rate of return (“IRR”)(1) of 19.7%(2), which, on average, exceeded the WA underwritten IRR Strong reputation and relationship with seasoned developers in the renewable energy industry Ability to execute and deliver underwritten returns $1.1 billion of originations in 2020, of which approximately 91% were with repeat customers $3.4 billion of originations life-to-date 110+ years of collective experience in the renewable energy and project development industry Comprehensive credit analysis, underwriting and loan structuring In-house underwriting, credit analysis and diligence Through December 31, 2020, no loss of principal on any of the 159 repaid project-based loans originated for the Solar Ventures Through our External Manager, MMAC has access to a renewable energy loan origination platform built off of extensive relationships and credit expertise gathered through years of experience. (1) WA IRR is measured as the total return in dollars of all repaid loans divided by the total commitment amount associated with such loans, where (i) the total return for each repaid loan was calculated as the product of each loan’s IRR and its commitment amount and (ii) IRR for each repaid loan was established by solving for a discount rate that made the net present value of all loan cash flows equal zero. (2) Includes WA IRR data for the year ended December 31, 2020 of 23.0%, which was disproportionately increased by one loan that provided an extraordinary IRR. Excluding this loan, life-to-date and for the year ended December 31, 2020 WA IRR would have been 15.3% and 13.0%, respectively. All figures are estimated and unaudited. Past performance is not indicative of future results. MMA Capital Holdings, Inc. 11 |
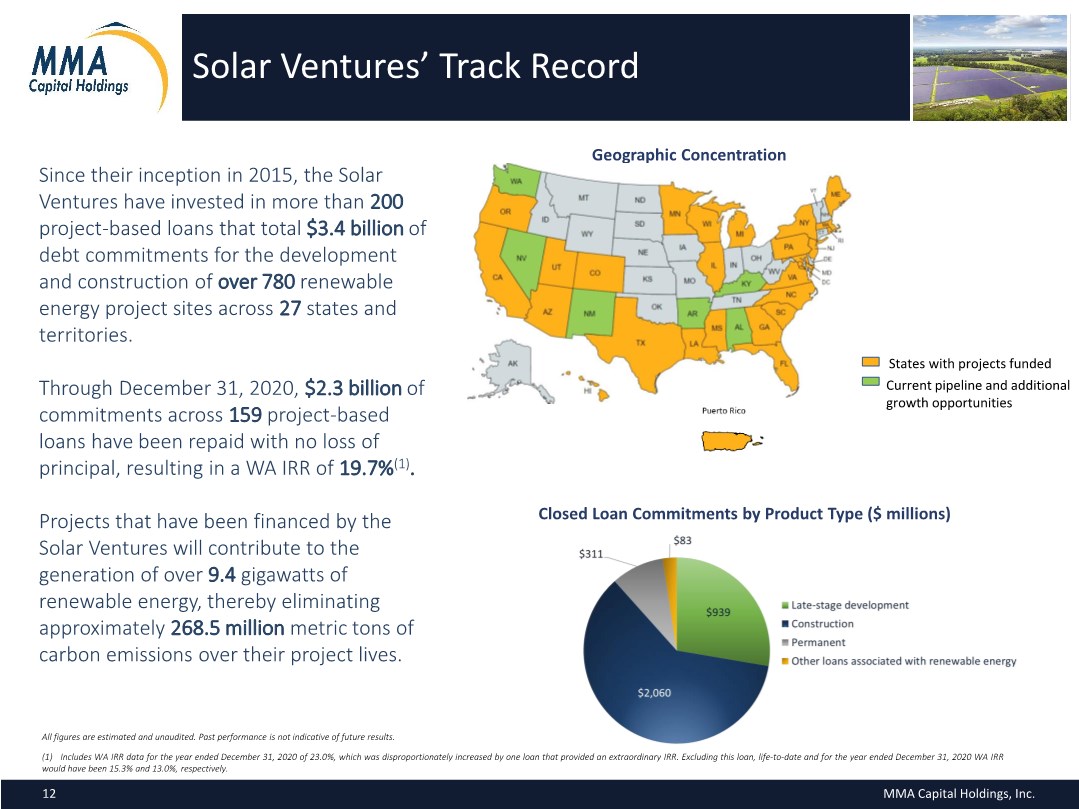
| Solar Ventures’ Track Record Since their inception in 2015, the Solar Ventures have invested in more than 200 project-based loans that total $3.4 billion of debt commitments for the development and construction of over 780 renewable energy project sites across 27 states and territories. Through December 31, 2020, $2.3 billion of commitments across 159 project-based loans have been repaid with no loss of principal, resulting in a WA IRR of 19.7%(1). Projects that have been financed by the Solar Ventures will contribute to the generation of over 9.4 gigawatts of renewable energy, thereby eliminating approximately 268.5 million metric tons of carbon emissions over their project lives. All figures are estimated and unaudited. Past performance is not indicative of future results. (1) Includes WA IRR data for the year ended December 31, 2020 of 23.0%, which was disproportionately increased by one loan that provided an extraordinary IRR. Excluding this loan, life-to-date and for the year ended December 31, 2020 WA IRR would have been 15.3% and 13.0%, respectively. Geographic Concentration Closed Loan Commitments by Product Type ($ millions) States with projects funded Current pipeline and additional growth opportunities MMA Capital Holdings, Inc. 12 |
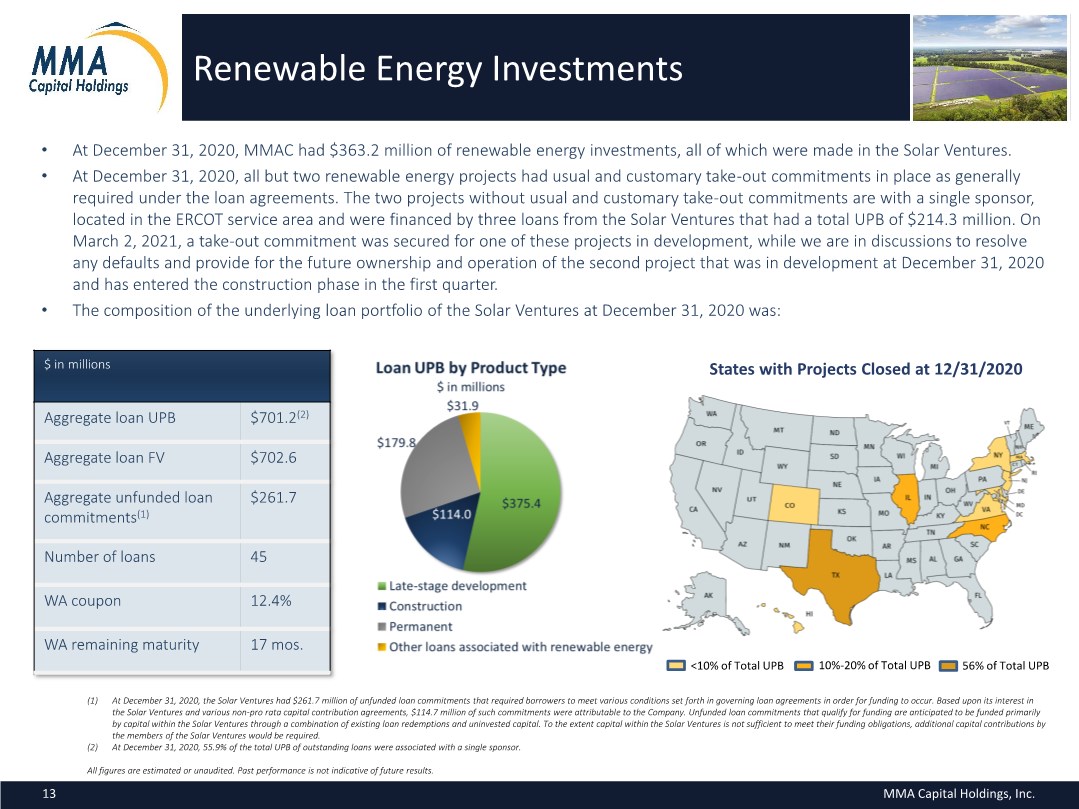
| Renewable Energy Investments • At December 31, 2020, MMAC had $363.2 million of renewable energy investments, all of which were made in the Solar Ventures. • At December 31, 2020, all but two renewable energy projects had usual and customary take-out commitments in place as generally required under the loan agreements. The two projects without usual and customary take-out commitments are with a single sponsor, located in the ERCOT service area and were financed by three loans from the Solar Ventures that had a total UPB of $214.3 million. On March 2, 2021, a take-out commitment was secured for one of these projects in development, while we are in discussions to resolve any defaults and provide for the future ownership and operation of the second project that was in development at December 31, 2020 and has entered the construction phase in the first quarter. • The composition of the underlying loan portfolio of the Solar Ventures at December 31, 2020 was: $ in millions Aggregate loan UPB $701.2(2) Aggregate loan FV $702.6 Aggregate unfunded loan commitments(1) $261.7 Number of loans 45 WA coupon 12.4% WA remaining maturity 17 mos. (1) At December 31, 2020, the Solar Ventures had $261.7 million of unfunded loan commitments that required borrowers to meet various conditions set forth in governing loan agreements in order for funding to occur. Based upon its interest in the Solar Ventures and various non-pro rata capital contribution agreements, $114.7 million of such commitments were attributable to the Company. Unfunded loan commitments that qualify for funding are anticipated to be funded primarily by capital within the Solar Ventures through a combination of existing loan redemptions and uninvested capital. To the extent capital within the Solar Ventures is not sufficient to meet their funding obligations, additional capital contributions by the members of the Solar Ventures would be required. (2) At December 31, 2020, 55.9% of the total UPB of outstanding loans were associated with a single sponsor. All figures are estimated or unaudited. Past performance is not indicative of future results. States with Projects Closed at 12/31/2020 MMA Capital Holdings, Inc. 13 <10% of Total UPB 10%-20% of Total UPB 56% of Total UPB |
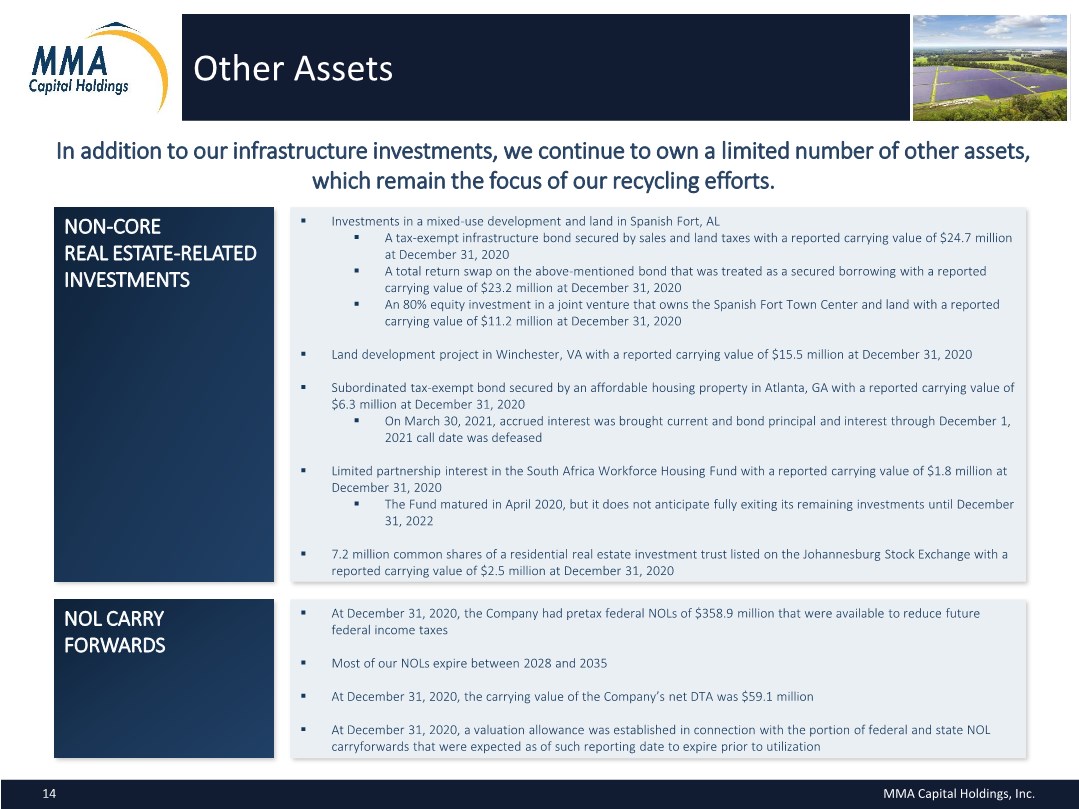
| Other Assets ▪ Investments in a mixed-use development and land in Spanish Fort, AL ▪ A tax-exempt infrastructure bond secured by sales and land taxes with a reported carrying value of $24.7 million at December 31, 2020 ▪ A total return swap on the above-mentioned bond that was treated as a secured borrowing with a reported carrying value of $23.2 million at December 31, 2020 ▪ An 80% equity investment in a joint venture that owns the Spanish Fort Town Center and land with a reported carrying value of $11.2 million at December 31, 2020 ▪ Land development project in Winchester, VA with a reported carrying value of $15.5 million at December 31, 2020 ▪ Subordinated tax-exempt bond secured by an affordable housing property in Atlanta, GA with a reported carrying value of $6.3 million at December 31, 2020 ▪ On March 30, 2021, accrued interest was brought current and bond principal and interest through December 1, 2021 call date was defeased ▪ Limited partnership interest in the South Africa Workforce Housing Fund with a reported carrying value of $1.8 million at December 31, 2020 ▪ The Fund matured in April 2020, but it does not anticipate fully exiting its remaining investments until December 31, 2022 ▪ 7.2 million common shares of a residential real estate investment trust listed on the Johannesburg Stock Exchange with a reported carrying value of $2.5 million at December 31, 2020 NOL CARRY FORWARDS ▪ At December 31, 2020, the Company had pretax federal NOLs of $358.9 million that were available to reduce future federal income taxes ▪ Most of our NOLs expire between 2028 and 2035 ▪ At December 31, 2020, the carrying value of the Company’s net DTA was $59.1 million ▪ At December 31, 2020, a valuation allowance was established in connection with the portion of federal and state NOL carryforwards that were expected as of such reporting date to expire prior to utilization NON-CORE REAL ESTATE-RELATED INVESTMENTS In addition to our infrastructure investments, we continue to own a limited number of other assets, which remain the focus of our recycling efforts. MMA Capital Holdings, Inc. 14 |
| Capitalization ▪ At December 31, 2020, the facility had $120.0 million of total commitments across five participants. The UPB and reported carrying value of the amounts borrowed under this facility was $103.7 million. The facility bears an interest rate of one-month LIBOR (subject to a 1.50% floor, which is currently in effect) + 2.75% on drawn balances until maturity in September 2022. ▪ Obligations are guaranteed by the Company and secured by a pledge of the entities that hold MMAC’s interests in the Solar Ventures. The facility carries financial covenants and collateral performance tests which are customary for facilities of this type. ▪ We have other asset-backed senior debt with aggregate UPBs and reported carrying values of $41.2 million and $40.9 million, respectively, that bear a WA interest rate of 3.9%. $32.8 million of this UPB was incurred in 2020. LIBOR-BASED LONG- TERM SUBORDINATED DEBT ▪ Our subordinated debt, which is senior only to shareholders’ equity and has limited financial covenants, has a UPB of $86.3 million, bears an interest rate of three-month LIBOR plus a 2.0% spread and amortizes 2.0% annually until a balloon payment at maturity in 2035. At December 31, 2020, the reported carrying value was $93.2 million, while the fair value was estimated to be $53.2 million. ▪ The interest rate risk associated with this debt is partially hedged until October 2026 with interest rate swaps, which effectively fix $35 million of LIBOR exposure at 1.61%, and a $35 million 3.0% interest rate cap. RENEWABLE ENERGY REVOLVER OTHER DEBT We utilize on-balance sheet leverage to support our investments and increase total returns to our shareholders. We have worked to expand our access to the capital markets and have entered into debt transactions with capital partners to finance our renewable energy investments. We expect to continuously evaluate ways to optimize the Company’s capitalization, with a focus on prudently deploying debt. MMA Capital Holdings, Inc. 15 |
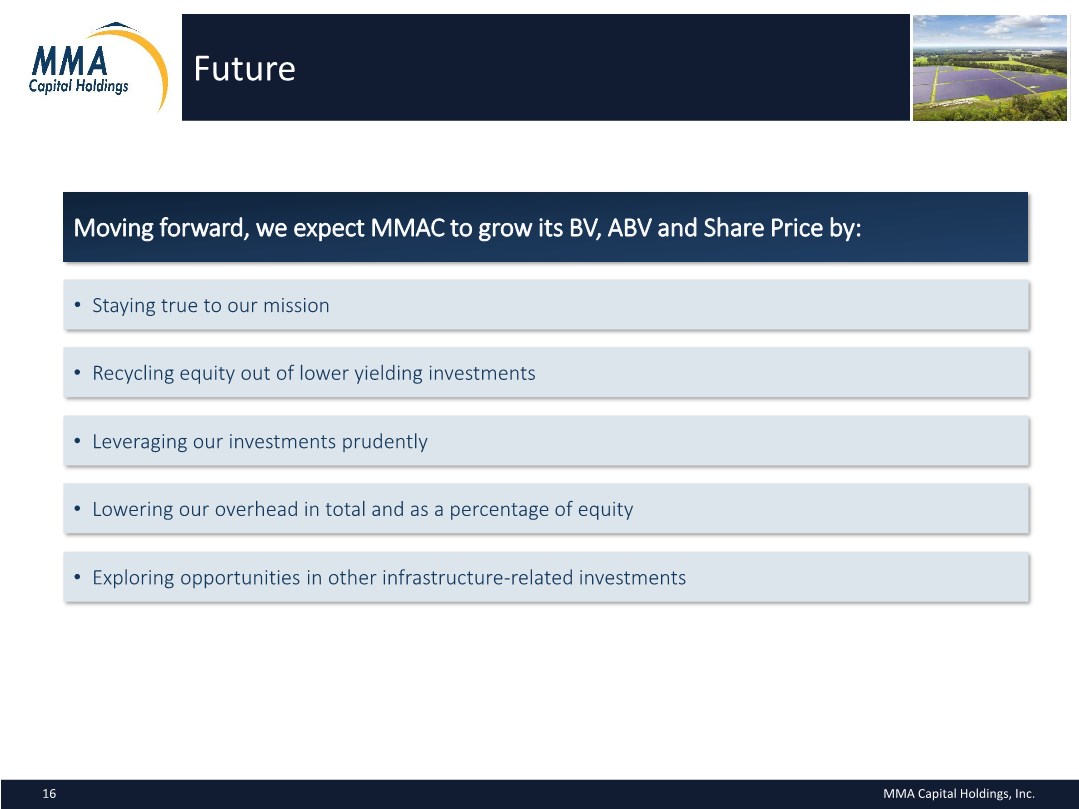
| Future • Staying true to our mission Moving forward, we expect MMAC to grow its BV, ABV and Share Price by: • Recycling equity out of lower yielding investments • Leveraging our investments prudently • Lowering our overhead in total and as a percentage of equity • Exploring opportunities in other infrastructure-related investments MMA Capital Holdings, Inc. 16 |
| Appendix – Select Financial Data The select financial data provided in this Appendix can be found in MMAC’s 2020 Annual Report on Form 10-K for the year ended December 31, 2020, which was filed on March 31, 2021. MMA Capital Holdings, Inc. 17 |
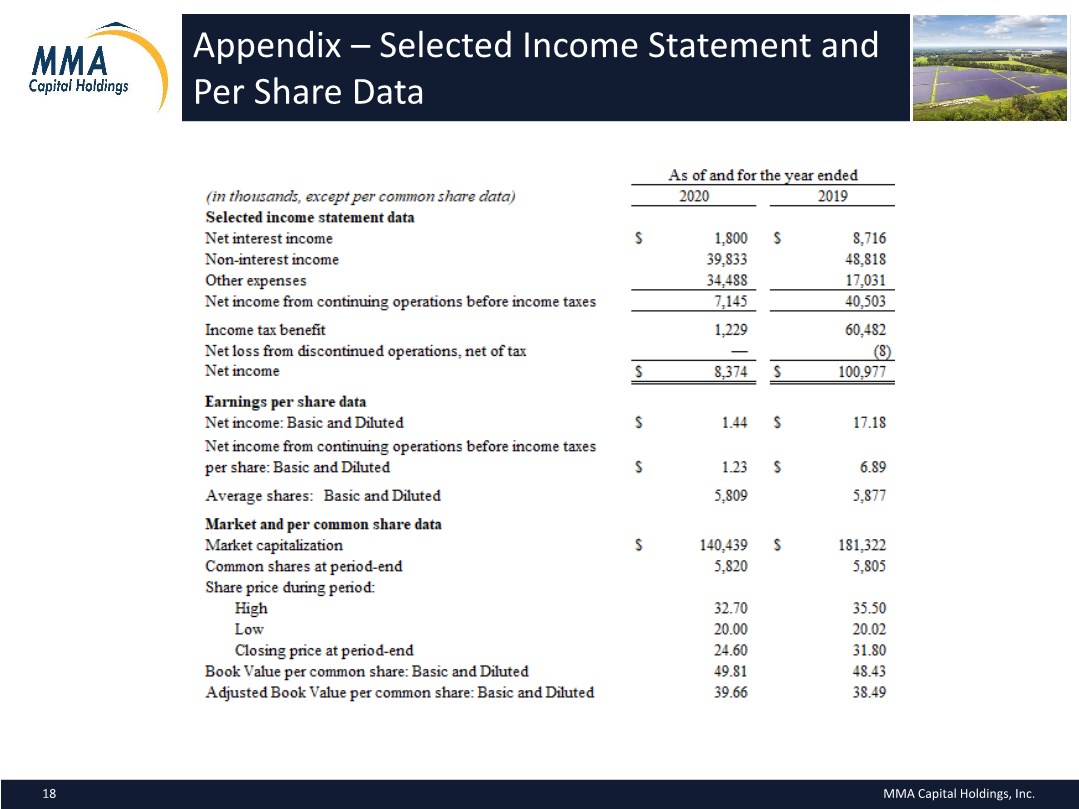
| Appendix Appendix – Selected Income Statement and Per Share Data MMA Capital Holdings, Inc. 18 |
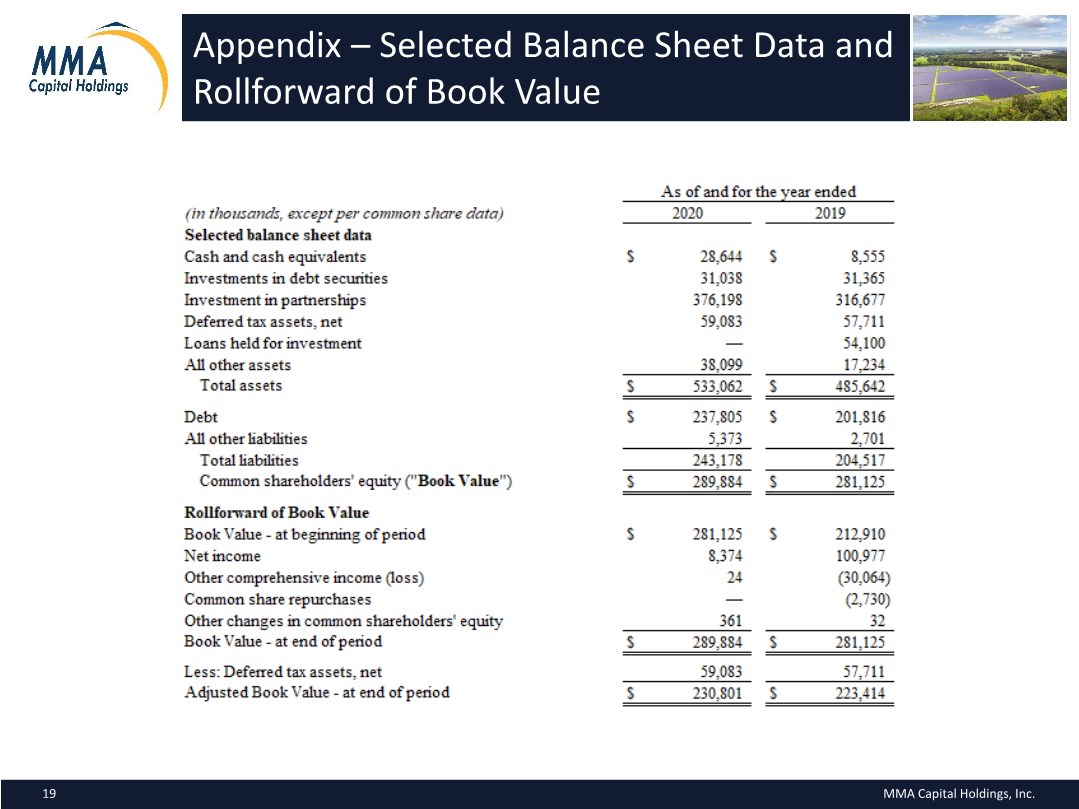
| Appendix Appendix – Selected Balance Sheet Data and Rollforward of Book Value MMA Capital Holdings, Inc. 19 |
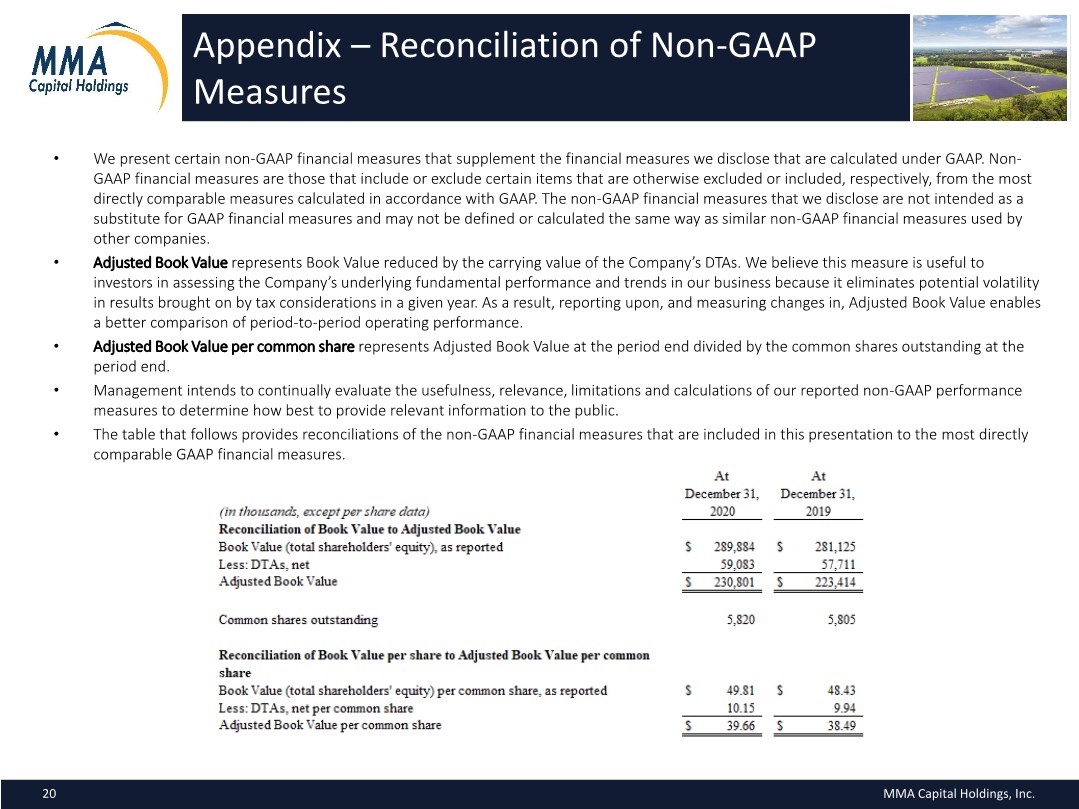
| Appendix Appendix – Reconciliation of Non-GAAP Measures MMA Capital Holdings, Inc. 20 • We present certain non-GAAP financial measures that supplement the financial measures we disclose that are calculated under GAAP. Non- GAAP financial measures are those that include or exclude certain items that are otherwise excluded or included, respectively, from the most directly comparable measures calculated in accordance with GAAP. The non-GAAP financial measures that we disclose are not intended as a substitute for GAAP financial measures and may not be defined or calculated the same way as similar non-GAAP financial measures used by other companies. • Adjusted Book Value represents Book Value reduced by the carrying value of the Company’s DTAs. We believe this measure is useful to investors in assessing the Company’s underlying fundamental performance and trends in our business because it eliminates potential volatility in results brought on by tax considerations in a given year. As a result, reporting upon, and measuring changes in, Adjusted Book Value enables a better comparison of period-to-period operating performance. • Adjusted Book Value per common share represents Adjusted Book Value at the period end divided by the common shares outstanding at the period end. • Management intends to continually evaluate the usefulness, relevance, limitations and calculations of our reported non-GAAP performance measures to determine how best to provide relevant information to the public. • The table that follows provides reconciliations of the non-GAAP financial measures that are included in this presentation to the most directly comparable GAAP financial measures. |
| Nasdaq: MMAC For more information, please visit our website at www.mmacapitalholdings.com Or, contact Investor Relations directly at 443-263-2900 | 855-650-6932 info@mmacapitalholdings.com MMA Capital Holdings, Inc. 21 |