Attached files
| file | filename |
|---|---|
| EX-32.1 - EX-32.1 - TriLinc Global Impact Fund LLC | trilinc-ex321_6.htm |
| EX-31.2 - EX-31.2 - TriLinc Global Impact Fund LLC | trilinc-ex312_8.htm |
| EX-31.1 - EX-31.1 - TriLinc Global Impact Fund LLC | trilinc-ex311_7.htm |
| EX-23.1 - EX-23.1 - TriLinc Global Impact Fund LLC | trilinc-ex231_147.htm |
| EX-21.1 - EX-21.1 - TriLinc Global Impact Fund LLC | trilinc-ex211_148.htm |
UNITED STATES
SECURITIES AND EXCHANGE COMMISSION
Washington, D.C. 20549
FORM 10-K
|
☒ |
ANNUAL REPORT PURSUANT TO SECTION 13 OR 15(d) OF THE SECURITIES EXCHANGE ACT OF 1934 |
For the year ended December 31, 2020
OR
|
☐ |
TRANSITION REPORT PURSUANT TO SECTION 13 OR 15(d) OF THE SECURITIES EXCHANGE ACT OF 1934 |
For the transition period from to
Commission File Number 000-55432
TriLinc Global Impact Fund, LLC
(Exact name of registrant as specified in its charter)
|
Delaware |
36-4732802 |
|
(State or other jurisdiction of incorporation or organization) |
(I.R.S. Employer Identification No.) |
1230 Rosecrans Avenue, Suite 605,
Manhattan Beach, CA 90266
(Address of principal executive offices)
(310) 997-0580
(Registrant’s telephone number, including area code)
(Former name, former address and former fiscal year, if changed since last report)
Securities registered pursuant to Section 12(b) of the Act: None
Securities registered pursuant to Section 12(g) of the Act: Units of Limited Liability Company Interest
Indicate by check mark if the Registrant is a well-known seasoned issuer, as defined in Rule 405 of the Securities Act. YES ☐ NO ☑
Indicate by check mark if the Registrant is not required to file reports pursuant to Section 13 or 15(d) of the Act. YES ☑ NO ☐
Indicate by check mark whether the registrant (1) has filed all reports required to be filed by Section 13 or 15(d) of the Securities Exchange Act of 1934 during the preceding 12 months (or for such shorter period that the registrant was required to file such reports), and (2) has been subject to such filing requirements for the past 90 days. Yes ☑ No ☐
Indicate by check mark whether the registrant has submitted electronically every Interactive Data File required to be submitted pursuant to Rule 405 of Regulation S-T (§ 232.405 of this chapter) during the preceding 12 months (or for such shorter period that the registrant was required to submit such files). Yes ☑ No ☐
Indicate by check mark whether the registrant is a large accelerated filer, an accelerated filer, a non-accelerated filer, a smaller reporting company, or an emerging growth company. See definitions of “large accelerated filer,” “accelerated filer,” “smaller reporting company,” and “emerging growth company” in Rule 12b-2 of the Exchange Act.
|
Large accelerated filer |
☐ |
Accelerated filer |
☐ |
|
Non-accelerated filer |
☑ |
Smaller reporting company |
☑ |
|
|
|
Emerging growth company |
☐ |
If an emerging growth company, indicate by check mark if the registrant has elected not to use the extended transition period for complying with any new or revised financial accounting standards provided pursuant to Section 13(a) of the Exchange Act. ☐
Indicate by check mark whether the registrant has filed a report on and attestation to its management’s assessment of the effectiveness of its internal control over financial reporting under Section 404(b) of the Sarbanes-Oxley Act (15 U.S.C. 7262(b)) by the registered public accounting firm that prepared or issued its audit report. ☐
Indicate by check mark whether the registrant is a shell company (as defined in Rule 12b-2 of the Exchange Act). Yes ☐ No ☑
There is no established trading market for the registrant’s units, and therefore the aggregate market value of the registrant’s units held by non-affiliates cannot be determined.
Securities registered pursuant to Section 12(b) of the Act:
|
Title of each class |
|
Trading Symbol(s) |
|
Name of each exchange on which registered |
|
None |
|
None |
|
None |
As of March 30, 2021, the Company had outstanding 18,086,989 Class A units, 8,006,891 Class C units, 10,509,265 Class I units, 24,555 Class W units, 2,207,715 Class Y units, and 8,423,851 Class Z units.
FOR THE YEAR ENDED DECEMBER 31, 2020
INDEX
|
|
|
|
|
Page |
|
|
|
|||
|
Item 1 |
|
|
5 |
|
|
Item 1A |
|
|
17 |
|
|
Item 1B |
|
|
33 |
|
|
Item 2 |
|
|
33 |
|
|
Item 3 |
|
|
33 |
|
|
Item 4 |
|
|
33 |
|
|
|
|
|||
|
Item 5 |
|
|
34 |
|
|
Item 6 |
|
|
36 |
|
|
Item 7 |
|
Management’s Discussion and Analysis of Financial Condition and Results of Operations |
|
36 |
|
Item 7A |
|
|
46 |
|
|
Item 8 |
|
|
46 |
|
|
Item 9 |
|
Changes in and Disagreements with Accountants on Accounting and Financial Disclosure |
|
46 |
|
Item 9A |
|
|
46 |
|
|
Item 9B |
|
|
47 |
|
|
|
|
|||
|
Item 10 |
|
|
48 |
|
|
Item 11 |
|
|
54 |
|
|
Item 12 |
|
Security Ownership of Certain Beneficial Owners and Management and Related Stockholder Matters |
|
55 |
|
Item 13 |
|
Certain Relationships and Related Transactions, and Director Independence |
|
56 |
|
Item 14 |
|
|
58 |
|
|
|
|
|||
|
Item 15 |
|
|
59 |
|
|
|
|
|
|
|
|
Item 16 |
|
|
60 |
|
2
This Annual Report on Form 10-K contains certain “forward-looking statements” within the meaning of the Private Securities Litigation Reform Act of 1995, Section 27A of the Securities Act of 1933, as amended, or Securities Act, and Section 21E of the Securities Exchange Act of 1934, as amended, or Exchange Act. Forward-looking statements are generally identifiable by use of forward-looking terminology such as “may,” “will,” “should,” “potential,” “intend,” “expect,” “seek,” “anticipate,” “estimate,” “believe,” “could,” “project,” “predict,” “continue,” “future” or other similar words or expressions. Forward-looking statements are not guarantees of performance and are based on certain assumptions, discuss future expectations, describe plans and strategies, contain projections of results of operations or of financial condition or state other forward-looking information. Such statements include, but are not limited to, those relating to our ability to deploy capital quickly and successfully, our ability to pay distributions to our unitholders, our reliance on TriLinc Advisors, LLC, or the Advisor, and TriLinc Global, LLC, or the Sponsor, strategies and investment activities and our ability to effectively deploy capital. Our ability to predict results or the actual effect of plans or strategies is inherently uncertain. Although we believe that the expectations reflected in such forward-looking statements are based on reasonable assumptions, our actual results and performance could differ materially from those set forth in the forward-looking statements and you should not unduly rely on these statements. These forward-looking statements involve risks, uncertainties and other factors that may cause our actual results in future periods to differ materially from those forward-looking statements. These factors include, but are not limited to:
|
|
• |
our future operating results; |
|
|
• |
our ability to purchase or make investments in a timely manner; |
|
|
• |
our business prospects and the prospects of our borrowers; |
|
|
• |
the impact of the COVID-19 pandemic and actions taken to prevent its spread on our business, results of operations, financial condition, liquidity and net asset value per unit; |
|
|
• |
the economic, social and/or environmental impact of the investments that we expect to make; |
|
|
• |
our contractual arrangements and relationships with third parties; |
|
|
• |
our ability to make distributions to our unitholders; |
|
|
• |
the dependence of our future success on the general economy and its impact on the companies in which we invest; |
|
|
• |
the availability of cash flow from operating activities for distributions and payment of operating expenses; |
|
|
• |
the performance of our Advisor, our sub-advisors and our Sponsor; |
|
|
• |
our dependence on our Advisor and our dependence on and the availability of the financial resources of our Sponsor; |
|
|
• |
the ability of our borrowers to make required payments; |
|
|
• |
our Advisor’s ability to attract and retain sufficient personnel to support our growth and operations; |
|
|
• |
the lack of a public trading market for our units; |
|
|
• |
the outcome and costs associated with our ongoing legal proceedings related to the recovery of amounts with respect to certain of our Watch List investments; |
|
|
• |
our ability to borrow funds; |
|
|
• |
our expected financings and investments; |
|
|
• |
the adequacy of our cash resources and working capital; |
|
|
• |
performance of our investments relative to our expectations and the impact on our actual return on invested equity, as well as the cash provided by these investments; |
|
|
• |
any failure in our Advisor’s or sub-advisors’ due diligence to identify all relevant facts in our underwriting process or otherwise; |
|
|
• |
the ability of our sub-advisors and borrowers to achieve their objectives; |
|
|
• |
the effectiveness of our portfolio management techniques and strategies; |
|
|
• |
failure to maintain effective internal controls; and |
|
|
• |
the loss of our exemption from the definition of an “investment company” under the Investment Company Act of 1940, as amended. |
3
The foregoing list of factors is not exhaustive. All forward-looking statements included in this Annual Report on Form 10-K are based on information available to us on the date hereof and we are under no duty to update any of the forward-looking statements after the date of this report to conform these statements to actual results.
Factors that could have a material adverse effect on our operations and future prospects are set forth in our filings with the United States Securities and Exchange Commission, or the SEC, including the “Risk Factors” in this Annual Report on Form 10-K beginning on page 18. The risk factors set forth in our filings with the SEC could cause our actual results to differ significantly from those contained in any forward-looking statement contained in this report.
Summary Risk Factors
An investment in units of our common stock involves significant risks. See “Risk Factors” beginning on page 17. These risks include, among others:
|
|
• |
We may not achieve investment results that will allow us to make distributions at a specified level of cash distributions or at all and we may reduce the amount of per unit distributions from time to time. |
|
|
• |
We operate in a highly competitive market for investment opportunities. |
|
|
• |
We may pay distributions from any source, including offering proceeds and, subject to certain limitations, borrowings, and we may choose to pay distributions from such other sources when we do not have sufficient cash flow from operations to fund such distributions. We have not established a limit on the amount of proceeds we may use to fund distributions. From time to time during our operational stage, we may not generate sufficient cash flow from operations to fund distributions. If we fund distributions from borrowings or other sources in excess of cash flow from operations, we will have less funds available for the investments, and our unitholders’ overall return may be reduced. |
|
|
• |
Our success will be dependent on the performance of our Advisor, including, without limitation, our Advisor's ability to successfully select and oversee sub-advisors. |
|
|
• |
We are dependent upon our key management personnel and the key management personnel of our Advisor and affiliates, who will face conflicts of interest relating to time management, and on the continued operations of our Advisor, for our future success. |
|
|
• |
We have made and intend to continue to make non-U.S. investments which involve certain legal, geopolitical, investment, repatriation, and transparency risks not typically associated with U.S. investments. |
|
|
• |
We have paid substantial compensation to our Advisor and its affiliates. The compensation we pay to the Advisor and its affiliates may be increased by our independent managers. This compensation was not determined on an arm’s-length basis and therefore may not be on the same terms we could achieve from a third party. |
|
|
• |
Our units will not be listed on an exchange for the foreseeable future, if ever. Therefore, it will be difficult for our unitholders to sell their units and, if they are able to sell their units, it likely will be at a substantial discount. |
|
|
• |
Our unitholders will not have the opportunity to evaluate our investments before we make them, which makes investment in our units more speculative. |
|
|
• |
Our success will be dependent on the performance of our sub-advisors and our sub-advisors’ failure to identify and make investments that meet our investment criteria or perform their responsibilities under the sub-advisory agreements may adversely affect our ability to realize our investment objectives. |
|
|
• |
Small and medium-sized businesses may have limited financial resources and may not be able to repay the loans we make to them. |
|
|
• |
Lack of minimum requirements when lending to small and medium-sized businesses could increase the risk of default. |
|
|
• |
Our unitholders will experience substantial dilution in the net tangible book value of their units equal to the offering costs associated with their units. |
4
TriLinc Global Impact Fund, LLC is a Delaware limited liability company formed on April 30, 2012. Unless otherwise noted, the terms “we,” “us,” “our,” “the Company”, “Trilinc,” and “our Company” refer to TriLinc Global Impact Fund, LLC; the term our “Advisor” and “TriLinc Advisors” refers to TriLinc Advisors, LLC, our external advisor; the term “SC Distributors” and our “dealer manager” refers to SC Distributors, LLC, our dealer manager; and the term our “Sponsor” refers to TriLinc Global, LLC, our sponsor.
Overview
The Company makes impact investments in Small and Medium Enterprises, or SMEs, which we define as those businesses having less than 500 employees, primarily in developing economies that provide the opportunity to achieve both competitive financial returns and positive measurable impact. To a lesser extent, we may also make impact investments in companies that may not meet our technical definition of SMEs due to a larger number of employees but that also provide the opportunity to achieve both competitive financial returns and positive measurable impact. We generally expect that such investments will have similar investment characteristics as SMEs as defined by us. We were organized as a Delaware limited liability company on April 30, 2012. We believe that we operate and intend to operate our business in a manner that permits us to maintain our exemption from registration under the Investment Company Act of 1940. We invest in SMEs through local market sub-advisors and our objective is to build a diversified portfolio of financial assets, including direct loans, loan participations, convertible debt instruments, trade finance, structured credit and preferred and common equity investments. We anticipate that a substantial portion of our assets will continue to consist of collateralized private debt instruments, which we believe offer opportunities for competitive risk-adjusted returns through income generation. We are externally managed and advised by TriLinc Advisors.
To assist the Company in achieving its investment objective, the Company makes investments via wholly owned subsidiaries. As of December 31, 2020, the Company has 14 subsidiaries, all of which are Cayman Islands exempted companies. To assist the Advisor in managing the Company and its subsidiaries, the Advisor may provide services via TriLinc Advisors International, Ltd. (“TAI”), a Cayman Islands exempted company that is wholly owned by TriLinc Advisors, LLC.
Our business strategy is to generate competitive financial returns and positive economic, social and/or environmental impact by providing financing to SMEs, primarily in developing economies, defined as countries with national income classified by the World Bank as upper-middle income and below. Our style of investment is referred to as impact investing, which J.P. Morgan Global Research and Rockefeller Foundation in a 2010 report called “an emerging alternative asset class” and defined as investing with the intent to create positive impact beyond financial return. We believe it is possible to generate competitive financial returns while creating positive, measurable impact. Through our investments in SMEs, we intend to enable job creation and stimulate economic growth.
Our investment objectives are to provide our unitholders current income, capital preservation and modest capital appreciation. These objectives are achieved primarily through SME trade finance and term loan financing, while employing rigorous risk mitigation and due diligence practices, and transparently measuring and reporting the economic, social and environmental impacts of our investments. The majority of our investments are senior secured trade finance, senior secured loans, and other collateralized loans or loan participations to SMEs with established, profitable businesses in developing economies. With our sub-advisors, we expect to provide growth capital financing generally ranging in size from $5-20 million per transaction for direct SME loans and $500,000 to $15 million for trade finance transactions. We seek to protect and grow investor capital by: (1) targeting countries with favorable economic growth and investor protections; (2) partnering with sub-advisors with significant experience in local markets; (3) focusing on creditworthy lending targets which have at least 3-year operating histories and demonstrated cash flows enabling loan repayment; (4) making primarily debt investments, backed by collateral and borrower guarantees; (5) employing best practices in our due diligence and risk mitigation processes; and (6) monitoring our portfolio on an ongoing basis.
Our goal is to create a diversified portfolio of primarily private debt instruments, including trade finance and term loans, whose counterparties are small and medium-size businesses in developing economies. Private debt facilities generate current income and in some cases offer the potential for modest capital appreciation, while maintaining a higher place in a company’s capital structure than the equity held by the owners and other investors. As small and growing businesses, our borrowers have used and we expect them to continue to use capital to expand operations, improve the financial standing of their operations, or finance the trade of their goods. According to the most recent IFC SME Banking Guide, SMEs have been shown to improve job creation and GDP growth throughout the world, and we expect the portfolio of our investments to have a positive, measurable impact in their communities, in addition to offering a competitive financial return to the investor.
On February 25, 2013, our registration statement on Form S-1 was declared effective by the SEC. Pursuant to the registration statement, we commenced our initial public offering of up to $1.5 billion in units of our limited liability company interest, consisting of up to $1.25 billion of units in our primary offering, consisting of Class A units and Class C units at the initial offering prices of $10.00 per unit and $9.576 per unit, respectively, and Class I units at $9.025 per unit, which we refer to as the primary offering, and up to $250 million of units pursuant to our distribution reinvestment plan, which we refer to as the Distribution Reinvestment Plan,
5
and which we collectively refer to as the Offering. In May 2012, the Advisor purchased 22,161 Class A units for aggregate gross proceeds of $200,000. In June 2013, we satisfied our minimum offering requirement of $2,000,000 when the Sponsor purchased 321,330 Class A units for aggregate gross proceeds of $2,900,000 and we commenced operations. The Offering terminated on March 31, 2017. Through the termination of the Offering, we raised approximately $361,776,000 in gross proceeds, including approximately $13,338,000 raised through the Distribution Reinvestment Plan.
Upon termination of the Offering, we registered $75 million in Class A, Class C and Class I units to continue to be offered pursuant to our Distribution Reinvestment Plan to the investors who have purchased units in the Offering. On March 7, 2018, our board of managers approved an amendment to our distribution reinvestment plan, pursuant to which, commencing with distributions declared for the month of March 2018, units issued pursuant to the Distribution Reinvestment Plan are being offered at the price equal to the net asset value per unit of each class of units, as most recently disclosed by the Company in a public filing with the SEC at the time of reinvestment. Prior to March 30, 2018, units were issued pursuant to the Distribution Reinvestment Plan at a price equal to the greater of $9.025 per unit or the net asset value per unit of each class, as most recently disclosed by the Company in a public filing with the SEC.
For the period from April 1, 2017 to December 31, 2017, we issued 971,564 of our units pursuant to the Distribution Reinvestment Plan for gross proceeds of approximately $8,762,000. In addition, for the period from April 1, 2017 to December 31, 2017, we issued 1,654,871 of our units for gross proceeds of approximately $14,204,000 pursuant to a private placement to accredited investors.
For the years ended December 31, 2019 and 2018, we issued 1,161,349 and 1,175,826, respectively, of our units pursuant to our Distribution Reinvestment Plan for gross proceeds of approximately $9,508,000 and $10,028,000, respectively. In addition, for the years ended December 31, 2019 and 2018, we issued 2,591,049 and 6,240,356, respectively, of our units for gross proceeds of approximately $21,084,000 and $53,117,000, respectively, pursuant to a private placement.
For the year ended December 31, 2020, we issued 1,181,117 of our units pursuant to our Distribution Reinvestment Plan for gross proceeds of approximately $9,274,000. In addition, for the year ended December 31, 2020, we issued 667,151 of our units for gross proceeds of approximately $5,276,000 pursuant to our ongoing private placement described above. As of December 31, 2020, $37,429,000 in units remained available for sale pursuant to the Distribution Reinvestment Plan.
As of December 31, 2020, we have issued an aggregate of 52,774,702 of our units, including 5,967,587 units issued under our Distribution Reinvestment Plan, for gross proceeds of approximately $493,031,000 including approximately $50,909,000 reinvested under our Distribution Reinvestment Plan (before dealer manager fees of approximately $4,801,000 and selling commissions of $16,862,000), for net proceeds of $471,368,000.
TriLinc Advisors manages our investments. TriLinc Advisors is a private investment advisory firm focusing on impact investments in SMEs around the world. TriLinc Advisors is a registered as an investment adviser with the SEC. Led by its Chairman and Chief Executive Officer, Gloria Nelund, its President, Brent VanNorman, its Chief Financial Officer, Mark Tipton, its Chief Operating Officer and Chief Compliance Officer, Scott Hall, and its Chief Investment Officer, Paul Sanford, TriLinc Advisors’ management team has a long track record and broad experience in the management of regulated, multi-billion dollar fund complexes and global macro portfolio management. TriLinc Advisors and our sub-advisors have an extensive network of relationships with emerging market private equity and debt managers, bilateral and multilateral Development Financial Institutions, or DFIs, and international consultancies and service providers that we believe benefit our portfolio of investments. We benefit from both the top-down, global macro investing approach of TriLinc Advisors and the bottom-up deal sourcing and structuring of our sub-advisors. TriLinc Advisors was a joint venture between our Sponsor and Strategic Capital until our Sponsor acquired Strategic Capital’s interest in the joint venture in July 2019. The purpose of the joint venture was to permit our Advisor to capitalize upon the expertise of our Sponsor’s management team as well as the experience of the executives of Strategic Capital in providing advisory services in connection with the formation, organization, registration and operation of entities similar to us. Pursuant to the joint venture agreement and its ownership in TriLinc Advisors, until July 2019, Strategic Capital was entitled to receive distributions equal to 15% of the gross cash proceeds received by TriLinc Advisors from the management and incentive fees payable by us to TriLinc Advisors under the Amended and Restated Advisory Agreement, dated as of February 25, 2014, by and between the Company and the Advisor, as renewed through February 25, 2022 (the “Advisory Agreement”). See “Investment Advisory Agreements and Fees” section below.
We seek to capitalize on the significant investment experience of our Advisor’s management team, which has over 130 years of collective experience in financial services and investment. Our CEO, Gloria Nelund, founded our Sponsor in 2008 after a thirty year career in the international asset management industry.
As of the date of this report, we have engagements, through our Advisor, with eleven third-party investment managers in a sub-advisory capacity to source, evaluate, and monitor investments. Our local market sub-advisors have significant experience and established networks in our targeted asset classes, regions and countries, and adhere to the investment parameters as directed by the Advisor’s investment team and our board of managers. Primary sub-advisors, who will source the majority of our investments, must have a minimum five year investment track record and have invested at least $250 million in their target region. Secondary sub-
6
advisors, who focus on a specific region or asset class, must have a minimum three year investment track record and have invested at least $100 million in their target region. All sub-advisors must have continuity in their investment team, including senior management, and an investment strategy that can responsibly deploy appropriate levels of capital. Sub-advisors must have strong, independent risk controls and must screen for and track impact and the Environmental, Social and Governance (ESG) practices of the borrowers.
TriLinc Advisors has contracted the following third-party investment managers to act as sub-advisors:
|
|
• |
Asia Impact Capital Ltd. (“AIC”): an investment firm advised by the founding principals of TAEL Partners Ltd. (“TAEL”) and established to provide investment services to TriLinc. TAEL is a leading Southeast Asian investment firm founded in 2007 by seasoned industry veterans with long-term track records and diverse investment capabilities across Southeast Asia. TAEL’s investment professionals have deep roots in Southeast Asia and extensive experience working for leading financial institutions on both international and local levels. TAEL’s principals have over 120 years of collective Asian market investment experience. The company has a hands-on approach and can adapt and tailor its investment structures to the nuances of the Southeast Asian markets while partnering with established, growing businesses. Leveraging its wide and established network of business relationships in the region, TAEL is often able to undertake investments at attractive pricing levels. TAEL’s founding principals have over $22 billion in credit transaction experience. AIC serves as a primary sub-advisor. |
|
|
• |
Barak Fund Management Ltd. (“Barak”): an Africa-based asset management company founded in 2008 that manages private debt funds focused on providing trade finance and term loans to small and middle market companies in Africa. Barak specializes in sourcing and originating mainly commodity and agricultural-related transactions with strong collateral characteristics. With affiliate offices in Côte d’Ivoire, Ghana, Kenya, Mauritius, South Africa and the United Kingdom, the Barak team is positioned to source and take advantage of the numerous opportunities that arise in some of the world’s fastest growing economies. Barak has completed over $4.6 billion in transactions since its inception. Barak’s two founding principals have more than 40 years of combined experience in trading, international banking and private debt investment in Africa. Both founding principals possess specialist expertise and proven track records in the agricultural and commodities sectors. Barak serves as a secondary sub-advisor. |
|
|
• |
Helios Investment Partners, LLP (“Helios”): an Africa-focused private investment firm that was established in 2004 and is based in London, Paris, Nigeria, and Kenya. Helios has invested in companies that operate in more than 35 countries across the African continent. Differentiated by a combination of investment skills, local and international networks, and a thorough understanding of the African environment, Helios is well-positioned to generate strong risk-adjusted returns for TriLinc’s term loan strategy in Sub-Saharan Africa. The Helios senior credit team members collectively have more than 65 years of investment experience and have completed over $938 million in debt transactions across Africa. These investment professionals lead the Helios credit team’s disciplined loan structuring and diligent risk management processes to create attractive investment and impact opportunities for TriLinc’s term loan strategy throughout Sub-Saharan Africa. Helios serves as a secondary sub-advisor. |
|
|
• |
TRG Management LP (“TRG,” d/b/a The Rohatyn Group): founded in 2002, TRG is a leading emerging markets asset management firm. The firm and its affiliates manage product offerings across private equity, private credit, hedge funds, fixed income, infrastructure and real estate. TRG is headquartered in New York, with offices around the globe including Brazil, Peru, Uruguay, Argentina, India, Singapore, London, Costa Rica, New Zealand, and Vietnam. TRG’s Global Private Credit Strategy encompasses three main regions: Latin America, Asia and Emerging Europe. TRG’s principals have collectively over 190 years of investment experience in institutional lending, debt structuring, sales and trading, and high-yield distressed debt and have deployed more than $1.3 billion into relevant transactions. TRG’s disciplined investment process, robust investment administration and operations infrastructure, and strong emerging market investment track record create substantial value for its investors and SMEs that are currently underserved by traditional banks and financial intermediaries operating in the region. TRG serves as a secondary sub-advisor. |
|
|
• |
Alsis Funds, S.C. (“Alsis”): a Latin America-focused asset management firm with offices in Mexico City and Miami that has deployed over $436 million since its inception in 2007. Alsis is managed by a team with significant experience, market knowledge, and extensive in-country networks. While Alsis’ investment activity is primarily in Mexico, the firm has proven to be a critical provider of capital to the growing SME segment and real estate industry across the region, with an attractive track record of deployed capital and realized returns in key growth industries. Alsis executes its SME strategy through a direct private lending approach that focuses on transactions that can be collateralized by purchase contracts with strong off-takers and also targets companies seeking financing backed by financial assets or real estate assets. Alsis’ principals possess over 75 years of combined experience in transaction sourcing, underwriting, credit analysis, and asset management. Alsis serves as a secondary sub-advisor. |
|
|
• |
Scipion Capital, Ltd. (“Scipion”): a Sub-Saharan Africa-focused investment management firm that has deployed over $512 million in trade finance transactions since its inception in 2007. Headquartered in London, with an office in Geneva and investment team member presence in Botswana, Morocco and the Cayman Islands, the firm focuses its investment strategy on managing a diversified portfolio of trade finance assets across multiple industries, geographies, and financing structures. More specifically, Scipion’s emphasis on short duration and self-liquidating transactions is a cornerstone of its investment strategy |
7
|
|
and has translated into an attractive track record of risk-adjusted returns and a reputation as one of the leading trade finance managers in the region. Scipion’s principals execute the firm’s strategy through over 150 years of combined experience in banking, emerging markets, and trade finance in Africa. Scipion serves as a secondary sub-advisor. |
|
|
• |
TransAsia Private Capital Ltd. (“TransAsia”): a Hong Kong-based asset management firm focusing on extending short- and long-term trade financing to mid-sized private companies in South and Southeast Asia. Since its inception in 2013, TransAsia has deployed approximately $6.8 billion. TransAsia’s three principals are well-versed in Asian debt asset management with almost 100 years of combined experience in banking, private equity, and private debt. All three have robust experience in Asian markets developed at leading institutions such as Income Partners Asset Management, MeesPierson/Fortis Bank, HypoVereinsbank, Lloyds and Chase Bank. Trans Asia serves as a secondary sub-advisor. |
|
|
• |
Africa Merchant Capital Group (“AMC”): a U.K.-based boutique merchant banking services business founded in 2012 that established AMC Trade Finance (“AMCTF”) in 2016 in order to implement its middle market trade finance strategy in Sub-Saharan Africa. The global regulatory environment has reduced commercial banks’ appetite to deploy funds into the African trade finance market, and non-banking sectors have insufficient capital resources, leaving the SME sector underfunded. AMCTF aims to increase the availability of trade finance for domestic and regional trade in Sub-Saharan Africa through offering a range of flexible short-term trade finance product solutions. The AMCTF product range includes off-balance sheet stand-alone transactional facilities, back-to-back Letter of Credit facilities, trade-receivable discounting, supplier cash payments and documentary collections. AMCTF’s principals have nearly 80 years of combined experience in banking, corporate finance, trade finance, and emerging markets and have completed over $1.6 billion in trade finance transactions. TriLinc’s partnership with AMCTF will provide short-term trade finance to borrowers trading into or out of select countries in Sub-Saharan Africa, responding to the demand of target borrower companies in the region, and helping them achieve sustainable growth through more flexible financing options. AMC serves as a secondary sub-advisor. |
|
|
• |
CEECAT Capital Limited & CCL Investments SARL (“CCL”): established in 2014, CCL is a European-focused spin-off of ADM Capital, which has specialized in recovery, special situations and stressed opportunities across Asia since 1998 and in the Central and Eastern Europe, Central Asia and Turkey (“CEECAT”) region since 2005. CCL manages all of ADM (“Asia Debt Management”) Capital’s legacy assets in the CEECAT region and focuses on extending private credit to SMEs who cannot access regular bank financing due to factors such as local regulatory restrictions on bank lending, illiquidity or stress in the banking sector, delays in the bank approval process, collateral coverage mismatch for local banks, among others. CCL’s principals have over 75 years of combined experience in corporate and structured finance, cash equity sales and equity derivative sales, and have completed over $350 million in debt investment deals across the CEECAT region. CCL has a demonstrated track record in establishing, operating, managing and advising funds that invest in companies across the region through utilizing their strong cultural knowledge of the local legal jurisdictions and regulatory compliance requirements. CCL serves as a secondary sub-advisor. |
|
|
• |
Origin Capital Limited (“Origin”): headquartered in Johannesburg, South Africa with associates in six countries. Origin originates, structures, and manages transactions in Latin America and Africa, and partners with larger funds, development banks and institutional investors. Origin is differentiated by a combination of investment skills, local and international networks, and a thorough understanding of the Latin American and African environments. Origin's principals have more than 75 years of combined experience in private debt, banking, and asset management in emerging markets and more than $3 billion in relevant transaction experience. |
|
|
• |
Enhanced Capital Impact Lending, LLC (“Enhanced Capital”): a subsidiary of Enhanced Capital Group, LLC (“ECG”) and is TriLinc’s investment partner. Founded in 1999, ECG is a U.S. based impact investment firm that invests capital into local businesses, renewable energy projects, historic real estate rehabilitation, and affordable housing projects through federal and state incentive programs and other public policy investment strategies. ECG has invested in 36 states across the U.S., supporting small businesses through their impact lending strategy and other small business lending strategies. Enhanced Capital’s principals have a combined experience of over 45 years in credit analysis and asset management and have deployed more than $408 million into relevant debt transactions. |
Investment Strategy
The Company seeks to generate competitive financial returns and positive economic, social and environmental impact by providing financing to SMEs. Our investment objectives are to provide our unitholders current income, capital preservation, and modest capital appreciation. We intend to meet our investment objectives through:
|
|
• |
Investing primarily in SME trade finance and term loans |
|
|
• |
A rigorous multi-level risk mitigation strategy at the portfolio level through “extreme” diversification, the sub-advisor level through rigorous due diligence and oversight, and the investment level through local market knowledge and credit expertise of our sub-advisors |
8
|
|
• |
Equity warrants and discounted trade receivables |
The majority of our investments have been and will continue to be senior secured trade finance, senior secured loans and other collateralized loans or loan participations to SMEs with established, profitable businesses in developing economies. With our sub-advisors, we provide growth capital financing generally ranging in size from $5-20 million per transaction for direct SME loans and $500,000 to $15 million for trade finance transactions. We seek to protect and grow investor capital by: (1) targeting countries with favorable economic growth and investor protections; (2) partnering with sub-advisors with significant experience in local markets; (3) focusing on creditworthy lending targets who have at least 3-year operating histories and demonstrated cash flows enabling loan repayment; (4) making primarily debt investments, backed by collateral and borrower guarantees; (5) employing sound due diligence and risk mitigation processes; and (6) monitoring our portfolio on an ongoing basis.
Investments have been and will continue to be primarily credit facilities to developing economy SMEs, including trade finance and SME term loans, through TriLinc Advisors’ team of professional sub-advisors with a local presence in the markets where they invest. We typically provide financing that is collateralized, has a short to medium-term maturity and is self-liquidating through the repayment of principal. By providing additional liquidity to growing small businesses, we believe we will support both economic growth and the expansion of the global middle class.
Investment Portfolio
The Company invests in various industries. The Company separately evaluates the performance of each of its investment relationships. However, because each of these investment relationships has similar business and economic characteristics, they have been aggregated into a single investment segment.
During the year ended December 31, 2020, we invested, either through direct loans or loan participations, approximately $25.5 million across five portfolio companies. Our investments consisted of senior secured trade finance participations, senior secured term loan participations, senior secured term loans and short term investments. Additionally, we received proceeds from repayments of investment principal of approximately $82.5 million.
At December 31, 2020, our portfolio included 41 companies and was comprised of $106,899,154 or 37.2% in senior secured term loans, $129,917,253 or 45.2% in senior secured term loan participations, $45,800,210 or 15.9% in senior secured trade finance participations, and $3,758,063 or 1.3% in other investments. At December 31, 2019, our portfolio included 43 companies and was comprised of $83,353,208 or 24.5% in senior secured term loans, $180,500,425 or 53.1% in senior secured term loan participations, $71,606,458 or 21.0% in senior secured trade finance participations, and $3,758,063 or 1.1% in short term investments.
9
As of December 31, 2020, we had the following investments, listed by description of the underlying borrower (if applicable):
|
Description |
|
Sector |
|
Industry Classification |
|
Country |
|
Interest |
|
|
Maturity (1) |
|
Principal Amount |
|
|
Fair Value |
|
|||
|
Sugar Producer |
|
Agricultural Products |
|
Sustainable Agriculture & Agroprocessing |
|
Brazil |
|
12.43% |
|
|
12/15/2020 |
(2) |
$ |
2,851,296 |
|
|
$ |
2,367,936 |
|
|
|
LED Lighting Service Provider |
|
Electric Services |
|
Technological Innovation |
|
Chile |
|
11.00% |
|
|
6/6/2021 |
(2) |
|
1,456,162 |
|
|
|
1,434,285 |
|
|
|
Minor Metals Resource Trader |
|
Secondary Nonferrous Metals |
|
Responsible Metals Distribution |
|
Hong Kong |
|
12.00% |
|
|
6/22/2021 |
|
|
5,000,000 |
|
|
|
5,000,000 |
|
|
|
Consumer Lender |
|
Personal Credit Institutions |
|
Inclusive Finance |
|
Colombia |
|
11.25% |
|
|
8/1/2021 |
|
|
1,816,934 |
|
|
|
1,816,934 |
|
|
|
Sustainable Packaging Manufacturer |
|
Corrugated and solid fiber boxes |
|
Recycling |
|
Ecuador |
|
9.16% Cash/2.20% PIK |
|
|
6/18/2025 |
|
|
13,503,499 |
|
|
|
13,503,499 |
|
|
|
Resource Trader |
|
Coal and Other Minerals and Ores |
|
Responsible Natural Resources Distribution |
|
Hong Kong |
|
11.50% |
|
|
12/31/2020 |
(4) |
|
17,166,559 |
|
|
|
17,166,559 |
|
|
|
Wholesale Distributor |
|
Chemicals and Allied Products |
|
Responsible Industrial Goods Distribution |
|
Malaysia |
|
12.00% |
|
|
12/31/2022 |
|
|
15,858,045 |
|
|
|
15,858,045 |
|
|
|
Waste to Fuels Processor |
|
Refuse Systems |
|
Recycling |
|
Mexico |
|
14.50% PIK |
|
|
7/27/2021 |
(3) |
|
28,531,105 |
|
|
|
29,730,723 |
|
|
|
Diaper Manufacturer II |
|
Consumer Products |
|
Responsible Consumer Goods Production |
|
Peru |
|
11.00% |
|
|
12/31/2024 |
|
|
4,737,437 |
|
|
|
4,737,437 |
|
|
|
SME Financier |
|
Short-Term Business Credit |
|
Inclusive Finance |
|
Botswana |
|
11.47% |
|
|
8/18/2021 |
|
|
4,740,000 |
|
|
|
4,740,000 |
|
|
|
IT Service Provider |
|
Programming and Data Processing |
|
Access to Technology |
|
Brazil |
|
10.00% Cash/1.50% PIK |
|
|
11/23/2023 |
|
|
18,362,141 |
|
|
|
18,502,811 |
|
|
|
Ship Maintenance & Repair Service Provider |
|
Boatbuilding and Repairing |
|
Infrastructure Development |
|
Brazil |
|
8.00% Cash/6.00% PIK |
|
|
12/7/2023 |
|
|
5,999,538 |
|
|
|
5,946,066 |
|
|
|
Hospitality Service Provider |
|
Hotels and Motels |
|
Infrastructure Development |
|
Cabo Verde |
|
10.00% Cash/4.75% PIK |
|
|
8/21/2021 |
(2) |
|
13,478,292 |
|
|
|
11,337,937 |
|
|
|
Consumer Lender |
|
Personal Credit Institutions |
|
Access to Technology |
|
Colombia |
|
11.90% |
|
|
9/1/2025 |
|
|
1,245,664 |
|
|
|
1,245,664 |
|
|
|
Mall Operator |
|
Department Stores |
|
Infrastructure Development |
|
Croatia |
|
8.50% Cash/4.50% PIK |
|
|
1/23/2021 |
(4) |
|
9,360,235 |
|
|
|
9,360,235 |
|
|
|
Tank Farm Operator |
|
Petroleum and Petroleum Products |
|
Responsible Fuel Storage |
|
Ghana |
|
12.00% |
|
|
2/10/2023 |
|
|
13,685,366 |
|
|
|
13,685,366 |
|
|
|
Mobile Network Operator |
|
Telephone Communications |
|
Access to Technology |
|
Jersey |
|
10.06% |
|
|
3/28/2023 |
|
|
1,417,700 |
|
|
|
1,161,200 |
|
|
|
Freight and Cargo Transporter |
|
Freight Transportation Arrangement |
|
Responsible Logistics Management |
|
Kenya |
|
7.77% Cash/4.00% PIK |
|
|
3/31/2023 |
|
|
14,034,913 |
|
|
|
14,034,913 |
|
|
|
Property Developer |
|
Land Subdividers and Developers |
|
Infrastructure Development |
|
Namibia |
|
8.50% Cash/4.00% PIK |
|
|
8/15/2021 |
(2) |
|
17,529,688 |
|
|
|
15,242,460 |
|
|
|
Wheel Manufacturer |
|
Motor Vehicle Parts and Accessories |
|
Responsible Consumer Goods Production |
|
Netherlands |
|
14.23% |
|
|
8/20/2021 |
|
|
8,275,000 |
|
|
|
8,893,693 |
|
|
|
Marine Logistics Provider |
|
Water Transportation |
|
Responsible Logistics Management |
|
Nigeria |
|
10.65% |
|
|
9/16/2020 |
(2) |
|
15,600,710 |
|
|
|
12,986,279 |
|
|
|
Bread Manufacturer |
|
Food Products |
|
Responsible Consumer Goods Production |
|
Romania |
|
8.00% Cash/5.00% PIK |
|
|
7/18/2021 |
|
|
1,830,509 |
|
|
|
1,821,078 |
|
|
|
Grain Processor C |
|
Farm Products |
|
Sustainable Agriculture & Agroprocessing |
|
Uganda |
|
14.50% |
|
|
4/30/2024 |
|
|
8,709,445 |
|
|
|
8,755,878 |
|
|
|
FMCG Manufacturer |
|
Soap, Detergents, and Cleaning |
|
Responsible Consumer Goods Production |
|
Zambia |
|
10.38% |
|
|
8/27/2023 |
|
|
2,203,673 |
|
|
|
2,203,673 |
|
|
|
Agriculture Distributor |
|
Agricultural Products |
|
Sustainable Agriculture & Agroprocessing |
|
Argentina |
|
10.45% |
|
|
6/30/2018 |
(2) |
|
12,500,000 |
|
|
|
9,679,636 |
|
|
|
Dairy Co-Operative |
|
Consumer Products |
|
Sustainable Dairy Production |
|
Argentina |
|
10.67% |
|
|
7/29/2019 |
(2) |
|
6,000,000 |
|
|
|
4,719,383 |
|
|
|
Beef Exporter |
|
Meat, Poultry & Fish |
|
Sustainable Agriculture & Agroprocessing |
|
Argentina |
|
11.50% |
|
|
8/31/2017 |
(2) |
|
9,000,000 |
|
|
|
6,361,679 |
|
|
|
Oilseed Distributor |
|
Fats and Oils |
|
Sustainable Agriculture & Agroprocessing |
|
Argentina |
|
9.00% |
|
|
8/31/2017 |
(2) |
|
6,000,000 |
|
|
|
3,398,558 |
|
|
|
Cocoa & Coffee Exporter |
|
Chocolate and Cocoa Products |
|
Sustainable Agriculture & Agroprocessing |
|
Cameroon |
|
9%, 5.5% |
|
|
8/31/2019 |
(2) |
|
13,532,693 |
|
|
|
13,128,867 |
|
|
|
Chia Seed Exporter |
|
Farm Products |
|
Sustainable Agriculture & Agroprocessing |
|
Chile |
|
10.90% |
|
|
3/4/2018 |
(2) |
|
1,326,687 |
|
|
|
1,375,794 |
|
|
|
Fish Processor & Exporter |
|
Commercial Fishing |
|
Sustainable Aquaculture & Processing |
|
Ecuador |
|
9.00% |
|
|
6/19/2019 |
(2), (4) |
|
35,838 |
|
|
|
35,838 |
|
|
|
Sesame Seed Exporter |
|
Farm Products |
|
Sustainable Agriculture & Agroprocessing |
|
Guatemala |
|
12.00% |
|
|
3/31/2016 |
(2) |
|
881,800 |
|
|
|
10,504 |
|
|
|
Non-Ferrous Metal Trader |
|
Coal and Other Minerals and Ores |
|
Responsible Metals Distribution |
|
Singapore |
|
3.00% Cash/3.00% PIK |
|
|
8/18/2025 |
(2) |
|
18,146,500 |
|
|
|
16,483,354 |
|
|
|
Mobile Phone Distributor |
|
Telephone and Telegraph Apparatus |
|
Access to Technology |
|
Hong Kong |
|
12.00% |
|
|
5/31/2020 |
(2) |
|
9,500,000 |
|
|
|
3,366,356 |
|
|
|
Vanilla Exporter |
|
Groceries and Related Products |
|
Sustainable Agriculture & Agroprocessing |
|
Mauritius |
|
10.65% |
|
|
10/20/2020 |
(4) |
|
434,619 |
|
|
|
434,619 |
|
|
|
Scrap Metal Recycler |
|
Secondary Nonferrous Metals |
|
Recycling |
|
Morocco |
|
11.00% |
|
|
7/31/2018 |
(2) |
|
1,433,058 |
|
|
|
628,861 |
|
|
|
Cocoa Trader III |
|
Farm Products |
|
Sustainable Agriculture & Agroprocessing |
|
Nigeria |
|
8.50% |
|
|
11/30/2020 |
(4) |
|
675,256 |
|
|
|
675,256 |
|
|
|
Cocoa Trader II |
|
Farm Products |
|
Sustainable Agriculture & Agroprocessing |
|
Nigeria |
|
8.50% |
|
|
11/30/2020 |
(4) |
|
838,967 |
|
|
|
838,967 |
|
|
10
|
Fruit & Nut Distributor |
|
Food Products |
|
Sustainable Agriculture & Agroprocessing |
|
South Africa |
|
17.50% |
|
|
5/22/2015 |
(2) |
|
785,806 |
|
|
|
497,462 |
|
|
|
Pharmaceuticals Distributor |
|
Drugs, Proprietaries, and Sundries |
|
Access to Healthcare and Pharmaceuticals |
|
United Arab Emirates |
|
14.60% |
|
|
6/30/2018 |
(2) |
|
648,430 |
|
|
|
648,430 |
|
|
|
Receivable from IIG TOF B.V. |
|
Financial services |
|
Other |
|
N/A |
|
8.75% |
|
|
N/A |
(2) |
|
6,000,000 |
|
|
|
3,758,063 |
|
|
|
Total Investments |
|
|
|
|
|
|
|
|
|
|
|
|
|
|
|
|
|
$ |
287,574,298 |
|
|
1 |
Trade finance borrowers may be granted flexibility with respect to repayment relative to the stated maturity date to accommodate specific contracts and/or business cycle characteristics. This flexibility in each case is agreed upon between the Company and the sub-advisor and between the sub-advisor and the borrower. |
|
2 |
See “Notes to Consolidated Financial Statements—Note 3. Investments—Watch List Investments" for further information. |
|
3 |
This investment consists of a senior secured term loan and equity warrants in the borrower. |
|
4 |
Refer to the Consolidated Schedule of Investments for further information about the status of this investment. |
As of December 31, 2020, the composition our investments based on the Company created industry classification was as follows:
|
|
|
Fair |
|
|
Percentage |
|
||
|
Industry Classification |
|
Value |
|
|
of Total |
|
||
|
Access to Healthcare and Pharmaceuticals |
|
$ |
648,430 |
|
|
|
0.2 |
% |
|
Access to Technology |
|
|
24,276,031 |
|
|
|
8.4 |
% |
|
Inclusive Finance |
|
|
6,556,934 |
|
|
|
2.3 |
% |
|
Infrastructure Development |
|
|
41,886,698 |
|
|
|
14.6 |
% |
|
Recycling |
|
|
43,863,083 |
|
|
|
15.3 |
% |
|
Responsible Consumer Goods Production |
|
|
17,655,881 |
|
|
|
6.1 |
% |
|
Responsible Fuel Storage |
|
|
13,685,366 |
|
|
|
4.8 |
% |
|
Responsible Industrial Goods Distribution |
|
|
15,858,045 |
|
|
|
5.5 |
% |
|
Responsible Logistics Management |
|
|
27,021,192 |
|
|
|
9.4 |
% |
|
Responsible Metals Distribution |
|
|
21,483,354 |
|
|
|
7.5 |
% |
|
Responsible Natural Resources Distribution |
|
|
17,166,559 |
|
|
|
6.0 |
% |
|
Sustainable Agriculture & Agroprocessing |
|
|
47,525,156 |
|
|
|
16.5 |
% |
|
Sustainable Aquaculture & Processing |
|
|
35,838 |
|
|
|
0.0 |
% |
|
Sustainable Dairy Production |
|
|
4,719,383 |
|
|
|
1.6 |
% |
|
Sustainable Forestry |
|
|
— |
|
|
|
0.0 |
% |
|
Technological Innovation |
|
|
1,434,285 |
|
|
|
0.5 |
% |
|
Other |
|
|
3,758,063 |
|
|
|
1.3 |
% |
|
Total |
|
$ |
287,574,298 |
|
|
|
100.0 |
% |
11
The industry composition of the Company’s portfolio, at fair value as of December 31, 2020 and December 31, 2019, was as follows:
|
|
|
As of December 31, 2020 |
|
|
As of December 31, 2019 |
|
||||||||||
|
|
|
Fair |
|
|
Percentage |
|
|
Fair |
|
|
Percentage |
|
||||
|
Industry |
|
Value |
|
|
of Total |
|
|
Value |
|
|
of Total |
|
||||
|
Agricultural Products |
|
$ |
12,047,572 |
|
|
|
4.2 |
% |
|
$ |
12,417,122 |
|
|
|
3.6 |
% |
|
Boatbuilding and Repairing |
|
|
5,946,066 |
|
|
|
2.1 |
% |
|
|
5,695,069 |
|
|
|
1.7 |
% |
|
Chemicals and Allied Products |
|
|
15,858,045 |
|
|
|
5.5 |
% |
|
|
15,000,000 |
|
|
|
4.4 |
% |
|
Chocolate and Cocoa Products |
|
|
13,128,867 |
|
|
|
4.6 |
% |
|
|
9,687,887 |
|
|
|
2.8 |
% |
|
Coal and Other Minerals and Ores |
|
|
33,649,913 |
|
|
|
11.7 |
% |
|
|
32,348,090 |
|
|
|
9.5 |
% |
|
Commercial Fishing |
|
|
35,838 |
|
|
|
0.0 |
% |
|
|
35,838 |
|
|
|
0.0 |
% |
|
Communications Equipment |
|
|
— |
|
|
|
0.0 |
% |
|
|
100,000 |
|
|
|
0.0 |
% |
|
Consumer Products |
|
|
9,456,820 |
|
|
|
3.3 |
% |
|
|
9,318,469 |
|
|
|
2.7 |
% |
|
Corrugated and solid fiber boxes |
|
|
13,503,499 |
|
|
|
4.7 |
% |
|
|
— |
|
|
|
— |
|
|
Department Stores |
|
|
9,360,235 |
|
|
|
3.3 |
% |
|
|
8,638,109 |
|
|
|
2.5 |
% |
|
Drugs, Proprietaries, and Sundries |
|
|
648,430 |
|
|
|
0.2 |
% |
|
|
803,254 |
|
|
|
0.2 |
% |
|
Electric Services |
|
|
1,434,285 |
|
|
|
0.5 |
% |
|
|
16,383,269 |
|
|
|
4.8 |
% |
|
Farm Products |
|
|
11,656,399 |
|
|
|
4.1 |
% |
|
|
9,644,313 |
|
|
|
2.8 |
% |
|
Fats and Oils |
|
|
3,398,558 |
|
|
|
1.2 |
% |
|
|
3,398,558 |
|
|
|
1.0 |
% |
|
Financial services |
|
|
3,758,063 |
|
|
|
1.3 |
% |
|
|
3,758,063 |
|
|
|
1.1 |
% |
|
Food Products |
|
|
2,318,540 |
|
|
|
0.8 |
% |
|
|
2,724,804 |
|
|
|
0.8 |
% |
|
Freight Transportation Arrangement |
|
|
14,034,913 |
|
|
|
4.9 |
% |
|
|
13,505,035 |
|
|
|
4.0 |
% |
|
Groceries and Related Products |
|
|
434,619 |
|
|
|
0.2 |
% |
|
|
468,756 |
|
|
|
0.1 |
% |
|
Hotels and Motels |
|
|
11,337,937 |
|
|
|
3.9 |
% |
|
|
12,846,584 |
|
|
|
3.8 |
% |
|
Land Subdividers and Developers |
|
|
15,242,460 |
|
|
|
5.3 |
% |
|
|
16,781,000 |
|
|
|
4.9 |
% |
|
Logging |
|
|
— |
|
|
|
0.0 |
% |
|
|
5,612,436 |
|
|
|
1.6 |
% |
|
Meat, Poultry & Fish |
|
|
6,361,679 |
|
|
|
2.2 |
% |
|
|
6,240,961 |
|
|
|
1.8 |
% |
|
Motor Vehicle Parts and Accessories |
|
|
8,893,693 |
|
|
|
3.1 |
% |
|
|
8,731,936 |
|
|
|
2.6 |
% |
|
Personal Credit Institutions |
|
|
3,062,598 |
|
|
|
1.1 |
% |
|
|
3,603,592 |
|
|
|
1.1 |
% |
|
Petroleum and Petroleum Products |
|
|
13,685,366 |
|
|
|
4.8 |
% |
|
|
15,500,000 |
|
|
|
4.6 |
% |
|
Programming and Data Processing |
|
|
18,502,811 |
|
|
|
6.4 |
% |
|
|
17,740,330 |
|
|
|
5.2 |
% |
|
Refuse Systems |
|
|
29,730,723 |
|
|
|
10.3 |
% |
|
|
25,766,063 |
|
|
|
7.6 |
% |
|
Secondary Nonferrous Metals |
|
|
5,628,861 |
|
|
|
2.0 |
% |
|
|
17,530,616 |
|
|
|
5.2 |
% |
|
Short-Term Business Credit |
|
|
4,740,000 |
|
|
|
1.6 |
% |
|
|
4,740,000 |
|
|
|
1.4 |
% |
|
Soap, Detergents, and Cleaning |
|
|
2,203,673 |
|
|
|
0.8 |
% |
|
|
2,894,698 |
|
|
|
0.9 |
% |
|
Telephone and Telegraph Apparatus |
|
|
3,366,356 |
|
|
|
1.2 |
% |
|
|
8,840,048 |
|
|
|
2.6 |
% |
|
Telephone Communications |
|
|
1,161,200 |
|
|
|
0.4 |
% |
|
|
36,794,973 |
|
|
|
11.0 |
% |
|
Water Transportation |
|
|
12,986,279 |
|
|
|
4.3 |
% |
|
|
12,748,503 |
|
|
|
3.7 |
% |
|
Total |
|
$ |
287,574,298 |
|
|
|
100.0 |
% |
|
$ |
340,298,376 |
|
|
|
100.0 |
% |
12
The table below shows the portfolio composition by geographic classification at fair value as of December 31, 2020 and December 31, 2019:
|
|
|
As of December 31, 2020 |
|
|
As of December 31, 2019 |
|
||||||||||
|
|
|
Fair |
|
|
Percentage |
|
|
Fair |
|
|
Percentage |
|
||||
|
Country |
|
Value |
|
|
of Total |
|
|
Value |
|
|
of Total |
|
||||
|
Argentina (1) |
|
$ |
24,159,256 |
|
|
|
8.4 |
% |
|
$ |
24,198,860 |
|
|
|
7.1 |
% |
|
Botswana |
|
|
4,740,000 |
|
|
|
1.6 |
% |
|
|
4,740,000 |
|
|
|
1.4 |
% |
|
Brazil |
|
|
26,816,813 |
|
|
|
9.3 |
% |
|
|
26,012,563 |
|
|
|
7.6 |
% |
|
Cabo Verde |
|
|
11,337,937 |
|
|
|
3.9 |
% |
|
|
12,846,584 |
|
|
|
3.8 |
% |
|
Cameroon |
|
|
13,128,867 |
|
|
|
4.6 |
% |
|
|
9,687,887 |
|
|
|
2.9 |
% |
|
Chile |
|
|
2,810,079 |
|
|
|
1.0 |
% |
|
|
2,652,855 |
|
|
|
0.8 |
% |
|
Colombia |
|
|
3,062,598 |
|
|
|
1.1 |
% |
|
|
23,479,065 |
|
|
|
6.9 |
% |
|
Croatia |
|
|
9,360,235 |
|
|
|
3.3 |
% |
|
|
8,638,109 |
|
|
|
2.5 |
% |
|
Ecuador |
|
|
13,539,337 |
|
|
|
4.7 |
% |
|
|
35,838 |
|
|
|
0.0 |
% |
|
Ghana |
|
|
13,685,366 |
|
|
|
4.8 |
% |
|
|
30,500,000 |
|
|
|
9.0 |
% |
|
Guatemala |
|
|
10,504 |
|
|
|
0.0 |
% |
|
|
10,504 |
|
|
|
0.0 |
% |
|
Hong Kong |
|
|
25,532,915 |
|
|
|
8.9 |
% |
|
|
51,188,138 |
|
|
|
15.0 |
% |
|
Jersey |
|
|
1,161,200 |
|
|
|
0.4 |
% |
|
|
16,919,500 |
|
|
|
5.0 |
% |
|
Kenya |
|
|
14,034,913 |
|
|
|
4.9 |
% |
|
|
13,505,035 |
|
|
|
4.0 |
% |
|
Malaysia |
|
|
15,858,045 |
|
|
|
5.5 |
% |
|
|
15,000,000 |
|
|
|
4.4 |
% |
|
Mauritius |
|
|
434,619 |
|
|
|
0.2 |
% |
|
|
468,756 |
|
|
|
0.1 |
% |
|
Mexico |
|
|
29,730,723 |
|
|
|
10.3 |
% |
|
|
25,766,063 |
|
|
|
7.6 |
% |
|
Morocco |
|
|
628,861 |
|
|
|
0.2 |
% |
|
|
7,530,616 |
|
|
|
2.2 |
% |
|
Namibia |
|
|
15,242,460 |
|
|
|
5.3 |
% |
|
|
16,781,000 |
|
|
|
4.9 |
% |
|
Netherlands |
|
|
8,893,693 |
|
|
|
3.1 |
% |
|
|
8,731,936 |
|
|
|
2.6 |
% |
|
New Zealand |
|
|
— |
|
|
|
0.0 |
% |
|
|
5,612,436 |
|
|
|
1.7 |
% |
|
Nigeria |
|
|
14,500,502 |
|
|
|
5.1 |
% |
|
|
14,262,726 |
|
|
|
4.2 |
% |
|
Peru |
|
|
4,737,437 |
|
|
|
1.6 |
% |
|
|
4,599,086 |
|
|
|
1.4 |
% |
|
Romania |
|
|
1,821,078 |
|
|
|
0.6 |
% |
|
|
2,034,188 |
|
|
|
0.6 |
% |
|
Singapore |
|
|
16,483,354 |
|
|
|
5.7 |
% |
|
|
— |
|
|
|
0.0 |
% |
|
South Africa |
|
|
497,462 |
|
|
|
0.2 |
% |
|
|
790,616 |
|
|
|
0.2 |
% |
|
United Arab Emirates |
|
|
648,430 |
|
|
|
0.2 |
% |
|
|
803,254 |
|
|
|
0.2 |
% |
|
Uganda |
|
|
8,755,878 |
|
|
|
3.0 |
% |
|
|
6,850,000 |
|
|
|
2.0 |
% |
|
Zambia |
|
|
2,203,673 |
|
|
|
0.8 |
% |
|
|
2,894,698 |
|
|
|
0.9 |
% |
|
N/A |
|
|
3,758,063 |
|
|
|
1.3 |
% |
|
|
3,758,063 |
|
|
|
1.0 |
% |
|
Total |
|
$ |
287,574,298 |
|
|
|
100.0 |
% |
|
$ |
340,298,376 |
|
|
|
100.0 |
% |
|
(1) |
All of the Company’s investments in Argentina are Participations in trade finance facilities originated by IIG Trade Opportunities Fund B.V. (“IIG TOF B.V.”), a subsidiary of a fund advised by one of the Company’s former sub-advisors, The International Investment Group L.L.C. (“IIG”). See Note 3 “Watch List Investments” for further information. |
As of December 31, 2020, our largest investment represented approximately 8.0% of our net assets or 9.9% of our total portfolio.
As of December 31, 2019, our largest investment represented approximately 6.6% of our net assets or 5.7% of our total portfolio.
Measuring Impact
We measure and expect to regularly provide accounting of economic, social and/or environmental impact achieved through our investments. The Company’s impact measurement system is utilized with investments to evaluate the progress of borrower companies toward their impact objectives during the life of the investment. The system leverages technology that has been specifically developed for tracking and analyzing impact and includes full integration of the Global Impact Investing Network’s Impact Reporting and Investment Standards (“IRIS”) metrics. Impact measurement is accomplished through the establishment of initial baseline measurements for both the Company core economic development metrics, as well as metrics associated with borrower companies’ stated impact objectives. These baseline measurements will be compared against future measurements in order to track incremental progress. In addition to furthering the Company’s economic development impact objectives, we anticipate that our investments will have a positive effect on borrower companies’ ability to make progress toward their stated impact objectives(s).
13
On an annual basis, an updated impact assessment is completed. This includes collection of our core impact metrics and borrower company impact objective-specific metrics. In March 2019, the Company issued its third Sustainability and Impact Report as of June 30, 2019. For our 2020 Sustainability and Impact report, the Company will also request an independent review of certain impact data therein.
Financing Strategy
We may opt to supplement our equity capital and increase potential returns to our unitholders through the use of prudent levels of borrowings from either commercial financial institutions or DFIs. We may use debt when the available terms and conditions are favorable to long-term investing and well-aligned with our investment strategy and portfolio composition. In determining whether to borrow money, we will seek to optimize maturity, covenant packages and rate structures. Most importantly, the risks of borrowing within the context of our investment outlook and the impact on our investment portfolio will be extensively analyzed in making this determination. As of December 31, 2020 and 2019, we had borrowings amounting to $5,000,000 and $5,000,000, respectively. If we are not able to obtain additional financings, our returns are expected to be lower than originally anticipated when we were formed.
Hedging Activities
Most of our investments are anticipated to continue to be denominated in U.S. dollars, but when exposed to foreign currencies, we will seek to hedge the exposure when prudent and cost-effective. These hedging activities may include the use of derivatives, swaps, or other financial products to hedge our interest rate or currency risk. At December 31, 2020 and 2019, we only had one investment, amounting to approximately $9 million and $8 million, respectively, which was not denominated in U.S. Dollars and we had not entered into any hedging transactions.
Operating Expense Responsibility Agreement
On March 26, 2018, the Company, Advisor and the Sponsor entered into an Amended and Restated Operating Expense Responsibility Agreement (“Responsibility Agreement”) originally effective as of June 11, 2013 and covering expenses through December 31, 2017. Since the inception of the Company through December 31, 2017, pursuant to the terms of the Responsibility Agreement, the Sponsor paid approximately $12,420,600 of operating expenses, asset management fees, and incentive fees on behalf of the Company and will reimburse to the Company an additional $4,057,734 of expenses, which had been paid by the Company as of December 31, 2017.
The Sponsor will only be entitled to reimbursement of the cumulative expenses it has incurred on the Company’s behalf to the extent the Company’s investment income in any quarter, as reflected on the statement of operations, exceeds the sum of (a) total distributions to unitholders incurred during the quarter and (b) the Company’s expenses as reflected on the statement of operations for the same quarter (the “Reimbursement Hurdle”). If the Sponsor is entitled to receive reimbursement for any given quarter because the Company’s investment income exceeds the Reimbursement Hurdle for such quarter, the Company will apply the excess amount (the “Excess Amount”) as follows: (i) first, the Company will reimburse the Sponsor for all expenses, other than asset management fees and incentive fees, that the Sponsor previously paid on the Company’s behalf, which will generally consist of operating expenses (the “Previously Paid Operating Expenses”) until all Previously Paid Operating Expenses incurred to date have been reimbursed; and (ii) second, the Company will apply 50% of the Excess Amount remaining after the payment of Previously Paid Operating Expenses to reimburse the Sponsor for the asset management fees and incentive fees that the Sponsor has agreed to pay on the Company’s behalf until all such asset management fees and incentive fees accrued to date have been reimbursed.
The Company did not meet the Reimbursement Hurdle for the years ended December 31, 2020 and 2019. Therefore, none of the expenses of the Company covered by the Responsibility Agreement have been recorded as expenses of the Company for the years ended December 31, 2020 and 2019. As of December 31, 2020, there is a remaining aggregate balance of approximately $16,091,300 in expenses covered by the Responsibility Agreement which are not yet reimbursable to the Sponsor and have not been recorded by the Company. In accordance with ASC 450, Contingencies, such expenses will be accrued and payable by the Company in the period that they become both probable and estimable. The Sponsor may demand the reimbursement of cumulative Company expenses covered by the Responsibility Agreement to the extent the Company exceeds the Reimbursement Hurdle during any quarter.
Investment Advisory Agreements and Fees
We have agreed to pay TriLinc Advisors an asset management fee and an incentive fee for its services under the Advisory Agreement. For the years ended December 31, 2020 and 2019, the Company incurred $7,334,178 and $7,702,572, respectively in asset management fees and $5,320,776 and $5,730,748, respectively in incentive fees to our Advisor.
14
Asset Management Fee
The asset management fee is calculated at an annual rate of 2.00% of our gross assets payable quarterly in arrears. For purposes of calculating the asset management fee, the term “gross assets” means the total net fair value of the Company’s assets at the end of the quarter, other than intangibles and after the deduction of associated allowance and reserves, as determined by the Advisor in its sole discretion.
Incentive Fee
The incentive fee is comprised of two parts: (i) a subordinated incentive fee on income and (ii) an incentive fee on capital gains. Each part of the incentive fee is outlined below.
The subordinated incentive fee on income is earned on pre-incentive fee net investment income and is determined and payable in arrears as of the end of each calendar quarter during which the Advisory Agreement is in effect. If the Advisory Agreement is terminated, the fee will also become payable as of the effective date of the termination.
The subordinated incentive fee on income is subject to a quarterly preferred return to investors, expressed as a rate of return on net assets at the beginning of the most recently completed calendar quarter, of 1.50% (6.0% annualized), subject to a “catch up” feature. The subordinated incentive fee on income for each quarter is calculated as follows:
No incentive fee is earned by the Advisor in any calendar quarter in which our pre-incentive fee net investment income does not exceed the preferred return rate of 1.50%, or the preferred return.
100% of our pre-incentive fee net investment income, if any, that exceeds the quarterly preferred return, but is less than or equal to 1.875% (7.5% annualized) on our net assets at the end of the immediately preceding fiscal quarter, in any quarter, is payable to the Advisor. We refer to this portion of our subordinated incentive fee on income as the catch up. It is intended to provide an incentive fee of 20% on all of our pre-incentive fee net investment income when our pre-incentive fee net investment income exceeds 1.875% on our net assets at the end of the immediately preceding fiscal quarter in any quarter.
For any quarter in which our pre-incentive fee net investment income exceeds 1.875% on our net assets at the end of the immediately preceding fiscal quarter, the subordinated incentive fee on income equals 20% of the amount of our pre-incentive fee net investment income, because the preferred return and catch up will have been achieved.
Pre-incentive fee net investment income is defined as interest income, dividend income and any other income accrued during the calendar quarter, minus our operating expenses for the quarter, including the asset management fee and operating expenses reimbursed to the Advisor. Pre-incentive fee net investment income does not include any realized capital gains, realized capital losses or unrealized capital appreciation or depreciation.
The following is a graphical representation of the calculation of the quarterly subordinated incentive fee on income:
Quarterly Subordinated Incentive Fee on Income
Pre-incentive fee net investment income
(expressed as a percentage of net assets)
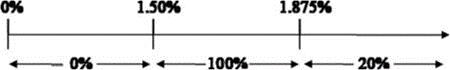
Percentage of pre-incentive fee net investment income
allocated to quarterly incentive fee
The incentive fee on capital gains is earned on investments sold or matured and shall be determined and payable in arrears as of the end of each calendar year during which the Advisory Agreement is in effect. In the case the Advisory Agreement is terminated, the fee will also become payable as of the effective date of such termination. The fee will equal 20% of our realized capital gains, less the aggregate amount of any previously paid incentive fee on capital gains. Incentive fee on capital gains is equal to our realized capital gains on a cumulative basis from inception, computed net of all realized capital losses and unrealized capital depreciation on a cumulative basis.
Because of the structure of the subordinated incentive fee on income and the incentive fee on capital gains, it is possible that we may pay such fees in a quarter where we incur a net loss. For example, if we receive pre-incentive fee net investment income in excess of the 1.75% on our net assets at the end of the immediately preceding fiscal quarter for a quarter, we will pay the applicable incentive fee even if we have incurred a net loss in the quarter due to a realized or unrealized capital loss. Our Advisor will not be under any
15
obligation to reimburse us for any part of the incentive fee it receives that is based on prior period accrued income that we never receive as a result of a subsequent decline in the value of our portfolio.
The fees that are payable under the Advisory Agreement for any partial period are appropriately prorated. The fees are calculated using a detailed policy and procedure approved by our Advisor and our board of managers, including a majority of the independent managers, and such policy and procedure is consistent with the description of the calculation of the fees set forth above.
Our Advisor may elect to defer or waive all or a portion of the fees that would otherwise be paid to it in its sole discretion. Any portion of a fee not taken as to any month, quarter or year will be deferred without interest and may be taken in any such other month prior to the occurrence of a liquidity event as our Advisor may determine in its sole discretion.
Investment Company Act Considerations
We have conducted and intend to continue to conduct our operations so that we and our subsidiaries will qualify for an exemption under, or otherwise will not be required to register as an investment company under, the Investment Company Act of 1940, as amended, which we refer to as the Investment Company Act.
Section 3(a)(1)(A) of the Investment Company Act defines an investment company as any issuer that is or holds itself out as being engaged primarily, or proposes to engage primarily, in the business of investing, reinvesting or trading in securities. Section 3(a)(1)(C) of the Investment Company Act defines an investment company as any issuer that is engaged or proposes to engage in the business of investing, reinvesting, owning, holding or trading in securities and owns or proposes to acquire investment securities having a value exceeding 40% of the value of the issuer’s total assets (exclusive of U.S. Government securities and cash items) on an unconsolidated basis, which we refer to as the 40% test. Excluded from the term “investment securities,” among other things, are U.S. Government securities and securities issued by majority-owned subsidiaries that are not themselves investment companies and are not relying on the exception from the definition of investment company set forth in Section 3(c)(1) or Section 3(c)(7) of the Investment Company Act.
We conduct our business primarily through our direct and indirect wholly- and majority-owned subsidiaries, including foreign subsidiaries, which were established to carry out specific activities. Although we reserve the right to modify our business methods at any time, the focus of our business involves providing loans and other financing of the nature described in this Form 10-K. We conduct our operations so that they comply with the limit imposed by the 40% test and we do not hold ourselves out as being engaged primarily, or actually engaged, in the business of investing in securities. Therefore, we expect that we will not be subject to registration or regulation as an investment company of any kind (including, without limitation, a face-amount certificate company, unit investment trust, open-end or closed-end company or a management company electing to be treated as a business development company) under the Investment Company Act. The securities issued to us by our wholly-owned or majority-owned subsidiaries, which subsidiaries will be neither investment companies nor companies exempt under Section 3(c)(1) or 3(c)(7) of the Investment Company Act, will not be investment securities for the purpose of this 40% test.
One or more of our subsidiaries may seek to qualify for an exception or exemption from registration as an investment company under the Investment Company Act pursuant to other provisions of the Investment Company Act, such as Sections 3(c)(5)(A) which is available for entities “primarily engaged in the business of purchasing or otherwise acquiring notes, drafts, acceptances, open accounts receivable, and other obligations representing part or all of the sales price of merchandise, insurance and services” and Section 3(c)(5)(B) which is available for entities “primarily engaged in the business of making loans to manufacturers, wholesalers, and retailers of, and to prospective purchasers of, specified merchandise, insurance and services.” Each of these exemptions generally requires that at least 55% of such subsidiary’s assets be invested in eligible loans and receivables. To qualify for either of the foregoing exemptions, the subsidiary would be required to comply with interpretations issued by the staff of the SEC that govern the respective activities.
We monitor our holdings and those of our subsidiaries to ensure continuing and ongoing compliance with these and/or other applicable tests, and we are responsible for making the determinations and calculations required to confirm our compliance with tests. If the SEC does not agree with our determinations, we may be required to adjust our activities and/or those of our subsidiaries.
Qualification for these or other exceptions or exemptions could affect our ability to originate, participate in or hold fixed-income assets, or could require us to dispose of investments that we might prefer to retain in order to remain qualified for such exemptions. Changes in current policies by the SEC and its staff could also require that we alter our business activities for this purpose. For a discussion of certain risks associated with the Investment Company Act, please see “Risk Factors.”
Competition
We compete with a large number of commercial banks, non-bank financial institutions, private equity funds, leveraged buyout and venture capital funds, investment banks and other equity and non-equity based investment funds. Many of our potential competitors are substantially larger and have considerably greater financial, technical and marketing resources than we do. For example, some competitors may have a lower cost of funds and access to funding sources that are not available to us. In addition, certain of our competitors may have higher risk tolerances or different risk assessments, which could allow them to consider a wider variety of investments and establish more relationships and build their market shares.
16
Concentration of credit risk
At December 31, 2020, our portfolio of $287,574,298 (at fair value) included 41 companies and was comprised of $106,899,154 or 37.2% in senior secured term loans, $129,917,253 or 45.2% in senior secured term loan participations, $45,800,210 or 15.9% in senior secured trade finance participations, and $3,758,063 or 1.3% in other investments. Our largest loan by value was $28,531,105 or 9.9% of our total portfolio and provides for paid in kind (“PIK”) interest, with principal and interest due at maturity. Our 5 largest loans by value comprised 33.1% of our portfolio at December 31, 2020. Participation in loans represented 61.1% of our portfolio at December 31, 2020.
Employees
We have no employees. Pursuant to the terms of the Advisory Agreement, our Advisor assumes principal responsibility for managing our affairs and we compensate the Advisor for these services.
Additional Information
Our internet address is www.trilincglobalimpactfund.com. Through a link on our website, we make available, free of charge, our annual reports on Form 10-K, quarterly reports on Form 10-Q, current reports on Form 8-K, along with any amendments to those filings, as soon as reasonably practicable after we file or furnish them to the SEC.
Our privacy policy and Code of Ethics are also available on our website. Within the time period and as required by the rules of the SEC, we will post on our website any amendment to our Code of Ethics.
You should carefully read and consider the risks described below together with all other information in this Annual Report, including our consolidated financial statements and the related notes thereto, before making a decision to purchase our units. If certain of the following risks actually occur, our results of operations and ability to pay distributions would likely suffer materially, or could be eliminated entirely. As a result, the value of our units may decline, and our unitholders could lose all or part of the money they paid to buy our units.
Risks Relating to Our Business and Structure: General
The lack of liquidity of our privately held investments may adversely affect our business.
Most of our investments consist and will continue to consist of loans and other fixed income instruments either originated in private transactions directly with the borrowers or via participation agreements with the direct lenders. Investments may be subject to restrictions on resale, including, in some instances, legal restrictions, or will otherwise be less liquid than publicly traded securities. The illiquidity of our investments may make it difficult for us to quickly obtain cash equal to the value at which we record our investments if the need arises. This could cause us to miss important business opportunities or react to changes in the market. In addition, if we are required to quickly liquidate all or a portion of our portfolio, we may realize significantly less than the value at which we have previously recorded our investments. In addition, we may face other restrictions on our ability to liquidate an investment in a public company to the extent that the Company, its Advisor, or respective officers, employees or affiliates have material non-public information regarding such company.
We may not raise sufficient capital to sustain our operations or the operations of our Sponsor and Advisor.
Pursuant to the terms of the Responsibility Agreement, our Sponsor has absorbed and deferred reimbursement for a substantial portion of our operating expenses incurred from the commencement of our operations through December 31, 2017. As of December 31, 2017, the Sponsor had agreed to pay a cumulative total of approximately $16.7 million of operating expenses, of which $4.2 million was paid by the Company and is shown as a receivable from the Sponsor. As of December 31, 2020, $16.1 million of the $16.7 million in total operating expenses covered under the Responsibility Agreement have not been reimbursed to the Sponsor. If we fail to raise sufficient capital, our Sponsor and Advisor may not attain profitability and may not have sufficient liquidity to continue to support our operations. The lack of financial support from the Sponsor and Advisor could force us to significantly reduce our planned operations.
When we are a debt or minority equity investor in a portfolio company, which we expect will generally be the case, we may not be in a position to control the entity, and its management may make decisions that could decrease the value of our investment.
Most of our investments are and, we anticipate will continue to be in the future, either debt or minority equity investments in our portfolio companies. Therefore, we will be subject to risk that a portfolio company may make business decisions with which we disagree, and the management of such company may take risks or otherwise act in ways that do not serve our best interests. As a result, a portfolio company may make decisions that could decrease the value of our portfolio holdings. In addition, we will generally not be in a position to control any portfolio company by investing in its debt securities.
17
Floating rate investments subject us to certain risks related to the discontinuation of LIBOR.
A portion of our investments bear interest at floating rates based on the London interbank offered rate (“LIBOR”). In July 2017, the United Kingdom's Financial Conduct Authority (“FCA”), which regulates LIBOR, announced that it will stop compelling banks to submit rates for the calculation of LIBOR after 2021. The FCA has decided not to ask, or to require, that panel banks continue to submit contributions to LIBOR beyond the end of 2021. The administrator of LIBOR has announced it will consult on its intention to cease the publication of the one week and two month LIBOR settings immediately following the LIBOR publication on December 31, 2021, and the remaining USD LIBOR settings immediately following the LIBOR publication on June 30, 2023. The U.S. Federal Reserve System, Office of the Comptroller of the Currency, and Federal Deposit Insurance Corporation have issued guidance encouraging market participants to adopt alternatives to LIBOR in new contracts as soon as practicable and no later than December 31, 2021, and the FCA has indicated that market participants should not rely on LIBOR being available after 2021. The U.S. Federal Reserve, in conjunction with the Alternative Reference Rates Committee (“ARRC”), a steering committee comprised of large U.S. financial institutions, has identified the Secured Overnight Financing Rate (“SOFR”), a new index calculated by short-term repurchase agreements, backed by Treasury securities, as its preferred alternative rate for LIBOR. At this time, it is not possible to predict how markets will respond to SOFR or other alternative reference rates as the transition away from LIBOR is anticipated in coming years.
As of December 31, 2020, 17% of the fair value of the Company’s total investments bore interest at floating rates based on LIBOR. There can be no assurances as to whether such replacement or alternative rate will be more or less favorable than LIBOR. The discontinuation or modification of LIBOR could result in interest rate decreases on our debt, which could adversely affect our cash flow, operating results and ability to make distributions to our unitholders at expected levels or at all.
We may be exposed to higher risks with respect to our investments that include PIK interest, particularly our investments in interest-only loans.
We have investments in loans that contain a PIK interest provision, including our largest loan, which made up 7.1% of our total portfolio by value as of December 31, 2020. These investments may expose us to higher risks, including the following:
|
|
• |
because PIK interest results in an increase in the size of the loan balance of the underlying loan, our exposure to potential loss increases when we receive PIK interest; and |
|
|
• |
it may be more difficult to value investments that include PIK interest because their continuing accruals of interest require continuing judgments about the collectability of the deferred payments and the value of the underlying collateral. |
To the extent our investments are structured as interest-only loans, PIK interest will increase the size of the balloon payment due at the end of the loan term. PIK interest payments on such loans may increase the probability and magnitude of a loss on our investment.
We operate in a highly competitive market for investment opportunities.
A large number of entities compete with us and make the types of investments that we seek to make in small and medium-sized privately owned businesses. We compete with a large number of commercial banks, non-bank financial institutions, private equity funds, leveraged buyout and venture capital funds, investment banks and other equity and non-equity based investment funds. Many of our competitors are substantially larger and have considerably greater financial, technical and marketing resources than we do. For example, some competitors may have a lower cost of funds and access to funding sources that are not available to us. In addition, certain of our competitors may have higher risk tolerances or different risk assessments, which could allow them to consider a wider variety of investments and establish more relationships and build their market shares. The competitive pressures we face may have a material adverse effect on our business, financial condition and results of operations. Also, as a result of this competition, we may not be able to take advantage of attractive investment opportunities from time to time, or to identify and make investments that satisfy our investment objectives or that we will be able to fully invest our available capital.
An investment strategy focused primarily on privately held companies presents certain challenges, including the lack of available information about these companies, a dependence on the talents and efforts of only a few key borrower and/or sub-advisor personnel and a greater vulnerability to economic downturns.
We have invested, and will continue to invest in the future, primarily in privately held companies. Generally, little public information exists about these companies, and we will be required to rely on the ability of the Advisor and the respective sub-advisors’ investment professionals to obtain adequate information to evaluate the potential returns from investments made in, with or through these companies. If we are unable to uncover all material information about these companies, we may not make a fully informed investment decision, and we may lose money on our investments. Please see “Notes to Consolidated Financial Statements—Note 3. Investments—Watch List Investments" for information about investments for which we have not been provided with accurate and complete information from a prior sub-advisor, IIG, which has adversely impacted the value of certain of these investments.
18
We may not realize gains from equity instruments granted as return enhancement vehicles when we acquire certain debt instruments.
When we invest in collateralized or senior secured loans, we may acquire warrants or other equity securities as well. Our goal is to ultimately dispose of such equity interests and realize gains upon our disposition of such interests. However, the equity interests we receive may not appreciate in value and, in fact, may decline in value. Accordingly, we may not be able to realize gains from our equity interests, and any gains that we do realize on the disposition of any equity interests may not be sufficient to offset any other losses we experience.
Actions of our sub-advisors and other investment partners could negatively impact our performance.
We participate in investments with third parties. Specifically, we participate in investments originated by our third-party sub-advisors, whom we also refer to as “investments partners”. Such participations may involve risks not otherwise present with a direct origination of loans, including, for example:
|
|
• |
The risk that our investment partner in an investment might become bankrupt or otherwise be unable to meet its obligations; |
|
|
• |
The risk that our investment partner will be ineffective or materially underperform relative to our expectations; |
|
|
• |
The risk that our investment partner will provide us with incomplete or inaccurate information or will misapply our funds; |
|
|
• |
The risk that the due diligence conducted by the investment partner may fail to reveal all material risks of an investment or that the investment partner omits material information about the investment, which could result in the Company being materially adversely affected; |
|
|
• |
The risk that our investment partner may at any time have economic or business interests or goals which are or which become inconsistent with our business interests or goals; |
|
|
• |
The risk that our investment partner may be in a position to take action contrary to our instructions or requests or contrary to our policies or objectives; or |
|
|
• |
The risk that actions by such partner could adversely affect our reputation, negatively impacting our ability to conduct business. |
Actions by such an investment partner, which are generally out of our control, might have the result of subjecting the investment to liabilities in excess of those contemplated and may have the effect of reducing our unitholders’ returns, particularly if the loan agreement provides that our partner can take actions contrary to our interests. As of December 31, 2020, 61.1% of the fair value of our investment portfolio consisted of participations in loans. As described further in “Notes to Consolidated Financial Statements—Note 3. Investments—Watch List Investments", IIG was the sub-advisor with respect to eight of the nineteen investments that we have deemed Watch List investments, which are investments with respect to which we have determined there have been significant changes in the credit and collection risk of the investment. As described in that section, IIG has failed to provide us with complete and accurate information with respect to our investments for which IIG was the sub-advisor, and, in 2017, sold us a $6 million participation in a loan that did not exist. We have not received any material updated information from IIG concerning the investments for which IIG was the sub-advisor since the first quarter of 2019, despite IIG being contractually obligated to provide the Company with updated information. IIG’s acts and omissions have negatively affected the value of certain of our investments, which could adversely affect returns to our unitholders. As of December 31, 2020, 10.2% of our portfolio (by fair value) consisted of investments for which IIG was the sub-advisor, all of which, except for one borrower, are deemed Watch List investments.
The global outbreak of COVID-19 (more commonly referred to as the Coronavirus) has disrupted economic markets and the prolonged economic impact is uncertain. Some economists and major investment banks have expressed concern that the continued spread of the virus globally, including the various quarantine policies being implemented in many countries, could lead to a world-wide economic downturn. Economic slowdowns or recessions could impair our borrowers and harm our operating results.
Our borrowers, as with all businesses, are susceptible to economic slowdowns or recessions and disruptions, such as the disruption and adverse impacts caused by the outbreak of the Coronavirus. These events may ultimately result in borrowers having difficulties repaying the loans in which we have invested or originated. For example, many businesses across the globe have seen a downturn in production and productivity due to the suspension of business and temporary closure of offices and factories in an attempt to curb the spread of the Coronavirus. Therefore, our non-performing assets, or borrowers requiring some form of forbearance, may increase and the value of our portfolio may correspondingly decrease during these periods. Adverse economic conditions also may decrease the value of collateral securing some of our loans (including loans in which we have acquired participations), which could lead to reduced recovery values should liquidation ultimately be required.
The global scope of the Coronavirus pandemic and the related uncertainties, have adversely impacted many industries and businesses directly or indirectly. Adverse impacts include disrupted global travel and supply chains, which adversely impact global commercial activity. As of the date of this report, many of our borrowers have experienced disruption in their operations related to COVID-19, to varying degrees. As of the date of this report, COVID-19 has had a significant impact with respect to current and
19
future payment performance with respect to 23.0% of our investments (based on the fair value of the investments as of December 31, 2020). These borrowers have experienced material losses to revenues. Where appropriate, we and our sub-advisors have attempted to work with borrowers to restructure facilities or extended payment due dates and maturity dates. With respect to one investment, where restructuring has not been successful, we have issued a notice of default and are pursuing legal action to recover amounts due.
In addition to the adverse impact on many of our borrowers, we have also seen a slow down in transaction volume due to the impact of the pandemic. To the extent the disruption and negative impact of the pandemic continues in future periods, we may have additional borrower defaults, which could further negatively impact our NAV. The adverse impact of COVID-19 was a significant contributor to the $0.424 decline in our NAV per unit as of December 31, 2020, as compared to our NAV per unit as of December 31, 2019.
Further, the business and operating results of our borrowers may be negatively impacted if a material percentage of their workforce is infected with the coronavirus or if the outbreak otherwise disrupts their management and other personnel or their ability to operate their respective businesses. Many companies across the globe have implemented policies and procedures designed to protect against the introduction of the coronavirus to the workforce, including permitting employees to work remotely, among others. These changes may lead to disruptions and/or decrease productivity, which may reduce borrowers’ revenues and ability to debt service their loans during the period of disruption.
In addition, we rely on our Advisor to manage our day-to-day operations. The business and operations of our Advisor, our Sponsor and their affiliates may also be adversely impacted by the coronavirus outbreak. Our Advisor has implemented its business continuity plan and additional procedures designed to protect against the introduction of the coronavirus to the workforce, including permitting and encouraging employees to work remotely, temporarily ceasing travel and significantly enhanced office sterilization procedures to minimize the probability of contagion. Although we are following our business continuity plan and following directives from federal, state and municipal authorities, our executive officers and directors, as well as the employees of our Advisor and Sponsor are subject to the risk of illness or quarantine, which may negatively impact their ability to provide us services to the same degree as had been the case prior to the outbreak. Although multiple vaccines have been approved for use in certain countries, there is uncertainty as to when a sufficient portion of the population will be vaccinated, such that restrictions and safety protocols can be relaxed.
Any of these adverse developments could have a material adverse effect on our business, financial condition and results of operations.
We face risks related to health epidemics which could adversely affect our business.
Our business could be materially adversely affected by the effects of a widespread outbreak of contagious disease, including the recent outbreak of respiratory illness caused by the Coronavirus. These effects could include disruptions or restrictions on our employees’ ability to travel, including trips to meet with sub-advisors and borrowers in other countries, which could hinder our ability to effectively oversee our investments. In addition, a significant outbreak of contagious diseases in the human population could result in a widespread health crisis that could adversely affect the economies and financial markets of the countries where our borrowers operate their businesses.
Our borrowers may incur debt that ranks equally with, or senior to, the debt instruments in which we invest.
Our borrowers may have, or may be permitted to incur, other debt that ranks equally with, or senior to, the debt instruments in which we invest. By their terms, such debt instruments may provide that the holders are entitled to receive payment of interest or principal on or before the dates on which we are entitled to receive payments with respect to the debt instruments in which we invest. Also, in the event of insolvency, liquidation, dissolution, reorganization or bankruptcy of a borrower, holders of debt instruments ranking senior to our investment in that borrower would typically be entitled to receive payment in full before we receive any distribution with respect to our investment. After repaying such senior creditors, such borrower may not have any remaining assets to use for repaying its obligation to us. In the case of debt ranking equally with that of our debt instruments, we would have to share on an equal basis any distributions with other creditors in the event of an insolvency, liquidation, dissolution, reorganization or bankruptcy of the relevant borrower. In addition, we may not be in a position to control any borrower through the loans we make. As a result, we are subject to the risk that any borrower in which we invest may make business decisions with which we disagree and the management of such company, as representatives of the holders of their common equity, may take risks or otherwise act in ways that do not serve our interests as debt investors.
There is a risk that our unitholders may not receive distributions or that our distributions may not grow over time or may be reduced.
We may not achieve investment results that will allow us to make a specified level of cash distributions. In addition, due to covenants and asset coverage tests, which may apply to us in the event we choose to employ financial leverage, we may be subject to restrictions on unitholder distributions.
20
In addition, pursuant to the terms of the Responsibility Agreement, our Sponsor has absorbed and deferred reimbursement for a substantial portion of our operating expenses that were incurred from when we began our operations through September 30, 2017. Our Sponsor determined not to pay for any operating expenses for the fourth quarter of 2017 and periods thereafter. From time to time, our board of managers may change the amount of distributions that are paid, if paid at all. For example, the daily distribution rate was reduced in March 2018 and was further reduced, effective May 1, 2021. Daily distributions per unit are expected to be paid for periods on and after May 1, 2021 in an annualized amount equal to approximately 7.0% of the most recently determined NAV per unit disclosed by us at the time the distribution is declared, although there can be no assurances that our board of managers will authorize distributions at this approximate annualized rate or at all. Since our NAV per unit can vary from quarter to quarter, if our board of managers continues to authorize daily distributions at an annualized rate that is based on our most recently determined NAV per unit, it is likely that the per unit dollar amount of distributions paid to our unitholders will similarly vary.
Our Sponsor is under no obligation to pay our operating expenses in the future, and if we do not generate sufficient investment income to cover our operating expenses, our distributions to our unitholders may further be reduced. In addition, the Sponsor could demand the reimbursement of operating expenses covered by the Responsibility Agreement if and when the Company has met the Reimbursement Hurdle. Such reimbursements to the Sponsor could affect the amount of cash available to the Company to pay distributions and/or make investments.
If we pay distributions from sources other than our cash flow from operations, we will have less funds available for the investments, and the overall return for our unitholders may be reduced.
Our operating agreement permits us to make distributions from any source, including offering proceeds and, subject to certain limitations, borrowings, and we may choose to pay distributions from such other sources when we do not have sufficient cash flow from operations to fund such distributions. We have not established a limit on the amount of proceeds we may use to fund distributions. From time to time during our operational stage, we may not generate sufficient cash flow from operations to fund distributions. If we fund distributions from borrowings or the net proceeds from this offering, we will have less funds available for the investments, and your overall return may be reduced.
If we internalize our management functions, we could incur adverse effects on our business and financial condition, including significant costs associated with becoming and being self-managed and the percentage of our units owned by our unitholders could be reduced.
If we seek to list our units on an exchange as a way of providing our unitholders with a liquidity event, we may consider internalizing the functions performed for us by our Advisor. An internalization could take many forms, for example, we may hire our own group of executives and other employees or we may acquire our Advisor or its respective assets including its existing workforce. Internalizing our management functions may not result in anticipated benefits to us and our unitholders. For example, we may not realize the perceived benefits because of: (i) the costs of being self-managed; (ii) our inability to effectively integrate a new staff of managers and employees; or (iii) our inability to properly replicate the services provided previously by our Advisor or its affiliates. Additionally, internalization transactions have also, in some cases, been the subject of litigation and even if these claims are without merit, we could be forced to spend significant amounts of money defending claims which would reduce the amount of funds available for us to make investments or to pay distributions. In connection with any such internalization transaction, a special committee consisting of all or some of our independent managers will be appointed to evaluate the transaction and to determine whether a fairness opinion should be obtained.
We may engage in hedging activity, which could expose us to risks associated with such transactions, including the risk that we may artificially limit the investment income realized by the Company on certain investments.
As of December 31, 2020, we had not engaged in any significant hedging transaction. If we do engage in hedging transactions, we may expose ourselves to risks associated with such transactions. We may utilize instruments such as forward contracts, currency options and interest rate swaps, caps, collars and floors to seek to hedge against fluctuations in the relative values of our portfolio positions from changes in currency exchange rates and market interest rates. Hedging against a decline in the values of our portfolio positions does not eliminate the possibility of fluctuations in the values of such positions or prevent losses if the values of such positions decline. However, such hedging can establish other positions designed to gain from those same developments, thereby offsetting the decline in the value of such portfolio positions. Such hedging transactions may also limit the opportunity for gain if the values of the portfolio positions should increase. Moreover, it may not be possible to hedge against an exchange rate or interest rate fluctuation for any given investment at an acceptable price.
The success of our hedging transactions will depend on our ability to correctly predict movements, currencies and interest rates. Therefore, while we may enter into such transactions to seek to reduce currency exchange rate and interest rate risks, unanticipated changes in currency exchange rates or interest rates may result in poorer overall investment performance than if we had not engaged in any such hedging transactions. In addition, the degree of correlation between price movements of the instruments used in a hedging strategy and price movements in the portfolio positions being hedged may vary. Moreover, for a variety of reasons, we may not seek
21
to establish a perfect correlation between such hedging instruments and the portfolio holdings being hedged. Any such imperfect correlation may prevent us from achieving the intended hedge and expose us to risk of loss. In addition, it may not be possible to hedge fully or perfectly against currency fluctuations affecting the value of investments denominated in non-U.S. currencies because the value of those investments is likely to fluctuate as a result of factors not related to currency fluctuations.
Our business plan anticipates external financing which may expose us to risks associated with leverage.
In order to achieve our investment objectives and our originally anticipated returns, we will need to utilize financial leverage. We may borrow money in order to make investments, for working capital and to make distributions to our unitholders. Under current or future market conditions, we may not be able to borrow all of the funds we may need. If we cannot obtain debt or equity financing on acceptable terms, our ability to acquire new investments to expand our operations will be adversely affected and we may be unable to pay distributions. As a result, we would be less able to achieve our investment objectives, which may negatively impact our results of operations and reduce our ability to make distributions to our unitholders. Furthermore, borrowing money for investments increases the risk of a loss. A decrease in the value of our investments will have a greater impact on the value of units to the extent that we have borrowed money to make investments. There is a possibility that the costs of borrowing could exceed the income we receive on the investments we make with such borrowed funds. Accordingly, we are subject to the risks that our cash flow will not be sufficient to cover the required debt service payments and that we will be unable to meet the other covenants or requirements of the credit agreements. In addition, our ability to pay distributions or incur additional indebtedness may be restricted by our credit agreements. If the value of our assets declines, we may be required to liquidate a portion or our entire investment portfolio and repay a portion or all of our indebtedness at a time when liquidation may be disadvantageous. Furthermore, any amounts that we use to service our indebtedness will not be available for distributions to our unitholders
All of our outstanding debt is collateralized with shares of the Company’s subsidiary that holds all of the Company’s assets and if we default on the payment our credit holders will have rights against such collateral, thereby reducing our asset base and the income we receive from such investments. As of December 31, 2020, we had $5 million debt outstanding with a debt to equity ratio of 1.4%.
We may enter into and have entered into financing arrangements involving balloon payment obligations, which may adversely affect our ability to make distributions to our unitholders.
Some of our financing arrangements require us to make a lump-sum or “balloon” payment at maturity. Our ability to make a balloon payment at maturity will be uncertain and may depend upon our ability to obtain additional financing. At the time the balloon payment is due, we may or may not be able to refinance the balloon payment on terms as favorable as the original financing. The effect of a refinancing could affect the rate of return to our unitholders. In addition, payments of principal and interest made to service our debts, including balloon payments, may reduce our ability to make distributions to our unitholders.
As of December 31, 2020, we had $5 million in total debt, which is required to be paid in full as a balloon payment of $5 million due in December 2021.
We may be unable to invest a significant portion of our raised capital on acceptable terms or within the time period we anticipate.
Delays in investing our raised capital may impair our performance. We may be unable to identify any investment opportunities that meet our investment objectives or that any investment that we make will produce a positive return. We may be unable to invest the net proceeds from our private placement of units, our notes offerings or future offerings on acceptable terms within the time period that we anticipate or at all, which could harm our financial condition and operating results.
We expect to invest proceeds we receive from our raised capital in short-term, highly-liquid investments until we use such funds to invest in assets meeting our investment objectives. The income we earn on these temporary investments is not substantial. Further, we may use the principal amount of these investments, and any returns generated on these investments, to pay for fees and expenses in connection with our capital raises and distributions. Therefore, delays in investing proceeds from our raised capital could impact the amount of and our ability to generate cash flow for distributions.
We may enter into financing arrangements that require us to enter into restrictive covenants that relate to or otherwise limit our operations, which could limit our ability to make distributions to our unitholders, to replace the Advisor or to otherwise achieve our investment objectives.
When providing financing, a lender may impose restrictions on us that affect our distribution and operating policies and our ability to incur additional debt. Financing documents we enter into may contain covenants that limit our ability to make distributions under certain circumstances. In addition, provisions of our financing documents may deter us from replacing our Advisor because of the consequences under such agreements. These or other limitations may adversely affect our flexibility and our ability to achieve our investment objectives.
22
We may enter into financing arrangements that require us to use and pledge offering proceeds to secure and repay such borrowings, and such arrangements may adversely affect our ability to make investments and operate our business.
We may enter into financing arrangements that require us to use and pledge future proceeds from the Offering or future offerings to secure and repay such borrowings. Such arrangements may cause us to have less proceeds available to make investments or otherwise operate our business, which may adversely affect our flexibility and our ability to achieve our investment objectives.
A change in interest rates may adversely affect our profitability and our hedging strategy may expose us to additional risks.
We may use a combination of equity and long-term and short-term borrowings denominated in one or more currencies to finance our lending activities. If we utilize borrowings, a portion of our income will depend upon the difference between the rate at which we borrow funds and the rate at which we loan these funds. Certain of our borrowings may be at fixed rates and others at variable rates. In connection with any borrowings, we may decide to enter into interest rate hedging interests. Hedging activities may limit our ability to participate in the benefits of lower interest rates with respect to the hedged portfolio. Adverse developments resulting from changes in interest rates or hedging transactions could have a material adverse impact on our business, financial condition and operating results. An increase in interest rates would decrease the value of our investments were we seeking to liquidate our portfolio.
Our investments may be long term and may require several years to realize liquidation events.
We anticipate maintaining an average portfolio duration in excess of two years with regard to our debt investments. As a result, our unitholders should not expect liquidity, if any, to occur over the near term. In addition, we expect that any warrants or other return enhancements that we receive when we make loans may require several years to appreciate in value and may not appreciate at all.
Prepayments by our borrowers could adversely impact our operating results, reducing total income and increasing the number of investments the Company will have to execute.
We are also subject to the risk that investments that we make may be repaid prior to scheduled maturity. In such an event, we will generally use proceeds from prepayments first to repay any borrowings outstanding on any line of credit, if we have any outstanding. In the event that funds remain after repayment of our outstanding borrowings, we will generally reinvest these proceeds in short-term securities, pending their future investment in new investment instruments. These short-term securities will typically have substantially lower yields than the debt securities being prepaid and we could experience significant delays in reinvesting these amounts. As a result, our operating results could be materially adversely affected if one or more of our borrowers elect to prepay amounts owed to us. For the years ended December 31, 2020 and 2019, we did not receive any such material prepayments.
Non-payment by borrowers and acts or omissions by our sub-advisors that result in us not being repaid for our investments has and may continue to prevent us from realizing expected income and has and may continue to result in a decrease in our net asset value.
All of our fixed-income investments are subject to the risk that a borrower will fail to repay a portion or all of periodically scheduled interest and/or principal payments. When this occurs, we fail to realize expected income and, in some instances, this has resulted and may continue to result in a write-down of the value of under-performing loans as well as our net asset value. As of December 31, 2020, we had 13 borrowers who had failed to repay principal and interest and were included on our Watch List. Please see “Notes to Consolidated Financial Statements—Note 3. Investments—Watch List Investments" for more information about the Watch List.
We allocate substantially all of our fixed-income investment capital to unrated instruments, which may be viewed as highly speculative.
We have and will likely continue to allocate substantially all of our fixed-income investment capital to unrated instruments. Such instruments may be viewed as highly speculative and the recovery of projected interest and principal payments is reliant on the Advisor’s and sub-advisors’ ability to accurately underwrite and manage our investments.
Small and Medium-Sized Businesses
Small and medium-sized businesses may have limited financial resources and may not be able to repay the loans we make to them.
Our strategy includes providing financing to borrowers that typically is not readily available to them. This may make it difficult for the borrowers to repay their loans to us. A borrower’s ability to repay its loan may be adversely affected by numerous factors, including the failure to meet its business plan, a downturn in its industry or negative economic conditions. A deterioration in a borrower’s financial condition and prospects will usually be accompanied by a deterioration in the value of any collateral and a
23
reduction in the likelihood of us realizing on any guarantees we may have obtained from the borrower’s management. We may at times be subordinated to a senior lender, and, in such situations, our interest in any collateral would likely be subordinate to another lender’s security interest.
Small and medium-sized businesses typically have narrower product offerings and smaller market shares than large businesses.
Because our target borrowers are smaller businesses, they tend to be more vulnerable to competitors’ actions and market conditions, as well as general economic downturns. In addition, borrowers may face intense competition, including competition from companies with greater financial resources, more extensive development, manufacturing, marketing and other capabilities and a larger number of qualified managerial and technical personnel.
Small and medium-sized businesses generally have less predictable operating results.
Our borrowers may have significant variations in their operating results, may from time to time be parties to litigation, may be engaged in rapidly changing businesses with products subject to a substantial risk of obsolescence, may require substantial additional capital to support their operations, finance expansion or maintain their competitive position, may otherwise have a weak financial position or may be adversely affected by changes in the business cycle. Our borrowers may not meet net income, cash flow and other coverage tests typically imposed by their senior lenders. A borrower’s failure to satisfy financial or operating covenants imposed by senior lenders could lead to defaults and, potentially, foreclosure on its senior credit facility, which could additionally trigger cross-defaults in other agreements. If this were to occur, it is possible that the borrower’s ability to repay our loan would be jeopardized.
Small and medium-sized businesses are more likely to be dependent on one or two persons.
Typically, the success of a small or medium-sized business depends on the management talents and efforts of one or two persons or a small group of persons. The death, disability or resignation of one or more of these persons could have a material adverse impact on our borrower and, in turn, on us.
Small and medium-sized businesses are likely to have greater exposure to economic downturns than larger businesses.
Our borrowers tend to have fewer resources than larger businesses and an economic downturn is more likely to have a material adverse effect on them. If one of our borrowers is adversely impacted by an economic downturn, its ability to repay our loan would be diminished.
Small and medium-sized businesses may have limited operating histories.
Borrowers with limited operating histories will be exposed to all of the operating risks that new businesses face and may be particularly susceptible to, among other risks, market downturns, competitive pressures and the departure of key executive officers.
Lack of minimum requirements when lending to small and medium-sized businesses could increase the risk of default.
Although our investment strategy is focused on small and medium-sized businesses meeting certain underwriting criteria, we are not required to invest only in businesses meeting certain minimum asset size, revenue size or profitability standards and the lack of these minimum requirements could create additional risks with respect to our investments, including the risk of default.
Non-U.S. Investments
Our investments in foreign debt and equity instruments may involve significant risks in addition to the risks inherent in U.S. investments.
Our investment strategy contemplates investing primarily in debt and equity instruments issued by foreign companies. During 2020 and 2019, we have made loans to companies located in Argentina, Botswana, Brazil, Cabo Verde, Cameroon, Cayman Islands, Chile, China, Colombia, Croatia, Ecuador, Ghana, Guatemala, Hong Kong, Indonesia, Italy, Jersey, Kenya, Malaysia, Mauritius, Mexico, Morocco, Namibia, New Zealand, Nigeria, Peru, Romania, Singapore, South Africa, Tanzania, the United Arab Emirates, the United Kingdom, Uganda, Uruguay, and Zambia. Investing in foreign companies may expose us to additional risks not typically associated with investing in U.S. companies. These risks include the economic disruption caused by the global outbreak of the Coronavirus and changes in exchange control regulations, political and social instability, expropriation, imposition of foreign taxes, less liquid markets and less available information than is generally the case in the U.S., higher transaction costs, less government supervision of exchanges, brokers and issuers, less developed bankruptcy laws, difficulty in enforcing contractual obligations, lack of uniform accounting and auditing standards and greater price volatility.
24
Non-U.S. investments involve certain legal, geopolitical, investment, repatriation, and transparency risks not typically associated with investing in the U.S.
|
|
• |
Legal Risk: The legal framework of certain developing countries is rapidly evolving and it is not possible to accurately predict the content or implications of changes in their statutes or regulations. Existing legal frameworks may be unfairly or unevenly enforced, and courts may decline to enforce legal protections covering our investments altogether. The cost and difficulties of litigation in these countries may make enforcement of our rights impractical or impossible. Adverse regulation or legislation may be introduced at any time without prior warning or consultation. |
|
|
• |
Geopolitical Risk: Given that we invest in developing economies, there is a possibility of nationalization, expropriation, unfavorable regulation, economic, political, or social instability, war, or terrorism which could adversely affect the economies of a given jurisdiction or lead to a material adverse change in the value of our investments in such jurisdiction. |
|
|
• |
Investment & Repatriation Risks: Significant time and/or financial resources may be required to obtain necessary government approval for us to invest under certain circumstances. In addition, we may invest in jurisdictions that become subject to investment restrictions as a result of economic or other sanctions after the time of our investment, the predictability of which is less certain given the new U.S. presidential administration. Under such circumstances, we may be required to divest of certain investments at a loss. |
|
|
• |
Transparency Risks: Disclosure, accounting, and financial standards in developing economies vary widely and may not be equivalent to those of developed countries. Although our Advisor will use its best efforts to verify information supplied to it and will engage qualified sub-advisors when appropriate, our investments may still be adversely affected by such risks. |
Fluctuation in currency exchange rates may negatively affect our borrowers’ ability to pay U.S. dollars denominated loans
For investment denominated in U.S. dollars, if the U.S. dollar rises, it may become more difficult for borrowers to make loan payments if the borrowers are operating in markets where the local currencies are depreciating relative the U.S. dollar.
Lack of compliance with the U.S. Foreign Corrupt Practices Act, or FCPA, could subject us to penalties and other adverse consequences.
We are subject to the FCPA, which generally prohibits U.S. companies from engaging in bribery or other prohibited payments to foreign officials for the purpose of obtaining or retaining business. Foreign companies, including potential competitors, are not subject to these prohibitions. Fraudulent practices, including corruption, extortion, bribery, pay-offs, theft and others, occur from time-to-time in countries in which we may do business. If people acting on our behalf or at our request are found to have engaged in such practices, severe penalties and other consequences could be imposed on us that may have a material adverse effect on our business, results of operations, cash flows and financial condition and our ability to make distributions to you and the value of your investment.
Risks Related to our Advisor and its Affiliates:
We are dependent upon our key management personnel and the key management personnel of our Advisor, who will face conflicts of interest relating to time management, and on our Advisor and its affiliates, for our future success.
We have no employees. Our executive officers and the officers and employees of our Advisor and its affiliates may hold similar positions in other affiliated entities and they may from time to time allocate more of their time to service the needs of such entities than they allocate to servicing our needs.
In addition, we have no separate facilities and are completely reliant on our Advisor, which has significant discretion as to the implementation and execution of our business strategies and risk management practices. We are subject to the risk of discontinuation of our Advisor’s operations or termination of the Advisory Agreement and the risk that, upon such event, no suitable replacement will be found. We believe that our success depends to a significant extent upon our Advisor and that discontinuation of its operations could have a material adverse effect on our ability to achieve our investment objectives.
The Advisor and its affiliates are responsible for selecting the sub-advisors. Although our Advisor retains ultimate responsibility for the performance of services under the Advisory Agreement, it can delegate its responsibilities to one of its affiliates or a third party. If our Advisor or any of its affiliates fail to perform according to our expectations and in accordance with the Advisory Agreement, we could be materially adversely affected.
We may compete with other Sponsor affiliated entities for opportunities to originate or participate in investments, which may have an adverse impact on our operations.
We may compete with other Sponsor affiliated entities, and with other entities that Sponsor affiliated entities may advise or own interests in, whether existing or created in the future, for opportunities to originate or participate in impact investments. The Advisor may face conflicts of interest when evaluating investment opportunities for us and other owned and/or managed by Sponsor affiliated entities and these conflicts of interest may have a negative impact on us.
25
Sponsor affiliated entities may have, and additional entities (including those that may be advised by Sponsor affiliated entities or in which Sponsor affiliated entities own interests) may be given, priority over us with respect to the acquisition of certain types of investments. As a result of our potential competition with these entities, certain investment opportunities that would otherwise be available to us may not in fact be available.
Our success will be dependent on the performance of our sub-advisors and our sub-advisors’ failure to identify and make investments that meet our investment criteria or perform their responsibilities under the sub-advisory agreements may adversely affect our ability to realize our investment objectives.
Our Advisor employs sub-advisors in its execution of the investment strategy, not all of whom have been identified. Our ability to achieve our investment objectives will depend, in part, on our sub-advisors’ ability to identify and invest in debt and equity instruments that meet our investment criteria. Accomplishing this result on a cost-effective basis will, in part, be a function of our sub-advisors’ execution of the investment process, their capacity to provide competent and efficient services to us, and, their ability to source attractive investments. Sub-advisors are responsible for locating, performing due diligence and closing on suitable acquisitions based on their access to local markets, local market knowledge for quality deal flow and extensive local private credit experience. Our sub-advisors will have substantial responsibilities under the sub-advisory agreements. Any failure to manage the investment process effectively could have a material adverse effect on our business, financial condition and results of operations. In addition, because the sub-advisors are separate companies from our Advisor, the risk exists that our sub-advisors will be ineffective or materially underperform. In addition, the Sub-Advisory Agreements with the sub-advisors can only be terminated under specific circumstances and they do not automatically terminate upon the termination of the Advisory Agreement.
We may be unable to find suitable investments through our sub-advisors. Our ability to achieve our investment objectives and to pay distributions will be dependent upon the performance of our local sub-advisors in the identification, performance of due diligence on and acquisition of investments, the determination of any financing arrangements, and the management of our projects and assets. If our sub-advisors fail to perform according to our expectations, or if the due diligence conducted by the sub-advisors fails to reveal all material risks of the businesses of our target investments, we could be materially adversely affected. Our former sub-advisor, IIG, failed to perform all of its responsibilities under its sub-advisory agreement with us, which has had and may continue to have an adverse impact on our ability to ascertain information about certain of our investments and the value of certain of our investments.
We have paid substantial compensation to our Advisor and its affiliates. The compensation we pay to the Advisor and its affiliates may be increased by our independent managers. This compensation was not determined on an arm’s-length basis and therefore may not be on the same terms we could achieve from a third party.
The compensation paid to our Advisor and its affiliates was not determined on an arm’s-length basis. A third party unaffiliated with us may be willing and able to provide certain services to us at a lower price.
In addition, subject to limitations in our operating agreement, the fees, compensation, income, expense reimbursements, interests and other payments payable to our Advisor and its affiliates may increase in the future from those previously disclosed, if such increase is approved by a majority of our independent managers.
There are significant potential conflicts of interest, which could impact our investment returns.
In the course of our investing activities, we also pay management and incentive fees to our Advisor and reimburse our Advisor for certain administrative expenses incurred on behalf of the Company. As a result, our investors invest on a “gross” basis and receive distributions on a “net” basis after expenses, resulting in, among other things, a lower rate of return than one might achieve by making direct investments. As a result of this arrangement, there may be times when the management team of our Advisor has interests that differ from those of our unitholders, giving rise to a conflict. For example, our Advisor has incentives to recommend that we make investments using borrowings since the asset management fees that we pay to our Advisor will increase if we use borrowings in connection with our investments.
Our subordinated incentive fee may induce our Advisor to make certain investments, including speculative investments.
The management compensation structure that has been implemented under the Advisory Agreement, with our Advisor may cause our Advisor to invest in higher-risk investments or take other risks. In addition to its asset management fee, our Advisor is entitled under the Advisory Agreement to receive subordinated incentive compensation based in part upon our achievement of specified levels of net cash flows. The incentive fee payable by us to our Advisor may create an incentive for the Advisor to make investments on our behalf that are risky or more speculative than would be the case in the absence of such compensation arrangement. The way in which the incentive fee payable from operations, sales or other sources is determined, which is calculated as a percentage of our net cash flows, may encourage our Advisor to use leverage to increase the return on our investments. Under certain circumstances, the use of leverage may increase the likelihood of default, which would disfavor our unitholders.
26
In evaluating investments and other management strategies, the opportunity to earn subordinated incentive compensation may lead our Advisor to place undue emphasis on the maximization of investment income at the expense of other criteria, such as preservation of capital, maintaining sufficient liquidity, or management of credit risk or market risk, in order to achieve higher subordinated incentive compensation. Investments with higher yield potential are generally riskier or more speculative. This could result in increased risk to the value of our investment portfolio.
Risks related to Tax Matters:
Our failure to be taxed as a partnership may result in adverse tax consequences for us and our investors.
We intend to be treated as a partnership (other than a publicly traded partnership) for federal income tax purposes and not as a corporation. We have not sought a ruling from the Internal Revenue Service, or IRS, on the tax treatment of us or our units, and such treatment as a partnership may not be sustained by a court if challenged by the IRS.
If we were taxable as a corporation, the “pass through” treatment of our income and losses would be lost. Instead, we would, among other things, pay income tax on our earnings in the same manner and at the same rate as a corporation, and our losses, if any, would not be deductible by the unitholders. Unitholders would be taxed upon distributions substantially in the manner that corporate shareholders are taxed on dividends.
Transfer restrictions imposed with respect to our interests and potential restructurings or agreements we enter into to avoid publicly traded partnership status, may adversely impact a unitholder’s ability to transfer or sell its units.
No transfer of an interest may be made if it would result in the Company being treated as a publicly traded partnership taxable as a corporation under the Internal Revenue Code of 1986, as amended, or the Code. We may, without the consent of any unitholder, amend our operating agreement in order to improve, upon advice of counsel, the Company’s position in avoiding such publicly traded partnership status for the Company (and we may impose time-delay and other restrictions on recognizing transfers or on repurchases pursuant to unit repurchase program as necessary to do so). Furthermore, we, upon advice of counsel, may restructure the Company (including the creation or liquidation of subsidiary entities) and/or enter into any agreements that we deem necessary, without the prior approval of the unitholders, if such activities are reasonably determined by us, in our sole discretion, to avoid the Company being characterized as a publicly traded partnership under the Code that is taxable as a corporation.
Unitholders may be allocated taxable income in excess of the cash available for distribution to them.
For U.S. federal income tax purposes, we may include in income certain amounts that we have not yet received in cash, such as original issue discount, which may arise if we receive warrants in connection with the making of a loan or possibly in other circumstances, or contracted payment-in-kind interest, which represents contractual interest added to the loan balance and due at the end of the loan term. Such original issue discount, which could be significant relative to our overall investment activities, or increases in loan balances as a result of contracted payment-in-kind arrangements, will be included in income before we receive any corresponding cash payments. We may also be required to include in income certain other amounts that we will not receive in cash. If a borrower defaults on a loan that is structured to provide accrued interest, it is possible that accrued interest previously reported as investment income will become uncollectible.
Since in certain cases we may recognize income before or without receiving cash representing such income, we may have difficulty paying investor distributions without resorting, in part or in whole, to borrowings or other sources of capital.
The payment of the distribution fee over time with respect to the Class C units, certain Class I units, and Class W units is deemed to be paid from cash distributions that would otherwise be distributable to such unitholders. Accordingly, the holders of Class C units, certain Class I units, and Class W units will receive a lower cash distribution to the extent of such unitholders’ obligation to pay such fees. Because the payment of such fees is not a deductible expense for tax purposes, the taxable income of the Company allocable to the Class C, certain Class I, and Class W unitholders may, therefore, exceed the amount of cash distributions made to such unitholders.
An audit or tax adjustment by the IRS may result in additional taxes or costs to the Company and our unitholders.
We have not requested and do not currently intend to request rulings from the IRS with respect to any of the U.S. federal income tax consequences to the Company or our unitholders. Thus, positions to be taken by the IRS as to any such tax consequences could differ from positions taken by us. If the IRS challenges certain U.S. federal income tax positions taken by us if we are audited any adjustment to our return resulting from such an audit would result in adjustments to tax returns of our unitholders and might result in an examination of items in such returns unrelated to their investment in the units or an examination of tax returns for prior or later years. Moreover, we and our unitholders could incur substantial legal and accounting costs in contesting any IRS challenge, regardless of the outcome. Our management generally will have the authority and power to act for, and bind the Company in connection with, any such audit or adjustment for administrative or judicial proceedings in connection therewith.
27
Pursuant to legislative changes enacted in the Bipartisan Budget Act of 2015, which are effective for tax years beginning in 2018, the IRS may, in certain circumstances, collect taxes (together with applicable interest and penalties) directly from the Company following a determination that the Company has underreported taxable income to our unitholders with respect to such years. The payment of such taxes by the Company would reduce the funds available for distribution by the Company, and could adversely affect the value of our units.
The Tax Cuts and Jobs Act may Adversely Affect the Company, its Subsidiaries or Unitholders
On December 22, 2017, President Trump signed into law P.L. 115-97, informally titled the Tax Cuts and Jobs Act (the “Tax Act”). The Tax Act makes significant changes to the Code, including a number of provisions that could affect the taxation of the Company, its subsidiaries or unitholders. The Tax Act limits the ability of taxpayers to utilize certain tax attributes, including the following:
|
|
• |
The amount of business interest expense that may be deducted in a particular year generally cannot exceed the sum of (i) the taxpayer’s business interest income, and (ii) 30% of its taxable income, as adjusted. |
|
|
• |
A new limitation restricts the ability of non-corporate taxpayers to deduct excess losses incurred in businesses. Any loss that is disallowed as an excess business loss is treated as a net operating loss carryover to the following tax year. |
|
|
• |
Net operating losses carried forward to a subsequent tax year may not reduce more than 80% of the income generated in the subsequent year. |
The Tax Act also requires taxpayers to recognize certain income for tax purposes not later than the taxable year in which such income is taken into account in an applicable financial statement, which may, in some cases, accelerate the taxation of our income. Also, although non-corporate owners of pass-through entities, including partnerships, are eligible for a new deduction under the Tax Act of up to 20% of their share of the amount of business income generated by the entity, this deduction will generally not be available to unitholders with respect to their income from the Company, which could adversely affect the value of units in the Company relative to investments in other pass-through vehicles. In addition, new provisions in the Tax Act that relate to the taxation of certain foreign earnings could, depending on their application to the Company or its subsidiaries, have adverse tax consequences.
Legislative or regulatory action could adversely affect our unitholders.
All statements contained in this Form 10-K concerning the expected U.S. federal income tax consequences of any investment in the Company are based upon existing law and the interpretations thereof. The income tax treatment of an investment in the Company may be modified by legislative, judicial or administrative changes, possibly with retroactive effect, to the detriment of the unitholders.
Our operations may result in reportable transactions for the Company and our unitholders.
Under regulations promulgated by the U.S. Treasury Department regulations, the activities of the Company may create one or more “reportable transactions,” requiring the Company and each unitholder, respectively, to file information returns with the IRS. We will give notice to all unitholders of any reportable transaction of which we become aware in the annual tax information provided to unitholders in order to file their tax returns.
Unitholders may be required to obtain U.S. federal income tax return filing extensions and to file tax returns in multiple jurisdictions.
We will use reasonable commercial efforts to cause all tax filings to be made in a timely manner (taking permitted extensions into account); however, investment in the Company may require the filing of tax return extensions. Unitholders may have to obtain one or more tax filing extensions if the Company does not deliver Schedule K-1 by the due date of the unitholders’ returns. Although our management will attempt to cause the Company to provide unitholders with estimated annual U.S. federal income tax information prior to March 15th as long as the Company’s taxable year is the calendar year, the Company may not obtain annual U.S. federal income tax information from all borrowers by such date and tax return extensions may be required to be filed by unitholders. Moreover, although estimates will be provided to the unitholders by the Company in good faith based on the information obtained from the borrowers, such estimates may be different from the actual final tax information and such differences could be significant, resulting in interest and penalties to the unitholders due to underpayment of taxes or loss of use of funds for an extended period of time due to overpayment of taxes. Furthermore, the Company’s activities may require unitholders to file in multiple jurisdictions if composite state returns are not filed by the Company. We may file composite state tax returns for the benefit of unitholders that elect to participate in the filing of such returns.
28
We may incur unrelated business taxable income which will be taxable to our tax –exempt investors.
Tax-exempt investors (such as an employee pension benefit plan or an IRA) may have Unrelated Business Taxable Income, or UBTI, from investments that are made by us. We have borrowed and may in the future borrow funds, which can lead to the generation of UBTI from debt financed property. We may also receive income from services rendered in connection with making loans, which is likely to constitute UBTI. We may acquire investments that generate UBTI and unitholders can expect some or all of their profits from the Company to be UBTI. Although we have attempted to structure our investments so as to minimize generating UBTI, there is no assurance that UBTI will not be generated from our investments. The Company will not be liable to tax-exempt investors for the recognition of UBTI.
Our operations may result in the Company being subject to foreign income taxes.
We have and may continue to conduct our activities in foreign jurisdictions and, in conjunction therewith, we have formed four subsidiaries to conduct such activities and we may form additional subsidiaries. The conduct of activities in foreign jurisdictions (whether or not foreign subsidiaries are formed to conduct such activities) may result in the Company or its subsidiaries being subject to tax in such foreign jurisdictions. Taxes paid by the Company in such foreign jurisdictions will reduce the cash available for distribution to the unitholders. However, because we are taxable as a partnership for U.S. federal income tax purposes, certain foreign income taxes paid by the Company may generate a foreign tax credit that will be allocated to each unitholder, which may be used to reduce, on a dollar-for-dollar basis, the tax liability of such unitholder.
Our operations may result in non-U.S. unitholders being subject to U.S. federal, state and local income and withholding tax and filing requirements.
We may generate income that is “effectively connected” with a U.S. trade or business, and, if so, a non-U.S. unitholder will generally be required to file an annual U.S. federal income tax return and pay U.S. federal income tax, in the same manner as a U.S. unitholder, with respect to such income. A U.S. federal withholding tax, at the highest applicable effective tax rate, generally will be imposed on a non-U.S. unitholder’s allocable share of such effectively connected income (whether or not such income is distributed). There also may be state or local tax withholding. Non-U.S. investors may also be subject to the provisions of the Foreign Investment in Real Property Tax Act of 1980, as amended, which generally treats any gain or loss of a non-U.S. person that is realized in connection with the (actual or constructive) disposition of a “U.S. real property interest” as gain or loss effectively connected with a U.S. trade or business engaged in by such non-U.S. person. A 30% U.S. “branch profits tax” will generally apply to an investment in the Company by non-U.S. unitholders that are corporations.
Risks related to the Investment Company Act:
We are not registered as an investment company under the Investment Company Act and, therefore, we will not be subject to the requirements imposed on an investment company by the Investment Company Act which may limit or otherwise affect our investment choices.
The Company and our subsidiaries will conduct our businesses so that none of such entities are required to register as “investment companies” under the Investment Company Act. Although we could modify our business methods at any time, at the present time we expect that the focus of our activities will involve investments in fixed-income assets and other loans of the nature described earlier.
Companies subject to the Investment Company Act are required to comply with a variety of substantive requirements including, but not limited to:
|
|
• |
limitations on the capital structure of the entity; |
|
|
• |
restrictions on certain investments; |
|
|
• |
prohibitions on transactions and restrictions on fees with affiliated entities; and |
|
|
• |
public reporting disclosures, record keeping, voting procedures, proxy disclosures, board operations and similar corporate governance rules and regulations. |
These and other requirements are intended to provide benefits and/or protections to security holders of investment companies. Because we and our subsidiaries do not expect to be subject to these requirements, you will not be entitled to these benefits or protections. It is our policy to operate in a manner that will not require us to register as an investment company, and we do not expect or intend to register as an investment company under the Investment Company Act.
Whether a company is an investment company can involve analysis of complex laws, regulations and SEC staff interpretations. We intend to conduct the Company’s operations so as not to become subject to regulation as an investment company under the Investment Company Act. So long as the Company conducts its businesses directly and through its wholly-owned or majority-owned subsidiaries that are not investment companies and none of the Company and the wholly-owned or majority-owned subsidiaries hold themselves
29
out as being engaged primarily in the business of investing in securities, the Company should not have to register. The securities issued by any subsidiary that is excepted from the definition of investment company under Section 3(c)(1) or Section 3(c)(7) of the Investment Company Act, together with any other “investment securities” (as used in the Investment Company Act) its parent may own, may not have a combined value in excess of 40% of the value of the parent entity’s total assets on an unconsolidated basis (which we refer to as the 40% test). In other words, even if some interests in other entities were deemed to be investment securities, so long as such investment securities do not comprise more than 40% of an entity’s assets, the entity will not be required to register as an investment company. If an entity held investment securities and the value of these securities exceeded 40% of the value of its total assets, and no other exemption from registration was available, then that entity might be required to register as an investment company.
We do not expect that we or any of our majority- or wholly-owned subsidiaries will be an investment company, and in particular, we will seek to assure that holdings of investment securities in the Company do not exceed 40% of the total assets of that entity as calculated under the Investment Company Act. In order to operate in compliance with that standard, we may be required to conduct our business in a manner that takes account of these provisions. In order for us to so comply, we or a subsidiary could be unable to sell assets we would otherwise want to sell or we may need to sell assets we would otherwise wish to retain, if we deem it necessary to remain in compliance with the 40% test. In addition, we may also have to forgo opportunities to acquire certain assets or interests in companies or entities that we would otherwise want to acquire, or acquire assets we might otherwise not select for purchase, if we deem it necessary to remain in compliance with the 40% test. For example, these restrictions will limit our ability to invest directly in certain types of assets, such as in securities that represent less than 50% of the voting securities (as used in the Investment Company Act) of the issuer thereof.
If the Company or any subsidiary owns assets that qualify as “investment securities” as such term is defined under the Investment Company Act and the value of such assets exceeds 40% of the value of its total assets, the entity could be deemed to be an investment company. In that case the entity would have to qualify for an exemption from registration as an investment company in order to operate without registering as an investment company. Certain of the subsidiaries that we may form in the future could seek to rely upon one of the exemptions from registration as an investment company under the Investment Company Act pursuant to Section 3(c)(5)(A) or Section 3(c)(5)(B) of the Investment Company Act. The exemption pursuant to Section 3(c)(5)(A) is available for entities “primarily engaged in the business of purchasing or otherwise acquiring notes, drafts, acceptances, open accounts receivable, and other obligations representing part or all of the sales price of merchandise, insurance, and services” (which we refer to as the 3(c)(5)(A) exemption), while the exemption pursuant to Section 3(c)(5)(B) is available for entities “primarily engaged in the business of making loans to manufacturers, wholesalers, and retailers of, and to prospective purchasers of, specified merchandise, insurance, and services” (which we refer to as the 3(c)(5)(B) exemption). Each of the 3(c)(5)(A) exemption and the 3(c)(5)(B) exemption generally requires that at least 55% of the assets of a subsidiary relying on such exemption be invested in eligible loans and receivables. To qualify for either of the foregoing exemptions, the subsidiary would be required to comply with interpretations issued by the staff of the SEC that govern the respective activities.
In addition to the exceptions discussed above, we and/or our subsidiaries may rely upon other exceptions and exemptions, including the exemptions provided by Section 3(c)(6) of the Investment Company Act (which exempts, among other things, parent entities whose primary business is conducted through majority-owned subsidiaries relying upon the 3(c)(5)(A) exemption and/or the 3(c)(5)(B) exemption discussed above) from the definition of an investment company and the registration requirements under the Investment Company Act.
The laws and regulations governing the Investment Company Act status of entities like the Company and our subsidiaries, including actions by the Division of Investment Management of the SEC providing more specific or different guidance regarding these exemptions, may change in a manner that adversely affects our operations. To the extent that the SEC staff provides more specific guidance regarding any of the matters bearing upon the exceptions discussed above or other exemptions from the definition of an investment company under the Investment Company Act upon which we may rely, we may be required to adjust our strategy accordingly. Any additional guidance from the SEC staff could provide additional flexibility to us, or it could further inhibit our ability to pursue the strategies we have chosen.
If the Company or any of our subsidiaries is required to register as an investment company under the Investment Company Act, the additional expenses and operational limitations associated with such registration may reduce our unitholders’ investment return or impair our ability to conduct our business as planned.
If we become an investment company or are otherwise required to register as such, we might be required to revise some of our current policies, or substantially restructure our business, to comply with the Investment Company Act. This would likely require us to incur the expense of holding a unitholder meeting to vote on such changes. Further, if we were required to register as an investment company, but failed to do so, we would be prohibited from engaging in our business, criminal and civil actions could be brought against us, some of our contracts might be unenforceable, unless a court were to direct enforcement, and a court could appoint a receiver to take control of us and liquidate our business.
30
Risks related to ERISA:
If our assets are deemed to be Employee Retirement Income Security Act of 1974, as amended (“ERISA”), plan assets, the Advisor and we may be exposed to liabilities under Title I of ERISA and the Code.
In some circumstances where an ERISA plan holds an interest in an entity, the assets of the entire entity are deemed to be ERISA plan assets unless an exception applies. This is known as the “look-through rule.” Under those circumstances, the obligations and other responsibilities of plan sponsors, plan fiduciaries and plan administrators, and of parties in interest and disqualified persons, under Title I of ERISA and Section 4975 of the Code, as applicable, may be applicable, and there may be liability under these and other provisions of ERISA and the Code. We believe that our assets will not be treated as plan assets because our units should qualify as “publicly-offered securities” that are exempt from the look-through rules under applicable Treasury Regulations. We note, however, that because certain limitations are imposed upon the transferability of our units, it is possible that this exemption may not apply. If that is the case, and if the Advisor or we are exposed to liability under ERISA or the Code, our performance and results of operations could be adversely affected. Prior to making an investment in us, our unitholders should consult with their legal and other advisors concerning the impact of ERISA and the Code on our unitholders’ investment and our performance.
Risks Relating to Investing in our Units:
The units sold will not be listed on an exchange for the foreseeable future, if ever. Therefore, it will be difficult for our unitholders to sell their units and, if they are able to sell their units, they will likely sell them at a substantial discount.
The units that may be offered by us are illiquid assets for which there is not expected to be any secondary market nor is it expected that any will develop in the future. Moreover, our unitholders should not rely on our unit repurchase program as a method to sell units promptly because our unit repurchase program includes numerous restrictions that limit the unitholders’ ability to sell our units to us, and our board of managers may amend, suspend or terminate our unit repurchase program at any time. In particular, the unit repurchase program provides that we may make repurchase offers only if our unitholders have held our units for a minimum of one year, we have sufficient funds available for repurchase from our distribution reinvestment plan and to the extent the total number of units for which repurchase is requested in any 12 month period does not exceed 5% of our weighted average number of outstanding units as of the same date in the prior 12 month period. Therefore, it will be difficult for our unitholders to sell their units promptly or at all. If our unitholders are able to sell their units, they may only be able to sell them at a substantial discount from the price they paid. Investor suitability standards imposed by certain states may also make it more difficult to sell units to someone in those states. The units should be purchased as a long-term investment only.
In the future, our board of managers may consider various forms of liquidity, each of which is referred to as a liquidity event, including, but not limited to: (1) dissolution and winding up distribution of our assets; (2) merger or sale of all or substantially all of our assets; or (3) the listing of units on a national securities exchange. If we do not consummate a liquidity event by August 25, 2021, we will be required to commence an orderly liquidation of the assets unless a majority of our board, including a majority of the independent managers, determines that liquidation is not in the best interests of our unitholders. Under such circumstances the commencement of an orderly liquidation will be postponed for one year. Further postponement of the liquidity event would only be permitted if a majority of our board, including a majority of independent managers, again determined that liquidation would not be in the best interest of our unitholders and our board must make a determination in this manner during each successive year until a liquidity event has occurred. If we at any time choose to seek but then fail to obtain unitholders’ approval of our liquidation, our operating agreement would not require us to consummate a liquidity event or liquidate and would not require our board to revisit the issue of liquidation, and we could continue to operate as before.
We may be unable to liquidate all assets. After we adopt a plan of liquidation, we would likely remain in existence until all our investments are liquidated. If we do not pursue a liquidity transaction, or delay such a transaction due to market conditions, our units may continue to be illiquid and our unitholders may, for an indefinite period of time, be unable to convert their investment to cash easily and could suffer losses on their investment.
Our unitholders will not have the opportunity to evaluate our investments before we make them, which makes investment in our units more speculative.
Our investments are selected by our sub-advisors and reviewed by our Advisor and our unitholders do not have input into such investment decisions, so our unitholders have to rely entirely on the ability of our Advisor and sub-advisors to select suitable and successful investment opportunities. Both of these factors will increase the uncertainty, and thus the risk, of investing in units.
Our unitholders will experience substantial dilution in the net tangible book value of their units equal to the offering costs associated with their units.
Our unitholders will incur immediate dilution, which will be substantial, equal to the costs of any offering associated with the sale of units. This means that the investors who have or will purchase units will pay a price per unit that substantially exceeds the amount
31
available with which to purchase assets and therefore, the value of these assets upon purchase. As of December 31, 2020, we have incurred a cumulative total of approximately $17.2 million in offering costs which has been reimbursed to our Sponsor.
Because of all the risks described in this section, investing in units may involve an above average degree of risk.
Because of all the risks described in this section, the investments we make in accordance with our investment objectives may result in a higher amount of risk than alternative investment options and volatility or loss of principal. Our investments may be highly risky and aggressive, and therefore, an investment in units may not be suitable for someone with lower risk tolerance.
Our unitholders may experience dilution.
Our unitholders do not have preemptive rights. If, as expected, we engage in a subsequent offering of units or securities convertible into units, issue units pursuant to our distribution reinvestment plan or otherwise issue additional units, investors who purchase units in this offering who do not participate in those other securities issuances will experience dilution in their percentage ownership of our outstanding units. Furthermore, unitholders may experience a dilution in the value of their units depending on the terms and pricing of any unit issuances and the value of our assets at the time of issuance.
The price for units redeemed pursuant to the Company’s unit repurchase program and issued pursuant to the DRP is the most recently disclosed estimated NAV per unit for such class of units, which may not equal the actual NAV per unit at the time of repurchase or reinvestment. The estimated NAV per unit may not be an accurate reflection of the fair market value of the Company’s assets and liabilities and likely will not represent the amount of net proceeds that would result if the Company liquidated or dissolved or the amount the Company’s unitholders would receive upon the sale of their units.
The price for units redeemed pursuant to the Company’s unit repurchase program and offered pursuant to the DRP is equal the most recently disclosed estimated NAV per unit of such class of units, which may not equal the actual NAV per unit on the date of repurchase or reinvestment due to the lag between the timing of the most recent NAV disclosure and the redemption or reinvestment. In addition, the estimated NAV per unit, as determined by our management in accordance with our valuation policies, may not be an accurate reflection of the fair value of the Company’s assets and liabilities in accordance with GAAP, may not reflect the price at which the Company would be able to sell all or substantially all of its assets or the outstanding units in an arm's length transaction, may not represent the value that the Company’s unitholders could realize upon a sale of the company or upon the liquidation of its assets and settlement of its liabilities, and may not be indicative of the price at which units would trade if they were listed on a national securities exchange. Further, our board of managers may determine the fair value of our assets completely or in part based upon internal valuation assessments and not independent valuation assessments, which may be materially different. In addition, the determination of fair value involves subjective judgments and estimates, which may not be accurate or complete.
We do not, and do not expect to, have research analysts reviewing our performance.
We do not, and do not expect to, have research analysts reviewing our performance or our securities on an ongoing basis. Therefore, our unitholders will not have an independent review of our performance and the value of our units relative to publicly traded companies.
General Risk Factors
Terrorist attacks, acts of war or national disasters may affect any market for units, impact the businesses in which we invest, and harm our business, operating results and financial conditions.
Terrorist acts, acts of war or national disasters have created, and continue to create, economic and political uncertainties and have contributed to global economic instability. Future terrorist activities, civil war, military or security operations, or national disasters could further weaken the domestic/global economies and create additional uncertainties in the regions in which we may invest, which may negatively impact the businesses in which we invest directly or indirectly and, in turn, could have a material adverse impact on our business, operating results and financial condition. Losses from terrorist attacks and national disasters are generally uninsurable.
The occurrence of cyber incidents, or a deficiency in our cyber security, could negatively impact our business by causing a disruption to our operations, a compromise or corruption of our confidential information, and/or damage to our business relationships, all of which could negatively impact our financial results.
A cyber incident is considered to be any adverse event that threatens the confidentiality, integrity, or availability of our information resources. More specifically, a cyber incident is an intentional attack or an unintentional event that can include gaining unauthorized
32
access to systems to disrupt operations, corrupt data, or steal confidential information. As our reliance on technology has increased, so have the risks posed to our systems, both internal and those we have outsourced. Our three primary risks that could directly result from the occurrence of a cyber incident include operational interruption, damage to our relationship with our borrowers, and private data exposure.
ITEM 1B. UNRESOLVED STAFF COMMENTS
This item is not applicable because the Company is not an accelerated filer, a large accelerated filer, or a well-known seasoned issuer.
We do not own or lease any properties. Our administrative and principal executive offices, which are located at 1230 Rosecrans Avenue, Suite 605, Manhattan Beach, CA 90266, are leased by our Sponsor.
As of December 31, 2020, the Company was not a party to any material legal proceedings other than the legal proceedings described in “Notes to Consolidated Financial Statements—Note 3. Investments—Watch List Investments".
ITEM 4. MINE SAFETY DISCLOSURES.
Not applicable.
33
ITEM 5. MARKET FOR REGISTRANT’S COMMON EQUITY, RELATED STOCKHOLDER MATTERS AND ISSUER PURCHASES OF EQUITY SECURITIES
Net Asset Value
There is no public trading market for our units.
We determine our net asset value on a quarterly basis. Our net asset value is determined by our board of managers based on the input of 1) our Advisor, 2) our audit committee, 3) an opinion of a third-party independent valuation firm as to the reasonableness of our internal estimates of fair value of selected loans and, 4) if engaged by our board of managers, one or more independent valuation firms. We may value our investments using different valuation approaches. We calculate our net asset value per unit by subtracting total liabilities from the total value of our assets on the date of valuation and dividing the result by the total number of outstanding units on the date of valuation. Our board of managers has determined our estimated net asset value, as of December 31, 2020, to be $7.600 per Class A, Class C, Class I, Class W, Class Y, and Class Z unit as compared to $8.024 per Class A, Class C, Class I, Class W, Class Y, and Class Z unit as of December 31, 2019. The decrease of $0.424 in the estimated net asset value from December 31, 2019 to December 31, 2020 resulted primarily due to the Company having recorded $15,037,022 in unrealized depreciation on our investments during the year ended December 31, 2020. Our net asset value would have decreased for all unit classes in all prior periods if the Sponsor had not absorbed and deferred reimbursement for a substantial portion of our operating expenses since we began our operations. Our estimated net asset value was determined in accordance with the procedures set forth above. See Note 2 to our Consolidated Financial Statements for more information about the valuation of our investments.
We are offering up to $75 million in Class A, Class C and Class I units pursuant to our Distribution Reinvestment Plan to the investors who have purchased units in the Offering. On March 7, 2018, our board of managers approved an amendment to our Distribution Reinvestment Plan, pursuant to which units issued pursuant to the Distribution Reinvestment Plan are being offered at the price equal to the net asset value per unit of each class of units most recently disclosed by the Company in a public filing with the SEC at the time of reinvestment. Prior to the amendment of our Distribution Reinvestment Plan, units were issued pursuant to the Distribution Reinvestment Plan at a price equal to the greater of $9.025 per unit or the net asset value per unit of each class, as most recently disclosed by the Company in a public filing with the SEC.
As of March 30, 2021, there were 18,086,989 Class A units outstanding held of record by 3,782 persons, 8,006,891 Class C units outstanding held of record by 1,965 persons, 10,509,265 Class I Units outstanding held of record by 1,891 persons, 24,555 Class W units outstanding held of record by 4 persons, 2,207,715 Class Y units outstanding held of record by 172 persons, and 8,423,851 Class Z units outstanding held of record by two persons. There were no outstanding options or warrants to purchase, or securities convertible into, our units.
Distributions
We pay distributions pursuant to the terms of our operating agreement on a monthly basis when declared by our board of managers. From time to time, we may also pay interim distributions at the discretion of our board. Distributions are subject to the board of managers’ discretion and applicable legal restrictions and accordingly, there can be no assurance that we will continue to make distributions at a specific rate or at all. Generally, our policy is to pay distributions from cash flow from operations. However, our organizational documents permit us to pay distributions from any source, including borrowings and offering proceeds, provided, however, that no funds will be advanced or borrowed for purpose of distributions, if the amount of such distributions would exceed our accrued and received revenues for the previous four quarters, less paid and accrued operating costs with respect to such revenues. We have not established a cap on the use of offering proceeds to fund distributions. If we pay distributions from sources other than cash flow from operations, we will have less funds available for investments and unitholders’ overall returns will be reduced.
Distributions are made on all classes of our units at the same time. The cash distributions received by our unitholders with respect to the Class C units, certain Class I units, and Class W units are and will continue to be lower than the cash distributions with respect to Class A and certain other Class I units because of the distribution fee relating to Class C units, an ongoing dealer manager fee with respect to certain Class I units and Class W units and an ongoing service fee with respect to Class W units, which is an expense specific to these units. The distributions paid with respect to these units will be lower until these ongoing fees are no longer payable. Amounts distributed to each class are allocated among the unitholders in such class in proportion to their units. Because the payment of such fees is not a deductible expense for tax purposes, the taxable income of the Company allocable to the Class C, certain Class I and Class W unitholders may, therefore, exceed the amount of cash distributions made to such unitholders.
Since July 2013, the Company has paid monthly distributions for all classes of units. For the year ended December 31, 2020 and 2019, $19,400,494 and $17,912,536, respectively, of these distributions were paid in cash and $9,274,239 and $9,507,647, respectively, were reinvested in units for those unitholders participating in the Company’s amended and restated distribution reinvestment plan (the “Distribution Reinvestment Plan”).
34
Unregistered Sales of Equity Securities and Use of Proceeds.
During the three months ended December 31, 2020, we sold an aggregate of 219,755 units of Class Y units to accredited investors for an aggregate amount of $1,694,000 pursuant to a private placement. The units were issued pursuant to an exemption from registration under Section 4(a)(2) of the Securities Act of 1933, as amended (the “Securities Act”), for transactions not involving a public offering.
Unit Repurchase Program
Beginning June 11, 2014, we commenced a unit repurchase program pursuant to which we conduct quarterly unit repurchases of up to 5% of our weighted average number of outstanding units in any 12-month period to allow our unitholders, who have held our units for a minimum of one year, to sell their units back to us. Our unit repurchase program includes numerous restrictions, including a one-year holding period, that limit our unitholders’ ability to sell their units. Additionally, we have no obligation to repurchase units if the repurchase would violate the restrictions on distributions under federal law or Delaware law, and all units to be repurchased under the program must be fully transferable and not be subject to any liens or other encumbrances and free from any restrictions on transfer. Unless our board of managers determines otherwise, we will limit the number of units to be repurchased during any calendar year to the number of units we can repurchase with the proceeds we receive from the sale of units under our distribution reinvestment plan. At the sole discretion of our board of managers, we may also use cash on hand, cash available from borrowings and cash from liquidation of investments as of the end of the applicable quarter to repurchase units.
On August 9, 2019, our board of managers amended and restated our unit repurchase program in order to amend the basis on which we will honor repurchase requests in the event repurchase requests exceed the existing limitations of the program. The amended and restated unit repurchase program took effect on September 30, 2019. Under the amended and restated unit repurchase program, if we cannot repurchase all units presented for repurchase in any quarter because of the limitations on repurchases set forth in the program, then we will honor repurchase requests in the following order of priority (unless our board of managers determines that we will not repurchase units in that quarter):
|
|
• |
first, we will repurchase units pursuant to repurchase requests made in connection with the death or disability of a unitholder (or on a pro rata basis among such requests if less than all of such death or disability requests can be satisfied); |
|
|
• |
second, we will repurchase units pursuant to any repurchase request that has been carried over from one or more previous quarterly periods where the value of the units that have not yet been repurchased pursuant to such request (with the value calculated as the number of units multiplied by the estimated net asset value per unit for units of that class, as most recently disclosed by us in a filing with the SEC) is less than $2,500 (or on a pro rata basis among such requests if less than all of such requests carried over from prior periods can be satisfied); and |
|
|
• |
third, we will repurchase units pursuant to all other repurchase requests on a pro rata basis. |
Unit repurchases are made on the last calendar day of the quarter at a price equal to the estimated net asset value per unit for each class of units, as most recently disclosed by us in a public filing with the SEC.
For the year ended December 31, 2020, the Company had received and processed 463 repurchase requests. The Company repurchased an aggregate of 399,251 Class A units, 259,441 Class C units, 497,682 Class I units and 27,593 Class Y units for a total of $9,253,053.
For the year ended December 31, 2019, the Company had received and processed 412 repurchase requests. The Company repurchased an aggregate of 647,648 Class A units, 446,469 Class C units, and 428,915 Class I units for a total of $12,440,304.
Repurchases for the first, second, third and fourth quarters of 2020 were repurchased at a price equal to $8.024, $7.804, $7.769 and $7.666, respectively per unit, which was the net asset value per unit of each class as of December 31, 2019, March 31, 2020, June 30, 2020 and September 30, 2020, respectively, and the most recently disclosed net asset value per unit at the time of repurchase in each respective quarter.
Our board of managers has the right to amend, suspend or terminate the unit repurchase program to the extent that it determines that it is in our best interest to do so. We will promptly notify our unitholders of any changes to the unit repurchase program, including any amendment, suspension or termination of it in our periodic or current reports or by means of other notice. Moreover, the unit repurchase program will terminate on the date that our units are listed on a national securities exchange, are included for quotation in a national securities market or, in the sole determination of our board of managers, a secondary trading market for the units otherwise develops.
35
During the three months ended December 31, 2020, we fulfilled the following requests pursuant to our unit repurchase program:
|
|
Total Number of Units Purchased |
|
|
Average Price Paid Per Unit |
|
|
Total Number of Units Purchased as Part of Publicly Announced Plans or Programs |
|
|
Maximum Number of Units that May Yet be Purchased Under the Program |
|
|||||
|
10/01/2020 - 10/31/2020 |
|
|
294,255 |
|
|
$ |
7.770 |
|
|
|
294,255 |
|
|
|
892,446 |
|
|
11/01/2020 - 11/30/2020 |
|
|
— |
|
|
$ |
- |
|
|
|
— |
|
|
|
892,446 |
|
|
12/01/2020 - 12/31/2020 |
|
|
— |
|
|
$ |
- |
|
|
|
— |
|
|
|
892,446 |
|
|
Total |
|
|
294,255 |
|
|
$ |
7.770 |
|
|
|
294,255 |
|
|
|
|
|
During the three months ended December 31, 2020, we repurchased 294,255 units for a total of $2,286,365. In addition, as of December 31, 2020, there were repurchase requests for a total of 297,746 units that were pending which were processed by the Company during January 2021 at a price of $7.666 per unit. For the quarter ended December 31, 2020, eligible repurchase requests exceeded the limitations of our unit repurchase program described above and the requests were fulfilled on a pro rata basis, such that we fulfilled 12.26% of eligible repurchase requests (based on the number of units submitted for repurchase). Pursuant to the terms of our unit repurchase program, the unsatisfied portion of repurchase requests that were not fulfilled at quarter-end were carried over to the next quarter and will be treated as a request for repurchase at the next quarter-end repurchase date, unless the repurchase request is withdrawn.
Distribution Reinvestment Plan
We have adopted the Distribution Reinvestment Plan pursuant to which our unitholders who have purchased Units in the Offering may elect to have the full amount of their cash distributions from us reinvested in additional units of the same class. On March 7, 2018, our board of managers approved an amendment to our distribution reinvestment plan, pursuant to which, commencing with distributions declared for the month of March 2018, units issued pursuant to the Distribution Reinvestment Plan are issued at the price equal to the net asset value per unit of each class of units, as most recently disclosed by the Company in a public filing with the SEC at the time of reinvestment.
Following the termination of the Offering, we have continued to offer units pursuant to our Distribution Reinvestment Plan. Although there are no distribution fees that are paid for any Class C units sold pursuant to the Distribution Reinvestment Plan, distribution fees have been and may be paid on an ongoing basis for Class C units sold pursuant to other Company offerings. Because distribution fees payable with respect to Class C units sold in other offerings are paid from and reduce the amount available for distribution on all Class C units, distributions will be reduced for Class C units purchased pursuant to the Distribution Reinvestment Plan. This will result in lower cash distributions with respect to the Class C units than the cash distributions with respect to Class A and certain Class I units. We may amend, suspend or terminate the distribution reinvestment plan at our discretion.
For the period from June 12, 2013 through December 31, 2020, we issued 5,967,587 units totaling approximately $50,909,000 of gross offering proceeds pursuant to our Distribution Reinvestment Plan.
ITEM 6. SELECTED FINANCIAL DATA
Not applicable.
ITEM 7. MANAGEMENT’S DISCUSSION AND ANALYSIS OF FINANCIAL CONDITION AND RESULTS OF OPERATIONS
The following discussion and analysis should be read in conjunction with our financial statements and related notes and other financial information appearing elsewhere in this annual report on Form 10-K.
Overview
We make impact investments in SMEs that provide the opportunity to achieve both competitive financial returns and positive measurable impact. We were organized as a Delaware limited liability company on April 30, 2012. We have operated and intend to continue to operate our business in a manner that will permit us to maintain our exemption from registration under the Investment Company Act of 1940, as amended. We use the proceeds raised from the issuance of units to invest in SMEs through local market sub-advisors in a diversified portfolio of financial assets, including direct loans, loan participations, convertible debt instruments, trade finance, structured credit and preferred and common equity investments. A substantial portion of our assets consists of collateralized private debt instruments, which we believe offer opportunities for competitive risk-adjusted returns and income generation. We are externally managed and advised by TriLinc Advisors, LLC, or the Advisor. The Advisor is an investment advisor registered with the SEC.
36
Our business strategy is to generate competitive financial returns and positive economic, social and environmental impact by providing financing to SMEs, which we define as those business having less than 500 employees, primarily in developing economies. To a lesser extent, we may also make impact investments in companies that may not meet our technical definition of SMEs due to a larger number of employees but that also provide the opportunity to achieve both competitive financial returns and positive measurable impact. We generally expect that such investments will have similar investment characteristics as SMEs as defined by us. Our style of investment is referred to as impact investing, which J.P. Morgan Global Research and Rockefeller Foundation in a 2010 report called “an emerging alternative asset class” and defined as investing with the intent to create positive impact beyond financial return. We believe it is possible to generate competitive financial returns while creating positive, measurable impact. We measure the economic, social and environmental impact of our investments using industry-standard metrics, including the Impact Reporting and Investment Standards. Through our investments in SMEs, we intend to enable job creation and stimulate economic growth.
We commenced the Offering on February 25, 2013. Pursuant to the Offering, we were offering on a continuous basis up to $1.5 billion in units of our limited liability company interest, consisting of up to $1.25 billion of units in the primary offering consisting of Class A and Class C units at initial offering prices of $10.00 and $9.576 per unit, respectively, and Class I units at $9.025 per unit, and up to $250 million of units pursuant to our Distribution Reinvestment Plan. SC Distributors, LLC was the dealer manager for the Offering. In May 2012, the Advisor purchased 22,161 Class A units for aggregate gross proceeds of $200,000. On June 11, 2013, we satisfied the minimum offering requirement of $2,000,000 when the Sponsor purchased 321,330 Class A units for aggregate gross proceeds of $2,900,000 and we commenced operations. The Offering terminated on March 31, 2017. Through the termination of the Offering, we raised approximately $361,776,000 in gross proceeds, including approximately $13,338,000 raised through our Distribution Reinvestment Plan.
Upon termination of the primary portion of the Offering, we registered $75 million in Class A, Class C and Class I units to continue to be offered pursuant to our Distribution Reinvestment Plan to the investors who have purchased units in the Offering. Units issued pursuant to our Distribution Reinvestment Plan are being offered at the price equal to the net asset value per unit of each class of units, as most recently disclosed by the Company in a public filing with the SEC at the time of reinvestment. Our Distribution Reinvestment Plan was amended, effective May 25, 2020, to allow holders of all classes of units other than Class Z units to participate, including holders who purchased units in our private placements. The offering must be registered or exempt from registration in every state in which we offer or sell units. If the offering is not exempt from registration, the required registration generally is for a period of one year. Therefore, we may have to stop selling units in any state in which the registration is not renewed annually and the offering is not otherwise exempt from registration.
From time to time we opportunistically seek to raise capital through sales of our common units in private placements that are exempt from registration under the Securities Act. For example, we currently are seeking to raise up to $100,000,000 in a continuous private offering of our Class Y and Class Z units that will expire on June 30, 2021, unless terminated earlier by us.
For the year ended December 31, 2020, we issued 1,181,117 of our units pursuant to our Distribution Reinvestment Plan for gross proceeds of approximately $9,274,000. In addition, for the year ended December 31, 2020, we issued 667,151 of our units for gross proceeds of approximately $5,276,000 pursuant to our ongoing private placement described above. As of December 31, 2020, $37,429,000 in units remained available for sale pursuant to the Distribution Reinvestment Plan.
For the year ended December 31, 2019, we issued 1,161,349 of our units pursuant to our Distribution Reinvestment Plan for gross proceeds of approximately $9,507,647. In addition, for the year ended December 31, 2019, we issued 2,591,049 of our units for gross proceeds of approximately $21,084,000 pursuant to a private placement.
From our inception to December 31, 2020, we have issued an aggregate of 52,774,702 of our units, including 5,967,587 units issued under our Distribution Reinvestment Plan, for gross proceeds of approximately $493,031,000 including approximately $50,909,000 reinvested under our Distribution Reinvestment Plan (before dealer manager fees of approximately $4,801,000 and selling commissions of $16,862,000), for net proceeds of $471,368,000.
Impact of COVID-19
There is an ongoing COVID-19 pandemic (more commonly referred to as the Coronavirus), which continues to adversely impact many industries and businesses directly or indirectly. Adverse impacts include disrupted global travel and supply chains, which adversely impact global commercial activity. Many businesses across the globe, have seen a downturn in production and productivity due to the suspension of business and temporary closure of offices and factories in an attempt to curb the spread of the Coronavirus. Any of these adverse developments could have a material adverse effect on our business, financial condition and results of operations. In addition, the extent of the impact of COVID-19 on the business, financial condition and results of operations of our borrowers may result in their inability to make required payments in the near term which could impact the fair value of our investments. Although multiple vaccines have been approved for use in certain countries, there is uncertainty as to when a sufficient portion of the population will be vaccinated such that restrictions and safety protocols can be relaxed. Although the Coronavirus has created material uncertainty and economic disruption, due to the rapidly evolving nature of the situation, we cannot predict the ultimate impact it will have on us. We are managing the situation through active engagement with our borrowers and are analyzing the potential effects COVID-19 may have on the portfolio or any potential capital deployments. Additionally, our Advisor has implemented its business continuity plan and additional procedures designed to protect against the introduction of the Coronavirus to the workforce, including
37
permitting and encouraging employees to work remotely, temporarily ceasing travel and significantly enhanced office sterilization procedures to minimize the probability of contagion.
As of the date of this report, COVID-19 has had a significant impact with respect to current and future payment performance with respect to 23.0% of the Company’s investments (based on the fair value of the investments as of December 31, 2020).
While many of our borrowers' businesses have experienced some disruption related to COVID-19, degrees of effect have varied to-date. As indicated in “Notes to Consolidated Financial Statements—Note 3. Investments—Watch List Investments," the borrowers with respect to three of the six investments we added to the Watch List for the year ended December 31, 2020 have not made required payments in part due to adverse impacts they have experienced related to the COVID-19 pandemic. Where appropriate, we and/or our sub-advisors are working with borrowers to restructure facilities and may restructure additional facilities to provide relief needed by certain borrowers, without necessarily providing concessions that are out of market. In the case of one investment, where efforts to reach an appropriate risk-adjusted restructuring have been unsuccessful, our sub-advisor issued a notice of default and acceleration notice, including the initiation of legal proceedings to recover amounts due.
Due to the disruptions associated with COVID-19, we can provide no assurances that we will be able to continue to collect interest and principal payments at levels comparable to those prior to the pandemic. Further, we can provide no assurances that we will be able to recover all past due amounts from delinquent borrowers. The economic uncertainty and disruption caused by the pandemic are expected to be prolonged and we may see further defaults and additional investments may be added to the Watch List in subsequent quarters. The adverse impact of COVID-19 was a significant contributor to the $0.424 decline in our NAV per unit as of December 31, 2020, as compared to our NAV per unit as of December 31, 2019.
In addition, we have seen, and expects to continue to see, a slowdown in transaction volume due to the impact of the pandemic, as smaller SMEs and those in industries most affected by COVID-19 (travel and hospitality, retail sales, etc.) may no longer be in a position to appropriately add debt capital. Transaction volumes may also be affected by restrictions on travel and other shelter in place orders, making it more difficult to conduct in-person visits with potential borrowers. Additionally, in future periods, we may hold higher levels of cash than before the pandemic to ensure we have sufficient cash available to meet our cash obligations. A potential slower pace of deployment or higher cash balances each have the potential to further reduce cash flow generated to cover our distributions to our unitholders and/or cause us to further reduce our NAV in future periods.
Investments
Our investment objectives are to provide our unitholders current income, capital preservation, and modest capital appreciation. These objectives are achieved primarily through SME trade finance and term loan financing, while employing rigorous risk-mitigation and due diligence practices, and transparently measuring and reporting the economic, social and environmental impacts of our investments. The majority of our investments are senior and other collateralized loans to SMEs with established, profitable businesses in developing economies. To a lesser extent, we may also make investments in financing to companies that may not meet our technical definition of SMEs due, for example, to the companies having a larger number of employees, but that also provide the opportunity to achieve both competitive financial returns and positive measurable impact. Furthermore, we may also make investments in developed economies, including the United States. With the sub-advisors that our Advisor has contracted with to assist the Advisor in implementing the Company’s investment program, we expect to provide growth capital financing generally ranging in size from $5-20 million per transaction for direct SME loans and $500,000 to $15 million for trade finance transactions. We seek to protect and grow investor capital by: (1) targeting countries with favorable economic growth and investor protections; (2) partnering with sub-advisors with significant experience in local markets; (3) focusing on creditworthy lending targets who have at least 3-year operating histories and demonstrated cash flows enabling loan repayment; (4) making primarily debt investments, backed by collateral and borrower guarantees; (5) employing best practices in our due diligence and risk mitigation processes; and (6) monitoring our portfolio on an ongoing basis. By providing additional liquidity to growing small businesses, we believe we support both economic growth and the expansion of the global middle class.
Investments will continue to be primarily credit facilities and participations in credit facilities to developing economy SMEs, including trade finance and term loans, through the Advisor’s team of professional sub-advisors with a local presence in the markets where they invest. As of December 31, 2020, more than a majority of our investments were in the form of participations and we expect that future investments will continue to be primarily participations. We typically provide financing that is collateralized, has a short to medium-term maturity and is self-liquidating through the repayment of principal. Our counterparty for participations generally will be the respective sub-advisor or its affiliate that originates the loan in which we are participating. We will not have a contract with the underlying borrower and therefore, in the event of default, we will not have the ability to directly seek recovery against the collateral and instead will have to seek recovery through our sub-advisor counterparty, which increases the risk of full recovery.
Certain investments, including loans and participations, may carry equity warrants on borrowers, which allow us to buy shares of the portfolio company at a given price, which we will exercise at our discretion during the life of the portfolio company. Our goal is to ultimately dispose of such equity interests and realize gains upon the disposition of such interests. However, these warrants and equity
38
interests are illiquid and it may be difficult for the Company to dispose of them. In addition, we expect that any warrants or other return enhancements received when we make or invest in loans may require several years to appreciate in value and may not appreciate at all.
LIBOR
In July 2017, FCA announced it intends to stop compelling banks to submit rates for the calculation of LIBOR. As a result, the U.S. Federal Reserve, in conjunction with ARRC, identified SOFR as its preferred alternative rate for LIBOR in derivatives and other financial contracts. We are not able to predict when LIBOR will cease to be available or when there will be sufficient liquidity in the SOFR markets. Any changes adopted by the FCA or other governing bodies in the method used for determining LIBOR may result in a sudden or prolonged increase or decrease in reported LIBOR. If that were to occur, interest rates of our debt could decrease, which could adversely affect our operating results. In addition, uncertainty about the extent and manner of future changes may result in interest rate that are higher or lower than if LIBOR were to remain available in the current form.
LIBOR is expected to be phased out or modified by June 2023, and the writing of contracts using LIBOR is expected to stop by the end of 2021. As of December 31, 2020, 17% of the fair value of the Company’s total investments bore interest at floating rates based on LIBOR. There can be no assurances as to whether such replacement or alternative rate will be more or less favorable than LIBOR. We intend to monitor the developments with respect to the potential phasing out of LIBOR after 2023 and work with our sub-advisors to seek to ensure any transition away from LIBOR will have minimal impact on our investments, but we can provide no assurances regarding the impact of the discontinuation of LIBOR.
Revenues
Since we anticipate that the majority of our assets will continue to consist of trade finance instruments and term loans, we expect that the majority of our revenue will continue to be generated in the form of interest. Our senior and subordinated debt investments may bear interest at a fixed or floating rate. Interest on debt securities is generally payable monthly, quarterly or semi-annually. In some cases, some of our investments provide for deferred interest payments or PIK interest. The principal amount of the debt securities and any accrued but unpaid interest generally is due at the maturity date. In addition, we generate revenue in the form of acquisition and other fees in connection with some transactions. Original issue discounts and market discounts or premiums are capitalized, and we accrete or amortize such amounts as interest income. We record prepayment premiums on loans and debt securities as interest income. Dividend income, if any, will be recognized on an accrual basis to the extent that we expect to collect such amounts.
Expenses
Our primary operating expenses include the payment of asset management fees and expenses reimbursable to our Advisor under the Advisory Agreement. We bear all other costs and expenses of our operations and transactions.
From our inception through December 31, 2017, under the terms of the Responsibility Agreement, our Sponsor assumed substantially all our operating expenses. Our Sponsor has not assumed any of our operating expenses subsequent to December 31, 2017. As of December 31, 2017, the Sponsor had agreed to pay a cumulative total of approximately $16.5 million of operating expenses, of which $16.1 million have not been reimbursed to the Sponsor as of December 31, 2020.
Portfolio and Investment Activity
During the year ended December 31, 2020, we invested approximately $25.5 million across four separate portfolio companies, including one new borrower. Our investments consisted of senior secured trade finance participations, senior secured term loan participations, senior secured term loans, short term notes, and equity warrants. Additionally, we received proceeds from repayments of investment principal of approximately $82.5 million.
During the year ended December 31, 2019, we invested approximately $37.8 million across nine portfolio companies. Our investments consisted of senior secured trade finance participations, senior secured term loan participations, senior secured term loans and short term investments. Additionally, we received proceeds from repayments of investment principal of approximately $76.9 million.
39
At December 31, 2020 and December 31, 2019, the Company’s investment portfolio included 41 and 43 companies, respectively, and the fair value of our portfolio was comprised of the following:
|
|
|
As of December 31, 2020 |
|
|
As of December 31, 2019 |
|
||||||||||
|
|
|
Investments |
|
|
Percentage of |
|
|
Investments |
|
|
Percentage of |
|
||||
|
|
|
at Fair Value |
|
|
Total Investments |
|
|
at Fair Value |
|
|
Total Investments |
|
||||
|
Senior secured term loans |
|
$ |
106,899,154 |
|
|
|
37.2 |
% |
|
$ |
83,353,208 |
|
|
|
24.5 |
% |
|
Senior secured term loan participations |
|
|
129,917,253 |
|
|
|
45.2 |
% |
|
|
180,500,425 |
|
|
|
53.1 |
% |
|
Senior secured trade finance participations |
|
|
45,800,210 |
|
|
|
15.9 |
% |
|
|
71,606,458 |
|
|
|
21.0 |
% |
|
Short term and other investments * |
|
|
3,758,063 |
|
|
|
1.3 |
% |
|
|
3,758,063 |
|
|
|
1.1 |
% |
|
Equity warrants |
|
|
1,199,618 |
|
|
|
0.4 |
% |
|
|
1,080,222 |
|
|
|
0.3 |
% |
|
Total investments |
|
$ |
287,574,298 |
|
|
|
100.0 |
% |
|
$ |
340,298,376 |
|
|
|
100.0 |
% |
|
* |
Short term investments are defined by the Company as investments that generally meet the standard underwriting guidelines for trade finance and term loan transactions and that also have the following characteristics: (1) maturity of less than one year, (2) loans to borrowers to whom, at the time of funding, the Company does not expect to re-lend. Impact data is not tracked for short term investments. |
As of December 31, 2020, the weighted average yields, based upon the cost of our portfolio, on trade finance participations, term loan participations, senior secured term loans, and short term investments were 10.4%, 12.3%, 11.4%, and 8.8%, respectively, for a weighted average yield on investments of approximately 11.6% on our total portfolio.
As of December 31, 2019, the weighted average yields, based upon the cost of our portfolio, on trade finance participations, term loan participations, senior secured term loans, and short term investments were 11.7%, 12.9%, 12.5%, and 8.8%, respectively, for a weighted average yield on investments of approximately 12.4% on our total portfolio.
Concentration Limits
We are subject to the following concentration limits as a percentage of total assets:
|
|
• |
Maximum 45% regional exposure |
|
|
• |
Maximum 20% country exposure |
|
|
• |
Maximum 5% individual investment exposure |
We may only make investments that do not cause us to exceed these limits on the date of investment. These limits are calculated as a percentage of the aggregate of all outstanding principal balances on our investments and our cash balances on the date of investment. As of December 31, 2020 and 2019, we were in compliance with all of the above concentration limits.
Watch List Investments
Please see “Notes to Consolidated Financial Statements—Note 3. Investments—Watch List Investments".
Interest Receivable
Depending on the specific terms of our investments, interest earned by us is payable either monthly, quarterly, or, in the case of most trade finance investments, at maturity. As such, some of our investments have up to a year or more of accrued interest receivable as of December 31, 2020. Our interest receivable balances at December 31, 2020 and 2019 are recorded at the amounts that we expect to collect. In addition, certain of our investment in term loans accrue deferred interest, which is not payable until the maturity of the loans. Accrued deferred interest included in the interest receivable balance as of December 31, 2020 and 2019 amounted to $3,418,264 and $2,796,466, respectively.
40
Results of Operations
Consolidated operating results for the years ended December 31, 2020 and 2019 are as follows:
|
|
|
Year Ended |
|
|||||
|
|
|
December 31, 2020 |
|
|
December 31, 2019 |
|
||
|
Investment income |
|
|
|
|
|
|
|
|
|
Interest income |
|
$ |
42,240,413 |
|
|
$ |
43,428,233 |
|
|
Interest from cash |
|
|
96,445 |
|
|
|
96,897 |
|
|
Total investment income |
|
|
42,336,858 |
|
|
|
43,525,130 |
|
|
Expenses |
|
|
|
|
|
|
|
|
|
Asset management fees |
|
|
7,334,178 |
|
|
|
7,702,572 |
|
|
Incentive fees |
|
|
5,320,776 |
|
|
|
5,730,748 |
|
|
Professional fees |
|
|
3,842,481 |
|
|
|
3,609,067 |
|
|
General and administrative expenses |
|
|
1,414,586 |
|
|
|
1,509,686 |
|
|
Interest expense |
|
|
254,682 |
|
|
|
1,660,095 |
|
|
Board of managers fees |
|
|
257,500 |
|
|
|
257,500 |
|
|
Total expenses |
|
|
18,424,203 |
|
|
|
20,469,668 |
|
|
Net investment income |
|
$ |
23,912,655 |
|
|
$ |
23,055,462 |
|
Revenues
For the years ended December 31, 2020 and 2019, total investment income amounted to $42,336,858 and $43,525,130, respectively. Interest income decreased by $1,187,820 during 2020 as a result of a decrease in our weighted average investment portfolio of approximately $7,243,000 and decrease in the weighted average yield of approximately 0.5% from a weighted average yield of 12.1% for 2019 to approximately 11.6% for 2020. The decrease in the average size of our portfolio during year ended December 31, 2020 was due to investment repayments that were not redeployed. The decrease in yield was primarily due to a change in the mix of investments and lower interest rates in our portfolio.
During the year ended December 31, 2020, $28,152,629 or 66.7% of the interest income earned came from loan and trade finance participations and $14,087,784 or 33.3% came from direct loans. In addition, we earned $96,445 in interest income on our cash balances.
During the year ended December 31, 2019, $32,495,008 or 75.1% of the interest income earned came from loan and trade finance participations and $10,933,226 or 24.9% came from direct loans. In addition, we earned $96,897 in interest income on our cash balances.
Expenses
Total operating expenses, excluding the asset management and incentive fees, incurred for the year ended December 31, 2020 decreased by $1,267,099 to $5,769,249 from $7,036,348 for the year ended December 31, 2019. The decrease was primarily due to the following: 1) a decrease in interest expense of $1,405,413, which was attributable to a decrease in outstanding indebtedness, 2) a decrease in general and administrative expenses of $95,100 which was primarily due to a decrease in travel expenses, offset by 3) an increase in professional fees of $233,414 which was primarily due to more fees incurred for legal, valuation and accounting services in connection with the valuation of our portfolio and our ongoing efforts to recover amounts outstanding with respect to investments for which IIG was the sub-advisor.
For the years ended December 31, 2020 and 2019, the asset management fees amounted to $7,334,178 and $7,702,572, respectively. The incentive fees for the years ended December 31, 2020 and 2019 amounted to $5,320,776 and $5,730,748, respectively. The decrease in incentive fees is due to the decrease in revenue during the year ended December 31, 2020.
Net Realized Gains or Losses and Net Change in Unrealized Appreciation or Depreciation on Investments.
We measure net realized gains or losses by the difference between the net proceeds from the repayment or sale of an investment and the amortized cost basis of the investment, without regard to unrealized appreciation or depreciation previously recognized, but considering unamortized upfront fees and prepayment penalties. Net change in unrealized appreciation or depreciation reflects the change in portfolio investment fair market values during the reporting period, including any reversal of previously recorded unrealized appreciation or depreciation, when gains or losses are realized. We had no realized gains or losses for the years ended December 31, 2020 and 2019. We recorded unrealized losses of $15,037,022 and $4,809,906 for the years ended December 31, 2020 and 2019, respectively. These unrealized losses were primarily driven by macro events, including the uncertainty created by the COVID-19
41
pandemic and its impact on the future cash flows generated by our investments as well as the ultimate realization of the underlying collateral.
Financial Condition, Liquidity and Capital Resources
As of December 31, 2020, we had approximately $55.0 million in cash. We generate cash primarily from cash flows from interest, dividends and fees earned from our investments and principal repayments, proceeds from sales of our investments and from sales of promissory notes, and proceeds from private placements of our units. We may also generate cash in the future from debt financing. Our primary use of cash will be to make loans, either directly or through participations, payments of our expenses, payments on our notes and any other borrowings, and cash distributions to our unitholders. We expect to maintain cash reserves from time to time for investment opportunities, working capital and distributions. As noted above, the combination of a slower pace of deployment of capital with higher cash balances may further reduce cash flows generated to cover our distributions to our unitholders and/or cause us to further reduce our NAV in future periods. From the beginning of the Company’s operations to date, our Sponsor has assumed a significant portion of our operating expenses under the Responsibility Agreement in the amount of approximately $16.5 million. The Company may only reimburse the Sponsor for expenses assumed by the Sponsor pursuant to the Responsibility Agreement to the extent the Company’s investment income in any quarter, as reflected on the statement of operations, exceeds the sum of (a) total distributions to unitholders incurred during the quarter and (b) the Company’s expenses as reflected on the statement of operations for the same quarter (the “Reimbursement Hurdle”). To the extent the Company is not successful in satisfying the Reimbursement Hurdle, no amount will be payable in that quarter by the Company for reimbursement to the Sponsor of the Company’s cumulative operating expenses. The Company did not meet the Reimbursement Hurdle for the quarter ended December 31, 2020. Therefore, none of the expenses of the Company covered by the Responsibility Agreement have been recorded as expenses of the Company for the quarter ended December 31, 2020. As of December 31, 2020, there is a remaining aggregate balance of approximately $16,091,300 in operating expenses assumed by the Sponsor pursuant to the Responsibility Agreement which have not been recorded by the Company. Thus, such amounts are not yet reimbursable by the Company to the Sponsor. Such reimbursements to the Sponsor would affect the amount of cash available to the Company to pay distributions and/or make investments.
We may borrow additional funds to make investments. We have not decided to what extent going forward we will finance portfolio investments using debt or the specific form that any such financing would take, but we believe that obtaining financing is necessary for us to fully achieve our long-term goals. We have been, and still are, actively seeking further financing through both development banks and several commercial banks. Accordingly, we cannot predict with certainty what terms any such financing would have or the costs we would incur in connection with any such arrangement. On August 7, 2017, TGIFC issued $5 million in the first of a Series 1 Senior Secured Promissory Notes private offering to State Street Australia Ltd ACF Christian Super (“Christian Super”). On December 18, 2018, TGIFC issued $5 million of Series 2 Senior Secured Promissory Notes to Christian Super. As of December 31, 2020, TGIFC has $5.0 million total outstanding under the Christian Super notes. For more information on this note, please see “Notes to Consolidated Financial Statements— Note 7. Notes Payable—Christian Super Promissory Note.” As of December 31, 2020, we had $5,000,000 in total debt outstanding with a debt to equity ratio of 1.4%.
Contractual Obligations and Commitments
The following table shows our payment obligations for repayment of debt, which represent our total contractual obligations as of December 31, 2020:
|
|
|
Total |
|
|
Less than 1 Year |
|
|
1 - 3 Years |
|
|
3- 5 years |
|
|
More than 5 years |
|
|||||
|
Notes payable |
|
$ |
5,000,000 |
|
|
$ |
- |
|
|
$ |
5,000,000 |
|
|
$ |
- |
|
|
$ |
- |
|
|
Total contractual obligations |
|
$ |
5,000,000 |
|
|
$ |
- |
|
|
$ |
5,000,000 |
|
|
$ |
- |
|
|
$ |
- |
|
We have included the following information to further assist investors in understanding our outstanding commitments.
We have entered into certain contracts under which we have material future commitments. Our Advisory Agreement between us and the Advisor, originally dated as of February 25, 2014, had previously been renewed and is subject to an unlimited number of one-year renewals upon mutual consent of the Company and the Advisor. The current term of the Advisory Agreement ends on February 25, 2022. The Advisor will serve as our advisor in accordance with the terms of our Advisory Agreement. Payments under our Advisory Agreement in each reporting period will consist of (i) asset management and incentive fees described in Part 1, Item 1. Business – Operating Expense Responsibility Agreement and – Investment Advisory Agreements and Fees of our Annual Report on Form 10-K for the year ended December 31, 2019, and (ii) the reimbursement of certain expenses.
If any of our contractual obligations discussed above are terminated, our costs may increase under any new agreements that we enter into as replacements. We would also likely incur expenses in locating alternative parties to provide the services we expect to receive under our Advisory Agreement.
42
Off-Balance Sheet Arrangements
Other than contractual commitments and other legal contingencies incurred in the normal course of our business, we do not expect to have any off-balance sheet financings or liabilities. The Company reimburses organization and offering expenses to the Sponsor to the extent that the aggregate of selling commissions, dealer manager fees and other organization and offering costs do not exceed 15.0% of the gross offering proceeds raised from the particular offering. As of December 31, 2020, there is a remaining balance of approximately $446,000 of offering costs that have not been reimbursed to the Sponsor.
Pursuant to the terms of the Responsibility Agreement between the Company, the Advisor and the Sponsor, the Sponsor has paid expenses on behalf of the Company through December 31, 2017, which may not be reimbursable to the Sponsor if the Company does not satisfy the Reimbursement Hurdle. Such expenses will be expensed and payable by the Company in the period they become reimbursable and are estimated to be approximately $16.1 million as of December 31, 2020.
Distributions
We have paid distributions commencing with the month beginning July 1, 2013, and we intend to continue to pay distributions on a monthly basis. From time to time, we may also pay interim distributions at the discretion of our board. Distributions are subject to the board of managers’ discretion and applicable legal restrictions and accordingly, there can be no assurance that we will make distributions at a specific rate or at all. Distributions are made on all classes of our units at the same time. The cash distributions received by our unitholders with respect to the Class C units, Class W units and certain Class I units, are and will continue to be lower than the cash distributions with respect to Class A and certain other Class I units because of the distribution fee relating to Class C units, the ongoing dealer manager fee relating to Class W units and Class I units issued pursuant to a private placement and the ongoing service fee relating to the Class W units, which are expenses specific to those classes of units. Amounts distributed to each class are allocated among the unitholders in such class in proportion to their units. Distributions are paid in cash or reinvested in units, for those unitholders participating in the Distribution Reinvestment Plan. For the year ended December 31, 2020, we paid a total of $28,674,733 in distributions, comprised of $19,400,494 paid in cash and $9,274,239 reinvested under our Distribution Reinvestment Plan.
Related Party Transactions
For the years ended December 31, 2020 and 2019, the Advisor earned $7,334,178, and $7,702,572, respectively, in asset management fees and $5,320,776 and $5,730,748, respectively, in incentive fees.
From our inception through September 30, 2017, pursuant to the terms of the Responsibility Agreement, the Sponsor has paid approximately $12,420,600 of operating expenses, asset management fees, and incentive fees on our behalf and will reimburse us an additional $4,057,734 of expenses, which we had paid as of September 30, 2017. Such expenses, in the aggregate of $16,091,300 since the Company’s inception, may be expensed and payable by the Company to the Sponsor only if the Company satisfies the Reimbursement Hurdle. The Company did not meet the Reimbursement Hurdle for the quarter ended December 31, 2020. Therefore, none of the expenses of the Company covered by the Responsibility Agreement have been recorded as expenses of the Company for the quarter ended December 31, 2020.
As of December 31, 2020 and December 31, 2019, due from affiliates on the Consolidated Statements of Assets and Liabilities in the amount of $4,057,734 and $4,240,231, respectively was due from the Sponsor pursuant to the Responsibility Agreement for operating expenses which were paid by the Company, but, under the terms of the Responsibility Agreement, are the responsibility of the Sponsor. The Sponsor anticipates paying this receivable in the due course of business.
For the years ended December 31, 2020 and 2019, we paid SC Distributors, the dealer manager for certain of our offerings, $468,000 and $577,000, respectively in ongoing distributions fees, dealer manager fees and service fees.
Legal Proceedings
As of December 31, 2020, the Company was not a party to any material legal proceedings other than as set forth in “Notes to Consolidated Financial Statements—Note 3. Investments—Watch List Investments".
Critical Accounting Policies and Use of Estimates
In preparing our Consolidated Financial Statements in accordance with GAAP and pursuant to the rules and regulations promulgated by the SEC, we make assumptions, judgments and estimates that can have a significant impact on our net income/loss and affect the reported amounts of certain assets, liabilities, revenue and expenses, and related disclosures. On an ongoing basis, we evaluate our estimates and discuss our critical accounting policies and estimates with the audit committee of our board of managers. We base our estimates on historical experience and various other assumptions that we believe to be reasonable under the circumstances. Actual results could differ materially from these estimates under different assumptions or conditions.
43
There have been no significant changes to our critical accounting policies, estimates and judgments during year ended December 31, 2020, compared to the critical accounting policies, estimates and judgments disclosed in “Management’s Discussion and Analysis of Financial Condition and Results of Operations” included in our Annual Report on Form 10-K for the year ended December 31, 2019.
The preparation of financial statements in conformity with GAAP requires the Company's management to make estimates and assumptions that affect the amounts reported in the financial statements. Although these estimates are based on management's knowledge of current events and actions it may undertake in the future, actual results may differ from these estimates. In particular, the COVID-19 pandemic has adversely impacted and is likely to further adversely impact the Company's business, the businesses of the Company's borrowers and the global markets generally. The full extent to which the pandemic will directly or indirectly impact the Company's business, results of operations and financial condition, including fair value measurements, will depend on future developments that are highly uncertain and difficult to predict. These developments include, but are not limited to, the duration and spread of the outbreak, its severity, the actions to contain the virus or address its impact, governmental actions to contain the spread of the pandemic and respond to the reduction in global economic activity, and how quickly and to what extent normal economic and operating conditions can resume.
Revenue Recognition
We record interest income on an accrual basis to the extent that we expect to collect such amounts. We do not accrue interest if there is reason to doubt the ability to collect such interest. Structuring, upfront and similar fees are recorded as a discount on investments purchased and are accreted into interest income, on a straight line basis, which we have determined not to be materially different from the effective yield method.
We record prepayment fees for loans and debt securities paid back to us prior to the maturity date as interest income upon receipt.
We generally place loans on non-accrual status when principal and interest are past due 90 days or more or when there is a reasonable doubt that principal or interest will be collected. If, however, management believes the principal and interest will be collected, a loan may be left on accrual status during the period we are pursuing repayment of the loan. Accrued interest is generally not reversed when a loan is placed on non-accrual. Interest payments received on non-accrual loans may be recognized as income or applied to principal depending upon management’s judgment of the financial condition of the borrower. Non-accrual loans are generally restored to accrual status when past due principal and interest is paid and, in our management’s judgment, is likely to remain current over the remainder of the term.
Valuation of Investments
We account for all of our investments at fair value with changes in fair value recognized in the consolidated statement of operations. Fair value is the price that would be received when selling an asset or paid to transfer a liability in an orderly transaction between market participants at the measurement date. We have categorized our investments into a three-level fair value hierarchy as discussed in Note 2.
Most of our investments are loans to private companies, which are not actively traded in any market and for which quotations are not available. For those investments for which market quotations are not readily available, or when such market quotations are deemed by the Advisor not to represent fair value, our board of managers has approved a multi-step valuation process to be followed each fiscal quarter, as described below:
|
|
1. |
Each investment is valued by the Advisor in collaboration with the relevant sub-advisor; |
|
|
2. |
For all investments with a stated maturity of greater than 12 months, we engage a third-party independent valuation firm to perform certain limited procedures that we have identified and requested the independent valuation firm perform a review on the reasonableness of our internal estimates of fair value on each asset on a quarterly rotating basis, with each of such investments being reviewed at least annually. In addition, the Company engaged an independent valuation firm to perform certain limited procedures that the Company identified and requested the independent valuation firm to perform to provide an estimate of the range of fair value of material investments on the Watch List. The analysis performed by the independent valuation firm was based upon data and assumptions provided to it by us and received from third party sources, which the independent valuation firm relied upon as being accurate without independent verification. The results of the analyses performed by the independent valuation firm are among the factors taken into consideration by the Company and its management in making its determination with respect to the fair value of such investments, but are not determinative. The Company and its management are solely and ultimately responsible for determining the fair value of the Company’s investments in good faith; |
|
|
3. |
The audit committee of our board of managers reviews and discusses the preliminary valuation prepared by the Advisor and any report rendered by the independent valuation firm; and |
44
|
|
4. |
The board of managers discusses the valuations and determines the fair value of each investment in our portfolio in good faith based on the inputs which include but are not limited to, inputs of the Advisor, the independent valuation firm and the audit committee. Our board of managers and we are solely and ultimately responsible for the determination, in good faith, of the fair value of each investment. |
Below is a description of factors that our board of managers may consider when valuing our investments.
Any potential valuation adjustments are subject to a materiality threshold as determined by the Advisor. Due to the fact that all non-Watch List investments are performing loans, with no macroeconomic indicator or other event observed that would reasonably be expected to have a material impact on the underlying performance or collateral value of the investment, most of these investments generally do not deviate materially from the amortized cost. If, pursuant to our quarterly review, we determine that one or more material valuation adjustments are appropriate, then we adjust the fair value. Historically, in most cases these adjustments that have resulted in a fair value that is materially different from amortized cost have resulted in our determination to place the investment on the Watch List.
Fixed income investments are typically valued utilizing a market approach, income approach, collateral based approach, or a combination of these approaches (and any others, as appropriate). The market approach uses prices and other relevant information generated by market transactions involving identical or comparable assets or liabilities (including the sale of a business) and is used less frequently due to the private nature of our investments. The income approach uses valuation techniques to convert future amounts (for example, interest and principal payments) to a single present value amount (Discounted Cash Flow or “DCF”) calculated based on an appropriate discount rate. The measurement is based on the net present value indicated by current market expectations about those future amounts. For Watch List investments, we may use a collateral based approach (also known as a liquidation or net recovery approach). The collateral based approach uses estimates of the collateral value of the borrower’s assets using an expected recovery model. When using the collateral based approach, we determine the fair value of the remaining assets, discounted to reflect the anticipated amount of time to recovery and the uncertainty of recovery. We also may make further adjustments to account for anticipated costs of recovery, including legal fees and expenses. In following a given approach, the types of factors that we may take into account in valuing our investments include, as applicable:
|
|
• |
Macro-economic factors that are relevant to the investment or the underlying borrower |
|
|
• |
Industry factors that are relevant to the investment or the underlying borrower |
|
|
• |
Historical and projected financial performance of the borrower based on most recent financial statements |
|
|
• |
Borrower draw requests and payment track record |
|
|
• |
Loan covenants, duration and drivers |
|
|
• |
Performance and condition of the collateral (nature, type and value) that supports the investment |
|
|
• |
Sub-Advisor recommendation as to possible impairment or reserve, including updates and feedback |
|
|
• |
For participations, our ownership percentage of the overall facility |
|
|
• |
Key inputs and assumptions that are believed to be most appropriate for the investment and the approach utilized |
|
|
• |
Applicable global interest rates |
|
|
• |
Impact of investments placed on non-accrual status |
With respect to warrants and other equity investments, as well as certain fixed income investments, we may also look to private merger and acquisition statistics, public trading multiples discounted for illiquidity and other factors, valuations implied by third-party investments in the portfolio companies, option pricing models or industry practices in determining fair value. We may also consider the size and scope of a portfolio company and its specific strengths and weaknesses, as well as any other factors we deem relevant in measuring the fair values of our investments.
Recent Accounting Pronouncements
See Note 2 to our accompanying Consolidated Financial Statements for a description of recent accounting pronouncements and our expectation of their impact on our results of operations and financial condition.
Subsequent Events
Please see “Notes to Consolidated Financial Statements—Note 11. Subsequent Events".
45
ITEM 7A. QUANTITATIVE AND QUALITATIVE DISCLOSURES ABOUT MARKET RISK
Not applicable
See the Consolidated Financial Statements beginning on page F-1.
ITEM 9. CHANGES IN AND DISAGREEMENTS WITH ACCOUNTANTS ON ACCOUNTING AND FINANCIAL DISCLOSURE
None.
ITEM 9A. CONTROLS AND PROCEDURES
Evaluation of Disclosure Controls and Procedures
The Company’s management, with the participation of the Company’s Chief Executive Officer and Chief Financial Officer, has evaluated the effectiveness of the Company’s disclosure controls and procedures (as defined in Rules 13a-15(e) and 15d-15(e) of the Exchange Act) as of the end of the period covered by this report. Based upon such evaluation, the Company’s Chief Executive Officer and Chief Financial Officer concluded that the Company’s disclosure controls and procedures were effective.
Internal Control Over Financial Reporting
The Company’s management is responsible for establishing and maintaining adequate internal control over financial reporting for the Company (as defined in Rule 13a-15(f) and 15d-15(f) of the Exchange Act). Internal control over financial reporting is a process designed to provide reasonable assurance regarding the reliability of financial statements for external purposes in accordance with accounting principles generally accepted in the United States of America. Internal control involves maintaining records that accurately represent our business transactions, providing reasonable assurance that receipts and expenditures of company assets are made in accordance with management authorization, and providing reasonable assurance that unauthorized acquisition, use or disposition of company assets that could have a material effect on our financial statements would be detected or prevented on a timely basis.
Because of its innate limitations, internal control over our financial statements is not intended to provide absolute guarantee that a misstatement can be detected or prevented on the statements. Therefore, even those systems determined to be effective can provide only reasonable assurance with respect to financial statement preparation and presentation. Also projections of any evaluation of effectiveness to future periods are subject to risk that controls may become inadequate because of changes in condition, or that the degree of compliance with the policies or procedures may deteriorate.
Under the supervision and with the participation of management, including the Company’s Chief Executive Officer and Chief Financial Officer, we conducted an evaluation of the effectiveness of our internal control over financial reporting based on the framework in Internal Control – Integrated Framework (2013) issued by the Committee of Sponsoring Organizations of the Treadway Commission (COSO). Based on this evaluation and those criteria, the management concluded that the Company’s internal control over financial reporting was effective as of December 31, 2020.
Changes in Internal Control Over Financial Reporting
There have not been any changes in our internal control over financial reporting (as such term is defined in Rules 13a-15(f) and 15d-15(f) under the Exchange Act) during the three months ended December 31, 2020 that have materially affected, or are reasonably likely to materially affect, our internal control over financial reporting.
As a result of COVID-19, starting in March 2020, our Advisor has implemented its business continuity plan and additional procedures designed to protect against the introduction of COVID-19 amongst its personnel, including permitting and encouraging employees to work remotely and temporarily ceasing travel and significantly enhanced office sterilization procedures to minimize the probability of contagion. The cessation of travel has caused us to adapt the methods we use to review our sub-advisors and investments. While our pre-existing controls were not specifically designed to operate in a predominantly remote work operating environment with no international travel, we have re-evaluated and adapted our review and reporting processes for this environment and we believe that our disclosure controls and procedures and internal controls over financial reporting continue to be effective. We are monitoring and assessing our internal control environment to ensure that our controls continue to be designed effectively and continue to operate effectively throughout the duration of the pandemic.
46
None
47
ITEM 10. DIRECTORS, OFFICERS AND CORPORATE GOVERNANCE.
Board of Managers
We operate under the direction of our board of managers, whose members are accountable to us and to our unitholders as fiduciaries. The board is responsible for the direction and control of our affairs. The board has engaged our Advisor to manage our day-to-day affairs and our portfolio of investment assets, subject to the board’s supervision. Because of the conflicts of interests created by the relationships between us and our Advisor and its affiliates, certain of the responsibilities of the board have been delegated to a committee comprised exclusively of independent managers.
We currently have five managers on our board of managers, three of whom are independent of us, our Advisor, our Sponsor and our respective affiliates. Our full board of managers has determined that each of our independent managers is independent in accordance with our operating agreement. Our operating agreement defines an “independent manager” as a person who has not been, directly or indirectly associated with our Sponsor or the Advisor within previous two years by virtue of:
|
|
• |
ownership interests in our Sponsor, our Advisor or any of their affiliates, other than any compensation received for being a manager or director as permitted below; |
|
|
• |
employment by our Sponsor, our Advisor or any of their affiliates; |
|
|
• |
service as an officer, director or manager of our Sponsor, our Advisor or any of their affiliates, other than as a manager or director for us and up to two other funds organized by our Sponsor or advised by our Advisor with securities registered under the federal securities laws; |
|
|
• |
performance of services, other than as our manager; or |
|
|
• |
maintenance of a material business or professional relationship with our Sponsor, our Advisor or any of their affiliates. |
We refer to our managers who are not independent as our “affiliated managers.” Our operating agreement sets forth the material business or professional relationships that cause a person to be affiliated with us and therefore not eligible to serve as an independent manager. A business or professional relationship is per se material if the prospective independent manager received more than five percent of his or her annual gross income in the last two years from our Sponsor, our Advisor or any affiliate of our Sponsor or our Advisor, or if more than five percent of his or her net worth, on a fair market value basis, has come from our Sponsor, our Advisor or any affiliate of our Sponsor or our Advisor.
The board of managers may increase the number of managers and fill any vacancy on the board of managers, whether resulting from an increase in the number of managers or otherwise. Any vacancies on our board of managers may be filled only by the affirmative vote of a majority of the remaining managers in office, even if the remaining managers do not constitute a quorum. Any replacements for vacancies among the independent managers will be nominated by the remaining independent managers. In addition, our unitholders, by a majority vote, may remove a manager and elect a new manager.
Our managers are accountable to us and to our unitholders as fiduciaries. This means that each manager must perform his or her duties in good faith and in a manner that each manager considers to be in our best interest and in the best interests of the unitholders. Our managers have a fiduciary responsibility for the safekeeping and use of all funds and assets of the Company and will not employ or permit another to employ such funds or assets in any manner except for the exclusive benefit of the Company. Further, our managers must act with such care as a prudent person in a similar situation would use under similar circumstances, including exercising reasonable inquiry when acting. However, our managers are not required to devote all of their time to our business and must devote only that portion of their time to our business as the reasonable execution of the duties shall require. We do not expect that our managers will be required to devote a significant portion of their time to us in discharging their duties.
In addition to meetings of the various committees of the board, which committees we describe below, we expect our board of managers to hold at least four regular board meetings each year. During 2020, the board of managers held 13 meetings. Our board has the authority to pay compensation to independent managers in connection with services rendered to us in any other capacity.
48
Managers and Executive Officers
As of the date of this report, our managers and executive officers and their positions and offices are as follows:
|
Name |
|
Age |
|
|
Position |
|
|
Gloria S. Nelund |
|
|
59 |
|
|
Chairman of our Board of Managers, Chief Executive Officer, President and Affiliated Manager |
|
Brent L. VanNorman |
|
|
60 |
|
|
Chief Compliance Officer and Affiliated Manager |
|
Scott T. Hall |
|
|
50 |
|
|
Chief Operating Officer |
|
Mark A. Tipton |
|
|
60 |
|
|
Chief Financial Officer |
|
Paul Sanford |
|
|
45 |
|
|
Chief Investment Officer |
|
Terry Otton |
|
|
66 |
|
|
Independent Manager |
|
Cynthia Hostetler |
|
|
58 |
|
|
Independent Manager |
|
R. Michael Barth |
|
|
71 |
|
|
Independent Manager |
Gloria S. Nelund, Chairman, President and Chief Executive Officer
Gloria S. Nelund has served as our Chairman and Chief Executive Officer since our formation in April 2012 and became our President in December 2014. In addition, she has served as the Chairman and Chief Executive Officer of our Advisor since its formation in April 2012, Chief Compliance Officer of our Advisor from October 2013 to March 2019, the Chairman and Chief Executive Officer of our Sponsor since its formation in August 2008, and President of our Sponsor from December 2014 to October 2015.
From October 2006 until August 2008, Ms. Nelund served as the President and founder of Titus Development Group, LLC, a consulting firm focusing on strategy development, business planning and launch for start-up companies, as well as growth planning for small to mid-sized firms. Prior to founding Titus Development, LLC, Ms. Nelund spent her career as a high-level executive in the international Asset Management Industry. Most recently, Ms. Nelund served as Head of the U.S. Private Wealth Management Division at Deutsche Bank, the world’s fifth largest financial institution. In this capacity, Ms. Nelund held fiduciary responsibility for more than $50 billion in investment assets, including more than $20 billion in emerging markets and credit instruments. In addition to this role, Ms. Nelund served as the only female member of the Global Private Wealth Management Executive Committee. Ms. Nelund served as the Managing Director of Scudder Kemper Investments prior to its purchase by Deutsche Bank.
Prior to her tenure at Deutsche Bank, Ms. Nelund spent 16 years as an executive at Bank of America/Security Pacific Bank, most notably as President and CEO of BofA Capital Management, Inc., an investment management subsidiary managing $35 billion in assets for both retail and institutional investors. In addition to managing fixed income and equity mutual funds in both the U.S. and internationally, Ms. Nelund’s division was responsible for managing assets on behalf of public funds, common trust funds and corporate funds. Ms. Nelund also spent five years as Manager of Worldwide Sales and Marketing of BofA Global Asset Management and three years as CEO of InterCash Capital Advisors, Inc., a $15 billion investment management subsidiary of Security Pacific Bank.
Ms. Nelund has been a pioneer in the development of social impact products for institutional and high net worth investors. While at Scudder, she supported the development and growth of one of the industry’s first socially responsible investment (SRI) products. In addition, Ms. Nelund was instrumental in making Deutsche Bank a major institutional supporter of microcredit, creating multiple programs for Private Wealth Management clients.
Ms. Nelund brings to us more than 40 years of experience in executive management of financial institutions, as well as deep expertise in the creation, sales and distribution of financial products within the wealth management community.
In addition to her activities with TriLinc, Ms. Nelund is an Independent Trustee for the Victory Funds, a mutual fund complex with more than $43 billion in assets under management. She is also a life-long supporter of development-oriented philanthropic causes. While at Deutsche Bank, Ms. Nelund served on the Board of the Deutsche Bank Americas Community Development Group, with responsibility for providing loans, investments, and grants to targeted organizations throughout the U.S. and Latin America. She has also volunteered as a teacher of at-risk youth in the Los Angeles Unified School District and the YMCA of Los Angeles. Ms. Nelund currently sits on the board of IPA and is involved with not-for-profit organizations and actively supports entrepreneurship, research and education. She is an active speaker and guest lecturer on Impact Investing at conferences and several top business schools, including Wheaton, Kellogg, and the Massachusetts Institute of Technology. Ms. Nelund attended the University of Dayton in Dayton, Ohio and she is a graduate of the University of Virginia Colgate Darden Graduate School’s Sales and Marketing Executives Program.
We believe that Ms. Nelund’s qualifications to serve as Chairman of our board of managers include her over 40 years of experience in the international asset management industry, including significant experience serving as CEO of multiple investment institutions. In
49
addition, her experience as a pioneer in the development of social impact products for institutional and high net worth investors affords her a unique perspective on the evolving world of impact investing and these insights will be valuable to us.
Brent L. VanNorman, Esq., CPA, Chief Compliance Officer, Secretary and Manager
Brent L. VanNorman has served as our Chief Compliance Officer and Secretary since October 2013 and as a Manager since December 2014. Mr. VanNorman served as our Chief Financial Officer from August 2014 to February 2019, as our Chief Operating Officer from August 2014 to February 2019, and as Interim Chief Financial Officer from October 2013 until his appointment as Chief Financial Officer in August 2014. In addition, Mr. VanNorman has served as President of our Advisor since October 2013. Mr. VanNorman also served as Chief Operating Officer of our Advisor from October 2013 to August 2018, and as Chief Financial Officer of our Advisor from October 2013 until January 2017. Mr. VanNorman has served as President of our Sponsor since November 2015 and continues as President in a part-time role as he transitions to retirement from our Sponsor.
In November 2013, Mr. VanNorman began serving in a part-time capacity as General Counsel for CCG Systems, Inc (“CCG”), a provider of fleet management software. In May 2018, he increased his role at CCG by becoming Executive Vice President & General Counsel and continued in that capacity when CCG sold the majority of its assets to TT Faster LLC. He currently serves TT Faster LLC in a part-time capacity as its General Counsel. Mr. VanNorman has also served on the Board of Directors of CCG since August of 2015. In addition, Mr. VanNorman served on the Board of Directors of IMPACT International, a not-for-profit organization from 2004 until 2015.
Prior to joining us, Mr. VanNorman served as a key member of the Intellectual Property and Litigation Team for the international law firm of Hunton & Williams LLP, beginning his practice there in August 2000, and terminating when he joined the Company. Prior to practicing law, Mr. VanNorman served as a Chief Information Officer for The Title Office, where he managed the accounting, data processing and marketing departments along with 15 of the company’s 42 offices. Prior to his tenure at The Title Office, Mr. VanNorman was a Senior Manager with the international CPA firm of Crowe Horwath where he oversaw large consulting projects in the firm’s Systems Consulting Group. In addition to appearing in many federal courts throughout the country and at all levels in the Virginia state court system, Mr. VanNorman is a patent attorney. He is also a Certified Public Accountant, Certified Computer Programmer and is certified in Production and Inventory Management. Mr. VanNorman graduated magna cum laude from Anderson University in Anderson, Indiana, with majors in Accounting and Computer Science. He was recognized as the Outstanding Accounting graduate. Mr. VanNorman graduated summa cum laude, from Regent University School of Law and was recognized as the Outstanding Law School Graduate in addition to being Editor-in-Chief of the school’s law review. He has served as an adjunct law professor at his alma mater. Mr. VanNorman is Gloria S Nelund’s brother-in-law. Mr. VanNorman brings a breadth of experience in business, accounting, data processing, and the law to the Sponsor’s management team.
Scott T. Hall, Chief Operating Officer
Scott T. Hall has served as our Chief Operating Officer since February 2019, Chief Operating Officer of the Advisor since August 2018, Chief Compliance Officer of the Advisor since March 2019, and Chief Compliance Officer of the Sponsor since March 2019.
Prior to joining the Advisor, Mr. Hall was the Chief Operating Officer of RS Funds Distributor, LLC, a limited purpose broker/dealer that serves as the distributor for RS Investments, from September 2012 until December 2016. Mr. Hall was retired from December 2016 until August 2018. Prior to his role of Chief Operating Officer of RS Funds Distributor, Mr. Hall served as the Director of Client Operations for RS Investments, a $30 billion San Francisco-based asset manager, beginning his tenure at RS Investments in July 1999. While at RS Investments, Mr. Hall was responsible for the mutual fund operations team, negotiating third party service agreements, developing policies and procedures and was instrumental in launching the broker/dealer. Mr. Hall also served as a member of the Disclosure Controls and Compliance Systems Committees and chaired the Distribution Oversight Committee at RS Investments. Mr. Hall graduated from San Diego State University with a B.S. in Financial Services.
Mark A. Tipton, Chief Financial Officer
Mark A. Tipton has served as our Chief Financial Officer since February 2019, as Chief Financial Officer of the Advisor since January 2018, and as Chief Financial Officer of the Sponsor since October 2017.
Prior to joining the Advisor, Mr. Tipton worked as Vice President of Logistics at SYNNEX Corporation, building the Reverse Logistics division from a start-up to a multi-million-dollar business and establishing key vendor relationships with leading tech brands, from March 2008 until July 2015. Mr. Tipton worked with these brands to develop processes that prevented $200 million of used consumer electronic devices from filling waste disposal sites. Instead, they were tested and either fully recycled or prepared for global resale into primarily developing economies. Mr. Tipton was retired from July 2015 until October 2017.
Prior to his tenure at SYNNEX, Mr. Tipton served as the Chief Financial Officer at New Age Electronics, Inc., where he managed all financial aspects of the company, from September 1998 until March 2008. Most notably, Mr. Tipton was instrumental in the growth of the company’s annual revenue from $140 million to over $1 billion, facilitated the close of a $250 million asset-based
50
lending facility, and was involved in the $150 million sale of the company to SYNNEX Corporation. Previously, Mr. Tipton was the Chief Financial Officer and Chief Operating Officer at a boutique broker-dealer/bond trading desk/investment advisor, where he managed all operating facets and financial activities of the firm. Mr. Tipton graduated from California State University, Northridge with a B.S. in Finance and Accounting. Additionally, Mr. Tipton was an audit manager in the financial services department of an international public accounting firm and maintains an active Certified Public Accountant license.
Paul Sanford, Chief Investment Officer
Paul Sanford has served as our Chief Investment Officer since our formation in April 2012. In addition, Mr. Sanford has served as the Chief Investment Officer of our Advisor since its formation in April 2012 and as Chief Investment Officer of our Sponsor since July 2011.
From September 2007 until July 2011, Mr. Sanford was Managing Director and Chief Investment Officer for a Los Angeles-based boutique Registered Investment Advisor, where he was responsible for developing and implementing the firm’s Global Investment Strategy, performing manager due diligence, and managing all fund investment relationships. Mr. Sanford’s extensive experience in the banking and investment industry also includes portfolio manager positions at Deutsche Bank, HSBC and Morton Capital Management.
Mr. Sanford has over eighteen years of experience developing, managing and executing global macro investment strategies at both large global banks and boutique investment firms. Throughout his career, Mr. Sanford has followed and invested in emerging markets as part of his various investment mandates, including conducting extensive research on developing economies and reviewing and selecting leading managers of emerging market debt and equities. Mr. Sanford has a deep understanding of macroeconomics and geopolitics, and an in-depth knowledge of traditional and alternative asset classes in both public and private capital markets. For over two decades, Mr. Sanford has been a global macro investor with a focus on Central Bank policy, GDP growth trends, global interest rates, global currencies and foreign government policies.
Mr. Sanford holds a B.A. in Business Economics from California State University, Long Beach and previously served in the United States Marine Corps. He is a member of the CFA Society of Los Angeles and the CFA Institute. Mr. Sanford serves on the Investment Committee for the City of Hope, an independent biomedical research, treatment and education institution, leading the fight to conquer cancer, diabetes, HIV/AIDS and other life-threatening diseases.
Terry Otton, Independent Manager
Terry Otton has served as our Independent Manager since February 2013. Previously, Mr. Otton served as Chief Executive Officer of RS Investments from September 2005 until his retirement in March 2012. Mr. Otton also served as President and Trustee of RS Investment Trust and RS Variable Products Trust from April 2004 and May 2006, respectively, until March 2012. Mr. Otton has 30 years of experience in the investment management and securities industry, including serving as a Managing Director of the mergers and acquisition practice at Putnam Lovell NBF Group, an investment banking firm, since 2001. Mr. Otton also served as a Managing Director and CFO of Robertson, Stephens & Company and Robertson Stephens Investment Management, the predecessor to RS Investments, for more than 10 years. Mr. Otton was one of the principal founders of Robertson Stephens Investment Management in 1986. Mr. Otton holds a Bachelor of Science degree in Business Administration from the University of California, Berkeley and is a Certified Public Accountant.
Mr. Otton was selected to serve on the Company’s board of managers because of his over 30 years of experience in the investment management and securities industry. Having recently served as Chief Executive Officer of RS Investments and President and Trustee of RS Investment Trust and RS Variable Products Trust, Mr. Otton brings recent and relevant perspectives on the state of the investment management industry. He is also able to provide valuable insight regarding our investment strategy, regulatory and compliance oversight and operational processes.
Cynthia Hostetler, Independent Manager
Cynthia Hostetler has served as our Independent Manager since February 2013. Additionally, Ms. Hostetler has served as an independent trustee for Invesco Funds since 2017 and an independent director of Genesee & Wyoming (NYSE:GWR) since May 2018. Ms. Hostetler has also served on the Board of Directors of Vulcan Materials Company (NYSE: VMC), a producer of construction materials, since July 2014. Previously, Ms. Hostetler was an independent trustee of Aberdeen Investment Funds from 2013 until 2017. Ms. Hostetler was also an independent trustee of Artio Global Investment Funds from 2010 until 2013, prior to the acquisition of Artio Global Asset Management by Aberdeen Asset Management. Ms. Hostetler was an independent director of Edgen Group (NYSE:EDG), an energy infrastructure company, since May 2012. EDG was acquired by Sumitomo Corporation in late 2013. From August 2001 until her retirement in January 2009, Ms. Hostetler was the Head of Investment Funds at the Overseas Private Investment Corporation (OPIC). Prior to OPIC, Ms. Hostetler was the President and a member of the Board of Directors of First Manhattan Bancorporation. Ms. Hostetler began her professional career as an attorney in the corporate/banking department of the law firm Simpson Thacher & Bartlett. Ms. Hostetler received a Bachelor of Arts degree from Southern Methodist University and her law degree from the University of Virginia School of Law.
51
Ms. Hostetler was selected to serve on the Company’s board of managers because of her direct experiences in investing and development in the geographic regions in which the Company operates, as well as her extensive experience in the banking and investment industries. As the Company seeks to establish and leverage relationships with DFIs, Ms. Hostetler’s seven years of experience as Vice President of Investment Funds at OPIC should position her as an excellent source of insight and guidance in working with these institutions. Her diverse public company and mutual fund board positions make her a valuable resource in the areas of risk management, governance, valuation and with regard to certain sectors in which we anticipate making investments.
R. Michael Barth, Independent Manager
R. Michael Barth has served as our Independent Manager since February 2013. Mr. Barth also served as a Managing Partner of Barth & Associates LLC, an emerging markets capital advisory and consulting firm, since January 2012. Previously, Mr. Barth held various positions with Darby Overseas Investment Ltd., a wholly owned subsidiary of Franklin Templeton Investments, including Senior Advisor in Business Development from January 2011 until January 2012, Senior Director in Business Development from January 2009 until January 2011, Senior Managing Director in Global Investment from March 2007 until January 2009 and Managing Director in Global Investment from March 2006 until March 2007. Before joining Darby, Mr. Barth spent over twenty years working for some of the most prominent development finance institutions in the world. Mr. Barth holds a Masters Degree in International Economics/International Affairs from the Johns Hopkins University, School of Advanced International Studies, and a Bachelor’s Degree in Economics from Brandeis University.
Mr. Barth was selected to serve on the Company’s board of managers because of his distinguished career in development and investment in the emerging markets. His qualifications to serve on the Company’s board of managers span more than 30 years of relevant experiences in development and emerging markets, including serving as Chief Executive Officer of FMO (Netherlands Development Finance Company) and Director of the Capital Markets Development Department at the World Bank and holding several senior positions at the International Finance Corporation, the private sector arm of the World Bank Group. Mr. Barth is currently Chairman of the Board of SFC Ltd, also known as AfricInvest Private Credit, and is a member of the Board of Directors of the Wananchi Group. Mr. Barth is also a member of the Investment Committees of the MPEFIII and IV funds, as well as the Supervisory Committee of the FIVE Financial Sector fund (representing KfW of Germany) – all three funds are managed by the Africinvest Group. Additionally, Mr. Barth is Senior Advisor of the Emerging Markets Private Equity Association (EMPEA), Senior Advisor to McKinsey and Company, Senior Consultant to the Asian Infrastructure Investment Bank and a member of the International Council of the Bretton Woods Committee. Previously, he held several board positions, including board positions in EMPEA, the Emerging Markets Growth Fund, FINCA Microfinance Holding and Procredit.
Unless a manager resigns, is removed “for cause” by the majority of the remaining managers (excluding the manager being removed) or is removed by the majority vote of our unitholders, our managers serve for the duration. Our executive officers serve until their successors are elected and qualify. Our executive officers act as our agents, execute contracts and other instruments in our name and on our behalf, and in general perform all duties incident to their offices and such other duties as may be prescribed by our board of managers from time to time. Our officers devote such portion of their time to our affairs as is required for the performance of their duties, but they are not required to devote all of their time to us. Each of our executive officers is also an officer of our Advisor.
Code of Ethics
The Company has adopted a Code of Ethics that applies to the Company’s managers and to officers or employees of the Company, whether acting directly as an officer or employee of the Company or indirectly as an officer of our Sponsor or employee of our Advisor, which conducts the day-to-day operations of the Company. There is no policy against hedging or pledging the company’s securities.
Committees of the Board of Managers
Our board of managers may delegate many of its powers to one or more committees. Our operating agreement requires that each of these committees be majority-comprised of our independent managers and our board will have two committees, the audit committee and the corporate governance and conflicts committee, each of which consists solely of independent managers.
Audit Committee
Our board of managers has established an audit committee that consists of Messrs. Terry Otton and R. Michael Barth, and has designated Mr. Terry Otton as an audit committee financial expert. Mr. Otton serves as chair of this committee. All members of our Audit Committee are independent managers. The Audit Committee assists our board in overseeing the following:
|
|
• |
our accounting and financial reporting policies; |
|
|
• |
the integrity and audits of our financial information; |
52
|
|
• |
our compliance with legal and regulatory requirements; |
|
|
• |
quarterly valuations of our investment portfolio; and |
|
|
• |
the performance of our risk management function and the independent registered public accounting firm. |
The audit committee selects the independent registered public accounting firm to audit our annual financial statements, and reviews with the independent registered public accounting firm the plans and results of the audit engagement, and consider and approve the audit and non-audit services provided by the independent registered public accounting firm. During 2020, our Audit Committee had four meetings.
Corporate Governance and Conflicts Committee
In order to assist our board with certain corporate governance procedures and to reduce or eliminate certain potential conflicts of interest, our operating agreement creates a corporate governance and conflicts committee of the board of managers, which is composed of all of our independent managers, Ms. Cynthia Hostetler and Messrs. Terry Otton and R. Michael Barth. Ms. Hostetler serves as chair of this committee. Our Corporate Governance and Conflicts Committee had four meetings in 2020. Our operating agreement authorizes the Corporate Governance and Conflicts Committee to act on any matter permitted under state law. Both the board of managers and the corporate governance and conflicts committee are expected to act jointly on any conflict-of-interest issues. Our operating agreement also authorizes the corporate governance and conflicts committee to retain its own legal or financial advisors. For more information, please see the section entitled “Conflicts of Interest.” Our Corporate Governance and Conflicts Committee also has the responsibility for managing cybersecurity and data privacy risks.
Limited Liability and Indemnification of Managers, Officers, Employees and Other Agents
Our organizational documents limit the liability of our managers and officers to us and our unitholders for monetary damages and generally require us to indemnify our managers, officers, our Advisor, and its affiliates for losses they may incur by reason of their service in that capacity. We will not provide that our sponsor, a manager, our Advisor or its affiliates (the “Indemnitee”) is held harmless for any loss or liability suffered by us unless all of the following conditions are met:
|
|
• |
the Indemnitee has determined in good faith that the course of conduct that caused the loss or liability was in our best interests; |
|
|
• |
the Indemnitee was acting on our behalf or performing services for us; |
|
|
• |
in the case of an independent manager, the loss or liability was not the result of gross negligence or willful misconduct by the independent manager; |
|
|
• |
in the case of a manager other than an independent manager, our Advisor or one of its affiliates, the loss or liability was not the result of negligence or misconduct by the party seeking to be held harmless; and |
|
|
• |
the agreement to hold harmless is recoverable only out of our assets and not from our unitholders. |
Furthermore, our organizational documents prohibit the indemnification of an Indemnitee for losses, liabilities or expenses arising from or out of an alleged violation of state or federal securities laws, unless one or more of the following conditions is met:
|
|
• |
there has been a successful adjudication on the merits of each count involving alleged material securities law violations; |
|
|
• |
such claims have been dismissed with prejudice on the merits by a court of competent jurisdiction; or |
|
|
• |
a court of competent jurisdiction approves a settlement of the claims against the Indemnitee and finds that indemnification of the settlement and related costs should be made, and the court considering the request for indemnification has been advised of the position of the Securities and Exchange Commission and of the published position of any state securities regulatory authorities in states in which the securities were offered or sold as to indemnification for violations of securities law. |
The Securities and Exchange Commission and certain states, take the position that indemnification against liabilities arising under the Securities Act of 1933 is against public policy and unenforceable.
Our operating agreement also provides that we shall indemnify and, without requiring a preliminary determination of the ultimate entitlement to indemnification, pay or reimburse reasonable expenses in advance of final disposition of a proceeding to:
|
|
• |
any of our present or former managers or officers who is made or is threatened to be made a party to a proceeding by reason of his or her service in that capacity |
53
|
|
• |
any individual who, while our manager or officer, and at our request, serves or served as a director, officer, partner or trustee of another partnership, corporation, joint venture, trust, employee benefit plan or other enterprise and who is made or is threatened to be made a party to a proceeding by reason of his or her service in that capacity; or |
|
|
• |
the Advisor or any of its affiliates acting as our agent. |
These aforementioned rights to indemnification and advance of expenses vest immediately upon the appointment as a manger, officer, Advisor or affiliate.
Additionally, pursuant to our operating agreement, the advancement of funds to the Advisor or its affiliates for reasonable legal expenses and other costs incurred as a result of any legal action for which indemnification is being sought is permissible only if all of the following conditions are met:
|
|
• |
the legal action relates to acts or omissions with respect to the performance of duties or services on our or our subsidiaries’ behalf; |
|
|
• |
the legal action is initiated by a third party who is not a unitholder or, if by a unitholder acting in his or her capacity as such, a court of competent jurisdiction approves such advancement; and |
|
|
• |
the Advisor or its affiliates undertake to repay the advanced funds to us, together with the applicable legal rate of interest thereon, if it is ultimately determined that such party is not entitled to indemnification. |
We also purchase and maintain insurance on behalf of all our managers and executive officers against liability asserted against or incurred by them in their official capacities with us.
ITEM 11. EXECUTIVE COMPENSATION
Compensation of Executive Officers and Managers
We do not currently have any employees nor do we currently intend to hire any employees. Each of our executive officers, including each executive officer who serves as a manager, is employed by our Sponsor and also serves as an executive officer of our Advisor. Each of these individuals receives compensation from our Sponsor for his or her services, including services performed for us and for our Advisor. As executive officers of our Advisor, these individuals will manage our day-to-day affairs and carry out the directives of our board of managers in the review and selection of our sub-advisor and review of our investment opportunities and will oversee and monitor our acquired investments. Although we will reimburse our Advisor for certain expenses incurred in connection with providing these services to us, we do not intend to pay any compensation directly to our executive officers and we will not reimburse our Advisor for the salaries and benefits paid to our named executive officers, as defined under the federal securities rules and regulations.
During 2020, we compensated each of our independent managers with an annual retainer of $70,000. In addition, we paid our independent managers fees for participating on committees of the board as follows:
|
|
• |
each member of a committee of the board received a $5,000 annual retainer for each committee upon which he or she served; and |
|
|
• |
the chairman of the audit committee received an additional annual retainer of $20,000 and the chairman of any other committee received an additional annual retainer of $2,500. |
All managers are entitled to reimbursement of reasonable and documented out-of-pocket expenses incurred in connection with attendance at any meeting of the board of managers or a committee thereof. If a manager is also one of our officers, we will not pay any compensation to said manager for services rendered as a manager. In addition, we purchase and maintain liability insurance on behalf of our managers and officers.
The following table sets forth compensation of the Company’s independent managers for the year ended December 31, 2020:
|
Name |
|
Fees Earned or |
|
|
All Other |
|
|
Total |
|
|||
|
Terry Otton |
|
$ |
100,000 |
|
|
|
— |
|
|
$ |
100,000 |
|
|
Cynthia Hostetler |
|
$ |
77,500 |
|
|
|
— |
|
|
$ |
77,500 |
|
|
R. Michael Barth |
|
$ |
80,000 |
|
|
|
|
|
|
$ |
80,000 |
|
The Company did not have any outstanding equity awards as of December 31, 2020.
Compensation Discussion and Analysis
Because the Advisory Agreement provides that the Advisor assumes principal responsibility for managing our affairs, we have no employees, and our executive officers, in their capacities as such, do not receive compensation from us, nor do they work exclusively
54
on our affairs. In their capacities as officers or employees of the Advisor or its affiliates, they devote such portion of their time to our affairs as is required for the performance of the duties of the Advisor under the Advisory Agreement. The compensation received by our executive officers is not paid or determined by us, but rather by an affiliate of the Advisor based on all of the services provided by these individuals. See “Certain Relationships and Related Transactions, and Director Independence” below for a summary of the fees and expenses payable to the Advisor and other affiliates.
Compensation Committee Report
We do not currently have a compensation committee, however, our compensation committee, if formed, would be comprised entirely of independent managers. In lieu of a formal compensation committee, our independent managers perform an equivalent function. Our independent managers have reviewed and discussed the Compensation Discussion and Analysis contained in this Annual Report on Form 10-K (“CD&A”) with management. Based on the independent managers’ review of the CD&A and their discussions of the CD&A with management, the independent managers recommended to the board of managers, and the board of managers has approved, that the CD&A be included in this Annual Report on Form 10-K.
INDEPENDENT MANAGERS:
Terry Otton
Cynthia Hostetler
R. Michael Barth
Compensation Committee Interlocks and Insider Participation
We do not currently have a compensation committee, however, we intend that our compensation committee, if formed, would be comprised entirely of independent managers. In lieu of a formal compensation committee, our independent managers perform an equivalent function. None of our independent managers served as one of our officers or employees or as an officer or employee of any of our subsidiaries during the fiscal years ended December 31, 2020 and 2019, or formerly served as one of our officers or as an officer of any of our subsidiaries. In addition, during the fiscal years ended December 31, 2020 and 2019, none of our executive officers served as a manager or member of a compensation committee (or other board committee performing equivalent functions or, in the absence of any such committee, the entire board of managers) of any entity that has one or more executive officers or managers serving as a member of our board of managers.
We do not expect that any of our executive officers will serve as a director or member of the compensation committee of any entity whose executive officers include a member of our compensation committee, if formed. We have not retained any independent compensation consultants.
The foregoing report shall not be deemed to be incorporated by reference by any general statement incorporating by reference this Annual Report on Form 10-K into any filing under the Securities Act of 1933, as amended (the “Securities Act”), or under the Exchange Act, except to the extent that we specifically incorporate this information by reference, and shall not otherwise be deemed filed under such Acts.
ITEM 12. SECURITY OWNERSHIP OF CERTAIN BENEFICIAL OWNERS AND MANAGEMENT AND RELATED STOCKHOLDER MATTERS
The following table sets forth the beneficial ownership of units as of the date of this filing for each person or group that holds more than 5% of any class of our voting securities, for each manager and executive officer and for our managers and executive officers as a group. As of the date of this filing, we had 46,807,115 units issued and outstanding. To our knowledge, each person that beneficially owns units has sole voting and disposition power with regard to such units.
Unless otherwise indicated below, each person or entity has an address in care of our principal executive offices at 1230 Rosecrans Ave, Suite 605, Manhattan Beach, California 90266.
|
Name of Beneficial Owner (1) |
|
Number of Units |
|
|
Percent of All Units |
|
||
|
TriLinc Global, LLC |
|
|
316,898 |
(3) |
|
|
0.68 |
% |
|
TriLinc Advisors, LLC |
|
|
22,161 |
(3) |
|
|
* |
|
|
Gloria S. Nelund |
|
|
— |
(3) |
|
|
* |
|
|
Paul Sanford |
|
|
— |
|
|
|
— |
|
|
Mark Tipton |
|
|
— |
|
|
|
— |
|
|
Scott Hall |
|
|
— |
|
|
|
— |
|
|
Brent VanNorman |
|
|
1,875 |
(3) |
|
|
* |
|
|
Terry Otton |
|
|
— |
|
|
|
— |
|
55
|
Cynthia Hostetler |
|
|
— |
|
|
|
— |
|
|
R. Michael Barth |
|
|
— |
|
|
|
— |
|
|
All manager and officers as a group (nine persons) |
|
|
340,934 |
|
|
|
0.73 |
% |
|
* |
Amount represents less than 0.1% |
|
(1) |
Under SEC rules, a person is deemed to be a “beneficial owner” of a security if that person has or shares “voting power,” which includes the power to dispose of or to direct the disposition of such security. A person also is deemed to be a beneficial owner of any securities which that person has a right to acquire within 60 days of the date of this report. Under these rules, more than one person may be deemed to be a beneficial owner of the same securities and a person may be deemed to be a beneficial owner of securities as to which he or she has no economic or pecuniary interest. |
|
(2) |
All of the units owned by our Sponsor, our Advisor and any of our managers or officers are Class A units. |
|
(3) |
TriLinc Advisors is controlled by our Sponsor, TriLinc Global LLC, as the managing member. Our Sponsor is presently directly or indirectly controlled by Gloria Nelund and Brent VanNorman, and as such, they may be deemed to be beneficial owners of the units owned by our Advisor and our Sponsor. |
We did not have any outstanding equity awards as of December 31, 2020.
ITEM 13. CERTAIN RELATIONSHIPS AND RELATED TRANSACTIONS, AND DIRECTOR INDEPENDENCE
Certain Relationships and Related Transactions
General
Our executive officers, two of our managers and the key investment professionals of our Advisor who perform services for us on behalf of our Advisor are also officers, directors, managers, and/or key professionals of our Sponsor, our dealer manager and other affiliates. For an overview of the positions held by these individuals at our affiliates, please see “Part III, Item 10: Directors, Officers and Corporate Governance— Managers and Executive Officers.” These persons have legal obligations with respect to those entities that are similar to their obligations to us.
No Arm’s-Length Agreements
All agreements, contracts or arrangements between or among us and our affiliates, including our Advisor and our dealer manager, were not negotiated at arm’s-length. Such agreements, contracts or arrangements include our Advisory Agreement and our Dealer Manager Agreement. The procedures with respect to conflicts of interest described herein were designed to lessen the effect of potential conflicts that arise from such relationships. However, we cannot assure you that these procedures will eliminate the conflicts of interest or reduce the risks related thereto.
Certain Conflict Resolution Measures
Corporate Governance and Conflicts Committee
In order to ameliorate the risks created by conflicts of interest, our operating agreement creates a corporate governance and conflicts committee of our board of managers composed solely of independent managers. Our operating agreement authorizes the corporate governance and conflicts committee to act on any matter related to conflicts of interest and to retain its own legal and financial advisors when and if it deems such an action appropriate. Among the issues relating to conflict of interest we expect the corporate governance and conflicts committee to act upon are:
|
|
• |
The continuation, renewal or enforcement of our agreements with the Advisor and its affiliates, including the Advisory Agreement; |
|
|
• |
Transactions with affiliates; |
|
|
• |
Compensation of the Advisor; and |
|
|
• |
Whether and when we seek to pursue a liquidity event. |
Other Provisions Relating to Conflicts of Interest
In addition to the creation of the corporate governance and conflicts committee, our operating agreement contains many other restrictions regarding conflicts of interest, including the following:
Advisor Compensation: Our independent manager’s review, at least annually, whether the compensation we contract to pay TriLinc Advisors and its affiliates is reasonable relative to the nature and quality of the services provided and the investment performance of
56
the Company and that the provisions of the Advisory Agreement are being carried out. The board of managers may consider all factors that they deem relevant in making these determinations.
Investments with affiliates: We may not invest in any asset or company in which the Advisor, any of our managers or officers or any of their affiliates has a direct economic interest without a determination by the majority of our board of managers (including a majority of our independent managers) that such an investment is fair and reasonable to us. In addition, with respect to any potential debt investment in a portfolio company in which our sub-advisor has an equity interest, our Advisor must determine, before the investment is made, that the procedures by which this potential debt investment is evaluated and priced are fair and reasonable.
Purchase of assets from affiliates: We may not purchase assets from the Sponsor, Advisor, manager or any of their affiliates unless a majority of our board of managers (including a majority of our independent managers) not otherwise interested in the transaction determine that such transaction is fair and reasonable to us and at a price to us no greater than the cost of the assets to the Advisor or its affiliates or such manager, unless there is substantial justification for any amount that exceeds such cost and such excess amount is determined to be reasonable. In no event would the cost of any such assets to us exceed its then current appraised value.
Sale of assets to affiliates: We may not sell or lease assets to the Sponsor, Advisor, manager or any of their affiliates or to the managers without a determination by a majority of our board of managers (including a majority of our independent managers) not otherwise interested in the transaction, that such transaction is fair and reasonable to us.
Loans to/from affiliates: We may not borrow money from the Sponsor, Advisor, managers or any of their affiliates unless a majority of our board of managers (including a majority of our independent managers) not otherwise interested in transaction approve it as being fair, competitive and commercially reasonable to us and no less favorable to us than loans between unaffiliated parties under similar circumstances.
Other restrictions on transactions with affiliates: We may not give our Advisor an exclusive right to sell our assets. Our Advisor is prohibited from commingling our funds with the funds of any other entity or person for which it provides advisory or other services. Our Advisor is prohibited from providing any financing with a term in excess of 12 months to us. We may not pay a commission or fee, either directly or indirectly to our Advisor, or its affiliates, except as otherwise permitted by our operating agreement. In addition, our operating agreement prohibits our Advisor and its affiliates from receiving or accepting any rebate, give-up or similar arrangement that is prohibited under federal or state securities laws. Our Advisor and its affiliates are also prohibited from participating in any reciprocal business arrangement that would circumvent provisions of federal or state securities laws governing conflicts of interest or investment restrictions.
We may not invest in general partnerships or joint ventures with affiliates and non-affiliates unless certain conditions, described in our operating agreement are met.
A majority of our board of managers (including a majority of our independent managers) not otherwise interested in the transaction must conclude that all other transactions between us and the Sponsor, Advisor, any of the managers or any of their affiliates are fair and reasonable to us and on terms and conditions not less favorable to us than those available from unaffiliated third parties. The terms pursuant to which any goods or services, other than those services provided pursuant to the Advisory Agreement, are provided to us by the Advisor, will be embodied in a written contract, the material terms of which will be fully disclosed to our unitholders in a prospectus supplement or another filing.
Allocation of Investment Opportunities
We rely on our executive officers and our Advisor’s investment professionals to identify suitable investments. Our Sponsor and other affiliated entities also rely on these same key investment professionals. Many investment opportunities that are suitable for us may also be suitable for the Sponsor or affiliates of the Sponsor, including TriLinc Global Sustainable Income Fund, LLC (“TGSIF”), a private impact investment fund sponsored by the Sponsor. The Sponsor, the Advisor and their affiliates share certain of the same executive officers and key employees, which we refer to as “TriLinc Professionals.” When the TriLinc Professionals direct an investment opportunity to the Sponsor or any affiliate of the Sponsor, including TGSIF, they, in their sole discretion, have to determine the program for which the investment opportunity is most suitable based on the investment objectives, portfolio and criteria of each program. The Advisory Agreement requires that this determination be made in a manner that is fair without favoring the Sponsor or any affiliate of the Sponsor. The factors that the TriLinc Professionals consider when determining the entity for which an investment opportunity would be the most suitable are the following:
|
|
• |
the investment objectives and criteria of the Sponsor and the other affiliated entities; |
|
|
• |
the cash requirements of the Sponsor and its affiliates; |
|
|
• |
the portfolio of the Sponsor and its affiliates by type of investment and risk of investment; |
|
|
• |
the policies of the Sponsor and its affiliates relating to leverage; |
|
|
• |
the anticipated cash flow of the asset to be acquired; |
57
|
|
• |
the income tax effects of the purchase; |
|
|
• |
the size of the investment; and |
|
|
• |
the amount of funds available to the Sponsor and its affiliates and the length of time such funds have been available for investment. |
In the event that our investment objectives overlap with those of another affiliate’s program and the opportunity is equally suitable for us and the affiliated program, then the opportunity shall be allocated to such program that had the funds available for investment for a longer time period.
If a subsequent event or development causes any investment, in the opinion of the TriLinc Professionals, to be more appropriate for another affiliated entity, they may offer the investment to such entity.
Our independent managers are responsible for reviewing our Advisor’s performance and determining that the compensation to be paid to our Advisor is reasonable and, in doing so, our independent managers must consider, among other factors, the success of our Advisor in generating appropriate investment opportunities for us.
Related Party Transactions
For the years ended December 31, 2020 and 2019, the Advisor earned $7,334,178, and $7,702,572, respectively, in asset management fees and $5,320,776 and $5,730,748, respectively, in incentive fees.
From our inception through September 30, 2017, pursuant to the terms of the Responsibility Agreement, the Sponsor has paid approximately $12,420,600 of operating expenses, asset management fees, and incentive fees on our behalf and will reimburse us an additional $4,057,734 of expenses, which we had paid as of September 30, 2017. Such expenses, in the aggregate of $16,478,300 since the Company’s inception, may be expensed and payable by the Company to the Sponsor only if the Company satisfies the Reimbursement Hurdle. The Company did not meet the Reimbursement Hurdle for the year ended December 31, 2020. Therefore, none of the expenses of the Company covered by the Responsibility Agreement have been recorded as expenses of the Company for the year ended December 31, 2020.
As of December 31, 2020 and December 31, 2019, due from affiliates on the Consolidated Statement of Assets and Liabilities in the amount of $4,057,734 and $4,240,231, respectively was due from the Sponsor pursuant to the Responsibility Agreement for operating expenses which were paid by the Company, but, under the terms of the Responsibility Agreement, are the responsibility of the Sponsor. The Sponsor anticipates paying this receivable in the due course of business.
For the years ended December 31, 2020 and 2019, we paid SC Distributors, the dealer manager for certain of our offerings, $468,000 and $577,000, respectively in ongoing distributions fees, dealer manager fees and service fees.
ITEM 14. PRINCIPAL ACCOUNTING FEES AND SERVICES
In accordance with the SEC’s definitions and rules, “audit fees” are fees for professional services for the audit and review of our annual financial statements, and includes fees for the audit and review of our annual financial statements included in a registration statement filed under the Securities Act as well as issuance of consents and for services that are normally provided by the accountant in connection with statutory and regulatory filings or engagements except those not required by statute or regulation. “Audit-related fees” are fees for assurance and related services that were reasonably related to the performance of the audit or review of our financial statements, including attestation services that are not required by statute or regulation, due diligence and services related to acquisitions. “Tax fees” are fees for tax compliance, tax advice and tax planning, and “all other fees” are fees for any services not included in the first three categories.
Independent Registered Public Accounting Firm
On March 29, 2019, our audit committee approved the engagement of BDO USA, LLP (“BDO”) as our independent registered public accounting firm for our fiscal year ended December 31, 2020 and 2019.
Audit Fees
The aggregate amount of fees billed by BDO for the professional services rendered in connection with the audit of the Company’s annual financial statements and reviews of the financial statements included in the Company’s Forms 10-K and 10-Qs for fiscal years 2020 and 2019 was approximately $492,000 and $369,000, respectively.
58
Audit Related Fees
The aggregate amount of fees billed by BDO for assurance and related services that were reasonably related to the performance of the audit or review of our financial statements in fiscal years 2020 and 2019 was approximately $11,000 and $11,000, respectively.
Tax Fees
There were no tax fees billed by our principal accountants for fiscal years 2020 and 2019.
All Other Fees
There were no other fees billed by BDO to the Company for fiscal years 2020 or 2019.
Audit Committee Pre-Approval Policy
The Audit Committee is responsible for appointing our independent registered public accounting firm and approving the terms of the independent registered public accounting firm’s services. In accordance with applicable laws and regulations, our Audit Committee reviews and pre-approves any audit and non-audit services to be performed by our independent accountant to ensure that the work does not compromise its independence in performing audit services. The responsibility for pre-approval of audit and permitted non-audit services includes pre-approval of the fees for such services and the other terms of the engagement. Our Audit Committee annually reviews and pre-approves all audit, audit-related, tax and all other services that are performed by the Company’s independent registered public accounting firm. In some cases, our Audit Committee may pre-approve the provision of a particular category or group of services for up to a year. Our Audit Committee approved all of the services listed in the table above.
ITEM 15. EXHIBITS AND CONSOLIDATED FINANCIAL STATEMENTS SCHEDULES
|
|
(1) |
The following consolidated financial statements: |
|
|
• |
Report of Independent Registered Public Accounting Firm (BDO) as of and for the years ended December 31, 2020 and 2019 |
|
|
• |
Consolidated Statements of Assets and Liabilities as of December 31, 2020 and 2019 |
|
|
• |
Consolidated Statements of Operations for the years ended December 31, 2020 and 2019 |
|
|
• |
Consolidated Statements of Changes in Net Assets for the years ended December 31, 2020 and 2019 |
|
|
• |
Consolidated Statements of Cash Flows for the years ended December 31, 2020 and 2019 |
|
|
• |
Consolidated Schedules of Investments as of December 31, 2020 and 2019 |
|
|
• |
Notes to the Consolidated Financial Statements |
|
|
(2) |
Financial Statement Schedules have been omitted because they are not applicable or the required information is shown in the Consolidated Financial Statements or Notes thereto in Item 8 of this Annual Report. |
|
|
(3) |
Exhibits required by Item 601 |
|
Number |
|
Description |
|
3.1 |
|
|
|
|
|
|
|
3.2 |
|
|
|
|
|
|
|
4.1 |
|
|
|
|
|
|
|
4.2 |
|
|
|
|
|
|
|
4.3 |
|
59
|
Number |
|
Description |
|
|
|
|
|
10.1 |
|
|
|
|
|
|
|
10.5 |
|
|
|
|
|
|
|
21.1* |
|
|
|
|
|
|
|
23.1* |
|
|
|
|
|
|
|
31.1* |
|
|
|
|
|
|
|
31.2* |
|
|
|
|
|
|
|
32.1* |
|
|
|
|
|
|
|
101* |
|
The following materials from TriLinc Global Impact Fund LLC’s Annual Report on Form 10-K for the year ended December 31, 2020, filed on March 31, 2021, formatted in XBRL (eXtensible Business Reporting Language): (i) Consolidated Statements of Assets and Liabilities, (ii) Consolidated Statement of Operations, (iii) Consolidated Statement of Changes in Net Assets, (iv) Consolidated Statements of Cash Flows, and (v) Notes to the Consolidated Financial Statements. |
|
* |
Filed herewith |
The Company has determined not to include a summary.
60
TRILINC GLOBAL IMPACT FUND, LLC
INDEX TO THE CONSOLIDATED FINANCIAL STATEMENTS
F-1
REPORT OF INDEPENDENT REGISTERED PUBLIC ACCOUNTING FIRM
To the Unit-holders and the Board of Managers of
TriLinc Global Impact Fund, LLC
Manhattan Beach, California
Opinion on the Consolidated Financial Statements
We have audited the accompanying consolidated statements of assets and liabilities of TriLinc Global Impact Fund, LLC (the “Company”) as of December 31, 2020 and 2019, including the consolidated schedules of investments, and the related consolidated statements of operations, changes in net assets, and cash flows for each of the two years in the period ended December 31, 2020, and the related notes (collectively referred to as the “consolidated financial statements”). In our opinion, the consolidated financial statements present fairly, in all material respects, the financial position of the Company at December 31, 2020 and 2019, and the results of its operations, changes in its net assets, and its cash flows for each of the two years in the period ended December 31, 2020, in conformity with accounting principles generally accepted in the United States of America.
Basis for Opinion
These consolidated financial statements are the responsibility of the Company’s management. Our responsibility is to express an opinion on the Company’s consolidated financial statements based on our audits. We are a public accounting firm registered with the Public Company Accounting Oversight Board (United States) (“PCAOB”) and are required to be independent with respect to the Company in accordance with the U.S. federal securities laws and the applicable rules and regulations of the Securities and Exchange Commission and the PCAOB.
We conducted our audits in accordance with the standards of the PCAOB. Those standards require that we plan and perform the audit to obtain reasonable assurance about whether the consolidated financial statements are free of material misstatement, whether due to error or fraud. The Company is not required to have, nor were we engaged to perform, an audit of its internal control over financial reporting. As part of our audits we are required to obtain an understanding of internal control over financial reporting but not for the purpose of expressing an opinion on the effectiveness of the Company’s internal control over financial reporting. Accordingly, we express no such opinion.
Our audits included performing procedures to assess the risks of material misstatement of the consolidated financial statements, whether due to error or fraud, and performing procedures that respond to those risks. Such procedures included examining, on a test basis, evidence regarding the amounts and disclosures in the consolidated financial statements. Our audits also included evaluating the accounting principles used and significant estimates made by management, as well as evaluating the overall presentation of the consolidated financial statements. We believe that our audits provide a reasonable basis for our opinion.
Critical Audit Matter
The critical audit matter communicated below is a matter arising from the current period audit of the consolidated financial statements that was communicated or required to be communicated to the audit committee and that: (1) relates to accounts or disclosures that are material to the consolidated financial statements and (2) involved our especially challenging, subjective, or complex judgments. The communication of the critical audit matter does not alter in any way our opinion on the consolidated financial statements, taken as a whole, and we are not, by communicating the critical audit matter below, providing separate opinions on the critical audit matter or on the accounts or disclosures to which it relates.
Valuation of Investments
Investments are carried at fair value, which is the price that would be received when selling an asset or paid to transfer a liability in an orderly transaction between market participants at the measurement date. As described in Notes 3 and 4 to the consolidated financial statements, the Company held $287.6 million of investments at December 31, 2020, where significant inputs and assumptions used to develop the fair value measurement were not observable (i.e., classified as level 3 in the fair value hierarchy). The Company’s investment portfolio is comprised of senior secured term loans, senior secured term loan participations, senior secured trade finance participations and equity warrants, where the borrowers are small and medium enterprises primarily in developing economies. A substantial portion of total investments consists of collateralized private debt instruments some of which are on the Watch List as disclosed in Note 3 to the consolidated financial statements. Watch List Investments are investments where management has determined there have been significant changes in the credit and collection risk of the investments. As described in Notes 2, 3 and 4 to the consolidated financial statements, management determines the fair value of the Company's investments by using valuation methodologies such as market approach and income approach that use significant unobservable inputs and assumptions, including
F-2
market yield, estimation of future cash flows and collateral value. The fair value of investments is determined on a quarterly basis by the Company’s board of managers based on input of the Advisor, a third-party valuation firm and the audit committee.
We identified the valuation of the Company’s investments as a critical audit matter. The principal consideration for our determination is the use of significant unobservable inputs and assumptions by the Company in its valuation models such as: (i) discount rate, estimated future cash flows and other information (i.e., financial performance metrics, market, sector and macro events and impact of the global pandemic) impacting the borrower’s financial performance relevant to performing debt investments and; (ii) discount rate, estimated future cash flows, liquidation value of the collateral, expected proceeds from credit insurance and/or guarantees, expected proceeds from ongoing bankruptcy and liquidation proceedings and potential or ongoing litigation matters relevant to the Watch List Investments. Auditing these significant inputs and assumptions involved a high degree of auditor judgment and specialized skills and knowledge.
The primary procedures we performed to address this critical audit matter included the following:
|
|
• |
Evaluating the reasonableness of management’s fair value measurements of its investments by assessing management’s inputs and assumptions and testing the accuracy of significant underlying data used for each investment type as follows: |
|
|
o |
Performing Debt Investments – (i) evaluating management’s cash flow projections based on the expected timing of payments from the borrower; (ii) recomputing the financial performance metrics used in the market approach valuation method, as applicable (i.e., revenue or earnings before interest, taxes, depreciation, and amortization) based on interim and forecasted financial statements from the borrower. |
|
|
o |
Watch List Investments – (i) assessing the reasonableness and accuracy of loans that may be restructured by obtaining the loan restructuring plan with the borrower; (ii) obtaining available documentation for the existence and valuation of collateral amounts used in developing the liquidation value as applicable; (iii) assessing reasonableness of source information used by management as the basis of expected proceeds from credit insurance claims; and (iv) assessing the reasonableness of management’s estimates of future cash flow from bankruptcy or liquidation proceedings and any potential or ongoing litigation, by evaluating information from management and its legal counsel. |
|
|
• |
Evaluating whether changes to the borrowers’ business or industry, including economic volatility resulting from the current global pandemic, necessitate the consideration of other factors in the valuation of the Company’s investment in the portfolio companies. |
|
|
• |
Utilizing personnel with specialized skill and knowledge in valuation to assist in performing the following procedures for performing debt investments and Watch List Investments: (i) assessing the appropriateness of valuation approaches and models (i.e., market approach or income approach using discounted cash flow model), and (ii) developing an independent range of fair value estimates, utilizing available market information from third-party sources to develop assumptions (including discount rate adjusted for the impact of market, sector and macro events) and comparing such fair value estimates to management’s estimates. |
|
|
• |
Evaluating material subsequent events and other available information for corroborating or contradictory evidence. |
/s/BDO USA LLP
We have served as the Company’s auditor since 2019.
Los Angeles, California
March 31, 2021
F-3
Item 1. Consolidated Financial Statements.
TriLinc Global Impact Fund, LLC
Consolidated Statements of Assets and Liabilities
|
|
|
As of |
|
|||||
|
|
|
December 31, |
|
|
December 31, |
|
||
|
|
|
2020 |
|
|
2019 |
|
||
|
ASSETS |
|
|
|
|
|
|
|
|
|
Investments owned, at fair value (amortized cost of $315,576,654 and $352,351,819, respectively) |
|
$ |
287,574,298 |
|
|
$ |
340,298,376 |
|
|
Cash |
|
|
55,002,776 |
|
|
|
22,333,304 |
|
|
Interest receivable |
|
|
21,076,328 |
|
|
|
16,501,872 |
|
|
Due from affiliates (see Note 5) |
|
|
4,057,734 |
|
|
|
4,240,231 |
|
|
Other assets |
|
|
990,387 |
|
|
|
317,000 |
|
|
Total assets |
|
|
368,701,523 |
|
|
|
383,690,783 |
|
|
|
|
|
|
|
|
|
|
|
|
LIABILITIES |
|
|
|
|
|
|
|
|
|
Due to unitholders |
|
|
1,640,061 |
|
|
|
1,572,295 |
|
|
Management fee payable |
|
|
1,816,626 |
|
|
|
1,889,835 |
|
|
Incentive fee payable |
|
|
1,215,456 |
|
|
|
1,481,726 |
|
|
Notes payable |
|
|
5,000,000 |
|
|
|
5,000,000 |
|
|
Unit repurchases payable |
|
|
2,282,554 |
|
|
|
2,312,031 |
|
|
Accrued distribution and other fees |
|
|
480,000 |
|
|
|
647,000 |
|
|
Accrued expenses |
|
|
993,196 |
|
|
|
1,192,336 |
|
|
Total liabilities |
|
|
13,427,893 |
|
|
|
14,095,223 |
|
|
Commitments and Contingencies (see Note 5) |
|
|
|
|
|
|
|
|
|
NET ASSETS |
|
$ |
355,273,630 |
|
|
$ |
369,595,560 |
|
|
|
|
|
|
|
|
|
|
|
|
ANALYSIS OF NET ASSETS: |
|
|
|
|
|
|
|
|
|
Net capital paid in on Class A units |
|
$ |
144,861,885 |
|
|
$ |
151,476,548 |
|
|
Net capital paid in on Class C units |
|
|
63,700,945 |
|
|
|
67,804,541 |
|
|
Net capital paid in on Class I units |
|
|
84,131,597 |
|
|
|
88,748,417 |
|
|
Net capital paid in on Class W units |
|
|
196,655 |
|
|
|
206,243 |
|
|
Net capital paid in on Class Y units |
|
|
15,595,564 |
|
|
|
11,007,080 |
|
|
Net capital paid in on Class Z units |
|
|
64,024,791 |
|
|
|
67,590,538 |
|
|
Offering costs |
|
|
(17,237,807 |
) |
|
|
(17,237,807 |
) |
|
Net assets (equivalent to $7.600 and $8.024, respectively per unit based on total units outstanding of 46,807,115 and 46,143,564, respectively) |
|
$ |
355,273,630 |
|
|
$ |
369,595,560 |
|
|
Net assets, Class A (units outstanding of 17,996,350 and 17,861,312, respectively) |
|
$ |
136,779,779 |
|
|
$ |
143,313,977 |
|
|
Net assets, Class C (units outstanding of 7,970,536 and 8,067,787, respectively) |
|
|
60,121,402 |
|
|
|
64,117,584 |
|
|
Net assets, Class I (units outstanding of 10,454,368 and 10,468,162, respectively) |
|
|
79,436,572 |
|
|
|
83,964,495 |
|
|
Net assets, Class W (units outstanding of 24,555 and 24,555, respectively) |
|
|
185,627 |
|
|
|
195,021 |
|
|
Net assets, Class Y (units outstanding of 1,937,455 and 1,297,897, respectively) |
|
|
14,725,459 |
|
|
|
10,413,945 |
|
|
Net assets, Class Z (units outstanding of 8,423,851 and 8,423,851, respectively) |
|
|
64,024,791 |
|
|
|
67,590,538 |
|
|
NET ASSETS |
|
$ |
355,273,630 |
|
|
$ |
369,595,560 |
|
See accompanying notes to the consolidated financial statements.
F-4
TriLinc Global Impact Fund, LLC
Consolidated Statements of Operations
|
|
|
For the Years Ended |
|
|||||
|
|
|
December 31, |
|
|
December 31, |
|
||
|
|
|
2020 |
|
|
2019 |
|
||
|
INVESTMENT INCOME |
|
|
|
|
|
|
|
|
|
Interest income |
|
$ |
42,240,413 |
|
|
$ |
43,428,233 |
|
|
Interest from cash |
|
|
96,445 |
|
|
|
96,897 |
|
|
Total investment income |
|
|
42,336,858 |
|
|
|
43,525,130 |
|
|
EXPENSES |
|
|
|
|
|
|
|
|
|
Asset management fees |
|
|
7,334,178 |
|
|
|
7,702,572 |
|
|
Incentive fees |
|
|
5,320,776 |
|
|
|
5,730,748 |
|
|
Professional fees |
|
|
3,842,481 |
|
|
|
3,609,067 |
|
|
General and administrative expenses |
|
|
1,414,586 |
|
|
|
1,509,686 |
|
|
Interest expense |
|
|
254,682 |
|
|
|
1,660,095 |
|
|
Board of managers fees |
|
|
257,500 |
|
|
|
257,500 |
|
|
Total expenses |
|
|
18,424,203 |
|
|
|
20,469,668 |
|
|
NET INVESTMENT INCOME |
|
|
23,912,655 |
|
|
|
23,055,462 |
|
|
Net change in unrealized depreciation on investments |
|
|
(15,037,022 |
) |
|
|
(4,809,906 |
) |
|
Foreign exchange gain (loss) |
|
|
17,207 |
|
|
|
(1,715 |
) |
|
NET INCREASE IN NET ASSETS RESULTING FROM OPERATIONS |
|
$ |
8,892,840 |
|
|
$ |
18,243,841 |
|
|
|
|
|
|
|
|
|
|
|
|
NET INVESTMENT INCOME PER UNIT - BASIC AND DILUTED |
|
$ |
0.51 |
|
|
$ |
0.52 |
|
|
EARNINGS PER UNIT - BASIC AND DILUTED |
|
$ |
0.19 |
|
|
$ |
0.41 |
|
|
WEIGHTED AVERAGE UNITS OUTSTANDING - BASIC AND DILUTED |
|
|
46,529,861 |
|
|
|
44,707,581 |
|
See accompanying notes to the consolidated financial statements.
F-5
TriLinc Global Impact Fund, LLC
Consolidated Statements of Changes in Net Assets
|
|
|
For the Years Ended |
|
|||||
|
|
|
December 31, |
|
|
December 31, |
|
||
|
|
|
2020 |
|
|
2019 |
|
||
|
INCREASE FROM OPERATIONS |
|
|
|
|
|
|
|
|
|
Net investment income |
|
$ |
23,912,655 |
|
|
$ |
23,055,462 |
|
|
Foreign exchange gain (loss) |
|
|
17,207 |
|
|
|
(1,715 |
) |
|
Net change in unrealized depreciation on investments |
|
|
(15,037,022 |
) |
|
|
(4,809,906 |
) |
|
Net increase from operations |
|
|
8,892,840 |
|
|
|
18,243,841 |
|
|
DECREASE FROM DISTRIBUTIONS |
|
|
|
|
|
|
|
|
|
Distributions to Class A unitholders |
|
|
(11,075,735 |
) |
|
|
(11,036,331 |
) |
|
Distributions to Class C unitholders |
|
|
(4,874,871 |
) |
|
|
(4,906,206 |
) |
|
Distributions to Class I unitholders |
|
|
(6,494,983 |
) |
|
|
(6,496,499 |
) |
|
Distributions to Class W unitholders |
|
|
(13,739 |
) |
|
|
(14,038 |
) |
|
Distributions to Class Y unitholders |
|
|
(1,014,936 |
) |
|
|
(747,194 |
) |
|
Distributions to Class Z unitholders |
|
|
(5,200,469 |
) |
|
|
(4,219,915 |
) |
|
Net decrease from distributions |
|
|
(28,674,733 |
) |
|
|
(27,420,183 |
) |
|
INCREASE (DECREASE) FROM CAPITAL TRANSACTIONS |
|
|
|
|
|
|
|
|
|
Issuance of Class A units |
|
|
4,342,129 |
|
|
|
4,440,574 |
|
|
Issuance of Class C units |
|
|
2,142,831 |
|
|
|
2,333,446 |
|
|
Issuance of Class I units |
|
|
2,785,140 |
|
|
|
2,727,517 |
|
|
Issuance of Class W units |
|
|
— |
|
|
|
— |
|
|
Issuance of Class Y units |
|
|
5,275,977 |
|
|
|
1,084,000 |
|
|
Issuance of Class Z units |
|
|
— |
|
|
|
20,000,000 |
|
|
Repurchase of units |
|
|
(9,253,114 |
) |
|
|
(12,440,304 |
) |
|
Distribution and other fees |
|
|
167,000 |
|
|
|
583,000 |
|
|
Offering costs |
|
|
— |
|
|
|
(26,690 |
) |
|
Net increase from capital transactions |
|
|
5,459,963 |
|
|
|
18,701,543 |
|
|
NET (DECREASE) INCREASE IN NET ASSETS |
|
|
(14,321,930 |
) |
|
|
9,525,201 |
|
|
Net assets at beginning of period |
|
|
369,595,560 |
|
|
|
360,070,359 |
|
|
Net assets at end of period |
|
$ |
355,273,630 |
|
|
$ |
369,595,560 |
|
See accompanying notes to the consolidated financial statements.
F-6
TriLinc Global Impact Fund, LLC
Consolidated Statements of Cash Flows
|
|
|
For the Years Ended |
|
|||||
|
|
|
December 31, |
|
|
December 31, |
|
||
|
|
|
2020 |
|
|
2019 |
|
||
|
Cash flows from operating activities |
|
|
|
|
|
|
|
|
|
NET INCREASE IN NET ASSETS RESULTING FROM OPERATIONS |
|
$ |
8,892,840 |
|
|
$ |
18,243,841 |
|
|
ADJUSTMENT TO RECONCILE NET INCREASE IN NET ASSETS RESULTING FROM OPERATIONS TO NET CASH PROVIDED BY OPERATING ACTIVITIES |
|
|
|
|
|
|
|
|
|
Purchase of investments |
|
|
(25,495,664 |
) |
|
|
(37,793,756 |
) |
|
Maturity of investments |
|
|
82,513,130 |
|
|
|
77,051,815 |
|
|
Payment-in-kind interest |
|
|
(19,042,591 |
) |
|
|
(10,380,892 |
) |
|
Net change in unrealized depreciation on investments |
|
|
15,037,022 |
|
|
|
4,809,906 |
|
|
Foreign exchange (gain) loss |
|
|
(17,207 |
) |
|
|
1,715 |
|
|
Accretion of discounts on investments |
|
|
(287,817 |
) |
|
|
(1,007,706 |
) |
|
Changes in assets and liabilities: |
|
|
|
|
|
|
|
|
|
(Increase) decrease in interest receivable |
|
|
(4,557,249 |
) |
|
|
1,048,452 |
|
|
Increase in other assets |
|
|
(490,890 |
) |
|
|
(184,959 |
) |
|
Increase in due to unitholders |
|
|
67,766 |
|
|
|
140,660 |
|
|
Decrease in management and incentive fees payable |
|
|
(339,479 |
) |
|
|
(395,653 |
) |
|
(Decrease) increase in other payables |
|
|
(199,141 |
) |
|
|
289,171 |
|
|
NET CASH PROVIDED BY OPERATING ACTIVITIES |
|
|
56,080,720 |
|
|
|
51,822,594 |
|
|
Cash flows from financing activities |
|
|
|
|
|
|
|
|
|
Net proceeds from issuance of units |
|
|
5,271,838 |
|
|
|
21,077,891 |
|
|
Distributions paid to unitholders |
|
|
(19,400,494 |
) |
|
|
(17,912,536 |
) |
|
Payments of offering costs |
|
|
— |
|
|
|
(26,690 |
) |
|
Repurchase of units |
|
|
(9,282,592 |
) |
|
|
(12,854,584 |
) |
|
Repayments of notes payable |
|
|
— |
|
|
|
(27,875,000 |
) |
|
NET CASH USED IN FINANCING ACTIVITIES |
|
|
(23,411,248 |
) |
|
|
(37,590,919 |
) |
|
TOTAL INCREASE IN CASH |
|
|
32,669,472 |
|
|
|
14,231,675 |
|
|
Cash at beginning of period |
|
|
22,333,304 |
|
|
|
8,101,629 |
|
|
Cash at end of period |
|
$ |
55,002,776 |
|
|
$ |
22,333,304 |
|
|
Supplemental information |
|
|
|
|
|
|
|
|
|
Cash paid for interest during the period |
|
$ |
275,653 |
|
|
$ |
1,943,615 |
|
|
Supplemental non-cash information |
|
|
|
|
|
|
|
|
|
Issuance of units in connection with distribution reinvestment plan |
|
$ |
9,274,238 |
|
|
$ |
9,507,647 |
|
|
Change in accrual of distribution and other fees |
|
$ |
(167,000 |
) |
|
$ |
(583,000 |
) |
See accompanying notes to the consolidated financial statements.
F-7
TriLinc Global Impact Fund, LLC
Consolidated Schedule of Investments
As of December 31, 2020
F-8
|
Investment Type / Country |
|
Portfolio Company |
|
Sector |
|
Description |
|
Interest |
|
|
Fees (2) |
|
|
Maturity (3) |
|
Principal Amount |
|
|
Participation % (4) |
|
|
Amortized Cost |
|
|
Fair Value |
|
|
% of Net Assets |
|
|||||||
|
Senior Secured Term Loans (1) |
|
|
|
|
|
|
|
|
|
|
|
|
|
|
|
|
|
|
|
|
|
|
|
|
|
|
|
|
|
|
|
|
|
|
||
|
Brazil |
|
Usivale Industria E Commercio Ltda (12), (17), (18) |
|
Agricultural Products |
|
Sugar Producer |
|
12.43% |
|
|
|
0.0 |
% |
|
12/15/2020 |
|
$ |
2,851,296 |
|
|
N/A |
|
|
$ |
2,851,296 |
|
|
$ |
2,367,936 |
|
|
|
0.7 |
% |
||
|
Chile |
|
Itelecom Holding Chile SPA (17) |
|
Electric Services |
|
LED Lighting Service Provider |
|
11.00% |
|
|
|
0.0 |
% |
|
6/6/2021 |
|
|
1,456,162 |
|
|
N/A |
|
|
|
1,434,285 |
|
|
|
1,434,285 |
|
|
|
0.4 |
% |
||
|
Colombia |
|
Other Investments (5) |
|
Personal Credit Institutions |
|
Consumer Lender |
|
11.25% |
|
|
|
0.0 |
% |
|
8/1/2021 |
|
|
1,816,934 |
|
|
N/A |
|
|
|
1,816,934 |
|
|
|
1,816,934 |
|
|
|
0.5 |
% |
||
|
Ecuador |
|
Other Investments |
|
Corrugated and solid fiber boxes |
|
Sustainable Packaging Manufacturer |
|
9.16% Cash/2.20% PIK |
|
|
|
0.0 |
% |
|
6/18/2025 |
|
|
13,503,499 |
|
|
N/A |
|
|
|
13,503,499 |
|
|
|
13,503,499 |
|
|
|
3.8 |
% |
||
|
Hong Kong |
|
Other Investments (22) |
|
Secondary Nonferrous Metals |
|
Minor Metals Resource Trader |
|
12.00% |
|
|
|
0.0 |
% |
|
6/22/2021 |
|
|
5,000,000 |
|
|
N/A |
|
|
|
5,000,000 |
|
|
|
5,000,000 |
|
|
|
1.4 |
% |
||
|
Hong Kong |
|
Other Investments (23), (26) |
|
Coal and Other Minerals and Ores |
|
Resource Trader |
|
11.50% |
|
|
|
0.0 |
% |
|
12/31/2020 |
|
|
17,166,559 |
|
|
N/A |
|
|
|
17,166,559 |
|
|
|
17,166,559 |
|
|
|
4.8 |
% |
||
|
Singapore |
|
Triton Metallics Pte Ltd. (17) |
|
Coal and Other Minerals and Ores |
|
Non-Ferrous Metal Trader |
|
3.00% Cash/3.00% PIK |
|
|
|
0.0 |
% |
|
8/18/2025 |
|
|
18,146,500 |
|
|
N/A |
|
|
|
18,146,500 |
|
|
|
16,483,354 |
|
|
|
4.6 |
% |
||
|
Malaysia |
|
Other Investments (24) |
|
Chemicals and Allied Products |
|
Wholesale Distributor |
|
12.00% |
|
|
|
0.0 |
% |
|
12/31/2022 |
|
|
15,858,045 |
|
|
N/A |
|
|
|
15,858,045 |
|
|
|
15,858,045 |
|
|
|
4.5 |
% |
||
|
Mexico |
|
Blue Arrow Biojet Holdings, LLC (9) |
|
Refuse Systems |
|
Waste to Fuels Processor |
|
14.50% PIK |
|
|
|
0.0 |
% |
|
7/27/2021 |
|
|
28,531,105 |
|
|
N/A |
|
|
|
28,531,105 |
|
|
|
28,531,105 |
|
|
|
8.0 |
% |
||
|
Peru |
|
Kinder Investments, Ltd. (16) |
|
Consumer Products |
|
Diaper Manufacturer II |
|
11.00% |
|
|
|
0.0 |
% |
|
12/31/2024 |
|
|
4,737,437 |
|
|
N/A |
|
|
|
4,737,437 |
|
|
|
4,737,437 |
|
|
|
1.3 |
% |
||
|
Total Senior Secured Term Loans |
|
|
|
|
|
|
|
|
|
|
|
|
|
|
|
|
|
|
|
|
|
|
|
|
109,045,660 |
|
|
|
106,899,154 |
|
|
|
30.0 |
% |
||
|
Senior Secured Term Loan Participations (1) |
|
|
|
|
|
|
|
|
|
|
|
|
|
|
|
|
|
|
|
|
|
|
|
|
|
|
|
|
|
|
|
|
|
|
||
|
Botswana |
|
Other Investments |
|
Short-Term Business Credit |
|
SME Financier |
|
11.47% |
|
|
|
0.0 |
% |
|
8/18/2021 |
|
|
4,740,000 |
|
|
47% |
|
|
|
4,740,000 |
|
|
|
4,740,000 |
|
|
|
1.3 |
% |
||
|
Brazil |
|
Other Investments (21) |
|
Programming and Data Processing |
|
IT Service Provider |
|
10.00% Cash/1.50% PIK |
|
|
|
0.0 |
% |
|
11/23/2023 |
|
|
18,362,141 |
|
|
27% |
|
|
|
18,502,811 |
|
|
|
18,502,811 |
|
|
|
5.2 |
% |
||
|
Brazil |
|
Other Investments |
|
Boatbuilding and Repairing |
|
Ship Maintenance & Repair Service Provider |
|
8.00% Cash/6.00% PIK |
|
|
|
0.0 |
% |
|
12/7/2023 |
|
|
5,999,538 |
|
|
42% |
|
|
|
5,946,066 |
|
|
|
5,946,066 |
|
|
|
1.7 |
% |
||
|
Cabo Verde |
|
TRG Cape Verde Holdings Ltd (6), (17) |
|
Hotels and Motels |
|
Hospitality Service Provider |
|
10.00% Cash/4.75% PIK |
|
|
|
0.0 |
% |
|
8/21/2021 |
|
|
13,478,292 |
|
|
88% |
|
|
|
13,478,292 |
|
|
|
11,337,937 |
|
|
|
3.2 |
% |
||
|
Colombia |
|
Other Investments |
|
Personal Credit Institutions |
|
Consumer Lender |
|
11.90% |
|
|
|
0.0 |
% |
|
9/1/2025 |
|
|
1,245,664 |
|
|
7% |
|
|
|
1,245,664 |
|
|
|
1,245,664 |
|
|
|
0.4 |
% |
||
|
Croatia |
|
Other Investments (8), (20), (26) |
|
Department Stores |
|
Mall Operator |
|
8.50% Cash/4.50% PIK |
|
|
|
0.0 |
% |
|
1/23/2021 |
|
|
9,360,235 |
|
|
5% |
|
|
|
9,360,235 |
|
|
|
9,360,235 |
|
|
|
2.6 |
% |
||
|
Ghana |
|
Other Investments (6) |
|
Petroleum and Petroleum Products |
|
Tank Farm Operator |
|
12.00% |
|
|
|
0.0 |
% |
|
2/10/2023 |
|
|
13,685,366 |
|
|
76% |
|
|
|
13,685,366 |
|
|
|
13,685,366 |
|
|
|
3.9 |
% |
||
|
Jersey |
|
Africell Holding Limited (10) |
|
Telephone Communications |
|
Mobile Network Operator |
|
10.06% |
|
|
|
3.0 |
% |
|
3/28/2023 |
|
|
1,417,700 |
|
|
16% |
|
|
|
1,161,200 |
|
|
|
1,161,200 |
|
|
|
0.3 |
% |
||
|
Kenya |
|
Other Investments |
|
Freight Transportation Arrangement |
|
Freight and Cargo Transporter |
|
7.77% Cash/4.00% PIK |
|
|
|
0.0 |
% |
|
3/31/2023 |
|
|
14,034,913 |
|
|
42% |
|
|
|
14,034,913 |
|
|
|
14,034,913 |
|
|
|
4.0 |
% |
||
|
Namibia |
|
Trustco Group Holdings Ltd. (14), (17) |
|
Land Subdividers and Developers |
|
Property Developer |
|
8.50% Cash/4.00% PIK |
|
|
|
0.0 |
% |
|
8/15/2021 |
|
|
17,529,688 |
|
|
100% |
|
|
|
17,508,259 |
|
|
|
15,242,460 |
|
|
|
4.3 |
% |
||
|
Netherlands |
|
Other Investments (9) |
|
Motor Vehicle Parts and Accessories |
|
Wheel Manufacturer |
|
14.23% |
|
|
|
0.0 |
% |
|
8/20/2021 |
|
|
8,275,000 |
|
|
44% |
|
|
|
8,893,693 |
|
|
|
8,893,693 |
|
|
|
2.5 |
% |
||
|
Nigeria |
|
Helios Maritime I (15), (17) |
|
Water Transportation |
|
Marine Logistics Provider |
|
10.65% |
|
|
|
0.8 |
% |
|
9/16/2020 |
|
|
15,600,710 |
|
|
100% |
|
|
|
15,600,710 |
|
|
|
12,986,279 |
|
|
|
3.7 |
% |
||
|
Romania |
|
Other Investments (8) |
|
Food Products |
|
Bread Manufacturer |
|
8.00% Cash/5.00% PIK |
|
|
|
2.5 |
% |
|
7/18/2021 |
|
|
1,830,509 |
|
|
27% |
|
|
|
1,821,078 |
|
|
|
1,821,078 |
|
|
|
0.5 |
% |
||
|
Uganda |
|
Other Investments |
|
Farm Products |
|
Grain Processor C |
|
14.50% |
|
|
|
0.0 |
% |
|
4/30/2024 |
|
|
8,709,445 |
|
|
100% |
|
|
|
8,755,878 |
|
|
|
8,755,878 |
|
|
|
2.5 |
% |
||
|
Zambia |
|
Other Investments (5) |
|
Soap, Detergents, and Cleaning |
|
FMCG Manufacturer |
|
10.38% |
|
|
|
0.0 |
% |
|
8/27/2023 |
|
|
2,203,673 |
|
|
25% |
|
|
|
2,203,673 |
|
|
|
2,203,673 |
|
|
|
0.6 |
% |
||
|
Total Senior Secured Term Loan Participations |
|
|
|
|
|
|
|
|
|
|
|
|
|
|
|
|
|
|
|
|
|
|
136,937,838 |
|
|
|
129,917,253 |
|
|
|
36.7 |
% |
||||
|
Senior Secured Trade Finance Participations (1) |
|
|
|
|
|
|
|
|
|
|
|
|
|
|
|
|
|
|
|
|
|
|
|
|
|
|
|
|
|
|
|
|
||||
|
Argentina |
|
Compania Argentina de Granos S.A. (17), (18) |
|
Agricultural Products |
|
Agriculture Distributor |
|
10.45% |
|
|
|
0.0 |
% |
|
6/30/2018 |
|
|
12,500,000 |
|
|
83% |
|
|
|
12,500,000 |
|
|
|
9,679,636 |
|
|
|
2.7 |
% |
||
|
Argentina |
|
Sancor Cooperativas Unidas Ltda (17) |
|
Consumer Products |
|
Dairy Co-Operative |
|
10.67% |
|
|
|
0.0 |
% |
|
7/29/2019 |
|
|
6,000,000 |
|
|
22% |
|
|
|
6,000,000 |
|
|
|
4,719,383 |
|
|
|
1.3 |
% |
||
|
Argentina |
|
Frigorifico Regional Industrias Alimentarias, S.A., Sucursal Uruguay (17), (18) |
|
Meat, Poultry & Fish |
|
Beef Exporter |
|
11.50% |
|
|
|
0.0 |
% |
|
8/31/2017 |
|
|
9,000,000 |
|
|
28% |
|
|
|
9,000,000 |
|
|
|
6,361,679 |
|
|
|
1.8 |
% |
||
|
Argentina |
|
Algodonera Avellaneda S.A. (17), (18) |
|
Fats and Oils |
|
Oilseed Distributor |
|
9.00% |
|
|
|
0.0 |
% |
|
8/31/2017 |
|
|
6,000,000 |
|
|
27% |
|
|
|
6,000,000 |
|
|
|
3,398,558 |
|
|
|
1.0 |
% |
||
|
Cameroon |
|
Producam SA (17) |
|
Chocolate and Cocoa Products |
|
Cocoa & Coffee Exporter |
|
9%, 5.5% |
|
|
|
0.0 |
% |
|
8/31/2019 |
|
|
13,532,693 |
|
|
72% |
|
|
|
13,532,695 |
|
|
|
13,128,867 |
|
|
|
3.7 |
% |
||
|
Chile |
|
Functional Products Trading S.A. (17), (18) |
|
Farm Products |
|
Chia Seed Exporter |
|
10.90% |
|
|
|
0.0 |
% |
|
3/4/2018 |
|
|
1,326,687 |
|
|
100% |
|
|
|
1,326,687 |
|
|
|
1,375,794 |
|
|
|
0.4 |
% |
||
|
Ecuador |
|
Other Investments (25), (17) |
|
Commercial Fishing |
|
Fish Processor & Exporter |
|
9.00% |
|
|
|
0.0 |
% |
|
6/19/2019 |
|
|
35,838 |
|
|
3% |
|
|
|
35,838 |
|
|
|
35,838 |
|
|
|
0.0 |
% |
||
|
Guatemala |
|
Procesos Fabriles S.A. (17), (18) |
|
Farm Products |
|
Sesame Seed Exporter |
|
12.00% |
|
|
|
0.0 |
% |
|
3/31/2016 |
|
|
881,800 |
|
|
24% |
|
|
|
881,800 |
|
|
|
10,504 |
|
|
|
0.0 |
% |
||
|
Hong Kong |
|
Conplex International Ltd. (17), (18) |
|
Telephone and Telegraph Apparatus |
|
Mobile Phone Distributor |
|
12.00% |
|
|
|
0.0 |
% |
|
5/31/2020 |
|
|
9,500,000 |
|
|
26% |
|
|
|
9,500,000 |
|
|
|
3,366,356 |
|
|
|
0.9 |
% |
||
|
Mauritius |
|
Other Investments (26) |
|
Groceries and Related Products |
|
Vanilla Exporter |
|
10.65% |
|
|
|
0.0 |
% |
|
10/20/2020 |
|
|
434,619 |
|
|
2% |
|
|
|
434,619 |
|
|
|
434,619 |
|
|
|
0.1 |
% |
||
F-9
|
Investment Type / Country |
|
Portfolio Company |
|
Sector |
|
Description |
|
Interest |
|
|
Fees (2) |
|
|
Maturity (3) |
|
Principal Amount |
|
|
Participation % (4) |
|
|
Amortized Cost |
|
|
Fair Value |
|
|
% of Net Assets |
|
|||||||
|
Morocco |
|
Mac Z Group SARL (17) |
|
Secondary Nonferrous Metals |
|
Scrap Metal Recycler |
|
11.00% |
|
|
|
0.0 |
% |
|
7/31/2018 |
|
|
1,433,058 |
|
|
73% |
|
|
|
1,433,058 |
|
|
|
628,861 |
|
|
|
0.2 |
% |
||
|
Nigeria |
|
Other Investments (9), (26) |
|
Farm Products |
|
Cocoa Trader III |
|
8.50% |
|
|
|
0.0 |
% |
|
11/30/2020 |
|
|
675,256 |
|
|
25% |
|
|
|
675,256 |
|
|
|
675,256 |
|
|
|
0.2 |
% |
||
|
Nigeria |
|
Other Investments (9), (26) |
|
Farm Products |
|
Cocoa Trader II |
|
8.50% |
|
|
|
0.0 |
% |
|
11/30/2020 |
|
|
838,967 |
|
|
14% |
|
|
|
838,967 |
|
|
|
838,967 |
|
|
|
0.2 |
% |
||
|
South Africa |
|
Applewood Trading 199 Pty, Ltd.(17), (18) |
|
Food Products |
|
Fruit & Nut Distributor |
|
17.50% |
|
|
|
0.0 |
% |
|
5/22/2015 |
|
|
785,806 |
|
|
19% |
|
|
|
785,806 |
|
|
|
497,462 |
|
|
|
0.1 |
% |
||
|
United Arab Emirates |
|
Global Pharma Intelligence Sarl (17), (18) |
|
Drugs, Proprietaries, and Sundries |
|
Pharmaceuticals Distributor |
|
14.60% |
|
|
|
0.0 |
% |
|
6/30/2018 |
|
|
648,430 |
|
|
60% |
|
|
|
648,430 |
|
|
|
648,430 |
|
|
|
0.2 |
% |
||
|
Total Senior Secured Trade Finance Participations |
|
|
|
|
|
|
|
|
|
|
|
|
|
|
|
|
|
|
|
|
|
|
63,593,156 |
|
|
|
45,800,210 |
|
|
|
12.8 |
% |
||||
|
Other Investments (1) |
|
|
|
|
|
|
|
|
|
|
|
|
|
|
|
|
|
|
|
|
|
|
|
|
|
|
|
|
|
|
|
|
|
|
||
|
N/A |
|
IIG TOF B.V. (17), (18), (19) |
|
Financial services |
|
Receivable from IIG TOF B.V. |
|
8.75% |
|
|
|
0.0 |
% |
|
N/A |
|
|
6,000,000 |
|
|
N/A |
|
|
|
6,000,000 |
|
|
|
3,758,063 |
|
|
|
1.1 |
% |
||
|
Equity Warrants |
|
|
|
|
|
|
|
|
|
|
|
|
|
|
|
|
|
|
|
|
|
|
|
|
|
|
|
|
|
|
|
|
|
|
||
|
Mexico |
|
Blue Arrow Biojet Holdings, LLC |
|
Refuse Systems |
|
Waste to Fuels Processor |
|
N/A |
|
|
N/A |
|
|
N/A |
|
N/A |
|
|
N/A |
|
|
|
- |
|
|
|
1,199,618 |
|
|
|
0.3 |
% |
||||
|
|
|
|
|
|
|
|
|
|
|
|
|
|
|
|
|
|
|
|
|
|
|
|
|
|
|
|
|
|
|
|
|
|
|
|
|
|
|
Total Investments |
|
|
|
|
|
|
|
|
|
|
|
|
|
|
|
|
|
|
|
|
|
$ |
315,576,654 |
|
|
$ |
287,574,298 |
|
|
|
|
|
||||
See accompanying notes to the consolidated financial statements.
|
1 |
Refer to Notes 2, 3 and 4 of the consolidated financial statements for additional information on the Company’s investments. |
|
2 |
Fees may include upfront, origination, commitment, facility and/or other fees that the borrower must contractually pay to the Company. Fees, if any, are typically received in connection with term loan transactions and are rarely applicable to trade finance transactions. |
|
4 |
Percentage of the Company’s participation in total borrowings under sub-advisor provided financing facility. |
|
5 |
Principal and interest paid monthly. |
|
6 |
Principal and interest paid quarterly. |
|
7 |
Monthly interest only payment. Principal due at maturity. |
|
8 |
Quarterly interest only payment. Principal due at maturity. |
|
9 |
Principal and interest to be paid at maturity. |
|
10 |
Quarterly interest payments. Principal to start amortizing 15 months from initial utilization date (IUD) as follows: 4.5% of loan balance quarterly until IUD + 27 months, then 6.5% of loan balance quarterly until IUD + 48 months, thereafter 7.5% of loan balance quarterly until maturity. |
|
11 |
Cash interest paid monthly. Principal, including PIK interest, to be repaid in equal monthly installments starting in October 2020. |
|
12 |
Principal and interest paid annually. The maturity date is expected to be extended in connection with a restructure of the loan. |
|
13 |
In October 2017, this investment was refinanced from a trade finance participation to a term loan participation and the maturity dates were extended to 8/31/2022. |
|
14 |
Quarterly interest payments. Refer to Note 3 for additional information. |
|
15 |
Interest accrues at a variable rate of one-month London Interbank Offered Rate (“Libor”) + 10.5%, which is paid currently, and also includes 4.68% of deferred interest due at maturity. |
|
16 |
In connection with a restructure of the underlying facilities, all maturity dates were extended to 12/31/2024. This investment was removed from the Watch List on April 1, 2019. |
|
17 |
Watch List investment. Refer to Note 3 for additional information. |
|
18 |
Investment on non-accrual status. |
|
19 |
This investment was originally classified as an investment in a credit facility originated by IIG Trade Opportunities Fund B.V. (“IIG TOF B.V.”), a fund advised by The International Investment Group L.L.C. (“IIG”). During the third quarter of 2018, as part of its quarterly verification process, the Company learned new information concerning this investment, which resulted in the Company reclassifying it from senior secured trade finance participations to short term investments. Please see Note 3 for additional information. |
|
20 |
Loan is denominated in euro currency with a principal amount of 6,200,000 euro; however, the Company’s participation is denominated in US dollars. The quarterly interest payments are paid at the current exchange rate and subject to foreign currency fluctuations. The fair value includes an investment premium of $91,200. |
|
21 |
Interest includes a stated coupon rate plus additional contingent interest payments based on a percentage of EBITDA after a minimum threshold has been achieved by the borrower. |
|
22 |
Interest paid quarterly. Principal to be repaid in four equal quarterly installments starting in September 2020. |
|
23 |
Interest paid quarterly. Principal to be repaid in two equal quarterly installments starting in September 2020. |
|
24 |
Interest paid quarterly. Principal to be repaid in quarterly installments starting in September 2020. |
|
25 |
IIG was the sub-advisor for this investment. See Note 3 for additional information about IIG. |
|
26 |
The Company extended the maturity dates of these investments. These extensions were finalized during the first quarter of 2021. |
F-10
TriLinc Global Impact Fund, LLC
Consolidated Schedule of Investments
December 31, 2019
|
Type / Country |
|
Portfolio Company |
|
Sector |
|
Description |
|
Interest |
|
|
Fees (2) |
|
|
Maturity (3) |
|
Principal Amount |
|
|
Participation % (4) |
|
|
Amortized Cost |
|
|
Fair Value |
|
|
% of Net Assets |
|
|||||||
|
Senior Secured Term Loans (1) |
|
|
|
|
|
|
|
|
|
|
|
|
|
|
|
|
|
|
|
|
|
|
|
|
|
|
|
|
|
|
|
|
|
|
||
|
Brazil |
|
Usivale Industria E Commercio Ltda (12), (17) |
|
Agricultural Products |
|
Sugar Producer |
|
12.43% |
|
|
|
0.0 |
% |
|
12/15/2020 |
|
$ |
2,851,296 |
|
|
N/A |
|
|
$ |
2,851,296 |
|
|
$ |
2,577,164 |
|
|
|
0.7 |
% |
||
|
Chile |
|
Other Investments (5) |
|
Electric Services |
|
LED Lighting Service Provider |
|
11.00% |
|
|
|
0.0 |
% |
|
6/6/2021 |
|
|
1,456,161 |
|
|
N/A |
|
|
|
1,383,269 |
|
|
|
1,383,269 |
|
|
|
0.4 |
% |
||
|
Colombia |
|
Other Investments (5) |
|
Personal Credit Institutions |
|
Consumer Lender |
|
11.25% |
|
|
|
0.0 |
% |
|
8/1/2021 |
|
|
3,603,592 |
|
|
N/A |
|
|
|
3,603,592 |
|
|
|
3,603,592 |
|
|
|
1.0 |
% |
||
|
Hong Kong |
|
Other Investments (22) |
|
Secondary Nonferrous Metals |
|
Minor Metals Resource Trader |
|
12.00% |
|
|
|
0.0 |
% |
|
6/22/2021 |
|
|
10,000,000 |
|
|
N/A |
|
|
|
10,000,000 |
|
|
|
10,000,000 |
|
|
|
2.7 |
% |
||
|
Hong Kong |
|
Other Investments (23) |
|
Coal and Other Minerals and Ores |
|
Resource Trader |
|
11.50% |
|
|
|
0.0 |
% |
|
12/28/2020 |
|
|
15,891,820 |
|
|
N/A |
|
|
|
15,891,820 |
|
|
|
15,891,820 |
|
|
|
4.3 |
% |
||
|
Malaysia |
|
Other Investments (24) |
|
Chemicals and Allied Products |
|
Wholesale Distributor |
|
12.00% |
|
|
|
0.0 |
% |
|
3/31/2021 |
|
|
15,000,000 |
|
|
N/A |
|
|
|
15,000,000 |
|
|
|
15,000,000 |
|
|
|
4.1 |
% |
||
|
Mexico |
|
Blue Arrow Biojet Holdings, LLC (9) |
|
Refuse Systems |
|
Waste to Fuels Processor |
|
14.50% PIK |
|
|
|
0.0 |
% |
|
7/27/2021 |
|
|
24,685,841 |
|
|
N/A |
|
|
|
24,685,841 |
|
|
|
24,685,841 |
|
|
|
6.7 |
% |
||
|
New Zealand |
|
Other Investments (10) |
|
Logging |
|
Sustainable Timber Exporter |
|
11.50% |
|
|
|
0.0 |
% |
|
2/11/2021 |
|
|
5,612,436 |
|
|
N/A |
|
|
|
5,612,436 |
|
|
|
5,612,436 |
|
|
|
1.5 |
% |
||
|
Peru |
|
Kinder Investments, Ltd. (16) |
|
Consumer Products |
|
Diaper Manufacturer II |
|
10.00% |
|
|
|
0.0 |
% |
|
8/15/2021 |
|
|
4,599,086 |
|
|
N/A |
|
|
|
4,599,086 |
|
|
|
4,599,086 |
|
|
|
1.2 |
% |
||
|
Total Senior Secured Term Loans |
|
|
|
|
|
|
|
|
|
|
|
|
|
|
|
|
|
|
|
|
|
|
|
|
83,627,340 |
|
|
|
83,353,208 |
|
|
|
22.6 |
% |
||
|
Senior Secured Term Loan Participations (1) |
|
|
|
|
|
|
|
|
|
|
|
|
|
|
|
|
|
|
|
|
|
|
|
|
|
|
|
|
|
|
|
|
|
|
||
|
Botswana |
|
Other Investments (7) |
|
Short-Term Business Credit |
|
SME Financier |
|
11.67% |
|
|
|
0.0 |
% |
|
8/18/2021 |
|
|
4,740,000 |
|
|
47% |
|
|
|
4,740,000 |
|
|
|
4,740,000 |
|
|
|
1.3 |
% |
||
|
Brazil |
|
Other Investments (7), (21) |
|
Programming and Data Processing |
|
IT Service Provider |
|
10.00% Cash/1.50% PIK |
|
|
|
0.0 |
% |
|
11/24/2022 |
|
|
17,644,892 |
|
|
75% |
|
|
|
17,644,892 |
|
|
|
17,740,330 |
|
|
|
4.8 |
% |
||
|
Brazil |
|
Other Investments (6), (21) |
|
Boatbuilding and Repairing |
|
Ship Maintenance & Repair Service Provider |
|
8.00% Cash/4.00% PIK |
|
|
|
0.0 |
% |
|
12/7/2023 |
|
|
5,741,741 |
|
|
42% |
|
|
|
5,669,936 |
|
|
|
5,695,069 |
|
|
|
1.5 |
% |
||
|
Cabo Verde |
|
Other Investments (6) |
|
Hotels and Motels |
|
Hospitality Service Provider |
|
10.00% Cash/4.75% PIK |
|
|
|
0.0 |
% |
|
8/21/2021 |
|
|
12,846,584 |
|
|
88% |
|
|
|
12,846,584 |
|
|
|
12,846,584 |
|
|
|
3.5 |
% |
||
|
Colombia |
|
Azteca Comunicaciones Colombia S.A.S. (11), (21) |
|
Telephone Communications |
|
Fiber Optics Network Provider |
|
8.95% Cash/4.00% PIK |
|
|
|
0.0 |
% |
|
10/15/2023 |
|
|
19,807,750 |
|
|
76% |
|
|
|
19,659,665 |
|
|
|
19,875,473 |
|
|
|
5.4 |
% |
||
|
Croatia |
|
Other Investments (8), (20) |
|
Department Stores |
|
Mall Operator |
|
7.00% Cash/6.00% PIK |
|
|
|
0.0 |
% |
|
1/23/2021 |
|
|
8,519,535 |
|
|
5% |
|
|
|
8,519,535 |
|
|
|
8,638,109 |
|
|
|
2.3 |
% |
||
|
Ghana |
|
Other Investments (6) |
|
Petroleum and Petroleum Products |
|
Tank Farm Operator |
|
12.00% |
|
|
|
0.0 |
% |
|
8/10/2021 |
|
|
15,500,000 |
|
|
76% |
|
|
|
15,500,000 |
|
|
|
15,500,000 |
|
|
|
4.2 |
% |
||
|
Ghana |
|
Other Investments (13) |
|
Electric Services |
|
Power Producer |
|
12.46% |
|
|
|
0.0 |
% |
|
11/12/2022 |
|
|
15,000,000 |
|
|
49% |
|
|
|
15,000,000 |
|
|
|
15,000,000 |
|
|
|
4.1 |
% |
||
|
Jersey |
|
Africell Holding Limited (28) |
|
Telephone Communications |
|
Mobile Network Operator |
|
12.35% |
|
|
|
3.0 |
% |
|
3/28/2023 |
|
|
17,290,000 |
|
|
16% |
|
|
|
16,919,500 |
|
|
|
16,919,500 |
|
|
|
4.6 |
% |
||
|
Kenya |
|
Other Investments (6) |
|
Freight Transportation Arrangement |
|
Freight and Cargo Transporter |
|
9.88% Cash/4.00% PIK |
|
|
|
0.0 |
% |
|
3/31/2023 |
|
|
13,505,035 |
|
|
42% |
|
|
|
13,505,035 |
|
|
|
13,505,035 |
|
|
|
3.7 |
% |
||
|
Namibia |
|
Other Investments (14) |
|
Land Subdividers and Developers |
|
Property Developer |
|
8.50% Cash/4.00% PIK |
|
|
|
0.0 |
% |
|
8/15/2021 |
|
|
16,834,571 |
|
|
100% |
|
|
|
16,781,000 |
|
|
|
16,781,000 |
|
|
|
4.5 |
% |
||
|
Netherlands |
|
Other Investments (9) |
|
Motor Vehicle Parts and Accessories |
|
Wheel Manufacturer |
|
15.00% |
|
|
|
0.0 |
% |
|
8/20/2021 |
|
|
8,275,000 |
|
|
44% |
|
|
|
8,275,000 |
|
|
|
8,731,936 |
|
|
|
2.4 |
% |
||
|
Nigeria |
|
Other Investments (15) |
|
Water Transportation |
|
Marine Logistics Provider |
|
12.94% |
|
|
|
0.8 |
% |
|
9/16/2020 |
|
|
12,762,670 |
|
|
100% |
|
|
|
12,748,503 |
|
|
|
12,748,503 |
|
|
|
3.4 |
% |
||
|
Romania |
|
Other Investments (8) |
|
Food Products |
|
Bread Manufacturer |
|
8.00% Cash/5.00% PIK |
|
|
|
2.5 |
% |
|
7/18/2021 |
|
|
2,059,785 |
|
|
27% |
|
|
|
2,034,188 |
|
|
|
2,034,188 |
|
|
|
0.6 |
% |
||
|
Uganda |
|
Other Investments (7) |
|
Farm Products |
|
Grain Processor C |
|
14.50% |
|
|
|
0.0 |
% |
|
4/30/2024 |
|
|
6,850,000 |
|
|
100% |
|
|
|
6,850,000 |
|
|
|
6,850,000 |
|
|
|
1.9 |
% |
||
|
Zambia |
|
Other Investments (5) |
|
Soap, Detergents, and Cleaning |
|
FMCG Manufacturer |
|
12.23% |
|
|
|
0.0 |
% |
|
8/27/2023 |
|
|
2,894,698 |
|
|
25% |
|
|
|
2,894,698 |
|
|
|
2,894,698 |
|
|
|
0.8 |
% |
||
|
Total Senior Secured Term Loan Participations |
|
|
|
|
|
|
|
|
|
|
|
|
|
|
|
|
|
|
|
|
|
|
|
|
179,588,536 |
|
|
|
180,500,425 |
|
|
|
49.0 |
% |
||
|
Senior Secured Trade Finance Participations (1) |
|
|
|
|
|
|
|
|
|
|
|
|
|
|
|
|
|
|
|
|
|
|
|
|
|
|
|
|
|
|
|
|
|
|
||
|
Argentina |
|
Compania Argentina de Granos S.A. (17), (18) |
|
Agricultural Products |
|
Agriculture Distributor |
|
10.45% |
|
|
|
0.0 |
% |
|
6/30/2018 |
|
|
12,500,000 |
|
|
83% |
|
|
|
12,500,000 |
|
|
|
9,839,958 |
|
|
|
2.7 |
% |
||
|
Argentina |
|
Sancor Cooperativas Unidas Ltda (17), (18) |
|
Consumer Products |
|
Dairy Co-Operative |
|
10.67% |
|
|
|
0.0 |
% |
|
7/29/2019 |
|
|
6,000,000 |
|
|
22% |
|
|
|
6,000,000 |
|
|
|
4,719,383 |
|
|
|
1.3 |
% |
||
|
Argentina |
|
Frigorifico Regional Industrias Alimentarias, S.A., Sucursal Uruguay (17), (18) |
|
Meat, Poultry & Fish |
|
Beef Exporter |
|
11.50% |
|
|
|
0.0 |
% |
|
8/31/2017 |
|
|
9,000,000 |
|
|
28% |
|
|
|
9,000,000 |
|
|
|
6,240,961 |
|
|
|
1.7 |
% |
||
|
Argentina |
|
Algodonera Avellaneda S.A. (17), (18) |
|
Fats and Oils |
|
Oilseed Distributor |
|
9.00% |
|
|
|
0.0 |
% |
|
8/31/2017 |
|
|
6,000,000 |
|
|
27% |
|
|
|
6,000,000 |
|
|
|
3,398,558 |
|
|
|
0.9 |
% |
||
|
Cameroon |
|
Producam SA (17) |
|
Chocolate and Cocoa Products |
|
Cocoa & Coffee Exporter |
|
16.42% |
|
|
|
0.0 |
% |
|
8/31/2019 |
|
|
10,413,683 |
|
|
72% |
|
|
|
10,413,683 |
|
|
|
9,687,887 |
|
|
|
2.6 |
% |
||
|
Chile |
|
Functional Products Trading S.A. (17), (18) |
|
Farm Products |
|
Chia Seed Exporter |
|
10.90% |
|
|
|
0.0 |
% |
|
3/4/2018 |
|
|
1,326,687 |
|
|
100% |
|
|
|
1,326,687 |
|
|
|
1,269,586 |
|
|
|
0.3 |
% |
||
|
Ecuador |
|
Other Investments (7), (25) |
|
Commercial Fishing |
|
Fish Processor & Exporter |
|
9.00% |
|
|
|
0.0 |
% |
|
6/19/2019 |
|
|
35,838 |
|
|
3% |
|
|
|
35,838 |
|
|
|
35,838 |
|
|
|
0.0 |
% |
||
F-11
|
Investment Type / Country |
|
Portfolio Company |
|
Sector |
|
Description |
|
Interest |
|
|
Fees (2) |
|
|
Maturity (3) |
|
Principal Amount |
|
|
Participation % (4) |
|
|
Amortized Cost |
|
|
Fair Value |
|
|
% of Net Assets |
|
|||||||
|
Guatemala |
|
Procesos Fabriles S.A. (17), (18) |
|
Farm Products |
|
Sesame Seed Exporter |
|
12.00% |
|
|
|
0.0 |
% |
|
3/31/2016 |
|
|
881,800 |
|
|
24% |
|
|
|
881,800 |
|
|
|
10,504 |
|
|
|
0.0 |
% |
||
|
Hong Kong |
|
Other Investments (9) |
|
Coal and Other Minerals and Ores |
|
Non-Ferrous Metal Trader |
|
11.50% |
|
|
|
0.0 |
% |
|
5/4/2020 |
|
|
16,456,270 |
|
|
N/A |
|
|
|
16,456,270 |
|
|
|
16,456,270 |
|
|
|
4.5 |
% |
||
|
Hong Kong |
|
Conplex International Ltd. (17) |
|
Telephone and Telegraph Apparatus |
|
Mobile Phone Distributor |
|
12.00% |
|
|
|
0.0 |
% |
|
3/31/2020 |
|
|
9,500,000 |
|
|
26% |
|
|
|
9,500,000 |
|
|
|
8,840,048 |
|
|
|
2.4 |
% |
||
|
Mauritius |
|
Other Investments (9) |
|
Groceries and Related Products |
|
Vanilla Exporter |
|
12.20% |
|
|
|
0.0 |
% |
|
5/8/2020 |
|
|
468,756 |
|
|
2% |
|
|
|
468,756 |
|
|
|
468,756 |
|
|
|
0.1 |
% |
||
|
Morocco |
|
Mac Z Group SARL (17), (18) |
|
Secondary Nonferrous Metals |
|
Scrap Metal Recycler |
|
11.00% |
|
|
|
0.0 |
% |
|
7/31/2018 |
|
|
7,349,626 |
|
|
73% |
|
|
|
7,349,626 |
|
|
|
7,530,616 |
|
|
|
2.0 |
% |
||
|
Nigeria |
|
Other Investments (9), (27) |
|
Farm Products |
|
Cocoa Trader III |
|
9.00% |
|
|
|
0.0 |
% |
|
4/30/2020 |
|
|
675,256 |
|
|
25% |
|
|
|
675,256 |
|
|
|
675,256 |
|
|
|
0.2 |
% |
||
|
Nigeria |
|
Other Investments (9), (27) |
|
Farm Products |
|
Cocoa Trader II |
|
9.00% |
|
|
|
0.0 |
% |
|
4/30/2020 |
|
|
838,967 |
|
|
14% |
|
|
|
838,967 |
|
|
|
838,967 |
|
|
|
0.2 |
% |
||
|
South Africa |
|
Applewood Trading 199 Pty, Ltd.(17), (18) |
|
Food Products |
|
Fruit & Nut Distributor |
|
10.00% |
|
|
|
0.0 |
% |
|
5/22/2015 |
|
|
785,806 |
|
|
19% |
|
|
|
785,806 |
|
|
|
690,616 |
|
|
|
0.2 |
% |
||
|
South Africa |
|
Other Investments (9), |
|
Communications Equipment |
|
Electronics Assembler |
|
12.00% |
|
|
|
0.0 |
% |
|
2/14/2020 |
|
|
100,000 |
|
|
1% |
|
|
|
100,000 |
|
|
|
100,000 |
|
|
|
0.0 |
% |
||
|
United Arab Emirates |
|
Global Pharma Intelligence Sarl (17), (18) |
|
Drugs, Proprietaries, and Sundries |
|
Pharmaceuticals Distributor |
|
14.60% |
|
|
|
0.0 |
% |
|
6/30/2018 |
|
|
803,254 |
|
|
60% |
|
|
|
803,254 |
|
|
|
803,254 |
|
|
|
0.2 |
% |
||
|
Total Senior Secured Trade Finance Participations |
|
|
|
|
|
|
|
|
|
|
|
|
|
|
|
|
|
|
|
|
|
|
|
|
83,135,943 |
|
|
|
71,606,458 |
|
|
|
19.3 |
% |
||
|
Other Investments (1) |
|
|
|
|
|
|
|
|
|
|
|
|
|
|
|
|
|
|
|
|
|
|
|
|
|
|
|
|
|
|
|
|
|
|
||
|
N/A |
|
IIG TOF B.V. (17), (18), (19) |
|
Financial services |
|
Receivable from IIG TOF B.V. |
|
8.75% |
|
|
|
0.0 |
% |
|
N/A |
|
|
6,000,000 |
|
|
N/A |
|
|
|
6,000,000 |
|
|
|
3,758,063 |
|
|
|
1.0 |
% |
||
|
Equity Warrants |
|
|
|
|
|
|
|
|
|
|
|
|
|
|
|
|
|
|
|
|
|
|
|
|
|
|
|
|
|
|
|
|
|
|
||
|
Mexico |
|
Blue Arrow Biojet Holdings, LLC |
|
Refuse Systems |
|
Waste to Fuels Processor |
|
N/A |
|
|
N/A |
|
|
N/A |
|
N/A |
|
|
N/A |
|
|
|
- |
|
|
|
1,080,222 |
|
|
|
0.3 |
% |
||||
|
|
|
|
|
|
|
|
|
|
|
|
|
|
|
|
|
|
|
|
|
|
|
|
|
|
|
|
|
|
|
|
|
|
|
|
|
|
|
Total Investments |
|
|
|
|
|
|
|
|
|
|
|
|
|
|
|
|
|
|
|
|
|
$ |
352,351,819 |
|
|
$ |
340,298,376 |
|
|
|
|
|
||||
See accompanying notes to the consolidated financial statements.
|
1 |
Refer to Notes 2, 3 and 4 of the consolidated financial statements for additional information on the Company’s investments. |
|
2 |
Fees may include upfront, origination, commitment, facility and/or other fees that the borrower must contractually pay to the Company. Fees, if any, are typically received in connection with term loan transactions and are rarely applicable to trade finance transactions. |
|
3 |
Trade finance borrowers may be granted flexibility with respect to repayment relative to the stated maturity date to accommodate specific contracts and/or business cycle characteristics. This flexibility in each case is agreed upon between the Company and the sub-advisor and between the sub-advisor and the borrower. |
|
4 |
Percentage of the Company’s participation in total borrowings outstanding under sub-advisor provided financing facility. |
|
5 |
Principal and interest paid monthly. |
|
6 |
Principal and interest paid quarterly. |
|
7 |
Monthly interest only payment. Principal due at maturity. |
|
8 |
Semi-annual interest only payment. Principal due at maturity. |
|
9 |
Principal and interest paid at maturity. |
|
10 |
Two-thirds and one-third of the principal and accrued interest to be paid on the 30th and 42nd months after original drawdown date of 8/10/2017, respectively. Subsequent to 9/30/2019, $1.8 million was received as partial repayment. |
|
11 |
Cash interest paid monthly. Principal, including PIK interest, to be repaid in equal monthly installments starting in October 2020. |
|
12 |
Principal and interest paid annually. The maturity date was extended to 2/28/2021 in connection with a restructure of the loan. Refer to Note 3 for additional information. |
|
13 |
Semi-annual interest payments. Semi-annual principal payment of $1.07 million starting January 31, 2021 with remaining balance due at maturity. |
|
14 |
Quarterly interest payments. Principal payments of 30% of total principal balance disbursed to be repaid on 6/30/2020 and 6/30/2021, with the remaining principal to be paid at maturity. |
|
15 |
Interest accrues at a variable rate of one-month Libor + 10.5%, which is paid currently, and also includes 4.68% of deferred interest due at maturity. |
|
16 |
In connection with a restructure of the underlying facilities, all maturity dates were extended to 8/15/21. This investment was removed from the Watch List on April 1, 2019. |
|
17 |
Watch List investment. Refer to Note 3 for additional information. |
|
18 |
Investment on non-accrual status. |
|
19 |
This investment was originally classified as an investment in a credit facility originated by IIG TOF B.V., a fund advised IIG. During the third quarter of 2018, as part of its quarterly verification process, the Company learned new information concerning this investment, which resulted in the Company reclassifying it from senior secured trade finance participations to short term investments. Please see Note 3 for additional information. |
|
20 |
Loan is denominated in euro currency with a principal amount of 6,200,000 euro, however the Company’s participation is denominated in US dollars. The quarterly interest payments are paid at the current exchange rate and subject to foreign currency fluctuations. The fair value includes an investment premium of $228,027. |
|
21 |
Cash interest paid monthly. Principal, including PIK interest, to be repaid in equal monthly installments starting in October 2020. |
|
22 |
Interest paid quarterly. Principal to be repaid in four equal quarterly installments starting in September 2020. |
|
23 |
Interest paid quarterly. Principal to be repaid in four equal quarterly installments starting in March 2020. |
|
24 |
Interest paid quarterly. Principal to be repaid in five equal quarterly installments starting in March 2020. |
|
25 |
During the third quarter 2018, the maturity date of this investment was extended to 6/19/2019. |
|
26 |
The maturity dates of these investments were previously extended to 1/2/2019 to 2/14/2019. During the first quarter 2019, they were further extended to December 2019 to February 2020. |
|
27 |
The Company extended the maturity dates of these investments during the fourth quarter of 2019 to 4/30/2020. |
|
28 |
Quarterly interest payments. Principal to start amortizing 15 months from initial utilization date (IUD) as follows: 4.5% of loan balance quarterly until IUD + 27 months, then 6.5% of loan balance quarterly until IUD + 48 months, thereafter 7.5% of loan balance quarterly until maturity. |
F-12
TRILINC GLOBAL IMPACT FUND, LLC
Notes to Consolidated Financial Statements
December 31, 2020
Note 1. Organization and Operations of the Company
TriLinc Global Impact Fund, LLC (the “Company”) was organized as a Delaware limited liability company on April 30, 2012 and formally commenced operations on June 11, 2013. The Company makes impact investments in Small and Medium Enterprises, known as SMEs, which the Company defines as those businesses having less than 500 employees, primarily in developing economies that provide the opportunity to achieve both competitive financial returns and positive measurable impact. The Company uses the proceeds raised from the issuance of units to invest in SMEs through local market sub-advisors in a diversified portfolio of financial assets, including direct loans, convertible debt instruments, trade finance, structured credit and preferred and common equity investments. To a lesser extent, the Company may also make impact investments in companies that may not meet our technical definition of SMEs due to a larger number of employees but that also provide the opportunity to achieve both competitive financial returns and positive measurable impact. In addition, the Company may also make investments in developed economies, including the United States. The Company generally expects that such investments will have similar investment characteristics as SMEs as defined by the Company. The Company’s investment objectives are to generate current income, capital preservation and modest capital appreciation primarily through investments in SMEs. The Company is externally managed by TriLinc Advisors, LLC (the “Advisor”). The Advisor is an investment advisor registered with the Securities and Exchange Commission (“SEC”).
TriLinc Global, LLC (the “Sponsor”) is the sponsor of the Company and employs staff who operate both the Advisor and the Company. Until July 2019, the Sponsor owned 85% of the units of the Advisor and Strategic Capital Advisory Services, LLC (“SCAS”) owned 15% of the Advisor, and was considered an affiliate of the Company. The Sponsor, the Advisor and SCAS are Delaware limited liability companies. In July 2019, the Sponsor acquired SCAS’ 15% ownership interest in the Advisor. As a result, the Sponsor now owns 100% of the Advisor and SCAS is no longer considered to be an affiliate of the Company.
In May 2012, the Advisor purchased 22,161 Class A units for aggregate gross proceeds of $200,000. The Company commenced its initial public offering of up to $1,500,000,000 in units of limited liability company interest (the “Offering”) on February 25, 2013. On June 11, 2013, the Company satisfied its minimum offering requirement of $2,000,000 when the Sponsor purchased 321,330 Class A units for aggregate gross proceeds of $2,900,000 and the Company commenced operations. The primary offering terminated on March 31, 2017. The Company continues to offer and sell units pursuant to its Distribution Reinvestment Plan (“DRP”). Through the termination of the primary offering, the Company raised approximately $361,776,000 in gross proceeds, including approximately $13,338,000 raised through the DRP. For the period from April 1, 2017 to December 31, 2020, the Company raised an additional $93,684,000 pursuant to a private placement and $37,571,000 pursuant to the DRP for total gross proceeds of $493,031,000 as of December 31, 2020.
Although the Company was organized and intends to conduct its business in a manner so that it is not required to register as an investment company under the Investment Company Act of 1940, as amended, the consolidated financial statements are prepared using the specialized accounting principles of the Financial Accounting Standards Board Accounting Standards Codification (“ASC”) Topic 946, Financial Services — Investment Companies. Overall, the Company’s management believes the use of investment company accounting makes the Company’s financial statements more useful to investors and other financial statement users since it allows a more appropriate basis of comparison to other entities with similar objectives.
To assist the Company in achieving its investment objective, the Company makes investments via wholly owned subsidiaries (each a “Subsidiary” and collectively, the “Subsidiaries”), all of which are Cayman Islands exempted companies. The Subsidiaries own all of the Company’s investments. As of December 31, 2020, the Company’s subsidiaries are as follows:
|
|
• |
TriLinc Global Impact Fund – Asia, Ltd. |
|
|
• |
TriLinc Global Impact Fund – Latin America, Ltd. |
|
|
• |
TriLinc Global Impact Fund – Trade Finance, Ltd. |
|
|
• |
TriLinc Global Impact Fund – African Trade Finance, Ltd. |
|
|
• |
TriLinc Global Impact Fund – Africa, Ltd. |
|
|
• |
TriLinc Global Impact Fund – Latin America II, Ltd. |
|
|
• |
TriLinc Global Impact Fund – African Trade Finance II, Ltd. |
|
|
• |
TriLinc Global Impact Fund – Latin America III, Ltd. |
|
|
• |
TriLinc Global Impact Fund – Asia II, Ltd. |
|
|
• |
TriLinc Global Impact Fund – Asia III, Ltd. |
|
|
• |
TriLinc Global Impact Fund – Asia IV, Ltd. |
|
|
• |
TriLinc Global Impact Fund – African Trade Finance III, Ltd. |
|
|
• |
TriLinc Global Impact Fund – Europe, Ltd. |
|
|
• |
TriLinc Global Impact Fund – Cayman, Ltd. |
F-13
Through December 31, 2020, the Company has made, through its Subsidiaries, loans in a number of countries located in South America, Asia, Africa, and Europe.
COVID-19
There is an ongoing COVID-19 pandemic (more commonly referred to as the Coronavirus), which continues to adversely impact many industries and businesses directly or indirectly. Adverse impacts include disrupted global travel and supply chains, which adversely impact global commercial activity. Many businesses across the globe have seen a downturn in production and productivity due to the suspension of business and temporary closure of offices and factories in an attempt to curb the spread of the Coronavirus. Any of these adverse developments could have a material adverse effect on our business, financial condition and results of operations. In addition, the extent of the impact of COVID-19 on the Company borrowers’ business, financial condition and results of operations may result in their inability to make required payments in the near term which could impact the fair value of the Company’s investments. Although multiple vaccines have been approved for use in certain countries, there is uncertainty as to when a sufficient portion of the population will be vaccinated such that restrictions and safety protocols can be relaxed. Although the Coronavirus has created material uncertainty and economic disruption, due to the rapidly evolving nature of the situation, we cannot predict the ultimate impact it will have on us. The Company is managing the situation through active engagement with its borrowers and is analyzing the potential effects COVID-19 may have on the portfolio or any potential capital deployments. Additionally, our Advisor has implemented its business continuity plan and additional procedures designed to protect against the introduction of the coronavirus to the workforce, including permitting and encouraging employees to work remotely, temporarily ceasing travel and significantly enhanced office sterilization procedures to minimize the probability of contagion.
As of the date of this report, COVID-19 has had a significant impact with respect to current and future payment performance with respect to 23.0% of the Company’s investments (based on the fair value of the investments as of December 31, 2020).
While many of the Company’s borrowers' businesses have experienced some disruption related to COVID-19, degrees of effect have varied to-date. As indicated under "-Watch List Investments" below, the borrowers with respect to three of the six investments added to the Watch List for the year ended December 31, 2020 have not made required payments in part due to adverse impacts they have experienced related to the COVID-19 pandemic. Where appropriate, the Company and/or the Company’s sub-advisors are working with borrowers to restructure facilities and may restructure additional facilities to provide relief needed by certain borrowers, without necessarily providing concessions that are out of market. In the case of one investment, where efforts to reach an appropriate risk-adjusted restructuring have been unsuccessful, the Company sub-advisor issued a notice of default and acceleration notice, including the initiation of legal proceedings to recover amounts due. Due to the disruptions associated with COVID-19, the Company can provide no assurances that it will be able to continue to collect interest and principal payments at levels comparable to those prior to the pandemic. Further, the Company can provide no assurances that it will be able to recover all past due amounts from delinquent borrowers. The economic uncertainty and disruption caused by the pandemic is expected to be prolonged and the Company may see further defaults and additional investments may be added to the Watch List in subsequent quarters. The adverse impact of COVID-19 was a significant contributor to the $0.424 decline in the Company's NAV per unit as of December 31, 2020, as compared to the Company's NAV per unit as of December 31, 2019.
In addition, the Company has seen, and expects to continue to see, a slowdown in transaction volume due to the impact of the pandemic, as smaller SMEs and those in industries most affected by COVID-19 (travel and hospitality, retail sales, etc.) may no longer be in a position to appropriately add debt capital. Transaction volumes may also be affected by restrictions on travel and other shelter in place orders, making it more difficult to conduct in-person visits with potential borrowers. Additionally, in future periods the Company may hold higher levels of cash than before the pandemic to ensure it has sufficient cash available to meet its cash obligations. A potential slower pace of deployment or higher cash balances each have the potential to further reduce cash flow generated to cover the Company’s distributions to its unitholders and/or cause the Company to further reduce its NAV in future periods.
Note 2. Significant Accounting Policies
Basis of Presentation
The Company’s financial information is prepared in accordance with accounting principles generally accepted in the United States of America (“GAAP”). The Company follows the accounting and reporting guidance in the FASB ASC Topic 946 — Financial Services, Investment Companies (“ASC 946”). The preparation of financial statements in accordance with GAAP requires management to make estimates and assumptions that affect the reported amounts of assets and liabilities and disclosure of contingent assets and liabilities at the date of the financial statements and the reported amounts of revenues and expenses during the reporting period. Although these estimates are based on management's knowledge of current events and actions it may undertake in the future, actual results may differ from these estimates. In particular, the COVID-19 pandemic has adversely impacted and is likely to further adversely impact the Company's business, the businesses of the Company's borrowers and the global markets generally. The full extent to which the pandemic will directly or indirectly impact the Company's business, results of operations and financial condition,
F-14
including fair value measurements, and asset impairment charges, will depend on future developments that are highly uncertain and difficult to predict. These developments include, but are not limited to, the duration and spread of the outbreak, its severity, the actions to contain the virus or address its impact, governmental actions to contain the spread of the pandemic and respond to the reduction in global economic activity, and how quickly and to what extent normal economic and operating conditions can resume.
The accompanying consolidated financial statements include the accounts of the Company and its Subsidiaries, which were established to hold certain investments of the Company. The Company owns 100% of each Subsidiary and, as such, the Subsidiaries are consolidated into the Company’s consolidated financial statements. Transactions between Subsidiaries, to the extent they occur, are eliminated in consolidation. The consolidated financial statements reflect all adjustments, consisting solely of normal recurring accruals, that, in the opinion of management, are necessary for the fair presentation of the results of the operations and financial condition as of and for the periods presented. These financial statements are presented in United States (“U.S.”) dollars, which is the functional and reporting currency of the Company and all its subsidiaries.
Cash
Cash consists of demand deposits at a financial institution located in the U.S. Such deposits may be in excess of the Federal Deposit Insurance Corporation insurance limits. The Company considers the credit risk of this financial institution to be remote and has not experienced and does not expect to experience any losses in any such accounts. The Company limits its credit risk by selecting financial institutions considered to be highly creditworthy.
Revenue Recognition
The Company records interest income on an accrual basis to the extent that the Company expects to collect such amounts. The Company does not accrue as a receivable interest on loans for accounting purposes if there is reason to doubt the ability to collect such interest. Structuring, upfront and similar fees are recorded as a discount on investments purchased and are accreted into interest income, on a straight-line basis, which the Company has determined not to be materially different from the effective yield method.
The Company records prepayment fees for loans and debt securities paid back to the Company prior to the maturity date as income upon receipt.
The Company generally places loans on non-accrual status when there is a reasonable doubt that principal or interest will be collected. If, however, management believes the principal and interest will be collected, a loan may be left on accrual status during the period the Company is pursuing repayment of the loan. Interest payments received on non-accrual loans may be recognized as income or applied to principal depending upon management’s judgment of the financial condition of the borrower. Non-accrual loans are generally restored to accrual status when past due principal and interest is paid and, in the Company’s management’s judgment, is likely to remain current over the remainder of the term.
Valuation of Investments
The Company carries all of its investments at fair value with changes in fair value recognized in the consolidated statement of operations. Fair value is the price that would be received when selling an asset or paid to transfer a liability in an orderly transaction between market participants at the measurement date.
The fair value measurement guidance establishes a hierarchal disclosure framework that prioritizes and ranks the level of market price observability of inputs used in measuring investments at fair value. Market price observability is affected by a number of factors, including the type of investment and the characteristics specific to the investment. Investments with readily available active quoted prices or for which fair value can be measured from actively quoted prices generally will have a higher degree of market price observability and a lesser degree of judgment used in measuring fair value.
Based on the observability of the inputs used in the valuation techniques, the Company is required to provide disclosures on fair value measurements according to the fair value hierarchy. The fair value hierarchy ranks the observability of the inputs used to determine fair values. Investments carried at fair value are classified and disclosed in one of the following three categories:
|
|
• |
Level 1 — Valuations based on unadjusted quoted prices in active markets for identical assets or liabilities that the Company has the ability to access at the measurement date. |
|
|
• |
Level 2 — Valuations based on inputs other than quoted prices included in Level 1, which are either directly or indirectly observable. |
|
|
• |
Level 3 — Valuations based on inputs that are unobservable and where there is little, if any, market activity at the measurement date. The inputs for the determination of fair value may require significant management judgment or estimation and is based upon management’s assessment of the assumptions that market participants would use in pricing the assets or liabilities. |
These investments include debt and equity investments in private companies or assets valued using the income, market or cost approach and may involve pricing models whose inputs require significant judgment or estimation because of the absence of any meaningful current market data for identical or similar investments. The inputs in these valuations may include, but are not limited to, capitalization and discount rates and earnings before interest, taxes, depreciation and amortization (“EBITDA”) multiples. The
F-15
information may also include pricing information or broker quotes, which include a disclaimer that the broker would not be held to such a price in an actual transaction. Certain investments may be valued based upon a collateral approach, which uses estimated value of underlying collateral and include adjustments deemed necessary for estimates of costs to obtain control and liquidate available collateral. The non-binding nature of consensus pricing and/or quotes accompanied by disclaimer would result in classification as Level 3 information, assuming no additional corroborating evidence.
The inputs used in the determination of fair value may require significant judgment or estimation.
Investments for which market quotations are readily available are valued at those quotations. Most of the Company’s investments are loans to private companies, which are not actively traded in any market and for which quotations are not available. For those investments for which market quotations are not readily available, or when such market quotations are deemed by the Advisor not to represent fair value, the Company’s board of managers has approved a multi-step valuation process to be followed each fiscal quarter, as described below:
|
|
1. |
Each investment is valued by the Advisor in collaboration with the relevant sub-advisor; |
|
|
2. |
For all investments with a stated maturity of greater than 12 months, the Company has engaged a third-party independent valuation firm to perform certain limited procedures that the Company identified and requested the independent valuation firm perform a review on the reasonableness of the Company’s internal estimates of fair value on each asset on a quarterly rotating basis, with each of such investments being reviewed at least annually. In addition, the Company engaged an independent valuation firm to perform certain limited procedures that the Company identified and requested the independent valuation firm to perform to provide an estimate of the range of fair value of material investments on the Watch List. The analysis performed by the independent valuation firm was based upon data and assumptions provided to it by the Company and received from third party sources, which the independent valuation firm relied upon as being accurate without independent verification. The results of the analyses performed by the independent valuation firm are among the factors taken into consideration by the Company and its management in making its determination with respect to the fair value of such investments, but are not determinative. The Company and its management are solely and ultimately responsible for determining the fair value of the Company’s investments in good faith; |
|
|
3. |
The audit committee of the Company’s board of managers reviews and discusses the preliminary valuation prepared by the Advisor and any report rendered by the independent valuation firm; and |
|
|
4. |
The board of managers discusses the valuations and determines the fair value of each investment in the Company’s portfolio in good faith based on the inputs which include but are not limited to, inputs of the Advisor, the independent valuation firm and the audit committee. The Company and its board of managers are solely and ultimately responsible for the determination, in good faith, of the fair value of each investment. |
Below is a description of factors that the Company’s board of managers may consider when valuing the Company’s investments.
Any potential valuation adjustments are subject to a materiality threshold as determined by the Advisor. Due to the fact that all non-Watch List investments are performing loans, with no macroeconomic indicator or other event observed that would reasonably be expected to have a material impact on the underlying performance or collateral value of the investment, most of these investments generally do not deviate materially from the amortized cost. If, pursuant to the Company's quarterly review, the Company determines that one or more material valuation adjustments are appropriate, then the Company adjusts the fair value. Historically, in most cases these adjustments that have resulted in a fair value that is materially different from amortized cost have resulted in the Company's determination to place the investment on the Watch List.
Fixed income investments are typically valued utilizing a market approach, income approach, collateral based approach, or a combination of these approaches (and any others, as appropriate). The market approach uses prices and other relevant information generated by market transactions involving identical or comparable assets or liabilities (including the sale of a business) and is used less frequently due to the private nature of the Company’s investments. The income approach uses valuation techniques to convert future amounts (for example, interest and principal payments) to a single present value amount (Discounted Cash Flow or “DCF”) calculated based on an appropriate discount rate. The measurement is based on the net present value indicated by current market expectations about those future amounts. For Watch List investments, the Company predominantly uses the income approach, but may also use a collateral based approach (also known as a liquidation or net recovery approach), or a hybrid approach consisting of the income approach and the collateral based approach. The collateral based approach uses estimates of the collateral value of the borrower’s assets using an expected recovery model. When using the collateral based approach, the Company determines the fair value of the remaining assets, discounted to reflect the anticipated amount of time to recovery and the uncertainty of recovery. The Company also may make further adjustments to account for anticipated costs of recovery, including legal fees and expenses. In following a given approach, the types of factors that the Company may take into account in valuing the Company’s investments include, as applicable:
|
|
• |
Macro-economic factors that are relevant to the investment or the underlying borrower |
|
|
• |
Industry factors that are relevant to the investment or the underlying borrower |
|
|
• |
Historical and projected financial performance of the borrower based on most recent financial statements |
F-16
|
|
• |
Borrower draw requests and payment track record |
|
|
• |
Loan covenants, duration and drivers |
|
|
• |
Performance and condition of the collateral (nature, type and value) that supports the investment |
|
|
• |
Sub-Advisor recommendation as to possible impairment or reserve, including updates and feedback |
|
|
• |
For participations, the Company’s ownership percentage of the overall facility |
|
|
• |
Key inputs and assumptions that are believed to be most appropriate for the investment and the approach utilized |
|
|
• |
Applicable global interest rates |
|
|
• |
Impact of investments placed on non-accrual status |
With respect to warrants and other equity investments, as well as certain fixed income investments, the Company may also look to private merger and acquisition statistics, public trading multiples discounted for illiquidity and other factors, valuations implied by third-party investments in the portfolio companies, option pricing models or industry practices in determining fair value. The Company may also consider the size and scope of a portfolio company and its specific strengths and weaknesses, as well as any other factors the Company deems relevant in measuring the fair values of the Company’s investments.
Net Realized Gains or Losses and Net Change in Unrealized Appreciation or Depreciation on Investments
The Company measures net realized gains or losses by the difference between the net proceeds from the repayment or sale on investments and the amortized cost basis of the investment including unamortized upfront fees and prepayment penalties. Realized gains or losses on the disposition of an investment are calculated using the specific identification method, utilizing the amortized cost basis of the investment, without regard to unrealized appreciation or depreciation previously recognized, but considering any prepayment penalties. Net change in unrealized appreciation or depreciation reflects the change in portfolio investment values during the reporting period, including any reversal of previously recorded unrealized appreciation or depreciation, when gains or losses are realized.
Payment-in-Kind Interest
The Company has investments that contain a payment-in-kind, or PIK, interest provision. For loans with contractual PIK interest, any interest will be added to the principal balance of such investments and be recorded as income, if the valuation indicates that such interest is collectible. For the years ended December 31, 2020 and 2019, the Company earned and capitalized PIK interest of $19,042,591 and $10,380,892, respectively.
Distribution and Ongoing Dealer Manager and Services Fees
The Company pays a distribution fee equal to 0.8% per annum of the Company’s current estimated value per share for each Class C unit sold in the Offering or pursuant to a private placement. The distribution fee is payable until the earlier to occur of the following: (i) a listing of the Class C units on a national securities exchange, (ii) following completion of each respective offering, total selling compensation equaling 10% of the gross proceeds of such offering, or (iii) there are no longer any Class C units outstanding. In addition, the Company pays an ongoing dealer manager fee for each Class I unit and Class W unit sold pursuant to a private placement. Such ongoing dealer manager fee is payable for five years until the earlier of: (x) the date on which such Class I units or Class W units are repurchased by the Company; (y) the listing of the Class I units or Class W units on a national securities exchange, the sale of the Company or the sale of all or substantially all of the Company’s assets; or (z) the fifth anniversary of the admission of the investor as a unitholder. Further, the Company pays an ongoing service fee for each Class W unit sold pursuant to the private placement. Such ongoing service fee is payable for six years until the earlier of: (x) the date on which such Class W units are repurchased by the Company; (y) the listing of the Class W units on a national securities exchange, the sale of the Company or the sale of all or substantially all of the Company’s assets; or (z) the sixth anniversary of the admission of the investor as a unitholder. The distribution fees, ongoing dealer manager fees and service fees are not paid at the time of purchase. Such fees are payable monthly in arrears, as they become contractually due.
The Company accounts for the distribution fees as a charge to equity at the time each Class C unit was sold in the Offering and recorded a corresponding liability for the estimated amount to be paid in future periods. The Company accounts for the ongoing dealer manager fees and service fees paid in connection with the sale of Class I and Class W units in the private placement in the same manner. At December 31, 2020, the estimated unpaid distribution fees for Class C units amounted to $458,000, the unpaid dealer manager fees for Class I units amounted to $21,000 and the unpaid dealer manager and service fees for Class W units amounted to $1,000.
F-17
Income Taxes
The Company is classified as a partnership for U.S. federal income tax purposes. As such, the Company allocates all income or loss to its unitholders according to their respective percentage of ownership, and is generally not subject to tax at the entity level. Therefore, no provision for federal or state income taxes has been included in these financial statements.
The Company may be subject to withholding taxes on income and capital gains imposed by certain countries in which the Company invests. The withholding tax on income is netted against the income accrued or received. Any reclaimable taxes are recorded as income. The withholding tax on realized or unrealized gain is recorded as a liability.
The Company follows the guidance for uncertainty in income taxes included in the ASC 740, Income Taxes. This guidance requires the Company to determine whether a tax position of the Company is more likely than not to be sustained upon examination by the applicable taxing authority, including the resolution of any related appeals or litigation processes, based on the technical merits of the position.
As of December 31, 2020, no tax liability for uncertain tax provision had been recognized in the accompanying financial statements nor did the Company recognize any interest and penalties related to unrecognized tax benefits. The earliest year that the Company’s income tax returns are subject to examination is the period ended December 31, 2016.
Unitholders are individually responsible for reporting income or loss, to the extent required by the federal and state income tax laws and regulations, based upon their respective share of the Company’s income and expense as reported for income tax purposes.
Calculation of Net Asset Value
The Company’s net asset value is calculated on a quarterly basis. As of December 31, 2020, the Company has six classes of units: Class A units, Class C units, Class I units, Class W units, Class Y units and Class Z units. All units participate in the income and expenses of the Company on a pro-rata basis based on the number of units outstanding. Under GAAP, pursuant to SEC guidance, the Company records liabilities for (i) ongoing fees that the Company currently owes to the dealer manager under the terms of the dealer manager agreement and (ii) for an estimate of the fees that the Company may pay to the dealer manager in future periods. As of December 31, 2020, under GAAP, the Company has recorded a liability in the amount of $480,000 for the estimated future amount of Class C unit distribution fees, Class I unit dealer manager fees, Class W unit ongoing dealer manager fees and Class W unit service fees payable.
The Company is not required to determine its net asset value per unit under GAAP and therefore, its determination of net asset value per unit for Class C units, Class I units and Class W units varies from GAAP. The Company does not deduct the liability for estimated future distribution fees in its calculation of net asset value per unit for Class C units. Further, the Company does not deduct the liability for estimated future dealer manager fees in its calculation of the net asset value per unit for Class I units and Class W units. Likewise, the Company does not deduct the liability for estimated future service fees in its calculation of the net asset value per unit for Class W units. The Company believes this approach is consistent with the industry standard and appropriate since the Company intends for the net asset value to reflect the estimated value on the date that the Company determines its net asset value.
Accordingly, the Company believes that its estimated net asset value at any given time should not include consideration of any estimated future distribution, ongoing dealer manager or service fees that may become payable after such date. As a result, as of December 31, 2020, each of the Class A, Class C, Class I, Class W, Class Y and Class Z units have the same net asset value per unit of $7.600, which is different than the net asset value per unit of $7.584 (on an aggregate basis for all unit classes) as shown in Note 10 – Financial Highlights. This net asset value per unit reflects a decrease of $0.424 per unit from the net asset value per unit of $8.024 as of December 31, 2019. The decrease in net asset value per unit was primarily due to the Company having recorded $15,037,022 in unrealized depreciation on its investments during the year ended December 31, 2020.
Net Income (Loss) per Unit
Basic net income (loss) per unit is computed by dividing net income (loss) by the weighted average number of members’ units outstanding during the period. Diluted net income or loss per unit is computed by dividing net income (loss) by the weighted average number of members’ units and members’ unit equivalents outstanding during the period. The Company did not have any potentially dilutive units outstanding at December 31, 2020 and 2019.
Organization and Offering Costs
The Sponsor has incurred organization and offering costs on behalf of the Company. Organization and offering costs incurred in connection with the Offering are reimbursable to the Sponsor to the extent the aggregate of selling commissions, dealer manager fees and other organization and offering costs do not exceed 15.0% of the gross offering proceeds (the “O&O Reimbursement Limit”) raised from the Offering and will be accrued and payable by the Company only to the extent that such costs do not exceed the O&O Reimbursement Limit. These expense reimbursements are subject to regulatory caps and approval by the Company’s board of
F-18
managers. Reimbursements to the Sponsor are included as a reduction to net assets on the Consolidated Statement of Changes in Net Assets. Based on the proceeds raised in the Offering at the end of the primary offering, the organization and offering expenses were equal to 4.7% of the gross proceeds. As a result of the termination of the primary offering, effective March 31, 2017, the Company no longer pays the dealer manager selling commissions and dealer manager fees under a dealer manager agreement relating to the Offering. The Company will continue to incur certain organization and offering costs associated with the DRP and ongoing distribution fees on Class C units. In addition, the Sponsor has and may continue to incur organization and offering costs on behalf of the Company in connection with private placements of the Company’s units and the Company will pay selling commissions, dealer manager fees and ongoing distribution, dealer manager, and service fees to the dealer manager for certain sales pursuant to private placements. As of December 31, 2020, the Sponsor has incurred approximately $596,000 in organization and offering costs on behalf of the Company related to private placements of the Company’s units. Through December 31, 2020, the Company has reimbursed an aggregate amount of approximately $87,000 of the organization and offering costs incurred relating to such private placements and is under no obligation to reimburse the Sponsor for the remainder.
Operating Expense Responsibility Agreement
On March 26, 2018, the Company, Advisor and the Sponsor entered into an Amended and Restated Operating Expense Responsibility Agreement (“Responsibility Agreement”) originally effective as of June 11, 2013 and covering expenses through December 31, 2017. Since the inception of the Company through December 31, 2017, pursuant to the terms of the Responsibility Agreement, the Sponsor paid approximately $12,420,600 of operating expenses, asset management fees, and incentive fees on behalf of the Company and will reimburse to the Company an additional $4,057,734 of expenses, which had been paid by the Company as of December 31, 2017.
The Sponsor will only be entitled to reimbursement of the cumulative expenses it has incurred on the Company’s behalf to the extent the Company’s investment income in any quarter, as reflected on the statement of operations, exceeds the sum of (a) total distributions to unitholders incurred during the quarter and (b) the Company’s expenses as reflected on the statement of operations for the same quarter (the “Reimbursement Hurdle”). If the Sponsor is entitled to receive reimbursement for any given quarter because the Company’s investment income exceeds the Reimbursement Hurdle for such quarter, the Company will apply the excess amount (the “Excess Amount”) as follows: (i) first, the Company will reimburse the Sponsor for all expenses, other than asset management fees and incentive fees, that the Sponsor previously paid on the Company’s behalf, which will generally consist of operating expenses (the “Previously Paid Operating Expenses”) until all Previously Paid Operating Expenses incurred to date have been reimbursed; and (ii) second, the Company will apply 50% of the Excess Amount remaining after the payment of Previously Paid Operating Expenses to reimburse the Sponsor for the asset management fees and incentive fees that the Sponsor has agreed to pay on the Company’s behalf until all such asset management fees and incentive fees accrued to date have been reimbursed.
The Company did not meet the Reimbursement Hurdle for the years ended December 31, 2020 and 2019. Therefore, none of the expenses of the Company covered by the Responsibility Agreement have been recorded as expenses of the Company for the years ended December 31, 2020 and 2019. As of December 31, 2020, there is a remaining aggregate balance of approximately $16,091,300 in expenses covered by the Responsibility Agreement which are not yet reimbursable to the Sponsor and have not been recorded by the Company. In accordance with ASC 450, Contingencies, such expenses will be accrued and payable by the Company in the period that they become both probable and estimable. The Sponsor may demand the reimbursement of cumulative Company expenses covered by the Responsibility Agreement to the extent the Company exceeds the Reimbursement Hurdle during any quarter.
Recently Issued Accounting Pronouncements
In June 2016, the FASB issued Accounting Standards Update (“ASU”) 2016-13, “Financial Instruments - Credit Losses (Topic 326): Measurement of Credit Losses on Financial Instruments.” ASU 2016-13 introduces an approach based on expected losses to estimate credit losses for financial instruments measured at amortized cost. ASU 2016-13 also modifies the impairment model for available-for-sale debt securities and provides for a simplified accounting model for purchased financial assets with credit deterioration since their origination. ASU 2016-13 is effective for fiscal years beginning after December 15, 2022. The guidance requires companies to apply the requirements in the year of adoption through cumulative adjustment with some aspects of the update requiring a prospective transition approach. The Company believes that the adoption of ASU 2016-13 will not have a material impact on its consolidated financial statements.
In August 2018, the FASB issued ASU No. 2018-13, Fair Value Measurement (Topic 820): Disclosure Framework - Changes to the Disclosure Requirements for Fair Value Measurement, or ASU 2018-13. This update removes the disclosure requirements for the amounts of and the reasons for transfers between Level 1 and Level 2 and disclosure of the policy for timing of transfers between levels. This update also removes disclosure requirements for the valuation processes for Level 3 fair value measurements. Additionally, this update adds disclosure requirements for the changes in unrealized gains and losses for recurring Level 3 fair value measurements and quantitative information for certain unobservable inputs in Level 3 fair value measurements. ASU 2018-13 is effective for interim and annual reporting periods beginning after December 15, 2019. The Company adopted this guidance effective January 1, 2020, which did not have a material impact on its consolidated financial statements.
F-19
Risk Factors
As an externally-managed company, the Company is largely dependent on the efforts of the Advisor, the sub-advisors and other service providers and has been dependent on the Sponsor for financial support in prior periods.
The Company’s sub-advisors are responsible for locating, performing due diligence and closing on suitable acquisitions based on their access to local markets, local market knowledge for quality deal flow and extensive local private credit experience. However, because the sub-advisors are separate companies from the Advisor, the Company is subject to the risk that one or more of its sub-advisors will be ineffective or materially underperform. The Company’s ability to achieve its investment objectives and to pay distributions to unitholders will be dependent upon the performance of its sub-advisors in the identification, performance of due diligence on and acquisition of investments, the determination of any financing arrangements, and the management of the Company’s projects and assets. The Company is subject to the risk that the Company’s sub-advisors may fail to perform according to the Company’s expectations, or the due diligence conducted by the sub-advisors may fail to reveal all material risks of the Company’s investments, which could result in the Company being materially adversely affected.
The Company is subject to financial market risks, including changes in interest rates. Global economies and capital markets can and have experienced significant volatility, which has increased the risks associated with investments in collateralized private debt instruments. Investment in the Company carries risk and there are no guarantees that the Company’s investment objectives will be achieved. The Company relies on the ability of the Advisor and the ability of the sub-advisors’ investment professionals to obtain adequate information to evaluate the potential returns from these investments, which primarily are made in, with or through private companies. If the Company is unable to uncover all material information about these companies or is provided incorrect or inadequate information about these companies from the Company’s subadvisors, the Company may not make a fully informed investment decision, and the Company may lose money on its investments. As described further in “Note 3—Investments—Watch List Investments,” IIG was the sub-advisor with respect to eight of the 19 investments that we have deemed Watch List investments, which are investments with respect to which we have determined there have been significant changes in the credit and collection risk of the investment. As described in Note 3, IIG failed to provide the Company with complete and accurate information with respect to the Company’s investments for which IIG was the sub-advisor, and sold the Company a $6 million participation in a loan that did not exist. In November 2019, the SEC charged IIG with fraud and revoked IIG's registration as an investment adviser. On March 30, 2020, the SEC obtained a final judgment on consent that enjoins IIG from violating the antifraud provisions of the federal securities laws. IIG has ceased operations and the Company does not expect to receive any further reporting from IIG with respect to its outstanding investments. IIG’s acts and omissions have negatively affected and are likely to continue to negatively affect the value of certain of the Company’s investments, which could adversely affect returns to the Company’s unitholders.
The Company’s investments consist of loans, loan participations and trade finance participations that are illiquid and non-traded, making purchase or sale of such financial instruments at desired prices or in desired quantities difficult. Furthermore, the sale of any such investments may be possible only at substantial discounts, and it may be extremely difficult to value any such investments accurately.
The value of the Company’s investments in loans may be detrimentally affected to the extent, among other things, that a borrower defaults on its obligations, there is insufficient collateral securing the loan and/or there are extensive legal and other costs incurred in collecting on a defaulted loan, observable secondary or primary market yields for similar instruments issued by comparable companies increase materially or risk premiums required in the market between smaller companies, such as the Company’s borrowers, and those for which market yields are observable increase materially. The majority of the Company’s investments are in the form of participation interests, in financing facilities originated by one of the Company’s sub-advisors. Accordingly, the Company’s counterparty for investments in participation interests generally will be the respective sub-advisor or its affiliate. The Company will not have a contract with the underlying borrower and therefore, in the event of default, will not have the ability to directly seek recovery against the collateral and instead will have to seek recovery through the Company’s sub-advisor counterparty, which increases the risk of full recovery. These risks may be further exacerbated by the adverse impact the COVID-19 pandemic has had and is expected to continue to have on the business of our borrowers. In addition, as of December 31, 2020 and December 31, 2019, all but one of the Company’s investments were denominated in U.S. dollars. If the U.S. dollar rises, it may become more difficult for borrowers to make loan payments if the borrowers are operating in markets where the local currencies are depreciating relative the U.S. dollar.
In addition, certain of the Company’s investments in loans contain a PIK interest provision. These investments may expose us to higher risks, including an increased risk of potential loss because PIK interest results in an increase in the size of the outstanding loan balance. The Company may also be exposed to the risk that it may be more difficult to value the investments because the continuing accrual of interest requires continuing subjective judgments about the collectability of the deferred payments and the value of the underlying collateral. To the extent the loan is structured as a PIK interest-only loan, the probability and magnitude of a loss on the Company’s investment may increase.
At December 31, 2020, the Company’s largest loan by value was $28,531,105, or 9.9% of total investments, and provides for PIK interest, with principal and interest due at maturity. The Company’s five largest loans by value comprised 33.1% of the Company’s portfolio at December 31, 2020. Participations in loans amounted to 61.1% of the Company’s total portfolio at December 31, 2020.
F-20
Note 3. Investments
As of December 31, 2020, the Company’s investments consisted of the following:
|
|
|
|
|
|
|
|
|
|
|
Percentage |
|
|
|
|
|
Amortized Cost |
|
|
Fair Value |
|
|
of Total Investments |
|
|||
|
Senior secured term loans |
|
$ |
109,045,660 |
|
|
$ |
106,899,154 |
|
|
|
37.2 |
% |
|
Senior secured term loan participations |
|
|
136,937,838 |
|
|
|
129,917,253 |
|
|
|
45.2 |
% |
|
Senior secured trade finance participations |
|
|
63,593,156 |
|
|
|
45,800,210 |
|
|
|
15.9 |
% |
|
Other investments |
|
|
6,000,000 |
|
|
|
3,758,063 |
|
|
|
1.3 |
% |
|
Equity warrants |
|
|
- |
|
|
|
1,199,618 |
|
|
|
0.4 |
% |
|
Total investments |
|
$ |
315,576,654 |
|
|
$ |
287,574,298 |
|
|
|
100.0 |
% |
As of December 31, 2019, the Company’s investments consisted of the following:
|
|
|
|
|
|
|
|
|
|
|
Percentage |
|
|
|
|
Amortized Cost |
|
|
Fair Value |
|
|
of Total Investments |
|
||||
|
Senior secured term loans |
|
$ |
83,627,340 |
|
|
$ |
83,353,208 |
|
|
|
24.5 |
% |
|
Senior secured term loan participations |
|
|
179,588,536 |
|
|
|
180,500,425 |
|
|
|
53.1 |
% |
|
Senior secured trade finance participations |
|
|
83,135,943 |
|
|
|
71,606,458 |
|
|
|
21.0 |
% |
|
Short term investments |
|
|
6,000,000 |
|
|
|
3,758,063 |
|
|
|
1.1 |
% |
|
Equity warrants |
|
|
- |
|
|
|
1,080,222 |
|
|
|
0.3 |
% |
|
Total investments |
|
$ |
352,351,819 |
|
|
$ |
340,298,376 |
|
|
|
100.0 |
% |
Participations
The majority of the Company’s investments are in the form of participation interests (“Participations”). Participations are interests in financing facilities originated by one of the Company’s sub-advisors. Participations may be interests in one specific loan or trade finance transaction, several loans or trade finance transactions under a facility, or may be interests in an entire facility. The Company’s rights under Participations include, without limitation, all corresponding rights in payments, collateral, guaranties, and any other security interests obtained by the respective sub-advisor in the underlying financing facilities.
Interest Receivable
Depending on the specific terms of the Company’s investments, interest earned by the Company is payable either monthly, quarterly, or, in the case of most trade finance investments, at maturity. As such, some of the Company’s trade finance investments have up to a year of accrued interest receivable as of December 31, 2020. In addition, certain of the Company’s investments in term loans accrue deferred interest, which is not payable until the maturity of the loans. Accrued deferred interest included in the interest receivable balance as of December 31, 2020 and December 31, 2019 amounted to $3,418,264 and $2,796,466, respectively. The Company’s interest receivable balances at December 31, 2020 and December 31, 2019 are recorded at the amounts that the Company expects to collect.
Trade Finance
Trade finance encompasses a variety of lending structures that support the export, import or sale of goods between producers and buyers in various countries and across various jurisdictions. The strategy is most prevalent in the financing of commodities. The Company’s Participations in trade finance positions typically fall into two broad categories: pre-export financing and receivable/inventory financing. Pre-export financing represents advances to borrowers based on proven orders from buyers. Receivable/inventory financing represents advances on borrowers’ eligible receivable and inventory balances. For trade finance, the structure and terms of the facility underlying the Company’s Participations vary according to the nature of the transaction being financed. The structure can take the form of a revolver with multiple draw requests and maturity of up to one year based on collateral and performance requirements. The structure can also be specific to the individual transaction being financed, which typically have shorter durations of 60 – 180 days. With respect to underwriting, particular consideration is given to the following:
|
|
• |
nature of the goods or transaction being financed, |
|
|
• |
the terms associated with the sale and repayment of the goods, |
|
|
• |
the execution risk associated with producing, storing and shipment of the goods, |
F-21
|
|
• |
the financial and performance profile of both the borrower and end buyer(s), |
|
|
• |
the underlying advance rate and subsequent Loan to Value (“LTV”) associated with lending against the goods that serve to secure the facility or transaction, |
|
|
• |
collateral and financial controls (collection accounts and inventory possession), |
|
|
• |
third party inspections and insurance, and |
|
|
• |
the region, country or jurisdiction in which the financing is being completed. |
Collateral varies by transaction, but is typically raw or finished goods inventory, and/or receivables. In the case of pre-export finance, the transaction is secured by purchase orders from buyers or offtake contracts, which are agreements between a buyer and seller to purchase/sell a future product.
Terms depend on the nature of the facility or transaction being financed. As such, they depend on the credit profile of the underlying financing, as well as the speed and detail associated with the request for financing. Interest can be paid as often as monthly or quarterly on revolving facilities (one year in duration) or at maturity when dealing with specific transactions with shorter duration, which is the case for the majority of the Company’s trade finance positions. At times, settlement can be delayed due to documentation, shipment, transportation or port clearing issues, delays associated with the end buyer or off-taker assuming possession, possible changes to contract or offtake terms, and the aggregation of settlement of multiple individual transactions. Conversely, at times payments are made ahead of schedule, as transactions either clear faster than expected, borrowers decide to prepay or pay down ahead of schedule, counterparties clear multiple individual transactions in one settlement, or less expensive financing is secured by the borrower.
On occasion, the Company may receive notice from the respective sub-advisor that a borrower or counterparty to a financing facility underlying one of the Company’s Participations intends to pay ahead of schedule or in one lump sum (settling multiple draw requests all at once). Depending on timing and the ability to redeploy these funds, combined with projected inflows of fund capital, these outsize payments can negatively impact the Company’s performance. In these situations, the credit profile of the borrower, and the transaction in general, is reviewed with the sub-advisor and a request may be made to either stagger payments, where at all possible, or request that payment only be made at the end of that specific financial quarter. These requests or accommodations, which happen very rarely, will only be made where the Company has strong comfort in and around the credit profile of the transaction or borrower.
Short Term Investments
Short term investments are defined by the Company as investments that generally meet the standard underwriting guidelines for trade finance and term loan transactions and that also have the following characteristics: (1) maturity of less than one year, (2) loans to borrowers to whom, at the time of funding, the Company does not expect to re-lend. Impact data is not tracked for short term investments.
Warrants
Certain investments, including loans and participations, may carry equity warrants, which allow the Company to buy shares of the portfolio company at a given price, which the Company may exercise at its discretion during the life of the portfolio company. The Company’s goal is to ultimately dispose of such equity interests and realize gains upon the disposition of such interests. However, these warrants and equity interests are generally illiquid and it may be difficult for the Company to dispose of them. In addition, the Company expects that any warrants or other return enhancements received when the Company makes or invests in loans may require several years to appreciate in value and may not appreciate at all.
F-22
Watch List Investments
The Company monitors and reviews the performance of its investments and if the Company determines that there are any significant changes in the credit and collection risk of an investment, the investment will be placed on the Watch List. The Company places an investment on the Watch List when it believes the investment has material performance weakness driven by company-specific and macro events that may affect the timing of future cash flows. For all Watch List investments, the Company evaluates: (i) liquidation value of collateral; (ii) rights and remedies enforceable against the borrower; (iii) any credit insurance and/or guarantees; (iv) market, sector and macro events and (v) other relevant information (e.g., third party purchase of the borrower and potential or ongoing litigation). At December 31, 2020, ten portfolio companies were on non-accrual status with an aggregate fair value of $31,464,418 or 10.9% of the fair value of the Company’s total investments. At December 31, 2019, ten portfolio companies were on non-accrual status with an aggregate fair value of $38,261,499 or 11.2% of the fair value of the Company’s total investments. Interest income not recorded relative to the original terms of the loans to the companies on non-accrual status amounted to approximately $1,683,000 and $4,791,000, respectively for the years ended December 31, 2020 and 2019. As of December 31, 2020 and December 31, 2019, respectively, the Company had 19 and 13 Watch List investments.
As of December 31, 2020, the Company’s Watch List investments consisted of the following:
|
|
|
|
|
|
|
|
|
|
|
|
|
|
|
|
|
|
|
Interest not accrued on Investments on Watch List status |
|
|||||||||||||
|
|
|
|
|
|
|
|
|
|
|
|
|
|
|
|
|
|
|
Three Months Ended |
|
|
Year-Ended |
|
||||||||||
|
|
|
|
|
|
|
|
|
|
|
|
|
|
|
|
|
|
|
December 31, |
|
|
December 31, |
|
|
December 31, |
|
|
December 31, |
|
||||
|
Portfolio Company |
|
Principal Balance |
|
|
Fair Value |
|
|
Accrued Interest |
|
|
Sub-advisor |
|
Valuation Approach |
|
2020 |
|
|
2019 |
|
|
2020 |
|
|
2019 |
|
|||||||
|
Trustco Group Holdings Ltd. |
|
$ |
17,529,688 |
|
|
$ |
15,242,460 |
|
|
$ |
2,125,182 |
|
|
Helios |
|
Income approach |
|
$ |
- |
|
|
$ |
- |
|
|
$ |
- |
|
|
$ |
- |
|
|
TRG Cape Verde Holdings Ltd. |
|
|
13,478,292 |
|
|
|
11,337,937 |
|
|
|
1,913,827 |
|
|
Helios |
|
Income approach |
|
|
— |
|
|
|
— |
|
|
|
— |
|
|
|
— |
|
|
Helios Maritime |
|
|
15,600,710 |
|
|
|
12,986,279 |
|
|
|
2,760,320 |
|
|
Helios |
|
Income approach |
|
|
— |
|
|
|
— |
|
|
|
— |
|
|
|
— |
|
|
Compania Argentina de Granos S.A. |
|
|
12,500,000 |
|
|
|
9,679,636 |
|
|
|
664,010 |
|
|
IIG |
|
Income approach |
|
|
333,819 |
|
|
|
333,819 |
|
|
|
664,010 |
|
|
|
1,324,392 |
|
|
Frigorifico Regional Industrias Alimentarias, S.A., Sucursal Uruguay |
|
|
9,000,000 |
|
|
|
6,361,679 |
|
|
|
264,500 |
|
|
IIG |
|
Income approach |
|
|
— |
|
|
|
264,500 |
|
|
|
— |
|
|
|
1,049,375 |
|
|
Sancor Cooperativas Unidas Ltda |
|
|
6,000,000 |
|
|
|
4,719,383 |
|
|
|
931,847 |
|
|
IIG |
|
Hybrid income/collateral based approach |
|
|
— |
|
|
|
163,607 |
|
|
|
161,829 |
|
|
|
163,607 |
|
|
IIG TOF B.V. |
|
|
6,000,000 |
|
|
|
3,758,063 |
|
|
|
572,000 |
|
|
IIG |
|
Income approach |
|
|
— |
|
|
|
134,167 |
|
|
|
93,000 |
|
|
|
532,292 |
|
|
Algodonera Avellaneda S.A. |
|
|
6,000,000 |
|
|
|
3,398,558 |
|
|
|
778,500 |
|
|
IIG |
|
Income approach |
|
|
— |
|
|
|
138,000 |
|
|
|
— |
|
|
|
547,500 |
|
|
Functional Products Trading S.A. (1) |
|
|
1,326,687 |
|
|
|
1,375,794 |
|
|
|
220,881 |
|
|
IIG |
|
Income approach |
|
|
36,956 |
|
|
|
36,955 |
|
|
|
147,020 |
|
|
|
73,911 |
|
|
Representaciones Saldana S.A. (1) |
|
|
35,838 |
|
|
|
35,838 |
|
|
|
6,550 |
|
|
IIG |
|
Income approach |
|
|
— |
|
|
|
— |
|
|
|
— |
|
|
|
— |
|
|
Procesos Fabriles S.A. (1) |
|
|
881,800 |
|
|
|
10,504 |
|
|
|
— |
|
|
IIG |
|
Collateral based approach |
|
|
— |
|
|
|
27,832 |
|
|
|
36,168 |
|
|
|
110,420 |
|
|
Triton Metallics Pte Ltd. |
|
|
18,146,500 |
|
|
|
16,483,354 |
|
|
|
537,538 |
|
|
TransAsia |
|
Income approach |
|
|
— |
|
|
|
— |
|
|
|
— |
|
|
|
— |
|
|
Conplex International Ltd. |
|
|
9,500,000 |
|
|
|
3,366,356 |
|
|
|
1,312,945 |
|
|
TransAsia |
|
Collateral based approach |
|
|
44,333 |
|
|
|
— |
|
|
|
44,333 |
|
|
|
— |
|
|
Producam S.A. |
|
|
13,532,693 |
|
|
|
13,128,867 |
|
|
|
— |
|
|
AMC |
|
Income approach |
|
|
— |
|
|
|
— |
|
|
|
— |
|
|
|
— |
|
|
Global Pharma Intelligence Sarl (1) |
|
|
648,430 |
|
|
|
648,430 |
|
|
|
134,215 |
|
|
Scipion |
|
Income approach |
|
|
24,194 |
|
|
|
29,970 |
|
|
|
102,025 |
|
|
|
29,970 |
|
|
Mac Z Group SARL |
|
|
1,433,058 |
|
|
|
628,861 |
|
|
|
210,568 |
|
|
Scipion |
|
Income approach |
|
|
— |
|
|
|
206,606 |
|
|
|
204,361 |
|
|
|
819,687 |
|
|
Applewood Trading 199 Pty, Ltd. (1) |
|
|
785,806 |
|
|
|
497,462 |
|
|
|
— |
|
|
Barak |
|
Income approach |
|
|
35,142 |
|
|
|
35,143 |
|
|
|
139,807 |
|
|
|
139,426 |
|
|
Usivale Industria E Commercio Ltda (1) |
|
|
2,851,296 |
|
|
|
2,367,936 |
|
|
|
645,932 |
|
|
N/A |
|
Income approach |
|
|
90,573 |
|
|
|
— |
|
|
|
90,573 |
|
|
|
— |
|
|
Itelecom Holding Chile SPA (1) |
|
|
1,456,162 |
|
|
|
1,434,285 |
|
|
|
119,585 |
|
|
Alsis |
|
Income approach |
|
|
— |
|
|
|
— |
|
|
|
— |
|
|
|
— |
|
|
Total Watchlist |
|
$ |
136,706,960 |
|
|
$ |
107,461,682 |
|
|
$ |
13,198,400 |
|
|
|
|
|
|
$ |
565,017 |
|
|
$ |
1,370,599 |
|
|
$ |
1,683,126 |
|
|
$ |
4,790,580 |
|
|
1 |
Investments with a fair value below 1.0% of the Company's net assets as of December 31, 2020. Additional information regarding Watch List investments with a fair value equal to or greater than 1.0% of the Company's net assets as of December 31, 2020 is presented below. |
F-23
As of December 31, 2019, the Company’s Watch List investments consisted of the following:
|
|
Principal Balance |
|
|
Fair Value |
|
|
Accrued Interest |
|
|
Sub-advisor |
|
Valuation Approach |
||||
|
Compania Argentina de Granos S.A. |
|
$ |
12,500,000 |
|
|
$ |
9,839,958 |
|
|
$ |
- |
|
|
IIG |
|
Income approach |
|
Frigorifico Regional Industrias Alimentarias, S.A., Sucursal Uruguay |
|
|
9,000,000 |
|
|
|
6,240,961 |
|
|
|
264,500 |
|
|
IIG |
|
Income approach |
|
Sancor Cooperativas Unidas Ltda |
|
|
6,000,000 |
|
|
|
4,719,383 |
|
|
|
442,805 |
|
|
IIG |
|
Hybrid income/collateral based approach |
|
IIG TOF B.V. |
|
|
6,000,000 |
|
|
|
3,758,063 |
|
|
|
572,000 |
|
|
IIG |
|
Income approach |
|
Algodonera Avellaneda S.A. |
|
|
6,000,000 |
|
|
|
3,398,558 |
|
|
|
778,500 |
|
|
IIG |
|
Income approach |
|
Functional Products Trading S.A. (1) |
|
|
1,326,687 |
|
|
|
1,269,586 |
|
|
|
220,882 |
|
|
IIG |
|
Income approach |
|
Procesos Fabriles S.A. (1) |
|
|
881,800 |
|
|
|
10,504 |
|
|
|
— |
|
|
IIG |
|
Collateral based approach |
|
Conplex International Ltd. |
|
|
9,500,000 |
|
|
|
8,840,048 |
|
|
|
482,667 |
|
|
TransAsia |
|
Income approach |
|
Producam S.A. |
|
|
10,413,683 |
|
|
|
9,687,887 |
|
|
|
2,403,043 |
|
|
AMC |
|
Income approach |
|
Global Pharma Intelligence Sarl (1) |
|
|
803,254 |
|
|
|
803,254 |
|
|
|
134,215 |
|
|
Scipion |
|
Income approach |
|
Mac Z Group SARL |
|
|
7,349,626 |
|
|
|
7,530,616 |
|
|
|
— |
|
|
Scipion |
|
Income approach |
|
Applewood Trading 199 Pty, Ltd. (1) |
|
|
785,806 |
|
|
|
690,616 |
|
|
|
— |
|
|
Barak |
|
Income approach |
|
Usivale Industria E Commercio Ltda (1) |
|
|
2,851,296 |
|
|
|
2,577,164 |
|
|
|
376,075 |
|
|
N/A |
|
Income approach |
|
Total Watchlist |
|
$ |
73,412,152 |
|
|
$ |
59,366,598 |
|
|
$ |
5,674,687 |
|
|
|
|
|
|
1 |
Investments with a fair value below 1.0% of the Company's net assets as of December 31, 2020. Additional information regarding Watch List investments with a fair value equal to or greater than 1.0% of the Company's net assets as of December 31, 2020 is presented below. |
Investments through Helios Investment Partners, LLP (“Helios”) as the Sub-Advisor
Trustco Group Holdings Ltd
In January 2017, the Company purchased a $15,000,000 Participation in a term loan facility with Trustco Group Holdings Ltd (“Trustco”), a Namibia based group operating a diversified set of business lines including property development, financial services (insurance, retail banking), education, and diamond mining. Repayment on this position has been slower than originally anticipated, largely due to a slowdown in the local real estate market. Helios has been actively working with the borrower to restructure the facility. As this has proved challenging, Helios issued a notice of default and acceleration notice to Trustco along with launching initial legal proceedings. A demand has also been made against Elisenheim as guarantor in respect of Trustco’s obligations to Helios. In addition to recourse against Trustco, Helios has the benefit of a security interest in property owned by the guarantor. The estimated proceeds from the collateral and the guarantor are enough to cover the principal and the interest for Trustco.
TRG Cape Verde Holdings Ltd
In May 2016, the Company purchased a $17,000,000 Participation in a term loan facility with TRG Cape Verde Holdings Ltd (“TRG Cape Verde”), an owner and developer of resorts based in Cabo Verde. Repayment on this position has been slower than originally anticipated due to regulatory changes in TRG Cape Verde’s fundraising model, along with further challenges associated with little to no occupancy at its resort properties due to the ongoing COVID-19 pandemic. Helios is actively working with the borrower to restructure the facility which is expected to be finalized in the coming quarters. In addition to the restructuring being conducted, the borrower has pledged certain of its real properties as collateral in support of its repayment obligations under this facility.
Helios Maritime I
Between July 2015 and December 2017, the Company purchased six Participations totaling $15,300,000 in a term loan facility with Helios Maritime I (“Helios Maritime”), a company setup for the purposes of on-lending to Starz Investment Company, Ltd., a Nigerian shipping and logistics company for the purpose of acquiring a handling tug vessel. Repayment on this position has been slower than originally anticipated due to delays in acquiring a long-term contract, which has been further prolonged based on challenges presented by the COVID-19 pandemic and the recent decline in oil prices. Helios is actively working with the borrower to restructure the facility which is expected to be finalized in the coming quarters. The borrower has pledged a marine vessel as collateral in support of its repayment obligations under this facility.
Investments through The International Investment Group L.L.C. (“IIG”) as the Sub-Advisor
The International Investment Group L.L.C. (“IIG”) was the sub-advisor with respect to certain investments that the Company made in South America, including eight of the 19 Watch List investments as of December 31, 2020. Since June 30, 2018, the Company has discovered, among other things, that IIG failed to provide the Company with complete and accurate information with respect to the investments for which IIG was the sub-advisor and, in 2017, sold the Company a $6 million participation in a loan to Nacadie (defined below) that did not exist. The Company has not received any material updated information from IIG concerning the investments for
F-24
which IIG was the sub-advisor since the first quarter of 2019, despite IIG being contractually obligated to provide the Company with updated information.
The SEC previously charged IIG with fraud on November 21, 2019 and revoked IIG's registration as an investment adviser on November 26, 2019. On March 30, 2020, the SEC obtained a final judgment on consent that enjoins IIG from violating the antifraud provisions of the federal securities laws. On July 17, 2020, the SEC filed fraud charges against David Hu, one of IIG's co-founders, who was also charged by the U.S. Attorney's Office for the Southern District of New York in a parallel criminal action. On January 28, 2021, David Hu pled guilty to one count of securities fraud, one count of wire fraud, and one count of conspiracy to commit securities fraud and wire fraud. IIG has ceased operations and the Company does not expect to receive any further reporting from IIG with respect to its outstanding investments. The Company is taking necessary steps, including legal action in some cases, in order to ascertain as much information as possible regarding these investments.
Most of the outstanding investments for which IIG was the sub-advisor were purchased from IIG TOF B.V., a Dutch Limited Liability Company advised by IIG. On December 11, 2019, a subsidiary of the Company filed an application in Amsterdam District Court to declare IIG TOF B.V. bankrupt. As set forth in the application for the Declaration of Bankruptcy, the Company and other creditors believe they have multiple due and payable claims against IIG TOF B.V. which IIG TOF B.V. has acknowledged it is unable to pay. On January 21, 2020, the Amsterdam District Court declared IIG TOF B.V. bankrupt and appointed a Dutch law firm as liquidator. The Company is seeking recovery of amounts due and payable to the Company with respect to the Participations it acquired from IIG TOF B.V. There can be no assurances as to when or if the Company will recover the amounts to which the Company believes it is entitled. Additional information regarding Watch List investments for which IIG was the sub-advisor with a fair value equal to or greater than 1.0% of the Company's net assets as of December 31, 2020 is presented below.
Compania Argentina de Granos
Between October 2016 and February 2017, the Company purchased two Participations in a trade finance facility originated by IIG TOF B.V., with Compania Argentina de Granos (“CAGSA”), as borrower. The Company purchased the initial Participation in October 2016 for $10,000,000 and subsequently increased the Participation by another $2,500,000 in February 2017. This facility is collateralized by two export contracts. CAGSA, an Argentine company, is mainly engaged in the trading of grain and oilseed and the distribution and processing of food ingredients. Due to unfavorable weather conditions, CAGSA was unable to make delivery of toasted soybean meal under the terms of its export contracts. As a result, it failed to pay IIG its outstanding principal due on June 30, 2018.
IIG previously informed the Company that it had been in active discussions with CAGSA and other CAGSA lenders to protect its rights under the credit facility. Additionally, IIG had previously informed the Company that IIG is a member of the creditors committee, which would determine all financial and restructuring options of CAGSA, which may include additional equity infusions by the existing shareholders. In February 2019, CAGSA disclosed that it had reached a preliminary settlement with its creditors. As of the date of this report, the Company does not know if the preliminary settlement has been finalized and details of the terms of the preliminary settlement were not available. As noted above, IIG has ceased operations and the Company has taken legal action in an attempt to recover amounts due.
Sancor Cooperativas Unidas Limitada
In April 2016 the Company purchased two Participations in a trade finance facility originated by IIG TOF B.V., with Sancor Cooperativas Unidas Limitada (“Sancor”), an Argentine company that distributes dairy products, as the borrower. IIG had worked with Sancor to restructure the existing loan and extended the maturity to July 29, 2019, with an annual renewal option. Since February 2019, Sancor has announced the sale of certain of its assets, which allowed it to make some payments to creditors and maintain operations, but the Company has not received any payment as a result of those asset sales. It is the Company’s understanding that Sancor is engaged in ongoing negotiations with its lenders regarding a debt restructuring. As noted above, IIG has ceased operations and the Company has taken legal action in an attempt to recover amounts due. During the quarter ended December 31, 2020, the Company learned, in connection with certain court proceedings in the United States Bankruptcy Court for the Southern District of New York regarding a fund advised by IIG, that funds had been received in a New York bank account controlled by an affiliate of IIG and that such funds may include prior debt service payments by Sancor related to the Company’s interests in the Sancor trade finance facility. The Company is monitoring the proceedings and expects to take steps, which may include legal action, to obtain control over any funds in such account to which the Company is entitled. There can be no assurances as to the amount of funds the Company may be able to obtain, or that it will be able to obtain any amounts from the account.
Frigorifico Regional Industrias Alimentarias, S.A., Sucursal Uruguay and Algodonera Avellaneda S.A.
Between June 2016 and July 2016, the Company purchased two Participations in a trade finance facility originated by IIG TOF B.V., with Frigorifico Regional Industrias Alimentarias, S.A., Sucursal Uruguay (“FRIAR”), an Argentine company that produces,
F-25
processes and exports beef, as the borrower. In June 2017, IIG called a technical event of default due to non-payment by FRIAR. In an effort to seek repayment from FRIAR, IIG filed the promissory notes for FRIAR in the commercial court in Buenos Aires, Argentina.
In March 2017, the Company purchased a Participation in a trade finance facility originated by IIG TOF B.V., with Algodonera Avellaneda S.A. (“Algodonera”) as the borrower for $6,000,000. The loan agreement states that Vicentin has guaranteed the payments to be made by Algodonera under the facility. Algodonera is an Argentinian vertically integrated cotton business. IIG informed the Company that in June 2017, IIG called a technical default on Algodonera under the facility due to nonpayment of interest and on Vicentin under the payment guarantee due to the breach of informational covenants. Thereafter, IIG made a filing against Vicentin and Algodonera in the commercial court in Buenos Aires, Argentina on July 4, 2017.
In August 2019, the Company was informed by IIG’s legal counsel that the commercial court proceedings with FRIAR and Algodonera had been terminated due to the parties having reached a settlement. The Company has evidence that the settlement proceeds have been placed in an escrow account with a New York law firm. The Company is awaiting a final decision by the relevant bankruptcy courts in order to reach a final settlement agreement amongst all the creditors and determine the Company’s allocated portion of the proceeds held in escrow.
IIG Trade Opportunities Fund B.V. Receivable
In March 2017, the Company purchased a Participation from IIG TOF B.V. in what the Company at that time believed to be a trade finance facility originated by IIG TOF B.V., with Nacadie Commercial S.A. (“Nacadie”) as the borrower. The Company purchased the Participation in March 2017 for $6,000,000. In connection with the Company’s review of this investment during the third quarter of 2018, IIG informed the Company that IIG had misapplied the funds the Company had transmitted at the time the Company made this investment. As a result, IIG offered to refund the Company’s investment amount, including all accrued interest. However, IIG did not repay the Company for this Participation. As noted above, the Company knows that the Nacadie facility in which it purchased this Participation did not exist and the Company considers this asset to be a receivable from IIG TOF B.V. rather than a Participation in a trade finance facility.
As noted above, IIG TOF B.V. has been declared bankrupt in the Netherlands, and the Company is seeking to recover amounts to which it is entitled through the bankruptcy proceedings. The Company has applied a discount to the fair value based on the risk created by the uncertainty of the ultimate resolution of the Company’s attempt to recover amounts to which it is entitled through the bankruptcy proceedings in the Netherlands.
Investments through TransAsia Private Capital Ltd. (“TransAsia”) as the Sub-Advisor
Triton Metallics Pte. Ltd.
In November 2019, the Company made an investment in Triton Metallics Pte. Ltd. (“Triton”) totaling $16,456,270 in a trade finance facility. Triton is a Singapore based diversified commodities trading company. TransAsia informed the Company in early 2020 that due to the COVID-19 pandemic there have been constrained trading volumes. As a result, TransAsia then began working with the borrower to restructure the facility and a restructuring agreement was executed on August 17, 2020. Under the new agreement, the loan was restructured from a trade finance facility into a term loan with the interest rate reduced from 11.5% to 6%, including 3% of PIK interest. The unpaid interest of $1,503,463 under the old trade finance facility has been capitalized and added to the outstanding principal balance as of the date of the new agreement. During the period of July 1, 2020 through August 16, 2020, $241,816 of interest income was recognized prior to the date the loan was restructured.
Conplex International Ltd.
Between November 2018 and May 2019, the Company purchased three Participations totaling $9,500,000 in a trade finance facility with Conplex International Ltd. (“Conplex”), a Hong Kong-based international open market distributor and wholesaler of electronics products. TransAsia had informed the Company that the borrower had a large portion of receivables overdue from a large off-taker. Subsequently, TransAsia began to actively work with the borrower to restructure the facility. While the restructuring was still progressing, TransAsia, after its regular search and review process, found that a winding-up petition was filed and approved on October 7, 2020. TransAsia immediately notified the Company while a court appointed provisional liquidator took control of Conplex. On October 14, 2020, TransAsia appointed a receiver to enforce on the secured facility. The receiver continues to work with the court appointed provisional liquidator in order to take control of the security. This facility is secured by a lien on mortgaged properties, accounts receivable and personal guarantees, which have been valued using the collateral based approach in the above table to arrive at the estimated fair value.
F-26
Investments through Africa Merchant Capital Group (“AMC”) as the Sub-Advisor
Producam SA
Between March 2018 and June 2018, the Company purchased three Participations totaling $15,986,369 in a trade finance facility with Producam SA (“Producam”), a Cameroon based cocoa and coffee exporter, as the borrower. Repayment on these Participations has been slower than originally anticipated due to short run cash flow pressure on Producam. The original sub-advisor for this facility was Africa Merchant Capital Group (“AMC”). In the third quarter of 2018, AMC informed the Company that the borrower misapplied the proceeds from the sale of certain of its inventory to finance its own cash flow needs rather than repay the facility. AMC then began working with the borrower to restructure the facility to recover amounts due. During the first quarter of 2021, Scipion replaced AMC as the sub-advisor with respect to Producam and has agreed to undertake efforts to liquidate the collateral underlying the facility in order to recover amounts due to the Company and the restructuring process is expected to be finalized.
Investments through Scipion Capital, Ltd. (“Scipion”) as the Sub-Advisor
Mac Z Group SARL
Between July 2016 and April 2017, the Company purchased nine Participations totaling $9,000,000 in a trade finance facility with Mac Z Group SARL (“Mac Z”), a scrap metal recycler, as the borrower. Mac Z is located in Morocco. The primary collateral securing this Participation was 1,970 tons of copper scrap. In late October 2017, Scipion’s designated collateral manager for Mac Z notified Scipion of an investigation into a 1,820 ton, approximately $13.3 million, shortage of copper scrap inventory physically held in the warehouse. The copper scrap is pledged to the Company and serves as the primary collateral for this Participation. The missing inventory led the Company to place Mac Z on the Watch List and on non-accrual status.
In addition to conducting its investigation, Scipion issued an event of default and has taken steps to enforce the corporate guarantee, personal guarantee and relevant pledges made for the benefit of Scipion with respect to the facility, which include two insurance policies. Scipion has placed a blocking notice on all of Mac Z’s bank accounts and has requested a freeze order from the Moroccan local courts on the physical assets of the company. Since the initial discovery and actions, Mac Z sold remaining inventory and the Company was paid interest of approximately $330,000 in January 2018 and $292,000 during the first week April 2018.
A judgment was received on December 18, 2017, in English court ordering the borrower and the corporate guarantor to make payment. In parallel to its recovery plan with respect to Mac Z, Scipion informed the Company that it has received a judgment in its favor with respect to its claim against the collateral manager under its professional indemnity insurance policy, which covers up to $40 million in losses. During the fourth quarter of 2020, $9,377,199 from a settlement under this insurance policy was received by the Company.
F-27
The industry composition of the Company’s portfolio, at fair value as of December 31, 2020 and December 31, 2019, was as follows:
|
|
|
As of December 31, 2020 |
|
|
As of December 31, 2019 |
|
||||||||||
|
|
|
Fair |
|
|
Percentage |
|
|
Fair |
|
|
Percentage |
|
||||
|
Industry |
|
Value |
|
|
of Total |
|
|
Value |
|
|
of Total |
|
||||
|
Agricultural Products |
|
$ |
12,047,572 |
|
|
|
4.2 |
% |
|
$ |
12,417,122 |
|
|
|
3.6 |
% |
|
Boatbuilding and Repairing |
|
|
5,946,066 |
|
|
|
2.1 |
% |
|
|
5,695,069 |
|
|
|
1.7 |
% |
|
Chemicals and Allied Products |
|
|
15,858,045 |
|
|
|
5.5 |
% |
|
|
15,000,000 |
|
|
|
4.4 |
% |
|
Chocolate and Cocoa Products |
|
|
13,128,867 |
|
|
|
4.6 |
% |
|
|
9,687,887 |
|
|
|
2.8 |
% |
|
Coal and Other Minerals and Ores |
|
|
33,649,913 |
|
|
|
11.7 |
% |
|
|
32,348,090 |
|
|
|
9.5 |
% |
|
Commercial Fishing |
|
|
35,838 |
|
|
|
0.0 |
% |
|
|
35,838 |
|
|
|
0.0 |
% |
|
Communications Equipment |
|
|
— |
|
|
|
0.0 |
% |
|
|
100,000 |
|
|
|
0.0 |
% |
|
Consumer Products |
|
|
9,456,820 |
|
|
|
3.3 |
% |
|
|
9,318,469 |
|
|
|
2.7 |
% |
|
Corrugated and solid fiber boxes |
|
|
13,503,499 |
|
|
|
4.7 |
% |
|
|
— |
|
|
|
— |
|
|
Department Stores |
|
|
9,360,235 |
|
|
|
3.3 |
% |
|
|
8,638,109 |
|
|
|
2.5 |
% |
|
Drugs, Proprietaries, and Sundries |
|
|
648,430 |
|
|
|
0.2 |
% |
|
|
803,254 |
|
|
|
0.2 |
% |
|
Electric Services |
|
|
1,434,285 |
|
|
|
0.5 |
% |
|
|
16,383,269 |
|
|
|
4.8 |
% |
|
Farm Products |
|
|
11,656,399 |
|
|
|
4.1 |
% |
|
|
9,644,313 |
|
|
|
2.8 |
% |
|
Fats and Oils |
|
|
3,398,558 |
|
|
|
1.2 |
% |
|
|
3,398,558 |
|
|
|
1.0 |
% |
|
Financial services |
|
|
3,758,063 |
|
|
|
1.3 |
% |
|
|
3,758,063 |
|
|
|
1.1 |
% |
|
Food Products |
|
|
2,318,540 |
|
|
|
0.8 |
% |
|
|
2,724,804 |
|
|
|
0.8 |
% |
|
Freight Transportation Arrangement |
|
|
14,034,913 |
|
|
|
4.9 |
% |
|
|
13,505,035 |
|
|
|
4.0 |
% |
|
Groceries and Related Products |
|
|
434,619 |
|
|
|
0.2 |
% |
|
|
468,756 |
|
|
|
0.1 |
% |
|
Hotels and Motels |
|
|
11,337,937 |
|
|
|
3.9 |
% |
|
|
12,846,584 |
|
|
|
3.8 |
% |
|
Land Subdividers and Developers |
|
|
15,242,460 |
|
|
|
5.3 |
% |
|
|
16,781,000 |
|
|
|
4.9 |
% |
|
Logging |
|
|
— |
|
|
|
0.0 |
% |
|
|
5,612,436 |
|
|
|
1.6 |
% |
|
Meat, Poultry & Fish |
|
|
6,361,679 |
|
|
|
2.2 |
% |
|
|
6,240,961 |
|
|
|
1.8 |
% |
|
Motor Vehicle Parts and Accessories |
|
|
8,893,693 |
|
|
|
3.1 |
% |
|
|
8,731,936 |
|
|
|
2.6 |
% |
|
Personal Credit Institutions |
|
|
3,062,598 |
|
|
|
1.1 |
% |
|
|
3,603,592 |
|
|
|
1.1 |
% |
|
Petroleum and Petroleum Products |
|
|
13,685,366 |
|
|
|
4.8 |
% |
|
|
15,500,000 |
|
|
|
4.6 |
% |
|
Programming and Data Processing |
|
|
18,502,811 |
|
|
|
6.4 |
% |
|
|
17,740,330 |
|
|
|
5.2 |
% |
|
Refuse Systems |
|
|
29,730,723 |
|
|
|
10.3 |
% |
|
|
25,766,063 |
|
|
|
7.6 |
% |
|
Secondary Nonferrous Metals |
|
|
5,628,861 |
|
|
|
2.0 |
% |
|
|
17,530,616 |
|
|
|
5.2 |
% |
|
Short-Term Business Credit |
|
|
4,740,000 |
|
|
|
1.6 |
% |
|
|
4,740,000 |
|
|
|
1.4 |
% |
|
Soap, Detergents, and Cleaning |
|
|
2,203,673 |
|
|
|
0.8 |
% |
|
|
2,894,698 |
|
|
|
0.9 |
% |
|
Telephone and Telegraph Apparatus |
|
|
3,366,356 |
|
|
|
1.2 |
% |
|
|
8,840,048 |
|
|
|
2.6 |
% |
|
Telephone Communications |
|
|
1,161,200 |
|
|
|
0.4 |
% |
|
|
36,794,973 |
|
|
|
11.0 |
% |
|
Water Transportation |
|
|
12,986,279 |
|
|
|
4.3 |
% |
|
|
12,748,503 |
|
|
|
3.7 |
% |
|
Total |
|
$ |
287,574,298 |
|
|
|
100.0 |
% |
|
$ |
340,298,376 |
|
|
|
100.0 |
% |
F-28
The table below shows the portfolio composition by geographic classification at fair value as of December 31, 2020 and December 31, 2019:
|
|
|
As of December 31, 2020 |
|
|
As of December 31, 2019 |
|
||||||||||
|
|
|
Fair |
|
|
Percentage |
|
|
Fair |
|
|
Percentage |
|
||||
|
Country |
|
Value |
|
|
of Total |
|
|
Value |
|
|
of Total |
|
||||
|
Argentina (1) |
|
$ |
24,159,256 |
|
|
|
8.4 |
% |
|
$ |
24,198,860 |
|
|
|
7.1 |
% |
|
Botswana |
|
|
4,740,000 |
|
|
|
1.6 |
% |
|
|
4,740,000 |
|
|
|
1.4 |
% |
|
Brazil |
|
|
26,816,813 |
|
|
|
9.3 |
% |
|
|
26,012,563 |
|
|
|
7.6 |
% |
|
Cabo Verde |
|
|
11,337,937 |
|
|
|
3.9 |
% |
|
|
12,846,584 |
|
|
|
3.8 |
% |
|
Cameroon |
|
|
13,128,867 |
|
|
|
4.6 |
% |
|
|
9,687,887 |
|
|
|
2.9 |
% |
|
Chile |
|
|
2,810,079 |
|
|
|
1.0 |
% |
|
|
2,652,855 |
|
|
|
0.8 |
% |
|
Colombia |
|
|
3,062,598 |
|
|
|
1.1 |
% |
|
|
23,479,065 |
|
|
|
6.9 |
% |
|
Croatia |
|
|
9,360,235 |
|
|
|
3.3 |
% |
|
|
8,638,109 |
|
|
|
2.5 |
% |
|
Ecuador |
|
|
13,539,337 |
|
|
|
4.7 |
% |
|
|
35,838 |
|
|
|
0.0 |
% |
|
Ghana |
|
|
13,685,366 |
|
|
|
4.8 |
% |
|
|
30,500,000 |
|
|
|
9.0 |
% |
|
Guatemala |
|
|
10,504 |
|
|
|
0.0 |
% |
|
|
10,504 |
|
|
|
0.0 |
% |
|
Hong Kong |
|
|
25,532,915 |
|
|
|
8.9 |
% |
|
|
51,188,138 |
|
|
|
15.0 |
% |
|
Jersey |
|
|
1,161,200 |
|
|
|
0.4 |
% |
|
|
16,919,500 |
|
|
|
5.0 |
% |
|
Kenya |
|
|
14,034,913 |
|
|
|
4.9 |
% |
|
|
13,505,035 |
|
|
|
4.0 |
% |
|
Malaysia |
|
|
15,858,045 |
|
|
|
5.5 |
% |
|
|
15,000,000 |
|
|
|
4.4 |
% |
|
Mauritius |
|
|
434,619 |
|
|
|
0.2 |
% |
|
|
468,756 |
|
|
|
0.1 |
% |
|
Mexico |
|
|
29,730,723 |
|
|
|
10.3 |
% |
|
|
25,766,063 |
|
|
|
7.6 |
% |
|
Morocco |
|
|
628,861 |
|
|
|
0.2 |
% |
|
|
7,530,616 |
|
|
|
2.2 |
% |
|
Namibia |
|
|
15,242,460 |
|
|
|
5.3 |
% |
|
|
16,781,000 |
|
|
|
4.9 |
% |
|
Netherlands |
|
|
8,893,693 |
|
|
|
3.1 |
% |
|
|
8,731,936 |
|
|
|
2.6 |
% |
|
New Zealand |
|
|
— |
|
|
|
0.0 |
% |
|
|
5,612,436 |
|
|
|
1.7 |
% |
|
Nigeria |
|
|
14,500,502 |
|
|
|
5.1 |
% |
|
|
14,262,726 |
|
|
|
4.2 |
% |
|
Peru |
|
|
4,737,437 |
|
|
|
1.6 |
% |
|
|
4,599,086 |
|
|
|
1.4 |
% |
|
Romania |
|
|
1,821,078 |
|
|
|
0.6 |
% |
|
|
2,034,188 |
|
|
|
0.6 |
% |
|
Singapore |
|
|
16,483,354 |
|
|
|
5.7 |
% |
|
|
— |
|
|
|
0.0 |
% |
|
South Africa |
|
|
497,462 |
|
|
|
0.2 |
% |
|
|
790,616 |
|
|
|
0.2 |
% |
|
United Arab Emirates |
|
|
648,430 |
|
|
|
0.2 |
% |
|
|
803,254 |
|
|
|
0.2 |
% |
|
Uganda |
|
|
8,755,878 |
|
|
|
3.0 |
% |
|
|
6,850,000 |
|
|
|
2.0 |
% |
|
Zambia |
|
|
2,203,673 |
|
|
|
0.8 |
% |
|
|
2,894,698 |
|
|
|
0.9 |
% |
|
N/A |
|
|
3,758,063 |
|
|
|
1.3 |
% |
|
|
3,758,063 |
|
|
|
1.0 |
% |
|
Total |
|
$ |
287,574,298 |
|
|
|
100.0 |
% |
|
$ |
340,298,376 |
|
|
|
100.0 |
% |
|
(1) |
All of the Company’s investments in Argentina are Participations in trade finance facilities originated by IIG TOF B.V.. See Note 3 “Watch List Investments” for further information. |
Note 4. Fair Value Measurements
The following table summarizes the valuation of the Company’s investments by the fair value hierarchy levels required under ASC 820 as of December 31, 2020:
|
|
|
Fair |
|
|
|
|
|
|
|
|
|
|
|
|
|
|
|
|
|
Value |
|
|
Level 1 |
|
|
Level 2 |
|
|
Level 3 |
|
||||
|
Senior secured term loans |
|
$ |
106,899,154 |
|
|
$ |
— |
|
|
$ |
— |
|
|
$ |
106,899,154 |
|
|
Senior secured term loan participations |
|
|
129,917,253 |
|
|
|
— |
|
|
|
— |
|
|
|
129,917,253 |
|
|
Senior secured trade finance participations |
|
|
45,800,210 |
|
|
|
— |
|
|
|
— |
|
|
|
45,800,210 |
|
|
Other investments |
|
|
3,758,063 |
|
|
|
— |
|
|
|
— |
|
|
|
3,758,063 |
|
|
Equity warrants |
|
|
1,199,618 |
|
|
|
— |
|
|
|
— |
|
|
|
1,199,618 |
|
|
Total |
|
$ |
287,574,298 |
|
|
$ |
— |
|
|
$ |
— |
|
|
$ |
287,574,298 |
|
F-29
The following table summarizes the valuation of the Company’s investments by the fair value hierarchy levels required under ASC 820 as of December 31, 2019:
|
|
|
Fair |
|
|
|
|
|
|
|
|
|
|
|
|
|
|
|
|
|
Value |
|
|
Level 1 |
|
|
Level 2 |
|
|
Level 3 |
|
||||
|
Senior secured term loan |
|
$ |
83,353,208 |
|
|
$ |
— |
|
|
$ |
— |
|
|
$ |
83,353,208 |
|
|
Senior secured term loan participations |
|
|
180,500,425 |
|
|
|
|
|
|
|
|
|
|
|
180,500,425 |
|
|
Senior secured trade finance participations |
|
|
71,606,458 |
|
|
|
— |
|
|
|
— |
|
|
|
71,606,458 |
|
|
Short term investments |
|
|
3,758,063 |
|
|
|
|
|
|
|
|
|
|
|
3,758,063 |
|
|
Equity warrants |
|
|
1,080,222 |
|
|
|
|
|
|
|
|
|
|
|
1,080,222 |
|
|
Total |
|
$ |
340,298,376 |
|
|
$ |
— |
|
|
$ |
— |
|
|
$ |
340,298,376 |
|
The following is a reconciliation of activity for the year ended December 31, 2020, of investments classified as Level 3:
|
|
|
Fair Value at December 31, 2019 |
|
|
Purchases/Transfer (1) |
|
|
Maturities or Prepayments |
|
|
Accretion of discounts / Payment-in-kind interest |
|
|
Net change in unrealized appreciation (depreciation) |
|
|
Fair Value at December 31, 2020 |
|
||||||
|
Senior secured term loans |
|
$ |
83,353,208 |
|
|
$ |
29,706,270 |
|
|
$ |
(12,583,759 |
) |
|
$ |
8,295,809 |
|
|
$ |
(1,872,374 |
) |
|
$ |
106,899,154 |
|
|
Senior secured term loan participations |
|
|
180,500,425 |
|
|
|
1,245,664 |
|
|
|
(52,724,386 |
) |
|
|
7,916,136 |
|
|
|
(7,020,586 |
) |
|
|
129,917,253 |
|
|
Senior secured trade finance participations |
|
|
71,606,458 |
|
|
|
(9,456,270 |
) |
|
|
(13,204,984 |
) |
|
|
3,118,464 |
|
|
|
(6,263,458 |
) |
|
|
45,800,210 |
|
|
Short term and other investments |
|
|
3,758,063 |
|
|
|
4,000,000 |
|
|
|
(4,000,000 |
) |
|
|
— |
|
|
|
|
|
|
|
3,758,063 |
|
|
Equity warrants |
|
|
1,080,222 |
|
|
|
— |
|
|
|
— |
|
|
|
— |
|
|
|
119,396 |
|
|
|
1,199,618 |
|
|
Total |
|
$ |
340,298,376 |
|
|
$ |
25,495,664 |
|
|
$ |
(82,513,129 |
) |
|
$ |
19,330,409 |
|
|
$ |
(15,037,022 |
) |
|
$ |
287,574,298 |
|
|
|
(1) |
A restructuring agreement was executed for Triton on August 17, 2020. Under the new agreement, the loan was restructured from a trade finance facility into a term loan. |
There were no realized gains or losses for any of the Company’s investments classified as Level 3 during the years ended December 31, 2020 and 2019. Net unrealized depreciation for the years ended December 31, 2020 and 2019 reported in the Company’s consolidated statements of operations attributable to the Company’s Level 3 assets still held at period end were $15,037,022 and $4,809,906, respectively. These unrealized losses were primarily driven by macro events including the uncertainty created by the recent COVID-19 pandemic and its impact on the future cash flows generated by our investments as well as the ultimate realization of the underlying collateral.
As of December 31, 2020, all of the Company’s portfolio investments utilized Level 3 inputs. The following table presents the quantitative information about Level 3 fair value measurements of the Company’s investments as of December 31, 2020:
|
|
|
Fair value |
|
|
Valuation technique |
|
Unobservable input |
|
Range (weighted average) (4) |
|
|
|
Senior secured trade finance participations (2) |
|
$ |
42,423,350 |
|
|
Income approach (DCF) |
|
Market yield |
|
8.5% - 17.5% (10.5%) |
|
|
Senior secured trade finance participations (1) |
|
$ |
3,376,860 |
|
|
Collateral based approach |
|
Value of collateral (collateral coverage) |
|
1.0x - 1.1x |
|
|
Senior secured term loans |
|
$ |
106,899,154 |
|
|
Income approach (DCF) |
|
Market yield |
|
11.0% - 14.5% (11.4%) |
|
|
Senior secured term loan participations |
|
$ |
129,917,253 |
|
|
Income approach (DCF) |
|
Market yield |
|
10.3% - 15.0% (12.3%) |
|
|
Other investments (3) |
|
$ |
3,758,063 |
|
|
Income approach (DCF) |
|
Market yield |
|
8.80% |
|
|
Equity warrants |
|
$ |
1,199,618 |
|
|
Option Pricing Method |
|
Estimated company value |
|
N/A |
|
|
(1) |
Collateral based approach used for the following Watch List investments: Procesos Fabriles S.A. ("Profasa") and Conplex International Ltd. (“Conplex”). See Note 3 “Watch List Investments” for further information. |
|
(2) |
The Company used the income approach for all Watch List investments except for Conplex, Sancor and Profasa and a hybrid of the collateral based approach and the income approach for Sancor, using additional unobservable inputs including recovery rates ranging from 15% to 30%, after considering potential and ongoing litigation and expected collection period ranging from 2 to 3 years. See Note 3 “Watch List Investments” for further information. |
|
(3) |
Receivable from IIG TOF B.V. using additional discount rate of 20%. The Company considers this asset to be a receivable from IIG TOF B.V. rather than a Participation in a trade finance facility, therefore the income approach is being applied. |
F-30
|
(4) |
The weighted average is the total annual interest of each investment divided by total amortized cost. |
As of December 31, 2019, all of the Company’s portfolio investments utilized Level 3 inputs. The following table presents the quantitative information about Level 3 fair value measurements of the Company’s investments as of December 31, 2019:
|
|
|
Fair value |
|
|
Valuation technique |
|
Unobservable input |
|
Range (weighted average) (4) |
|
|
|
participations (2) |
|
$ |
70,792,700 |
|
|
Income approach (DCF) |
|
Market yield |
|
9.0% - 16.8% (12.7%) |
|
|
Senior secured trade finance participations (1) |
|
$ |
813,758 |
|
|
Collateral based approach |
|
Value of collateral (collateral coverage) |
|
1.0x - 1.1x |
|
|
Senior secured term loans |
|
$ |
83,353,208 |
|
|
Income approach (DCF) |
|
Market yield |
|
10.0% - 14.5% (12.4%) |
|
|
Senior secured term loan participations |
|
$ |
180,500,425 |
|
|
Income approach (DCF) |
|
Market yield |
|
11.0% - 15.9% (13.0%) |
|
|
Other investments (3) |
|
$ |
3,758,063 |
|
|
Hybrid income/collateral based approach |
|
Market yield / value of collateral |
|
8.75% |
|
|
Equity warrants |
|
$ |
1,080,222 |
|
|
Option Pricing Method |
|
Estimated company value |
|
N/A |
|
|
(1) |
Collateral based approach used for the following Watch List investments: Profasa and Global Pharma Intelligence Sarl. See Note 3 “Watch List Investments” for further information. |
|
(2) |
The Company used the income approach for Algodonera, FRIAR, CAGSA, and Functional Products Trading S.A. and a hybrid of the collateral based approach and the income approach for Sancor and Mac Z, using additional unobservable inputs including recovery rates ranging from 15% to 30%, after considering potential and ongoing litigation and expected collection period ranging from 2 to 3 years. See Note 3 “Watch List Investments” for further information. |
|
(3) |
Receivable from IIG TOF B.V. using additional discount rate of 20%. |
|
(4) |
The weighted average is the total annual interest of each investment divided by total amortized cost. |
The significant unobservable Level 3 inputs used in the fair value measurement of the Company’s investments are market yields used to discount the estimated future cash flows expected to be received from the underlying investments, which include both future principal and interest payments. Significant increases in market yields would result in significantly lower fair value measurements. In addition, a significant decrease in future cash flows is expected to be received from the underlying investments due to a projected decrease in results of operations and cash flows from the underlying investments, would result in significantly lower fair value measurements.
For additional information concerning of the country-specific risk concentrations for the Company’s investments, refer to the Consolidated Schedule of Investments and Note 3.
Note 5. Contingencies and Related Parties
Agreements
Advisory Agreement
The current term of the Advisory Agreement between the Company and the Advisor, (the “Advisory Agreement”) ends on February 25, 2022, subject to an unlimited number of one-year renewals upon mutual consent of the Company and the Advisor.
Asset management fees payable to the Advisor are remitted quarterly in arrears and are equal to 0.50% (2.00% per annum) of Gross Asset Value, as defined in the Advisory Agreement between the Company and the Advisor. Asset management fees are paid to the Advisor in exchange for fund management and administrative services. Although the Advisor manages, on the Company’s behalf, many of the risks associated with global investments in developing economies, management fees do not include the cost of any hedging instruments or insurance policies that may be required to appropriately manage the Company’s risk.
If certain financial goals are reached by the Company, the Company is required to pay the Advisor an incentive fee that is comprised of two parts: (i) a subordinated fee on net investment income and (ii) an incentive fee on capital gains. The subordinated incentive fee on income is calculated and payable quarterly in arrears and is based upon the Company’s pre-incentive fee net investment income for the immediately preceding quarter. No subordinated incentive fee is earned by the Advisor in any calendar quarter in which the Company’s pre-incentive fee net investment income does not exceed the quarterly preferred return rate of 1.50% (6.00% annualized) (the “Preferred Return”). In any quarter, all of the Company’s pre-incentive fee net investment income, if any, that exceeds the quarterly Preferred Return, but is less than or equal to 1.875% (7.50% annualized) at the end of the immediately preceding fiscal quarter, is payable to the Advisor. For any quarter in which the Company’s pre-incentive fee net investment income exceeds
F-31
1.875% on its net assets at the end of the immediately preceding fiscal quarter, the subordinated incentive fee on income equals 20% of the amount of the Company’s pre-incentive fee net investment income.
An incentive fee on capital gains will be earned on investments sold and shall be determined and payable to the Advisor in arrears as of the end of each calendar year. The incentive fee on capital gains is equal to 20% of the Company’s realized capital gains on a cumulative basis from inception, computed net of all realized capital losses and unrealized capital depreciation on a cumulative basis, less the aggregate amount of any previously paid incentive fees on capital gains. The Company had no capital gains and therefore did not accrue an incentive fee on capital gains for the years ended December 31, 2020 and 2019.
Transactions
For the years ended December 31, 2020 and 2019, the Advisor earned $7,334,178 and $7,702,572, respectively, in asset management fees and $5,320,776 and $5,730,748, respectively, in incentive fees.
As of December 31, 2020 and December 31, 2019, due from affiliates on the Consolidated Statements of Assets and Liabilities in the amount of $4,057,734 and $4,240,231, respectively was due from the Sponsor pursuant to the Responsibility Agreement for operating expenses which were paid by the Company, but, under the terms of the Responsibility Agreement, are the responsibility of the Sponsor. The Sponsor anticipates paying this receivable in the due course of business.
On November 12, 2020, the Advisor entered into a sub-advisory agreement with Enhanced Capital Impact Lending, LLC (“Enhanced Capital”). This agreement is expected to expand the diversification of the portfolio of the Company, by securing senior and other collateralized loans to SME’s operating within the United States. There have been no investments made through Enhanced Capital as of December 31, 2020.
Note 6. Organization and Offering Costs
As of December 31, 2020, the Sponsor has paid approximately $17,590,000 of offering costs and $236,000 of organization costs relating to the Offering, all of which were paid directly by the Sponsor on behalf of the Company, and were reimbursed to the Sponsor as disclosed in Note 2 of the consolidated financial statements. Such amounts include approximately $0 and $57,000 of offering costs, which were incurred by the Sponsor during the years ended December 31, 2020 and 2019, respectively. During the year ended December 31, 2020, the Company did not make any reimbursement of offering costs to the Sponsor. During the year ended December 31, 2019, the Company paid $26,690 in reimbursement of offering costs to the Sponsor. Such offering costs reimbursed by the Company have been recognized against the proceeds from the issuance of units.
From the commencement of the Company’s operations through December 31, 2020, the Company has reimbursed the Sponsor a total of $17,238,000 of offering and organization costs and there is a remaining balance of approximately $446,000 of offering costs that have not yet been reimbursed to the Sponsor as of December 31, 2020.
For the years ended December 31, 2020 and 2019, we paid SC Distributors, the dealer manager for certain of our offerings, $468,000 and $577,000, respectively in ongoing distributions fees, dealer manager fees and service fees.
Note 7. Notes Payable
The Company notes payable consist of the following:
|
|
December 31, 2020 |
|
|
December 31, 2019 |
|
|||
|
|
Outstanding Balance |
|
|
Outstanding Balance |
|
|||
|
Christian Super promissory note |
|
$ |
5,000,000 |
|
|
$ |
5,000,000 |
|
|
Total notes payable |
|
$ |
5,000,000 |
|
|
$ |
5,000,000 |
|
Christian Super Promissory Notes
On August 7, 2017, Trilinc Global Impact Fund Cayman, Ltd. (“TGIFC”) issued $5 million in the first of a Series 1 Senior Secured Promissory Notes private offering (the “CS Note”) to State Street Australia Ltd ACF Christian Super (“Christian Super”). The CS Note was issued pursuant to a private offering targeting $25 million in the aggregate amount.
The CS Note had an interest rate of 4.0% per annum plus one-year LIBOR and interest was payable quarterly in arrears within 15 days after the end of each calendar quarter. The entire principal balance under the CS Note (and any unpaid interest) was due in one balloon payment on August 7, 2021, which is the fourth anniversary of the issuance date. The principal balance of the CS Note may be prepaid prior to the maturity date without premium or penalty.
F-32
In September 2019, the Company repaid the entire principal amount of $5 million that was due under the CS Note.
On December 18, 2018, TGIFC issued $5 million of Series 2 Senior Secured Promissory Notes (“Series 2 Note”) to Christian Super pursuant to the CS Notes private offering. The Series 2 Note has an interest rate of 3.5% per annum plus one-year LIBOR (3.83% as of December 31, 2020) and interest is payable quarterly in arrears within 15 days after the end of each calendar quarter. The interest rate may not exceed the maximum rate of non-usurious interest permitted by applicable law, with excess interest to be applied to the principal amount of the CS Note. The entire principal balance under the Series 2 Note (and any unpaid interest) is due in one balloon payment on December 18, 2021, which is the fourth anniversary of the issuance date. The principal balance of the CS Note may be prepaid prior to the maturity date without premium or penalty.
TGIFC’s obligation under the CS Note is secured by an equitable mortgage pursuant to the Equitable Mortgage Over Shares by and between TGIFC and the Noteholders, dated as of August 7, 2017 (the “CS Equitable Mortgage”), granting the holder of the CS Note a mortgage over 10 shares out of a total of 32.11 of the issued and outstanding shares of the Subsidiaries. While the collateral initially pledged under the CS Equitable Mortgage greatly exceeds the amount funded under the CS Note based on the current net asset value of the Company’s investments held by the Subsidiaries, the Company may issue more shares of the Subsidiaries to secure further financing obligations as long as the pro rata value of TGIFC shares (based on the aggregate net asset value of the investments held by the Subsidiaries) is equal to at least the outstanding amount due and payable under the CS Note. The CS Note and the CS Equitable Mortgage contain representations, warranties and covenants customary for financing and mortgage arrangements of this type. As of December 31, 2020, the Company was in full compliance with all such representations, warranties and covenants.
For the years ended December 31, 2020 and 2019, the Company recognized $254,682 and $1,660,095, respectively, in interest expense. Due to the variable rate structure of these borrowings, the carrying basis of these debt obligations is considered to approximate their fair value.
The principal payments due on borrowings for each of the next five years ending December 31 and thereafter, are as follows:
Note 8. Unit Capital
As of December 31, 2020, the Company had six classes of units: Class A, Class C, Class I, Class W, Class Y and Class Z units. The unit classes have been sold with different upfront sales commissions and dealer manager fees as well as different ongoing distribution fees, dealer manager fees and/or service fees with respect to certain classes of units, including a distribution fee with respect to Class C units, an ongoing dealer manager fee with respect to Class I and Class W units, and an ongoing service fee with respect to Class W units. As of December 31, 2020, the Company recorded a liability in the aggregate amount of $480,000 for the estimated future amount of ongoing distribution fees, dealer manager fees and service fees payable. The estimated liability as of December 31, 2020 is calculated based on a net asset value per Class C, Class I and Class W units of $7.666 with a distribution fee of 0.80% for Class C units, an ongoing dealer manager fee of 0.50% for Class I units, and ongoing aggregate dealer and service fees of 0.75% for Class W units, per annum applied to the net asset value, during the expected period that Class C, Class W and Class I units remain outstanding, and discounted using an annual rate of 4%. All units participate in the income and expenses of the Company on a pro-rata basis based on the number of units outstanding. The following table is a summary of unit activity during the year ended December 31, 2020:
|
|
|
Units |
|
|
|
|
|
|
|
|
|
|
Units |
|
||
|
|
Outstanding |
|
|
|
|
|
|
Units |
|
|
Outstanding |
|
||||
|
|
|
as of |
|
|
Units Issued |
|
|
Repurchased |
|
|
as of |
|
||||
|
|
|
December 31, |
|
|
During |
|
|
During |
|
|
December 31, |
|
||||
|
|
|
2019 |
|
|
the Period |
|
|
the Period |
|
|
2020 |
|
||||
|
Class A units |
|
|
17,861,312 |
|
|
|
534,289 |
|
|
|
(399,251 |
) |
|
|
17,996,350 |
|
|
Class C units |
|
|
8,067,787 |
|
|
|
162,190 |
|
|
|
(259,441 |
) |
|
|
7,970,536 |
|
|
Class I units |
|
|
10,468,162 |
|
|
|
483,888 |
|
|
|
(497,682 |
) |
|
|
10,454,368 |
|
|
Class W units |
|
|
24,555 |
|
|
|
- |
|
|
|
- |
|
|
|
24,555 |
|
|
Class Y units |
|
|
1,297,897 |
|
|
|
667,151 |
|
|
|
(27,593 |
) |
|
|
1,937,455 |
|
|
Class Z units |
|
|
8,423,851 |
|
|
|
- |
|
|
|
- |
|
|
|
8,423,851 |
|
|
Total |
|
|
46,143,564 |
|
|
|
1,847,518 |
|
|
|
(1,183,967 |
) |
|
|
46,807,115 |
|
The total of 1,847,518 units issued during the year ended December 31, 2020 included 1,181,117 units issued under the DRP at a value of $9,274,000 and 667,151 units sold pursuant to our private placement for aggregate gross proceeds of $5,276,000.
F-33
Beginning June 11, 2014, the Company commenced a unit repurchase program pursuant to which the Company may conduct quarterly unit repurchases of up to 5% of the weighted average number of outstanding units in any 12-month period to allow the Company’s unitholders, who have held units for a minimum of one year, to sell their units back to the Company at a price equal to the most recently determined net asset value per unit for each class of units, as most recently disclosed by the Company in a public filing with the SEC at the time of repurchase. Repurchases for the fourth quarter of 2020 have been made at a price equal to $7.666 per units, which was the net asset value per unit of each class as of September 30, 2020, the most recently disclosed net asset value at the time of repurchase.
The unit repurchase program includes numerous restrictions, including a one-year holding period, that limit the ability of the Company’s unitholders to sell their units. Unless the Company’s board of managers determines otherwise, the Company will limit the number of units to be repurchased during any calendar year to the number of units that can be repurchased with the proceeds the Company receives from the sale of units under the Company’s DRP. At the sole discretion of the Company’s board of managers, the Company may also use cash on hand, cash available from borrowings and cash from the repayment or liquidation of investments as of the end of the applicable quarter to repurchase units.
During the year ended December 31, 2020, the Company fulfilled repurchase requests for a total of 1,183,967 units at a weighted average repurchase price per unit of $7.815 for an aggregate repurchase price of $9,253,114. As of December 31, 2020, $2,282,554 of these repurchase requests were pending processing and were completed by the Company in October 2020. For the quarter ended December 31, 2020, eligible repurchase requests exceeded the limitations of the Company’s unit repurchase program described above and the requests were fulfilled on a pro rata basis, such that the Company fulfilled 12.26% of eligible repurchase requests (based on the number of units submitted for repurchase) and 2,081,000 units were not redeemed. Pursuant to the terms of the Company’s unit repurchase program, the unsatisfied portion of repurchase requests that were not fulfilled at quarter-end will be carried over to the next quarter and treated as a request for repurchase at the next quarter-end repurchase date, unless the repurchase request is withdrawn.
Note 9. Distributions
Since July 2013, the Company has paid monthly distributions for all classes of units. The following table summarizes the distributions paid for the year ended December 31, 2020:
|
|
|
|
|
Daily Rate |
|
|
Cash |
|
|
Distributions |
|
|
Total |
|
||||
|
Month ended |
|
Date Declared |
|
Per Unit |
|
|
Distributions |
|
|
Reinvested |
|
|
Declared |
|
||||
|
January 31, 2020 |
|
January 15, 2020 |
|
$ |
0.00168675 |
|
|
$ |
1,610,076 |
|
|
$ |
793,883 |
|
|
$ |
2,403,959 |
|
|
February 29, 2020 |
|
February 14, 2020 |
|
$ |
0.00168675 |
|
|
|
1,513,649 |
|
|
|
743,093 |
|
|
|
2,256,742 |
|
|
March 31, 2020 |
|
February 21, 2020 |
|
$ |
0.00168675 |
|
|
|
1,648,333 |
|
|
|
772,972 |
|
|
|
2,421,305 |
|
|
April 30, 2020 |
|
February 21, 2020 |
|
$ |
0.00168675 |
|
|
|
1,573,136 |
|
|
|
769,639 |
|
|
|
2,342,775 |
|
|
May 31, 2020 |
|
February 21, 2020 |
|
$ |
0.00168675 |
|
|
|
1,630,166 |
|
|
|
798,492 |
|
|
|
2,428,658 |
|
|
June 30, 2020 |
|
May 14, 2020 |
|
$ |
0.00168675 |
|
|
|
1,586,255 |
|
|
|
768,554 |
|
|
|
2,354,809 |
|
|
July 31, 2020 |
|
May 14, 2020 |
|
$ |
0.00168675 |
|
|
|
1,633,362 |
|
|
|
790,735 |
|
|
|
2,424,097 |
|
|
August 31, 2020 |
|
May 14, 2020 |
|
$ |
0.00168675 |
|
|
|
1,647,236 |
|
|
|
784,492 |
|
|
|
2,431,728 |
|
|
September 30, 2020 |
|
August 11, 2020 |
|
$ |
0.00168675 |
|
|
|
1,602,006 |
|
|
|
758,709 |
|
|
|
2,360,715 |
|
|
October 31, 2020 |
|
August 11, 2020 |
|
$ |
0.00168675 |
|
|
|
1,658,266 |
|
|
|
779,447 |
|
|
|
2,437,713 |
|
|
November 30, 2020 |
|
August 11, 2020 |
|
$ |
0.00168675 |
|
|
|
1,613,503 |
|
|
|
748,170 |
|
|
|
2,361,673 |
|
|
December 31, 2020 |
|
November 10, 2020 |
|
$ |
0.00168675 |
|
|
|
1,684,506 |
|
|
|
766,053 |
|
|
|
2,450,559 |
|
|
Total for 2020 |
|
|
|
|
|
|
|
$ |
19,400,494 |
|
|
$ |
9,274,239 |
|
|
$ |
28,674,733 |
|
F-34
Note 10. Financial Highlights
The following is a schedule of financial highlights of the Company for the years ended December 31, 2020 and 2019:
|
|
Twelve months ended |
|
|||||
|
|
December 31, |
|
|
December 31, |
|
||
|
|
2020 |
|
|
2019 |
|
||
|
Per unit data (1): |
|
|
|
|
|
|
|
|
Net asset value at beginning of period |
$ |
8.01 |
|
|
$ |
8.20 |
|
|
Net investment income |
|
0.51 |
|
|
|
0.52 |
|
|
Net change in unrealized depreciation on investments |
|
(0.32 |
) |
|
|
(0.11 |
) |
|
Net increase in net assets resulting from operations |
|
0.18 |
|
|
|
0.41 |
|
|
Distributions |
|
(0.62 |
) |
|
|
(0.61 |
) |
|
Net change in accrued distribution and other fees |
|
0.00 |
|
|
|
0.02 |
|
|
Net decrease in net assets |
|
(0.42 |
) |
|
|
(0.19 |
) |
|
Net asset value at end of period (2) |
$ |
7.58 |
|
|
$ |
8.01 |
|
|
Total return based on net asset value (3) |
|
2.39 |
% |
|
|
4.98 |
% |
|
Net assets at end of period |
$ |
355,273,630 |
|
|
$ |
369,595,560 |
|
|
Units Outstanding at end of period |
|
46,807,115 |
|
|
|
46,143,564 |
|
|
Ratio/Supplemental data (annualized) (3): |
|
|
|
|
|
|
|
|
Ratio of net investment income to average net assets |
|
6.14 |
% |
|
|
6.32 |
% |
|
Ratio of net operating expenses to average net assets |
|
4.93 |
% |
|
|
5.61 |
% |
|
1 |
The per unit data was derived by using the weighted average units outstanding during the years ended December 31, 2020 and 2019, which were 46,529,861 and 44,707,581, respectively. |
|
2 |
For financial statement reporting purposes under GAAP, as of December 31, 2020 and 2019, the Company recorded a liability in the amount of $480,000 and $647,000, respectively, for the estimated future amount of Class C distribution fees, Class I dealer manager fees, Class W dealer manager fees and Class W services fees payable. This liability is reflected in this table, which is consistent with the financial statements. While the Company follows GAAP for financial reporting purposes, it has determined that deducting the accrual for the estimated future amount of Class C distribution fees, Class I dealer manager fees, Class W dealer manager fees and Class W services fees may not be the appropriate approach for determining the net asset value used on the quarterly investor statements and for other purposes. The Company believes that not making such deduction for purposes of net asset value determination is consistent with the industry standard and is more appropriate since the Company intends for the net asset value to reflect the estimated value on the date that the Company determines its net asset value. |
|
3 |
The Company’s net investment income has been annualized assuming consistent results over a full fiscal year, however, this may not be indicative of actual results over a full fiscal year. |
Note 11. Subsequent Events
The Company’s management has evaluated subsequent events through the date of issuance of the consolidated financial statements included herein. There have been no subsequent events that occurred during such period that would require disclosure in the Form 10-K or would be required to be recognized in the consolidated financial statements as of and for the year ended December 31, 2020, except as discussed below.
Distributions
With the authorization of the Company’s board of managers, the Company declared distributions for all classes of units for the period from January 1 through April 30, 2021. These distributions were or will be calculated based on unitholders of record for each day in an amount equal to $0.00168675 per unit per day (less the distribution fee with respect to Class C units, the ongoing dealer manager fee with respect to certain Class I units and Class W units, and the ongoing service fee with respect to Class W units).
The cash distributions for January and February totaled $1,638,166 and $1,485,176, respectively. With respect to unitholders participating in the Distribution Reinvestment Plan, $767,969 and $695,616 of the distributions for January and February, respectively, were reinvested in units.
The March and April distributions will be calculated based on unitholders of record for each day in an amount equal to $0.00168675 per unit per day (less the distribution fee with respect to Class C units, the ongoing dealer manager fee with respect to certain Class I units and Class W units and the ongoing service fee with respect to Class W units). These distributions will be paid in cash or reinvested in units, for those unitholders participating in the Distribution Reinvestment Plan on or about April 1, 2021 and May 1, 2021, respectively.
F-35
On March 26, 2021, the Company’s board of managers determined that it is in the Company’s best interests, that, for periods on and after May 1, 2021, the Company’s daily distribution rate will be more closely tied to the most recently determined NAV per unit that the Company has disclosed in a public filing with the SEC at the time the distribution is declared. Accordingly, the Company’s board of managers has authorized a daily distribution rate of $0.00145753 per unit (less the ongoing fees applicable to certain classes of units which reduce the amount of distributions paid to the applicable unitholders) for the month of May 2021, which is equal to an annualized rate of approximately 7.0% of the NAV of $7.600 per unit, determined as of December 31, 2020. This daily distribution rate is lower than the daily distribution rate of $0.00168675 per unit, per day that had been declared by the Company with respect to distributions from March 2018 through April 2021. The board of managers expects to maintain the declaration and payment of distributions at an annualized rate equal to approximately 7.0% of the most recently determined NAV per unit that the Company has disclosed in a public filing with the SEC at the time the distribution is declared, which means the distribution rate is expected to remain relatively constant as a percentage of the Company’s NAV per unit. However, the board of managers may determine, in its discretion at any time, to change the rate at which distributions are paid or to not pay distributions at all. Given that the Company’s NAV per unit varies from quarter to quarter, it is expected that, even if the approximate annualized rate at which distributions are declared remains constant, the actual per unit dollar amount of distributions paid to unitholders may vary from time to time in concert with variations in the Company’s NAV. The payment of distributions is uncertain and cannot be guaranteed.
Investments
Subsequent to December 31, 2020 through March 31, 2021, the Company funded approximately $18.9 million in new investments and received proceeds from repayment of investments of approximately $6.5 million.
F-36
Pursuant to the requirements of Section 13 or 15(d) of the Securities Exchange Act of 1934, the registrant has duly caused this report to be signed on its behalf by the undersigned, thereunto duly authorized on March 31, 2021.
|
TriLinc Global Impact Fund, LLC |
|
|
|
/s/ Gloria S. Nelund |
|
Gloria S. Nelund |
|
Chief Executive Officer (principal executive officer) |
Pursuant to the requirements of the Securities Exchange Act of 1934, this report has been signed below by the following persons on behalf of the registrant and in the capacities and on the date indicated:
|
Name |
|
Title |
|
Date |
|
|
|
|
||
|
/s/ Gloria S. Nelund |
|
Chief Executive Officer, Manager (principal executive officer) |
|
March 31, 2021 |
|
Gloria S. Nelund |
||||
|
|
|
|
||
|
/s/ Mark A. Tipton |
|
Chief Financial Officer (principal financial and accounting officer) |
|
March 31, 2021 |
|
Mark A. Tipton |
|
|
|
|
|
|
|
|
|
|
|
/s/ Brent L. VanNorman |
|
Manager |
|
March 31, 2021 |
|
Brent L. VanNorman |
||||
|
|
|
|
||
|
/s/ Terry Otton |
|
Manager |
|
March 31, 2021 |
|
Terry Otton |
||||
|
|
|
|
||
|
/s/ Cynthia Hostetler |
|
Manager |
|
March 31, 2021 |
|
Cynthia Hostetler |
||||
|
|
|
|
||
|
/s/ R. Michael Barth |
|
Manager |
|
March 31, 2021 |
|
R. Michael Barth |
||||