Attached files
| file | filename |
|---|---|
| EX-99.1 - EXHIBIT 99.1 - Porch Group, Inc. | tm2111542d1_ex99-1.htm |
| 8-K - FORM 8-K - Porch Group, Inc. | tm2111542d1_8k.htm |
Exhibit 99.2
Copyright 2021 Porch Group, Inc. All rights reserved 1 Q4 2020 Earnings Presentation March 30, 2021 Group Love your home. For moving and improving and everything in between.
Copyright 2021 Porch Group, Inc. All rights reserved 2 DISCLAIMERS 2 Forward - Looking Statements Certain statements in this presentation may be considered “forward - looking statements” within the meaning of the “safe harbor” provisions of the United States Private Securities Litigation Reform Act of 1995 . Forward - looking statements generally relate to future events or Porch Group, Inc . ’s (“Porch”) future financial or operating performance . For example, projections of future revenue, contribution margin, Adjusted EBITDA and other metrics, business strategy and plans, and anticipated impacts from pending or completed acquisitions, are forward - looking statements . In some cases, you can identify forward - looking statements by terminology such as “may,” “should,” “expect,” “intend,” “will,” “estimate,” “anticipate,” “believe,” “predict,” “potential” or “continue,” or the negatives of these terms or variations of them or similar terminology . Such forward - looking statements are subject to risks, uncertainties, and other factors which could cause actual results to differ materially from those expressed or implied by such forward looking statements . These forward - looking statements are based upon estimates and assumptions that, while considered reasonable by Porch and its management, are inherently uncertain . Factors that may cause actual results to differ materially from current expectations include, but are not limited to : ( 1 ) the ability to recognize the anticipated benefits of Porch’s December 2020 business combination (the “Merger”) with PropTech Acquisition Corporation (“PropTech”), which may be affected by, among other things, competition and the ability of the combined company to grow and manage growth profitably, maintain key commercial relationships and retain its management and key employees ; ( 2 ) expansion plans and opportunities, including future and pending acquisitions or additional business combinations ; ( 3 ) costs related to the Merger and being a public company ; ( 4 ) litigation, complaints, and/or adverse publicity ; ( 5 ) the impact of changes in consumer spending patterns, consumer preferences, local, regional and national economic conditions, crime, weather, demographic trends and employee availability ; ( 6 ) privacy and data protection laws, privacy or data breaches, or the loss of data ; ( 7 ) the impact of the COVID - 19 pandemic and its effect on the business and financial conditions of Porch ; and ( 8 ) other risks and uncertainties described in our filings with the Securities and Exchange Commission (“SEC”), which are available on the SEC’s website at www . sec . gov . Nothing in this presentation should be regarded as a representation by any person that the forward - looking statements set forth herein will be achieved or that any of the contemplated results of such forward - looking statements will be achieved . You should not place undue reliance on forward - looking statements, which speak only as of the date they are made . Porch does not undertake any duty to update these forward - looking statements, except as may be required by law . 2020 Financial Information ; Non - GAAP Financial Measures Some of the financial information and data contained in this presentation, such as Adjusted EBITDA, Adjusted EBITDA Margin, Contribution Margin, and Gross Written Premium have not been prepared in accordance with United States generally accepted accounting principles (“GAAP”) . Porch defines Adjusted EBITDA as net income (loss) plus interest expense, net, income tax expense (benefit), other expense, net, and depreciation and amortization, certain non - cash long - lived asset impairment charges, stock - based compensation expense and acquisition - related impacts, including compensation to the sellers that requires future service, amortization of intangible assets, gains (losses) recognized on changes in the value of contingent consideration arrangements, if any, gain or loss on divestures and certain transaction costs . Adjusted EBITDA Margin is defined as Adjusted EBITDA as a percentage of total revenue . Contribution Margin is defined as revenue less all variable expenses, including cost of revenue, marketing and sales . Gross Written Premium represents the total dollars of insurance premium sales based on date of contract execution . Porch is not providing reconciliations of expected Adjusted EBITDA, Adjusted EBITDA Margin, Contribution Margin, or Gross Written Premium for future periods to the most directly comparable measures prepared in accordance with GAAP because Porch is unable to provide these reconciliations without unreasonable effort because certain information necessary to calculate such measures on a GAAP basis is unavailable or dependent on the timing of future events outside of our control . Porch uses these non - GAAP measures to compare Porch’s performance to that of prior periods for budgeting and planning purposes . Porch believes these non - GAAP measures of financial results provide useful information to management and investors regarding certain financial and business trends relating to Porch’s results of operations . Porch believes that the use of these non - GAAP financial measures provides an additional tool for investors to use in evaluating projected operating results and trends in and in comparing Porch’s financial measures with other similar companies, many of which present similar non - GAAP financial measures to investors . Porch's method of determining these non - GAAP measures may be different from other companies' methods and, therefore, may not be comparable to those used by other companies and Porch does not recommend the sole use of these non - GAAP measures to assess its financial performance . Porch management does not consider these non - GAAP measures in isolation or as an alternative to financial measures determined in accordance with GAAP . The principal limitation of these non - GAAP financial measures is that they exclude significant expenses and income that are required by GAAP to be recorded in Porch’s financial statements . In addition, they are subject to inherent limitations as they reflect the exercise of judgments by management about which expense and income are excluded or included in determining these non - GAAP financial measures . In order to compensate for these limitations, management presents non - GAAP financial measures in connection with GAAP results . Other companies may calculate Adjusted EBITDA, Adjusted EBITDA Margin, Contribution Margin, Gross Written Premium and other non - GAAP measures differently, and therefore Porch’s Adjusted EBITDA, Adjusted EBITDA Margin, Contribution Margin, Gross Written Premium and other non - GAAP measures may not be directly comparable to similarly titled measures of other companies . Use of Projections This presentation contains financial forecasts of Porch, namely Porch’s projected revenue, Contribution Margin, Adjusted EBITDA, Adjusted EBITDA Margin, and Gross Written Premium for 2021 . Porch’s independent registered public accounting firm has not audited, reviewed, compiled or performed any procedures with respect to the projections for the purpose of their inclusion in this presentation, and accordingly, did not express an opinion or provide any other form of assurance with respect thereto for the purpose of this presentation . These projections should not be relied upon as being necessarily indicative of future results . The projected financial information contained in this presentation constitutes forward - looking information . The assumptions and estimates underlying such projected financial information are inherently uncertain and are subject to a wide variety of significant business, economic, competitive and other risks and uncertainties that could cause actual results to differ materially from those contained in the prospective financial information . See “Forward - Looking Statements” above . Actual results may differ materially from the results contemplated by the projected financial information contained in this presentation, and the inclusion of such information in this presentation should not be regarded as a representation by any person that the results reflected in such projections will be achieved .

Copyright 2021 Porch Group, Inc. All rights reserved Presenters Matt Ehrlichman CEO & Founder, Porch Group matt@porchgroup.com www.porchgroup.com Marty Heimbigner CFO, Porch Group marty@porchgroup.com Matthew Neagle COO, Porch Group maneagle@porchgroup.com 3
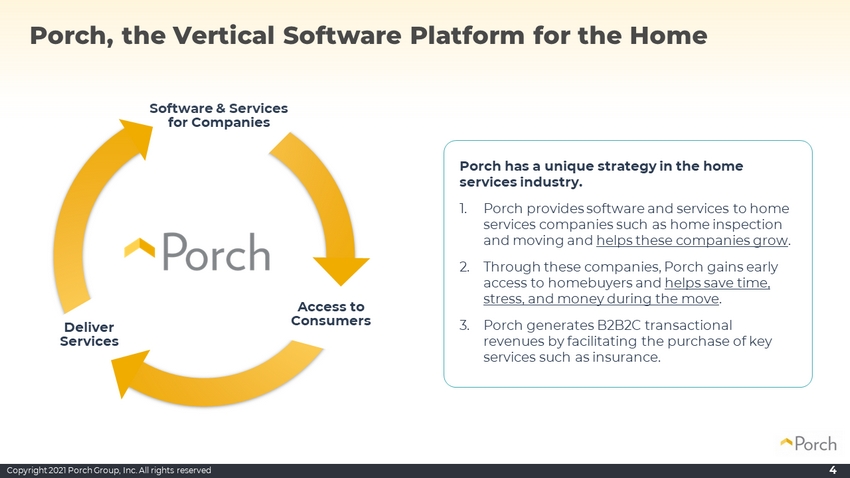
Copyright 2021 Porch Group, Inc. All rights reserved Software & Services for Companies Access to Consumers Deliver Services Porch has a unique strategy in the home services industry. 1. Porch provides software and services to home services companies such as home inspection and moving and helps these companies grow . 2. Through these companies, Porch gains early access to homebuyers and helps save time, stress, and money during the move . 3. Porch generates B2B2C transactional revenues by facilitating the purchase of key services such as insurance. Porch, the Vertical Software Platform for the Home 4
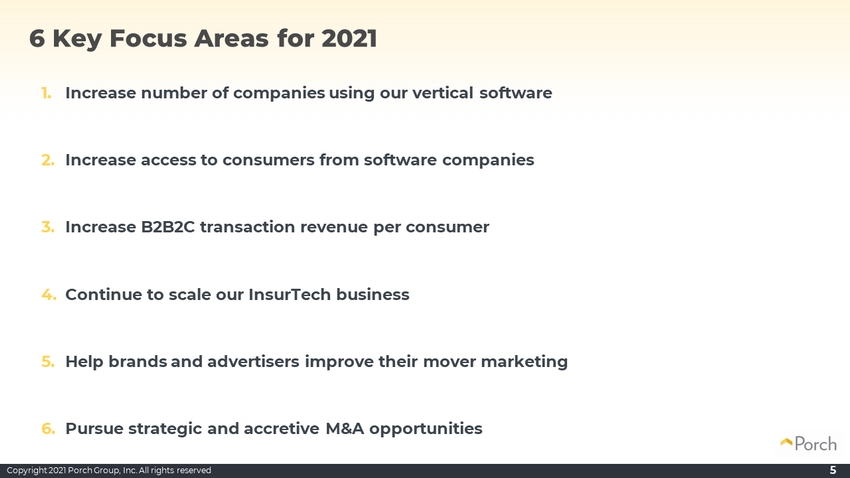
Copyright 2021 Porch Group, Inc. All rights reserved 6 Key Focus Areas for 2021 1. Increase number of companies using our vertical software 2. Increase access to consumers from software companies 3. Increase B2B2C transaction revenue per consumer 4. Continue to scale our InsurTech business 5. Help brands and advertisers improve their mover marketing 6. Pursue strategic and accretive M&A opportunities 5
Copyright 2021 Porch Group, Inc. All rights reserved 6 Q4 and Full Year 2020 Results Group
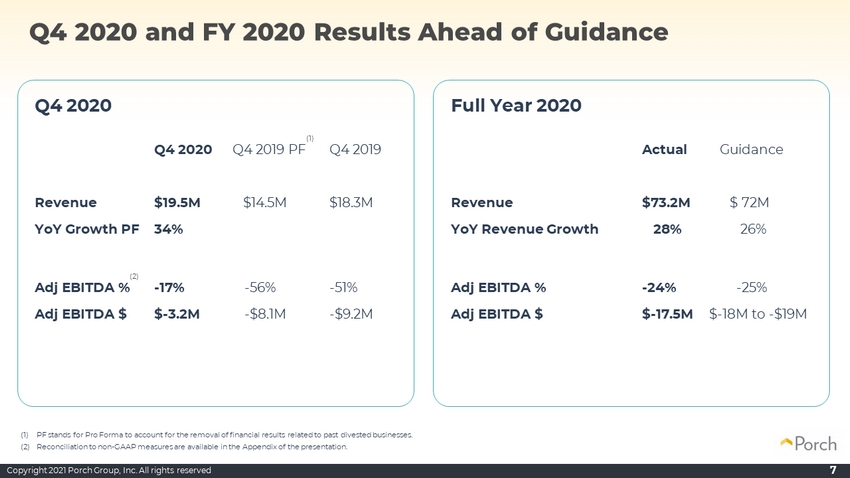
Copyright 2021 Porch Group, Inc. All rights reserved 7 Q4 2020 and FY 2020 Results Ahead of Guidance Q4 2020 Q4 2020 Q4 2019 PF Q4 2019 Revenue $19.5M $14.5M $18.3M YoY Growth PF 34% Adj EBITDA % - 17% - 56% - 51% Adj EBITDA $ $ - 3.2M - $8.1M - $9.2M Full Year 2020 Actual Guidance Revenue $73.2M $ 72M YoY Revenue Growth 28% 26% Adj EBITDA % - 24% - 25% Adj EBITDA $ $ - 17.5M $ - 18M to - $19M (1) PF stands for Pro Forma to account for the removal of financial results related to past divested businesses. (2) Reconciliation to non - GAAP measures are available in the Appendix of the presentation. (1) (2)
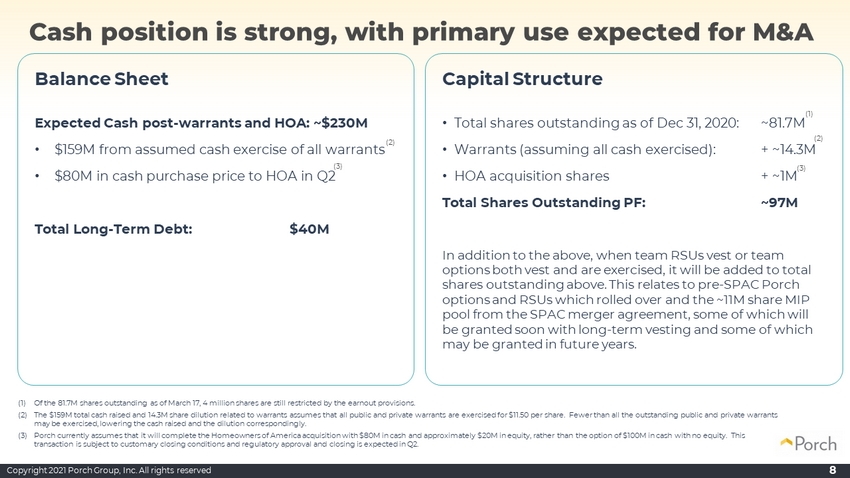
Copyright 2021 Porch Group, Inc. All rights reserved 8 Balance Sheet Expected Cash post - warrants and HOA: ~$230M • $159M from assumed cash exercise of all warrants • $80M in cash purchase price to HOA in Q2 Total Long - Term Debt: $40M Capital Structure • Total shares outstanding as of Dec 31, 2020: ~81.7M • Warrants (assuming all cash exercised): + ~14.3M • HOA acquisition shares + ~1M Total Shares Outstanding PF: ~97M In addition to the above, when team RSUs vest or team options both vest and are exercised, it will be added to total shares outstanding above. This relates to pre - SPAC Porch options and RSUs which rolled over and the ~11M share MIP pool from the SPAC merger agreement, some of which will be granted soon with long - term vesting and some of which may be granted in future years. (1) Of the 81.7M shares outstanding as of March 17, 4 million shares are still restricted by the earnout provisions. (2) The $159M total cash raised and 14.3M share dilution related to warrants assumes that all public and private warrants are exe rci sed for $11.50 per share. Fewer than all the outstanding public and private warrants may be exercised, lowering the cash raised and the dilution correspondingly. (3) Porch currently assumes that it will complete the Homeowners of America acquisition with $80M in cash and approximately $20M in equity, rather than the option of $100M in cash with no equity. This transaction is subject to customary closing conditions and regulatory approval and closing is expected in Q2. Cash position is strong, with primary use expected for M&A (1) (2) (3) (2) (3)
Copyright 2021 Porch Group, Inc. All rights reserved 9 Public KPIs Group
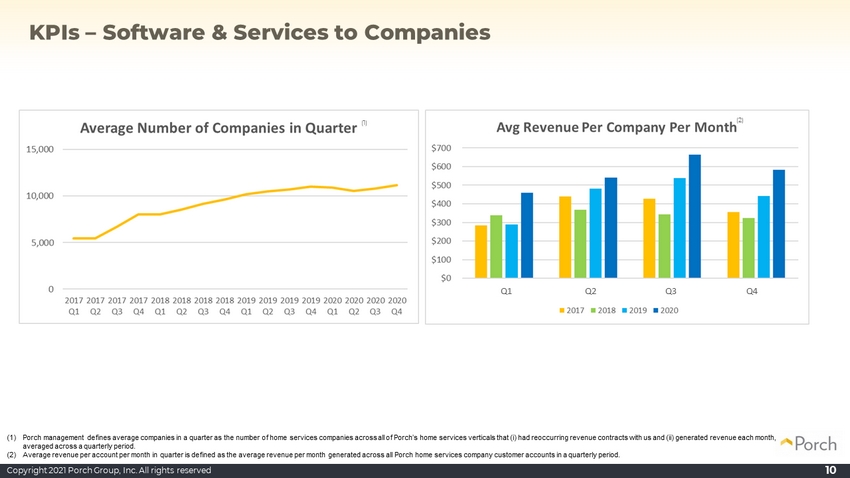
Copyright 2021 Porch Group, Inc. All rights reserved 10 KPIs – Software & Services to Companies (1) Porch management defines average companies in a quarter as the number of home services companies across all of Porch’s home s erv ices verticals that ( i ) had reoccurring revenue contracts with us and (ii) generated revenue each month, averaged across a quarterly period. (2) Average revenue per account per month in quarter is defined as the average revenue per month generated across all Porch home ser vices company customer accounts in a quarterly period. Q1 Q2 Q3 Q4 (1) (2)
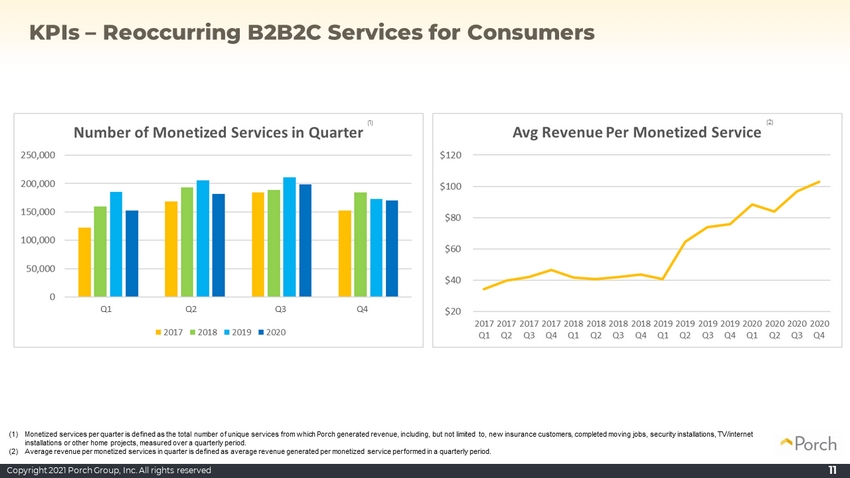
Copyright 2021 Porch Group, Inc. All rights reserved 11 KPIs – Reoccurring B2B2C Services for Consumers (1) Monetized services per quarter is defined as the total number of unique services from which Porch generated revenue, includin g, but not limited to, new insurance customers, completed moving jobs, security installations, TV/internet installations or other home projects, measured over a quarterly period. (2) Average revenue per monetized services in quarter is defined as average revenue generated per monetized service performed in a q uarterly period. Q1 Q2 Q3 Q4 (1) (2)
Copyright 2021 Porch Group, Inc. All rights reserved 12 Q1 and Full Year 2021 Guidance Update Group
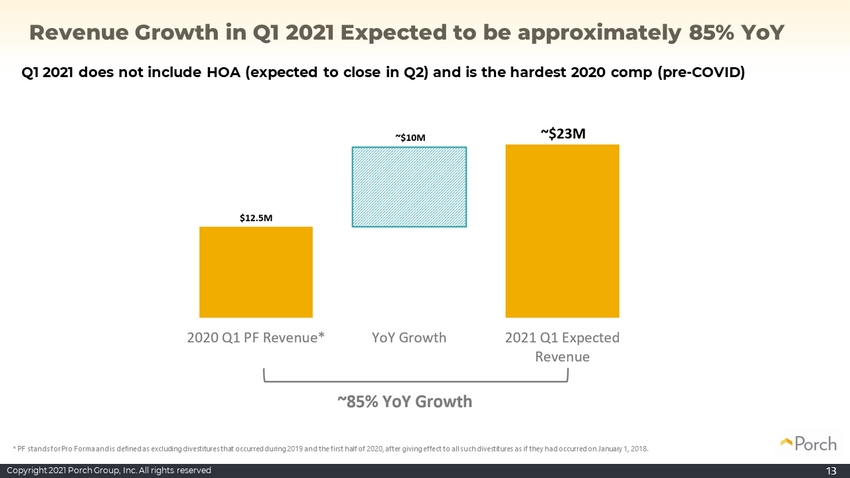
Copyright 2021 Porch Group, Inc. All rights reserved 13 Revenue Growth in Q1 2021 Expected to be approximately 85% YoY * PF stands for Pro Forma and is defined as excluding divestitures that occurred during 2019 and the first half of 2020, afte r g iving effect to all such divestitures as if they had occurred on January 1, 2018. Q1 2021 does not include HOA (expected to close in Q2) and is the hardest 2020 comp (pre - COVID)
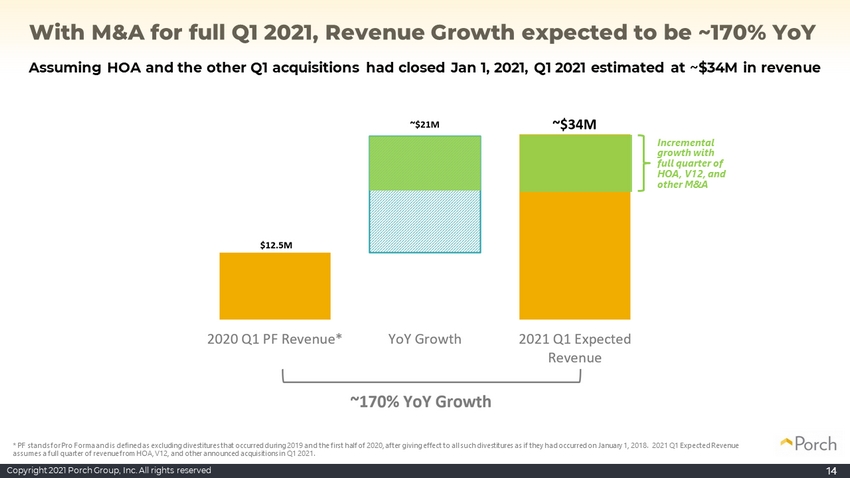
Copyright 2021 Porch Group, Inc. All rights reserved 14 With M&A for full Q1 2021, Revenue Growth expected to be ~170% YoY Assuming HOA and the other Q1 acquisitions had closed Jan 1, 2021, Q1 2021 estimated at ~$34M in revenue Incremental growth with full quarter of HOA, V12, and other M&A * PF stands for Pro Forma and is defined as excluding divestitures that occurred during 2019 and the first half of 2020, afte r g iving effect to all such divestitures as if they had occurred on January 1, 2018. 2021 Q1 Expected Revenue assumes a full quarter of revenue from HOA, V12, and other announced acquisitions in Q1 2021.
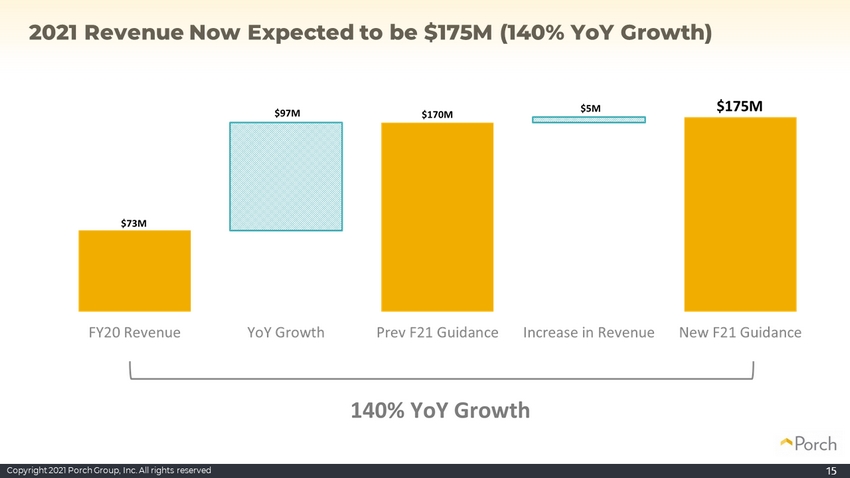
Copyright 2021 Porch Group, Inc. All rights reserved 15 2021 Revenue Now Expected to be $175M (140% YoY Growth)
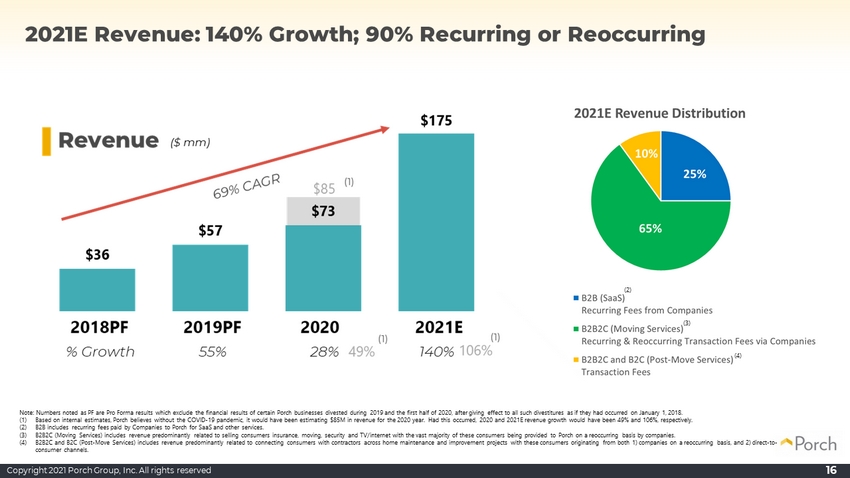
Copyright 2021 Porch Group, Inc. All rights reserved Note: Numbers noted as PF are Pro Forma results which exclude the financial results of certain Porch businesses divested duri ng 2019 and the first half of 2020, after giving effect to all such divestitures as if they had occurred on January 1, 2018. (1) Based on internal estimates, Porch believes without the COVID - 19 pandemic, it would have been estimating $85M in revenue for the 2020 year. Had this occurred, 2020 and 2021E revenue growth would have been 49% and 106%, respectively. (2) B2B includes recurring fees paid by Companies to Porch for SaaS and other services. (3) B2B2C (Moving Services) includes revenue predominantly related to selling consumers insurance, moving, security and TV/intern et with the vast majority of these consumers being provided to Porch on a reoccurring basis by companies. (4) B2B2C and B2C (Post - Move Services) includes revenue predominantly related to connecting consumers with contractors across home m aintenance and improvement projects with these consumers originating from both 1) companies on a reoccurring basis, and 2) di rec t - to - consumer channels. 16 2021E Revenue: 140% Growth; 90% Recurring or Reoccurring (2) (3) (4)
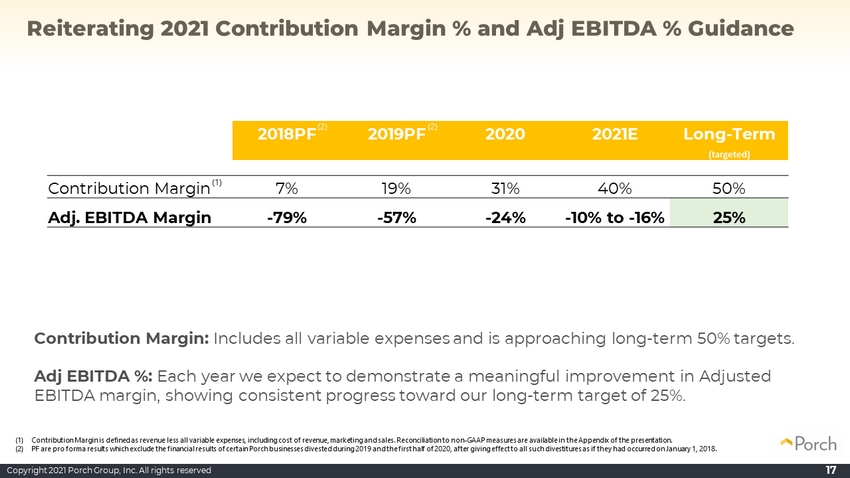
Copyright 2021 Porch Group, Inc. All rights reserved Reiterating 2021 Contribution Margin % and Adj EBITDA % Guidance 17 Contribution Margin: Includes all variable expenses and is approaching long - term 50% targets. Adj EBITDA %: Each year we expect to demonstrate a meaningful improvement in Adjusted EBITDA margin, showing consistent progress toward our long - term target of 25%. 2018PF 2019PF 2020 2021E Long - Term (targeted) Contribution Margin 7% 19% 31% 40% 50% Adj. EBITDA Margin - 79% - 57% - 24% - 10% to - 16% 25% (1) Contribution Margin is defined as revenue less all variable expenses, including cost of revenue, marketing and sales. Reconci lia tion to non - GAAP measures are available in the Appendix of the presentation. (2) PF are pro forma results which exclude the financial results of certain Porch businesses divested during 2019 and the first h alf of 2020, after giving effect to all such divestitures as if they had occurred on January 1, 2018. (1) (2) (2)
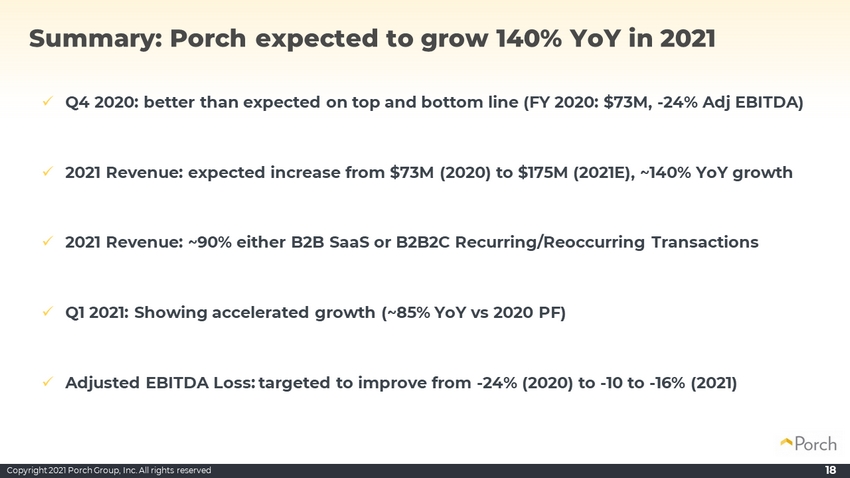
Copyright 2021 Porch Group, Inc. All rights reserved Summary: Porch expected to grow 140% YoY in 2021 x Q4 2020: better than expected on top and bottom line (FY 2020: $73M, - 24% Adj EBITDA) x 2021 Revenue: expected increase from $73M (2020) to $175M (2021E), ~140% YoY growth x 2021 R evenue : ~90% either B2B SaaS or B2B2C Recurring/Reoccurring Transactions x Q1 2021: Showing accelerated growth (~85% YoY vs 2020 PF) x Adjusted EBITDA Loss: targeted to improve from - 2 4 % (2020) to - 10 to - 16% (2021) 18

Copyright 2021 Porch Group, Inc. All rights reserved 19 Thank you Group

Copyright 2021 Porch Group, Inc. All rights reserved 20 Q&A Group

Copyright 2021 Porch Group, Inc. All rights reserved 21 Appendix Group
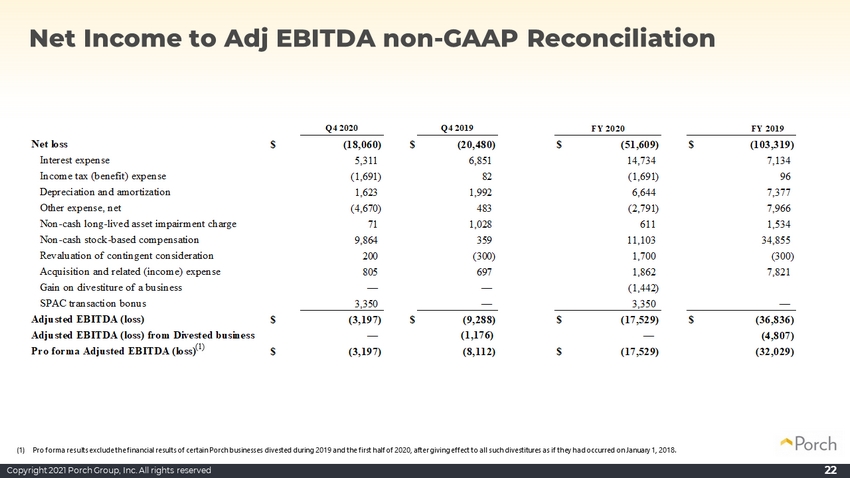
Copyright 2021 Porch Group, Inc. All rights reserved Net Income to Adj EBITDA non - GAAP Reconciliation 22 Q4 2020 Q4 2019 Net loss $ (18,060) $ (20,480) $ (51,609) $ (103,319) Interest expense 5,311 6,851 14,734 7,134 Income tax (benefit) expense (1,691) 82 (1,691) 96 Depreciation and amortization 1,623 1,992 6,644 7,377 Other expense, net (4,670) 483 (2,791) 7,966 Non-cash long-lived asset impairment charge 71 1,028 611 1,534 Non-cash stock-based compensation 9,864 359 11,103 34,855 Revaluation of contingent consideration 200 (300) 1,700 (300) Acquisition and related (income) expense 805 697 1,862 7,821 Gain on divestiture of a business — — (1,442) SPAC transaction bonus 3,350 — 3,350 — Adjusted EBITDA (loss) $ (3,197) $ (9,288) $ (17,529) $ (36,836) Adjusted EBITDA (loss) from Divested business — (1,176) — (4,807) Pro forma Adjusted EBITDA (loss) $ (3,197) (8,112) $ (17,529) (32,029) FY 2020 FY 2019 (1) Pro forma results exclude the financial results of certain Porch businesses divested during 2019 and the first half of 2020, aft er giving effect to all such divestitures as if they had occurred on January 1, 2018. (1)
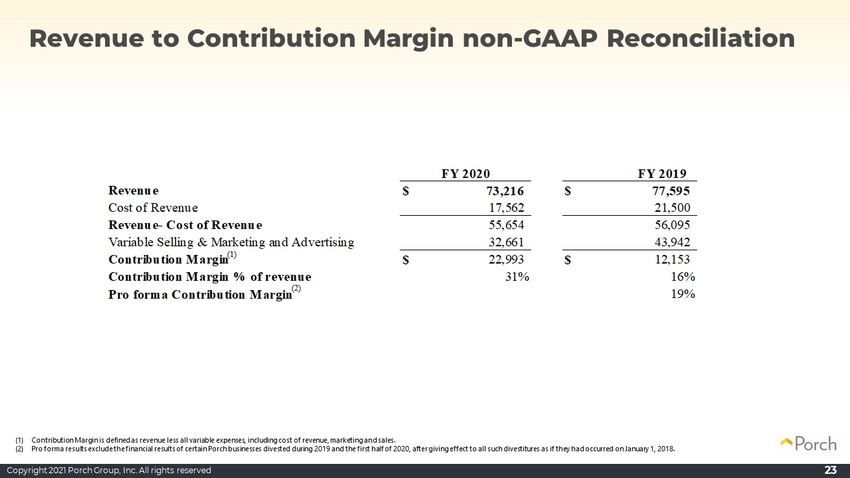
Copyright 2021 Porch Group, Inc. All rights reserved Revenue $ 73,216 $ 77,595 Cost of Revenue 17,562 21,500 Revenue- Cost of Revenue 55,654 56,095 Variable Selling & Marketing and Advertising 32,661 43,942 Contribution Margin $ 22,993 $ 12,153 Contribution Margin % of revenue 31% 16% Pro forma Contribution Margin 19% FY 2020 FY 2019 Revenue to Contribution Margin non - GAAP Reconciliation 23 (1) Contribution Margin is defined as revenue less all variable expenses, including cost of revenue, marketing and sales. (2) Pro forma results exclude the financial results of certain Porch businesses divested during 2019 and the first half of 2020, aft er giving effect to all such divestitures as if they had occurred on January 1, 2018. (1) (2)
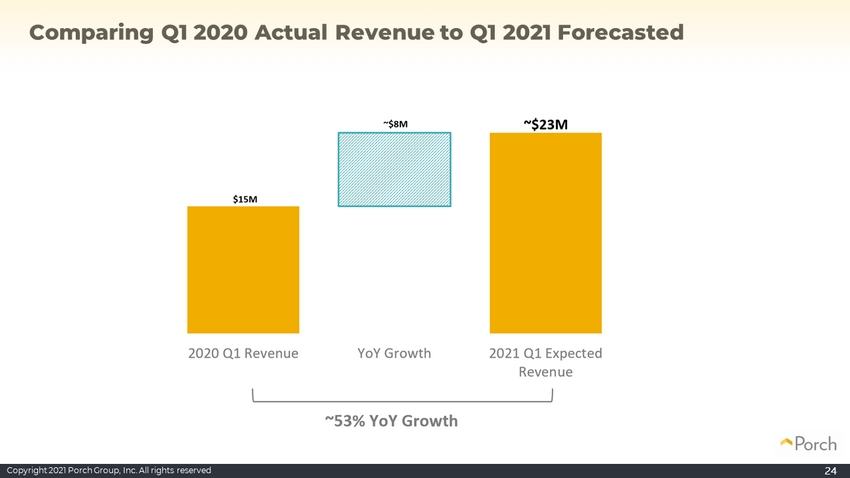
Copyright 2021 Porch Group, Inc. All rights reserved 24 Comparing Q1 2020 Actual Revenue to Q1 2021 Forecasted
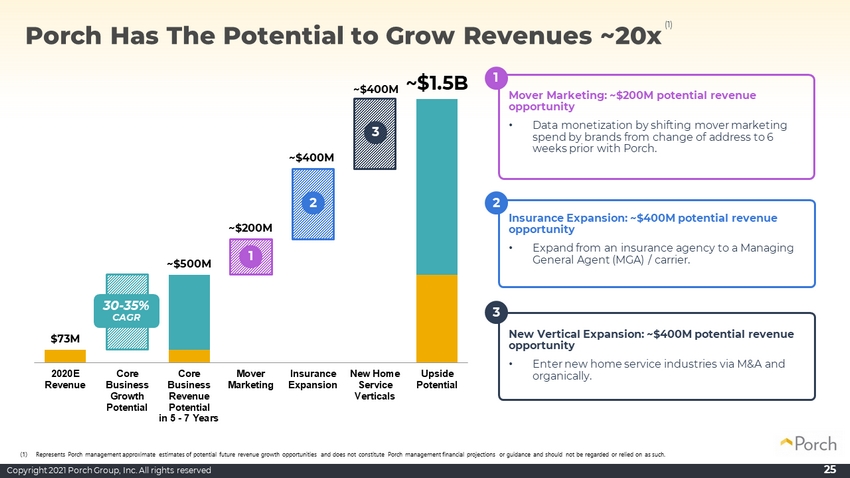
Copyright 2021 Porch Group, Inc. All rights reserved $73M ~$500M ~$1.5B - $200 $400 $600 $800 $1000 $1200 $1400 $1600 2020E Revenue Core Business Growth Potential Core Business Revenue Potential in 5 - 7 Years Mover Marketing Insurance Expansion New Home Service Verticals Upside Potential ~$200M ~$400M ~$400M Porch Has The Potential to Grow Revenues ~20x 25 New Vertical Expansion: ~$400M potential revenue opportunity • Enter new home service industries via M&A and organically. 30 - 35% CAGR Insurance Expansion: ~$400M potential revenue opportunity • Expand from an insurance agency to a Managing General Agent (MGA) / carrier. Mover Marketing: ~$200M potential revenue opportunity • Data monetization by shifting mover marketing spend by brands from change of address to 6 weeks prior with Porch. 3 2 1 1 2 3 (1) (1) Represents Porch management approximate estimates of potential future revenue growth opportunities and does not constitute Po rch management financial projections or guidance and should not be regarded or relied on as such.
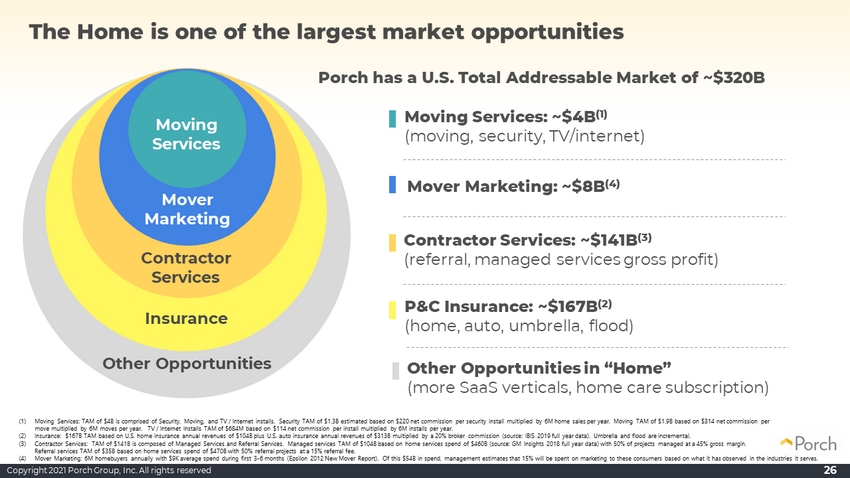
Copyright 2021 Porch Group, Inc. All rights reserved 26 Contractor Services: ~$ 141 B (3) (referral, managed services gross profit) Contractor Services Moving Services Mover Marketing Moving Services: ~ $4B (1) (moving, security, TV/internet) Porch has a U.S. Total Addressable Market of ~$320B The Home is one of the largest market opportunities Other Opportunities Mover Marketing: ~ $8 B ( 4) (1) Moving Services: TAM of $4B is comprised of Security, Moving, and TV / Internet installs. Security TAM of $1.3B estimated ba sed on $220 net commission per security install multiplied by 6M home sales per year. Moving TAM of $1.9B based on $314 net commission per move multiplied by 6M moves per year. TV / Internet Installs TAM of $684M based on $114 net commission per install multiplied by 6M installs per year. (2) Insurance: $167B TAM based on U.S. home insurance annual revenues of $104B plus U.S. auto insurance annual revenues of $313B mu ltiplied by a 20% broker commission (source: IBIS 2019 full year data). Umbrella and flood are incremental. (3) Contractor Services: TAM of $141B is composed of Managed Services and Referral Services . Managed services TAM of $104B based on home services spend of $460B (source: GM Insights 2018 full year data) with 50% of projects managed at a 45% gross margin. Referral services TAM of $35B based on home services spend of $470B with 50% referral projects at a 15% referral fee. (4) Mover Marketing: 6M homebuyers annually with $9K average spend during first 3 - 6 months (Epsilon 2012 New Mover Report). Of this $54B in spend, management estimates that 15% will be spent on marketing to these consumers based on what it has observed in t he industries it serves. Other Opportunities in “Home” (more SaaS verticals, h ome care subscription) Insurance P&C Insurance: ~ $167B (2) (home, auto, umbrella, flood)
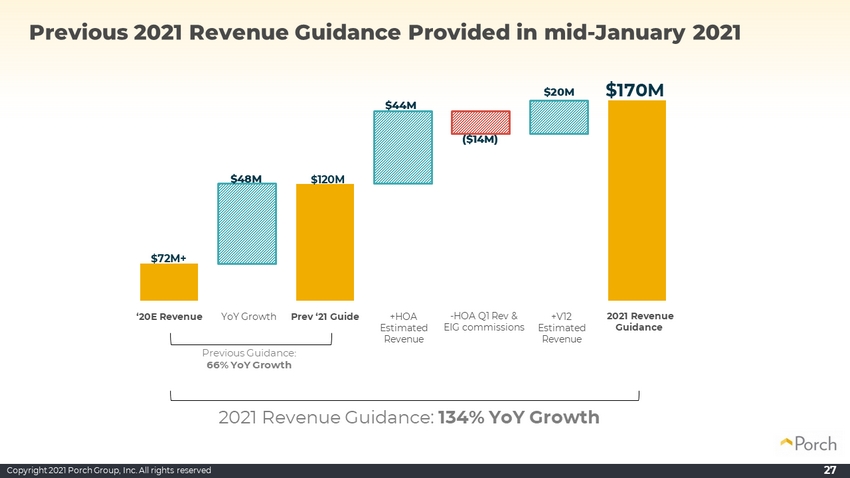
Copyright 2021 Porch Group, Inc. All rights reserved 27 Previous 2021 Revenue Guidance Provided in mid - January 2021 Previous Guidance: 66% YoY Growth $72M+ $120M $170M $48M $44M ($14M) $20M ‘20E Revenue YoY Growth Prev ‘21 Guide +HOA Estimated Revenue - HOA Q1 Rev & EIG commissions +V12 Estimated Revenue 2021 Revenue Guidance 2021 Revenue Guidance: 134% YoY Growth