Attached files
| file | filename |
|---|---|
| EX-99.1 - EXHIBIT 99.1 - Diamond S Shipping Inc. | tm2111490d1_ex99-1.htm |
| 8-K - FORM 8-K - Diamond S Shipping Inc. | tm2111490-1_8k.htm |
Exhibit 99.2

International Seaways / Diamond S Shipping Merger Investor Presentation March 2021

Disclaimer 2 Cautionary Statement Regarding Forward - Looking Statements This presentation contains certain statements that are “forward - looking statements” within the meaning of Section 27 A of the Securities Act of 1933 and Section 21 E of the Securities Exchange Act of 1934 , as amended . International Seaways, Inc . (the “Company” or “Seaways”) and Diamond S Shipping, Inc . (“Diamond”) have identified some of these forward - looking statements with words like “believe,” “may,” “could,” “would,” “might,” “possible,” “will,” “should,” “expect,” “intend,” “plan,” “anticipate,” “estimate”, “potential”, “outlook” or “continue,” the negative of these words, other terms of similar meaning or the use of future dates . Forward - looking statements in this communication include without limitation, statements about the benefits of the proposed transaction, including future financial and operating results and synergies, Seaways’, Diamond’s and the combined company’s plans, objectives, expectations and intentions, and the expected timing of the completion of the transaction . Such statements are qualified by the inherent risks and uncertainties surrounding future expectations generally, and actual results could differ materially from those currently anticipated due to a number of risks and uncertainties . Risks and uncertainties that could cause results to differ from expectations include : uncertainties as to the timing of the contemplated transaction ; uncertainties as to the approval of Seaways’ and Diamond’s shareholders required in connection with the contemplated transaction ; the possibility that a competing proposal will be made ; the possibility that the closing conditions to the contemplated transaction may not be satisfied or waived, including that a governmental entity may prohibit, delay or refuse to grant a necessary regulatory approval ; the effects of disruption caused by the announcement of the contemplated transaction making it more difficult to maintain relationships with employees, customers, vendors and other business partners ; the risk that stockholder litigation in connection with the contemplated transaction may affect the timing or occurrence of the contemplated transaction or result in significant costs of defense, indemnification and liability ; the risk that the anticipated tax treatment of the proposed transaction between Seaways and Diamond is not obtained ; other business effects, including the effects of industry, economic or political conditions outside of the control of the parties to the contemplated transaction ; transaction costs ; actual or contingent liabilities ; and other risks and uncertainties discussed in Seaways’ and Diamond’s filings with the U . S . Securities and Exchange Commission (the “SEC”), including the “Risk Factors” section of Seaways’ and Diamond’s respective annual reports on Form 10 - K for the fiscal year ended December 31 , 2020 . You can obtain copies of these documents free of charge from the sources indicated above . Neither Seaways nor Diamond undertake any obligation to update any forward - looking statements as a result of new information, future developments or otherwise, except as expressly required by law . All forward - looking statements in this communication are qualified in their entirety by this cautionary statement . Non - GAAP Financial Measures Included in this presentation are certain non - GAAP financial measures, including Time Charter Equivalent (“TCE”) revenue, EBITDA , Adjusted EBITDA, and total leverage ratios, designed to complement the financial information presented in accordance with generally accepted accounting principle s i n the United States of America because management believes such measures are useful to investors. TCE revenues, which represents shipping revenues less voyage expen ses , is a measure to compare revenue generated from a voyage charter to revenue generated from a time charter. EBITDA represents net (loss)/income before int erest expense, income taxes and depreciation and amortization expense. Adjusted EBITDA consists of EBITDA adjusted for the impact of certain items that we do no t consider indicative of our ongoing operating performance. Total leverage ratios are calculated as total debt divided by Adjusted EBITDA. We present non - GAAP measur es when we believe that the additional information is useful and meaningful to investors. Non - GAAP financial measures do not have any standardized meaning a nd are therefore unlikely to be comparable to similar measures presented by other companies. The presentation of non - GAAP financial measures is not intended to be a substitute for, and should not be considered in isolation from, the financial measures reported in accordance with GAAP. See Appendix for a reconciliation of c ert ain non - GAAP measures to the comparable GAAP measures. This presentation also contains estimates and other information concerning our industry that are based on industry publicatio ns, surveys and forecasts. This information involves a number of assumptions and limitations, and we have not independently verified the accuracy or completeness of the inf ormation.
Additional Information and Where to Find It This presentation may be deemed to be solicitation material in respect of the proposed transaction between Seaways and Diamond . In connection with the proposed transaction, Seaways intends to file with the SEC a registration statement on Form S - 4 that will include a joint proxy statement of Seaways and Diamond that also constitutes a prospectus of Seaways . Seaways and Diamond may also file other documents with the SEC regarding the proposed transaction . This presentation is not a substitute for the joint proxy statement/prospectus, Form S - 4 or any other document which Seaways or Diamond may file with the SEC . Investors and security holders of Seaways and Diamond are urged to read the joint proxy statement/prospectus, Form S - 4 and all other relevant documents filed or to be filed with the SEC carefully when they become available because they will contain important information about Seaways, Diamond, the transaction and related matters . Investors will be able to obtain free copies of the joint proxy statement/prospectus and Form S - 4 (when available) and other documents filed with the SEC by Seaways and Diamond through the website maintained by the SEC at www . sec . gov . Copies of documents filed with the SEC by Seaways will be made available free of charge on Seaways’ investor relations website at https : //www . intlseas . com/investor - relations . Copies of documents filed with the SEC by Diamond will be made available free of charge on Diamond’s investor relations website at https : //diamondsshipping . com/investor - relations . No Offer or Solicitation This presentation is not intended to and does not constitute an offer to sell or the solicitation of an offer to subscribe for or buy or an invitation to purchase or subscribe for any securities or the solicitation of any vote or approval in any jurisdiction, nor shall there be any sale, issuance or transfer of securities in any jurisdiction in contravention of applicable law . No offer of securities shall be made except by means of a prospectus meeting the requirements of Section 10 of the Securities Act of 1933 , as amended . Participants in the Solicitation Seaways, Diamond and certain of their respective directors and executive officers may be deemed to be participants in the solicitation of proxies from the holders of Seaways and Diamond securities in connection with the contemplated transaction . Information regarding these directors and executive officers and a description of their direct and indirect interests, by security holdings or otherwise, will be included in the Form S - 4 and joint proxy statement/prospectus regarding the proposed transaction (when available) and other relevant materials to be filed with the SEC by Seaways and Diamond . Information regarding Seaways’ directors and executive officers is available in Seaway’s proxy statement relating to its 2020 annual meeting of stockholders filed with the SEC on April 29 , 2020 . Information regarding Diamond’s directors and executive officers is available in Diamond’s proxy statement relating to its 2020 annual meeting of shareholders filed with the SEC on April 16 , 2020 . These documents will be available free of charge from the sources indicated above . Securities Disclaimer 3
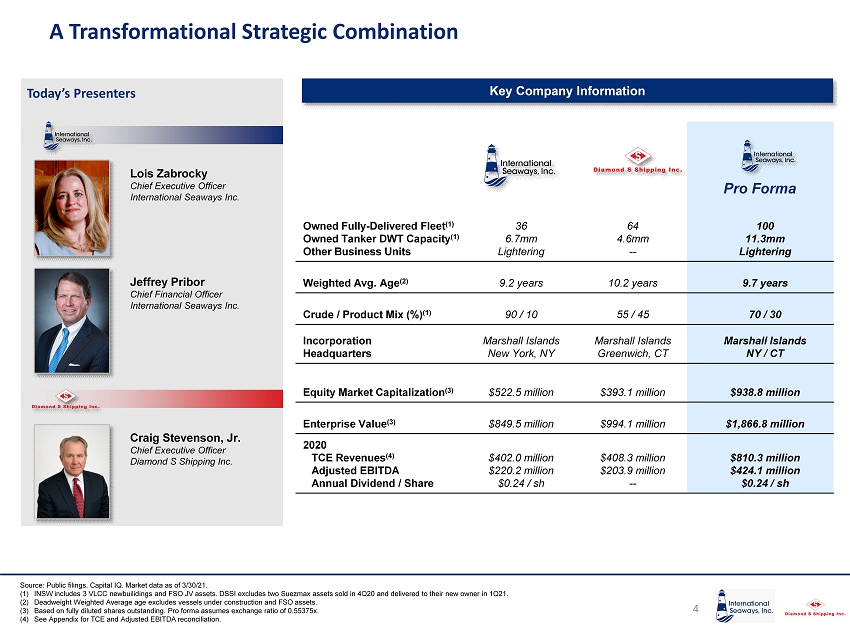
Source: Public filings. Capital IQ. Market data as of 3/30/21. (1) INSW includes 3 VLCC newbuilidings and FSO JV assets. DSSI excludes two Suezmax assets sold in 4Q20 and delivered to their new owner in 1Q21. (2) Deadweight Weighted Average age excludes vessels under construction and FSO assets. (3) Based on fully diluted shares outstanding. Pro forma assumes exchange ratio of 0.55375x. (4) See Appendix for TCE and Adjusted EBITDA reconciliation. Today’s Presenters A Transformational Strategic Combination 4 Key Company Information Owned Fully - Delivered Fleet (1) Owned Tanker DWT Capacity (1) Other Business Units 36 6.7mm Lightering 64 4.6mm -- 100 11.3mm Lightering Weighted Avg. Age (2) 9.2 years 10.2 years 9.7 years Crude / Product Mix (%) (1) 90 / 10 55 / 45 70 / 30 Incorporation Headquarters Marshall Islands New York, NY Marshall Islands Greenwich, CT Marshall Islands NY / CT Equity Market Capitalization (3) $522.5 million $393.1 million $938.8 million Enterprise Value (3) $849.5 million $994.1 million $1,866.8 million 2020 TCE Revenues (4) Adjusted EBITDA Annual Dividend / Share $402.0 million $220.2 million $0.24 / sh $408.3 million $203.9 million -- $810.3 million $424.1 million $0.24 / sh Lois Zabrocky Chief Executive Officer International Seaways Inc. Jeffrey Pribor Chief Financial Officer International Seaways Inc. Craig Stevenson, Jr. Chief Executive Officer Diamond S Shipping Inc. Pro Forma

Transaction Summary 5 International Seaways (“INSW”) and Diamond S Shipping (“DSSI”) will merge in a stock - for - stock transaction (the “Transaction”) t o create a diversified tanker company with an enterprise value of nearly $2 billion Key Terms • INSW will merge with DSSI in a stock - for - stock transaction • DSSI shareholders will receive 0.55375 shares in INSW in consideration for each share held • Post - Transaction, INSW and DSSI shareholders will own approximately 55.75% and 44.25% of the combined company, respectively Actions Concurrent with Transaction • Special dividend to INSW Shareholders o Immediately prior to closing, existing INSW shareholders will receive a special dividend of approximately $1.10 per share • Capital Ship Management (“CSM”) transition of services o Affiliated management services agreements to be phased out, with majority of vessels re - delivered by Q3 - Q4 2021 PF Company Management Leadership & Governance • Combined company will be led by INSW’s Chief Executive Officer Lois Zabrocky and Chief Financial Officer Jeffrey Pribor, with DSSI Chief Executive Officer Craig Stevenson, Jr. assuming the role of a special advisor for an interim period • Pro forma Board of Directors will be comprised of 10 Directors, of which seven (7) will be appointed by INSW and three (3) by DSSI • Formation of Integration Committee to ensure seamless transition Path to Closing • The lenders under DSSI’s credit facilities have consented to the change of control and therefore these facilities will remain outstanding (with amendments) following the Closing o DSSI banking group has provided consent to amend facilities as required to permit transaction • The bank amendments harmonize covenants across main facilities • Expected Transaction closing in Q3 2021 • Transaction subject to approvals of INSW and DSSI shareholders and customary regulatory approvals o A group of shareholders, representing approximately 14% and 29% of the issued and outstanding shares of INSW and DSSI, respectively, has committed to vote in favor of the Transaction

Key Transaction Highlights 6 The combination of INSW and DSSI will create a leader in the tanker segment – the second largest US - listed tanker owner by vessel count and the third largest US - listed tanker owner by DWT ▪ Leading tanker platform with diverse fleet of 100 tankers and combined dead - weight tonnage (“DWT”) of approximately 11.3 million ▪ Strong presence in crude (71% by DWT) and clean products (29% by DWT) trades across all sizes; creation of “power alleys” wit hin VLCC, Suezmax, LR1 / Panamax and MR vessel classes ▪ Broad operating footprint and strengthened financial profile improves positioning for accretive growth opportunities; organic gr owth / fleet renewal remain key priorities – as evidenced by Shell LNG - fueled VLCC project Improved operating profile: benefits of scale with material operational synergies ▪ Transaction expected to generate over $23 million in preliminary annual cost synergies and over $9 million of annual revenue syn ergies ▪ Cost savings and commercial alignment across entirety of fleet ▪ Peer group leader in ESG initiatives and transparency; INSW named #1 tanker owner in Webber Research ESG rankings three years running Value enhancing transaction for both INSW and DSSI shareholders: improved trading liquidity, conservative leverage, highly - experienced management and Board to guide INSW into next decade ▪ Merger approximately doubles INSW net asset value in a cashless, accretive transaction ▪ Growth in equity market capitalization and increased depth in share trading offers potential for valuation re - rating as a sector bellwether ▪ Net leverage of approximately 42% compares favorably to tanker peers and across global shipping; DSSI’s comparable capitaliza tio n preserves pro forma INSW’s financial flexibility in rapidly changing markets ▪ Highly experienced combined leadership and Board of Directors

Strategic Vision for New International Seaways 7 Enhance position as a diversified tanker sector bellwether Enhanced scale of 100 vessel fleet Creates “power alley” footprint in large crude (VLCC, Suezmax ) and LR1/Panamax and MR markets Enhanced share liquidity to aid trading and provide currency for continued growth Maintain and build upon best - in - class safety and ESG track record Integrate and optimize global operating platforms to drive material cost synergies Strong balance sheet preserves financial flexibility Attractive net leverage ratio of approximately 42% remains one of the lowest in the sector Share repurchase authorization stands at $50 million Facilitates selective organic growth that embraces core competencies, renews fleet, and delivers accretive returns to equity (i.e., Shell LNG - fueled VLCC project) Manage incremental liquidity from asset sales, undrawn revolver capacity Maintain annual dividend of $0.24 / share with opportunity to expand Maximize Shareholder Value Merger expands INSW operating footprint and provides substantial upside potential Strong financial profile with significant asset base, supported by overlapping bank group with long - term sector commitment Potential to realize tightening of Price - to - Net Asset Value through enhanced platform and larger market capitalization and attendant trading liquidity Executing on flexible capital allocation

Source: Clarksons . (1) VLCC NB Prices Adjusted includes a $12 million premium to reflect incremental cost of dual fuel vessel. $50 $60 $70 $80 $90 $100 $110 2015 2016 2017 2018 2019 2020 2021 $ millions VLCC NB Prices Adjusted VLCC Resale Prices VLCC 5 Year Old Prices Suezmax Resale Prices Disciplined Capital Allocation – Fleet Renewal 8 International Seaways Invested $600 million at the bottom of the cycle ▪ Two Suezmax newbuilding resales purchased for $58 million each in 2017 ▪ 2010 - built VLCC purchased for $53 million in 2017 ▪ Six VLCCs built 2016 and 2015 purchased for $434 million total in 2018 The nine ships have contributed $111 million in operating income (TCE revenue minus opex ) LTM ended Dec 31, 2020 ▪ Newbuilding order for 3 Dual Fuel VLCCs for a total of $290 million in 2021 Timely Asset Purchases Provide Maximum Return Seaways Raffles Seaways Hatteras Seaways Montauk 6 VLCC purchase 3 Dual Fuel VLCC order (1)

3 rd Largest US Listed Tanker Company by DWT (1)(2) 100% 100% 100% 90% 87% 78% 78% 71% 70% 47% 10% 13% 22% 22% 29% 30% 53% 100% 100% EURN DHT NAT INSW TNK FRO TNP PF INSW NNA DSSI STNG ASC Crude Product Crude vs. Product (by dwt) (1) 18.7 11.9 10.4 9.1 8.7 7.6 7.3 6.0 5.8 4.6 3.9 1.1 9.3 yrs 6.1 yrs 9.7 yrs 5.3 yrs 9.3 yrs 9.6 yrs 12.2 yrs 10.8 yrs 9.2 yrs 10.2 yrs 13.0 yrs 7.7 yrs EURN FRO PF INSW STNG DHT TNP TNK NNA INSW DSSI NAT ASC • Tanker International is largest VLCC pool with 60 vessels under commercial management • Headquartered in London with offices in New York and Singapore • Penfield Marine is a commercial manager operating a Suezmax, Aframax / LR2 and Panamax / LR1 pool • Headquartered in Connecticut with offices in London and Singapore • Concord Maritime operates Dakota Tankers, a pool specializing in Aframax / LR2 trades • Headquartered in Connecticut with an office in London • Panamax International is a commercial management joint - venture between Ultranav , Flopec and International Seaways, specializing in Panamax vessels in South America trade lanes • Based in Miami with an office in Santiago, Chile • CPT Alliance is the commercial manager of Clean Products Tankers and one of the largest clean product pools • Headquartered in Santiago, Chile • Norden operates Norient Product Pool, one of the largest product tanker operators in the world • Headquartered in Denmark with offices in Annapolis and Singapore Combined Platform Metrics – Pro Forma Company Visualized 9 Source: Company filings. Publicly available materials. (1) Represents owned tanker fleets and on a fully delivered basis. (2) Deadweight Weighted Average age excludes vessels under construction. (3) INSW and EURN exclude FSO JV assets. (4) Excludes gas carriers. VLCC 14 0 14 Suezmax 2 13 15 Aframax / LR2 2 1 3 Panamax / LR1 12 0 12 MR 4 50 54 FSO JV 2 0 2 Total Asset Count 36 64 100 Other Assets + + + + + = = = = = Leading Commercial Platforms Provide Global Trading Footprint (4) 2 nd Largest US Listed Tanker Company by Vessel Count (1) (3) Pro Forma + + = = (Mdwt) (3) (3) (3)

$543 $327 $690 $566 $216 $124 $1,232 $340 $893 Debt Cash Net Debt INSW DSSI ($ Millions) Capital Structure as of 12/31/20 (3) Combined Balance Sheet Strength 10 Source: Company filings. (1) $360M facility pro forma for vessel sales completed in 1Q21. (2) Reflects full balance of facility related to a 51% joint venture. (3) Cash for both INSW and DSSI includes restricted cash. All figures for DSSI are pro forma for vessel sales completed in 1Q21. (4) Undrawn revolvers of is the sum of $40 million and $53 million for INSW and DSSI, respectively. Lender Support with Global Reach Debt Summary ($ Millions) Name # Collateral Vessels Balance 12/31/2020 Interest Rate Quarterly Repayment Maturity Date Core Facility 14 $271.6 L + 240bps $9.5 2025 Sinosure Facility 6 246.1 L + 200bps 5.9 2027 - 2028 8.5% Senior Notes 25.0 8.50% 2023 $525M Facility 36 440.0 L + 250bps 18.8 2024 $360M Facility 26 202.2 L + 265bps 12.2 2024 $66M Facility 2 47.4 L + 325bps 1.1 2021 Total $1,232.3 $47.5 Cash & Liquidity as of 12/31/20 (3)(4) $216 $124 $93 $433 INSW DSSI Combined Undrawn Revolvers Total Combined Liquidity ($ Millions) (2) (1)

Selected Financial Data 11 $402 $220 $408 $204 TCE Revenue Adjusted EBITDA INSW DSSI ($ Millions) Source: See Appendix for TCE and Adjusted EBITDA reconciliation. FY 2020

$8.0 $1.8 $5.7 $4.8 $3.0 $23.3 Cash Salaries & Benefits Office & Administrative Expenses External Management Fees Professional Fees & Public Company Costs Non-Cash Compensation Savings Total Cost Synergies Significant Transaction Synergies 12 Source: INSW management estimates. ($ millions) Overview of Potential Cost Synergies (Annually) Clear runway to material cost reductions and revenue synergies from complementary platforms ▪ Significant reduction in overhead through consolidation of headquarters and workforce, elimination of duplicative typical public company costs, and streamlining of ship management arrangements ▪ Expected annual revenue synergies of over $9 million ▪ Expected synergies fully realizable within 2022

Market Update – Oil Supply, Demand and Implications 13 Sources: EIA, IEA, Kpler . ▪ IEA’s March forecast estimates 2021 demand to be up 5.5 mb/d, recovering about 60% of the volume lost in 2020, and increasing to 99.2 mb/d by Q4 2021 ▪ EIA expects a similar 5.4 mb/d increase in demand for 2021 and 3.5 mb/d for 2022 ▪ IEA reported global oil stocks were 62.8 mb below the May 2020 peak, which is needed to set the stage for tanker recovery ▪ OPEC meeting on March 3 did not lead to a lifting of production quotas aside from small amounts for Russia and Kazakhstan ▪ Floating oil storage has decreased to pre - pandemic levels World Weekly Floating Storage (crude/co, by current sea) (Last 18 months) Oil Supply and Demand 0 25,000 50,000 75,000 100,000 125,000 150,000 175,000 200,000 Sep-19 Oct-19 Nov-19 Dec-19 Jan-20 Feb-20 Mar-20 Apr-20 May-20 Jun-20 Jul-20 Aug-20 Aug-20 Sep-20 Oct-20 Nov-20 Dec-20 Jan-21 Feb-21 Mar-21 N. Pacific Malacca Strait Singapore Strait Gulf of Oman Mideast Gulf Caribbean Sea MED Sea N. Atlantic S. Pacific Arabian Sea Other Volume of commodities on tankers that are idled offshore for 10 or more days (end of week stocks) Kilobarrels
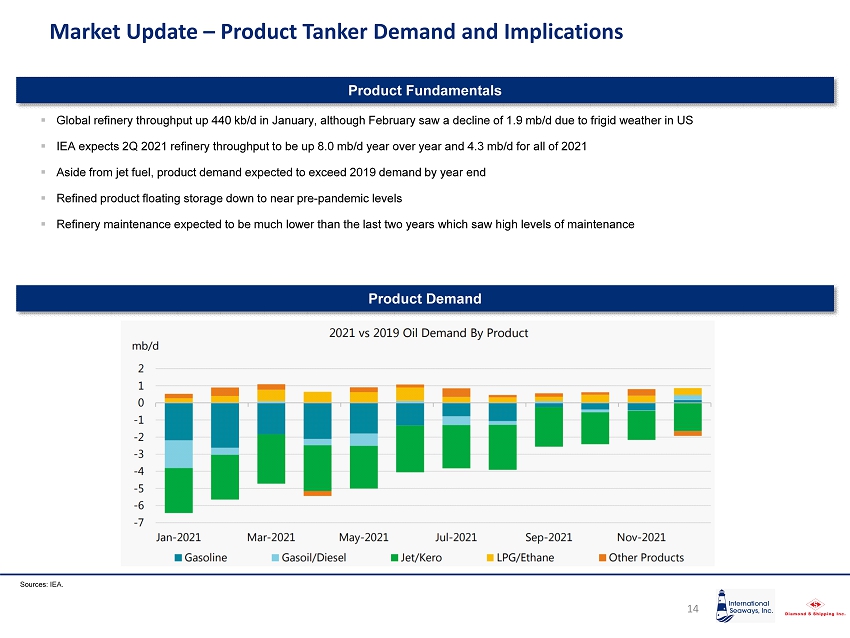
Market Update – Product Tanker Demand and Implications 14 Sources: IEA. ▪ Global refinery throughput up 440 kb/d in January, although February saw a decline of 1.9 mb/d due to frigid weather in US ▪ IEA expects 2Q 2021 refinery throughput to be up 8.0 mb/d year over year and 4.3 mb/d for all of 2021 ▪ Aside from jet fuel, product demand expected to exceed 2019 demand by year end ▪ Refined product floating storage down to near pre - pandemic levels ▪ Refinery maintenance expected to be much lower than the last two years which saw high levels of maintenance Product Demand Product Fundamentals

Market Update – Ship Supply 15 ▪ Orderbook remains at historical lows: − VLCC 8.1% − Suezmax 10.0% − Aframax /LR2 10.2% − Panamax/LR1 1.8% − MR 6.1% ▪ 31 VLCCs ordered in 2019; 41 in 2020; 10 cancelled recently ▪ Ordering tempered by uncertainty surrounding markets, decarbonization, and higher steel and newbuilding prices Recycling Potential ▪ The VLCC fleet is aging – 208 (25%) ships out of a fleet of 836 are 15 years old or older and 64 (8%) are already 20 years old or older. This is equal to the entire VLCC orderbook ▪ A further 13 VLCCs will reach age 20 during the balance of 2021 ▪ At age 15 and every 2.5 years thereafter, significant investment required to continue to trade ▪ As ships reach ballast water treatment deadlines, even greater capital expenditure is required to keep trading ▪ After a record 31 ships recycled in 2018, only four VLCCs were recycled in both of 2019 and 2020. At current spot rates and steel prices, we expect to see recycling increase 8.9 10.6 1.5 19.2 6.7 11.1 9.9 9.3 7.4 2021 2022 2023 20+ 19 18 17 16 15 (Million DWT) Delivery Year Age as of March 2021 Orderbook Update VLCC Orderbook Sources: Clarksons . Recycling Candidates

Closing Remarks Transaction will create one of the largest US publicly - listed tanker platforms with over 100 vessels diversified across segment and size, including “power alleys” in large crude and product segments Larger operating footprint and strategic alignment unlocks substantial cost and commercial synergies fully realizable within 2022 Strong balance sheet preserves financial and strategic flexibility; conservative leverage and supportive lender group with long - term sector commitment Highly - experienced management and Board leadership focused on efficient transaction integration and critical initiatives to drive shareholder value including fleet renewal and ESG 16

Appendix

TCE Reconciliation 18 International Seaways ($000s) FY 2020 Shipping revenues $421,648 Less: Voyage expenses 19,643 Time charter equivalent revenues $402,005 ($000s) FY 2020 Crude Fleet Product Fleet Voyage revenue $235,563 $360,347 Voyage expense (73,337) (115,244) Amortization of TC contracts acquired 2,324 466 Off - hire bunkers in voyage expenses 503 376 Commercial management pool fees - 2,377 Load - to - discharge / Discharge - to - discharge (3,730) (1,359) Revenue from sold vessels - (15) TCE revenue $161,323 $246,948 Diamond S Shipping Source: Company filings and corporate presentations.

Adjusted EBITDA Reconciliation 19 International Seaways ($000s) FY 2020 Net income / (loss) $(5,531) Income tax provision 1 Interest expense 36,712 Depreciation and amortization 74,343 EBITDA $105,525 Third - party debt modification fees 232 Loss on disposal of vessels, net of impairments 100,087 Write - off deferred financing costs 13,073 Loss on extinguishment of debt 1,197 Adjusted EBITDA $220,214 ($000s) FY 2020 Net income / (loss) $26,396 Interest expense, net 34,401 Operating income $60,797 Depreciation and amortization 115,783 Noncontrolling interest (6,508) EBITDA $170,072 Fair value of TC amortization 2,789 Nonrecurring corporate expenses 1,474 Loss on sale of assets 29,551 Adjusted EBITDA $203,886 Source: Company filings and corporate presentations. Diamond S Shipping