Attached files
| file | filename |
|---|---|
| 8-K - 8-K - MARKETWISE, INC. | d141674d8k.htm |

Exhibit 99.1 MANAGEMENT PRESENTATIONExhibit 99.1 MANAGEMENT PRESENTATION

IMPORTANT INFORMATION About this Presentation This investor presentation (this “Presentation”) is for informational purposes only to assist interested parties in making their own evaluation with respect to a proposed business combination (the “Business Combination”) between Ascendant Digital Acquisition Corp. (“ACND”) and Beacon Street Group, LLC (the “Company”). The information contained herein does not purport to be all-inclusive and none of ACND, the Company or their respective affiliates makes any representation or warranty, express or implied, as to the accuracy, completeness or reliability of the information contained in this Presentation. This Presentation does not constitute (i) a solicitation of a proxy, consent or authorization with respect to any securities or in respect of the proposed Business Combination or (ii) an offer to sell, a solicitation of an offer to buy, or a recommendation to purchase any security of ACND, the Company, or any of their respective affiliates. You should not construe the contents of this Presentation as legal, tax, accounting or investment advice or a recommendation. You should consult your own counsel and tax and financial advisors as to legal and related matters concerning the matters described herein, and, by accepting this Presentation, you confirm that you are not relying upon the information contained herein to make any decision. The distribution of this Presentation may also be restricted by law and persons into whose possession this Presentation comes should inform themselves about and observe any such restrictions. The recipient acknowledges that it is (a) aware that the United States securities laws prohibit any person who has material, non-public information concerning a company from purchasing or selling securities of such company or from communicating such information to any other person under circumstances in which it is reasonably foreseeable that such person is likely to purchase or sell such securities, and (b) familiar with the Securities Exchange Act of 1934, as amended, and the rules and regulations promulgated thereunder (collectively, the Exchange Act ), and that the recipient will neither use, nor cause any third party to use, this Presentation or any information contained herein in contravention of the Exchange Act, including, without limitation, Rule 10b-5 thereunder. This Presentation and information contained herein constitutes confidential information and is provided to you on the condition that you agree that you will hold it in strict confidence and not reproduce, disclose, forward or distribute it in whole or in part without the prior written consent of ACND and the Company and is intended for the recipient hereof only. Forward Looking Statements Certain statements in this Presentation may be considered forward-looking statements. Forward-looking statements generally relate to future events or ACND’s or the Company’s future financial or operating performance. For example, statements regarding anticipated growth in the industry in which the Company operates and anticipated growth in demand for the Company’s products, and projections of the Company’s future financial results and other metrics are forward-looking statements. In some cases, you can identify forward-looking statements by terminology such as “may,” “should,” “expect,” “intend,” “will,” “estimate,” “anticipate,” “believe,” “predict,” “potential” or “continue,” or the negatives of these terms or variations of them or similar terminology. Such forward-looking statements are subject to risks, uncertainties, and other factors which could cause actual results to differ materially from those expressed or implied by such forward looking statements. These forward-looking statements are based upon estimates and assumptions that, while considered reasonable by ACND and its management, and the Company and its management, as the case may be, are inherently uncertain. Factors that may cause actual results to differ materially from current expectations include, but are not limited to: the occurrence of any event, change or other circumstances that could give rise to the termination of negotiations and any subsequent definitive agreements with respect to the Business Combination; the outcome of any legal proceedings that may be instituted against ACND, the combined company or others following the announcement of the Business Combination and any definitive agreements with respect thereto; the inability to complete the Business Combination due to the failure to obtain approval of the shareholders of ACND, to obtain financing to complete the Business Combination or to satisfy other conditions to closing; changes to the proposed structure of the Business Combination that may be required or appropriate as a result of applicable laws or regulations or as a condition to obtaining regulatory approval of the Business Combination; the ability to meet stock exchange listing standards following the consummation of the Business Combination; the risk that the Business Combination disrupts current plans and operations of the Company as a result of the announcement and consummation of the Business Combination; the ability to recognize the anticipated benefits of the Business Combination, which may be affected by, among other things, competition, the ability of the combined company to grow and manage growth profitably, maintain relationships with customers and suppliers and retain its management and key employees; costs related to the Business Combination; changes in or compliance with applicable laws or regulations; the possibility that the Company or the combined company may be adversely affected by other economic, business, and/or competitive factors; negative impacts on the Company's reputation; the Company’s estimates of expenses and profitability; the evolution of the markets in which the Company competes; the ability of the Company to implement its strategic initiatives and continue to innovate its existing products; the ability of the Company to defend its intellectual property; the impact of the COVID-19 pandemic on the Company’s business; and other risks and uncertainties set forth in the section entitled “Risk Factors” and “Cautionary Note Regarding Forward-Looking Statements” in ACND’s registration statement on Form S-4 (File No. 333-254720). Nothing in this Presentation should be regarded as a representation by any person that the forward-looking statements set forth herein will be achieved or that any of the contemplated results of such forward-looking statements will be achieved. You should not place undue reliance on forward- looking statements, which speak only as of the date they are made. Neither ACND nor the Company undertakes any duty to update these forward-looking statements. Financial Information; Non-GAAP Financial Measures The financial information and data contained in this Presentation is unaudited and does not conform to Regulation S-X. Such information and data may not be included in, may be adjusted in or may be presented differently in the registration statement to be filed by ACND and the proxy statement/prospectus contained therein. 2IMPORTANT INFORMATION About this Presentation This investor presentation (this “Presentation”) is for informational purposes only to assist interested parties in making their own evaluation with respect to a proposed business combination (the “Business Combination”) between Ascendant Digital Acquisition Corp. (“ACND”) and Beacon Street Group, LLC (the “Company”). The information contained herein does not purport to be all-inclusive and none of ACND, the Company or their respective affiliates makes any representation or warranty, express or implied, as to the accuracy, completeness or reliability of the information contained in this Presentation. This Presentation does not constitute (i) a solicitation of a proxy, consent or authorization with respect to any securities or in respect of the proposed Business Combination or (ii) an offer to sell, a solicitation of an offer to buy, or a recommendation to purchase any security of ACND, the Company, or any of their respective affiliates. You should not construe the contents of this Presentation as legal, tax, accounting or investment advice or a recommendation. You should consult your own counsel and tax and financial advisors as to legal and related matters concerning the matters described herein, and, by accepting this Presentation, you confirm that you are not relying upon the information contained herein to make any decision. The distribution of this Presentation may also be restricted by law and persons into whose possession this Presentation comes should inform themselves about and observe any such restrictions. The recipient acknowledges that it is (a) aware that the United States securities laws prohibit any person who has material, non-public information concerning a company from purchasing or selling securities of such company or from communicating such information to any other person under circumstances in which it is reasonably foreseeable that such person is likely to purchase or sell such securities, and (b) familiar with the Securities Exchange Act of 1934, as amended, and the rules and regulations promulgated thereunder (collectively, the Exchange Act ), and that the recipient will neither use, nor cause any third party to use, this Presentation or any information contained herein in contravention of the Exchange Act, including, without limitation, Rule 10b-5 thereunder. This Presentation and information contained herein constitutes confidential information and is provided to you on the condition that you agree that you will hold it in strict confidence and not reproduce, disclose, forward or distribute it in whole or in part without the prior written consent of ACND and the Company and is intended for the recipient hereof only. Forward Looking Statements Certain statements in this Presentation may be considered forward-looking statements. Forward-looking statements generally relate to future events or ACND’s or the Company’s future financial or operating performance. For example, statements regarding anticipated growth in the industry in which the Company operates and anticipated growth in demand for the Company’s products, and projections of the Company’s future financial results and other metrics are forward-looking statements. In some cases, you can identify forward-looking statements by terminology such as “may,” “should,” “expect,” “intend,” “will,” “estimate,” “anticipate,” “believe,” “predict,” “potential” or “continue,” or the negatives of these terms or variations of them or similar terminology. Such forward-looking statements are subject to risks, uncertainties, and other factors which could cause actual results to differ materially from those expressed or implied by such forward looking statements. These forward-looking statements are based upon estimates and assumptions that, while considered reasonable by ACND and its management, and the Company and its management, as the case may be, are inherently uncertain. Factors that may cause actual results to differ materially from current expectations include, but are not limited to: the occurrence of any event, change or other circumstances that could give rise to the termination of negotiations and any subsequent definitive agreements with respect to the Business Combination; the outcome of any legal proceedings that may be instituted against ACND, the combined company or others following the announcement of the Business Combination and any definitive agreements with respect thereto; the inability to complete the Business Combination due to the failure to obtain approval of the shareholders of ACND, to obtain financing to complete the Business Combination or to satisfy other conditions to closing; changes to the proposed structure of the Business Combination that may be required or appropriate as a result of applicable laws or regulations or as a condition to obtaining regulatory approval of the Business Combination; the ability to meet stock exchange listing standards following the consummation of the Business Combination; the risk that the Business Combination disrupts current plans and operations of the Company as a result of the announcement and consummation of the Business Combination; the ability to recognize the anticipated benefits of the Business Combination, which may be affected by, among other things, competition, the ability of the combined company to grow and manage growth profitably, maintain relationships with customers and suppliers and retain its management and key employees; costs related to the Business Combination; changes in or compliance with applicable laws or regulations; the possibility that the Company or the combined company may be adversely affected by other economic, business, and/or competitive factors; negative impacts on the Company's reputation; the Company’s estimates of expenses and profitability; the evolution of the markets in which the Company competes; the ability of the Company to implement its strategic initiatives and continue to innovate its existing products; the ability of the Company to defend its intellectual property; the impact of the COVID-19 pandemic on the Company’s business; and other risks and uncertainties set forth in the section entitled “Risk Factors” and “Cautionary Note Regarding Forward-Looking Statements” in ACND’s registration statement on Form S-4 (File No. 333-254720). Nothing in this Presentation should be regarded as a representation by any person that the forward-looking statements set forth herein will be achieved or that any of the contemplated results of such forward-looking statements will be achieved. You should not place undue reliance on forward- looking statements, which speak only as of the date they are made. Neither ACND nor the Company undertakes any duty to update these forward-looking statements. Financial Information; Non-GAAP Financial Measures The financial information and data contained in this Presentation is unaudited and does not conform to Regulation S-X. Such information and data may not be included in, may be adjusted in or may be presented differently in the registration statement to be filed by ACND and the proxy statement/prospectus contained therein. 2

IMPORTANT INFORMATION This Presentation also includes certain financial measures not presented in accordance with generally accepted accounting principles (“GAAP”) including, but not limited to, Adjusted CFFO, Adjusted CFFO Conversion, Adjusted Free Cash Flow, and Adjusted Free Cash Flow Margin and certain ratios and other metrics derived therefrom. The Company defines Adjusted CFFO as net cash provided by operating activities plus profits distributions to Class B unitholders included in stock based compensation. The Company defines Adjusted CFFO Conversion as Adjusted CFFO minus capital expenditures divided by Adjusted CFFO. The Company defines Adjusted Free Cash Flow as Adjusted CFFO minus capital expenditures. The Company defines Adjusted Free Cash Flow Margin as Adjusted Free Cash Flow divided by Billings (i.e., amounts invoiced to customers). These financial measures are not measures of financial performance in accordance with GAAP and may exclude items that are significant in understanding and assessing the Company’s financial results. Therefore, these measures should not be considered in isolation or as an alternative to net income, cash flows from operations or other measures of profitability, liquidity or performance under GAAP. You should be aware that the Company’s presentation of these measures may not be comparable to similarly-titled measures used by other companies. The Company believes these non-GAAP measures of financial results provide useful information to management and investors regarding certain financial and business trends relating to the Company’s financial condition and results of operations. The Company believes that the use of these non- GAAP financial measures provides an additional tool for investors to use in evaluating ongoing operating results and trends in and in comparing the Company’s financial measures with other similar companies, many of which present similar non-GAAP financial measures to investors. These non- GAAP financial measures are subject to inherent limitations as they reflect the exercise of judgments by management about which expense and income are excluded or included in determining these non-GAAP financial measures. For a reconciliation of these non-GAAP figures to the nearest measure determined under GAAP, please see the appendix to this Presentation. This Presentation also includes certain projections of non-GAAP financial measures. Due to the high variability and difficulty in making accurate forecasts and projections of some of the information excluded from these projected measures, together with some of the excluded information not being ascertainable or accessible, the Company is unable to quantify certain amounts that would be required to be included in the most directly comparable GAAP financial measures without unreasonable effort. Consequently, no disclosure of estimated comparable GAAP measures is included and no reconciliation of the forward-looking non-GAAP financial measures is included. Use of Projections and Estimates This Presentation contains financial forecasts for the Company with respect to certain financial results for the Company's fiscal years 2021 and 2022. The Company's independent auditors have not audited, reviewed, compiled or performed any procedures with respect to the projections for the purpose of their inclusion in this Presentation, and accordingly, they did not express an opinion or provide any other form of assurance with respect thereto for the purpose of this Presentation. These projections are forward-looking statements and should not be relied upon as being necessarily indicative of future results. The assumptions and estimates underlying the prospective financial information are inherently uncertain and are subject to a wide variety of significant business, economic and competitive risks and uncertainties that could cause actual results to differ materially from those contained in the prospective financial information. Accordingly, there can be no assurance that the prospective results are indicative of the future performance of the Company or that actual results will not differ materially from those presented in the prospective financial information. Inclusion of the prospective financial information in this Presentation should not be regarded as a representation by any person that the results contained in the prospective financial information will be achieved. Industry and Market Data In this Presentation, ACND and the Company rely on and refer to certain information and statistics obtained from third-party sources which they believe to be reliable. Neither ACND nor the Company has independently verified the accuracy or completeness of any such third-party information. Additional Information ACND has filed with the SEC a registration statement on Form S-4 with the SEC, which includes a proxy statement/prospectus, that is both the proxy statement to be distributed to holders of ACND’s ordinary shares in connection with its solicitation of proxies with respect to the proposed Business Combination and other matters as may be described therein, as well as the prospectus relating to the offer and sale of the securities to be issued in the Business Combination. This Presentation does not contain all the information that should be considered concerning the proposed Business Combination and is not intended to form the basis of any investment decision or any other decision in respect of the Business Combination. ACND’s shareholders and other interested persons are advised to read, when available, the preliminary proxy statement/prospectus and the amendments thereto and the definitive proxy statement/prospectus and other documents filed in connection with the proposed Business Combination, as these materials will contain important information about the Company, ACND and the Business Combination. When available, the definitive proxy statement/prospectus and other relevant materials for the proposed Business Combination will be mailed to shareholders of ACND as of a record date to be established for voting on the proposed Business Combination. Shareholders will also be able to obtain copies of the preliminary proxy statement, the definitive proxy statement and other documents filed with the SEC, without charge, once available, at the SEC’s website at www.sec.gov, or by directing a request to: ACND at 667 Madison Avenue, New York, NY 10065 or (212) 209-6126. Participants in the Solicitation ACND and its directors and executive officers may be deemed participants in the solicitation of proxies from ACND’s shareholders with respect to the proposed Business Combination. A list of the names of those directors and executive officers and a description of their interests in ACND is contained in the proxy statement/prospectus contained in ACND’s registration statement on Form S-4, which was filed with the SEC and is available free of charge at the SEC’s web site at www.sec.gov. The Company and its directors and executive officers may also be deemed to be participants in the solicitation of proxies from the shareholders of ACND in connection with the proposed Business Combination. A list of the names of such directors and executive officers and information regarding their interests in the proposed Business Combination is included in the proxy statement/prospectus contained in ACND’s registration statement on Form S-4. 3IMPORTANT INFORMATION This Presentation also includes certain financial measures not presented in accordance with generally accepted accounting principles (“GAAP”) including, but not limited to, Adjusted CFFO, Adjusted CFFO Conversion, Adjusted Free Cash Flow, and Adjusted Free Cash Flow Margin and certain ratios and other metrics derived therefrom. The Company defines Adjusted CFFO as net cash provided by operating activities plus profits distributions to Class B unitholders included in stock based compensation. The Company defines Adjusted CFFO Conversion as Adjusted CFFO minus capital expenditures divided by Adjusted CFFO. The Company defines Adjusted Free Cash Flow as Adjusted CFFO minus capital expenditures. The Company defines Adjusted Free Cash Flow Margin as Adjusted Free Cash Flow divided by Billings (i.e., amounts invoiced to customers). These financial measures are not measures of financial performance in accordance with GAAP and may exclude items that are significant in understanding and assessing the Company’s financial results. Therefore, these measures should not be considered in isolation or as an alternative to net income, cash flows from operations or other measures of profitability, liquidity or performance under GAAP. You should be aware that the Company’s presentation of these measures may not be comparable to similarly-titled measures used by other companies. The Company believes these non-GAAP measures of financial results provide useful information to management and investors regarding certain financial and business trends relating to the Company’s financial condition and results of operations. The Company believes that the use of these non- GAAP financial measures provides an additional tool for investors to use in evaluating ongoing operating results and trends in and in comparing the Company’s financial measures with other similar companies, many of which present similar non-GAAP financial measures to investors. These non- GAAP financial measures are subject to inherent limitations as they reflect the exercise of judgments by management about which expense and income are excluded or included in determining these non-GAAP financial measures. For a reconciliation of these non-GAAP figures to the nearest measure determined under GAAP, please see the appendix to this Presentation. This Presentation also includes certain projections of non-GAAP financial measures. Due to the high variability and difficulty in making accurate forecasts and projections of some of the information excluded from these projected measures, together with some of the excluded information not being ascertainable or accessible, the Company is unable to quantify certain amounts that would be required to be included in the most directly comparable GAAP financial measures without unreasonable effort. Consequently, no disclosure of estimated comparable GAAP measures is included and no reconciliation of the forward-looking non-GAAP financial measures is included. Use of Projections and Estimates This Presentation contains financial forecasts for the Company with respect to certain financial results for the Company's fiscal years 2021 and 2022. The Company's independent auditors have not audited, reviewed, compiled or performed any procedures with respect to the projections for the purpose of their inclusion in this Presentation, and accordingly, they did not express an opinion or provide any other form of assurance with respect thereto for the purpose of this Presentation. These projections are forward-looking statements and should not be relied upon as being necessarily indicative of future results. The assumptions and estimates underlying the prospective financial information are inherently uncertain and are subject to a wide variety of significant business, economic and competitive risks and uncertainties that could cause actual results to differ materially from those contained in the prospective financial information. Accordingly, there can be no assurance that the prospective results are indicative of the future performance of the Company or that actual results will not differ materially from those presented in the prospective financial information. Inclusion of the prospective financial information in this Presentation should not be regarded as a representation by any person that the results contained in the prospective financial information will be achieved. Industry and Market Data In this Presentation, ACND and the Company rely on and refer to certain information and statistics obtained from third-party sources which they believe to be reliable. Neither ACND nor the Company has independently verified the accuracy or completeness of any such third-party information. Additional Information ACND has filed with the SEC a registration statement on Form S-4 with the SEC, which includes a proxy statement/prospectus, that is both the proxy statement to be distributed to holders of ACND’s ordinary shares in connection with its solicitation of proxies with respect to the proposed Business Combination and other matters as may be described therein, as well as the prospectus relating to the offer and sale of the securities to be issued in the Business Combination. This Presentation does not contain all the information that should be considered concerning the proposed Business Combination and is not intended to form the basis of any investment decision or any other decision in respect of the Business Combination. ACND’s shareholders and other interested persons are advised to read, when available, the preliminary proxy statement/prospectus and the amendments thereto and the definitive proxy statement/prospectus and other documents filed in connection with the proposed Business Combination, as these materials will contain important information about the Company, ACND and the Business Combination. When available, the definitive proxy statement/prospectus and other relevant materials for the proposed Business Combination will be mailed to shareholders of ACND as of a record date to be established for voting on the proposed Business Combination. Shareholders will also be able to obtain copies of the preliminary proxy statement, the definitive proxy statement and other documents filed with the SEC, without charge, once available, at the SEC’s website at www.sec.gov, or by directing a request to: ACND at 667 Madison Avenue, New York, NY 10065 or (212) 209-6126. Participants in the Solicitation ACND and its directors and executive officers may be deemed participants in the solicitation of proxies from ACND’s shareholders with respect to the proposed Business Combination. A list of the names of those directors and executive officers and a description of their interests in ACND is contained in the proxy statement/prospectus contained in ACND’s registration statement on Form S-4, which was filed with the SEC and is available free of charge at the SEC’s web site at www.sec.gov. The Company and its directors and executive officers may also be deemed to be participants in the solicitation of proxies from the shareholders of ACND in connection with the proposed Business Combination. A list of the names of such directors and executive officers and information regarding their interests in the proposed Business Combination is included in the proxy statement/prospectus contained in ACND’s registration statement on Form S-4. 3

ASCENDANT WAS LOOKING FOR A GREAT ACQUISITION, IN THE ATTENTION ECONOMY Significant and growing “attention $191B TAM with significant tailwinds, ripe for disruption 1 ✓ economy” TAM Market leading tech platform with scalable, high-value Scalable, digitally delivered IP 2✓ content, data & analytics 10M+ self-directed investors, growing 78% from 2018 to Large, thriving community 3✓ 2020 12 primary customer facing brands offering 160+ Diversified product suite 4✓ products 1 “Adjusted Rule of 50” financial profile - Scale + Growth Best in class financial profile 5✓ 2 + Recurring + Adjusted FCF Experienced leadership team Deep, long-tenured & proven team 6✓ Multiple organic & inorganic avenues to potentially Sustained growth outlook 7 ✓ drive sustained profitable growth at scale 1. Adjusted Rule of 50 equals annual GAAP Revenue Growth Rate plus Adjusted FCF Margin. Adjusted FCF Margin = Adjusted FCF / Billings 4 2. Adjusted FCF is calculated as Adjusted CFFO (Cash Flow From Operations) - Capital Expenditures. Adjusted CFFO is calculated as net cash provided by operating activities plus profits distributions to Class B unitholders included in stock based compensation expenseASCENDANT WAS LOOKING FOR A GREAT ACQUISITION, IN THE ATTENTION ECONOMY Significant and growing “attention $191B TAM with significant tailwinds, ripe for disruption 1 ✓ economy” TAM Market leading tech platform with scalable, high-value Scalable, digitally delivered IP 2✓ content, data & analytics 10M+ self-directed investors, growing 78% from 2018 to Large, thriving community 3✓ 2020 12 primary customer facing brands offering 160+ Diversified product suite 4✓ products 1 “Adjusted Rule of 50” financial profile - Scale + Growth Best in class financial profile 5✓ 2 + Recurring + Adjusted FCF Experienced leadership team Deep, long-tenured & proven team 6✓ Multiple organic & inorganic avenues to potentially Sustained growth outlook 7 ✓ drive sustained profitable growth at scale 1. Adjusted Rule of 50 equals annual GAAP Revenue Growth Rate plus Adjusted FCF Margin. Adjusted FCF Margin = Adjusted FCF / Billings 4 2. Adjusted FCF is calculated as Adjusted CFFO (Cash Flow From Operations) - Capital Expenditures. Adjusted CFFO is calculated as net cash provided by operating activities plus profits distributions to Class B unitholders included in stock based compensation expense


Founded with a mission to level the playing field for self-directed investors Today we are a Leading Subscription Services Platform serving millions of self-directed investors A diverse portfolio of operating brands serving as a trusted source for financial research, education and actionable ideas 6Founded with a mission to level the playing field for self-directed investors Today we are a Leading Subscription Services Platform serving millions of self-directed investors A diverse portfolio of operating brands serving as a trusted source for financial research, education and actionable ideas 6

BEACON STREET GROUP AT A GLANCE A market leader in delivering high-value and actionable 10M+ 850K+ $759 financial research, easy-to- Digital Paid Digital Industry Leading 2 Platform Subscribers at 2020 ARPU use technology, as well as 1 Members at 12/31/20 financial education and a 12/31/20 social connection with world- class experts to help self- directed investors meet their $549M 24% 99.8% 3 financial goals 2020 Billings 2020 Adjusted 2020 Adjusted 5 Free Cash Flow CFFO Conversion +77% 4 Margin YoY Growth 1.Includes free and paid subscribers 2.Based on trailing four quarter net billings / average number of trailing four quarter paid subscribers 3.Billings represents amounts invoiced to customers 4.Adjusted FCF Margin = Adjusted FCF / Billings. Adjusted FCF is calculated as Adjusted CFFO - Capital Expenditures. Adjusted CFFO is calculated as net cash provided by operating activities plus profits distributions to Class B unitholders included in stock based compensation expense 7 5.Adjusted CFFO Conversion = (Adjusted CFFO - Capital Expenditures) / Adjusted CFFOBEACON STREET GROUP AT A GLANCE A market leader in delivering high-value and actionable 10M+ 850K+ $759 financial research, easy-to- Digital Paid Digital Industry Leading 2 Platform Subscribers at 2020 ARPU use technology, as well as 1 Members at 12/31/20 financial education and a 12/31/20 social connection with world- class experts to help self- directed investors meet their $549M 24% 99.8% 3 financial goals 2020 Billings 2020 Adjusted 2020 Adjusted 5 Free Cash Flow CFFO Conversion +77% 4 Margin YoY Growth 1.Includes free and paid subscribers 2.Based on trailing four quarter net billings / average number of trailing four quarter paid subscribers 3.Billings represents amounts invoiced to customers 4.Adjusted FCF Margin = Adjusted FCF / Billings. Adjusted FCF is calculated as Adjusted CFFO - Capital Expenditures. Adjusted CFFO is calculated as net cash provided by operating activities plus profits distributions to Class B unitholders included in stock based compensation expense 7 5.Adjusted CFFO Conversion = (Adjusted CFFO - Capital Expenditures) / Adjusted CFFO


KEY DRIVERS OF OUR SUCCESS POWERFUL CONTENT CUSTOMER FOCUS SCALABLE MODEL DATA / TECHNOLOGY PLATFORM • Compelling content fosters • Customer centricity through • Industry-leading ROI on new • Real-time campaign relationships between readers every stage of a subscriber’s customer acquisition feedback, AI and rapid and editors, creates customer journey scalability • Upsell to higher ARPU loyalty and brand goodwill • Emphasis on developing products with almost all of • Machine learning and • Insightful and engaging long-term relationship with the upsell revenues falling to advanced analytics drive content drives conversion the subscriber the bottom line increased upsell yield users from free to paid • Consistent 90%+ revenue subscribers retention • Focus on proven formula to launch & scale new products in a low-risk capital way 9KEY DRIVERS OF OUR SUCCESS POWERFUL CONTENT CUSTOMER FOCUS SCALABLE MODEL DATA / TECHNOLOGY PLATFORM • Compelling content fosters • Customer centricity through • Industry-leading ROI on new • Real-time campaign relationships between readers every stage of a subscriber’s customer acquisition feedback, AI and rapid and editors, creates customer journey scalability • Upsell to higher ARPU loyalty and brand goodwill • Emphasis on developing products with almost all of • Machine learning and • Insightful and engaging long-term relationship with the upsell revenues falling to advanced analytics drive content drives conversion the subscriber the bottom line increased upsell yield users from free to paid • Consistent 90%+ revenue subscribers retention • Focus on proven formula to launch & scale new products in a low-risk capital way 9
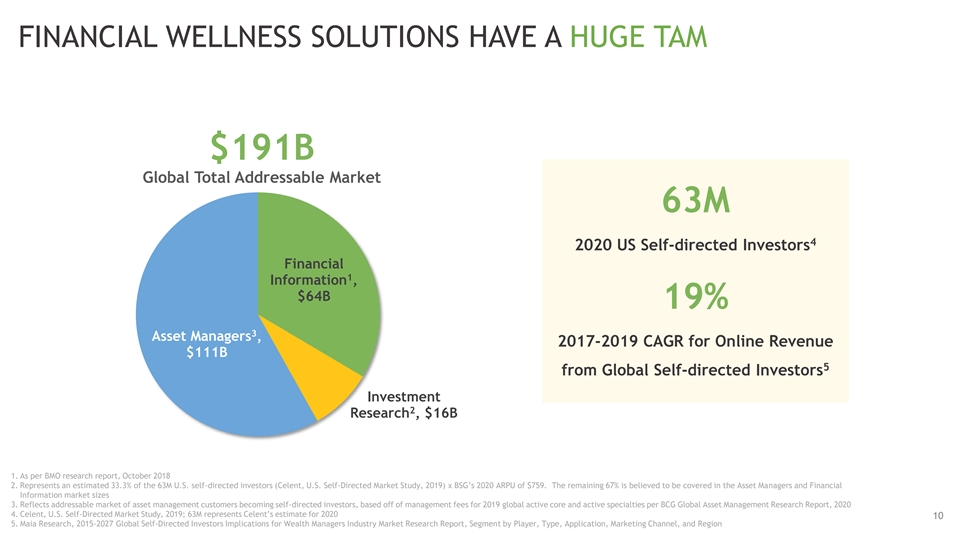
FINANCIAL WELLNESS SOLUTIONS HAVE A HUGE TAM $191B Global Total Addressable Market 63M 4 2020 US Self-directed Investors Financial 1 Information , $64B 19% 3 Asset Managers , 2017-2019 CAGR for Online Revenue $111B 5 from Global Self-directed Investors Investment 2 Research , $16B 1. As per BMO research report, October 2018 2. Represents an estimated 33.3% of the 63M U.S. self-directed investors (Celent, U.S. Self-Directed Market Study, 2019) x BSG’s 2020 ARPU of $759. The remaining 67% is believed to be covered in the Asset Managers and Financial Information market sizes 3. Reflects addressable market of asset management customers becoming self-directed investors, based off of management fees for 2019 global active core and active specialties per BCG Global Asset Management Research Report, 2020 4. Celent, U.S. Self-Directed Market Study, 2019; 63M represents Celent’s estimate for 2020 10 5. Maia Research, 2015-2027 Global Self-Directed Investors Implications for Wealth Managers Industry Market Research Report, Segment by Player, Type, Application, Marketing Channel, and RegionFINANCIAL WELLNESS SOLUTIONS HAVE A HUGE TAM $191B Global Total Addressable Market 63M 4 2020 US Self-directed Investors Financial 1 Information , $64B 19% 3 Asset Managers , 2017-2019 CAGR for Online Revenue $111B 5 from Global Self-directed Investors Investment 2 Research , $16B 1. As per BMO research report, October 2018 2. Represents an estimated 33.3% of the 63M U.S. self-directed investors (Celent, U.S. Self-Directed Market Study, 2019) x BSG’s 2020 ARPU of $759. The remaining 67% is believed to be covered in the Asset Managers and Financial Information market sizes 3. Reflects addressable market of asset management customers becoming self-directed investors, based off of management fees for 2019 global active core and active specialties per BCG Global Asset Management Research Report, 2020 4. Celent, U.S. Self-Directed Market Study, 2019; 63M represents Celent’s estimate for 2020 10 5. Maia Research, 2015-2027 Global Self-Directed Investors Implications for Wealth Managers Industry Market Research Report, Segment by Player, Type, Application, Marketing Channel, and Region

PERSONAL INVESTING IS CHANGING IN …the markets are no longer FAVOR OF BSG reserved for institutional investors or HNWI. The goal of AGING POPULATION GROWING THE PIE 1 • 17% of U.S. population is 65+• 72% of millennials identify as self- democratizing the financial 3 directed investors (~$22T of • 10,000 Americans retiring every 3 net worth) markets is becoming a reality“ day, creating consistent demand 2 velocity• Rise of self-directed ‘Robinhood’ investors provides huge future upside VOLUME OF ACTIVITY COMPLEXITY • Retail investors now represent • Increasing number and complexity ~20% of trading on any given of investment instruments (e.g., 4 day, up from ~10% in 2010 ETFs, options, crypto, et al) EDUCATION PERFORMANCE • Increased emphasis on financial • Individual investors have a 3- literacy - knowledge & skill to year return performance lag 5 effectively manage wealth versus the S&P 500 1. Statista 2. Deutsche Bank 3. Deloitte study 11 4. Wall Street research 5. realinvestmentadvice.comPERSONAL INVESTING IS CHANGING IN …the markets are no longer FAVOR OF BSG reserved for institutional investors or HNWI. The goal of AGING POPULATION GROWING THE PIE 1 • 17% of U.S. population is 65+• 72% of millennials identify as self- democratizing the financial 3 directed investors (~$22T of • 10,000 Americans retiring every 3 net worth) markets is becoming a reality“ day, creating consistent demand 2 velocity• Rise of self-directed ‘Robinhood’ investors provides huge future upside VOLUME OF ACTIVITY COMPLEXITY • Retail investors now represent • Increasing number and complexity ~20% of trading on any given of investment instruments (e.g., 4 day, up from ~10% in 2010 ETFs, options, crypto, et al) EDUCATION PERFORMANCE • Increased emphasis on financial • Individual investors have a 3- literacy - knowledge & skill to year return performance lag 5 effectively manage wealth versus the S&P 500 1. Statista 2. Deutsche Bank 3. Deloitte study 11 4. Wall Street research 5. realinvestmentadvice.com

PREMIUM SUBSCRIPTION CONTENT, SOFTWARE AND TOOLS ACTIONABLE IDEAS SOFTWARE & TOOLS Forever Portfolio Buy These 20 Stocks Today and Hold Them Forever! 12PREMIUM SUBSCRIPTION CONTENT, SOFTWARE AND TOOLS ACTIONABLE IDEAS SOFTWARE & TOOLS Forever Portfolio Buy These 20 Stocks Today and Hold Them Forever! 12

BUILDING RELATIONSHIPS AND HELPING SUBSCRIBERS “…you folks have become my “You guys talk about ‘life changing teachers and a true resource… results’… I am actually taking pride educating me on how to invest for in managing our investments. That the long term. WHAT A GIFT!” is a big life change. ” - Nick F. - Joe D. “You have each been instrumental in “…your recommendations had a helping me build wealth… analyses profound impact on my family and are consistently meticulous, I am very much appreciative.” concise and on-point.” – Kyle B. - David K. “Empire Financial research articles have taught me a lot and I truly “…despite the world imploding, believe that small investors like [you] helped me keep a level head me have no place in the market in the early days of the pandemic.” without your financial research - Nick C. and investment ideas.” - Sandeep L. 13BUILDING RELATIONSHIPS AND HELPING SUBSCRIBERS “…you folks have become my “You guys talk about ‘life changing teachers and a true resource… results’… I am actually taking pride educating me on how to invest for in managing our investments. That the long term. WHAT A GIFT!” is a big life change. ” - Nick F. - Joe D. “You have each been instrumental in “…your recommendations had a helping me build wealth… analyses profound impact on my family and are consistently meticulous, I am very much appreciative.” concise and on-point.” – Kyle B. - David K. “Empire Financial research articles have taught me a lot and I truly “…despite the world imploding, believe that small investors like [you] helped me keep a level head me have no place in the market in the early days of the pandemic.” without your financial research - Nick C. and investment ideas.” - Sandeep L. 13

PROVEN, AGILE PLATFORM FOR 160+ LAUNCHING NEW PRODUCTS QUICKLY 130+ WITH LOW RISK 90+ Detect new demand and investment DETECT trends in the financial marketplace through observation, research and analysis <50 Identify a financial expert that has a ANALYZE personal passion for a specific area of growing customer interest and can provide unique insights 2017 2018 2019 2020 PRODUCTS OFFERED Launch new products within weeks. LAUNCH Target offers based on customer behavior and use AI to track and 110+ New Products in 3 Years improve results Grow content team in product area SCALE and cross-sell and upsell to build Helped drive >$300M of Billings customer lifetime relationship 14PROVEN, AGILE PLATFORM FOR 160+ LAUNCHING NEW PRODUCTS QUICKLY 130+ WITH LOW RISK 90+ Detect new demand and investment DETECT trends in the financial marketplace through observation, research and analysis <50 Identify a financial expert that has a ANALYZE personal passion for a specific area of growing customer interest and can provide unique insights 2017 2018 2019 2020 PRODUCTS OFFERED Launch new products within weeks. LAUNCH Target offers based on customer behavior and use AI to track and 110+ New Products in 3 Years improve results Grow content team in product area SCALE and cross-sell and upsell to build Helped drive >$300M of Billings customer lifetime relationship 14

DIVERSE RESEARCH PORTFOLIO ACROSS DIFFERENT ASSET CLASSES DIVERSE RESEARCH PRODUCTS # OF CUMULATIVE SELECTED 1 1 (% OF BILLINGS - 2018-2020) SUBSCRIBERS LIFETIME SPEND EXAMPLES • Newswire Other 5% Free • Investor Hour Commodities 3% 9.5M General market commentary, current • The Weekly Pulse Bundle 19% events - Insightful and educational Value 5% • The Daily Cut Software 6% • Fry’s Investment Paid Report - $249 2 Mega Cap equities and basic 544K <$600 • Empire Stock investment strategies Investor - $199 Income 10% Growth 17% High Value • Empire Elite Growth More advanced investing - $5,000 2 215K $600-$5,000 strategies - Value Investing, • Palm Beach Microcaps, Real Estate, Options, Ventures - $3,000 Trading, Cryptocurrencies Cryptocurrency 11% • Alliance - $31,000 + Small Cap 13% $499 annually Ultra High Value 2 • Total Portfolio - 98K >$5,000 Product bundles Trading 11% $15,000 + $499 annually 1.As of December 31, 2020 2.Number of subscribers indicated correspond with the cumulative lifetime spend to the right (e.g., 544K of the 856K+ total paid subscribers have less than $600 of cumulative lifetime spend) 15DIVERSE RESEARCH PORTFOLIO ACROSS DIFFERENT ASSET CLASSES DIVERSE RESEARCH PRODUCTS # OF CUMULATIVE SELECTED 1 1 (% OF BILLINGS - 2018-2020) SUBSCRIBERS LIFETIME SPEND EXAMPLES • Newswire Other 5% Free • Investor Hour Commodities 3% 9.5M General market commentary, current • The Weekly Pulse Bundle 19% events - Insightful and educational Value 5% • The Daily Cut Software 6% • Fry’s Investment Paid Report - $249 2 Mega Cap equities and basic 544K <$600 • Empire Stock investment strategies Investor - $199 Income 10% Growth 17% High Value • Empire Elite Growth More advanced investing - $5,000 2 215K $600-$5,000 strategies - Value Investing, • Palm Beach Microcaps, Real Estate, Options, Ventures - $3,000 Trading, Cryptocurrencies Cryptocurrency 11% • Alliance - $31,000 + Small Cap 13% $499 annually Ultra High Value 2 • Total Portfolio - 98K >$5,000 Product bundles Trading 11% $15,000 + $499 annually 1.As of December 31, 2020 2.Number of subscribers indicated correspond with the cumulative lifetime spend to the right (e.g., 544K of the 856K+ total paid subscribers have less than $600 of cumulative lifetime spend) 15

BEST-IN-CLASS BUSINESS MODEL TAILORED FOR HIGH VALUE SUBSCRIBERS CUMULATIVE FREE-TO-PAID CUMULATIVE HIGH-VALUE CUMULATIVE ULTRA CONVERSION RATE CONVERSION RATE CONVERSION RATE 2 3 4 6% 37% 31% TOTAL HIGH VALUE TOTAL ULTRA HIGH FREE TOTAL PAID SUBSCRIBERS VALUE SUBSCRIBERS SUBSCRIBERS SUBSCRIBERS (Total spend >$600) (Total spend >$5,000) 1 1 1 1 ~9.5M+ 856K+ 313K+ 98K+ 1.Subscriber figures shown as of December 31, 2020 2.Represents cumulative free-to-paid conversion rate for the period January 1, 2018 to December 31, 2020. Calculated as (number of free subscribers who purchased a subscription during the period) / (average number of free subscribers during the period) 3.Represents cumulative high-value conversion rate as of December 31, 2020. Calculated as (number of paid subscribers who have purchased >$600 in aggregate over their lifetime as of December 31, 2020)/(number of paid subscribers as of December 31, 2020) 16 4.Represents cumulative ultra-value conversion rate as of December 31, 2020. Calculated as (number of paid subscribers who have purchased >$5,000 in aggregate over their lifetime as of December 31, 2020)/(number of high value subscribers as of December31, 2020)BEST-IN-CLASS BUSINESS MODEL TAILORED FOR HIGH VALUE SUBSCRIBERS CUMULATIVE FREE-TO-PAID CUMULATIVE HIGH-VALUE CUMULATIVE ULTRA CONVERSION RATE CONVERSION RATE CONVERSION RATE 2 3 4 6% 37% 31% TOTAL HIGH VALUE TOTAL ULTRA HIGH FREE TOTAL PAID SUBSCRIBERS VALUE SUBSCRIBERS SUBSCRIBERS SUBSCRIBERS (Total spend >$600) (Total spend >$5,000) 1 1 1 1 ~9.5M+ 856K+ 313K+ 98K+ 1.Subscriber figures shown as of December 31, 2020 2.Represents cumulative free-to-paid conversion rate for the period January 1, 2018 to December 31, 2020. Calculated as (number of free subscribers who purchased a subscription during the period) / (average number of free subscribers during the period) 3.Represents cumulative high-value conversion rate as of December 31, 2020. Calculated as (number of paid subscribers who have purchased >$600 in aggregate over their lifetime as of December 31, 2020)/(number of paid subscribers as of December 31, 2020) 16 4.Represents cumulative ultra-value conversion rate as of December 31, 2020. Calculated as (number of paid subscribers who have purchased >$5,000 in aggregate over their lifetime as of December 31, 2020)/(number of high value subscribers as of December31, 2020)

FINANCIAL HIGHLIGHTS $549M 77% $759 >5x 1 2 2020 Billings 2020 Billings 2020 ARPU LTV/CAC Ratio growth INDUSTRY-LEADING UNIT TRACK RECORD OF SCALE ECONOMICS GROWTH 97% 24% 99.8% 2018-2020 2020 Adjusted Free 2020 Adjusted CFFO 3 4 Cash Flow Margin Conversion Subscription Billings PREMIER CASH FLOW RECURRING REVENUE BASE STRONG MARGIN PROFILE CONVERSION 1.Based on trailing four quarter net billings / average number of trailing four quarter paid subscribers 2.Based on average lifetime customer contribution margin divided by customer acquisition costs. Customer acquisition costs include direct marketing spend, external revenue share expense, retention and renewal expenses, copywriting and marketing salaries, tele-sales salaries and commissions and customer service commissions 3.Adjusted FCF Margin = Adjusted FCF / Billings. Adjusted FCF is calculated as Adjusted CFFO - Capital Expenditures. Adjusted CFFO is calculated as net cash provided by operating activities plus profits distributions to Class B unitholders included in stock based compensation expense 17 4.Adjusted CFFO Conversion = (Adjusted CFFO - Capital Expenditures) / Adjusted CFFOFINANCIAL HIGHLIGHTS $549M 77% $759 >5x 1 2 2020 Billings 2020 Billings 2020 ARPU LTV/CAC Ratio growth INDUSTRY-LEADING UNIT TRACK RECORD OF SCALE ECONOMICS GROWTH 97% 24% 99.8% 2018-2020 2020 Adjusted Free 2020 Adjusted CFFO 3 4 Cash Flow Margin Conversion Subscription Billings PREMIER CASH FLOW RECURRING REVENUE BASE STRONG MARGIN PROFILE CONVERSION 1.Based on trailing four quarter net billings / average number of trailing four quarter paid subscribers 2.Based on average lifetime customer contribution margin divided by customer acquisition costs. Customer acquisition costs include direct marketing spend, external revenue share expense, retention and renewal expenses, copywriting and marketing salaries, tele-sales salaries and commissions and customer service commissions 3.Adjusted FCF Margin = Adjusted FCF / Billings. Adjusted FCF is calculated as Adjusted CFFO - Capital Expenditures. Adjusted CFFO is calculated as net cash provided by operating activities plus profits distributions to Class B unitholders included in stock based compensation expense 17 4.Adjusted CFFO Conversion = (Adjusted CFFO - Capital Expenditures) / Adjusted CFFO
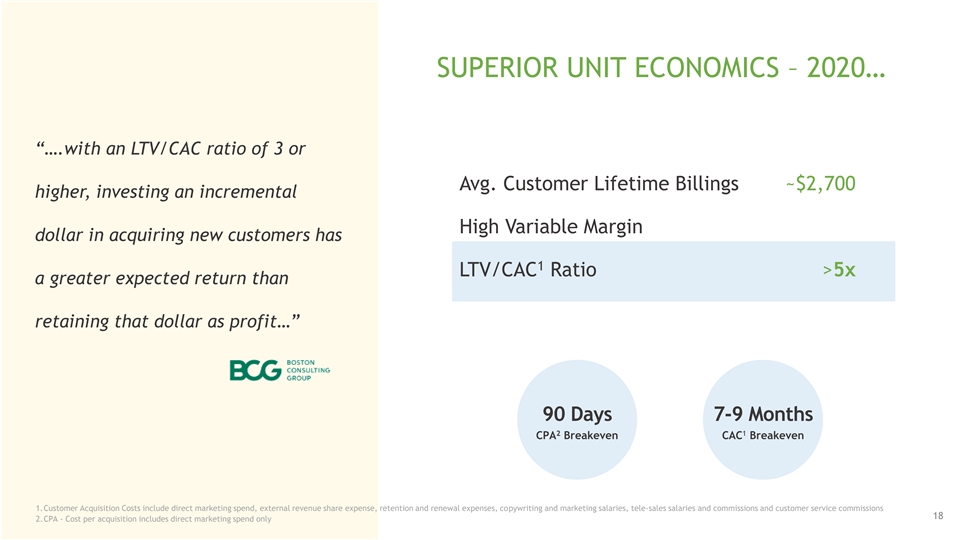
SUPERIOR UNIT ECONOMICS – 2020… “….with an LTV/CAC ratio of 3 or Avg. Customer Lifetime Billings ~$2,700 higher, investing an incremental High Variable Margin dollar in acquiring new customers has 1 LTV/CAC Ratio >5x a greater expected return than retaining that dollar as profit…” 90 Days 7-9 Months 2 1 CPA Breakeven CAC Breakeven 1.Customer Acquisition Costs include direct marketing spend, external revenue share expense, retention and renewal expenses, copywriting and marketing salaries, tele-sales salaries and commissions and customer service commissions 18 2.CPA - Cost per acquisition includes direct marketing spend onlySUPERIOR UNIT ECONOMICS – 2020… “….with an LTV/CAC ratio of 3 or Avg. Customer Lifetime Billings ~$2,700 higher, investing an incremental High Variable Margin dollar in acquiring new customers has 1 LTV/CAC Ratio >5x a greater expected return than retaining that dollar as profit…” 90 Days 7-9 Months 2 1 CPA Breakeven CAC Breakeven 1.Customer Acquisition Costs include direct marketing spend, external revenue share expense, retention and renewal expenses, copywriting and marketing salaries, tele-sales salaries and commissions and customer service commissions 18 2.CPA - Cost per acquisition includes direct marketing spend only

… WITH SUBSCRIBERS SPENDING MORE INITIALLY AND INCREASING THAT SPEND OVER TIME 2020 Cohort 2019 Cohort 2018 Cohort 2017 Cohort 2016 Cohort 2015 Cohort Year 1 Year 2 Year 3 Year 4 Year 5 CUMULATIVE SPEND BY COHORT OVER TIME 19… WITH SUBSCRIBERS SPENDING MORE INITIALLY AND INCREASING THAT SPEND OVER TIME 2020 Cohort 2019 Cohort 2018 Cohort 2017 Cohort 2016 Cohort 2015 Cohort Year 1 Year 2 Year 3 Year 4 Year 5 CUMULATIVE SPEND BY COHORT OVER TIME 19

VISION & GROWTH STRATEGY 20VISION & GROWTH STRATEGY 20

STRATEGIC INITIATIVES ARE DRIVING AND ACCELERATING GROWTH KEY INITIATIVES (PAST 3 YEARS) 225 11,000,000 10.4 • Strategic acquisitions (6 operating subsidiaries) 8.9 9,000,000 • Broadened product offerings, including adding 27+ 175 7.5 editors & 110+ publications and built or acquired $158 software and tools to complement premium content 7,000,000 6.5 $150 125 5.6 5.1 $123 $117 • Upgraded corporate infrastructure with deployment 5,000,000 4.3 3.8 of new systems & applications, including analytics $96 $91 75 and machine learning $71 3,000,000 $52 25 • Improvement in marketing efficiency & customer 1,000,000 satisfaction / retention Q1 '19 Q2 '19 Q3 '19 Q4 '19 Q1 '20 Q2 '20 Q3 '20 Q4 '20 (25) (1,000,000) • Recruited and trained additional talent across 1 2 Billings ($M) Total Subscriber Relationships (M) organization 1.Billings represents amounts invoiced to customers 2.Includes both free and paid subscribers 21STRATEGIC INITIATIVES ARE DRIVING AND ACCELERATING GROWTH KEY INITIATIVES (PAST 3 YEARS) 225 11,000,000 10.4 • Strategic acquisitions (6 operating subsidiaries) 8.9 9,000,000 • Broadened product offerings, including adding 27+ 175 7.5 editors & 110+ publications and built or acquired $158 software and tools to complement premium content 7,000,000 6.5 $150 125 5.6 5.1 $123 $117 • Upgraded corporate infrastructure with deployment 5,000,000 4.3 3.8 of new systems & applications, including analytics $96 $91 75 and machine learning $71 3,000,000 $52 25 • Improvement in marketing efficiency & customer 1,000,000 satisfaction / retention Q1 '19 Q2 '19 Q3 '19 Q4 '19 Q1 '20 Q2 '20 Q3 '20 Q4 '20 (25) (1,000,000) • Recruited and trained additional talent across 1 2 Billings ($M) Total Subscriber Relationships (M) organization 1.Billings represents amounts invoiced to customers 2.Includes both free and paid subscribers 21
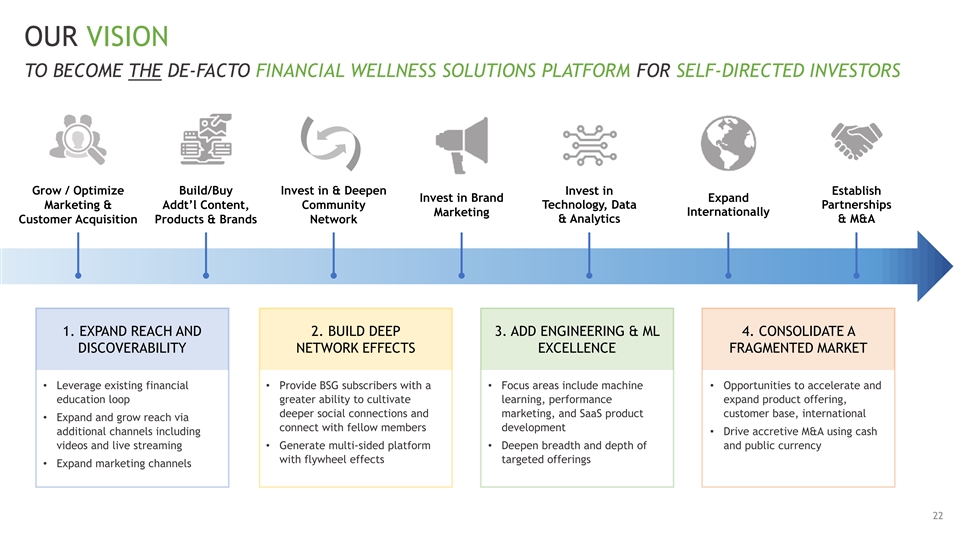
OUR VISION TO BECOME THE DE-FACTO FINANCIAL WELLNESS SOLUTIONS PLATFORM FOR SELF-DIRECTED INVESTORS Grow / Optimize Build/Buy Invest in & Deepen Invest in Establish Invest in Brand Expand Marketing & Addt’l Content, Community Technology, Data Partnerships Marketing Internationally Customer Acquisition Products & Brands Network & Analytics & M&A 1. EXPAND REACH AND 2. BUILD DEEP 3. ADD ENGINEERING & ML 4. CONSOLIDATE A DISCOVERABILITY NETWORK EFFECTS EXCELLENCE FRAGMENTED MARKET • Leverage existing financial • Provide BSG subscribers with a • Focus areas include machine • Opportunities to accelerate and education loop greater ability to cultivate learning, performance expand product offering, deeper social connections and marketing, and SaaS product customer base, international • Expand and grow reach via connect with fellow members development additional channels including • Drive accretive M&A using cash videos and live streaming• Generate multi-sided platform • Deepen breadth and depth of and public currency with flywheel effects targeted offerings • Expand marketing channels 22OUR VISION TO BECOME THE DE-FACTO FINANCIAL WELLNESS SOLUTIONS PLATFORM FOR SELF-DIRECTED INVESTORS Grow / Optimize Build/Buy Invest in & Deepen Invest in Establish Invest in Brand Expand Marketing & Addt’l Content, Community Technology, Data Partnerships Marketing Internationally Customer Acquisition Products & Brands Network & Analytics & M&A 1. EXPAND REACH AND 2. BUILD DEEP 3. ADD ENGINEERING & ML 4. CONSOLIDATE A DISCOVERABILITY NETWORK EFFECTS EXCELLENCE FRAGMENTED MARKET • Leverage existing financial • Provide BSG subscribers with a • Focus areas include machine • Opportunities to accelerate and education loop greater ability to cultivate learning, performance expand product offering, deeper social connections and marketing, and SaaS product customer base, international • Expand and grow reach via connect with fellow members development additional channels including • Drive accretive M&A using cash videos and live streaming• Generate multi-sided platform • Deepen breadth and depth of and public currency with flywheel effects targeted offerings • Expand marketing channels 22

… WITH A TRACK RECORD OF EFFICIENT AND HIGHLY ACCRETIVE CAPITAL ALLOCATION ORIGINAL SALES 2020 SALES YEAR FOCUS AREA BUILD OR BUY ($ MILLIONS) ($ MILLIONS) Transaction 1 2010 Macro Build -- $120 Transaction 2 2013 Risk Allocation Buy $1 $30 Transaction 3 2014 Macro Buy $5 $110 Transaction 4 2015 Commodities Buy $12 $25 Transaction 5 2016 Trading Build -- $30 Transaction 6 2017 Growth Buy $28 $67 Transaction 7 2019 Growth / SPACs Build -- $32 Transaction 8 2019 Software Build -- $7 1 Transaction 9 2021 Software Buy $3 Future Total $49 $421 % of Total 2020 Net Sales 77% 23 1. Acquisition completed on January 21, 2021; Original Sales represents revenue in 2020; 2020 Sales left blank since acquisition was completed after 2020… WITH A TRACK RECORD OF EFFICIENT AND HIGHLY ACCRETIVE CAPITAL ALLOCATION ORIGINAL SALES 2020 SALES YEAR FOCUS AREA BUILD OR BUY ($ MILLIONS) ($ MILLIONS) Transaction 1 2010 Macro Build -- $120 Transaction 2 2013 Risk Allocation Buy $1 $30 Transaction 3 2014 Macro Buy $5 $110 Transaction 4 2015 Commodities Buy $12 $25 Transaction 5 2016 Trading Build -- $30 Transaction 6 2017 Growth Buy $28 $67 Transaction 7 2019 Growth / SPACs Build -- $32 Transaction 8 2019 Software Build -- $7 1 Transaction 9 2021 Software Buy $3 Future Total $49 $421 % of Total 2020 Net Sales 77% 23 1. Acquisition completed on January 21, 2021; Original Sales represents revenue in 2020; 2020 Sales left blank since acquisition was completed after 2020

FORECASTED KEY PERFORMANCE INDICATORS ARPU decline due to 1 PAID SUBSCRIBERS (IN THOUSANDS) ARPU significant subscriber growth; future As of Feb. 28, 2021 1,310 monetization will $792 drive accretion 978k, 78% YoY Growth $759 1,084 New Estimate $717 Prior Estimate Historical 857 $599 553 526 $478 2018 2019 2020 2021P 2022P 2018 2019 2020 2021P 2022P 1.Based on trailing four quarter net billings /average number of trailing four quarter paid subscribers 24 24FORECASTED KEY PERFORMANCE INDICATORS ARPU decline due to 1 PAID SUBSCRIBERS (IN THOUSANDS) ARPU significant subscriber growth; future As of Feb. 28, 2021 1,310 monetization will $792 drive accretion 978k, 78% YoY Growth $759 1,084 New Estimate $717 Prior Estimate Historical 857 $599 553 526 $478 2018 2019 2020 2021P 2022P 2018 2019 2020 2021P 2022P 1.Based on trailing four quarter net billings /average number of trailing four quarter paid subscribers 24 24
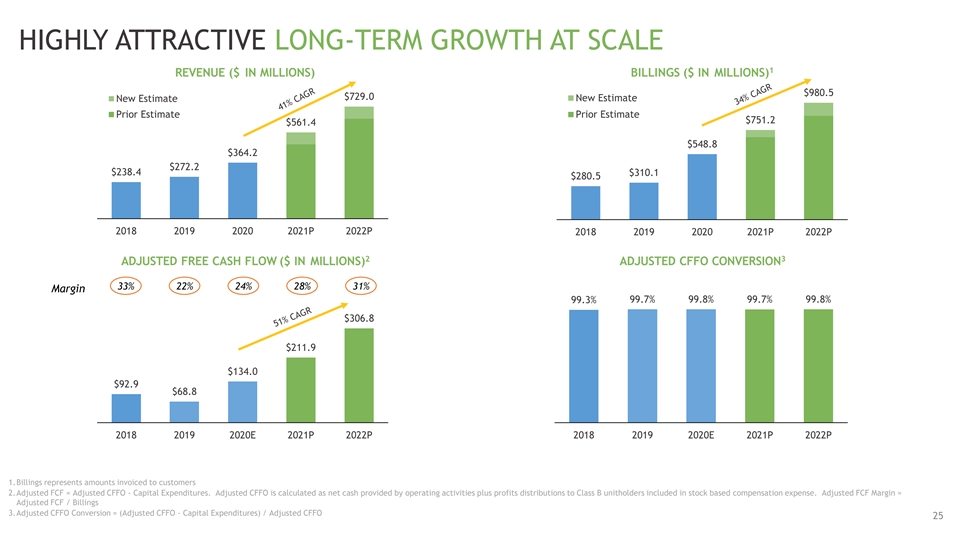
HIGHLY ATTRACTIVE LONG-TERM GROWTH AT SCALE 1 REVENUE ($ IN MILLIONS) BILLINGS ($ IN MILLIONS) $980.5 $729.0 New Estimate New Estimate Prior Estimate Prior Estimate $751.2 $561.4 $548.8 $364.2 $272.2 $238.4 $310.1 $280.5 2018 2019 2020 2021P 2022P 2018 2019 2020 2021P 2022P 2 3 ADJUSTED FREE CASH FLOW ($ IN MILLIONS) ADJUSTED CFFO CONVERSION 33% 22% 24% 28% 31% Margin 99.3% 99.7% 99.8% 99.7% 99.8% $306.8 $211.9 $134.0 $92.9 $68.8 2018 2019 2020E 2021P 2022P 2018 2019 2020E 2021P 2022P 1.Billings represents amounts invoiced to customers 2.Adjusted FCF = Adjusted CFFO - Capital Expenditures. Adjusted CFFO is calculated as net cash provided by operating activities plus profits distributions to Class B unitholders included in stock based compensation expense. Adjusted FCF Margin = Adjusted FCF / Billings 3.Adjusted CFFO Conversion = (Adjusted CFFO - Capital Expenditures) / Adjusted CFFO 25HIGHLY ATTRACTIVE LONG-TERM GROWTH AT SCALE 1 REVENUE ($ IN MILLIONS) BILLINGS ($ IN MILLIONS) $980.5 $729.0 New Estimate New Estimate Prior Estimate Prior Estimate $751.2 $561.4 $548.8 $364.2 $272.2 $238.4 $310.1 $280.5 2018 2019 2020 2021P 2022P 2018 2019 2020 2021P 2022P 2 3 ADJUSTED FREE CASH FLOW ($ IN MILLIONS) ADJUSTED CFFO CONVERSION 33% 22% 24% 28% 31% Margin 99.3% 99.7% 99.8% 99.7% 99.8% $306.8 $211.9 $134.0 $92.9 $68.8 2018 2019 2020E 2021P 2022P 2018 2019 2020E 2021P 2022P 1.Billings represents amounts invoiced to customers 2.Adjusted FCF = Adjusted CFFO - Capital Expenditures. Adjusted CFFO is calculated as net cash provided by operating activities plus profits distributions to Class B unitholders included in stock based compensation expense. Adjusted FCF Margin = Adjusted FCF / Billings 3.Adjusted CFFO Conversion = (Adjusted CFFO - Capital Expenditures) / Adjusted CFFO 25
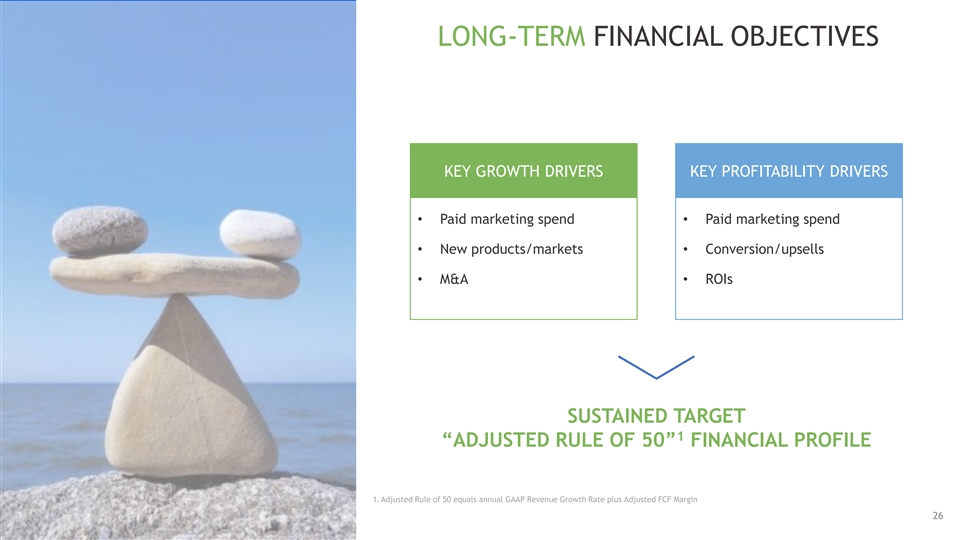
LONG-TERM FINANCIAL OBJECTIVES KEY GROWTH DRIVERS KEY PROFITABILITY DRIVERS • Paid marketing spend• Paid marketing spend • New products/markets• Conversion/upsells • M&A• ROIs SUSTAINED TARGET 1 “ADJUSTED RULE OF 50” FINANCIAL PROFILE 1.Adjusted Rule of 50 equals annual GAAP Revenue Growth Rate plus Adjusted FCF Margin 26LONG-TERM FINANCIAL OBJECTIVES KEY GROWTH DRIVERS KEY PROFITABILITY DRIVERS • Paid marketing spend• Paid marketing spend • New products/markets• Conversion/upsells • M&A• ROIs SUSTAINED TARGET 1 “ADJUSTED RULE OF 50” FINANCIAL PROFILE 1.Adjusted Rule of 50 equals annual GAAP Revenue Growth Rate plus Adjusted FCF Margin 26

INVESTMENT HIGHLIGHTS $191B TAM with significant tailwinds, ripe for disruption ✓ Market leading tech platform with scalable high-value and proprietary content, data & analytics ✓ ✓ 10M+ self-directed investors, growing 78% from 2018 to 2020 ✓ 12 primary customer facing brands offering 160+ products 1 2 “Adjusted Rule of 50” financial profile - Scale + Growth + Recurring + Adjusted FCF ✓ Deep, long-tenured & proven team ✓ Multiple organic & inorganic avenues to potentially drive sustained profitable growth at scale ✓ 1. Adjusted Rule of 50 equals annual GAAP Revenue Growth Rate plus Adjusted FCF Margin. Adjusted FCF Margin = Adjusted FCF / Billings 27 2. Adjusted FCF is calculated as Adjusted CFFO (Cash Flow From Operations) - Capital Expenditures. Adjusted CFFO is calculated as net cash provided by operating activities plus profits distributions to Class B unitholders included in stock based compensation expenseINVESTMENT HIGHLIGHTS $191B TAM with significant tailwinds, ripe for disruption ✓ Market leading tech platform with scalable high-value and proprietary content, data & analytics ✓ ✓ 10M+ self-directed investors, growing 78% from 2018 to 2020 ✓ 12 primary customer facing brands offering 160+ products 1 2 “Adjusted Rule of 50” financial profile - Scale + Growth + Recurring + Adjusted FCF ✓ Deep, long-tenured & proven team ✓ Multiple organic & inorganic avenues to potentially drive sustained profitable growth at scale ✓ 1. Adjusted Rule of 50 equals annual GAAP Revenue Growth Rate plus Adjusted FCF Margin. Adjusted FCF Margin = Adjusted FCF / Billings 27 2. Adjusted FCF is calculated as Adjusted CFFO (Cash Flow From Operations) - Capital Expenditures. Adjusted CFFO is calculated as net cash provided by operating activities plus profits distributions to Class B unitholders included in stock based compensation expense

BSG VS. COMPS: BEST IN CLASS WITH SIGNIFICANT UPSIDE POTENTIAL 2021P ADJ. FREE CASH FLOW MARGIN (%) 2020-2022P ADJ. FREE CASH FLOW CAGR (%) 2020-2022P GAAP REVENUE CAGR (%) 28.1% 41.5% 51.5% 51.3% 15.7% 15.6% 21.6% 10.0% 7.7% 1 1 BSG Consumer / SMB Tech Digital Subscription BSG Consumer / SMB Tech Digital Subscription BSG Consumer / SMB Tech Digital Subscription 2 2 2 2 Subscription and Info Services Subscription and Info Services Subscription and Info Services 4 EV / 2021P ADJ. FREE CASH FLOW (X) EV / 2021P REVENUE (X) 8.4x 31.3x 7.2x 5.4x 18.7x 14.3x 3 1,3 BSG Consumer / SMB Tech Digital Subscription BSG Consumer / SMB Tech Digital Subscription 2 2 Subscription and Info Services Subscription and Info Services Sources: FactSet as of 1/29/2021, Wall Street research Notes: Consumer / SMB Tech Subscription group includes: CHGG, DBX, GDDY, HUBS, MTCH, NFLX, SPOT, SQ, SVMK, WIX; Digital Subscription and Info Services group includes: CSGP, ENV, FDS, FORR, INFO, IT, MORN, MSCI, NYT 1.Adjusted Free Cash Flow = Adjusted CFFO - Capital Expenditures. Adjusted Free Cash Flow Margin = Adjusted Free Cash Flow / Billings. Adjusted CFFO is calculated as net cash provided by operating activities plus profits distributions to Class B unitholders included in stock based compensation expense. Billings represents amounts invoiced to customers 2.Adjusted Free Cash Flow = Adjusted CFFO + Taxes – Capital Expenditures. Adjusted Free Cash Flow Margin = Adjusted Free Cash Flow / GAAP Revenue 3.Multiples based on pro forma Total Enterprise Value of $3,024 million 28 4.Trading multiples greater than 45.0x are excludedBSG VS. COMPS: BEST IN CLASS WITH SIGNIFICANT UPSIDE POTENTIAL 2021P ADJ. FREE CASH FLOW MARGIN (%) 2020-2022P ADJ. FREE CASH FLOW CAGR (%) 2020-2022P GAAP REVENUE CAGR (%) 28.1% 41.5% 51.5% 51.3% 15.7% 15.6% 21.6% 10.0% 7.7% 1 1 BSG Consumer / SMB Tech Digital Subscription BSG Consumer / SMB Tech Digital Subscription BSG Consumer / SMB Tech Digital Subscription 2 2 2 2 Subscription and Info Services Subscription and Info Services Subscription and Info Services 4 EV / 2021P ADJ. FREE CASH FLOW (X) EV / 2021P REVENUE (X) 8.4x 31.3x 7.2x 5.4x 18.7x 14.3x 3 1,3 BSG Consumer / SMB Tech Digital Subscription BSG Consumer / SMB Tech Digital Subscription 2 2 Subscription and Info Services Subscription and Info Services Sources: FactSet as of 1/29/2021, Wall Street research Notes: Consumer / SMB Tech Subscription group includes: CHGG, DBX, GDDY, HUBS, MTCH, NFLX, SPOT, SQ, SVMK, WIX; Digital Subscription and Info Services group includes: CSGP, ENV, FDS, FORR, INFO, IT, MORN, MSCI, NYT 1.Adjusted Free Cash Flow = Adjusted CFFO - Capital Expenditures. Adjusted Free Cash Flow Margin = Adjusted Free Cash Flow / Billings. Adjusted CFFO is calculated as net cash provided by operating activities plus profits distributions to Class B unitholders included in stock based compensation expense. Billings represents amounts invoiced to customers 2.Adjusted Free Cash Flow = Adjusted CFFO + Taxes – Capital Expenditures. Adjusted Free Cash Flow Margin = Adjusted Free Cash Flow / GAAP Revenue 3.Multiples based on pro forma Total Enterprise Value of $3,024 million 28 4.Trading multiples greater than 45.0x are excluded

PUBLIC COMPARABLES RATIONALE Consumer / SMB Tech Subscription • BSG is a direct to consumer, tech-enabled, subscription-based business whose success is driven by its ability to directly connect with retail investors, get them interested enough to click through and to subscribe and whose value is ultimately driven by forming personal connections with these subscribers, providing high quality content, and converting them to this higher value content at higher price points • Target customers are primarily retail investors whose buying behavior closely resembles that of consumer subscription customers • Free-to-paid business model aligns closely with many high performing consumer / SMB tech companies, with higher tiers for customers as they continue to see greater value • BSG is at the most favorable end of the range of this peer group for all major categories of: i.) revenue growth, ii.) gross margins, iii.) ARPU, iv.) monthly churn, and v.) LTV / CAC Digital Subscription and Info Services • BSG’s content has similarities to many of the digital subscription and info services companies, although a number of the comps in the group are more focused on institutional customers as compared to consumers • This group is focused on digital publication of financial media content, which is similar to BSG’s content and delivery medium • BSG leads in all major categories versus this peer group (and is in line with the group in monthly churn): i.) revenue growth, ii.) gross margins, iii.) ARPU, iv.) monthly churn, and v.) LTV / CAC 29PUBLIC COMPARABLES RATIONALE Consumer / SMB Tech Subscription • BSG is a direct to consumer, tech-enabled, subscription-based business whose success is driven by its ability to directly connect with retail investors, get them interested enough to click through and to subscribe and whose value is ultimately driven by forming personal connections with these subscribers, providing high quality content, and converting them to this higher value content at higher price points • Target customers are primarily retail investors whose buying behavior closely resembles that of consumer subscription customers • Free-to-paid business model aligns closely with many high performing consumer / SMB tech companies, with higher tiers for customers as they continue to see greater value • BSG is at the most favorable end of the range of this peer group for all major categories of: i.) revenue growth, ii.) gross margins, iii.) ARPU, iv.) monthly churn, and v.) LTV / CAC Digital Subscription and Info Services • BSG’s content has similarities to many of the digital subscription and info services companies, although a number of the comps in the group are more focused on institutional customers as compared to consumers • This group is focused on digital publication of financial media content, which is similar to BSG’s content and delivery medium • BSG leads in all major categories versus this peer group (and is in line with the group in monthly churn): i.) revenue growth, ii.) gross margins, iii.) ARPU, iv.) monthly churn, and v.) LTV / CAC 29

CONSUMER / SMB TECH SUBSCRIPTION METRICS ($ in millions, except per share data) Financial Metrics Operational Metrics (Q4 2020) Revenue YoY Growth Rev CAGR Gross Margin Annual Monthly LTV / Company '20-'21 '21-'22 '20-'22 2020 2021E ARPU Churn CAC Beacon Street Group 54.1% 29.9% 41.5% 85.7% 86.8% $ 759.0 1.8% >5x Netflix, Inc. 20.1% 15.6% 17.8% 39.0% 40.4% $ 130.5 4.0% - (1) Square, Inc. 48.3% 19.7% 33.2% 29.2% 27.7% 41.0 - - Spotify Technology S.A. 16.1% 19.5% 17.8% 25.3% 25.4% 60.8 3.9% 2.9x Match Group, Inc. 18.7% 17.2% 18.0% 73.5% 73.6% 226.3 - - (2) HubSpot, Inc. 34.1% 24.6% 29.3% 82.2% 82.5% - - - Wix.com Ltd. 31.5% 25.3% 28.4% 70.1% 63.2% 158.3 1.4% - GoDaddy Inc. 12.0% 10.4% 11.2% 65.0% 65.3% 166.0 1.2% >10x Chegg, Inc. 25.7% 21.6% 23.6% 68.3% 68.9% 160.0 - - Dropbox, Inc. 10.4% 8.8% 9.6% 79.1% 80.1% 130.2 - - SVMK Inc. 17.5% 20.1% 18.8% 80.4% 80.8% 494.0 - - Mean: 23.4% 18.3% 20.8% 61.2% 60.8% Median: 19.4% 19.6% 18.4% 69.2% 67.1% Sources: FactSet, CapitalIQ, Wall Street research, public filings & transcripts (1) Square ARPU represents Cash App 30 (2) HubSpot reports ARPU, but it was not included due to difference in customer typeCONSUMER / SMB TECH SUBSCRIPTION METRICS ($ in millions, except per share data) Financial Metrics Operational Metrics (Q4 2020) Revenue YoY Growth Rev CAGR Gross Margin Annual Monthly LTV / Company '20-'21 '21-'22 '20-'22 2020 2021E ARPU Churn CAC Beacon Street Group 54.1% 29.9% 41.5% 85.7% 86.8% $ 759.0 1.8% >5x Netflix, Inc. 20.1% 15.6% 17.8% 39.0% 40.4% $ 130.5 4.0% - (1) Square, Inc. 48.3% 19.7% 33.2% 29.2% 27.7% 41.0 - - Spotify Technology S.A. 16.1% 19.5% 17.8% 25.3% 25.4% 60.8 3.9% 2.9x Match Group, Inc. 18.7% 17.2% 18.0% 73.5% 73.6% 226.3 - - (2) HubSpot, Inc. 34.1% 24.6% 29.3% 82.2% 82.5% - - - Wix.com Ltd. 31.5% 25.3% 28.4% 70.1% 63.2% 158.3 1.4% - GoDaddy Inc. 12.0% 10.4% 11.2% 65.0% 65.3% 166.0 1.2% >10x Chegg, Inc. 25.7% 21.6% 23.6% 68.3% 68.9% 160.0 - - Dropbox, Inc. 10.4% 8.8% 9.6% 79.1% 80.1% 130.2 - - SVMK Inc. 17.5% 20.1% 18.8% 80.4% 80.8% 494.0 - - Mean: 23.4% 18.3% 20.8% 61.2% 60.8% Median: 19.4% 19.6% 18.4% 69.2% 67.1% Sources: FactSet, CapitalIQ, Wall Street research, public filings & transcripts (1) Square ARPU represents Cash App 30 (2) HubSpot reports ARPU, but it was not included due to difference in customer type

DIGITAL SUBSCRIPTION AND INFO SERVICES METRICS ($ in millions, except per share data) Financial Metrics Operational Metrics (Q4 2020) Revenue YoY Growth Rev CAGR Gross Margin Annual Monthly LTV / Company '20-'21 '21-'22 '20-'22 2020 2021E ARPU Churn CAC Beacon Street Group 54.1% 29.9% 41.5% 85.7% 86.8% $ 759.0 1 .8% >5x MSCI Inc. 14.2% 10.1% 12.1% 82.9% 83.6% - - - IHS Markit Ltd. 6.8% 6.5% 6.6% 62.5% 62.9% - - - CoStar Group, Inc. 17.9% 15.7% 16.8% 81.2% 81.2% - - - (1) Gartner, Inc. 8.4% 13.7% 11.0% 66.4% 66.5% - 1.6% - FactSet Research Systems Inc. 5.5% NA 5.1% NA NA - 0.9% - Morningstar, Inc. NA NA NA NA NA - - - The New York Times Company 10.5% 7.6% 9.0% NA NA - - 3.7x Envestnet, Inc. 13.5% 10.5% 12.0% 69.3% 67.4% - - - Forrester Research, Inc. 6.7% 8.4% 7.5% 59.7% 59.3% - 3.5% - Mean: 10.4% 10.3% 10.0% 70.3% 70.2% Median: 9.5% 10.1% 10.0% 67.9% 67.0% Sources: FactSet, CapitalIQ, Wall Street research, public filings & transcripts (1) Gartner churn represents global technology salesDIGITAL SUBSCRIPTION AND INFO SERVICES METRICS ($ in millions, except per share data) Financial Metrics Operational Metrics (Q4 2020) Revenue YoY Growth Rev CAGR Gross Margin Annual Monthly LTV / Company '20-'21 '21-'22 '20-'22 2020 2021E ARPU Churn CAC Beacon Street Group 54.1% 29.9% 41.5% 85.7% 86.8% $ 759.0 1 .8% >5x MSCI Inc. 14.2% 10.1% 12.1% 82.9% 83.6% - - - IHS Markit Ltd. 6.8% 6.5% 6.6% 62.5% 62.9% - - - CoStar Group, Inc. 17.9% 15.7% 16.8% 81.2% 81.2% - - - (1) Gartner, Inc. 8.4% 13.7% 11.0% 66.4% 66.5% - 1.6% - FactSet Research Systems Inc. 5.5% NA 5.1% NA NA - 0.9% - Morningstar, Inc. NA NA NA NA NA - - - The New York Times Company 10.5% 7.6% 9.0% NA NA - - 3.7x Envestnet, Inc. 13.5% 10.5% 12.0% 69.3% 67.4% - - - Forrester Research, Inc. 6.7% 8.4% 7.5% 59.7% 59.3% - 3.5% - Mean: 10.4% 10.3% 10.0% 70.3% 70.2% Median: 9.5% 10.1% 10.0% 67.9% 67.0% Sources: FactSet, CapitalIQ, Wall Street research, public filings & transcripts (1) Gartner churn represents global technology sales
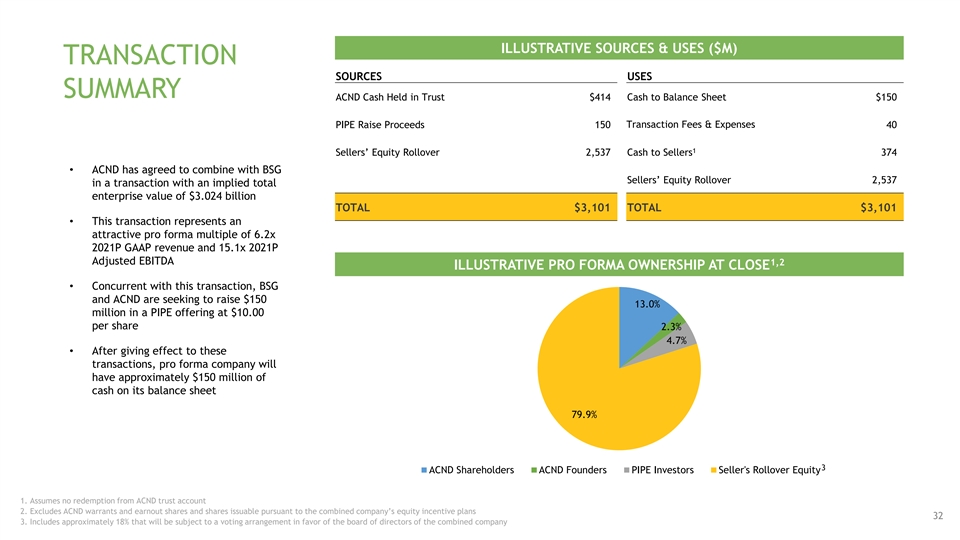
ILLUSTRATIVE SOURCES & USES ($M) TRANSACTION SOURCES USES SUMMARY ACND Cash Held in Trust $414 Cash to Balance Sheet $150 PIPE Raise Proceeds 150 Transaction Fees & Expenses 40 1 Sellers’ Equity Rollover 2,537 Cash to Sellers 374 • ACND has agreed to combine with BSG Sellers’ Equity Rollover 2,537 in a transaction with an implied total enterprise value of $3.024 billion TOTAL $3,101 TOTAL $3,101 • This transaction represents an attractive pro forma multiple of 6.2x 2021P GAAP revenue and 15.1x 2021P Adjusted EBITDA 1,2 ILLUSTRATIVE PRO FORMA OWNERSHIP AT CLOSE • Concurrent with this transaction, BSG and ACND are seeking to raise $150 13.0% million in a PIPE offering at $10.00 per share 2.3% 4.7% • After giving effect to these transactions, pro forma company will have approximately $150 million of cash on its balance sheet 79.9% 3 ACND Shareholders ACND Founders PIPE Investors Seller's Rollover Equity 1. Assumes no redemption from ACND trust account 2. Excludes ACND warrants and earnout shares and shares issuable pursuant to the combined company’s equity incentive plans 32 3. Includes approximately 18% that will be subject to a voting arrangement in favor of the board of directors of the combined companyILLUSTRATIVE SOURCES & USES ($M) TRANSACTION SOURCES USES SUMMARY ACND Cash Held in Trust $414 Cash to Balance Sheet $150 PIPE Raise Proceeds 150 Transaction Fees & Expenses 40 1 Sellers’ Equity Rollover 2,537 Cash to Sellers 374 • ACND has agreed to combine with BSG Sellers’ Equity Rollover 2,537 in a transaction with an implied total enterprise value of $3.024 billion TOTAL $3,101 TOTAL $3,101 • This transaction represents an attractive pro forma multiple of 6.2x 2021P GAAP revenue and 15.1x 2021P Adjusted EBITDA 1,2 ILLUSTRATIVE PRO FORMA OWNERSHIP AT CLOSE • Concurrent with this transaction, BSG and ACND are seeking to raise $150 13.0% million in a PIPE offering at $10.00 per share 2.3% 4.7% • After giving effect to these transactions, pro forma company will have approximately $150 million of cash on its balance sheet 79.9% 3 ACND Shareholders ACND Founders PIPE Investors Seller's Rollover Equity 1. Assumes no redemption from ACND trust account 2. Excludes ACND warrants and earnout shares and shares issuable pursuant to the combined company’s equity incentive plans 32 3. Includes approximately 18% that will be subject to a voting arrangement in favor of the board of directors of the combined company

APPENDIX 33APPENDIX 33

HISTORICAL KEY PERFORMANCE INDICATORS FREE SUBSCRIBERS PAID SUBSCRIBERS 1 ARPU (IN THOUSANDS) (IN THOUSANDS) $759 857 9,530 $599 $478 553 526 5,027 2,741 2018 2019 2020 2018 2019 2020 2018 2019 2020 1.Based on trailing four quarter net billings / average number of trailing four quarter paid subscribers 34 34HISTORICAL KEY PERFORMANCE INDICATORS FREE SUBSCRIBERS PAID SUBSCRIBERS 1 ARPU (IN THOUSANDS) (IN THOUSANDS) $759 857 9,530 $599 $478 553 526 5,027 2,741 2018 2019 2020 2018 2019 2020 2018 2019 2020 1.Based on trailing four quarter net billings / average number of trailing four quarter paid subscribers 34 34

NON-GAAP RECONCILIATIONS ($ in 000's) 2018 2019 2020 Net Cash Provided by Operating Activities 76,493 54,201 55,875 Plus: Profits distributions to Class B unitholders included in stock based compensation expense 17,135 14,831 78,398 Adj. CFFO (Adjusted Cash Flow from Operations) 93,628 69,032 134,273 35 35NON-GAAP RECONCILIATIONS ($ in 000's) 2018 2019 2020 Net Cash Provided by Operating Activities 76,493 54,201 55,875 Plus: Profits distributions to Class B unitholders included in stock based compensation expense 17,135 14,831 78,398 Adj. CFFO (Adjusted Cash Flow from Operations) 93,628 69,032 134,273 35 35
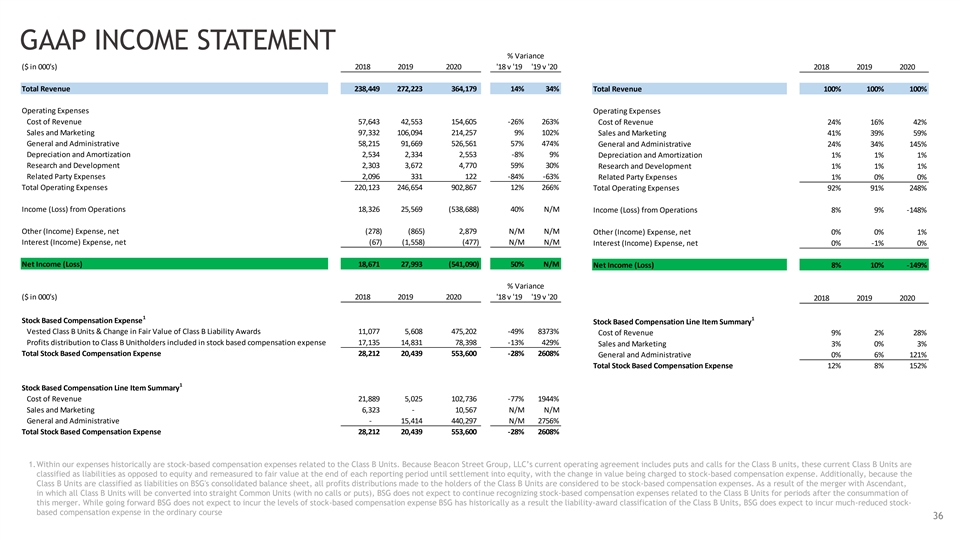
GAAP INCOME STATEMENT % Variance ($ in 000's) 2018 2019 2020 '18 v '19 '19 v '20 2018 2019 2020 Total Revenue 238,449 272,223 364,179 14% 34% Total Revenue 100% 100% 100% Operating Expenses Operating Expenses Cost of Revenue 5 7,643 4 2,553 154,605 -26% 263% Cost of Revenue 24% 16% 42% Sales and Marketing 9 7,332 106,094 214,257 9% 102% Sales and Marketing 41% 39% 59% General and Administrative 58,215 91,669 526,561 57% 474% General and Administrative 24% 34% 145% Depreciation and Amortization 2,534 2,334 2,553 -8% 9% Depreciation and Amortization 1% 1% 1% Research and Development 2,303 3,672 4,770 59% 30% Research and Development 1% 1% 1% Related Party Expenses 2,096 331 122 -84% -63% Related Party Expenses 1% 0% 0% Total Operating Expenses 220,123 246,654 902,867 12% 266% Total Operating Expenses 92% 91% 248% Income (Loss) from Operations 1 8,326 2 5,569 ( 538,688) 40% N/M Income (Loss) from Operations 8% 9% -148% Other (Income) Expense, net (278) (865) 2,879 N/M N/M Other (Income) Expense, net 0% 0% 1% Interest (Income) Expense, net (67) (1,558) (477) N/M N/M Interest (Income) Expense, net 0% -1% 0% Net Income (Loss) 18,671 2 7,993 (541,090) 50% N/M Net Income (Loss) 8% 10% -149% % Variance ($ in 000's) 2018 2019 2020 '18 v '19 '19 v '20 2018 2019 2020 1 1 Stock Based Compensation Expense Stock Based Compensation Line Item Summary Vested Class B Units & Change in Fair Value of Class B Liability Awards 11,077 5,608 475,202 -49% 8373% Cost of Revenue 9% 2% 28% Profits distribution to Class B Unitholders included in stock based compensation expense 17,135 14,831 78,398 -13% 429% Sales and Marketing 3% 0% 3% Total Stock Based Compensation Expense 2 8,212 2 0,439 553,600 -28% 2608% General and Administrative 0% 6% 121% Total Stock Based Compensation Expense 12% 8% 152% 1 Stock Based Compensation Line Item Summary Cost of Revenue 21,889 5,025 102,736 -77% 1944% Sales and Marketing 6,323 - 1 0,567 N/M N/M General and Administrative - 1 5,414 440,297 N/M 2756% Total Stock Based Compensation Expense 2 8,212 20,439 553,600 -28% 2608% 1.Within our expenses historically are stock-based compensation expenses related to the Class B Units. Because Beacon Street Group, LLC’s current operating agreement includes puts and calls for the Class B units, these current Class B Units are classified as liabilities as opposed to equity and remeasured to fair value at the end of each reporting period until settlement into equity, with the change in value being charged to stock-based compensation expense. Additionally, because the Class B Units are classified as liabilities on BSG's consolidated balance sheet, all profits distributions made to the holders of the Class B Units are considered to be stock-based compensation expenses. As a result of the merger with Ascendant, in which all Class B Units will be converted into straight Common Units (with no calls or puts), BSG does not expect to continue recognizing stock-based compensation expenses related to the Class B Units for periods after the consummation of this merger. While going forward BSG does not expect to incur the levels of stock-based compensation expense BSG has historically as a result the liability-award classification of the Class B Units, BSG does expect to incur much-reduced stock- based compensation expense in the ordinary course 36 36GAAP INCOME STATEMENT % Variance ($ in 000's) 2018 2019 2020 '18 v '19 '19 v '20 2018 2019 2020 Total Revenue 238,449 272,223 364,179 14% 34% Total Revenue 100% 100% 100% Operating Expenses Operating Expenses Cost of Revenue 5 7,643 4 2,553 154,605 -26% 263% Cost of Revenue 24% 16% 42% Sales and Marketing 9 7,332 106,094 214,257 9% 102% Sales and Marketing 41% 39% 59% General and Administrative 58,215 91,669 526,561 57% 474% General and Administrative 24% 34% 145% Depreciation and Amortization 2,534 2,334 2,553 -8% 9% Depreciation and Amortization 1% 1% 1% Research and Development 2,303 3,672 4,770 59% 30% Research and Development 1% 1% 1% Related Party Expenses 2,096 331 122 -84% -63% Related Party Expenses 1% 0% 0% Total Operating Expenses 220,123 246,654 902,867 12% 266% Total Operating Expenses 92% 91% 248% Income (Loss) from Operations 1 8,326 2 5,569 ( 538,688) 40% N/M Income (Loss) from Operations 8% 9% -148% Other (Income) Expense, net (278) (865) 2,879 N/M N/M Other (Income) Expense, net 0% 0% 1% Interest (Income) Expense, net (67) (1,558) (477) N/M N/M Interest (Income) Expense, net 0% -1% 0% Net Income (Loss) 18,671 2 7,993 (541,090) 50% N/M Net Income (Loss) 8% 10% -149% % Variance ($ in 000's) 2018 2019 2020 '18 v '19 '19 v '20 2018 2019 2020 1 1 Stock Based Compensation Expense Stock Based Compensation Line Item Summary Vested Class B Units & Change in Fair Value of Class B Liability Awards 11,077 5,608 475,202 -49% 8373% Cost of Revenue 9% 2% 28% Profits distribution to Class B Unitholders included in stock based compensation expense 17,135 14,831 78,398 -13% 429% Sales and Marketing 3% 0% 3% Total Stock Based Compensation Expense 2 8,212 2 0,439 553,600 -28% 2608% General and Administrative 0% 6% 121% Total Stock Based Compensation Expense 12% 8% 152% 1 Stock Based Compensation Line Item Summary Cost of Revenue 21,889 5,025 102,736 -77% 1944% Sales and Marketing 6,323 - 1 0,567 N/M N/M General and Administrative - 1 5,414 440,297 N/M 2756% Total Stock Based Compensation Expense 2 8,212 20,439 553,600 -28% 2608% 1.Within our expenses historically are stock-based compensation expenses related to the Class B Units. Because Beacon Street Group, LLC’s current operating agreement includes puts and calls for the Class B units, these current Class B Units are classified as liabilities as opposed to equity and remeasured to fair value at the end of each reporting period until settlement into equity, with the change in value being charged to stock-based compensation expense. Additionally, because the Class B Units are classified as liabilities on BSG's consolidated balance sheet, all profits distributions made to the holders of the Class B Units are considered to be stock-based compensation expenses. As a result of the merger with Ascendant, in which all Class B Units will be converted into straight Common Units (with no calls or puts), BSG does not expect to continue recognizing stock-based compensation expenses related to the Class B Units for periods after the consummation of this merger. While going forward BSG does not expect to incur the levels of stock-based compensation expense BSG has historically as a result the liability-award classification of the Class B Units, BSG does expect to incur much-reduced stock- based compensation expense in the ordinary course 36 36