Attached files
| file | filename |
|---|---|
| EX-99.2 - EXHIBIT 99.2 - SPRING VALLEY ACQUISITION CORP. | tm2110955d1_ex99-2.htm |
| EX-99.1 - EXHIBIT 99.1 - SPRING VALLEY ACQUISITION CORP. | tm2110955d1_ex99-1.htm |
| EX-10.3 - EXHIBIT 10.3 - SPRING VALLEY ACQUISITION CORP. | tm2110955d1_ex10-3.htm |
| EX-10.2 - EXHIBIT 10.2 - SPRING VALLEY ACQUISITION CORP. | tm2110955d1_ex10-2.htm |
| EX-10.1 - EXHIBIT 10.1 - SPRING VALLEY ACQUISITION CORP. | tm2110955d1_ex10-1.htm |
| EX-2.1 - EXHIBIT 2.1 - SPRING VALLEY ACQUISITION CORP. | tm2110955d1_ex2-1.htm |
| 8-K - FORM 8-K - SPRING VALLEY ACQUISITION CORP. | tm2110955d1_8k.htm |
Exhibit 99.3
 |
Bringing agriculture through technology to new heights and innovation INVESTOR PRESENTATION March 2021 |
 |
Disclaimer This presentation (this “Presentation”) is provided for informational purposes only and has been prepared to assist interested parties in making their own evaluation with respect to a potential business combination between Dream Holdings, Inc. (“Dream”) and Spring Valley Acquisition Corp. (“Spring Valley”) and related transactions (the “Proposed Business Combination”) and for no other purpose. No representations or warranties, express or implied are given in, or in respect of, this Presentation. To the fullest extent permitted by law in no circumstances will Spring Valley, Dream or any of their respective subsidiaries, stockholders, affiliates, representatives, partners, directors, officers, employees, advisers or agents be responsible or liable for any direct, indirect or consequential loss or loss of profit arising from the use of this Presentation, its contents, its omissions, reliance on the information contained within it, or on opinions communicated in relation thereto or otherwise arising in connection therewith. Industry and market data used in this Presentation have been obtained from third-party industry publications and sources as well as from research reports prepared for other purposes. None of Spring Valley or Dream has independently verified the data obtained from these sources and cannot assure you of the data’s accuracy or completeness. This data is subject to change. In addition, this Presentation does not purport to be all-inclusive or to contain all of the information that may be required to make a full analysis of Dream or the Proposed Business Combination. Viewers of this Presentation should each make their own evaluation of Dream and of the relevance and adequacy of the information and should make such other investigations as they deem necessary. Forward-Looking Statements This document contains certain forward-looking statements within the meaning of the federal securities laws. Forward-looking statements generally are accompanied by words such as “believe,” “may,” “will,” “estimate,” “continue,” “anticipate,” “intend,” “expect,” “should,” “would,” “plan,” “predict,” “project,” “forecast,” “potential,” “seem,” “seek,” “strategy,” “future,” “outlook,” “opportunity,” “should,” “would,” “will be,” “will continue,” “will likely result” and similar expressions that predict or indicate future events or trends or that are not statements of historical matters. These forward-looking statements include, but are not limited to, statements regarding the proposed transaction between Dream and Spring Valley, including statements as to the expected timing, completion and effects of the proposed transaction, statements regarding each of Dream and Spring Valley, and statements regarding estimates, projections and forecasts of other financial and performance metrics and projections of market opportunity. These statements are based on various assumptions, whether or not identified in this Presentation, and on the current expectations of Dream’s and Spring Valley’s management and are not predictions of actual performance, and, as a result, are subject to risks and uncertainties. These forward-looking statements are provided for illustrative purposes only and are not intended to serve as, and must not be relied on by any investor as, a guarantee, an assurance, a prediction or a definitive statement of fact or probability. Actual events and circumstances are difficult or impossible to predict and will differ from assumptions. Many actual events and circumstances are beyond the control of Dream and Spring Valley. These forward-looking statements are subject to a number of risks and uncertainties, including, but not limited to, changes in domestic and foreign business, market, financial, political and legal conditions; the inability of the parties to successfully or timely consummate the Proposed Business Combination, including the risk that any required regulatory approvals are not obtained, are delayed or are subject to unanticipated conditions that could adversely affect the combined company or the expected benefits of the Proposed Business Combination or that the approval of the stockholders of Spring Valley or Dream is not obtained; failure to realize the anticipated benefits of the Proposed Business Combination; the inability to complete the PIPE investment in connection with the proposed transaction; the lack of a third party valuation in determining whether or not to pursue the proposed transactions; risks relating to the uncertainty of the projected financial information with respect to Dream; risks related to expansion of Dream’s business and technology; the risk that the vertical farming industry may not grow as large or as quickly as management currently expects, the impact of any future loss of “B Corporation” status on Dream’s business; the effects of competition on Dream’s future business; the effects of natural disasters, terrorist attacks and the spread and/or abatement of infectious diseases, such as COVID-19, on Dream’s business or on the ability to implement business plans, forecasts, and other expectations after the completion of the proposed transactions; the ability of Spring Valley or the combined company to issue equity or equity-linked securities or obtain debt financing in connection with the Proposed Business Combination or in the future, and those factors discussed in Spring Valley’s final prospectus dated November 25, 2020 under the heading “Risk Factors,” and other documents of Spring Valley filed, or to be filed, with the Securities and Exchange Commission (“SEC”). These filings identify and address other important risks and uncertainties that could cause actual events and results to differ materially from those contained in the forward-looking statements. If any of these risks materialize or our assumptions prove incorrect, actual results could differ materially from the results implied by these forward-looking statements. There may be additional risks that none of Spring Valley or Dream presently know or that Spring Valley or Dream currently believe are immaterial that could also cause actual results to differ from those contained in the forward-looking statements. In addition, forward-looking statements reflect Spring Valley’s and Dream’s expectations, plans or forecasts of future events and views as of the date of this Presentation. Spring Valley and Dream anticipate that subsequent events and developments will cause Spring Valley’s and Dream’s assessments to change. However, while Spring Valley and Dream may elect to update these forward-looking statements at some point in the future, Spring Valley and Dream specifically disclaim any obligation to do so, unless required by applicable law. These forward-looking statements should not be relied upon as representing Spring Valley’s and Dream’s assessments as of any date subsequent to the date of this Presentation. Accordingly, undue reliance should not be placed upon the forward-looking statements. Certain market data information in this Presentation is based on the estimates of Dream and Spring Valley management. Dream and Spring Valley obtained the industry, market and competitive position data used throughout this Presentation from internal estimates and research as well as from industry publications and research, surveys and studies conducted by third parties. Dream and Spring Valley believe their estimates to be accurate as of the date of this Presentation. However, this information may prove to be inaccurate because of the method by which Dream or Spring Valley obtained some of the data for its estimates or because this information cannot always be verified due to the limits on the availability and reliability of raw data, the voluntary nature of the data gathering process. Use of Projections This Presentation contains projected financial information with respect to Dream. Such projected financial information constitutes forward-looking information, and is for illustrative purposes only and should not be relied upon as necessarily being indicative of future results. The assumptions and estimates underlying such financial forecast information are inherently uncertain and are subject to a wide variety of significant business, economic, competitive and other risks and uncertainties. See “Forward-Looking Statements” above. Actual results may differ materially from the results contemplated by the financial forecast information contained in this Presentation, and the inclusion of such information in this Presentation should not be regarded as a representation by any person that the results reflected in such forecasts will be achieved. 2 |
 |
Disclaimer (cont’d) Important Information and Where to Find It In connection with the Proposed Business Combination, Spring Valley intends to file a registration statement on Form S-4, including a proxy statement/prospectus (the “Registration Statement”), with the SEC, which will include a preliminary proxy statement to be distributed to holders of Spring Valley’s common stock in connection with Spring Valley’s solicitation of proxies for the vote by Spring Valley’s stockholders with respect to the Proposed Business Combination and other matters as described in the Registration Statement, and a prospectus relating to the offer of the securities to be issued to Dream’s stockholders in connection with the Proposed Business Combination. After the Registration Statement has been declared effective, Spring Valley will mail a definitive proxy statement/prospectus, when available, to its stockholders and Dream’s stockholders. Investors and security holders and other interested parties are urged to read the proxy statement/prospectus, and any amendments thereto and any other documents filed with the SEC when they become available, carefully and in their entirety because they contain important information about Spring Valley, Dream and the Proposed Business Combination. Investors and security holders may obtain free copies of the preliminary proxy statement/prospectus and definitive proxy statement/prospectus (when available) and other documents filed with the SEC by Spring Valley through the website maintained by the SEC at http://www.sec.gov. No Offer or Solicitation This communication does not constitute an offer to sell or a solicitation of an offer to buy, or the solicitation of any vote or approval in any jurisdiction in connection with the Proposed Business Combination among Dream and Spring Valley or any related transactions, nor shall there be any sale, issuance or transfer of securities in any jurisdiction where, or to any person to whom, such offer, solicitation or sale may be unlawful. Any offering of securities or solicitation of votes regarding the proposed transaction will be made only by means of a proxy statement/prospectus that complies with applicable rules and regulations promulgated under the Securities Act of 1933, as amended (the “Securities Act”), and the Securities Exchange Act of 1934, as amended, or pursuant to an exemption from the Securities Act or in a transaction not subject to the registration requirements of the Securities Act. Participants in the Solicitation Spring Valley and Dream and their respective directors and certain of their respective executive officers and other members of management and employees may be considered participants in the solicitation of proxies with respect to the Proposed Business Combination. Information about the directors and executive officers of Spring Valley is in its final prospectus filed with the SEC on November 25, 2020. Additional information regarding the participants in the proxy solicitation and a description of their direct interests, by security holdings or otherwise, will be set forth in the Registration Statement and other relevant materials to be filed with the SEC regarding the Proposed Business Combination. Stockholders, potential investors and other interested persons should read the Registration Statement carefully before making any voting or investment decisions. These documents, when available, can be obtained free of charge from the sources indicated above. Financial Information; Non-GAAP Financial Measures The financial information and data contained in this Presentation are unaudited and do not conform to Regulation S-X. Accordingly, such information and data may not be included in, may be adjusted in or may be presented differently in, the Registration Statement or any other document to be filed by Spring Valley with the SEC. Some of the financial information and data contained in this Presentation, such as earnings before income taxes, depreciation and amortization (“EBITDA”), have not been prepared in accordance with United States generally accepted accounting principles (“GAAP”). Spring Valley and Dream believe these non-GAAP measures of financial results provide useful information to management and investors regarding certain financial and business trends relating to Dream’s financial condition and results of operations. Dream’s management uses these non-GAAP measures for trend analyses and for budgeting and planning purposes. Spring Valley and Dream believe that the use of these non-GAAP financial measures provides an additional tool for investors to use in evaluating projected operating results and trends in and in comparing Dream’s financial measures with other similar companies, many of which present similar non-GAAP financial measures to investors. [Dream is not able to forecast net income on a forward-looking basis without unreasonable efforts due to the high variability and difficulty in predicting certain items that affect GAAP, and therefore has not provided a reconciliation for forward-looking EBITDA]. Management does not consider these non-GAAP measures in isolation or as an alternative to financial measures determined in accordance with GAAP. The principal limitation of these non-GAAP financial measures is that they exclude significant expenses and income that are required by GAAP to be recorded in Dream’s financial statements. In addition, they are subject to inherent limitations as they reflect the exercise of judgments by management about which expense and income are excluded or included in determining these non-GAAP financial measures. In order to compensate for these limitations, management presents non-GAAP financial measures in connection with GAAP results. You should review Dream's audited financial statements, which will be included in the Registration Statement. Trademarks and Intellectual Property All trademarks, service marks, and trade names of Dream or Spring Valley or their respective affiliates used herein are trademarks, service marks, or registered trade names of Dream or Spring Valley, respectively, as noted herein. Any other product, company names, or logos mentioned herein are the trademarks and/or intellectual property of their respective owners, and their use is not intended to, and does not imply, a relationship with Dream or Spring Valley, or an endorsement or sponsorship by or of Dream or Spring Valley. Solely for convenience, the trademarks, service marks and trade names referred to in this presentation may appear without the ®, TM or SM symbols, but such references are not intended to indicate, in any way, that Dream or Spring Valley will not assert, to the fullest extent under applicable law, their rights or the right of the applicable licensor to these trademarks, service marks and trade names. 3 |
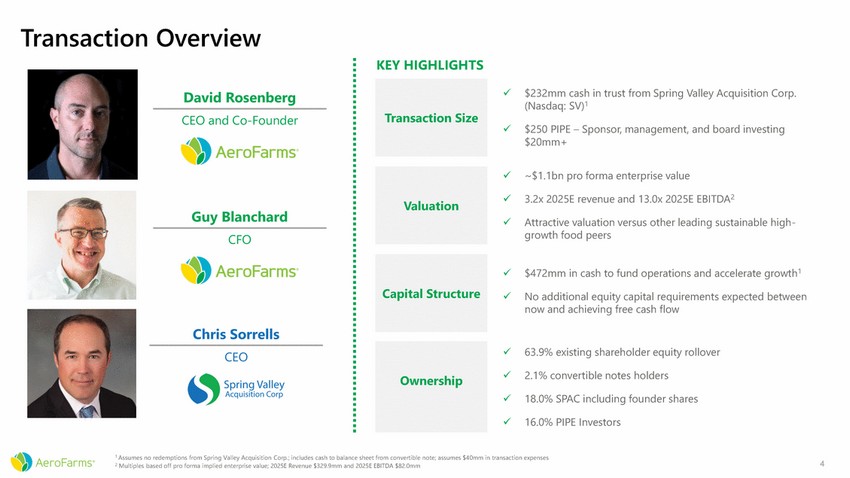 |
Transaction Overview KEY HIGHLIGHTS ✓ $232mm cash in trust from Spring Valley Acquisition Corp. (Nasdaq: SV)1 David Rosenberg CEO and Co-Founder ✓ $250 PIPE – Sponsor, management, and board investing $20mm+ ✓ ~$1.1bn pro forma enterprise value ✓ 3.2x 2025E revenue and 13.0x 2025E EBITDA2 Guy Blanchard Attractive valuation versus other leading sustainable high-growth food peers ✓ CFO ✓ $472mm in cash to fund operations and accelerate growth1 ✓ No additional equity capital requirements expected between now and achieving free cash flow Chris Sorrells ✓ 63.9% existing shareholder equity rollover CEO ✓ 2.1% convertible notes holders ✓ 18.0% SPAC including founder shares ✓ 16.0% PIPE Investors 1 Assumes no redemptions from Spring Valley Acquisition Corp.; includes cash to balance sheet from convertible note; assumes $40mm in transaction expenses 2 Multiples based off pro forma implied enterprise value; 2025E Revenue $329.9mm and 2025E EBITDA $82.0mm 4 Ownership Capital Structure Valuation Transaction Size |
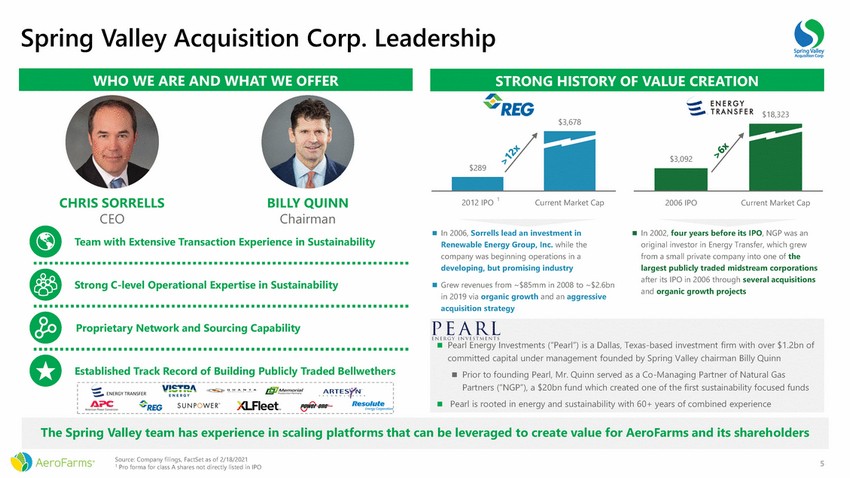 |
Spring Valley Acquisition Corp. Leadership $18,323 $3,678 CHRIS SORRELLS CEO BILLY QUINN Chairman 2012 IPO 1 Current Market Cap 2006 IPO Current Market Cap ◼ In 2006, Sorrells lead an investment in Renewable Energy Group, Inc. while the company was beginning operations in a developing, but promising industry ◼ In 2002, four years before its IPO, NGP was an original investor in Energy Transfer, which grew from a small private company into one of the largest publicly traded midstream corporations after its IPO in 2006 through several acquisitions and organic growth projects Team with Extensive Transaction Experience in Sustainability Strong C-level Operational Expertise in Sustainability ◼ Grew revenues from ~$85mm in 2008 to ~$2.6bn in 2019 via organic growth and an aggressive acquisition strategy Proprietary Network and Sourcing Capability Established Track Record of Building Publicly Traded Bellwethers Source: Company filings, FactSet as of 2/18/2021 1 Pro forma for class A shares not directly listed in IPO 5 The Spring Valley team has experience in scaling platforms that can be leveraged to create value for AeroFarms and its shareholders ◼ Pearl Energy Investments (“Pearl”) is a Dallas, Texas-based investment firm with over $1.2bn of committed capital under management founded by Spring Valley chairman Billy Quinn ◼ Prior to founding Pearl, Mr. Quinn served as a Co-Managing Partner of Natural Gas Partners (“NGP”), a $20bn fund which created one of the first sustainability focused funds ◼ Pearl is rooted in energy and sustainability with 60+ years of combined experience $289 $3,092 WHO WE ARE AND WHAT WE OFFER STRONG HISTORY OF VALUE CREATION |
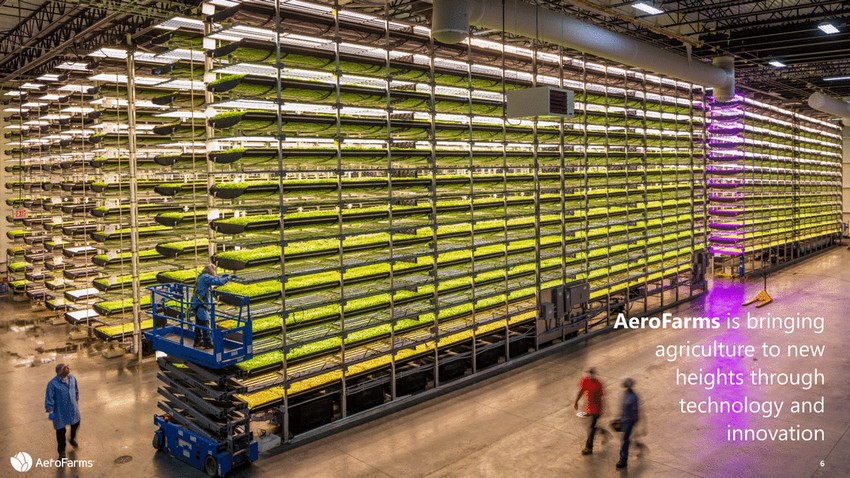 |
AeroFarms is bringing agriculture to new heights through technology and innovation 6 |
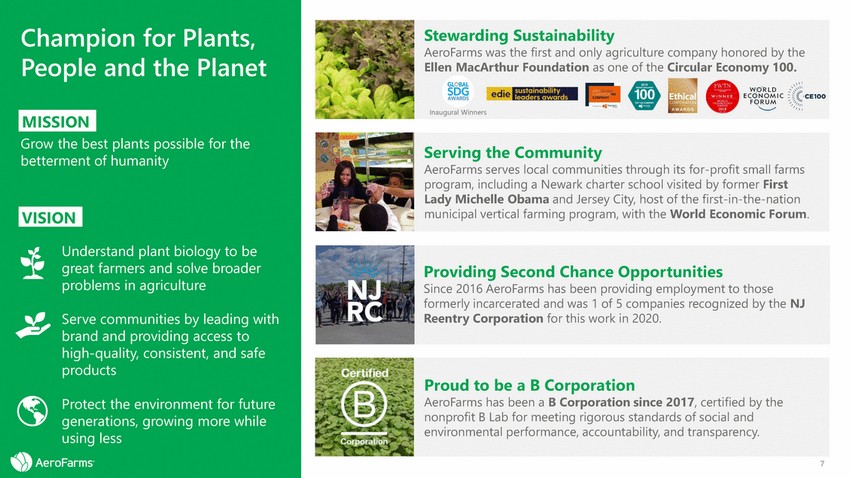 |
Champion for Plants, People and the Planet Grow the best plants possible for the betterment of humanity Understand plant biology to be great farmers and solve broader problems in agriculture Serve communities by leading with brand and providing access to high-quality, consistent, and safe products Protect the environment for future generations, growing more while using less 7 Proud to be a B Corporation AeroFarms has been a B Corporation since 2017, certified by the nonprofit B Lab for meeting rigorous standards of social and environmental performance, accountability, and transparency. Providing Second Chance Opportunities Since 2016 AeroFarms has been providing employment to those formerly incarcerated and was 1 of 5 companies recognized by the NJ Reentry Corporation for this work in 2020. VISION Serving the Community AeroFarms serves local communities through its for-profit small farms program, including a Newark charter school visited by former First Lady Michelle Obama and Jersey City, host of the first-in-the-nation municipal vertical farming program, with the World Economic Forum. MISSION Stewarding Sustainability AeroFarms was the first and only agriculture company honored by the Ellen MacArthur Foundation as one of the Circular Economy 100. Inaugural Winners |
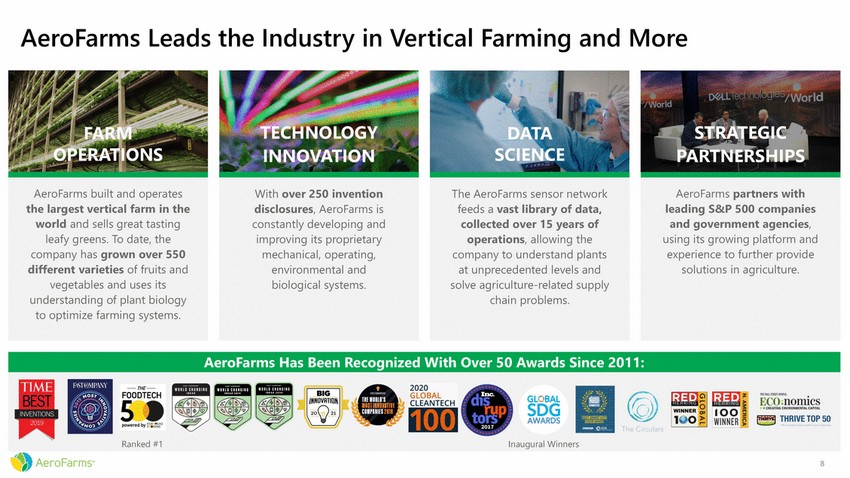 |
AeroFarms Leads the Industry in Vertical Farming and More TECHNOLOGY INNOVATION STRATEGIC PARTNERSHIPS FARM OPERATIONS DATA SCIENCE 8 AeroFarms Has Been Recognized With Over 50 Awards Since 2011: Ranked #1Inaugural Winners The AeroFarms sensor network feeds a vast library of data, collected over 15 years of operations, allowing the company to understand plants at unprecedented levels and solve agriculture-related supply chain problems. AeroFarms partners with leading S&P 500 companies and government agencies, using its growing platform and experience to further provide solutions in agriculture. With over 250 invention disclosures, AeroFarms is constantly developing and improving its proprietary mechanical, operating, environmental and biological systems. AeroFarms built and operates the largest vertical farm in the world and sells great tasting leafy greens. To date, the company has grown over 550 different varieties of fruits and vegetables and uses its understanding of plant biology to optimize farming systems. |
 |
World Class Leadership Team with Decades of Experience Guy Blanchard Chief Financial Officer Andreas Sokollek Chief Operating Officer Marc Oshima Chief Marketing Officer and Co-Founder MaryAlice Feinstein Chief People Officer Roger Buelow Chief Technology Officer Stacy Kimmel, Ph.D. VP of R&D Dane Almassy VP of Sales Mark Boyland General Counsel BACKED BY A STRONG INVESTOR BASE 9 David Rosenberg Chief Executive Officer and Co-Founder ▪ Successful serial entrepreneur, 14+ years leading Silicon Valley VC backed companies ▪ Member of World Economic Forum (WEF) and WEF Global Internet of Things Council ▪ Co-founded and co-chaired WEF YGL Circular Economy Taskforce ▪ 3 Team U.S. Gold Medal National Championships in Fencing and 2 Individual Silver Medals ▪ MBA from Columbia Business School |
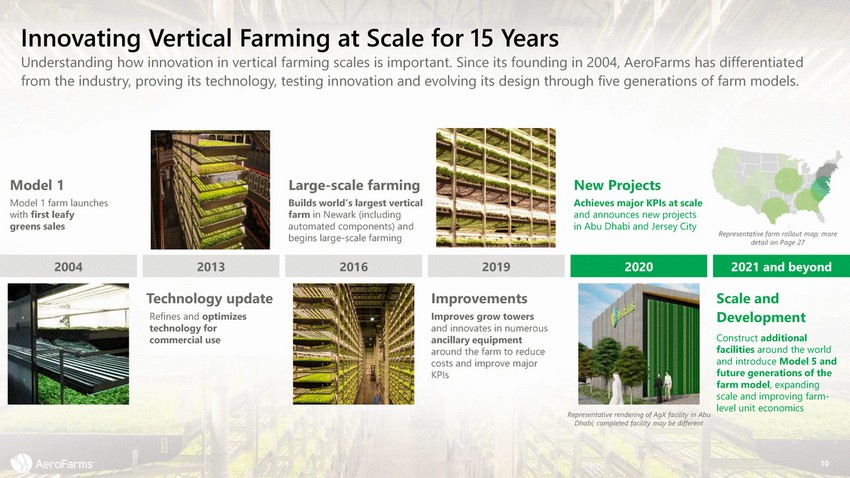 |
Innovating Vertical Farming at Scale for 15 Years Understanding how innovation in vertical farming scales is important. Since its founding in 2004, AeroFarms has differentiated from the industry, proving its technology, testing innovation and evolving its design through five generations of farm models. Model 1 Model 1 farm launches with first leafy greens sales Large-scale farming Builds world’s largest vertical farm in Newark (including automated components) and begins large-scale farming New Projects Achieves major KPIs at scale and announces new projects in Abu Dhabi and Jersey City Representative farm rollout map; more detail on Page 27 2004 2021 and beyond Technology update Improvements Improves grow towers and innovates in numerous ancillary equipment around the farm to reduce costs and improve major KPIs Scale and Development Construct additional facilities around the world and introduce Model 5 and future generations of the farm model, expanding scale and improving farm-level unit economics Refines and optimizes technology for commercial use Representative rendering of AgX facility in Abu Dhabi; completed facility may be different 10 2020 2019 2016 2013 |
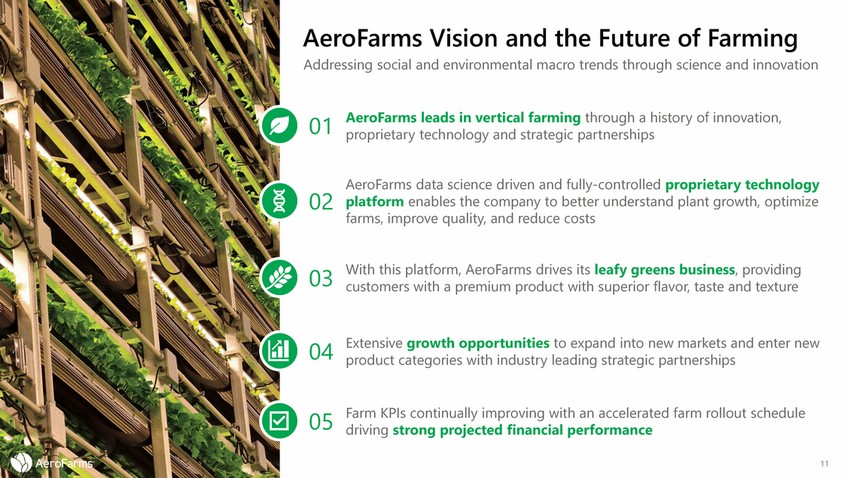 |
AeroFarms Vision and the Future of Farming Addressing social and environmental macro trends through science and innovation AeroFarms leads in vertical farming through a history of innovation, proprietary technology and strategic partnerships 01 AeroFarms data science driven and fully-controlled proprietary technology platform enables the company to better understand plant growth, optimize farms, improve quality, and reduce costs 02 With this platform, AeroFarms drives its leafy greens business, providing customers with a premium product with superior flavor, taste and texture 03 Extensive growth opportunities to expand into new markets and enter new product categories with industry leading strategic partnerships 04 Farm KPIs continually improving with an accelerated farm rollout schedule driving strong projected financial performance 05 11 |
 |
01 The AeroFarms Opportunity 12 |
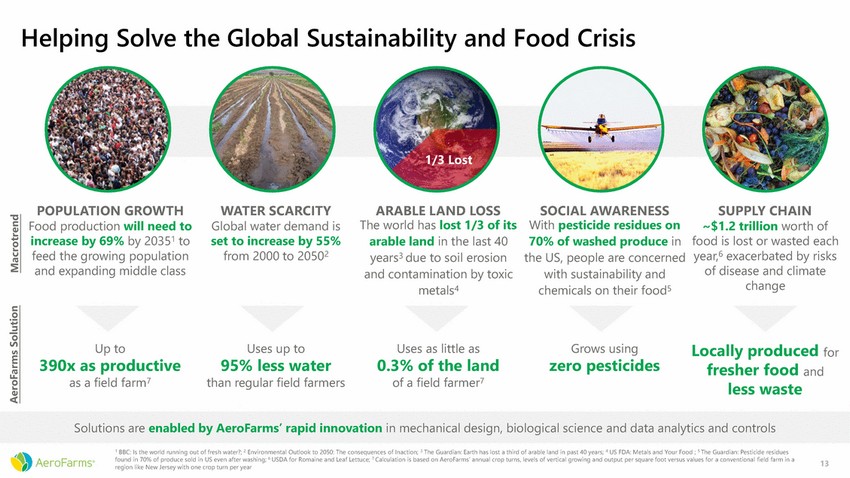 |
Helping Solve the Global Sustainability and Food Crisis 1/3 Lost POPULATION GROWTH Food production will need to increase by 69% by 20351 to feed the growing population and expanding middle class WATER SCARCITY Global water demand is set to increase by 55% from 2000 to 20502 ARABLE LAND LOSS The world has lost 1/3 of its arable land in the last 40 years3 due to soil erosion and contamination by toxic metals4 SOCIAL AWARENESS With pesticide residues on 70% of washed produce in the US, people are concerned with sustainability and chemicals on their food5 SUPPLY CHAIN ~$1.2 trillion worth of food is lost or wasted each year,6 exacerbated by risks of disease and climate change Up to 390x as productive as a field farm7 Uses up to 95% less water than regular field farmers Uses as little as 0.3% of the land of a field farmer7 Grows using zero pesticides Locally produced for fresher food less waste and Solutions are enabled by AeroFarms’ rapid innovation in mechanical design, biological science and data analytics and controls 1 BBC: Is the world running out of fresh water?; 2 Environmental Outlook to 2050: The consequences of Inaction; 3 The Guardian: Earth has lost a third of arable land in past 40 years; 4 US FDA: Metals and Your Food ; 5 The Guardian: Pesticide residues found in 70% of produce sold in US even after washing; 6 USDA for Romaine and Leaf Lettuce; 7 Calculation is based on AeroFarms’ annual crop turns, levels of vertical growing and output per square foot versus values for a conventional field farm in a region like New Jersey with one crop turn per year 13 AeroFarms Solution Macrotrend |
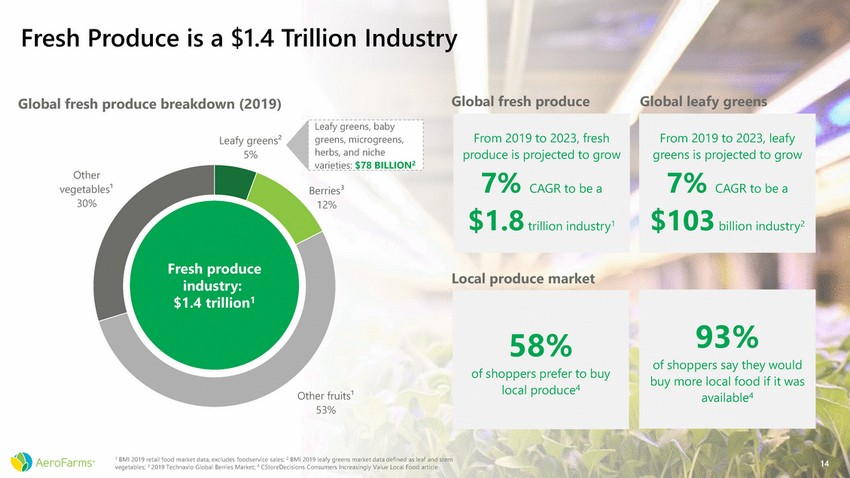 |
Fresh Produce is a $1.4 Trillion Industry Global fresh produce Global leafy greens Global fresh produce breakdown (2019) Leafy greens² 5% Other v egetables¹ 30% Berries³ 12% Fresh produce industry: $1.4 trillion1 Local produce market of shoppers say they would Other fruits¹ 53% 1 BMI 2019 retail food market data, excludes foodservice sales; 2 BMI 2019 leafy greens market data defined as leaf and stem vegetables; 3 2019 Technavio Global Berries Market; 4 CStoreDecisions Consumers Increasingly Value Local Food article 14 93% buy more local food if it was available4 58% of shoppers prefer to buy local produce4 Leafy greens, baby greens, microgreens, herbs, and niche varieties: $78 BILLION2 From 2019 to 2023, leafy greens is projected to grow 7% CAGR to be a $103 billion industry2 From 2019 to 2023, fresh produce is projected to grow 7% CAGR to be a $1.8 trillion industry1 |
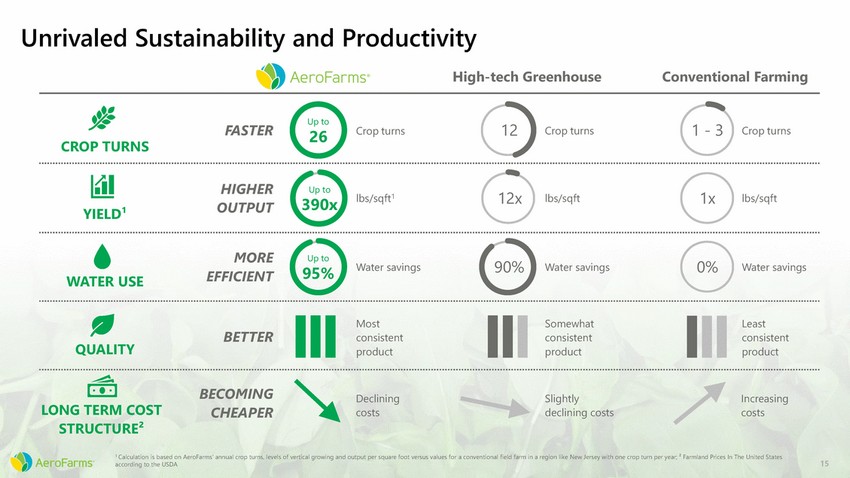 |
Unrivaled Sustainability and Productivity High-tech Greenhouse Conventional Farming Up to 12 1 - 3 FASTER Crop turns Crop turns Crop turns 26 CROP TURNS HIGHER OUTPUT Up to 12x 1x lbs/sqft1 lbs/sqft lbs/sqft 390x YIELD¹ MORE EFFICIENT Up to 90% 0% Water savings Water savings Water savings 95% WATER USE Most consistent product Somewhat consistent product Least consistent product BETTER QUALITY BECOMING CHEAPER Declining costs Slightly declining costs Increasing costs LONG TERM COST STRUCTURE² 1 Calculation is based on AeroFarms’ annual crop turns, levels of vertical growing and output per square foot versus values for a conventional field farm in a region like New Jersey with one crop turn per year; ² Farmland Prices In The United States according to the USDA 15 |
 |
02 Technology Platform 16 |
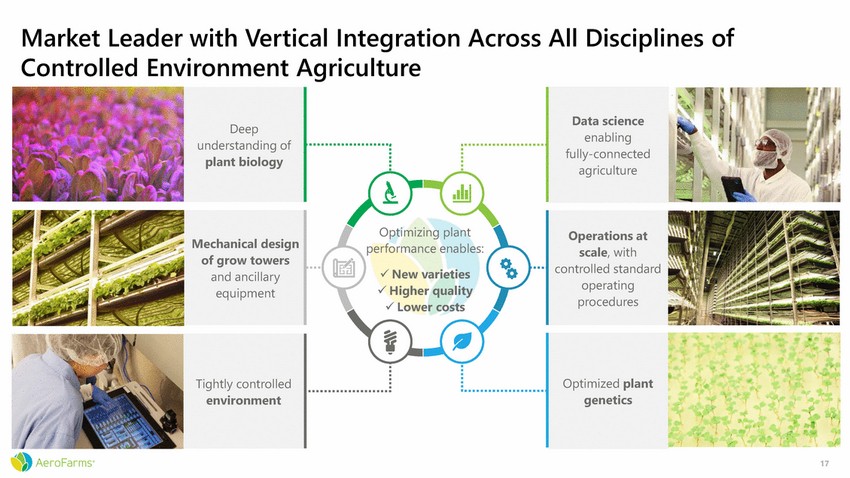 |
Market Leader with Vertical Integration Across All Disciplines of Controlled Environment Agriculture understanding of Optimizing plant performance enables: ✓ New varieties ✓ Higher quality ✓ Lower costs 17 Tightly controlled environment Optimized plant genetics Mechanical design of grow towers and ancillary equipment Operations at scale, with controlled standard operating procedures Deep plant biology Data science enabling fully-connected agriculture |
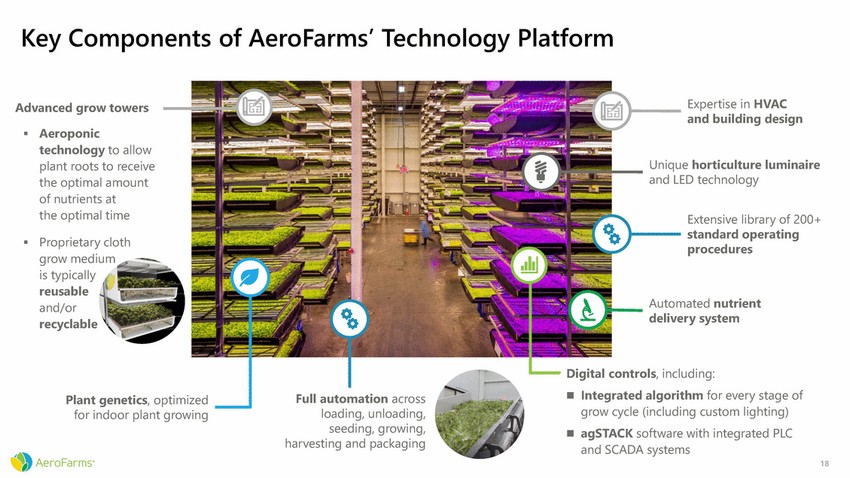 |
Key Components of AeroFarms’ Technology Platform Expertise in HVAC and building design Advanced grow towers Aeroponic technology to allow plant roots to receive the optimal amount of nutrients at the optimal time ▪ Unique horticulture luminaire and LED technology Extensive library of 200+ standard operating procedures Proprietary cloth grow medium is typically reusable and/or recyclable ▪ Automated nutrient delivery system Digital controls, including: Integrated algorithm for every stage of grow cycle (including custom lighting) agSTACK software with integrated PLC and SCADA systems ◼ Full automation across loading, unloading, seeding, growing, harvesting and packaging Plant genetics, optimized for indoor plant growing ◼ 18 |
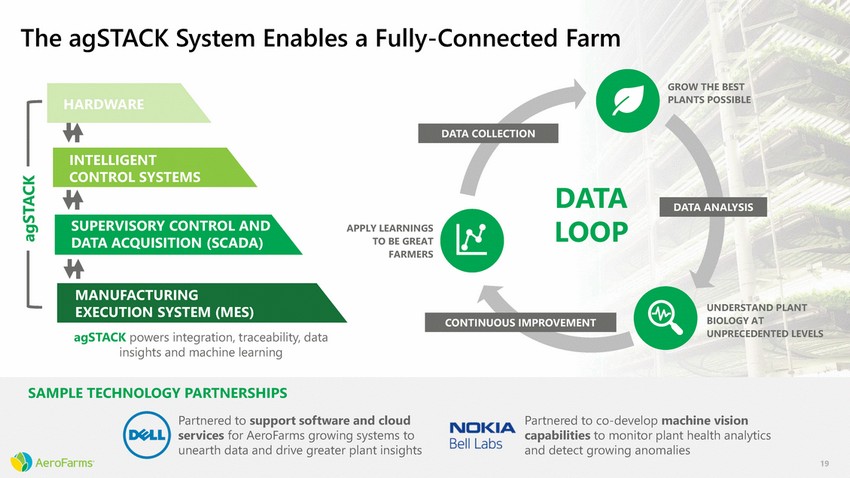 |
The agSTACK System Enables a Fully-Connected Farm GROW THE BEST PLANTS POSSIBLE SYSTEMS DATA LOOP ROL AND APPLY LEARNINGS TO BE GREAT FARMERS (SCADA) UNDERSTAND PLANT BIOLOGY AT UNPRECEDENTED LEVELS (MES) agSTACK powers integration, traceability, data insights and machine learning SAMPLE TECHNOLOGY PARTNERSHIPS Partnered to support software and cloud services for AeroFarms growing systems to unearth data and drive greater plant insights Partnered to co-develop machine vision capabilities to monitor plant health analytics and detect growing anomalies 19 agSTACK CONTINUOUS IMPROVEMENT MANUFACTURING EXECUTION SYSTEM SUPERVISORY CONT DATA ACQUISITION DATA ANALYSIS INTELLIGENT CONTROL DATA COLLECTION HARDWARE |
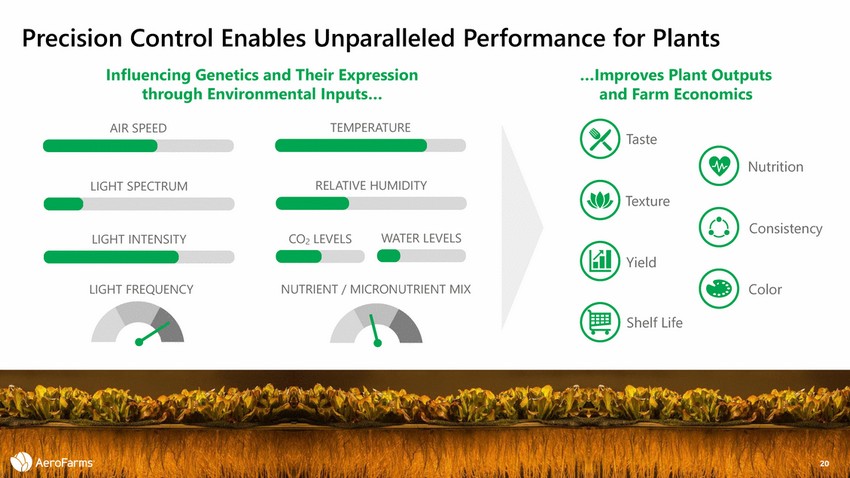 |
Precision Control Enables Unparalleled Influencing Genetics and Their Expression Performance for Plants …Improves Plant Outputs and Farm Economics through Environmental Inputs… TEMPERATURE AIR SPEED Taste Nutrition RELATIVE HUMIDITY LIGHT SPECTRUM Texture Consistency WATER LEVELS CO2 LEVELS LIGHT INTENSITY Yield Color LIGHT FREQUENCY NUTRIENT / MICRONUTRIENT MIX Shelf Life 20 |
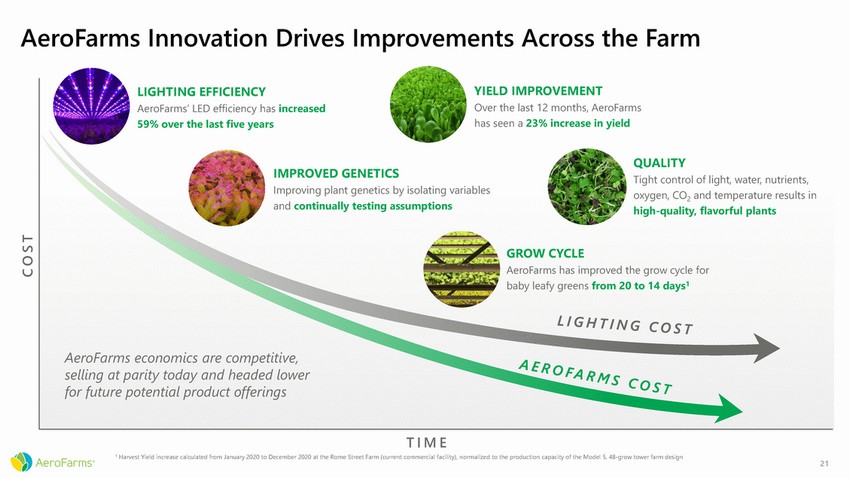 |
AeroFarms Innovation Drives Improvements Across the Farm IMPROVED GENETICS Tight control of light, water, nutrients, and continually testing assumptions high-quality, flavorful plants T I M E 1 Harvest Yield increase calculated from January 2020 to December 2020 at the Rome Street Farm (current commercial facility), normalized to the production capacity of the Model 5, 48-grow tower farm design 21 C O S T LIGHTING EFFICIENCYYIELD IMPROVEMENT AeroFarms’ LED efficiency has increasedOver the last 12 months, AeroFarms 59% over the last five yearshas seen a 23% increase in yield QUALITY Improving plant genetics by isolating variablesoxygen, CO2 and temperature results in GROW CYCLE AeroFarms has improved the grow cycle for baby leafy greens from 20 to 14 days1 AeroFarms economics are competitive, selling at parity today and headed lower for future potential product offerings |
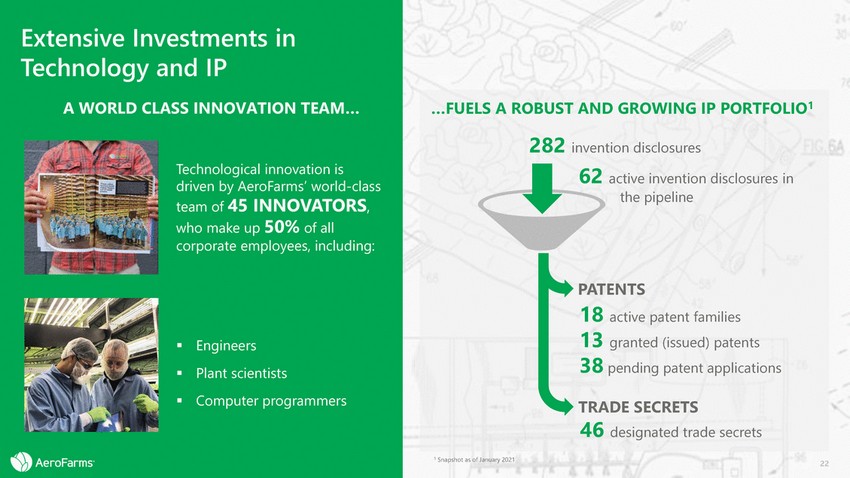 |
Extensive Investments in Technology and IP A WORLD CLASS INNOVATION TEAM… Technological innovation is driven by AeroFarms’ world-class team of 45 INNOVATORS, who make up 50% of all corporate employees, including: ▪ ▪ ▪ Engineers Plant scientists Computer programmers 1 Snapshot as of January 2021 22 …FUELS A ROBUST AND GROWING IP PORTFOLIO1 282 invention disclosures 62 active invention disclosures in the pipeline PATENTS 18 active patent families 13 granted (issued) patents 38 pending patent applications TRADE SECRETS 46 designated trade secrets |
 |
03 Scaling the Leafy Greens Opportunity 23 |
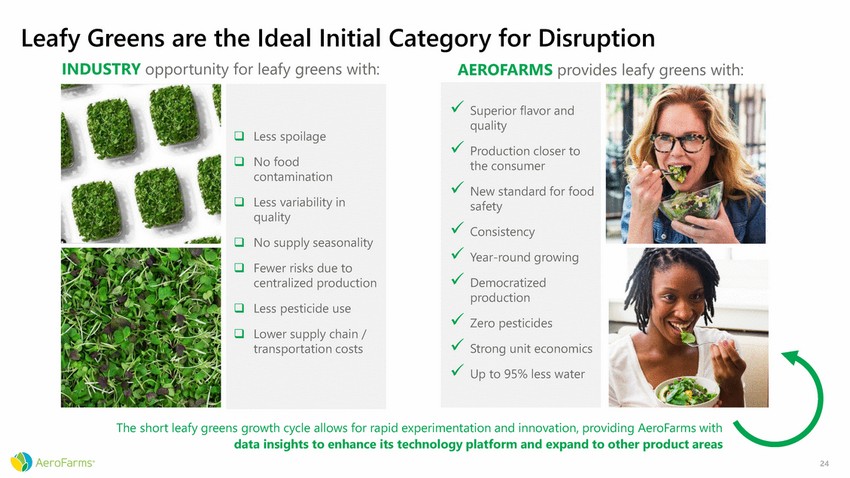 |
Leafy Greens are the Ideal Initial Category for Disruption INDUSTRY opportunity for leafy greens with: AEROFARMS provides leafy greens with: contamination quality centralized production transportation costs The short leafy greens growth cycle allows for rapid experimentation and innovation, providing AeroFarms with data insights to enhance its technology platform and expand to other product areas 24 ❑Less spoilage ❑No food ❑Less variability in ❑No supply seasonality ❑ Fewer risks due to ❑Less pesticide use ❑Lower supply chain / ✓ Superior flavor and quality ✓ Production closer to the consumer ✓ New standard for food safety ✓ Consistency ✓ Year-round growing ✓ Democratized production ✓ Zero pesticides ✓ Strong unit economics ✓ Up to 95% less water |
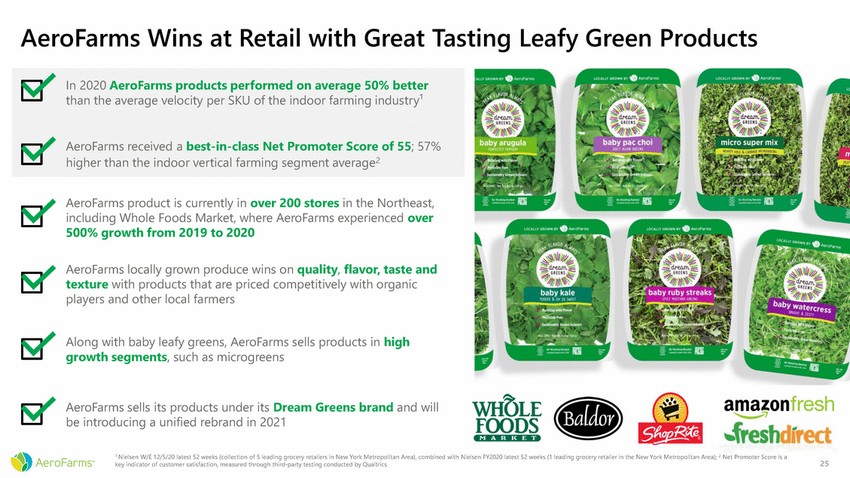 |
AeroFarms Wins at Retail with Great Tasting Leafy Green Products AeroFarms product is currently in over 200 stores in the Northeast, including Whole Foods Market, where AeroFarms experienced over 500% growth from 2019 to 2020 AeroFarms locally grown produce wins on quality, flavor, taste and texture with products that are priced competitively with organic players and other local farmers Along with baby leafy greens, AeroFarms sells products in high growth segments, such as microgreens AeroFarms sells its products under its Dream Greens brand and will be introducing a unified rebrand in 2021 1 Nielsen W/E 12/5/20 latest 52 weeks (collection of 5 leading grocery retailers in New York Metropolitan Area), combined with Nielsen FY2020 latest 52 weeks (1 leading grocery retailer in the New York Metropolitan Area); 2 Net Promoter Score is a key indicator of customer satisfaction, measured through third-party testing conducted by Qualtrics 25 In 2020 AeroFarms products performed on average 50% better than the average velocity per SKU of the indoor farming industry¹ AeroFarms received a best-in-class Net Promoter Score of 55; 57% higher than the indoor vertical farming segment average2 |
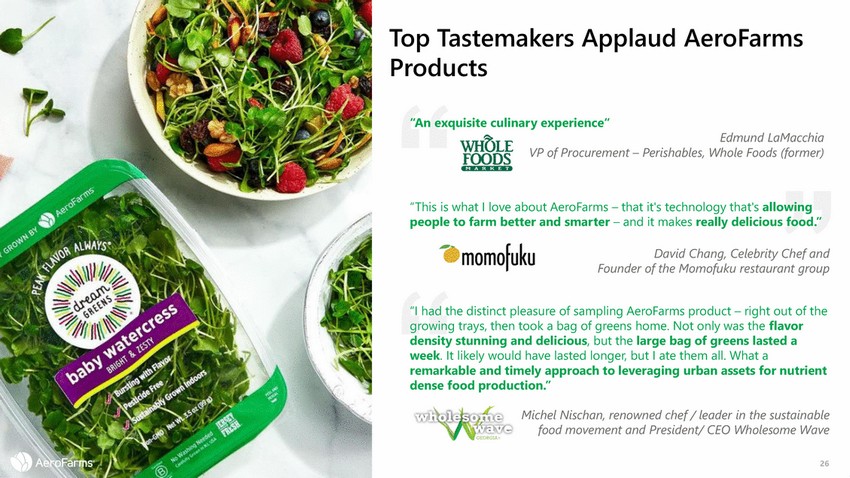 |
Top Tastemakers Applaud AeroFarms Products “An exquisite culinary experience“ Edmund LaMacchia VP of Procurement – Perishables, Whole Foods (former) “This is what I love about AeroFarms – that it's technology that's allowing people to farm better and smarter – and it makes really delicious food.” David Chang, Celebrity Chef and Founder of the Momofuku restaurant group “I had the distinct pleasure of sampling AeroFarms product – right out of the growing trays, then took a bag of greens home. Not only was the flavor density stunning and delicious, but the large bag of greens lasted a week. It likely would have lasted longer, but I ate them all. What a remarkable and timely approach to leveraging urban assets for nutrient dense food production.” Michel Nischan, renowned chef / leader in the sustainable food movement and President/ CEO Wholesome Wave 26 |
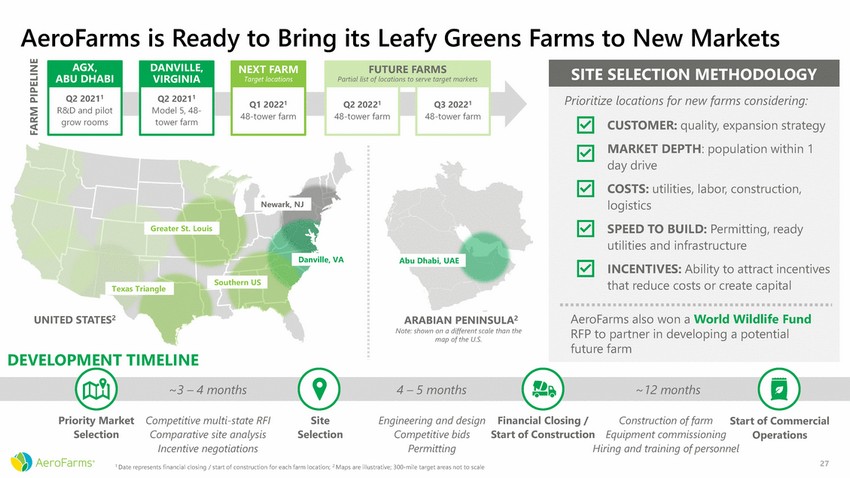 |
AeroFarms is Ready to Bring its Leafy Greens Farms to New Markets RE FARMS ons to Q1 2022 Q2 2022 Q3 2022 Newark, NJ Greater St. Louis Danville, VA Abu Dhabi, UAE Southern US Texas Triangle UNITED STATES2 ARABIAN PENINSULA2 Note: shown on a different scale than the map of the U.S. DEVELOPMENT TIMELINE ~3 – 4 months 4 – 5 months ~12 months Priority Market Selection Competitive multi-state RFI Comparative site analysis Incentive negotiations Site Selection Engineering and design Competitive bids Permitting Financial Closing / Start of Construction Construction of farm Equipment commissioning Start of Commercial Operations Hiring and training of personnel 27 1 Date represents financial closing / start of construction for each farm location; 2 Maps are illustrative; 300-mile target areas not to scale FARM PIPELINE SITE SELECTION METHODOLOGY Prioritize locations for new farms considering: CUSTOMER: quality, expansion strategy MARKET DEPTH: population within 1 day drive COSTS: utilities, labor, construction, logistics SPEED TO BUILD: Permitting, ready utilities and infrastructure INCENTIVES: Ability to attract incentives that reduce costs or create capital AeroFarms also won a World Wildlife Fund RFP to partner in developing a potential future farm FUTU Partial list of locati serve target markets 1 48-tower farm 1 48-tower farm NEXT FARM Target locations 1 48-tower farm DANVILLE, VIRGINIA Q2 20211 Model 5, 48-tower farm AGX, ABU DHABI Q2 20211 R&D and pilot grow rooms |
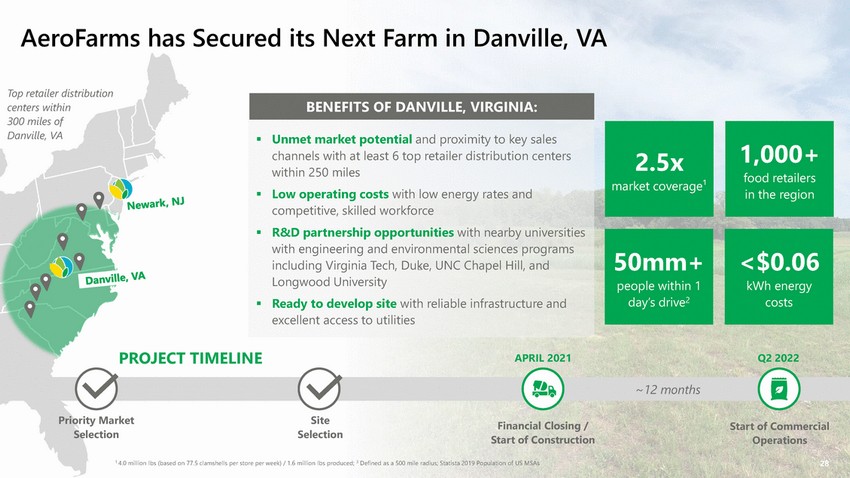 |
AeroFarms has Secured its Next Farm in Danville, VA Top retailer distribution centers within 300 miles of Danville, VA food retailers PROJECT TIMELINE APRIL 2021 Q2 2022 ~12 months Priority Market Selection Site Selection Financial Closing / Start of Construction Start of Commercial Operations 1 4.0 million lbs (based on 77.5 clamshells per store per week) / 1.6 million lbs produced; 3 Defined as a 500 mile radius; Statista 2019 Population of US MSAs 28 <$0.06 kWh energy costs 50mm+ people within 1 day’s drive2 2.5x market coverage¹ 1,000+ in the region BENEFITS OF DANVILLE, VIRGINIA: ▪Unmet market potential and proximity to key sales channels with at least 6 top retailer distribution centers within 250 miles ▪Low operating costs with low energy rates and competitive, skilled workforce ▪R&D partnership opportunities with nearby universities with engineering and environmental sciences programs including Virginia Tech, Duke, UNC Chapel Hill, and Longwood University ▪Ready to develop site with reliable infrastructure and excellent access to utilities |
 |
04 Growing Beyond Greens Leafy 29 |
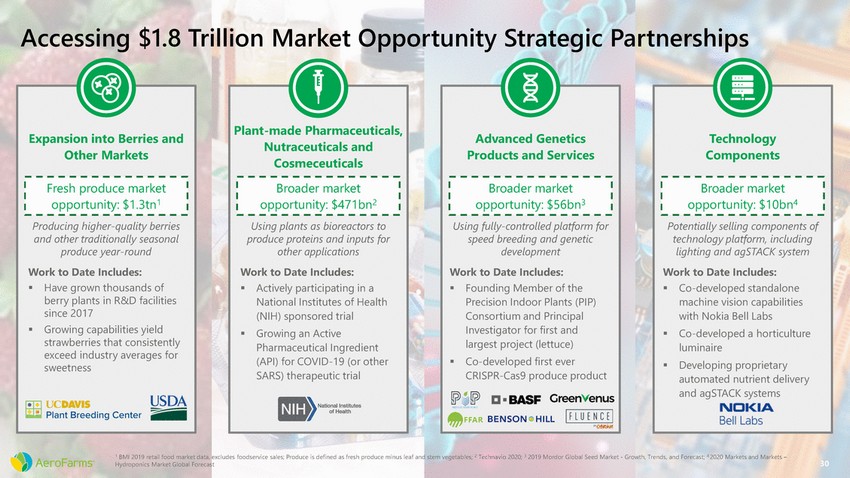 |
Accessing $1.8 Trillion Market Opportunity Strategic Partnerships Components luminaire automated nutrient delivery 1 BMI 2019 retail food market data, excludes foodservice sales; Produce is defined as fresh produce minus leaf and stem vegetables; 2 Technavio 2020; 3 2019 Mordor Global Seed Market - Growth, Trends, and Forecast; 4 2020 Markets and Markets – Hydroponics Market Global Forecast 30 Technology Potentially selling components of technology platform, including lighting and agSTACK system Work to Date Includes: ▪Co-developed standalone machine vision capabilities with Nokia Bell Labs ▪Co-developed a horticulture ▪Developing proprietary and agSTACK systems Broader market opportunity: $10bn4 Advanced Genetics Products and Services Using fully-controlled platform for speed breeding and genetic development Work to Date Includes: ▪Founding Member of the Precision Indoor Plants (PIP) Consortium and Principal Investigator for first and largest project (lettuce) ▪Co-developed first ever CRISPR-Cas9 produce product Broader market opportunity: $56bn3 Plant-made Pharmaceuticals, Nutraceuticals and Cosmeceuticals Using plants as bioreactors to produce proteins and inputs for other applications Work to Date Includes: ▪Actively participating in a National Institutes of Health (NIH) sponsored trial ▪Growing an Active Pharmaceutical Ingredient (API) for COVID-19 (or other SARS) therapeutic trial Broader market opportunity: $471bn2 Expansion into Berries and Other Markets Producing higher-quality berries and other traditionally seasonal produce year-round Work to Date Includes: ▪Have grown thousands of berry plants in R&D facilities since 2017 ▪Growing capabilities yield strawberries that consistently exceed industry averages for sweetness Fresh produce market opportunity: $1.3tn1 |
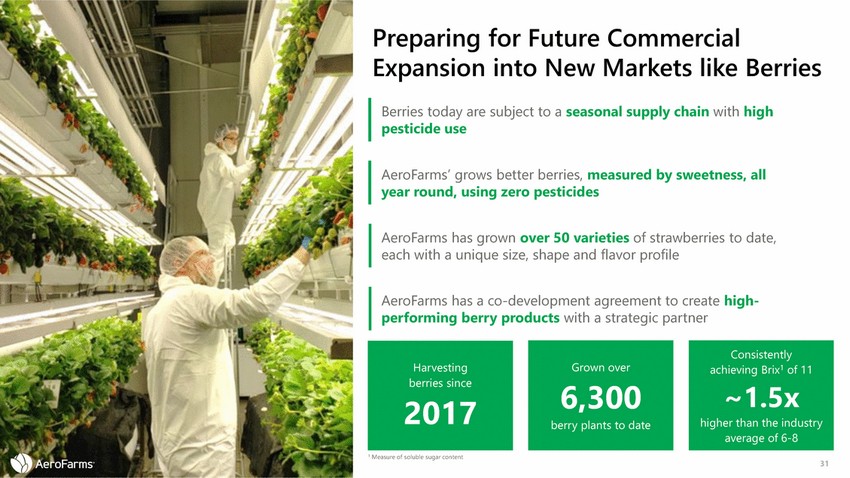 |
Preparing for Future Commercial Expansion into New Markets like Berries Berries today are subject to a seasonal supply chain with high pesticide use AeroFarms’ grows better berries, measured by sweetness, all year round, using zero pesticides AeroFarms has grown over 50 varieties of strawberries to date, each with a unique size, shape and flavor profile AeroFarms has a co-development agreement to create high-performing berry products with a strategic partner higher than the industry 1 Measure of soluble sugar content 31 Consistently achieving Brix1 of 11 ~1.5x average of 6-8 Grown over 6,300 berry plants to date Harvesting berries since 2017 |
 |
05 Financial Projections 32 |
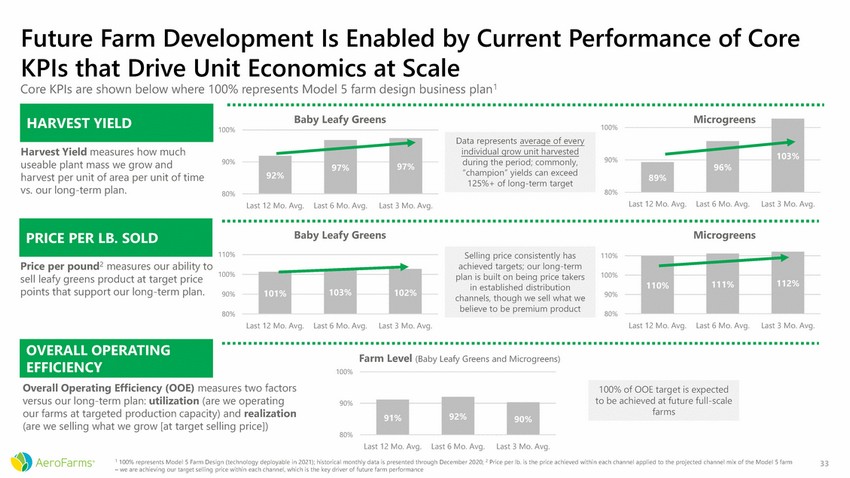 |
Future Farm Development Is Enabled by Current KPIs that Drive Unit Economics at Scale Core KPIs are shown below where 100% represents Model 5 farm design business plan1 Performance of Core Baby Leafy Greens Microgreens 100% 100% Harvest Yield measures how much useable plant mass we grow and harvest per unit of area per unit of time vs. our long-term plan. 90% 90% 80% 80% Last 12 Mo. Avg. Last 6 Mo. Avg. Last 3 Mo. Avg. Last 12 Mo. Avg.Last 6 Mo. Avg. Last 3 Mo. Avg. Baby Leafy Greens Microgreens 110% 110% Price per pound2 measures our ability to sell leafy greens product at target price points that support our long-term plan. 100% 100% 90% 90% 80% 80% Last 12 Mo. Avg. Last 6 Mo. Avg. Last 3 Mo. Avg. Last 12 Mo. Avg. Last 6 Mo. Avg. Last 3 Mo. Avg. Farm Level (Baby Leafy Greens and Microgreens) 100% Overall Operating Efficiency (OOE) measures two factors versus our long-term plan: utilization (are we operating our farms at targeted production capacity) and realization (are we selling what we grow [at target selling price]) 90% 80% Last 12 Mo. Avg.Last 6 Mo. Avg. Last 3 Mo. Avg. 1 100% represents Model 5 Farm Design (technology deployable in 2021); historical monthly data is presented through December 2020; 2 Price per lb. is the price achieved within each channel applied to the projected channel mix of the Model 5 farm – we are achieving our target selling price within each channel, which is the key driver of future farm performance 33 92% 91% 90% 100% of OOE target is expected to be achieved at future full-scale farms OVERALL OPERATING EFFICIENCY 103% 102% 101% 110%111% 112% Selling price consistently has achieved targets; our long-term plan is built on being price takers in established distribution channels, though we sell what we believe to be premium product PRICE PER LB. SOLD 97% 97% 92% Data represents average of every individual grow unit harvested during the period; commonly, “champion” yields can exceed 125%+ of long-term target 103% 96% 89% HARVEST YIELD |
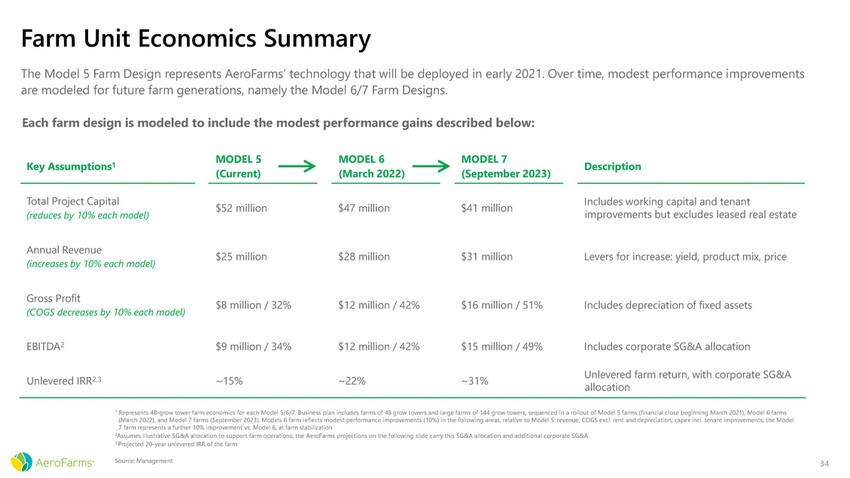 |
Farm Unit Economics Summary The Model 5 Farm Design represents AeroFarms’ technology that will be deployed in early 2021. Over time, modest performance improvements are modeled for future farm generations, namely the Model 6/7 Farm Designs. Each farm design is modeled to include the modest performance gains described below: improvements but excludes leased real estate allocation 1 Represents 48-grow tower farm economics for each Model 5/6/7. Business plan includes farms of 48 grow towers and large farms of 144 grow towers, sequenced in a rollout of Model 5 farms (financial close beginning March 2021), Model 6 farms (March 2022), and Model 7 farms (September 2023). Models 6 farm reflects modest performance improvements (10%) in the following areas, relative to Model 5: revenue, COGS excl. rent and depreciation, capex incl. tenant improvements; the Model 7 farm represents a further 10% improvement vs. Model 6, at farm stabilization 2Assumes illustrative SG&A allocation to support farm operations; the AeroFarms projections on the following slide carry this SG&A allocation and additional corporate SG&A 3 Projected 20-year unlevered IRR of the farm Source: Management 34 Key Assumptions1 MODEL 5MODEL 6MODEL 7 (Current)(March 2022)(September 2023) $52 million$47 million$41 million $25 million$28 million$31 million $8 million / 32%$12 million / 42%$16 million / 51% $9 million / 34%$12 million / 42%$15 million / 49% ~15%~22%~31% Description Total Project Capital (reduces by 10% each model) Annual Revenue (increases by 10% each model) Gross Profit (COGS decreases by 10% each model) EBITDA2 Unlevered IRR2,3 Includes working capital and tenant Levers for increase: yield, product mix, price Includes depreciation of fixed assets Includes corporate SG&A allocation Unlevered farm return, with corporate SG&A |
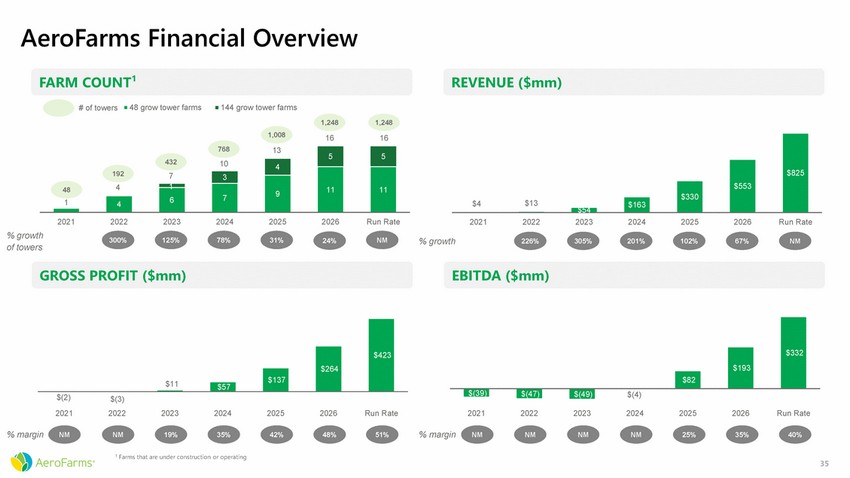 |
AeroFarms Financial Overview FARM COUNT¹ REVENUE ($mm) # of towers 48 grow tower farms 144 grow tower farms 1,248 1,248 1,008 16 16 48 2021 2022 2023 2024 2025 2026 Run Rate 2021 2022 2023 2024 2025 2026 Run Rate % growth of towers 300% 125% 78% 31% 24% NM % growth 226% 305% 201% 102% 67% NM GROSS PROFIT ($mm) EBITDA ($mm) $(2) 2021 $(3) 2022 2023 2024 2025 2026 Run Rate 2021 2022 2023 2024 2025 2026 Run Rate % margin % margin NM NM 19% 35% 42% 48% 51% NM NM NM NM 25% 35% 40% 1 Farms that are under construction or operating 35 $332 $193 $82 $(39) $(47) $(49) $(4) $423 $264 $137 $11 $57 76813 5 5 43210 4 11 11 1927 3 9 4 7 6 1 4 $825 $553 $330 $4$13 $163 |
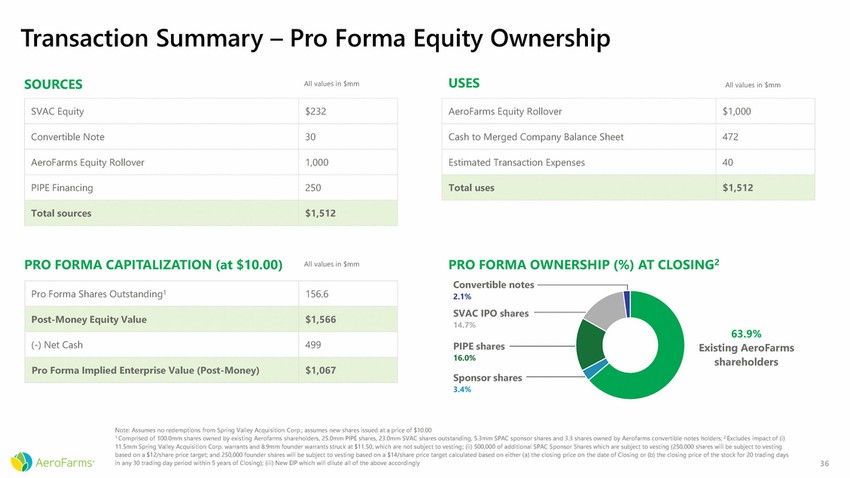 |
Transaction Summary – Pro Forma Equity Ownership USES SOURCES All values in $mm All values in $mm PRO FORMA CAPITALIZATION (at $10.00) PRO FORMA OWNERSHIP (%) AT CLOSING2 All values in $mm Convertible notes 2.1% SVAC IPO shares 14.7% 63.9% Existing AeroFarms shareholders PIPE shares 16.0% Sponsor shares 3.4% Note: Assumes no redemptions from Spring Valley Acquisition Corp.; assumes new shares issued at a price of $10.00 1 Comprised of 100.0mm shares owned by existing Aerofarms shareholders, 25.0mm PIPE shares, 23.0mm SVAC shares outstanding, 5.3mm SPAC sponsor shares and 3.3 shares owned by Aerofarms convertible notes holders; 2 Excludes impact of (i) 11.5mm Spring Valley Acquisition Corp. warrants and 8.9mm founder warrants struck at $11.50, which are not subject to vesting; (ii) 500,000 of additional SPAC Sponsor Shares which are subject to vesting (250,000 shares will be subject to vesting based on a $12/share price target; and 250,000 founder shares will be subject to vesting based on a $14/share price target calculated based on either (a) the closing price on the date of Closing or (b) the closing price of the stock for 20 trading days in any 30 trading day period within 5 years of Closing); (iii) New EIP which will dilute all of the above accordingly 36 Pro Forma Shares Outstanding1 156.6 Post-Money Equity Value $1,566 (-) Net Cash 499 Pro Forma Implied Enterprise Value (Post-Money) $1,067 AeroFarms Equity Rollover $1,000 Cash to Merged Company Balance Sheet 472 Estimated Transaction Expenses 40 Total uses $1,512 SVAC Equity $232 Convertible Note 30 AeroFarms Equity Rollover 1,000 PIPE Financing 250 Total sources $1,512 |
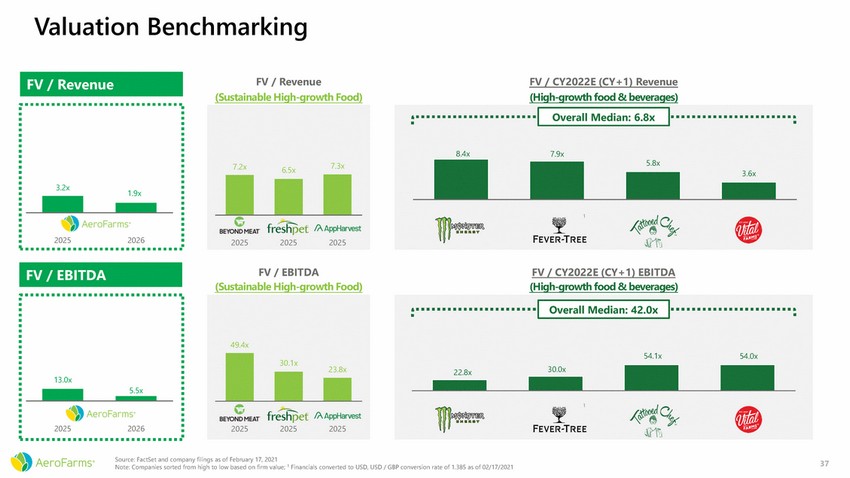 |
Valuation Benchmarking FV / Revenue (Sustainable High-growth Food) FV / CY2022E (CY+1) Revenue (High-growth food & beverages) 1.9x FV / EBITDA (Sustainable High-growth Food) FV / CY2022E (CY+1) EBITDA (High-growth food & beverages) Source: FactSet and company filings as of February 17, 2021 Note: Companies sorted from high to low based on firm value; 1 Financials converted to USD, USD / GBP conversion rate of 1.385 as of 02/17/2021 37 54.1x54.0x 1 Monster BeverageFevertree DrinksTattooed ChefVital Farms Corporation 22.8x30.0x Overall Median: 42.0x 49.4x 202520252025 30.1x 23.8x 13.0x 20252026 5.5x FV / EBITDA 8.4x7.9x 1 Monster BeverageFevertree DrinksTattooed ChefVital Farms Corporation 5.8x 3.6x Overall Median: 6.8x 7.2x6.5x7.3x 202520252025 3.2x 20252026 FV / Revenue |
 |
AeroFarms Company Highlights AeroFarms has a 15+ year track record of vertical farming at scale and an expert management team that is revolutionizing the farming industry Technology and data are a competitive differentiator and moat for AeroFarms AeroFarms sells leafy greens commercially with a brand that is winning at retail and with potential development partners A substantial pipeline of farm projects and a Total Addressable Market of $1.8T represents an enormous opportunity for expansion AeroFarms has increasingly attractive unit economics across multiple new farm models 38 |
 |
Bringing agriculture to new heights through technology and innovation THANK YOU 39 |