Attached files
| file | filename |
|---|---|
| EX-32.1 - EXHIBIT 32.1 - I-ON Digital Corp. | brhc10022207_ex32-1.htm |
| EX-31.1 - EXHIBIT 31.1 - I-ON Digital Corp. | brhc10022207_ex31-1.htm |
| EX-21.1 - EXHIBIT 21.1 - I-ON Digital Corp. | brhc10022207_ex21-1.htm |
UNITED STATES
SECURITIES AND EXCHANGE COMMISSION
WASHINGTON, D.C. 20549
FORM 10-K
(Mark One)
☒ ANNUAL REPORT PURSUANT TO SECTION 13 OR 15(d) OF THE SECURITIES EXCHANGE ACT OF 1934
For the fiscal year ended December 31, 2020
☐ TRANSITION REPORT PURSUANT TO SECTION 13 OR 15(d) OF THE SECURITIES EXCHANGE ACT OF 1934
For the transition period from ______________to ______________
Commission File Number 000-549995
|
I-ON DIGITAL CORP.
|
(Exact name of registrant as specified in its charter)
(formerly known as I-ON Digital Corp.)
|
Delaware
|
46-3031328
|
|
|
(State or Other Jurisdiction of Incorporation or Organization)
|
(I.R.S. Employer Identification Number)
|
|
15, Teheran-ro 10-gil, Gangnam-gu, Seoul, Korea
|
06234
|
|
|
(Address of Principal Executive Offices)
|
(Zip Code)
|
+82-2-3430-1200
(Registrant’s Telephone Number, Including Area Code)
Securities registered pursuant to Section 12(b) of the Act:
|
Title of each class
|
Name of each exchange on which registered
|
|
|
Common Stock, par value $0.0001 per share
|
OTCQB
|
Securities registered pursuant to Section 12(g) of the Act:
None
Indicate by check mark if the registrant is a well-known seasoned issuer, as defined in Rule 405 of the Securities Act. Yes ☐ No ☒
Indicate by check mark if the registrant is not required to file reports pursuant to Section 13 or 15(d) of the Exchange Act. Yes ☐ No ☒
Indicate by check mark whether the registrant (1) has filed all reports required to be filed by Section 13 or 15(d) of the Exchange Act of 1934 during the past 12 months (or for such shorter period that the registrant
was required to file such reports), and (2) has been subject to such filing requirement for the past 90 days. Yes ☒ No ☐
Indicate by check mark whether the registrant has submitted electronically every Interactive Data File required to be submitted pursuant to Rule 405 of Regulation S-T (§ 232.405 of this chapter) during the preceding 12
months (or for such shorter period that the registrant was required to submit such files). Yes ☒ No ☐
Indicate by check mark if disclosure of delinquent filers in response to Item 405 of Regulation S-K is not contained herein, and will not be contained, to the best of the registrant’s knowledge, in definitive proxy or
information statements incorporated by reference in Part III of this Form 10-K or any amendment to this Form 10-K. ☐
Indicate by check mark whether the registrant is a large accelerated filer, an accelerated filer, a non-accelerated filer, smaller reporting company, or an emerging growth company. See the definitions of “large
accelerated filer,” “accelerated filer,” “smaller reporting company,” and “emerging growth company” in Rule 12b-2 of the Exchange Act.
|
Large accelerated filer ☐
|
Accelerated filer ☐
|
|
Non-accelerated filer ☒
|
Smaller reporting company ☒
|
|
Emerging growth company ☐
|
If an emerging growth company, indicate by check mark if the registrant has elected not to use the extended transition period for complying with any new or revised financial accounting standards provided pursuant to
Section 13(a) of the Exchange Act. ☐
Indicate by check mark whether the registrant has filed a report on and attestation to its management’s assessment of the effectiveness of internal control over financial reporting under Section 404(b) of the
Sarbanes-Oxley Act (15 U.S.C. 7762(b)) by the registered public accounting firm that prepared or issued its audit report. ☐
Indicate by check mark whether the registrant is a shell company (as defined in Rule 12b-2 of the Exchange Act).
Yes ☐ No ☒
As of June 30, 2020 (the last business day of the registrant’s most recently completed second fiscal quarter), the aggregate market value of the common stock held by non-affiliates of the registrant was approximately
$2.8 million based on the closing sales price of $0.08 on the OTC Markets. All executive officers and directors of the registrant have been deemed, solely for the purpose of the foregoing calculation, to be “affiliates” of the registrant.
As of March 22, 2021, there were approximately 35,030,339 shares of the registrant’s common stock outstanding.
DOCUMENTS INCORPORATED BY REFERENCE:
None.
|
PART I
|
Page
|
|
|
Item 1.
|
2
|
|
|
Item 1A
|
13
|
|
|
Item 1B
|
21
|
|
|
Item 2.
|
21
|
|
|
Item 3.
|
21
|
|
|
Item 4.
|
21
|
|
|
PART II
|
||
|
Item 5.
|
22
|
|
|
Item 6.
|
23
|
|
|
Item 7.
|
23
|
|
|
Item 7A
|
28
|
|
|
Item 8.
|
28
|
|
|
Item 9.
|
28
|
|
|
Item 9A
|
28
|
|
|
Item 9B.
|
28
|
|
|
PART III
|
||
|
Item 10.
|
29
|
|
|
Item 11.
|
30
|
|
|
Item 12.
|
32
|
|
|
Item 13.
|
32
|
|
|
Item 14.
|
32
|
|
|
PART IV
|
||
|
Item 15.
|
33
|
|
|
36
|
||
PART I
|
SPECIAL NOTE ON FORWARD-LOOKING STATEMENTS
The information in this report contains forward-looking statements. All statements other than statements of historical fact made in this report are forward looking. In particular, the
statements herein regarding industry prospects and future results of operations or financial position are forward-looking statements. These forward-looking statements can be identified by the use of words such as “believes,” “estimates,”
“intends”, “plans”, “could,” “possibly,” “probably,” anticipates,” “projects,” “expects,” “may,” “will,” or “should,” “designed to,” “designed for,” or other variations or similar words or language. No assurances can be given that the future
results anticipated by the forward-looking statements will be achieved. Forward-looking statements reflect management’s current expectations and are inherently uncertain. Our actual results may differ significantly from management’s
expectations.
Although these forward-looking statements reflect the good faith judgment of our management, such statements can only be based upon facts and factors currently known to us. Forward-looking
statements are inherently subject to risks and uncertainties, many of which are beyond our control. As a result, our actual results could differ materially from those anticipated in these forward-looking statements as a result of various
factors, including those set forth below under the caption “Risk Factors.” For these statements, we claim the protection of the safe harbor for forward-looking statements contained in the Private Securities Litigation Reform Act of 1995. You
should not unduly rely on these forward-looking statements, which speak only as of the date on which they were made. They give our expectations regarding the future but are not guarantees. We undertake no obligation to update publicly or
revise any forward-looking statements, whether as a result of new information, future events or otherwise, unless required by law.
|
Organization and Corporate History
I-ON Digital Corp. (formerly known as I-ON Communications Corp.) was incorporated under the laws of the State of Delaware on June 18, 2013 as ALPINE 3 Inc. Alpine 3 Inc. was set up to serve as a vehicle to effect an
asset acquisition, merger, exchange of capital stock or other business combination with a domestic or foreign business. ALPINE 3 did not undertake any effort to cause a market to develop in its securities, either debt or equity, before it
successfully concluded a business combination. On April 4, 2014, The Michael J. Rapport Trust (the “Trust”) purchased 10,000,000 shares of common stock which was all of the outstanding shares of Alpine 3, Inc., and subsequently changed the name to
Evans Brewing Company Inc. (“EBC”) on May 29, 2014. On October 9, 2014 the Trust agreed to the cancellation of 9,600,000 of the shares of common stock that it had acquired and retained 400,000 shares of common stock.
On October 15, 2014, Bayhawk and EBC entered into an Asset Purchase and Share Exchange Agreement (the “Agreement”), subject to receiving approval of the independent Bayhawk shareholders who voted on the transaction. On
September 17, 2015, the independent Bayhawk shareholders approved the agreement and Bayhawk sold to EBC and EBC purchased from Bayhawk assets of Bayhawk, including but not limited to the assets relating to the Bayhawk Ales label and the Evans Brands
(collectively, the “Transferred Assets”). Bayhawk retained ownership of 100% of the stock in Evans Brewing Corp. (CA) (“Evans Brewing California”) which has the brewers license at City Brewery in Lacrosse, WI. Based on the affirmative vote by the
independent Bayhawk shareholders to approve the Asset Purchase transaction, EBC proceeded with the share exchange and tender offer to the Bayhawk shareholders, pursuant to which EBC offered to exchange shares of EBC common stock for shares of Bayhawk
common stock, on a one-for-one basis (the “Exchange Offer”). At the close of the share exchange on December 2, 2015, 4,033,863 Bayhawk shares were accepted and exchanged for 4,033,863 shares of EBC common stock.
On January 25, 2018, Evans Brewing Company, Inc. consummated an Agreement of Merger and Plan of Reorganization (the “Merger Agreement”), with I-ON Digital Corp.., a company organized under the laws of the Republic of
Korea (South Korea) (“I-ON”) and I-ON Acquisition Corp., a wholly-owned subsidiary of the Company (“Acquisition”). Pursuant to the terms of the Merger Agreement, Acquisition merged with and into I-ON in a statutory reverse triangular merger (the
“Merger”) with I-ON surviving as a wholly-owned subsidiary of the Registrant. As consideration for the Merger, the Registrant agreed to issue the shareholders of I-ON (the “I-ON Holders”) an aggregate of 26,000,000 shares of our Common Stock, in
accordance with their pro rata ownership of I-ON capital stock. Following the Merger, the Registrant adopted the business plan of I-ON in information technology consultancy and software development. On December 14, 2017, in connection with the
Merger, the Company’s Board of Directors approved an amendment to its Certificate of Incorporation (the “Amendment”) to change its name to I-ON Digital Corp.
At the effective time of the Merger, our board of directors and officers were reconstituted by the appointment of Jae Cheol James Oh as Chairman, Chief Executive Officer, and Chief Financial Officer, Hong Rae Kim as
Executive Director and Jae Ho Cho as Director. Michael Rapport resigned as President, Chief Executive Officer, and Chairman in connection with the Transaction and Evan Rapport resigned as Vice President and Director, Kenneth Wiedrich resigned as
Chief Financial Officer and Director and Kyle Leingang resigned as Secretary. Roy Robertson, Mark Lamb, Joe Ryan, and Kevin Hammons resigned as members of the Board of Directors and their respective committees.
On March 21, 2019, the Company’s Board of Directors approved an amendment to the Company’s Certificate of Incorporation to change the name of the Company to I-ON Digital Corp. The Company filed a Certificate of
Amendment to effectuate the name change on or about April 2, 2019.
I-ON Digital
Following the Merger, the Company adopted the business plan of I-ON. I-ON was founded by Jae Cheol James Oh, who currently serves as CEO. The Company’s roots are in IT consultancy and software development. I-ON
services South Korea’s enterprise content management system’s (CMS) market and specializes in advancing market-leading internet software applications to capitalize on rapidly growing market sectors.
After being awarded its first of numerous international patents in 2003, I-ON has since evolved into an industry-leading and recognized software developer and provider of on-premise and cloud-based enterprise-class
unstructured data management, digital experience and digital marketing software and solutions. I-ON’s portfolio of software and solutions serves the digital marketing and technology needs of organizations, enabling clients to create, measure, and
optimizes digital experiences for their audiences across marketing channels and devices. We believe these solutions help clients reduce the cost of content management and delivery, while increasing the return on their investments in digital
communication and marketing spend. As of its founding, the Company has serviced and continues to service over 1,000 blue-chip and middle-market clients across virtually all verticals in both private and public sectors. The Company has
meaningfully expanded its reach over the past decade and now currently markets, licenses and sells its products and services directly to clients in South Korea and Japan, as well as in Singapore, Malaysia, Indonesia, Thailand, Vietnam, and the U.S.
through value-added resellers and partnerships.
I-ON currently holds 6 international and over 20 domestic patents for both products and methodologies built into the 10 product offerings the Company currently has at market. These encompass enterprise CMS, digital
experience and service delivery software, digital marketing, smart mobility and analytics tools, and, more recently, energy management solutions as well as sports software and IT convergence services. Beginning in the fourth quarter of 2018, the
Company started endorsing its 7th generation cloud based Digital Experience (DXP) platform as a service offering known as ICE, which encompasses a more feature-rich front and back end CMS. The Company has designed and developed industry-leading
technologies that are compliant with global standards including GS (Good Software) and NET (New Excellent Technology). I-ON also holds numerous domestic and global industry awards, earning high rankings and recognition from the likes of Gartner
(Magic Quadrant 2014) and Red Herring (2014 Asia Top 100 Winner), among many others.
In addition to South Korea, Japan has particularly helped fuel I-ON’s growth over the past 10 years owing to the success of an exclusive licensing deal with Ashisuto, a large Japan-based technology services firm that
employs approximately 800 technical, engineering and marketing staff across 9 office locations. Ashisuto, which has provided technology services to Japan’s enterprises and government entities since 1973, currently white labels and sells I-ON’s
core CMS offering ICS6 to over 600 clients as NOREN 6.
As a result of global enterprise digital marketing trends and I-ON’s nearly 20 -year track record in South Korea, Japan and now, Southeast Asia, the Company’s objective is to continue to gain market share in these
markets. I-ON will continue to closely engage and consult with existing and prospective clients as their subject matter expert and digital strategist of choice across multiple touchpoints in the digital marketing and technology ecosystem, helping
Chief Marketing Officers (CMO) and Chief Information Officers (CIO) drive critical change and growth for their organizations.
I-ON has invested and continues to spend substantial revenue on research and development. The Company has over 120 employees as of December 31, 2019, approximately 95% of whom are considered full-time. Research and
development typically comprises of approximately 80 junior, mid to senior level engineers and developers, most of whom are based at the Company’ headquarters located at 15 Teheran-ro 10-gil, Gangnam-gu, Seoul, South Korea, 06234.
PRODUCTS AND SERVICES
I-ON’s product line is comprised of:
|
Enterprise CMS & Digital Experience (IaaS/PaaS):
|
|
|
I-ON Content Server - ICS6
|
I-ON Content Application Framework Engine - ICAFE
|
|
I-ON Deploy Server - IDS
|
I-ON Content Ecosystem - ICE
|
|
I-ON Digital Asset Management System - IDAS
|
|
|
I-ON Web Analytics Server
|
|
Software as a Service (SaaS) :
|
Energy Management Solutions :
|
|
Distributed Repository Service - GAIA
|
Load Aggregator’s Management System - LAMS
|
|
iDrive - E-Document Management System
|
- Demand Resource Management
|
|
e.Form - mobile contract platform
Assist9 – mobile ERP dashboard
|
- DLMS/COSEM -Advanced two-way metering infrastructure
|
Sports & IT Convergence Service
Ticket Advanced Marketing Management – TAMM- pro-sports marketing & analytics
VoiceBall – Amateur League Umpire & Data Service
The following is a brief description of I-ON’s key products:
ICS6 (I-ON Content Server) – ICS6 is I-ON’s generation 6 web content management system that helps reduce burdens of complex website management by organizing vast amounts of
ever-increasing digital content and big data into physical directory and logical site structure. ICS6 is one of South Korea’s first-to-market cloud-based CMS platforms and a market share leader in both Korea & Japan.
ICE (I-ON Content Ecosystem) - ICE is I-ON’s 7th generation DXP offering that manages the digital content management lifecycle commencing from creation, registration,
distribution, deletion, billing to analytics. ICE is geared for SOs seeking ways to enhance business to business to consumer (B2B2C) value.
IDS (I-ON Deploy Server) – IDS, in conjunction with ICS6, securely, conveniently and automatically deploys files and content between servers when distribution inefficiencies and
services issues arise.
IDAS (I-ON Digital Asset Management System) – IDAS, in conjunction with ICS6, ensures a virtuous cycle of an organization’s digital assets through an integrated framework that
collects, manages, deploys and distributes content. It also provides ample storage and categorization functionalities necessary to address high multi-media content demand including high-resolution video. The software supports digital archiving,
scalability and changes in physical environment.
iCAFE (I-ON Content Application Framework Engine) – iCAFE is a content delivery platform optimized for N-Screen environments, offering a
robust wire-wireless service delivery platform for broadcasting, imaging & mobile content
e.Form – e.Form is a one-stop mobile contract solution for smartphones and tablets that digitizes and expedites document creation and execution processes for organizations. The
platform supports over 200 application programming interfaces (APIs).
iDrive – iDrive is a SaaS-based EDMS (e-document management system) which centralizes all categories of e-documents within an organization, iDrive is geared for streamlining and
managing the e-document lifecycle from creation, approval, archiving to destruction.
GAIA – GAIA is a back-end unstructured data repository platform that manages a cloud-based ecosystem that enterprises or individuals can use to build and share mobile
applications.
LAMS (Load Aggregator’s Management System) - LAMS is one of South Korea’s first Open ADR 2.0-based demand response management solutions designed to manage and reduce electricity
consumption and peak demand through demand response program participation.
TAMM (Ticket Admission Marketing Management) - TAMM is a mobile B2B2C platform that integrates and manages the professional sports event experience from marketing and promotion
and ticket purchases and reservations to the delivery of a mobile analytics dashboard for followers. Event organizers/sponsors have included, among others, the LPGA Hana Bank Championship and SK Telecom Open. I-ON acquired the core TAMM developers
and intellectual property from South Korea-based MoceanPeople in March 2016.
Assist9 – Assist9 is a mobile all-in-one work flow process and data management dashboard geared towards small and medium-sized businesses and startups. Core functions revolve
around ERP, PMS, SFA, HR, and e-approval – with up to fifteen others- and are designed to improve operational efficiencies and provide CEOs with greater analytical insight into their businesses.
ADDRESSABLE MARKETS
South Korea, Japan and Southeast Asia
Econsultancy and Adobe reported in recent studies that less than 15% of CMO respondents identified as working for digital-first organizations, despite a study by Forrester Research that indicated 51% of B2B enterprises
were ratcheting up digital marketing initiatives in 2018 and into 2019. A key driver of I-ON’s ability to tap further into existing and future addressable markets, the Company believes, will depend on how quickly mid to large enterprises can adopt a
digital-first mindset through continued client engagement.
According to many industry researchers, such as Forrester and Gartner, the combined enterprise digital marketing and CMS sector in South Korea and Japan is expected to generate a high single digit compounded annual
growth rate to over $800 million by 2020.
Given its market share-leading in both South Korea and Japan, I-ON remains uniquely positioned to serve as a localized partner and to address the evolving marketing needs of mid to large enterprises. CMOs continue to
seek new and innovative ways to analyze, improve return on investment (ROI) and justify the value of increased digital marketing spending.
According to numerous industry sources, including Forbes, South Korea has emerged as one of Asia’s fastest growing technology startup hubs, attracting increasing investment from domestic funds and foreign investment.
Today, South Korea remains the eleventh largest economy in the world and, with 51 million people, the twenty-eighth largest population in the world, while boasting the world’s highest broadband penetration at 97%.
South Korea was recently highlighted in Bloomberg’s list of most innovative countries, owing to the country’s research and development intensity, as well as productivity and educational standards. Home to Samsung, Hyundai and over 10 other Fortune
500 companies, South Korea, for the past several decades, has also been on a path pivoting from big industry and manufacturing to transformative technology, thanks to government and private/public partnership initiatives. Favorable policy
initiatives have recently led to larger budget allocation towards science and technology, matching funds with international investors, establishing international entrepreneurship programs at universities, opening up many of the country’s research
institutes, and providing safety nets for technologists and scientists that take capital risk.
Similarly, Japan remains the third largest economy and second largest developed economy in the world, the third largest automobile manufacturing, and the largest electronics goods industry in the world. Despite being
home to over 50 Fortune 500 companies, and facing growing competition from China and South Korea, manufacturing and investment in Japan have also pivoted toward software development, high-technology, and precision goods sectors, such as robotics and
optical instruments.
Asia-Pacific and Global
Across not only South Korea and Japan, but the entire Asia-Pacific region, businesses and consumers today increasingly demand personalized content and experiences in their online interactions, across multiple digital
channels and devices. This is accelerating growth in the CMS and digital marketing arenas as well demand from marketers seeking solutions that optimize customers’ experiences, demonstrate the success of their programs with objective metrics, and
deliver the greatest return on their marketing spend.
According to Gartner, the enterprise CMS market across the Asia-Pacific region, which includes China, South Korea, Hong Kong, Japan, Indonesia, Malaysia, Singapore and Vietnam – exceeded $700 million in 2016, up
significantly from $500 million in 2014 and is projected to exceed $900 million by 2019, reflecting a compounded annual growth rate of at least 12%. Malaysia, Indonesia and Singapore collectively generated $180 million in enterprise CMS revenue last
year and Gartner projects a 16% annual growth rate into 2020.
In North America, aggregate digital marketing spend, which includes CMS for both products and professional services by both mid and large-sized enterprises, exceeded $135 billion in 2016 from approximately $95 billion
in 2014, and according to forecasts from both IDC and Statista, is projected to grow 18% annually to over $225 billion by 2019.
Globally, sources such as the CMO Council and Gartner estimate the current web and mobile digital marketing industry size at $450 billion, while forecasting a high single digit 5 year compounded annual growth rate to
over $600 billion by 2019.
MARKETING AND GROWTH STRATEGY
Growth in omni-channel DXP, digital marketing and big data
CMS and digital marketing budgets at global brands continue to increase relative to traditional marketing dollars, according to Gartner and many CMO surveys, which describe a general atmosphere keen on shifting
marketing dollars towards ROI enhancing tools such as audience analytics and curation, consumer engagement, smart mobility and artificial intelligence. In South Korea, existing and prospective clients across many sectors are often consulting with
I-ON on how best to integrate disparate and increasingly complex needs, which may for example apply digital asset management, e-commerce, sports software and SaaS capabilities. As competition has been intensifying, the pace of overall M&A
activity has also been accelerating as small and mid-size players such as I-ON, seek to diversify and address the trends and demands. Accordingly, enterprise CMS globally is being viewed less as tools for building web pages and standard analytics,
but more so as vital software and value-added solutions that can help drive the effectiveness of often complex, data driven and expensive digital strategies and marketing campaigns. Interoperability remains a key differentiator across the dynamic
South Korean and East Asian markets. Companies small and large, particularly those with intricate distribution and supply chain responsibilities, not only require a portal for their intranet for external needs, but demand that their CMS software
facilitate a real-time connection between the business, people and things that allow all to communicate, transact and even negotiate with each other across all touch points. As a result, I-ON also intends to play further into the unstructured and
big data, analytics, e-commerce and smart mobility arenas as part of its DXP offering.
Defining Value Proposition
I-ON believes it remains uniquely positioned to address the evolving digital experience and marketing needs of medium to large enterprises. Given the growth across the global enterprise digital marketing spectrum and
I-ON’s 19-year track record serving a marquee clientele in South Korea, Japan, and parts of Southeast Asia, I-ON’s objective is to continue to aggressively gain market share by closely engaging with existing and prospective clients, while driving
sales for both its core CMS offering and complementary solutions that enable organizations to transform traditional marketing initiatives into analytics and data-driven strategies vital to delivering measurable results.
I-ON believes that its software products and solutions will continue to be a primary revenue source for the Company over time and that its growing portfolio of products may generate profitable demand for associated
maintenance, support, implementation, consulting, and training services that the Company, and a channel of licensees and value-added resellers (VARs), can provide.
Near-term, I-ON intends to do the following to drive organic growth:
| ∙ |
Continue to leverage knowledge and experience into new or enhanced solutions and products
|
| ∙ |
Continue to deploy secure pilot environments for prospective customers to evaluate and envision additional uses for customized application development
|
| ∙ |
Continue to procure contracts directly, via strategic partnerships and increasing sales personnel
|
| ∙ |
Recruit seasoned executives as well as younger talent to utilize unique training model that addresses resource shortages
|
| ∙ |
Incubate and build-out focused profitable technology practices
|
| ∙ |
Continue to participate in multi-lateral joint research and development projects in concert with its partners across many different countries
|
South East Asia
According to Gartner, Malaysia, Indonesia and Singapore generated $180 million in enterprise CMS revenue last year and project a 16% annual growth rate by 2020. As a result, I-ON intends to continue to build off of
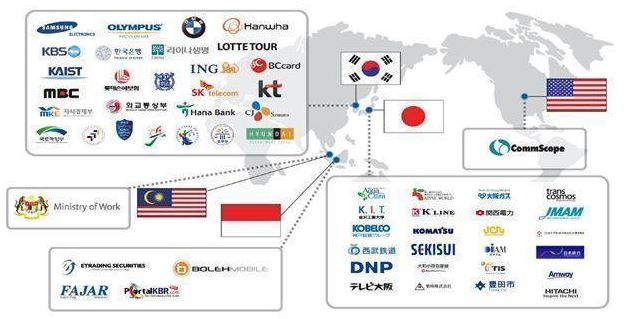
its initial successes in the Southeast Asia region, which include, among other projects, the following: implementation of a fully integrated mobile/online trading solution for Malaysia’s MNC Securities; a CMS implementation for a leading USA cable
manufacturer, Commscope- supporting 13 languages to meet global standards; the implementation of a CMS solution based on CSDP (Convergence Service Delivery Platform) for Indonesia’s BOLEH Mobile; and an integration of CMS platforms for the Malaysia
Ministry of Works.
Announced on October 1, 2018, I-ON and Singapore-based Hyper Resources Interactive Pte Ltd. executed an MoU whereby Hyper Resources will assist with marketing and utilize I-ON’s core CMS suite of ICS6, IDAS, IDS, ICS
and eForm solutions to address the needs of Singaporean enterprises. I-ON will assist with operational and technical support as well as solutions training.
Sports ICT
I-ON absorbed the TAMM team and technology in 2016. Currently the exclusive and secure web and mobile payment gateway provider for the KLGPA and technology partners with most of the major sponsors of the events, TAMM
and its next generation omni-channel sports data management solution are well-positioned to address the $5 billion global sports software market, which is projected to increase at a 13% CAGR through 2024. Significant global investment in sports
infrastructure including stadiums, complexes and leagues has been the leading driver of sports software development and implementation, which helps organizers automate various administrative functions, ticket sales, promotions, as well as player and
game management utilizing both cloud-based and on-premise technology. North America currently holds a market share of close to 60% and is expected to continue its dominant trend through 2024, according to Hexa Research.
As announced in 2018, I-ON formed a partnership with the Ministry of Culture, Sports and Tourism and the Korea Institute of Sports Science to develop a domestic multi-sport marketing and analytics platform addressing
amateur and pro golf and baseball participants and engagement. The initiative also integrates reputable University research and high-tech private sector resources. More recently in January 2019, I-ON announced a letter of intent, subject to a
multi-year framework, with California-based Pacific Pro Football league, a new amateur-pro D-league targeting future NFL recruits, which is led by a distinguished team of former NFL executives, players and coaches. The engagement represents I-ON’s
initial foray into the US market with respect to TAMM and sports software initiatives. I-ON’s scope of service is broad, but entails building out the league’s CMS infrastructure while serving as their digital strategist of choice leading up to the
2020 league launch and well beyond. This could be in association with Pacific Pro’s exclusive sponsor Adidas.
Energy ICT
In early 2018, I-ON and its various partners including Japan-based TIS INTEC Group – a leading systems integrator- began a deeper dive on how to best address the fast-growing need for distributed energy management and
virtual power plant (VPP) solutions for grid connected renewable energy sources in hopes of delivering an enhanced, reliable energy and cost-efficient product offering to East Asia markets. By employing key components of I-ON’s energy management
system to address the demand response needs of power grid companies, I-ON intends to introduce its own proprietary next generation VPP solution that operate within cloud-based service environments to address the energy management needs of
enterprises.
Popular in the U.S. and Europe, but a rapidly emerging sector in Japan and across East Asia, VPP is a cloud-based distributed power plant that aggregates the capacities of energy resources at the requests of power
transmission and distribution service providers for the purposes of enhancing power generation more reliably. VPP typically integrates small-scale power plants or energy storage facilities for residential settings, buildings, factories and
incorporates them into a remotely controlled virtual power station using a sophisticated set of software and IT systems. These systems tap into existing grid networks to tailor electricity supply and demand services under changing load conditions
both quickly and in real time, thus maximizing value for both the power generator and end user. Most industry observers currently peg the global VPP industry at $8-$12 billion -- double from just a few years ago -- and forecast the industry will
grow annually at a mid to high double-digit rate through 2025, driven by investment in the U.S., Europe and Australia with South Korea and Japan leading the way in East Asia.
Announced on November 21, 2018, Sweden-based Telenor Connexion and I-ON formed a collaboration agreement in order to provide South Korean customers in the energy sector with high-value and quality IoT solutions and
services by utilizing I-ON’s capabilities in data management, smart mobility, and advanced analytics.
Acquisition Strategy
I-ON intends to continue to leverage its international partnerships and ongoing success in enterprise CMS to move upstream, cross-sell, and serve clients more directly as either their digital strategist of choice
and/or by acquiring businesses with (i) a revenue producing platform with existing enterprise clients, (ii) subject matter expertise and or (iii) rights to intellectual property in at least one of the following digital marketing-related disciplines:
predictive analytics, smart mobility, marketing automation, search engine optimization (SEO), enterprise resource planning (ERP), workflow automation, and eCommerce. I-ON has already identified multiple compelling acquisition opportunities within
these domains, particularly in South Korea and Japan. However, there can be no assurance that I-ON will be able to acquire one or more of these businesses or that it will be able to do so on terms that are favorable to I-ON.
Notably, I-ON believes that overall macro conditions that drive consolidation and acquisitions also remain ideal including the historical low interest rate environment, a large, evolving and fragmented technology
services and solutions market across South Korea and East Asia, and the relatively low organic growth opportunities that ordinarily may not exist for smaller businesses. These existential conditions could enable I-ON to identify and purchase
compelling assets inexpensively.
Expand Product Offering and Geographic Coverage over the long-term
Over the next 5 years, I-ON’s growth strategy is to significantly expand its client base in South Korea, Japan, and Southeast Asia, while also expanding into new geographic areas, such as the U.S. and Europe to provide
clients with global coverage and around the clock services that CMS and digital marketing requires. I-ON’s continued business model is to allow its work and unique technical skills to attract new clients as well as win repeat projects with past and
current clients. At the same time, ION intends to expand its core offerings and increase brand awareness with new service capabilities and software products that produce significant value for clients.
PATENTS AND TRADEMARKS
Key Patents:
| ∙ |
Integrated certification system using electronic contract #10-1132672
|
| ∙ |
Website construction and management methodology #0457428
|
| ∙ |
Website integrated management system and management methodology #10-0764690
|
| ∙ |
Internet Reaction application reaction survey methodology and systems #0366708
|
| ∙ |
Modification and restoration methodology on comment utilizing digital items #10-0634047
|
| ∙ |
Power Quantity Reduction Compensation System management method #10-1046943
|
| ∙ |
Mobile Chat Systems for Supporting Cartoon Story-Style Communication on Webpage #9973458
|
| ∙ |
Enhancement to Sports Game Assistance System #10223448
|
| ∙ |
I-ON holds over 20 additional domestic patents
|
Key Certifications:
| ∙ |
I-ON e.Form Server Green Technology Certificate #GT-12-00040
|
| ∙ |
I-ON Content Server v6.1 Certificate of Software Quality – GS (Good Software) #14-0017
|
| ∙ |
DRMS OpenADR 2.0a/b Certificate of System Conformance
|
| ∙ |
Certificate for Company Research Institute #20022427
|
AWARDS AND INDUSTRY RECOGNITION HISTORY
|
∙
|
Selected to participate in ‘IP-Star Company development’ project by Seoul Business Agency (2013)
|
|
∙
|
Designated as Best Small and Medium Company Workplace by Small and Medium Business Corporation (2012-2014)
|
|
∙
|
Designated as Global Small Giant Company by Small and Medium Business Administration (2012-2014)
|
|
∙
|
Grand prize at New Software Solution in General Software section by Ministry of Knowledge Economy (2012)
|
|
∙
|
Designated as top Promising Future-Leading Company by Money Today (Economic newspaper 2012)
|
|
∙
|
Certified ‘Promising Export Firm’ by Small and Medium Business Administration (2011-2013)
|
|
∙
|
KOSA (Korea Software Industry Association)
|
|
∙
|
Best prize at 11th Korean Software Companies’ Competitiveness Award - Mobile SW section (2012)
|
|
∙
|
Best prize at 10th Korean Software Companies’ Competitiveness Award– KMS/EMC/BMP section (2011)
|
| ∙ |
Best prize at SoftBank Mobile Solution Contest in Japan (2011)
|
| ∙ |
Citation of Prime Minister awarded on the SW Industrial Day (2011)
|
| ∙ |
Tower of million USD exports award (2007)
|
| ∙ |
Grand prize in Internet Service Section (oneul.com) (2012)
|
| ∙ |
Winner of Brand Service Section (Lotte Duty Free) (2012)
|
| ∙ |
Grand prize in Business Improvement section (e.Form) (2012)
|
| ∙ |
Grand Prize in Information Management (Real-time Power demand resources Operation System) (2012)
|
| ∙ |
Grand Prize in Location Based System (LBS) (Lucky Bird) (2012)
|
| ∙ |
Grand Prize in Product brand (Catch Chevrolet) (2011)
|
| ∙ |
Grand Prize eBook (Kyowon Aesop) (2011)
|
CUSTOMERS
Because organizations in virtually every sector of the economy perform or need the functions I-ON supports, the Company has successfully deployed its software solutions to over 1,000 blue-chip and middle-market
enterprises across virtually all industries and verticals in both the private and public sectors. Such industries include but are not limited to financial services, banking, informational technology services, teleDigital, internet, automotive,
healthcare, publishing, media, education, energy, logistics, retail, consumer and business services, as well as government institutions. Over 400 enterprise clients in South Korea, 500 in Japan, and 100 across Southeast Asia and globally currently
utilize I-ON products, solutions and professional services capabilities.
Given its current foothold, I-ON believes it remains uniquely positioned to address the evolving marketing needs of medium to large enterprises as CMOs continue to lack the wherewithal to analyze, improve ROI, and
justify the value of increased digital marketing spend. I-ON’s diversified product suite, introduction of new products, tools and data sources, combined with media consumption devices such as mobile and tablets have created an environment that’s
been uncharted by numerous enterprise marketers and their CMOs, particularly in South Korea, Japan, Southeast Asia and China.
Below is a sample of I-ON’s clientele based on region.
Entry into new markets combined with relevant new product introductions has also enabled I-ON to diversify its client mix, thereby minimizing client concentration risk as reflected by the decline in top 10 client
contribution since 2013.
Below highlights I-ON’s top 10 clients as percentage of total revenue (Fiscal Years 2017-2020):
|
2017
|
2018
|
2019
|
2020
|
||||||||||||||||||
|
JoongAng Ilbo
|
8.6
|
%
|
KEPCO
|
10.1
|
%
|
SBDC
|
10.8
|
%
|
Samsung SDS
|
18.6
|
%
|
||||||||||
|
KBS
|
6.7
|
%
|
K.K. I-ON
|
7.7
|
%
|
Kyowon Creative
|
8.8
|
%
|
LG CNS
|
12.9
|
%
|
||||||||||
|
Hyundai Auto
|
6.3
|
%
|
Samsung Electro
|
6.5
|
%
|
Finger
|
8.8
|
%
|
K.K I-ON
|
9.7
|
%
|
||||||||||
|
Samsung Electro
|
6.0
|
%
|
SBDC
|
6.5
|
%
|
Amore Pacific
|
7.0
|
%
|
SBDC
|
5.8
|
%
|
||||||||||
|
KTDS
|
5.7
|
%
|
Finger
|
6.3
|
%
|
K.K I-ON
|
6.0
|
%
|
Kyowon Creative
|
5.3
|
%
|
||||||||||
|
K.K. I-ON
|
5.5
|
%
|
Mnwise
|
5.9
|
%
|
SG Tech
|
5.9
|
%
|
SK
|
4.7
|
%
|
||||||||||
|
Jeju Tourism
|
4.8
|
%
|
K.K. Ashisuto
|
4.7
|
%
|
Samsung SDS
|
5.3
|
%
|
Samsung Card
|
3.2
|
%
|
||||||||||
|
KLPGA
|
4.2
|
%
|
Shinhan Card
|
4.7
|
%
|
Seoul School Safety Mutual Aid Association
|
5.3
|
%
|
Shinhan Card
|
3.0
|
%
|
||||||||||
|
YTN
|
4.0
|
%
|
Samsung SDS
|
4.1
|
%
|
Penta Breed
|
3.2
|
%
|
NEO B&S
|
2.6
|
%
|
||||||||||
|
CJ Digital Music
|
3.9
|
%
|
Jeju Tourism
|
3.9
|
%
|
SBS
|
3.0
|
%
|
Finger
|
1.9
|
%
|
||||||||||
|
55.7
|
%
|
60.4
|
%
|
63.4
|
%
|
67.6
|
%
|
||||||||||||||
MARKETING, SALES AND DISTRIBUTION
I-ON relies both on inside and outside sales efforts as well as value-added resellers based in specific geographies to drive a bulk of their business development efforts. The Company has over 100 partners, formal and
informal, across 28 countries that provides client leads The Company also relies on client references and its track record and regularly attends reputable industry and technology conferences internationally.
COMPETITION
The market for I-ON’s products and solutions, primarily in South Korea, Japan and Southeast Asia is competitive but not considerably fragmented. We compete primarily with digital marketing agencies, systems consulting
firms and boutique consulting firms, that maintain specialized skills or products or are geographically focused, and clients’ own IT firms. Many of the firms we compete with have longer operating histories and are more developed than we are. The
principal competitive factors in these addressable markets include the ability to solve problems; the ability to deliver creative concepts and solutions; expertise and talent with advanced technologies; availability of resources; the quality and
speed of solutions; a deep understanding of user experiences; and the price of solutions. I-ON competes favorably when considering these factors and believes that its ability to deliver business innovation and outstanding value to its clients on
time and on budget, along with its successful track record, distinguishes them from competitors.
Interoperability has emerged as a key differentiator in I-ON’s addressable markets, as CMS is now seldom viewed as a stand-alone system for an enterprise’s online presence. Large enterprises and to a growing extent
small and middle market companies, particularly those with complex distribution and supply chain issues, not only require a portal for their intranet for external needs, but expect CMS platforms to allow for a real-time connection between the
business, people, behavior and things that allow all to communicate, transact and even negotiate with each other. Thus, in order to be better served and remain competitive in their own circles, clients are increasingly looking to I-ON to consult
with and integrate disparate and increasingly complex systems.
In addition to holding a first mover advantage, I-ON has been able to compete by offering flexible and often less expensive pricing, offering time-tested & proven licensing joint venture partnerships such as with
Ashisuto in Japan and focusing on R&D to drive product upgrade cycles such as ICE and introduce new products built off existing technology related to sports, energy and mobile. From a domestic DXP front, I-ON competes with companies such as
deCos Interactive and contentWise. Much larger competitors such as Adobe, Stellent, and IBM which service at significantly higher prices and complexity, lack mid-market cachet, are not built locally for scale, or are merely focused on other
disciplines. Opensource models tend to have a truer SME focus, are vague & lack vendor responsibilities, and do not address the needs of complex large to blue-chip enterprises.
RESEARCH AND DEVELOPMENT
Because the verticals in which I-ON competes are characterized by rapid technological change, the Company’s ability to compete successfully depends upon maintaining and enhancing expertise in its core business segments
and product lines. As a result, I-ON has reinvested and continues to spend substantial revenue on research and development. The Company currently employs over 100 junior, mid to senior level engineers and developers, most of whom are based at the
Company’s headquarters in Seoul. In order enable its employees to provide expert, timely, competitive services to the marketplace, I-ON also provides ongoing training and sponsors advanced university education to enhance employee skills and
knowledge of all current and future product offerings.
MANAGEMENT AND EMPLOYEES
As of December 31, 2020, I-ON has 127 full time and 1 part time employees. We believe we enjoy good employee relations. None of our employees are members of any labor union, and we are not a party to any collective
bargaining agreement.
PROPERTIES
The Company does not own any physical location. I-ON currently leases its corporate headquarters and other offices in Seoul, South Korea which expires on December 31, 2021. I-ON’s lease for its Tokyo, Japan office
expires on May 25, 2021. We believe that our current offices are sufficient in size for current and future operations.
POTENTIAL FUTURE PROJECTS AND CONFLICTS OF INTEREST
Members of the Company’s management may serve in the future as an officer, director or investor in other entities. Neither the Company nor any of its shareholders would have any interest in these other companies’
projects. Management believes that it has sufficient resources to fully discharge its responsibilities for all current and future projects.
GOVERNMENT REGULATION
We believe we are in compliance with applicable federal, state and other regulations and that we have compliance programs in place to ensure compliance going forward. There are no regulatory notifications or actions
pending.
LEGAL MATTERS
None.
RELATED PARTY TRANSACTIONS
The Company receives loan guarantees from the chief executive officer with regards to its long-term borrowing, and the Company’s restricted cash provided as collateral to the Company’s chief executive officer’s loans.
Available Information
We will make available free of charge any of our filings as soon as reasonably practicable after we electronically file these materials with, or otherwise furnish them to, the Securities and Exchange
Commission (“SEC”). We are not including the information contained in our website as part of, or incorporating it by reference into, this report on Form 10-K.
The public may read and copy any materials we file with the SEC at the SEC’s Public Reference Room at 100 F Street, N.E., Room 1580, Washington, D.C. 20002. The public may obtain information on the
operation of the Public Reference Room by calling the SEC at 1-800-SEC-0330. The SEC maintains an Internet site that contains reports, proxy and information statements, and other information regarding issuers that file electronically with the SEC at
http://www.sec.gov.
Within our website’s “Investor” section, “SEC Filings” tab, all of our filings with the Commission and all amendments to these reports are available as soon as reasonably practicable after filing.
Website
Our website address is www.i-on.net.
Our Information
Our principal executive offices are located at 15, Teheran-ro 10-gil, Gangnam-gu, Seoul, Korea 06234 and our telephone number is 82-2-3430-1200. We can be contacted by email at ir@i-on.net.
Our business, financial condition, operating results and prospects are subject to the following risks. Additional risks and uncertainties not presently foreseeable to us may also impair our business
operations. If any of the following risks actually occurs, our business, financial condition or operating results could be materially adversely affected. In such case, the trading price of our common stock could decline, and our stockholders may lose
all or part of their investment in the shares of our common stock.
This Form 10-K contains forward-looking statements that involve risks and uncertainties. These forward-looking statements can be identified by the use of words such as “believes,” “estimates,”
“intends”, “plans”, “could,” “possibly,” “probably,” anticipates,” “projects,” “expects,” “may,” “will,” or “should,” “designed to,” “designed for,” or other variations or similar words or language. Actual results could differ materially from those
discussed in the forward-looking statements as a result of certain factors, including those set forth below and elsewhere in this Form 10-K.
Risks Related to Pandemics
The recent COVID-19 coronavirus pandemic may adversely affect our business, results of operations, financial condition, liquidity, and cash flow.
While the impact on our business from the recent outbreak of the COVID-19 coronavirus is unknown at this time and difficult to predict, various aspects of our business could be
adversely affected by it.
As of the date of this Annual Report, COVID-19 coronavirus has been declared a pandemic by the World Health Organization, has been declared a National Emergency by the United States
Government and has resulted in several states being designated disaster zones. COVID-19 coronavirus caused significant volatility in global markets, including the market price of our securities. The spread of COVID-19 coronavirus has caused public
health officials to recommend precautions to mitigate the spread of the virus, especially as to travel and congregating in large numbers. In addition, certain states and municipalities have enacted, and additional cities are considering,
quarantining and “shelter-in-place” regulations which severely limit the ability of people to move and travel, and require non-essential businesses and organizations to close.
It is unclear how such restrictions, which will contribute to a general slowdown in the global economy, will affect our business, results of operations, financial condition and our
future strategic plans.
Shelter-in-place and essential-only travel regulations have negatively impacted many of our customers. In addition, while our digesters are manufactured in the United States, we
still could experience significant supply chain disruptions due to interruptions in operations at any or all of our suppliers’ facilities. If we experience significant delays in receiving our products we will experience delays in fulfilling orders
and ultimately receiving payment, which could result in loss of sales and a loss of customers, and adversely impact our financial condition and results of operations.
In addition, our headquarters are located in Seoul, South Korea which was also subject to large COVID-19 outbreak requiring its government to enact travel and work restrictions.
While these restrictions were lessened as of the date of this Annual Report, it is unclear at this time how these restrictions will affect our operations and revenues.
Risks Specific to Our Business
Our proprietary software or service delivery may not operate properly, which could damage our reputation, give rise to claims against us, or divert application of our resources
from other purposes, any of which could harm our business and operating results.
We may encounter human or technical obstacles that prevent our proprietary applications from operating properly. If our applications do not function reliably or fail to achieve customer expectations in terms of
performance, customers could assert liability claims against us or attempt to cancel their contracts with us. This could damage our reputation and impair our ability to attract or maintain customers. We provide a limited warranty, have not paid
warranty claims in the past, and do not have a reserve for warranty claims.
Moreover, information services as complex as those we offer have in the past contained, and may in the future develop or contain, undetected defects or errors. We cannot assure you that material performance problems or
defects in our products or services will not arise in the future. Errors may result from receipt, entry, or interpretation of customer information or from interface of our services with legacy systems and data that we did not develop and the function
of which is outside of our control. Despite testing, defects or errors may arise in our existing or new software or service processes. These defects and errors and any failure by us to identify and address them could result in loss of revenue or
market share, liability to customers or others, failure to achieve market acceptance or expansion, diversion of development resources, injury to our reputation, and increased service and maintenance costs. Defects or errors in our software might
discourage existing or potential customers from purchasing our products and services. Correction of defects or errors could prove to be impossible or impracticable. The costs incurred in correcting any defects or errors or in responding to resulting
claims or liability may be substantial and could adversely affect our operating results.
If our security measures are breached or fail and unauthorized access is obtained to a customer’s data, our service may be perceived as insecure, the attractiveness of our
services to current or potential customers may be reduced, and we may incur significant liabilities.
Our services involve the web-based storage and transmission of customers’ proprietary information. We rely on proprietary and commercially available systems, software, tools and monitoring, as well as other processes,
to provide security for processing, transmission and storage of such information. Because of the sensitivity of this information and due to requirements under applicable laws and regulations, the effectiveness of our security efforts is very
important. If our security measures are breached or fail as a result of third-party action, acts of terror, social unrest, employee error, malfeasance or for any other reasons, someone may be able to obtain unauthorized access to customer data.
Improper activities by third-parties, advances in computer and software capabilities and encryption technology, new tools and discoveries and other events or developments may facilitate or result in a compromise or breach of our security systems. Our
security measures may not be effective in preventing unauthorized access to the customer data stored on our servers. If a breach of our security occurs, we could face damages for contract breach, penalties for violation of applicable laws or
regulations, possible lawsuits by individuals affected by the breach and significant remediation costs and efforts to prevent future occurrences. In addition, whether there is an actual or a perceived breach of our security, the market perception of
the effectiveness of our security measures could be harmed and we could lose current or potential customers.
Disruptions in Internet or telecommunication service or damage to our data centers could adversely affect our business by reducing our customers’ confidence in the reliability of
our services and products.
Our information technologies and systems are vulnerable to damage or interruption from various causes, including acts of God and other natural disasters, war and acts of terrorism and power losses, computer systems
failures, internet and teleDigital or data network failures, operator error, losses of and corruption of data and similar events. Data regarding our business and our customers’ insurance claims and encounters resides on computer hardware located
domestically and abroad. Although we conduct business continuity planning to protect against fires, floods, other natural disasters and general business interruptions to mitigate the adverse effects of a disruption, relocation or change in
operating environment at our data centers, the situations we plan for and the amount of insurance coverage we maintain may not be adequate in any particular case. In addition, the occurrence of any of these events could result in interruptions,
delays or cessations in service to our customers. Any of these events could impair or prohibit our ability to provide our services, reduce the attractiveness of our services to current or potential customers and adversely impact our financial
condition and results of operations.
In addition, despite the implementation of security measures, our infrastructure, data centers, or systems that we interface with or utilize, including the internet and related systems, may be vulnerable to physical
break-ins, hackers, improper employee or contractor access, computer viruses, programming errors, denial-of-service attacks or other attacks by third-parties seeking to disrupt operations or misappropriate information or similar physical or
electronic breaches of security. Any of these can cause system failure, including network, software or hardware failure, which can result in service disruptions. As a result, we may be required to expend significant capital and other resources to
protect against security breaches and hackers or to alleviate problems caused by such breaches.
We depend on key information systems and third party service providers.
We depend on key information systems to accurately and efficiently transact our business. These systems and services are vulnerable to interruptions or other failures resulting from, among other things, natural
disasters, terrorist attacks, software, equipment or teleDigital failures, processing errors, computer viruses, other security issues or supplier defaults. Security, backup and disaster recovery measures may not be adequate or implemented properly to
avoid such disruptions or failures. Any disruption or failure of these systems or services could cause substantial errors, processing inefficiencies, security breaches, inability to use the systems or process transactions, loss of customers or other
business disruptions, all of which could negatively affect our business and financial performance.
As cybersecurity attacks continue to evolve and increase, our information systems could also be penetrated or compromised by internal and external parties’ intent on extracting confidential information, disrupting
business processes or corrupting information. These risks could arise from external parties or from acts or omissions of internal or service provider personnel. Such unauthorized access could disrupt our business and could result in the loss of
assets, litigation, remediation costs, damage to our reputation and failure to retain or attract customers following such an event, which could adversely affect our business.
We may be unable to adequately establish, protect or enforce our intellectual property rights.
Our success depends in part upon our ability to establish, protect and enforce our intellectual property and other proprietary rights. If we fail to establish, protect or enforce our intellectual property rights, we
may lose an important advantage in the market in which we compete. We rely on a combination of trademark, copyright and trade secret law and contractual obligations to protect our key intellectual property rights, all of which provide only limited
protection. Our intellectual property rights may not be sufficient to help us maintain our position in the market and our competitive advantages.
We hold several patents and also rely on trade secrets to protect certain of our proprietary technology. However, trade secrets may not be protectable if not properly kept confidential. We strive to enter into
non-disclosure agreements with our employees, customers, contractors and business partners to limit access to and disclosure of our proprietary information. However, the steps we have taken may not be sufficient to prevent unauthorized use of our
technology, and adequate remedies may not be available in the event of unauthorized use or disclosure of our trade secrets and proprietary technology. Moreover, others may reverse engineer or independently develop technologies that are competitive to
ours or infringe our intellectual property.
Accordingly, despite our efforts, we may be unable to prevent third-parties from using our intellectual property for their competitive advantage. Any such use could have a material adverse effect on our business,
results of operations and financial condition. Monitoring unauthorized uses of and enforcing our intellectual property rights can be difficult and costly. Legal intellectual property actions are inherently uncertain and may not be successful, and
may require a substantial amount of resources and divert our management’s attention.
Claims by others that we infringe their intellectual property could force us to incur significant costs or revise the way we conduct our business.
Our competitors protect their proprietary rights by means of patents, trade secrets, copyrights, trademarks and other intellectual property. We have not conducted an independent review of patents and other intellectual
property issued to third-parties, who may have patents or patent applications relating to our proprietary technology. We may receive letters from third parties alleging, or inquiring about, possible infringement, misappropriation or violation of
their intellectual property rights. Any party asserting that we infringe, misappropriate or violate proprietary rights may force us to defend ourselves, and potentially our customers, against the alleged claim. These claims and any resulting lawsuit,
if successful, could subject us to significant liability for damages and/or invalidation of our proprietary rights or interruption or cessation of our operations. Any such claims or lawsuit could:
|
●
|
be time-consuming and expensive to defend, whether meritorious or not;
|
| ● |
require us to stop providing products or services that use the technology that allegedly infringes the other party’s intellectual property;
|
| ● |
divert the attention of our technical and managerial resources;
|
| ● |
require us to enter into royalty or licensing agreements with third-parties, which may not be available on terms that we deem acceptable;
|
| ● |
prevent us from operating all or a portion of our business or force us to redesign our products, services or technology platforms, which could be difficult and expensive and may make the performance or value of our product or service
offerings less attractive;
|
| ● |
subject us to significant liability for damages or result in significant settlement payments; or
|
| ● |
require us to indemnify our customers.
|
Furthermore, during the course of litigation, confidential information may be disclosed in the form of documents or testimony in connection with discovery requests, depositions or trial testimony. Disclosure of our
confidential information and our involvement in intellectual property litigation could materially adversely affect our business. Some of our competitors may be able to sustain the costs of intellectual property litigation more effectively than we can
because they have substantially greater resources. In addition, any litigation could significantly harm our relationships with current and prospective customers. Any of the foregoing could disrupt our business and have a material adverse effect on
our business, operating results and financial condition.
The continued success of our business model is heavily dependent upon our offshore operations, and any disruption to those operations will adversely affect us.
The majority of our operations, including the development and maintenance of our Web-based platform and our customer support services, are performed by our highly educated workforce of approximately 120 employees in
South Korea which may experience unrest due to the threats posed by North Korea. The performance of our operations in South Korea, and our ability to maintain our offshore offices, is an essential element of our business model, as South Korea is a
tech hub for Enterprise CMS/Digital marketing as well as all of our senior leadership are located in South Korea. Our competitive advantage will be greatly diminished and may disappear altogether if our operations in South Korea are negatively
impacted.
Our offshore operations expose us to additional business and financial risks which could adversely affect us and subject us to civil and criminal liability.
The risks and challenges associated with our operations outside the United States include laws and business practices favoring local competitors; compliance with multiple, conflicting and changing governmental laws and
regulations, including employment and tax laws and regulations; and fluctuations in foreign currency exchange rates. Foreign operations subject us to numerous stringent U.S. and foreign laws, including the Foreign Corrupt Practices Act, or FCPA, and
comparable foreign laws and regulations that prohibit improper payments or offers of payments to foreign governments and their officials and political parties by U.S. and other business entities for the purpose of obtaining or retaining business.
Safeguards we implement to discourage these practices may prove to be less than effective and violations of the FCPA and other laws may result in severe criminal or civil sanctions, or other liabilities or proceedings against us, including class
action lawsuits and enforcement actions from the SEC, Department of Justice and overseas regulators.
Future product development is dependent upon access to and reliability of third party software products and open source software.
Certain of our software products contain components developed and maintained by third party software vendors. We expect that we may have to incorporate software from third party vendors in our future
products. We also incorporate open source software in certain of our software products. We may not be able to replace the functionality provided by the third party or open source software currently offered with our products if that software becomes
obsolete, defective, non-compliant with third party patent restrictions or incompatible with future versions of our products or is not adequately maintained or updated, or if our relationship with the third party vendor terminates. In addition, we
must carefully monitor and manage our use of, and compliance with the licensing requirements of, open source software. Any significant interruption in the availability of these third party software products on commercially acceptable terms, defects
in these products, non-compliance with third party patent restrictions or our inability to comply with the licensing terms of either third party commercial software or open source software could delay development of future products or enhancement of
future products and could have a material adverse effect on our business, financial condition, operating results and cash flows.
Future product development is dependent on adequate research and development resources.
In order to remain competitive, we must continue to develop new products and enhancements to our existing products. This is particularly true as we further expand our cloud and SaaS offerings and
capabilities. Maintaining adequate research and development resources to meet the demands of the market is essential, and failure to do so could present an advantage to our competitors. If we are unable to develop products due to certain constraints,
such as high employee turnover, lack of management ability or a lack of other development resources, including through third party outsourcing firms, our competitiveness could be harmed.
Discovery of errors in our software could adversely affect our earnings.
The software products we offer are inherently complex. Despite testing and quality control, we cannot be certain that errors will not be found in current versions, new versions or enhancements of our
products after commencement of commercial delivery. If new or existing customers have difficulty deploying our products or require significant amounts of customer support, our operating margins could be harmed. Moreover, we could face possible claims
and higher development costs if our software contains undetected errors or if we fail to meet our customers’ expectations. With our BSM strategy, these risks increase because we are combining already complex products to create solutions that are even
more complicated than the aggregation of their product components. Significant technical challenges could also arise with our products because our customers purchase and deploy our products across a variety of computer platforms and integrate them
with a number of third party software applications and databases. These combinations increase our risk further because in the event of a system-wide failure, it may be difficult to determine which product is at fault; thus, we may be harmed by the
failure of another supplier’s products.
As a result of the foregoing, we could experience loss of or delay in revenue and loss of market share; loss of customers; damage to our reputation; failure to achieve market acceptance; diversion of
development resources; increased service and warranty costs; legal actions by customers against us which could, whether or not successful, increase costs and distract our management; and increased insurance costs.
Risks Related to Securities Markets and Investments in Our Securities
General securities market uncertainties resulting from the COVID-19 pandemic.
Since the outset of the pandemic the US and worldwide national securities markets have undergone unprecedented stress due to the uncertainties of the pandemic and the resulting
reactions and outcomes of government, business and the general population. These uncertainties have resulted in declines in all market sectors, increases in volumes due to flight to safety and governmental actions to support the markets. As a
result, until the pandemic has stabilized, the markets may not be available to the Company for purposes of raising required capital. Should we not be able to obtain financing when required, in the amounts necessary to execute on our plans in full,
or on terms which are economically feasible we may be unable to sustain the necessary capital to pursue our strategic plan and may have to reduce the planned future growth and scope of our operations.
Our executive officers and certain stockholders possess the majority of our voting power, and through this ownership, control our Company and our corporate actions.
Our current executive officers, directors and largest stockholders of the Company, hold approximately 37% of the voting power of the outstanding shares as of December 31, 2020. These officers,
directors and certain stockholders have a controlling influence in determining the outcome of any corporate transaction or other matters submitted to our stockholders for approval, including mergers, consolidations and the sale of all or
substantially all of our assets, election of directors, and other significant corporate actions. The interests of our executive officers and certain shareholders may give rise to a conflict of interest with the Company and the Company’s
stockholders. For additional details concerning voting power please refer to the section below entitled “Description of Securities.”
Liquidity of our common stock has been limited.
Our common stock is quoted on OTC Markets under the symbol “IONI”. The liquidity of our common stock is very limited and is affected by our limited trading market. The OTC Markets is an inter-dealer
market much less regulated than the major exchanges, and is subject to abuses, volatilities and shorting. There is currently no broadly followed and established trading market for our common stock. An established trading market may never develop or
be maintained. Active trading markets generally result in lower price volatility and more efficient execution of buy and sell orders. Absence of an active trading market reduces the liquidity of the shares traded.
The trading volume of our common stock may be limited and sporadic. This situation is attributable to a number of factors, including the fact that we are a small company that is relatively unknown to
stock analysts, stock brokers, institutional investors and others in the investment community that generate or influence sales volume, and that even if we came to the attention of such persons, they may tend to be risk-averse and would be reluctant
to follow an unproven company such as ours or purchase or recommend the purchase of our shares until such time as we became more seasoned and viable. As a consequence, there may be periods of several days or more when trading activity in our shares
is minimal, as compared to a seasoned issuer that has a large and steady volume of trading activity that will generally support continuous sales without an adverse effect on share price. We cannot give any assurance that a broader or more active
public trading market for our common stock will develop or be sustained, or that current trading levels will be sustained. As a result of such trading activity, the quoted price for our common stock while on the OTC Markets may not necessarily be a
reliable indicator of its fair market value.
Because we became public by means of a “reverse business combination,” we may not be able to attract the attention of major brokerage firms.
There may be risks associated with us becoming public through a “reverse business combination.” Securities analysts of major brokerage firms and securities institutions may not provide coverage of us
because there were no broker-dealers who sold our stock in a public offering that would be incentivized to follow or recommend the purchase of our common stock. The absence of such research coverage could limit investor interest in our common stock,
resulting in decreased liquidity. No assurance can be given that established brokerage firms will, in the future, want to cover our securities or conduct any secondary offerings or other financings on our behalf.
Our stock price may be volatile.
The market price of our common stock is likely to be highly volatile and could fluctuate widely in price in response to various factors, many of which are beyond our control, including the following:
| ∙ |
the concentration of the ownership of our shares by a limited number of affiliated stockholders may limit interest in our securities;
|
| ∙ |
limited “public float” with a small number of persons whose sales or lack of sales could result in positive or negative pricing pressure on the market price for our common stock;
|
| ∙ |
additions or departures of key personnel;
|
| ∙ |
loss of a strategic relationship;
|
| ∙ |
variations in operating results from the expectations of securities analysts or investors;
|
| ∙ |
announcements of new products or services by us or our competitors;
|
| ∙ |
reductions in the market share of our products;
|
| ∙ |
announcements by us or our competitors of significant acquisitions, strategic partnerships, joint ventures or capital commitments;
|
| ∙ |
investor perception of our industry or prospects;
|
| ∙ |
insider selling or buying;
|
| ∙ |
investors entering into short sale contracts;
|
| ∙ |
regulatory developments affecting our industry; and
|
| ∙ |
changes in our industry;
|
| ∙ |
competitive pricing pressures;
|
| ∙ |
our ability to obtain working capital financing;
|
| ∙ |
sales of our common stock;
|
| ∙ |
our ability to execute our business plan;
|
| ∙ |
operating results that fall below expectations;
|
| ∙ |
revisions in securities analysts’ estimates or reductions in security analysts’ coverage; and
|
| ∙ |
economic and other external factors.
|
Many of these factors are beyond our control and may decrease the market price of our common stock, regardless of our operating performance. We cannot make any predictions or projections as to what
the prevailing market price for our common stock will be at any time, including as to whether our common stock will sustain current market prices, or as to what effect that the sale of shares or the availability of common stock for sale at any time
will have on the prevailing market price.
In addition, the securities markets have from time to time experienced significant price and volume fluctuations that are unrelated to the operating performance of particular companies. These market
fluctuations may also materially and adversely affect the market price of our common stock.
Our common stock is subject to price volatility unrelated to our operations.
The market price of our common stock could fluctuate substantially due to a variety of factors, including market perception of our ability to achieve our planned growth, quarterly operating results
of other companies in the same industry, trading volume in our common stock, changes in general conditions in the economy and the financial markets or other developments affecting the Company’s competitors or the Company itself.
A decline in the price of our common stock could affect our ability to raise working capital and adversely impact our ability to continue operations.
A prolonged decline in the price of our common stock could result in a reduction in the liquidity of our common stock and a reduction in our ability to raise capital. A decline in the price of our
common stock could be especially detrimental to our liquidity, our operations and strategic plans. Such reductions may force us to reallocate funds from other planned uses and may have a significant negative effect on our business plan and
operations, including our ability to develop new services and continue our current operations. If our common stock price declines, we can offer no assurance that we will be able to raise additional capital or generate funds from operations
sufficient to meet our obligations. If we are unable to raise sufficient capital in the future, we may not be able to have the resources to continue our normal operations.
Concentrated ownership of our common stock creates a risk of sudden changes in our common stock price.
The sale by any shareholder of a significant portion of their holdings could have a material adverse effect on the market price of our common stock.
Sales of our currently issued and outstanding stock may become freely tradable pursuant to Rule 144 and may dilute the market for your shares and have a depressive effect on the
price of the shares of our common stock.
A substantial majority of the outstanding shares of Common Stock are “restricted securities” within the meaning of Rule 144 under the Securities Act of 1933, as amended (the “Securities Act”) (“Rule
144”). As restricted shares, these shares may be resold only pursuant to an effective registration statement or under the requirements of Rule 144 or other applicable exemptions from registration under the Securities Act and as required under
applicable state securities laws. Rule 144 provides in essence that a non-affiliate who has held restricted securities for a period of at least six months may sell their shares of common stock. Under Rule 144, affiliates who have held restricted
securities for a period of at least six months may, under certain conditions, sell every three months, in brokerage transactions, a number of shares that does not exceed the greater of 1% of a company’s outstanding shares of common stock or the
average weekly trading volume during the four calendar weeks prior to the sale. A sale under Rule 144 or under any other exemption from the Securities Act, if available, or pursuant to subsequent registrations of our shares of common stock, may have
a depressive effect upon the price of our shares of common stock in any active market that may develop.
We do not plan to declare or pay any dividends to our stockholders in the near future.
We have not declared any dividends in the past, and we do not intend to distribute dividends in the near future. The declaration, payment and amount of any future dividends will be made at the
discretion of the board of directors and will depend upon, among other things, the results of operations, cash flows and financial condition, operating and capital requirements, and other factors as the board of directors considers relevant. There
is no assurance that future dividends will be paid, and if dividends are paid, there is no assurance with respect to the amount of any such dividend.
The requirements of being a public company may strain our resources and distract management.
As a public company, we are subject to the reporting requirements of the Securities Exchange Act of 1934, as amended (the “Exchange Act”), the Sarbanes-Oxley Act of 2002 (the “Sarbanes-Oxley Act”),
and the Securities Act. These rules, regulations and requirements are extensive. We may incur significant costs associated with our public company corporate governance and reporting requirements. This may divert management’s attention from other
business concerns, which could have a material adverse effect on our business, financial condition and results of operations. We also expect that these applicable rules and regulations may make it more difficult and more expensive for us to obtain
director and officer liability insurance and we may be required to accept reduced policy limits and coverage or incur substantially higher costs to obtain the same or similar coverage. As a result, it may be more difficult for us to attract and
retain qualified individuals to serve on our board of directors or as executive officers.
Future changes in financial accounting standards or practices may cause adverse unexpected financial reporting fluctuations and affect reported results of operations.
A change in accounting standards or practices can have a significant effect on our reported results and may even affect our reporting of transactions completed before the change is effective. New
accounting pronouncements and varying interpretations of accounting pronouncements have occurred and may occur in the future. Changes to existing rules or the questioning of current practices may adversely affect our reported financial results or
the way we conduct business.
“Penny Stock” rules may make buying or selling our common stock difficult.
Trading in our common stock has previously been subject to the “penny stock” rules. The SEC has adopted regulations that generally define a penny stock to be any equity security that has a market
price of less than $5.00 per share, subject to certain exceptions. These rules require that any broker-dealer that recommends our common stock to persons other than prior customers and accredited investors, must, prior to the sale, make a special
written suitability determination for the purchaser and receive the purchaser’s written agreement to execute the transaction. Unless an exception is available, the regulations require the delivery, prior to any transaction involving a penny stock, of
a disclosure schedule explaining the penny stock market and the risks associated with trading in the penny stock market. In addition, broker-dealers must disclose commissions payable to both the broker-dealer and the registered representative and
current quotations for the securities they offer. The additional burdens imposed upon broker-dealers by such requirements may discourage broker-dealers from effecting transactions in our common stock, which could severely limit the market price and
liquidity of our common stock.
SHOULD ONE OR MORE OF THE FOREGOING RISKS OR UNCERTAINTIES MATERIALIZE, OR SHOULD THE UNDERLYING ASSUMPTIONS PROVE INCORRECT, ACTUAL RESULTS MAY DIFFER SIGNIFICANTLY FROM THOSE
ANTICIPATED, BELIEVED, ESTIMATED, EXPECTED, INTENDED OR PLANNED
We are a smaller reporting company as defined by 17 C.F.R. 229 (10)(f)(i) and are not required to provide information under this item..
We do not own any physical location. I-ON currently leases its corporate headquarters and other offices in Seoul, South Korea which expires on December 31, 2021. I-ON’s lease for its Tokyo, Japan
office expires on May 25, 2021. We believe that our current offices are sufficient in size for current and future operations.
From time to time, we are a party to, or otherwise involved in, legal proceedings arising in the normal and ordinary course of business. As of the date of this report, we are not aware of any other
proceeding, threatened or pending, against us which, if determined adversely, would have a material effect on our business, results of operations, cash flows or financial position.
Not applicable.
PART II
ITEM 5: MARKET FOR REGISTRANT’S COMMON EQUITY RELATED SHAREHOLDER MATTERS AND ISSUER PURCHASES OF EQUITY SECURITIES.
(a) Market Information
Our common stock first became quoted on the OTC Markets under the trading symbol “EVBW” on March 27, 2014. On February 24, 2016, our common stock began trading under the name Evans Brewing Company,
Inc. and under the trading symbol “ALES”. On April 21, 2016, the common stock was uplisted to the OTCQB Venture Marketplace and on August 2, 2018 our trading symbol was changed to IONI. Over the counter market quotations reflect inter-dealer prices,
without retail mark-up, mark-down or commission, and may not necessarily represent actual transactions. The following table lists the high and low sale information for our common stock as quoted on the OTC Markets for the fiscal years ended 2020 and
2019:
|
Price Range
|
||||||||
|
Quarter Ended
|
High ($)
|
Low ($)
|
||||||
|
December 31, 2020
|
$
|
0.15
|
0.13
|
|||||
|
September 30, 2020
|
$
|
0.22
|
0.18
|
|||||
|
June 30, 2020
|
$
|
0.08
|
0.08
|
|||||
|
March 31, 2020
|
$
|
0.09
|
0.09
|
|||||
|
December 31, 2019
|
$
|
0.11
|
0.06
|
|||||
|
September 30, 2019
|
$
|
0.14
|
0.05
|
|||||
|
June 30, 2019
|
$
|
0.35
|
0.08
|
|||||
|
March 31, 2019
|
$
|
0.60
|
0.06
|
|||||
The above quotations from the OTC Markets reflect inter-dealer prices, without retail mark-up, mark-down or commission, and may not represent actual transactions.
(b) Holders
The number of record holders of our common stock as of December 31, 2020, was approximately 300 based on information received from our transfer agent. This amount excludes an indeterminate number of
shareholders whose shares are held in “street” or “nominee” name with a brokerage firm or other fiduciary.
(c) Dividends
We have not paid or declared any cash dividends on our common stock and we do not anticipate paying dividends on our common stock for the foreseeable future.
RECENT SALES OF UNREGISTERED SECURITIES
On August 22, 2018, we entered into an equity purchase agreement (the “Purchase Agreement”) with Peak One Opportunity Fund, L.P. (“Buyer”), whereby Buyer agreed to invest up to $540,000.00 (the “Purchase Price”) in
our Company in exchange for convertible debentures, upon the terms and subject to the conditions thereof. Pursuant to the SPA, we issued a convertible debenture to the Buyer in the original principal amount of $200,000.00 (the “Signing Debenture”).
Each convertible debenture issued pursuant to the SPA, coupled with the accrued and unpaid interest relating to each convertible debenture, is due and payable three years from the issuance date of the respective convertible debenture. Any amount of
principal or interest that is due under each convertible debenture, which is not paid by the respective maturity date, will bear interest at the rate of 18% per annum until it is satisfied in full. Additionally, the Buyer has the right at any time
to convert amounts owed under each convertible debenture into shares of our common stock. Each debenture shall contain representations, warranties, events of default, beneficial ownership limitations, and other provisions that are customary of
similar instruments. As consideration for the Purchase Agreement we issued the Buyer warrants to purchase 50,000 shares of Common Stock at the exercise price of $2.75 expiring five years after issuance (the “Warrants”).
Pursuant to the Agreement of Merger and Plan of Reorganization (the “Merger Agreement”) with I-ON Acquisition Corp., a wholly-owned subsidiary of the Registrant, and I-ON Digital, Corp.., a company organized under the
laws of the Republic of Korea (South Korea) (“I-ON”) the Company issued the shareholders of I-ON (the “I-ON Holders”) an aggregate of 26,000,000 shares of our Common Stock (the “Merger Shares”) in accordance with the pro rata ownership of the I-ON
Holders immediately prior to the Merger.
All of the securities referred to above were offered and sold without registration under the Securities Act of 1933, as amended (the “Securities Act”) in reliance on the exemptions provided by Section 4(a)(2) of the
Securities Act as provided in Rule 506(b) of Regulation D and/or Regulations promulgated thereunder. The securities have not been registered under the Securities Act or any other applicable securities laws, and unless so registered, may not be
offered or sold in the United States except pursuant to an exemption from the registration requirements of the Securities Act
We are a smaller reporting company as defined by 17 C.F.R. 229(10)(f)(i) and are not required to provide the information under this heading.
The following discussion should be read in conjunction with the information contained in the consolidated financial statements of the Company and the notes thereto appearing elsewhere herein and in conjunction with
the Management’s Discussion and Analysis of Financial Condition and Results of Operations set forth in the Company’s Annual Report on Form 10-K for the year ended December 31, 2019. Readers should carefully review the risk factors disclosed in this
Form 10-K and other documents filed by the Company with the SEC.
As used in this report, the terms “Company”, “we”, “our”, and “us” refer to I-ON Digital Corp., a Delaware corporation.
PRELIMINARY NOTE REGARDING FORWARD-LOOKING STATEMENTS
This Annual Report contains forward-looking statements within the meaning of the federal securities laws. These forward-looking statements can be identified by the use of words such as “believes,”
“estimates,” “intends”, “plans”, “could,” “possibly,” “probably,” anticipates,” “projects,” “expects,” “may,” “will,” or “should,” “designed to,” “designed for,” or other variations or similar words or language. The forward-looking statements are
based on the current expectations of the Company and are subject to certain risks, uncertainties and assumptions, including those set forth in the discussion under “Management’s Discussion and Analysis of Financial Condition and Results of
Operations” in this report. Actual results may differ materially from results anticipated in these forward-looking statements. We base the forward-looking statements on information currently available to us, and we assume no obligation to update
them
Business History of Company
I-ON Digital Corp. (the “Company”) was incorporated under the laws of the State of Delaware on June 18, 2013. On April 4, 2014, The Michael J. Rapport Trust (the “Trust”) purchased 10,000,000
shares of the Company’s common stock which was all of the outstanding shares of Alpine 3, Inc., and subsequently changed the name to Evans Brewing Company Inc. (“EBC”) on May 29, 2014. On October 9, 2014, the Trust agreed to the cancellation of
9,600,000 of the shares of common stock that it had acquired and retained 400,000 shares of common stock. From April 2014 through December 2015, EBC has been in the process of acquiring the Bayhawk brands and related assets, as discussed in more
detail below.
On October 15, 2014, EBC entered into an Asset Purchase and Share Exchange Agreement (the “Agreement”), with Bayhawk Ales, Inc. (“Bayhawk”) whereby Bayhawk sold to EBC, and EBC purchased from
Bayhawk, assets of Bayhawk, in exchange for 4,033,863 shares of EBC common stock upon the terms and subject to the conditions set forth in the Asset Purchase and Share Exchange Agreement.
On September 29, 2016, Evans Brewing Company, Inc., closed the acquisition of a restaurant business located in the downtown SOCO District of Fullerton, California, through the acquisition of all
the outstanding stock of EBC Public House, Inc., which the Company now operates as its first branded restaurant and taproom under the trade name “The Public House by Evans Brewing Company”. The Public House features the Company’s beers – as well as
beers from other selected local Orange County, California breweries, -- food and, occasional entertainment. In connection with such closing, the Company acquired 100% of the outstanding shares of EBC Public House from Mr. Rapport and issued
1,000,000 shares of the Company’s Series A Preferred Stock to Mr. Rapport. The asset purchase and share exchange have been treated as business combination as both companies are controlled by the same management.
On January 25, 2018, the Company consummated an Agreement of Merger and Plan of Reorganization (the “Merger Agreement”), with I-ON Digital Corp.., a company organized under the laws of the Republic
of Korea (South Korea) (“I-ON”) and I-ON Acquisition Corp., a wholly-owned subsidiary of the Registrant (“Acquisition”). Pursuant to the terms of the Merger Agreement, Acquisition merged with and into I-ON in a statutory reverse triangular merger
(the “Merger”) with I-ON surviving as a wholly-owned subsidiary of the Registrant. As consideration for the Merger, the Registrant agreed to issue the shareholders of I-ON (the “I-ON Holders”) an aggregate of 26,000,000 shares of our Common
Stock. Following the Merger, the Registrant adopted the business plan of I-ON in information technology consultancy and software development. On December 14, 2017, in connection with the Merger, the Registrant’s Board of Directors approved an
amendment to its Certificate of Incorporation (the “Amendment”) to change its name to I-ON Digital Corp. On April 2, 2019, the Company amended its Certificate of Incorporation to change the name of the Company to “I-ON Digital Corp.”
Overview
Prior to the Merger, the Company operated a craft brewery based on Orange County, California that produces and sells premium craft beers, including a variety of ales and lagers. EBC’s beers are
currently produced in its 17-barrel brewery in Irvine, California, the oldest continuously operating brewing facility in Orange County and one of the oldest in all of Southern California. This facility has been producing craft beers since January
1995.
Following the Merger, the Company adopted the business plan of I-ON. I-ON was founded by Jae Cheol James Oh, who currently serves as CEO, the Company’s roots of which are in IT consultancy and
software development. I-ON services South Korea’s Enterprise Content Management system’s market and specializes in advancing market-leading internet software applications to capitalize on rapidly growing market sectors.
After being awarded its first of 6 patents in 2003, I-ON has since evolved into an industry-leading and recognized software developer and provider of enterprise-class unstructured data management
and digital marketing software and solutions. I-ON services over 1,000 blue-chip and middle-market clients across virtually all verticals in both private and public sectors. The Company has meaningfully expanded its reach over the past decade and
now currently licenses and sells its products and services directly to clients in South Korea and Japan, as well as in Singapore, Malaysia, Indonesia, Thailand, Vietnam, and the U.S. through value-added resellers and partnerships.
I-ON’s portfolio of software and solutions serves the digital marketing and technology needs of organizations, enabling clients to create, measure, and optimizes digital experiences for their
audiences across marketing channels and devices. We believe these solutions help clients reduce the cost of content management and delivery and increase the return on their investments in digital communication.
ON currently holds 6 international patents for both products and methodologies (with 3 more pending) built into the 11 product offerings the Company currently has at market. These encompass
enterprise web content management (CMS), web experience and service delivery software, digital marketing, smart mobility and analytics tools, and, more recently, energy management solutions. The Company has designed and developed industry-leading
technologies that are compliant with global standards including GS (Good Software) and NET (New Excellent Technology). I-ON also holds numerous domestic and global industry awards, earning high rankings and recognition from the likes of Gartner
(Magic Quadrant 2014) and Red Herring (2014 Asia Top 100 Winner), among many others.
Basis of Presentation
The financial statements of the Company are presented in United States dollars and have been prepared in accordance with accounting principles generally accepted in the United States.
Summary of Significant Accounting Policies
Our significant accounting policies are more fully described in the notes to our consolidated financial statements included in this Annual Report on Form 10-K for the fiscal year ended December 31,
2019. We believe that the accounting policies below are critical for one to fully understand and evaluate our financial condition and results of operations.
Results of Operations for the year ended December 31, 2020 as Compared to the year ended December 31, 2019
|
Year Ended
|
||||||||||||||||||||||||
|
December 31, 2020
|
December 31, 2019
|
Change
|
||||||||||||||||||||||
|
Amount
|
% of Revenue
|
Amount
|
% of Revenue
|
Amount
|
%
|
|||||||||||||||||||
|
|
||||||||||||||||||||||||
|
Net sales
|
$
|
10,471,502
|
100.0
|
%
|
$
|
7,954,015
|
100.0
|
%
|
$
|
2,517,487
|
31.7
|
%
|
||||||||||||
|
Cost of goods sold
|
6,078,030
|
58.0
|
%
|
5,519,931
|
69.4
|
%
|
558,099
|
10.1
|
%
|
|||||||||||||||
|
Gross profit (loss)
|
4,393,472
|
42.0
|
%
|
2,434,084
|
30.6
|
%
|
1,959,388
|
80.5
|
%
|
|||||||||||||||
|
Operating expense:
|
||||||||||||||||||||||||
|
Research and development
|
999,209
|
9.5
|
%
|
838,237
|
10.5
|
%
|
160,972
|
19.2
|
%
|
|||||||||||||||
|
General and administrative
|
1,697,377
|
16.2
|
%
|
1,871,818
|
23.5
|
%
|
(174,441
|
)
|
-9.3
|
%
|
||||||||||||||
|
Total operating expense
|
2,696,586
|
25.8
|
%
|
2,710,055
|
34.1
|
%
|
(13,469
|
)
|
-0.5
|
%
|
||||||||||||||
|
Income (loss) from operations
|
1,696,886
|
16.2
|
%
|
(275,971
|
)
|
-3.5
|
%
|
1,972,857
|
-714.9
|
%
|
||||||||||||||
|
Other income (expense):
|
||||||||||||||||||||||||
|
Loss on extinguishment of debt
|
-
|
0.0
|
%
|
(216,208
|
)
|
-2.7
|
%
|
216,208
|
-100.0
|
%
|
||||||||||||||
| Interest Income |
45,405 | 0.4 | % | 52,104 | 0.7 | % | (6,699 | ) |
-12.9 | % | ||||||||||||||
|
Foreign currency transaction gain (loss)
|
(1,865
|
)
|
0.0
|
%
|
14,966
|
0.2
|
%
|
(16,831
|
)
|
-112.5
|
%
|
|||||||||||||
|
Government subsidized income
|
15,487
|
0.1
|
%
|
6,391
|
0.1
|
%
|
9,096
|
142.3
|
%
|
|||||||||||||||
|
Miscellaneous income, net
|
(24,957
|
)
|
-0.2
|
%
|
35,308
|
0.4
|
%
|
(60,265
|
)
|
-170.7
|
%
|
|||||||||||||
|
Interest expense
|
(23,507
|
)
|
-0.2
|
%
|
(48,041
|
)
|
-0.6
|
%
|
24,534
|
-51.1
|
%
|
|||||||||||||
|
Total other income (expense), net
|
10,563
|
0.1
|
%
|
(155,480
|
)
|
-2.0
|
%
|
166,043
|
-106.8
|
%
|
||||||||||||||
|
Income (loss) before provision for income taxes, and non-controlling interest
|
1,707,449
|
16.3
|
%
|
(431,451
|
)
|
-5.4
|
%
|
2,138,900
|
-495.7
|
%
|
||||||||||||||
|
Provision for income tax
|
86,570
|
0.8
|
%
|
276,015
|
3.5
|
%
|
(189,445
|
)
|
-68.6
|
%
|
||||||||||||||
|
Net income (loss) before non-controlling interest
|
1,620,879
|
15.5
|
%
|
(707,466
|
)
|
-8.9
|
%
|
2,328,345
|
-329.1
|
%
|
||||||||||||||
|
Non-controlling interest income
|
431
|
0.0
|
%
|
4,982
|
0.1
|
%
|
(4,551
|
)
|
-91.3
|
%
|
||||||||||||||
|
Net income (loss)
|
$
|
1,620,448
|
15.5
|
%
|
$
|
(712,448
|
)
|
-9.0
|
%
|
$
|
2,332,896
|
-327.4
|
%
|
|||||||||||
Net Sales
Net sales increased by $2,517,487 or 31.7%, to $10,471,502 for the year
ended December 31, 2020 from $7,954,015 for the year ended December 31, 2019. The net increase in net sales was primarily due the
following:
| ● |
Revenue from customization increased by $710,087 or 15.8%, to $5,209,443 for the year ended
December 31, 2020 from $4,499,346 for the year ended December 31, 2019. The increase was due to increase in amount of customer
contract revenue which was $9,578,588 for year ended December 31, 2020 compared to $6,980,876 for the year ended December 31,
2019.
|
| ● |
Revenue from maintenance increased by $338,571 or 23.1%, to $1,802,032 for the year ended December 31, 2020 from $1,463,461
for the year ended December 31, 2019. The increase was due to increase in maintenance and development contracts and increase in number of customers to 91 in 2020 from 65 in 2019.
|
| ● |
Revenue from installation increased by $1,140,802 or 144.2%, to $1,931,765 for the year ended December 31, 2020 from $790,963 for the year ended December 31, 2019. The increase was due to increase in number of customers to 19 in 2020 from 9 in 2019.
|
Cost of Goods Sold
Cost of goods sold increased by $558,099 or 10.1%, to $6,078,030 for the
year ended December 31, 2020 from $5,519,931 for the year ended December 31, 2019. The increase was primarily due to increase in
outside services (outsourced developers) followed by increase in revenue.
Gross Profit (Loss)
Gross profit increased by $1,959,388, or 80.5%, to gross profit of $4,393,472, or 42.0% of net sales, for the
year ended December 31, 2020, from gross profit of $2,434,084, or 30.6% of net sales, for the year ended December 31, 2019. The gross profit increase was mainly due to increase in sales of 31.7% in year 2020 compared to year 2019.
While outside services (outsourced developers) costs increased in year 2020 compared to year 2019, salaries maintained same in year 2020
compared to year 2019, which resulted in higher gross margin.
Research and Development
Research and development expenses increased by $160,972 or 19.2%, to $999,209 for the year ended December 31, 2020 from $838,237 for the year ended December 31, 2019. The increase was due to increase in head count.
General and Administrative
General and administrative expenses decreased by $174,441 or -9.3%, to $1,697,377 for the year ended
December 31, 2020 from $1,871,818 for the year ended December 31, 2019, maintaining same expenses as prior year.
Other Income (Expense)
Other income (expense) for the year ended December 31, 2020, was $10,563 compared to ($155,480) for the year ended December 31, 2019. The change was primarily a result of miscellaneous income, net. Income (loss) before provision for income
taxes, and non-controlling interest for the year ended December 31, 2020 was $1,707,449 compared to ($431,451) for the same period in 2019.
Provision for Income Tax
Change in tax provision decreased by $189,445 or -68.6%, to $86,570 for the year ended December 31, 2020 from tax benefit of $276,015 for the year ended December 31, 2019.
Net Income (Loss)
Net income (loss) from operations increased by $2,332,896 to $1,620,448 for the year ended December 31, 2020 from $(712,448), for the year ended December 31, 2019. The change was primarily a result of increase in remote-controlled projects
of $2,517,487 due to Covid.
Liquidity and Capital Resources
At December 31, 2020, the Company had cash and cash equivalents of $4,521,328. We estimate that we will require up to $3,000,000 of capital for the next year of operations. We estimate that our
expenses will be comprised primarily of general expenses including particularly marketing, research and development costs, overhead, legal and accounting fees.
|
Year Ended December 31,
|
Change
|
|||||||||||||||
|
2020
|
2019
|
Amount
|
%
|
|||||||||||||
|
Net cash provided by operating activities
|
$
|
2,600,978
|
$
|
134,444
|
$
|
2,466,534
|
1834.6
|
%
|
||||||||
|
Net cash used in investing activities
|
(7,002
|
)
|
(462,131
|
)
|
455,129
|
-98.5
|
%
|
|||||||||
|
Net cash provided by financing activities
|
200,694
|
57,296
|
143,398
|
250.3
|
%
|
|||||||||||
|
Effect of foreign currency translation on cash and cash equivalents
|
494,198
|
(159,366
|
)
|
653,564
|
-410.1
|
%
|
||||||||||
|
Net increase (decrease) in cash and cash equivalents
|
$
|
3,288,868
|
$
|
(429,757
|
)
|
$
|
3,718,625
|
-865.3
|
%
|
|||||||
Operating Activities. Operating cash flows for the fiscal 2020 and 2019 were a positive $2,600,978 and a positive $134,444, respectively. The more increased cash flow from operating activities for the fiscal 2020 compared to the same period last year primarily reflects increased net income.
Investing Activities. Net cash flows of investing activities for the fiscal 2020 and 2019 was negative $7,002 and a negative $462,131, respectively. Capital expenditures represented most of the cash used
in investing activities flows for the fiscal 2020. The increase payable in short-term loans represented most of the cash provided by investing activities flows for fiscal 2019.
Financing Activities. Financing cash flows for the fiscal 2020 and 2019 were a positive $200,694 and a positive $57,296, respectively. For the fiscal 2020, net cash was provided primarily by receipt of government
grants. For the fiscal 2019, net cash was provided primarily from increased borrowings under short term loan payable and long term loan payable, which was partially offset by treasury stock purchase.
Off Balance Sheet Arrangements
As of December 31, 2020, there were no off balance sheet arrangements.
We are a smaller reporting company as defined by 17 C.F.R. 229 (10)(f)(i) and are not required to provide information under this item.
The information required by Item 8 appears after the signature page to this report.
Not applicable.
Management’s Report on Disclosure Controls and Procedures
Our management is responsible for establishing and maintaining a system of disclosure controls and procedures (as defined in Rule 13a-15(e) and 15d-15(e) under the Exchange Act) that is designed to ensure that
information required to be disclosed by us in the reports that we file or submit under the Exchange Act is recorded, processed, summarized and reported, within the time periods specified in the Commission’s rules and forms. Disclosure controls and
procedures include, without limitation, controls and procedures designed to ensure that information required to be disclosed by an issuer in the reports that it files or submits under the Exchange Act is accumulated and communicated to the issuer’s
management, including its principal executive officer or officers and principal financial officer or officers, or persons performing similar functions, as appropriate to allow timely decisions regarding required disclosure.
An evaluation was conducted under the supervision and with the participation of our management of the effectiveness of the design and operation of our disclosure controls and procedures as of June 30, 2017. Based on
that evaluation, our management concluded that our disclosure controls and procedures were not effective as of such date to ensure that information required to be disclosed in the reports that we file or submit under the Exchange Act, is recorded,
processed, summarized and reported within the time periods specified in SEC rules and forms. The Company had no audit committee. Such officer also confirmed that there was no change in our internal control over financial reporting during the fiscal
year period ended December 21, 2017 that has materially affected, or is reasonably likely to materially affect, our internal control over financial reporting.
None.
PART III
The table below lists all current officers and directors of the Company as of the date of this report. All officers serve at the discretion of the Board of Directors. The term of office of each of our directors expire
at our next Annual Meeting of Shareholders or until their successors are duly elected and qualified.
|
Name
|
Age
|
Position
|
|
Jae Cheol Oh
|
51
|
Chairman, Chief Executive Officer, Chief Financial Officer
|
|
Hong Rae Kim
|
50
|
Executive Director
|
|
Jae Ho Cho
|
46
|
Director
|
|
Eugene Hong
|
63
|
Director
|
|
Jean Koh
|
60
|
Director
|
|
Charlie Baik
|
51
|
Director
|
Jae Cheol Oh, Chairman, Chief Executive Officer, Chief Financial Officer
James Jae Cheol Oh has served as founder and CEO of I-ON since 1999 and Chairman, CEO and CFO of the Company since the Merger. He is also an affiliated professor of Management Engineering at Sangmyung University. Mr.
Oh holds a B.A. in Economics from Kyung Hee University and a M.S. in Management Engineering from Sangmyung University. We believe Mr. Oh’s experience founding and running I-ON qualifies him to serve on our board of directors.
Jae Ho Cho, Director
Jae Ho Cho joined I-ON Digital in February 2003 and serves as head of the Service Delivery Platform Business department. He has been a director of the Company since the Merger. During his time with I-ON he has
participated in the development of many of I-ONs core products. He holds a M.S. from Cheng Ju Graduate School. We believe Mr. Cho’s depth of experience in information technology consultancy and software development qualifies him to serve on our
board of directors.
Hong Rae Kim, Executive Director
Hong Rae Kim is a co-founder of I-ON and has served as CEO of PT.IONSoft, a company located in Indonesia, since 2012. He has been an executive director of the Company since the Merger. Mr. Kim has also previously
served as a PMO and COO of I-ON. Mr. Kim graduated from Gang Nam University with a bachelor’s degree in Economics. We believe Mr. Kim’s experience founding and working with I-ON qualifies him to serve on our board of directors.
Mr. Eugene Hong, Independent Director
Mr. Hong’s career at Samsung, most recently as Executive Vice President of Samsung Venture Investment Co, Ltd., spans over 25 years. Between 1992 and 1998, he served as a Director in the production,
planning and strategy divisions for both Samsung Motors Corp.. and Samsung Techwin Corp.. In 1999, Mr. Hong transitioned to the Samsung Venture team initially as a Director, rising to Vice President, Senior Vice President and eventually to his
current role as Executive Vice President, focusing primarily on managing technology and industrial related investments. Since 2013, Mr. Hong has originated, spearheaded and overseen over twenty investments across multiple high growth sectors
including, among others, enterprise software, network security solutions, AI, optical equipment/OLED laser, autonomous driving, block chain, mobile and battery technologies. Mr. Hong received his B.S. from Korea University in 1984, M.S. from Texas
Tech University in 1986 and PhD from Arizona State University in 1991. Mr. Hong has served as a director since August 10, 2018.
Dr. Jean Koh, Independent Director
Dr. Jean Koh has served as a director since August 10, 2018 and has over 25 years of technology and senior executive experience with publicly and privately held companies within the multimedia and mobile content
technology verticals. Dr. Koh is currently serving as the Chairman of the Korea Mobile Internet Business Association (MOIBA), an association with well over 500 mobile internet companies and industry executives. In 1994, Dr. Koh founded Baro
Vision - now KOSDAQ-listed Galaxia Digital - a leading domestic developer of proprietary video compression technology, which has since transformed itself into one of South Korea´s leading providers of comprehensive e-payment solutions. Dr. Koh
received his PhD. in Computer Science from Syracuse University and currently serves as a key member on the ‘Presidential Committee of the Fourth Industrial Revolution’ under the Moon Jae-In Administration.
Mr. Charlie Baik, Independent Director
Mr. Charlie Seung Taik Baik has served as a director since August 10, 2018 and currently serves as the Chief Operating Officer and Chief Compliance Officer of EZER, Inc., a leading multi-purpose engineering firm
that addresses the needs of the utility, sustainable energy and industrial sectors. Since August 2006, Mr. Baik has also served as EZER, Inc.´s Chief Marketing Officer. Previously, Mr. Baik held the positions of Senior Executive Vice President
and Chief Marketing Officer of NASDAQ-listed Gravity Corp., a leading PC and mobile game publisher with numerous titles under its belt and the maker of the world famous ‘Ragnarok Online’, a massive multiplayer online role-playing game. Mr. Baik
also served as the Chief Operating Officer of Gravity Corp.. from August 2006 to June 2008 and as the Chief Executive Officer of NEOCYON, Inc. since 2000.
Code of Ethics
As part of our system of corporate governance, the Company adopted a Code of Business Conduct and Ethics (the “Code”) for directors and executive officers of the Company. This Code is
intended to focus each director and executive officer on areas of ethical risk, provide guidance to directors and executive officer to help them recognize and deal with ethical issues, provide mechanisms to report unethical conduct, and help
foster a culture of honesty and accountability. Each director and executive officer must comply with the letter and spirit of this Code. We intend to disclose any changes in or waivers from our Code of Business Conduct and Ethics and our
Code of Ethics for Financial Executives by filing a Form 8-K or by posting such information on our website.
The following tables lists the compensation of the Company’s principal executive officers and board members for the years ended December 31, 2020 and 2019. The following information includes the dollar value
of base salaries, bonus awards, the number of non-qualified Company Options granted and certain other compensation, if any, whether paid or deferred.
|
Name and
Principal
Position
|
Year
|
Salary
($)
|
Bonus
($)
|
Stock
Awards
|
Option
Awards
|
Non-Equity
Incentive Plan
Compensation
|
Nonqualified
Deferred
Compensation
Earnings
|
All
Other
Comp.
($)
|
Total
($)
|
|||||||||||||||||||||||||
|
Jae Cheol Oh, Chairman, Chief Executive Officer, Chief Financial Officer (5)
|
2020
2019
|
$
$
|
85,928
86,086
|
-
-
|
$
|
|
-
-
|
-
-
|
-
-
|
$
$
|
85,928
86,086
|
|||||||||||||||||||||||
|
Hong Rae Kim, Director (5)
|
2020
2019
|
$
$
|
79,022
76,092
|
-
-
|
$
|
-
-
|
-
-
|
-
-
|
$
$
|
79,022
76,092
|
||||||||||||||||||||||||
|
Jae Ho Cho, Director (5)
|
2020
2019
|
$
$
|
83,132
89,992
|
-
-
|
$
|
-
-
|
-
-
|
-
-
|
$
$
|
83,132
89,992
|
||||||||||||||||||||||||
|
Eugene Hong, Director (6)
|
2020
2019
|
$
$
|
-
-
|
-
-
|
$
|
-
-
|
-
-
|
-
-
|
$
$
|
-
-
|
||||||||||||||||||||||||
|
Jean Koh, Director (6)
|
2020
2019
|
$
$
|
-
-
|
-
-
|
$
|
-
-
|
-
-
|
-
-
|
$
$
|
-
-
|
||||||||||||||||||||||||
|
Charlie Baik, Director (6)
|
2020
2019
|
$
$
|
5,084
5,147
|
-
-
|
$
|
-
-
|
-
-
|
-
-
|
$
$
|
5,084
5,147
|
||||||||||||||||||||||||
|
(5)
|
Appointed January 25, 2018.
|
|
(6)
|
Appointed August 10, 2018.
|
Compensation of Directors
Option Grants Table
There were no individual grants of stock options to purchase our common stock made to the executive officers named in the Summary Compensation Table through to date.
Aggregated Option Exercises and Fiscal Year-End Option Value Table
There were no stock options exercised during periods ending December 31, 2020 and December 31, 2019 by the executive officer named in the Summary Compensation Table.
Long-Term Incentive Plan (‘LTIP’) Awards Table
There were no awards made to a named executive officer in the last completed fiscal year under any LTIP.
Compensation Arrangements with Executive Management
There were no compensation contracts for any of the executives of the Company at the end of December 31, 2020.
Item 12. Security Ownership of Certain Beneficial Owners and Management and Related Shareholder Matters
The following tables set forth, as of the date of this Annual Report, the beneficial ownership of Common Stock for: (1) each director currently serving on our Board of Directors; (2) each of our named executive
officers; (3) our directors and executive officers as a group; and (3) each person known to the Company to beneficially own more than 5% of the outstanding shares of Common Stock. As of March 22, 2021, there were 35,030,339 shares of Common Stock
outstanding. Except as otherwise noted, each stockholder has sole voting and investment power with respect to the shares beneficially owned. Beneficial ownership consists of a direct interest in the shares of common stock, except as otherwise
indicated.
|
Shareholder (1)
|
Beneficial
Ownership
|
Percent of
Class (2)
|
||||||
|
Jae Cheol Oh
|
14,292,723
|
40.8
|
%
|
|||||
|
Hong Rae Kim
|
1,013,396
|
2.9
|
%
|
|||||
|
Jae Ho Cho
|
0
|
0
|
%
|
|||||
|
Eugene Hong
|
0
|
0
|
%
|
|||||
|
Jean Koh
|
0
|
0
|
%
|
|||||
|
Charlie Baik
|
0
|
0
|
%
|
|||||
|
Officers and Directors as a Group (3 persons)
|
15,306,119
|
43.7
|
%
|
|||||
|
(1)
|
The address for all officers, directors and beneficial owners is 15, Teheran-ro 10-gil, Gangnam-gu, Seoul, Korea.
|
The Company receives loan guarantees from the chief executive officer with regards to its long-term borrowing, and the Company’s restricted cash provided as collateral to the Company’s chief executive officer’s loans.
Audit and Non-Audit Fees
The following table sets forth the fees for professional audit services and the fees billed for other services rendered by our auditors, in connection with the audit of our financial statements for the years ended
December 31, 2020 and 2019, and any other fees billed for services rendered by our auditors during these periods.
|
Year Ended
December 31,
2020(1)
($)
|
Year Ended
December 31,
2019(2)
($)
|
|||||||
|
Audit fees
|
$
|
75,000
|
$
|
75,000
|
||||
|
Audit-related fees
|
-0-
|
-0-
|
||||||
|
Tax fees
|
20,000
|
-0-
|
||||||
|
All other fees
|
-0-
|
-0-
|
||||||
|
Total
|
$
|
95,000
|
$
|
75,000
|
||||
| (1) |
Performed by Benjamin & Ko
|
| (2) |
Performed by Benjamin & Ko
|
Since our inception, our Board of Directors, performing the duties of the audit committee, has reviewed all audit and non-audit related fees at least annually. The Board, acting as the audit committee, pre-approved all
audit related services for the year ended December 31, 2020.
PART IV
|
Number
|
Description
|
|
|
Agreement of Merger and Plan of Reorganization among Evans Brewing Company, Inc., I-ON Digital Corp.., I-ON Acquisition Corp. and I-on Digital, Ltd. (previously filed as Exhibit 10.1 to the Company’s Current Report on Form 8-K, filed on
December 26, 2017, and incorporated herein by reference)
|
||
|
Spin-Off Agreement among Evans Brewing Company, Inc., Michael J. Rapport Trust, Evans Brewing Company, Inc. and EBC Public House, Inc. (previously filed as Exhibit 2.2 to the Company’s Current Report on Form 8-K, filed on February 1, 2018,
and incorporated herein by reference)
|
||
|
Certificate of Incorporation of the Company (previously filed as Exhibit 3.1 to the Company’s Registration Statement on Form 10, filed on July 3, 2013, and incorporated herein by reference)
|
||
|
Certificate of Amendment of Certificate of Incorporation (previously filed as Exhibit 3.3 to the Company’s Current Report on Form 8-K, filed on April 22, 2014, and incorporated herein by reference)
|
||
|
Certificate of Amendment of Certificate of Incorporation (previously filed as Exhibit 3.1 to the Company’s Current Report on Form 8-K, filed on October 23, 2015, and incorporated herein by reference)
|
|
Certificate of Amendment of Certificate of Incorporation (previously filed as Exhibit 3.1 to the Company’s Current Report on Form 8-K, filed on February 1, 2018, and incorporated herein by reference)
|
||
|
Certificate of Amendment of Certificate of Incorporation (previously filed as Exhibit 3.1 to the Company’s Current Report on Form 8-K, filed on April 3, 2019, and incorporated herein by reference)
|
||
|
By-laws of the Company (previously filed as Exhibit 3.2 to the Company’s Registration Statement on Form 10, filed on July 3, 2013, and incorporated herein by reference)
|
||
|
Certificate of Designation of Rights and Preferences for Series A Convertible Preferred Stock (previously filed as Exhibit 3.1 to the Company’s Current Report on Form 8-K, filed on December 15, 2015, and incorporated herein by reference)
|
||
|
Convertible Note Debenture in favor of Peak One Opportunity Fund, L.P., due August 13, 2021 (previously filed as Exhibit 4.1 to the Company’s Current Report on Form 8-K, filed on August 28, 2018, and incorporated herein by reference)
|
||
|
Common Stock Purchase Warrant of Peak One Opportunity Fund, L.P. (previously filed as Exhibit 4.2 to the Company’s Current Report on Form 8-K, filed on August 28, 2018, and incorporated herein by reference)
|
||
|
Securities Purchase Agreement between the Company and Peak One Opportunity Fund, L.P. (previously filed as Exhibit 10.1 to the Company’s Current Report on Form 8-K, filed on August 28, 2018, and incorporated herein by reference)
|
||
|
Equity Purchase Agreement between the Company and Peak One Opportunity Fund, L.P. (previously filed as Exhibit 10.2 to the Company’s Current Report on Form 8-K, filed on August 28, 2018, and incorporated herein by reference)
|
||
|
Registration Rights Agreement between the Company and Peak One Opportunity Fund, L.P. (previously filed as Exhibit 10.3 to the Company’s Current Report on Form 8-K, filed on August 28, 2018, and incorporated herein by reference)
|
||
|
Code of Business Conduct and Ethics (previously filed as Exhibit 14.1 to the Company’s Registration Statement on Form S-1, filed on September 27, 2017, and incorporated herein by reference)
|
||
|
List of Subsidiaries*
|
||
|
Certification of Chief Executive and Financial Officer required by Rule 13a-14(a) or Rule 15d-14(a) under the Securities Exchange Act of 1934, as amended*
|
||
|
Certification of Chief Executive Officer required by Rule 13a-14(b) or Rule 15d-14(b) under the Securities Exchange Act of 1934, as amended, and 18 U.S.C. Section 1350, as Adopted Pursuant
to Section 906 of the Sarbanes-Oxley Act of 2002*
|
|
101.INS
|
XBRL Instance Document*
|
|
|
101.SCH
|
XBRL Schema Document*
|
|
|
101.CAL
|
XBRL Calculation Linkbase Document*
|
|
|
101.DEF
|
XBRL Definition Linkbase Document*
|
|
|
101.LAB
|
XBRL Label Linkbase Document*
|
|
|
101.PRE
|
XBRL Presentation Linkbase Document*
|
| * |
Furnished herewith.
|
| ** |
Filed herewith.
|
SIGNATURES
Pursuant to the requirements of Section 13 or 15(d) of the Securities Exchange Act of 1934, the Registrant has duly caused this report to be signed on its behalf by the undersigned, thereunto duly
authorized.
Dated: March 25, 2021
|
I-ON DIGITAL CORP.
|
|||
|
By:
|
/s/ Jae Cheol Oh
|
||
|
Name: Jae Cheol Oh
|
|||
|
Title:
|
Chairman, Chief Executive Officer and Chief Financial Officer
(Principal Executive, Financial and Accounting Officer)
|
||
Pursuant to the requirements of the Securities Exchange Act of 1934, this report has been signed below by the following persons on behalf of the registrant and in the capacities and on the dates indicated:
|
March 25, 2021
|
|
|
/s/ Jae Cheol Oh
|
|
|
Name: Jae Cheol Oh
|
|
|
Title: Chairman, Chief Executive Officer and Chief Financial officer
|
|
|
(Principal Executive, Financial and Accounting Officer)
|
|
|
March 25, 2021
|
/s/ Hong Rae Kim
|
|
Name: Hong Rae Kim
|
|
|
Title: Executive Director
|
|
March 25, 2021
|
/s/ Jae Ho Cho
|
|
Name: Jae Ho Cho
|
|
|
Title: Director
|
|
March 25, 2021
|
/s/ Eugene Hong
|
|
Name: Eugene Hong
|
|
|
Title: Director
|
|
March 25, 2021
|
/s/ Jean Koh
|
|
Name: Jean Koh
|
|
|
Title: Director
|
|
March 25, 2021
|
/s/ Charlie Baik
|
|
Name: Charlie Baik
|
|
|
Title: Director
|
I-ON Digital Corp.
And Subsidiary
I-ON Digital Corp. and Subsidiary
|
3
|
||
|
Consolidated Financial Statements
|
||
|
4
|
||
|
5
|
||
|
6
|
||
|
7
|
||
|
8
|
||
 |
|
 |
To the Board of Directors and
Stockholders of I-ON Digital Corp. and subsidiaries
Opinion on the Financial Statements
We have audited the accompanying consolidated balance sheets of I-ON Digital Corp. and subsidiaries (the “Company”) as of December 31, 2020 and 2019, and the related consolidated statements of income, comprehensive
income, stockholders’ equity, and cash flows for each of the years in the two-year period ended December 31, 2020, and the related notes (collectively referred to as the consolidated financial statements). In our opinion, the consolidated
financial statements present fairly, in all material respects, the financial position of the Company as of December 31, 2020 and 2019, and the results of its operations and its cash flows for each of the years in the two-year period ended
December 31, 2020, in conformity with accounting principles generally accepted in the United States of America.
Basis for Opinion
These consolidated financial statements are the responsibility of the Company’s management. Our responsibility is to express an opinion on the Company’s consolidated financial statements based on our audits. We are
a public accounting firm registered with the Public Company Accounting Oversight Board (United States) (PCAOB) and are required to be independent with respect to the Company in accordance with the U.S. federal securities laws and the applicable
rules and regulations of the Securities and Exchange Commission and the PCAOB.
We conducted our audits in accordance with the standards of the PCAOB. Those standards require that we plan and perform the audit to obtain reasonable assurance about whether the consolidated financial statements
are free of material misstatement, whether due to error or fraud. The Company is not required to have, nor were we engaged to perform, an audit of its internal control over financial reporting. As part of our audits, we are required to obtain an
understanding of internal control over financial reporting, but not for the purpose of expressing an opinion on the effectiveness of the Company’s internal control over financial reporting. Accordingly, we express no such opinion.
Our audits included performing procedures to assess the risks of material misstatement of the consolidated financial statements, whether due to error or fraud, and performing procedures that respond to those risks.
Such procedures included examining, on a test basis, evidence regarding the amounts and disclosures in the consolidated financial statements. Our audits also included evaluating the accounting principles used and significant estimates made by
management, as well as evaluating the overall presentation of the consolidated financial statements. We believe that our audits provide a reasonable basis for our opinion.
Critical Audit Matters
The critical audit matters communicated below are matters arising from the current period audit of the consolidated financial statements that were communicated or required to be communicated to the audit committee
and that: (1) relate to accounts or disclosures that are material to the financial statements and (2) involved especially challenging, subjective, or complex judgments. The communication of critical audit matters does not alter in any way our
opinion on the financial statements, taken as a whole, and we are not, by communicating the critical audit matters below, providing separate opinions on the critical audit matters or on the accounts or disclosures to which they relate.
| • |
Revenue recognition for certain long-term fixed-price contracts
|
Critical Audit Matter Description
As discussed in Notes 2 to the consolidated financial statements, the Company has a few long-term fixed-price contracts whereby the Company recognizes revenue over the contract period using
estimated hours incurred which approximates actual hours on a monthly basis. The Company provides long-term fixed-price contracts to customers based on estimated hours to complete the services to full-fill the contract requirements.
Accordingly, the Company recognizes revenue on a monthly basis based on percentage completion over the contract period based on estimated hours incurred which approximates actual labor hours. Estimates regarding the Company’s costs, which is
primarily labor costs, associated with the service are used in determining the estimated hours incurred which approximates actual costs. The Company has historically been materially accurate in estimating the hours over the contract period
compared to actual hours incurred.
We identified the evaluation of revenue recognition for certain long-term fixed-price contracts as a critical audit matter as the Company’s estimated hours to incur over the contract period to
complete services require a high degree of subjective auditor judgment given the nature and complexity of the work to be performed. The determination of, and changes to, those estimates may have a material impact on revenue recorded.
How the Critical Audit Matter was Addressed in the Audit
The following are the primary procedures we performed to address this critical audit matter. We inquired of financial and operational personnel of the Company and inspected supporting
documents to identify factors on how the Company estimates hours over the contract period. We evaluated the Company’s revenue recognition for long-term fixed-price contracts as follows:
|
o
|
reading the underlying contracts and related amendments to obtain an understanding of the contractual requirements and related performance obligations,
|
|
o
|
considering hours incurred to-date and the relative progress towards completion of the contracts,
|
|
o
|
considering, if relevant, the estimated reserves on specific contracts that include estimation uncertainty based on the nature of the contract, and
|
|
o
|
evaluating the Company’s assessment of contract performance risks included within the estimated hours to complete.
|
|
•
|
Income taxes and Deferred Tax Assets
|
Critical Audit Matter Description
The Company’s net deferred income tax asset was $1.0 million as of December 31, 2020 and the related total income tax expense was $0.4 million for the year ended December 31, 2020. Income taxes
are provided based on the asset and liability method of accounting. The provision for income taxes is based on pretax financial income. Deferred tax assets and liabilities are recognized for the future expected tax consequences of temporary
differences between income tax and financial reporting and principally relate to differences in the tax basis of assets and liabilities and their reported amounts, using enacted tax rates in effect for the year in which differences are expected
to reverse. Filing positions in all of the foreign, federal and state jurisdictions where the Company is required to file income tax returns are analyzed by the Company, as well as all open tax years in these jurisdictions, to determine whether
the positions will be more likely than not be sustained by the applicable tax authority. Tax positions not deemed to meet the more-likely-than-not threshold are not recorded as a tax benefit or expense in the current year.
We identified income taxes and deferred income tax asset positions as a critical audit matter due to the Company operating in the foreign jurisdictions and the complexity of tax laws and
regulations. Performing audit procedures and evaluating audit evidence obtained related to these considerations required a high degree of judgement and effort.
How the Critical Audit Matter was Addressed in the Audit
Our audit procedures performed to address this critical audit matter included the following, among others:
|
o
|
We evaluated the completeness and accuracy of deferred income taxes and the income tax provision by agreement to material tax filings.
|
|
o
|
We assessed the reasonableness of the key judgements and estimates inherent in management’s assessment of their tax obligation and uncertain tax positions, including analysis over forecasts and tax
elections.
|
|
o
|
We involved our tax specialists with our evaluation of management’s judgements that no uncertain positions exist by analyzing the related tax law, statutes, and regulations and their application to
the Company’s positions.
|
|
o
|
We evaluated the adequacy of the Company’s disclosure in Note 12 in relation to the income taxes.
|
|
o
|
We evaluated the assumptions and estimates used by management in the context of other audit evidence obtained during the audit.
|
Benjamin & Ko /s/
We have served as the Company’s auditor since 2019.
Santa Ana, California
March 25, 2021
I-ON Digital Corp., and Subsidiary
|
December 31,
|
2020
|
2019
|
||||||
|
|
||||||||
|
ASSETS
|
||||||||
|
|
||||||||
|
Current assets:
|
||||||||
|
Cash and cash equivalents
|
$
|
4,521,328
|
$
|
1,337,741
|
||||
|
Restricted cash
|
1,746,324
|
1,641,043
|
||||||
|
Short-term financial instruments
|
771,140
|
716,013
|
||||||
|
Short-term loan receivable
|
137,868
|
197,741
|
||||||
|
Accounts receivables, net of allowance for doubtful accounts $619,336 and $674,129, respectively
|
3,006,084
|
2,875,384
|
||||||
|
Deferred tax assests - current
|
274,291
|
232,766
|
||||||
|
Prepaid expenses and other current assets
|
1,099,493
|
1,055,553
|
||||||
|
Total current assets
|
11,556,528
|
8,056,241
|
||||||
|
|
||||||||
|
Non-current assets:
|
||||||||
|
Investments
|
101,517
|
105,437
|
||||||
|
Property and equipment, net
|
118,402
|
203,754
|
||||||
|
Intangible assets, net
|
232,400
|
192,868
|
||||||
|
Deposits
|
395,585
|
354,300
|
||||||
|
Derivative asset
|
-
|
105,594
|
||||||
|
Deferred tax assets - non current
|
755,795
|
774,307
|
||||||
|
Total non-current assets
|
1,603,699
|
1,736,260
|
||||||
|
Total Assets
|
$
|
13,160,227
|
$
|
9,792,501
|
||||
|
|
||||||||
|
Liabilities and Stockholders’ Equity
|
||||||||
|
|
||||||||
|
Current liabilities:
|
||||||||
|
Accounts payable
|
$
|
626,919
|
$
|
48,802
|
||||
|
Accrued expenses and other
|
1,835,463
|
1,705,485
|
||||||
|
Value added tax payable
|
233,477
|
107,717
|
||||||
|
Income tax payable
|
31,668
|
8,179
|
||||||
|
Short-term loan payable
|
505,515
|
475,039
|
||||||
|
Current portion of long term debt
|
206,765
|
194,300
|
||||||
|
Government grants outstanding
|
424,439
|
-
|
||||||
|
Total current liabilities
|
3,864,246
|
2,539,522
|
||||||
|
Long term debt, net of current portion
|
-
|
194,300
|
||||||
|
Total liabilities
|
3,864,246
|
2,733,822
|
||||||
|
|
||||||||
|
Commitments and contingencies
|
||||||||
|
|
||||||||
|
Stockholders’ Equity
|
||||||||
|
Common stock - $0.0001 par value; authorized 100,000,000 shares; 35,030,339 shares issued and outstanding at December 31, 2020 and December 31, 2019
|
3,503
|
3,603
|
||||||
|
Treasury stock
|
(709,478
|
)
|
(709,478
|
)
|
||||
|
Additional paid-in-capital
|
3,713,370
|
3,646,740
|
||||||
|
Accumulated other comprehensive loss
|
289,933
|
(259,960
|
)
|
|||||
|
Accumulated retained earnings
|
5,517,785
|
3,897,337
|
||||||
|
Total company stockholders’ equity
|
8,815,113
|
6,578,242
|
||||||
|
Preferred stock (I-ON Korea) - $.4380 par value; authorized 2,000,000 shares; 157,142 shares issued and outstanding at December 31, 2020 and at December 31, 2019
|
475,036
|
475,036
|
||||||
|
Non-controlling interests
|
5,832
|
5,401
|
||||||
|
Total stockholders’ equity
|
9,295,981
|
7,058,679
|
||||||
|
Total Liabilities and Stockholders’ Equity
|
$
|
13,160,227
|
$
|
9,792,501
|
||||
See accompanying notes to consolidated financial statements.
I-ON Digital Corp., and Subsidiary
|
Years Ended December 31,
|
||||||||
|
2020
|
2019
|
|||||||
|
Net sales
|
$
|
10,471,502
|
$
|
7,954,015
|
||||
|
Cost of goods sold
|
6,078,030
|
5,519,931
|
||||||
|
Gross profit
|
4,393,472
|
2,434,084
|
||||||
|
Operating expense:
|
||||||||
|
Research and development
|
999,209
|
838,237
|
||||||
|
General and administrative
|
1,697,377
|
1,871,818
|
||||||
|
Total operating expense
|
2,696,586
|
2,710,055
|
||||||
|
Income (loss) from operations
|
1,696,886
|
(275,971
|
)
|
|||||
|
Other income (expense):
|
||||||||
|
Loss on extinguishment of convertible debt
|
-
|
(216,208
|
)
|
|||||
|
Interest income
|
45,405
|
52,104
|
||||||
|
Foreign currency transaction gain (loss)
|
(1,865
|
)
|
14,966
|
|||||
|
Government subsidized income
|
15,487
|
6,391
|
||||||
|
Miscellaneous income, net
|
(24,957
|
)
|
35,308
|
|||||
|
Interest expense
|
(23,507
|
)
|
(48,041
|
)
|
||||
|
Total other income (expense), net
|
10,563
|
(155,480
|
)
|
|||||
|
Income (loss) before provision for income taxes, and non-controlling interest
|
1,707,449
|
(431,451
|
)
|
|||||
|
Provision for (benefit from) income tax
|
86,570
|
276,015
|
||||||
|
Net income (loss) before non-controlling interest
|
1,620,879
|
(707,466
|
)
|
|||||
|
Non-controlling interest income (loss)
|
431
|
4,982
|
||||||
|
Net income (loss)
|
$
|
1,620,448
|
$
|
(712,448
|
)
|
|||
|
Comprehensive income statement:
|
||||||||
|
Net income (loss)
|
$
|
1,620,879
|
$
|
(707,466
|
)
|
|||
|
Foreign currency translation gain (loss)
|
549,893
|
(207,767
|
)
|
|||||
|
Total comprehensive income (loss)
|
$
|
2,170,772
|
$
|
(915,233
|
)
|
|||
|
Earnings per share - Basic
|
||||||||
|
Net income (loss) before non-controlling interest
|
$
|
0.05
|
$
|
(0.02
|
)
|
|||
|
Non-controlling interest
|
$
|
0.00
|
$
|
0.00
|
||||
|
Earnings per share to stockholders
|
$
|
0.05
|
$
|
(0.02
|
)
|
|||
|
Earnings per share - Diluted
|
||||||||
|
Net income (loss) before non-controlling interest
|
$
|
0.05
|
$
|
(0.02
|
)
|
|||
|
Non-controlling interest
|
$
|
0.00
|
$
|
0.00
|
||||
|
Earnings per share to stockholders
|
$
|
0.05
|
$
|
(0.02
|
)
|
|||
|
Weighted average number of common shares outstanding:
|
||||||||
|
Basic
|
35,030,339
|
35,030,339
|
||||||
|
Diluted
|
35,030,339
|
35,030,339
|
||||||
See accompanying notes to consolidated financial statements.
I-ON Digital Corp. and Subsidiary
|
Common Stock
|
||||||||||||||||||||||||||||||||||||||||
|
Shares
|
Amount
|
Additional Paid-In Capital
|
Retained Earnings
|
Treasury Stock
|
Accumulated Other Comprehensive Income (Loss)
|
Total Company Stockholders' Equity
|
Non-Controlling Interst
|
Preferred Stock
|
Total Stockholders' Equity
|
|||||||||||||||||||||||||||||||
|
Balance at December 31, 2018
|
35,030,339
|
$
|
3,603
|
$
|
3,582,987
|
$
|
4,609,785
|
$
|
(709,478
|
)
|
$
|
(52,193
|
)
|
$
|
7,434,704
|
$
|
419
|
$
|
-
|
$
|
7,435,123
|
|||||||||||||||||||
|
Foreign currency translation
|
-
|
-
|
-
|
-
|
-
|
(207,767
|
)
|
(207,767
|
)
|
-
|
-
|
(207,767
|
)
|
|||||||||||||||||||||||||||
|
Stock compensation expense
|
-
|
-
|
63,753
|
-
|
-
|
-
|
63,753
|
-
|
-
|
63,753
|
||||||||||||||||||||||||||||||
|
Issuance of preferred stock of subsidiary (I-ON Korea)
|
-
|
-
|
-
|
-
|
-
|
-
|
-
|
-
|
475,036
|
475,036
|
||||||||||||||||||||||||||||||
|
Net income (loss)
|
-
|
-
|
-
|
(712,448
|
)
|
-
|
-
|
(712,448
|
)
|
4,982
|
-
|
(707,466
|
)
|
|||||||||||||||||||||||||||
|
Balance at December 31, 2019
|
35,030,339
|
$
|
3,603
|
$
|
3,646,740
|
$
|
3,897,337
|
$
|
(709,478
|
)
|
$
|
(259,960
|
)
|
$
|
6,578,242
|
$
|
5,401
|
$
|
475,036
|
$
|
7,058,679
|
|||||||||||||||||||
|
Reclassification of issuance of common stock in connection with equity purchase agreement
|
-
|
(100
|
)
|
100
|
-
|
-
|
-
|
-
|
-
|
-
|
-
|
|||||||||||||||||||||||||||||
|
Foreign currency translation
|
-
|
-
|
-
|
-
|
-
|
549,893
|
549,893
|
-
|
-
|
549,893
|
||||||||||||||||||||||||||||||
|
Stock compensation expense
|
-
|
-
|
66,530
|
-
|
-
|
-
|
66,530
|
-
|
-
|
66,530
|
||||||||||||||||||||||||||||||
|
Net income (loss)
|
-
|
-
|
-
|
1,620,448
|
-
|
-
|
1,620,448
|
431
|
-
|
1,620,879
|
||||||||||||||||||||||||||||||
|
Balance at December 31, 2020
|
35,030,339
|
$
|
3,503
|
$
|
3,713,370
|
$
|
5,517,785
|
$
|
(709,478
|
)
|
$
|
289,933
|
$
|
8,815,113
|
$
|
5,832
|
$
|
475,036
|
$
|
9,295,981
|
||||||||||||||||||||
See accompanying notes to consolidated financial statements.
I-ON Digital Corp. and Subsidiary
|
Years ended December 31,
|
2020
|
2019
|
||||||
|
Cash flows from operating activities:
|
||||||||
|
Net income (loss)
|
$
|
1,620,448
|
$
|
(712,448
|
)
|
|||
|
Adjustments to reconcile net income (loss) to net cash used in operating activities:
|
||||||||
|
Non-controlling interest
|
431
|
10,360
|
||||||
|
Depreciation - fixed assets
|
111,806
|
215,919
|
||||||
|
Amortization of intangible assets
|
29,179
|
24,134
|
||||||
|
Stock options expense
|
66,530
|
63,753
|
||||||
|
Amortization of debt discount
|
-
|
11,111
|
||||||
|
Loss on extinguishment of convertible debt
|
-
|
216,208
|
||||||
|
Foreign exchange gain (loss)
|
-
|
978
|
||||||
|
Interest expense - OID on convertible debt
|
-
|
(55,000
|
)
|
|||||
|
Changes in operating assets and liabilities:
|
||||||||
|
Account receivable, net
|
148,057
|
(205,056
|
)
|
|||||
|
Prepaid expenses and other current assets
|
21,924
|
(226,447
|
)
|
|||||
|
Deposit
|
(17,108
|
)
|
(8,491
|
)
|
||||
|
Deferred taxes
|
38,351
|
225,161
|
||||||
|
Account payable
|
431,649
|
(352,800
|
)
|
|||||
|
Accrued expenses and other
|
18,960
|
935,576
|
||||||
|
Value added tax payable
|
109,578
|
2,885
|
||||||
|
Income tax payable
|
21,173
|
(11,399
|
)
|
|||||
|
Net cash provided by operating activities
|
2,600,978
|
134,444
|
||||||
|
Cash flows from investing activities:
|
||||||||
|
Proceeds from (purchases of) investments
|
(49,998
|
)
|
(9,972
|
)
|
||||
|
Purchases of property and equipment
|
(21,060
|
)
|
(196,729
|
)
|
||||
|
Purchases of intangible assets
|
(54,219
|
)
|
(83,852
|
)
|
||||
|
Payments received from short-term loan receivable
|
136,117
|
29,123
|
||||||
|
Loans provided under short-term loans
|
(17,842
|
)
|
(200,701
|
)
|
||||
|
Net cash used in investing activities
|
(7,002
|
)
|
(462,131
|
)
|
||||
|
Cash flows from financing activities:
|
||||||||
|
Payments on short-term loan payable
|
-
|
(600,523
|
)
|
|||||
|
Proceeds from loan
|
-
|
471,840
|
||||||
|
Principal payments on long-term debt
|
(190,636
|
)
|
(85,858
|
)
|
||||
|
Principal payments on convertible debt
|
-
|
(200,000
|
)
|
|||||
|
Proceeds from issuance of non-controlling interest preferred shares issued by subsidiary
|
-
|
471,837
|
||||||
|
Net receipt of government grants
|
391,330
|
-
|
||||||
|
Net cash provided by financing activities
|
200,694
|
57,296
|
||||||
|
Effect of foreign currency translation on cash and cash equivalents
|
494,198
|
(159,366
|
)
|
|||||
|
Net increase (decrease) in cash and cash equivalents
|
3,288,868
|
(429,757
|
)
|
|||||
|
Cash and cash equivalents including restricted cash, beginning of year
|
2,978,784
|
3,408,541
|
||||||
|
Cash and cash equivalents including restricted cash, end of year
|
$
|
6,267,652
|
$
|
2,978,784
|
||||
|
Supplemental disclosure of cash flow information:
|
||||||||
|
Interest paid
|
$
|
23,507
|
$
|
6,750
|
||||
|
Taxes paid
|
$
|
26,689
|
$
|
6,757
|
||||
See accompanying notes to consolidated financial statements.
I-ON Digital Corp. and Subsidiary
| Note 1. |
Organization and Operations
|
I-ON Digital Corp. (“the Company”) was incorporated on July 5, 1999, and is engaged in developing and supplying computerized system. The corporate headquarter is located at 15 Teheran-ro 10-gil Gangnam-gu Seoul,
South Korea. The Company provides enterprise content management services to customers primarily in Korea, Japan and Indonesia, by developing industry-leading products such as ICS (web content management system), iDrive (e-document management
system), LAMS (load aggregator’s management system), e.Form (mobile contract system), IDAS (digital asset management system) and ICE (content delivery system).
I-ON, Ltd is the Japanese subsidiary of the Company incorporated in 2002. The Company has 99.5% ownership of I-ON, Ltd. PT ION-soft is the Indonesian affiliate of the Company incorporated in October 2011 (20% of ownership). The Company’s
ownership of PT I-ON-soft was reduced to 0.9%, due to the capital infusion of the major shareholder on August 1, 2019.
| Note 2. |
Summary of Significant Accounting Policies
|
The summary of significant accounting policies of the Company is presented to assist in understanding the Company’s consolidated financial statements. The consolidated financial statements and notes are
representations of the Company’s management, who is responsible for integrity and objectivity. These accounting policies conform to accounting principles generally accepted in the United States of America
and have been consistently applied in the preparation of the consolidated financial statements.
Principles of Consolidation and Presentation
The consolidated financial statements include the accounts of I-ON Digital Corp. and its 99.5% owned subsidiary, I-ON, Ltd. All intercompany accounts, transactions, and profits have been eliminated upon
consolidation. The accompanying consolidated financial statements and the notes hereto are reported in US Dollars.
The consolidated financial statements were prepared and presented in accordance with Financial Accounting Standards Board (“FASB”) Accounting Standards Codification (“ASC”) 810, Consolidation. Non-controlling
interests represent the portion of earnings that is not within the parent Company’s control. These amounts are required to be reported as equity instead of as a liability on the consolidated balance sheet. ASC requires net income or loss from
non-controlling interests to be shown separately on the consolidated statements of operations.
The consolidated financial statements included herein have been prepared by the Company pursuant to the rules and regulations of the Securities and Exchange Commission (the “SEC”). Certain information and
footnote disclosures normally included in the financial statements prepared in accordance with accounting principles generally accepted in the United States of America (“GAAP”) have been omitted pursuant to such rules and regulations.
The Company is also required to consolidate any variable interest entities (VIEs), of which it is the primary beneficiary, as defined. Based on the Company’s analysis pursuant to ASC 810-10-25,
Consolidations, the Company does not have any VIEs that need to be consolidated at this time. When the Company does not have a controlling interest in an entity, but exerts a significant influence over the entity, the Company would apply
the equity method of accounting.
Foreign Currency Transaction and Translation
The Company’s principal country of operations is Korea. The financial position and results of operations of the Company are determined using the local currency, Korean Won (“KRW”), as the functional
currency.
| ● |
I-ON, Ltd (Japanese subsidiary) – The financial position and results of operations of I-ON, Ltd, the Japanese subsidiary of the Company, are initially recorded using its local currency, Japanese Yen (“JPY”). Assets and liabilities
denominated in foreign currency are translated to the functional currency at the functional currency rate of exchange at the balance sheet date. The results of operations denominated in foreign currency are translated at the average
rate of exchange during the reporting period. All differences are reflected in accumulated other comprehensive income.
|
|
December 31,
|
December 31,
|
Average Year Ended
December 31,
|
|||||||
|
Currency
|
2020
|
2019
|
2020
|
2019
|
|||||
|
Japanese Yen to Korean Won
|
JPY10.54
|
JPY 10.63
|
JPY11.05
|
JPY10.69
|
|||||
|
Korean Won to US Dollar ($)
|
KRW1,088.00
|
KRW 1,157.80
|
KRW1,180.05
|
KRW 1,165.65
|
|||||
Source (Seoul Money Brokerage Services)
| ● |
Consolidation – Assets and liabilities denominated in foreign currencies at the balance sheet date are translated at the exchange rated prevailing at the balance sheet date. The results of operations are translated from KRW to US
Dollar at the weighted average rate of exchange during the reporting period. The registered equity capital denominated in the functional currency is translated at the historical rate of exchange at the time of capital contribution. All
translation adjustments resulting from the translation of the financial statements into the reporting currency, US Dollar, are dealt with as a component of accumulated other comprehensive income.
|
Translation adjustments were a net gain of $549,893 and net loss of $207,767 for the years ended December 31, 2020 and 2019, respectively.
Segment Reporting
FASB ASC 280, Segment Reporting, requires public companies to report financial and descriptive information about their reportable operating segments. Operating segments
are defined as components of an enterprise about which separate financial information is available and that is evaluated regularly by the chief operating decision maker in deciding how to allocate resources and in assessing performance. The
Company’s chief executive officer has been identified as the chief operating decision maker.
The Company generates revenues from two geographic areas, consisting of Korea and Japan. The following enterprise-wide disclosure is prepared on a basis consistent with the preparation of the consolidated
financial statements:
|
2020
|
2019
|
|||||||
|
Korea:
|
||||||||
|
Current assets
|
$
|
10,998,742
|
$
|
7,821,531
|
||||
|
Non-current assets
|
1,603,402
|
1,735,978
|
||||||
|
Current liabilities
|
3,535,680
|
2,437,550
|
||||||
|
Non-current liabilities
|
-
|
194,300
|
||||||
|
Net Sales
|
8,872,013
|
7,141,655
|
||||||
|
Japan:
|
||||||||
|
Current assets
|
$
|
557,786
|
$
|
234,710
|
||||
|
Non-current assets
|
297
|
282
|
||||||
|
Current liabilities
|
328,566
|
101,972
|
||||||
|
Non-current liabilities
|
-
|
-
|
||||||
|
Net Sales
|
1,599,489
|
812,360
|
||||||
I-ON Digital Corp. and Subsidiary
Notes to Consolidated Financial Statements
Revenue Recognition
Revenues are recognized when control of the promised services is transferred to the Company’s customers, in an amount that reflects the consideration the Company expects to be entitled to in exchange for those services.
The Company’s revenue consists of services provided, royalties and commissions. These revenue sources are as follows:
| ∙ |
Royalty – the Company receives a fixed amount of royalties from a company in Japan for providing rights to sell the Company’s products in Japanese market. Revenue is recognized over the contract and
service period and when collectability is reasonably assured.
|
| ∙ |
License Solution & Services – the Company recognizes revenue on installation of the web-content management software, services provided for installation, and customization.
|
| ∙ |
Customizing Services – the Company recognizes revenue from processing transactions between businesses and their customers. Revenue is recognized over the contract and service period and when
collectability is reasonably assured.
|
| ∙ |
Maintenance – the Company recognizes revenue over the contract term based on percentage-of-completion method.
|
Investments
The Company classifies its investment securities as available-for-sale securities in accordance with FASB ASC 320, Investments and records these securities at fair value.
Unrealized gains and losses as results of changes in the fair value of the available-for-sale investments are recorded as a separate component within accumulated other comprehensive income in the accompanying balance sheets. At December 31, 2020
and 2019, cost approximates investment value resulting in zero unrealized gain or loss, therefore, the changes in available for sale securities during 2020 and 2019 are the result of the foreign currency translation which is included in foreign
currency translation and recorded under accumulated other comprehensive income or loss statements.
The Company’s investment securities include privately-held companies where quoted market prices are not available and the cost method, combined with other intrinsic information, is used to assess the fair value
of the investment. If the carrying value is below the fair value of an investment at the end of any period, the investment is considered for impairment. Investments are considered impaired when a decline in fair value is judged to be
other-than-temporary. Once a decline in fair value is determined to be other-than-temporary, an impairment charge is recorded, and a new cost basis in the investment is established.
Cash and Cash Equivalents
The Company considers all money market funds and highly liquid financial instruments with maturities of three months or less when acquired to be cash equivalents.
Restricted Cash
Restricted cash represents cash deposits which is restricted by the financial institutions for the loans the financial institutions have with the Company’s chief executive officer. The loans with the financial institutions amounted to
approximately $1,572,000 and $1,502,000 at December 31, 2020 and 2019, respectively, and expires on various days during 2020 and 2021, unless extended. The loans, bearing various interest rates, are guaranteed by the Company and the
restricted cash deposits of the Company are provided to the financial institutions as collateral. The Company’s chief executive officer pays interest from the loans without any default at December 31, 2020 and 2019. The amount of restricted
cash as of December 31, 2020 and 2019 was $1,746,324 and $1,641,043, respectively.
This arrangement could be considered as a violation of Section 402 of the Sarbanes-Oxley Act of 2002 amended the Securities Exchange Act of 1934 to prohibit U.S. and foreign companies with securities traded in
the United States from making, or arranging for third parties to make, nearly any type of personal loan to their directors and executive officers. Violations of the Sarbanes-Oxley loan prohibition are subject to the civil and criminal penalties
applicable to violations of the Exchange Act.
I-ON Digital Corp. and Subsidiary
Notes to Consolidated Financial Statements
Short-Term Financial Instruments
Short-term financial instruments represent interest-bearing certificates of deposits with original maturities between three months to year.
Accounts Receivable
Accounts receivables are recorded at the invoiced amount and do not bear interest. Amounts collected on accounts receivables are included in net cash provided by operating activities in the consolidated cash flow
statements. The allowance for doubtful accounts reflects management’s best estimate of probable losses inherent in the trade accounts receivable. Management primarily determines the allowance based on the aging of accounts receivable balances,
historical write-off experience, customer concentrations, customer credit worthiness and current industry and economic trends. The Company’s provision for uncollectible receivables are included in selling, marketing, general and administrative
expense in the consolidated statements of operation and comprehensive loss. At December 31, 2020 and 2019, allowance for doubtful accounts was approximately $620,000 and $674,000, respectively. The Company does not have any off-balance sheet
exposure related to its customers.
Property and Equipment
Property and equipment are recorded at cost. Depreciation of property and equipment is computed using the declining balance method, based on the estimated useful lives as follows:
|
Facility equipment
|
4 years
|
|
Automobile
|
4 years
|
|
Office equipment
|
4 years
|
Repairs and maintenance are expensed as incurred. Expenditures that increase the value or productive capacity of assets are capitalized. When property and equipment are retired, sold, or otherwise disposed of,
the asset’s carrying amount and related accumulated depreciation are removed from the accounts, and any gain or loss is included in operations.
The Company is working on a government research project and many other technical innovation projects. The Company receives government grants that it uses to offset the amount of assets acquired or expenses
incurred.
Research and Development
Research and development costs are expensed as incurred. Research and development costs include travel, payroll, and other general expenses specific to research and development activities.
Research and development cost for the years ended December 31, 2020 and 2019 were approximately $999,000 and $838,000, respectively.
I-ON Digital Corp. and Subsidiary
Notes to Consolidated Financial Statements
Intangible Assets
When the Company acquires an intangible asset, it is recorded at acquisition cost (the purchase price of the intangible asset and the costs directly related to the preparation of the asset for its intended purpose). The cost of an intangible
asset acquired in a business combination is measured at the fair value at the acquisition date according to the accounting standards for business combinations. Intangible assets with a finite life are amortized using the straight-line method
over their estimated useful lives.
The estimated useful lives of the respective asset categories are as follows:
|
Development costs
|
3 years
|
|
Intangible assets excluding development costs
|
10 years
|
|
Other Intangible assets
|
3 to 5 years
|
Severance and Retirement Benefits
In accordance with the Korean Labor Standard Law, employees and directors with at least one year of service are entitled to receive a lump-sum payment upon termination of their employment, based on their length of
service and rate of pay at the time of termination. Accrued severance benefits represent an amount which would be payable assuming all eligible employees and directors were to terminate their employment as of the balance sheet date. The annual
severance benefits expense charged to operations is calculated based upon the net change in the accrued severance benefits payable at the balance sheet date based on the guidance of FASB ASC 960, Accounting –
Defined Benefit Pension Plans.
The Company’s retirement pension plan is a defined contribution plan, and the Company pays the defined contribution regardless of the result of the operations of the Company. The Company recognizes the contributions to be paid in the
current accounting period as retirement benefits expense. The amounts recognized as costs related to defined contribution plans were $390,234 and $353,892 for the years
ended December 31, 2020 and 2019, respectively.
Compensated Absences
Employees of the Company are entitled to be compensated for absences depending on job classification, length of service, and other factors. At December 31, 2020 and 2019, the amounts were deemed to be
immaterial.
Impairment analysis for long-lived assets and intangible assets
The Company’s long-lived assets and intangible assets (consisting of property and equipment and purchased intangible assets) are reviewed for impairment in accordance with the guidance of the FASB ASC 360, Property, Plant, and Equipment and FASB ASC 205 Presentation of Financial Statements. The Company tests for impairment losses on long-lived assets used in operations whenever events or changes in circumstances
indicate that the carrying amount of the asset may not be recoverable. Recoverability of an asset to be held and used is measured by a comparison of the carrying amount of an asset to the future undiscounted cash flows expected to be
generated by the asset. If such asset is considered to be impaired, the impairment to be recognized is measured by the amount by which the carrying amount of the asset exceeds its fair value. Impairment evaluations involve
management’s estimates on asset useful lives and future cash flows. Actual useful lives and cash flows could be different from those estimated by management which could have a material effect on our reporting results and financial
positions. Fair value is determined through various valuation techniques including discounted cash flow models, quoted market values and third-party independent appraisals, as considered necessary. The Company had not experienced
impairment losses on its long-lived assets and intangible assets during any of the periods presented.
I-ON Digital Corp. and Subsidiary
Notes to Consolidated Financial Statements
FASB ASC Topic 260, Earnings Per Share, requires a reconciliation of the numerator and denominator of the basic and diluted earnings (loss) per share (EPS) computations.
Basic earnings (loss) per share are computed by dividing net earnings available to common shareholders by the weighted-average number of common shares outstanding during the period. Diluted earnings (loss) per share is computed similar to basic
earnings per share except that the denominator is increased to include the number of additional common shares that would have been outstanding if the potential common shares had been issued and if the additional common shares were dilutive. In
periods where losses are reported, the weighted-average number of common stock outstanding excludes common stock equivalents, because their inclusion would be anti-dilutive.
Fair Value Measurements
The Company follows FASB ASC Topic 820, Fair Value Measurements. ASC 820 defines fair value, establishes a framework for measuring fair value under generally accepted
accounting principles and enhances disclosures about fair value measurements. Fair value is defined under ASC 820 as the exchange price that would be received for an asset or paid to transfer a liability in the principal or most advantageous
market for the asset or liability in an orderly transaction between market participants.
ASC 820 establishes a hierarchy of valuation inputs based on the extent to which the inputs are observable in the marketplace. Observable inputs reflect market data obtained from sources independent of the
reporting entity and unobservable inputs reflect the entity’s own assumptions about how market participants would value an asset or liability based on the best information available.
Valuation techniques used to measure fair value under ASC 820 must maximize the use of observable inputs and minimize the use of unobservable inputs. The standard describes a fair value hierarchy based on three
levels of inputs, of which the first two are considered observable and the last unobservable, that may be used to measure fair value.
The following describes the hierarchy of inputs used to measure fair value and the primary valuation methodologies used by the Company for financial instruments measured at fair value on a recurring basis.
The three levels of inputs are as follows:
| Level 1 |
Quoted prices in active markets for identical assets or liabilities that the Company has an ability to access as of the measurement date.
|
| Level 2 |
Inputs that are observable, either directly or indirectly, such as quoted prices for similar assets or liabilities, quoted prices in markets that are not active, or other inputs that are observable or can be corroborated by
observable market data for substantially the same term of the assets or liabilities.
|
| Level 3 |
Unobservable inputs that are supported by little or no market activity and that are significant to the fair value of the assets or liabilities.
|
A financial instrument’s categorization within the valuation hierarchy is based upon the lowest level of input that is significant to the fair value measurement. Our financial instruments include cash and cash
equivalents, restricted cash, short-term financial instruments, short-term loans, accounts receivable, investments, accounts payables and debt. The carrying values of these financial instruments approximate their fair value due to their short
maturities. The carrying amount of our debt approximates fair value because the interest rates on these instruments approximate the interest rate on debt with similar terms available to us.
I-ON Digital Corp. and Subsidiary
Notes to Consolidated Financial Statements
| ∙ |
Investments in privately-held companies, where quoted market prices are not available, accounted for as available-for-sale securities, classified as Level 3 within the fair value hierarchy, and are recorded as an asset on the
consolidated balance sheet
|
| ∙ |
An equity purchase put option that meets the definition of a derivative, classified as Level 3 within the fair value hierarchy, which is recorded as an asset on the consolidated balance sheet
|
The derivatives are evaluated under the hierarchy of ASC 480-10, ASC Paragraph 815-25-1 and ASC Subparagraph 815-10-15-74 addressing embedded derivatives. The fair value of the Level 3 financial instruments was
determined with the assistance of an independent third-party valuation specialist using an Option Pricing Model.
The following table summarize the Company’s fair value measurements by level at December 31, 2020 for the assets measured at fair value on a recurring basis:
|
December 31, 2020
|
||||||||||||
|
Level 1
|
Level 2
|
Level 3
|
||||||||||
|
Available-for-sale securities
|
$
|
-
|
$
|
-
|
$
|
101,517
|
||||||
|
Equity purchase put option
|
- |
- |
- |
|||||||||
|
Fair value, at December 31, 2020
|
$
|
-
|
$
|
-
|
$
|
101,517
|
||||||
The following table summarize the Company’s fair value measurements by level at December 31, 2019 for the assets measured at fair value on a recurring basis:
|
December 31, 2019
|
||||||||||||
|
Level 1
|
Level 2
|
Level 3
|
||||||||||
|
Available-for-sale securities
|
$
|
-
|
$
|
-
|
$
|
105,437
|
||||||
|
Equity purchase put option
|
-
|
-
|
105,594
|
|||||||||
|
Fair value, at December 31, 2019
|
$
|
-
|
$
|
0
|
$
|
211,031
|
||||||
Income Taxes
Income taxes are provided for the tax effects of transactions reported in the financial statements and consists of taxes currently due and deferred taxes. Deferred taxes are recognized for the differences between
the basis of assets and liabilities for financial statement and income tax purposes.
The Company follows FASB ASC 740, Income Taxes, which requires the recognition of deferred tax assets and liabilities for the expected future tax consequences of events
that have been included in the financial statements or tax returns. Under this method, deferred income taxes are recognized for the tax consequences in future years of differences between the tax bases of assets and liabilities and their
financial reporting amounts at each period end based on enacted tax laws and statutory tax rates, applicable to the periods in which the differences are expected to affect taxable income. Valuation allowances are established, when necessary, to
reduce deferred tax assets to the amount expected to be realized.
I-ON Digital Corp. and Subsidiary
Notes to Consolidated Financial Statements
FASB ASC 740-10-25 provides criteria for the recognition, measurement, presentation and disclosure of uncertain tax position. The Company must recognize the tax benefit from an uncertain tax position only if it is
more likely than not that the tax position will be sustained on examination by the taxing authorities, based on the technical merits of the position. The tax benefits recognized in the financial statements from such a position are measured based
on the largest benefit that has a greater than 50% likelihood of being realized upon ultimate resolution. The Company did not recognize additional liabilities for uncertain tax positions pursuant to FASB ASC 740-10-25 for the years ended December
31, 2020 and 2019.
Contingencies
Accounting guidance requires that the Company record an estimated loss from a loss contingency when information available prior to issuance of the consolidated financial statements indicates that it is probable
that an asset has been impaired or a liability has been incurred at the date of the consolidated financial statements and the amount of the loss can be reasonably estimated. Accounting for contingencies such as legal matters requires
significant judgment. Many of these legal matters can take years to resolve. Generally, as the time period increases over which the uncertainties are resolved, the likelihood of changes to the estimate of the ultimate outcome increases.
Concentration of Credit Risk
Financial instruments that potentially subject the Company to concentrations of credit risk are cash and trade receivable arising from its normal business activities. The Company deposits its cash in high credit
quality institutions. The Company performs ongoing credit evaluations to its customers and establishes allowances when appropriate.
Cash and cash equivalents are maintained at various financial institutions located in Korea. The Company has never experienced any losses related to these balances.
Advertising
Costs associated with advertising and promotions are expensed as incurred. Advertising expense amounted to $84,216 and $44,698 for the years ended December 31, 2020 and 2019, respectively.
Employee Stock Based Compensation
The Company accounts for its share-based compensation plan in accordance with FASB ASC 718, Stock Compensation, which establishes a fair value method of accounting for
stock-based compensation plans. The Company records stock compensation expense based on the value of the number of shares vesting specified periods over three years.
Stock-based compensation issued to employees and members of our board of directors is measured at the date of grant based on the estimated fair value of the award, net of estimated forfeitures. The grant date
fair value of a stock-based award is recognized as an expense over the requisite service period of the award on a straight-line basis.
I-ON Digital Corp. and Subsidiary
Notes to Consolidated Financial Statements
For purposes of determining the variables used in the calculation of stock-based compensation issued to employees, the Company performs an analysis of current market data and historical data to calculate an estimate of implied volatility, the
expected term of the option and the expected forfeiture rate. With the exception of the expected forfeiture rate, which is not an input, we use these estimates as variables in the Black-Scholes option pricing model. Depending upon the number of
stock options granted any fluctuations in these calculations could have a material effect on the results presented in our consolidated statements of operations. In addition, any differences between estimated forfeitures and actual forfeitures
could also have a material impact on our consolidated financial statements.
Non-controlling Interests
Non-controlling interests are measured at their proportionate share of the acquiree’s identifiable net assets at the acquisition date.
Government Grants
Government grants are not recognized unless there is reasonable assurance that the Company will comply with the grants’ conditions and that the grants will be received. Government borrowings, which are lower than
the market interest rate, are regarded as government grants. The grant is measured from the difference between the fair values of the government borrowings computed using the market interest rate and the acquisition cost of the grant. Government
grants whose primary condition is that the Company purchase, construct or otherwise acquire long-term assets are deducted in calculating the carrying amount of the asset. The grant is recognized in profit or loss over the life of a depreciable
asset as a reduced depreciation expense.
Government grants which are intended to compensate the Company for expenses incurred are recognized as other income in profit or loss over the periods in which the Company recognizes the related costs as expenses.
There are government grants outstanding of $424,439 and $0 as of December 31, 2020 and 2019, respectively.
Value Added Tax
National Tax Service in Korea administered Value Added Tax under the Tax Reform Act of 1976 promulgated by the National Assembly. Value added tax is imposed on goods sold in or imported into Korea and on services
provided within Korea. Value added tax in Korea is charged on an aggregated basis at a rate of 10% on the full price collected for the goods sold or for the taxable services provided. Value added tax paid were
$538,533 and $374,799 for the years ended December 31, 2020 and 2019, respectively.
Recent Accounting Pronouncement
| ● |
Reference Rate Reform
|
In March 2020, the FASB issued ASU No. 2020-04, Reference Rate Reform (Topic 848)—Facilitation of the Effects of Reference Rate Reform on
Financial Reporting. This standard provides optional guidance for a limited time to ease the potential burden in accounting for (or recognizing the effects of) reference rate reform on financial reporting. The amendments in this
standard apply only to contracts and hedging relationships that reference LIBOR or another reference rate expected to be discontinued due to reference rate reform. The expedients and exceptions provided by the amendments do not apply to
contract modifications made and hedging relationships entered into or evaluated after December 31, 2022. The amendments in this standard are elective and are effective upon issuance for all entities. The Company is evaluating the expedients and
exceptions provided by the amendments in this standard to determine their impact.
Other recently issued accounting updates are not expected to have a material impact on the Company’s Interim Financial Statements.
| ● |
Fair Value Measurements
|
In August 2018, the FASB amended "Fair Value Measurements" to modify the disclosure requirements related to fair value. The amendment removes requirements to disclose (1) the amount of and reasons
for transfers between levels 1 and 2 of the fair value hierarchy, (2) our policy related to the timing of transfers between levels, and (3) the valuation processes used in level 3 measurements. It clarifies that, for investments measured at
net asset value, disclosure of liquidation timing is only required if the investee has communicated the timing either to us or publicly. It also clarifies that the narrative disclosure of the effect of changes in level 3 inputs should be
based on changes that could occur at the reporting date. The amendment adds a requirement to disclose the range and weighted average of significant unobservable inputs used in level 3 measurements. The guidance is effective for the Company
with the Company’s quarterly filing for the period ended March 31, 2020 and the Company made the required disclosure changes in that filing and going forward. Adoption did not have an impact on the Company’s consolidated results of
operations, consolidated financial position, and cash flows.
| ● |
Retirement Plans
|
In August 2018, the FASB amended "Retirement Plans" to modify the disclosure requirements for defined benefit plans. For the Company, the amendment requires the disclosure of the weighted average interest crediting
rate used for cash balance plans and an explanation of the reasons for significant gains and losses related to changes in the benefit obligation for the period. It removes the requirement to disclose the approximate amount of future benefits
covered by insurance contracts. The guidance is effective for the Company with the Company’s annual filing for the year ended December 31, 2020 and the Company made the required disclosure changes in this filing. Adoption did not have an impact
on the Company’s consolidated results of operations, consolidated financial position, and cash flows.
I-ON Digital Corp. and Subsidiary
Notes to Consolidated Financial Statements
| ● |
Intangibles – Goodwill and other – Internal-Use Software
|
In August 2018, the FASB issued ASU No. 2018-15, Intangibles—Goodwill and Other—Internal-Use Software (Subtopic 350-40): Customer’s Accounting for Implementation Costs Incurred in a Cloud Computing
Arrangement That Is a Service Contract. This standard aligns the requirements for capitalizing implementation costs incurred in a hosting arrangement that is a service contract with the requirements for capitalizing implementation costs
incurred to develop or obtain internal-use software (and hosting arrangements that include an internal-use software license). The Company’s accounting for the service element of a hosting arrangement that is a service contract is not affected
by the proposed amendments and will continue to be expensed as incurred in accordance with existing guidance. This standard does not expand on existing disclosure requirements except to require a description of the nature of hosting
arrangements that are service contracts. This standard is effective for fiscal years, and for interim periods within those fiscal years, beginning after December 15, 2019. Early adoption is permitted, including adoption in any interim period
for which financial statements have not been issued. Entities can choose to adopt the new guidance prospectively or retrospectively. The Company adopted the updated disclosure requirements of ASU No. 2018-15 in the first quarter of fiscal
2020, coinciding with the standard’s effective date, and the impact from this standard is immaterial.
| ● |
Goodwill
|
In January 2017, the FASB amended "Goodwill" to simplify the subsequent measurement of goodwill. The amended guidance eliminates Step 2 from the goodwill impairment test. Instead, impairment is
defined as the amount by which the carrying value of the reporting unit exceeds its fair value, up to the total amount of goodwill of the reporting unit. The new guidance is effective for the Company on January 1, 2020 and did not have an
impact on our consolidated results of operations, consolidated financial position, and cash flows.
| ● |
Financial Instruments
|
In June 2016, the FASB amended "Financial Instruments" to provide financial statement users with more decision-useful information about the expected credit losses on debt instruments and other
commitments to extend credit held by a reporting entity at each reporting date. During November 2018 and April 2019, the FASB made amendments to the new standard that clarified guidance on several matters, including accrued interest,
recoveries, and various codification improvements. The new standard, as amended, replaces the incurred loss impairment methodology in the current standard with a methodology that reflects expected credit losses and requires consideration of a
broader range of reasonable and supportable information to support credit loss estimates. The new guidance is effective for us on January 1, 2020, and in the first half of 2019, and there is no material impact on the Company’s consolidated
results of operations, consolidated financial position, and cash flows.
|
●
|
Income Statement – Reporting Comprehensive Income
|
In February 2018, the FASB issued Accounting Standards Update No. 2018-02, Income Statement-Reporting Comprehensive Income (Topic 220) (ASU 2018-02), which amends existing
standards for income statement-reporting comprehensive income to allow a reclassification from accumulated other comprehensive income to retained earnings for stranded tax effects resulting from Tax Cuts and Jobs Act and improve the
usefulness of information reported to financial statements users. ASU 2018-02 will be effective for beginning after December 15, 2018, and early adoption is permitted. The Company
adopted ASU 2018-02 effective January 1, 2019; such adoption had no material impact on the Company’s consolidated financial statements.
|
●
|
Improvements to Nonemployee Share-based Payment Accounting
|
In June 2018, the FASB issued ASU No. 2018-07 “Improvements to Nonemployee Share-Based Payment Accounting” (“ASU 2018-07”). ASU 2018-07 aligns the accounting for share-based payment awards
to employees and non-employees. Under ASU 2018-07 the existing employee guidance will apply to nonemployee share-based transactions, except for specific guidance related to the attribution of compensation cost. ASU 2018-07 should be applied
to all new awards granted after the date of adoption. ASU 2018-07 is effective for annual and interim periods beginning after December 15, 2018, and early adoption is permitted. The
Company adopted ASU 2018-07 effective January 1, 2019; such adoption had no material impact on the Company’s consolidated financial statements.
I-ON Digital Corp. and Subsidiary
Notes to Consolidated Financial Statements
| ● |
Leases (ASU 2019-01)
|
In March 2019, the FASB issued ASU 2019-01, Leases (Topic 842) Codification Improvements, which removed the requirement for an entity to disclose in the interim periods
after adoption, the effect of the change on income from continuing operations, net income, any other affected financial statement line item, and any affected per share amount. For lessors, the new leasing standard requires leases to be
classified as a sales-type, direct financing or operating leases. These criteria focus on the transfer of control of the underlying lease asset. This standard and related update was effective for fiscal years beginning after December 15, 2018, and interim periods within those fiscal years. Early adoption is permitted. The Company adopted ASU 2016-02 effective
January 1, 2019; such adoption had no material impact on the Company’s financial statements, given that the noncancelable term of the Company’s current lease is less than 12 months.
| ● |
Leases (ASU 2016-02)
|
In February 2016, the FASB issued ASU 2016-02, Leases (Topic 842), which requires the recognition of lease assets and lease liabilities on the balance sheet by lessees for
those leases currently classified as operating leases under ASC 840 “Leases.” These amendments also require qualitative disclosures along with specific quantitative disclosures. These amendments are effective for fiscal years beginning after December 15, 2018, including interim periods within those fiscal years. Early application is permitted. The Company can elect to record a cumulative-effect adjustment as of
the beginning of the year of adoption or apply a modified retrospective transition approach. The Company expects that substantially all of its operating lease commitments will be subject to the new guidance and will be recognized as operating
lease liabilities and right-of-use assets upon adoption. The Company adopted ASU 2016-02 effective January 1, 2019; such adoption had no material impact on the Company’s financial statements, given that the noncancelable term of the Company’s
current lease is less than 12 months.
| Note 3. |
Property and Equipment
|
Property and equipment consist of the following:
|
December 31,
|
2020
|
2019
|
||||||
|
Facilities
|
$
|
197,430
|
$
|
185,528
|
||||
|
Vehicles
|
42,555
|
39,989
|
||||||
|
Equipment
|
1,769,330
|
1,615,288
|
||||||
|
Government grants
|
(355,582
|
)
|
(213,526
|
)
|
||||
|
Total property and equipment
|
1,653,733
|
1,627,279
|
||||||
|
Less: accumulated depreciation
|
(1,535,331
|
)
|
(1,423,525
|
)
|
||||
|
Property and equipment, net
|
$
|
118,402
|
$
|
203,754
|
||||
Depreciation expense for December 31, 2020 and 2019 were $111,806 and $215,919, respectively.
As noted in Note 2, the government grants received is against the values of assets acquired or the expenses incurred.
| Note 4. |
Investment
|
The Company had the following investments.
|
Investments
|
Percentage of
Ownership
|
December 31, 2020
|
December 31,
2019
|
||||||||||
|
PT IONSOFT
|
Equity
|
0.09
|
%
|
$ | - | $ | - | ||||||
|
ACDC Consulting VN PTE LED
|
Available-for-sale
|
20.00
|
%
|
$
|
-
|
$
|
10,040
|
||||||
|
4Grit
|
Available-for-sale
|
2.50
|
%
|
$
|
45,960
|
$
|
43,189
|
||||||
|
E-channel
|
Available-for-sale
|
0.07
|
%
|
$
|
43,470
|
$
|
40,849
|
||||||
|
KSFC
|
Available-for-sale
|
0.00
|
%
|
$
|
12,087
|
$
|
11,359
|
||||||
|
Total investment securities
|
$
|
101,517
|
$
|
105,437
|
|||||||||
Equity Method
The Company applies the equity method for investments in affiliate, which is a privately-held company where quoted market prices are not available, in which it has the ability to
exercise significant influence over operating and financial policies of the affiliate. Significant influence is generally defined as 20% to 50% ownership in the voting stock of an investee. The Company changed PT IONSOFT account classification
from equity method to cost method since third quarter of 2019 since the share of PT IONSOFT has changed from 20% into 0.9% as of August 1, 2019.
Available-for-sale securities
The Company’s investments also include privately-held companies, where quoted market prices are not available, and the cost method, combined with other intrinsic information, is used to assess the fair value of the
investment.
| Note 5. |
Intangible Assets
|
Intangible assets consist of the following:
|
2020
|
2019
|
|||||||
|
Patents
|
$
|
325,842
|
$
|
251,798
|
||||
|
Other intangible assets
|
587,867
|
551,865
|
||||||
|
Government grants
|
(50,364
|
) |
(8,729
|
)
|
||||
|
Total intangible assets
|
863,345
|
794,634
|
||||||
|
Less: Accumulated amortization
|
$
|
(630,945
|
)
|
(601,766
|
)
|
|||
|
Intangible assets, net
|
$
|
232,400
|
$
|
192,868
|
||||
I-ON Digital Corp. and Subsidiary
Notes to Consolidated Financial Statements
Amortization expense for December 31, 2020 and 2019 were $29,179 and $24,134, respectively.
Future amortization expense of the Company’s intangible assets at December 31, 2020 is expected to be as follows:
|
Years ending December 31,
|
||||
|
2021
|
$
|
30,464
|
||
|
2022
|
28,917
|
|||
|
2023
|
27,541
|
|||
|
2024
|
27,142
|
|||
|
2025
|
25,679
|
|||
|
Thereafter
|
92,657
|
|||
|
Total
|
$
|
232,400
|
||
As noted in Note 2, the government grants received is against the values of assets acquired or the expenses incurred.
| Note 6. |
Long-term Debt
|
Total long-term debt consisted of the following:
|
2020
|
2019
|
|||||||
|
A note payable to a financial institution bearing interest at 2.75% and 2.81% at December 31, 2020 and 2019, respectively, and guaranteed by the officer of the Company. The Company was required to make interest-only payment until
December 2019, then monthly payments of both principal and interest starting from January 2020. This note payable is due on April 2021.
|
114,890
|
215,927
|
||||||
| A note payable to a financial institution bearing interest at 2.81% and 2.81% at December 31, 2020 and 2019, respectively, and guaranteed by the
officer of the Company. The Company was required to make interest-only payment until December 2019, then monthly payments of both principal and interest starting from January 2020. This note payable is due on April 2021 and December 2021. |
91,875 |
172,673 |
||||||
|
Long-term debt
|
$
|
206,765
|
$
|
388,600
|
||||
|
Less: current portion
|
(206,765
|
)
|
(194,300
|
)
|
||||
|
Long-term debt, net of current portion
|
$
|
-
|
$
|
194,300
|
||||
Future minimum payments on debt consists of the following:
|
Years ending December 31,
|
||||
|
2021
|
$
|
206,765
|
||
|
Total
|
$
|
206,765
|
||
The long-term debts contain certain covenants, and the Company was in compliance with the covenants at all periods reported.
| Note 7. |
Line of Credit
|
The Company has lines of credit with financial institutions for total amount of approximately $3,600,000 that expires in various months in 2021, unless extended. There was no outstanding balance under the credit
lines at December 31, 2020. The lines of credit, bearing various interest rates are guaranteed by the officer of the Company.
The Company has an arrangement with its customers and a financial institution, in which the Company’s customers issue electronic invoices with the Company as the recipient. The Company can use these receivables as
collateral for loans up to approximately $5,500,000 and $5,100,000 as of December 31, 2020 and 2019, respectively. The Company receives its payments due when the customer fully pays the invoices to the financial institution. The interest rates
vary depending on the Company’s customers’ credit ratings. The Company has no borrowings outstanding as of December 31, 2020 and 2019, respectively. The maturity date of the arrangement varies on the dates of the original transactions.
I-ON Digital Corp. and Subsidiary
Notes to Consolidated Financial Statements
| Note 8. |
Equity Purchase Agreement – Put Option
|
On August 13, 2018 (the “Closing Date”), the Company entered into an Equity Purchase Agreement (the “Purchase Agreement”) with the convertible debenture holder (the “Holder”), whereby, upon the terms and subject
to the conditions thereof, the Holder is committed to purchase shares of the Company’s common stock, par value $0.0001 per share (the “Purchase Shares”), at an aggregate price of up to $10,000,000 (the “Total Commitment Amount”) over the course
of a 24- month term. The significant terms of the Purchase Agreement are given below:
| ∙ |
Put Provision: From time to time over the 24-month term of the Purchase Agreement, commencing on the date on which a registration statement registering the Purchase Shares (the “Registration Statement”) becomes effective, the Company
may, in its sole discretion, provide the Buyer with a put notice (each a “Put Notice”) to purchase a specified number of the Purchase Shares (each a “Put Amount Requested”) subject to the limitations contained in the Purchase Agreement.
|
The actual amount of proceeds the Company receives pursuant to each Put Notice (each, the “Put Amount”) is to be determined by the lesser of (i) 88% of the lowest closing bid price of the Company’s Common Stock on
the trading day immediately preceding the respective date of the Put Notice and (ii) 88% of the lowest closing bid price during the Valuation Period (the period of 7 trading days immediately following the clearing date associated with the
applicable Put Notice).
The Put Amount Requested pursuant to any single Put Notice must have an aggregate value of at least $20,000, and cannot exceed the lesser of (i) 250% of the average daily trading value of the common stock in the 10
trading days immediately preceding the Put Notice or (ii) such number of shares of common stock that has an aggregate value of $500,000.
|
∙
|
Term: Unless earlier terminated, the Purchase Agreement will terminate automatically on the earlier to occur of: (i) 24 months after the initial effectiveness of the Registration Statement, (ii) the date on which the Buyer has
purchased or acquired all of the Purchase Shares, or (iii) the date on which certain bankruptcy proceedings are initiated with respect to the Company.
|
Upon execution of the Purchase Agreement, the Company issued 100,000 shares of common stock with a par value of $0.0001 to the Holder.
The Company adopted the provisions of FASB ASC Topic 480 and Topic 815, to determine the proper classification of the Purchase Agreement. The Company determined the put option meets the definition of a derivative
under ASC 815 but is outside the scope of ASC 480. Under ASC 816-40, the Company determined the derivate does not meet equity classification and accordingly, is classified as an asset on the consolidated balance as a Level 3 financial instrument.
The Company used an independent third-party valuation firm to determine the fair value of the derivative asset using an Option Pricing Model.
Changes to fair value at the end of each reporting period is recorded as other income or expense in the consolidated statements of income. The following table summarizes the changes in the Level 3
financial instrument related to the derivate asset for the equity put option:
|
Fair value, at December 31, 2019
|
$
|
105,594
|
||
|
Issuance of equity purchase put option
|
-
|
|||
|
Change in fair value
|
105,594 | |||
|
Fair value, at December 31, 2020
|
$
|
-
|
|
Fair value, at December 31, 2018
|
$
|
109,343
|
||
|
Issuance of equity purchase put option
|
||||
|
Change in fair value
|
(3,749
|
)
|
||
|
Fair value, at December 31, 2019
|
$
|
105,594
|
I-ON Digital Corp. and Subsidiary
Notes to Consolidated Financial Statements
| Note 9. |
Commitments and Contingencies
|
Royalty
On February 15, 2006, the Company agreed to provide the rights to Ashisuto to sell the products in the Japanese market. Per the agreement, the contract period is automatically extended by 5 years up to 20 years.
Total royalty amounts received for the years ended December 31, 2020 and 2019 were approximately $187,000 and $184,000, respectively, and it is included in revenues on the Consolidated Statements of Income and Comprehensive Income.
Operating Leases
The Company leases its office under non-cancelable operating leases that expire on dates through December 2021. The lease is automatically extended upon agreement of both parties. Future minimum rental payments
under the non-cancelable operating leases as of December 31, 2020 are as follows:
|
December 31,
|
Amount
|
|||
|
2021
|
142,366
|
|||
|
Total
|
$
|
142,366
|
||
Rent expense for all operating leases were $131,689 and $144,556 for the years ended December 31, 2020 and 2019, respectively.
| Note 10. |
Related Party Transactions
|
The Company receives loan guarantees from the chief executive officer with regards to its long-term borrowing, and the Company’s restricted cash is provided as collateral to the Company’s chief executive officer’s
loans.
| Note 11. |
Earnings Per Share
|
The Company calculates earnings per share in accordance with FASB ASC 260, Earnings Per Share, which requires a dual presentation of basic and diluted earnings per share.
Basic earnings per share are computed using the weighted average number of shares outstanding during the fiscal year. Potentially dilutive common shares consist of stock options outstanding (using the treasury method).
I-ON Digital Corp. and Subsidiary
Notes to Consolidated Financial Statements
The following table sets forth the computation of basic and diluted net income per common share:
|
Years Ended December 31,
|
2020
|
2019
|
||||||
|
Net income before non-controlling interest
|
$
|
1,620,879
|
$
|
(707,466
|
)
|
|||
|
Non-controlling interest
|
431
|
4,982
|
||||||
|
Net income
|
1,620,448
|
(712,448
|
)
|
|||||
|
|
||||||||
|
Weighted-average shares of common stock outstanding:
|
||||||||
|
Basic
|
35,030,339
|
35,030,339
|
||||||
|
Dilutive effect of common stock equivalents arising from
|
||||||||
|
share option, excluding antidilutive effect from loss
|
-
|
-
|
||||||
|
Dilutive shares
|
35,030,339
|
35,030,339
|
||||||
|
|
||||||||
|
Earnings per share – Basic and diluted
|
||||||||
|
Net income before non-controlling interest
|
$
|
0.05
|
$
|
(0.02
|
)
|
|||
|
Non-controlling interest
|
$
|
0.00
|
$
|
0.00
|
||||
|
Earnings per share to stockholders
|
$
|
0.05
|
$
|
(0.02
|
)
|
|||
No non-vested share awards or non-vested share unit awards were antidilutive for the years ended December 31, 2020 and 2019.
| Note 12. |
Income Taxes
|
Income taxes consist of the following:
|
Current
|
Deferred
|
Total
|
||||||||||
|
Year ended December 31, 2020:
|
||||||||||||
|
Federal
|
$
|
-
|
$
|
-
|
$
|
-
|
||||||
|
State
|
-
|
-
|
-
|
|||||||||
|
Foreign
|
48,847
|
37,723
|
86,570
|
|||||||||
|
Total income tax provision (benefit)
|
$
|
48,847
|
$
|
37,723 |
$
|
86,570
|
||||||
|
Year ended December 31, 2019:
|
||||||||||||
|
Federal
|
$
|
-
|
$
|
-
|
$
|
-
|
||||||
|
State
|
-
|
-
|
-
|
|||||||||
|
Foreign
|
16,786
|
259,229
|
276,015
|
|||||||||
|
Total income tax provision (benefit)
|
$
|
16,786
|
$
|
259,229
|
$
|
276,015
|
||||||
Current income tax expense is based on taxable income for foreign, federal and state tax reporting purposes. Deferred income tax expense is provided for certain income and expenses which are recognized in
different periods for tax and financial reporting purposes.
I-ON Digital Corp. and Subsidiary
Notes to Consolidated Financial Statements
Deferred income tax assets and liabilities are computed annually for differences between the consolidated financial statements and tax basis of assets and liabilities that will result in taxable or deductible
amount in the future based on enacted tax laws and rates applicable to the period in which the differences are expected to affect taxable income. Valuation allowances are established when necessary to reduce deferred income tax assets to the
amount expected to be realized.
The significant components of deferred income tax assets and liabilities are as follows:
|
As of December 31,
|
||||||||
|
2020
|
2019
|
|||||||
|
Deferred income tax assets:
|
||||||||
|
Allowance for bad debt
|
$
|
182,709
|
$
|
165,378
|
||||
|
Government grants
|
18,687
|
32,385
|
||||||
|
Available-for-sale securities
|
8,308
|
44,314
|
||||||
|
Research and development tax credit
|
1,178,952
|
1,232,877
|
||||||
|
Loss on equity investments
|
-
|
-
|
||||||
|
Net operating income (loss)
|
(426,081
|
)
|
90,550
|
|||||
|
Retirement benefits
|
78,993
|
74,232
|
||||||
|
Total deferred income tax assets
|
1,041,568
|
1,639,736
|
||||||
|
Less - valuation allowance
|
(11,482
|
)
|
(625,819
|
)
|
||||
|
Deferred tax assets, net of valuation allowance
|
1,030,086
|
1,013,917
|
||||||
|
Deferred income tax liabilities:
|
||||||||
|
Other
|
- |
(6,844
|
)
|
|||||
|
Total deferred income tax liabilities
|
- |
(6,844
|
)
|
|||||
|
Net deferred tax assets
|
$
|
1,030,086
|
$
|
1,007,073
|
||||
|
Current deferred tax assets:
|
$
|
274,291
|
$
|
232,766
|
||||
|
Non-current deferred tax assets
|
$
|
755,795
|
$
|
774,307
|
||||
The difference between the change in net deferred tax assets and the deferred income tax expenses is mainly due to remeasurement of deferred tax assets and liabilities reflecting currency exchange rates at the
balance sheet dates. The related tax impact was recorded through other comprehensive income.
Deferred tax assets and liabilities are recognized for the estimated future tax consequences attributable to differences between the financial statement carrying amounts of existing assets and liabilities and
their respective tax bases and operating loss and tax credit carryforwards.
In assessing the realization of gross deferred income tax assets, management considers whether it is more likely than not that some portion or all its deferred income tax assets will not be realized. The ultimate
realization of deferred income tax assets is dependent upon the generation of future taxable income during the periods in which those temporary differences become deductible.
I-ON Digital Corp. and Subsidiary
Notes to Consolidated Financial Statements
The effective tax rates for the reporting periods are as follows:
|
Years Ended December 31,
|
||||||||
|
2020
|
2019
|
|||||||
|
Tax expense (benefit) at statutory rate - 22% foreign tax
|
$
|
398,431
|
$
|
(94,919
|
)
|
|||
|
Allowance for bad debt
|
(17,331
|
)
|
(42,663
|
)
|
||||
|
Government grants
|
13,698
|
(4,571
|
)
|
|||||
|
Available-for-sale securities
|
36,006
|
(33,943
|
)
|
|||||
|
Research and development tax credit
|
53,925
|
(216,958
|
)
|
|||||
|
Loss on equity investments
|
-
|
35,778
|
||||||
|
Net operating income (loss)
|
516,631
|
(90,550
|
)
|
|||||
|
Retirement benefits
|
(4,761
|
)
|
(1,351
|
)
|
||||
|
Others
|
(921,511
|
)
|
99,373
|
|||||
|
Valuation allowance
|
11,482
|
625,819
|
||||||
|
Total income tax provision (benefit)
|
$
|
86,570
|
$
|
276,015
|
||||
|
Effective tax rate
|
5.07
|
%
|
-63.97
|
%
|
||||
The Company adopted the guidance in ASC 740 for uncertain tax positions, which requires that realization of an uncertain income tax position must be more likely than not before it can be recognized in the financial
statements. This guidance in ASC 740 further prescribes the benefits or liabilities to be recorded in the financial statements as the amounts are cumulatively more likely than not to be realized assuming a review by tax authorities having all
relevant information and applying current conventions. The guidance also clarifies the financial statement classification of tax-related penalties and interest and sets forth new disclosure regarding unrecognized tax benefits or liabilities.
Differences between the amounts recognized in the consolidated financial statements prior to the adoption of the guidance in ASC 740 for unrecognized tax benefits and the amounts reported after adoption would be accounted for as a
cumulative-effect adjustment to the beginning balance of retained earnings.
As of December 31, 2020 and 2019, the Company identified no material unrecognized tax benefits and does not expect material change within the next twelve-months. The Company’s policy is to recognize tax penalties
and interest in tax expense, if any.
The Company recorded tax deferred assets for its research & development tax credits in the amount of $1,178,952 and $1,232,877 as of December 31, 2020 and 2019, respectively. The tax credits are carried forward
for five years. Tax years 2012 and forward are open to examination by the Korean National Tax Service (NTS). NTS conducted tax examination in 2012 and no penalties were charged to the Company.
| Note 13. |
Stock Compensation
|
The Company has a Stock Option Plan (“Plan”) that allows grants to officers and key employees shares of common stock. The options have vesting schedules of three years from the date of grant, and are exercisable
within seven years from the end of the vesting period. Stock options granted and outstanding as of December 31, 2020 and 2019 may be exercised after one year from the date of the Company’s public listing. If the Company’s not publicly listed,
these options will be cancelled.
The Company recognized approximately $66,530 and $89,000 of stock-based compensation related to options granted to employees for the years ended December 31, 2020 and 2019, respectively.
The fair value of each award to employees in 2020 is estimated on the date of grant using the Binomial option pricing model with the following weighted-average assumptions: expected life of approximately 6.25
years, risk-free interest rate of approximately 2.85%, expected volatility of 16.38% and no dividends during the expected life. Expected volatility is based on historical volatilities of public companies operating in the Company’s industry. The
expected life of the options represents the period of time options are expected to be outstanding and is estimated considering vesting terms and employees’ historical exercise and post-vesting employment termination behavior. The risk-free
interest rate is based on the U.S. Treasury yield curve in effect at the time of grant.
The Company did not provide any new stock option grants in 2020.
A summary of the status of the Company’s stock option plan is presented as follows:
|
Number of
Shares
|
Weighted-
Average
Exercise
Price
|
Weighted-
Average
Remaining
Contractual
Live
(In Years)
|
Aggregate
Intrinsic
Value
|
|||||||||||||
|
Outstanding, December 31, 2018
|
160,116
|
1.63
|
9.18
|
$
|
64,046
|
|||||||||||
|
Granted
|
-
|
-
|
||||||||||||||
|
Exercised
|
-
|
-
|
||||||||||||||
|
Cancelled
|
-
|
-
|
||||||||||||||
|
Outstanding, December 31, 2019
|
160,116
|
1.63
|
8.18
|
$
|
64,046
|
|||||||||||
|
Granted
|
-
|
-
|
||||||||||||||
|
Exercised
|
-
|
-
|
||||||||||||||
|
Cancelled
|
-
|
-
|
||||||||||||||
|
Outstanding, December 31, 2020
|
160,116
|
1.63
|
7.18
|
$
|
-
|
|||||||||||
|
Options exercisable at December 31, 2020
|
91,044
|
$
|
-
|
$
|
-
|
$
|
-
|
|||||||||
|
Vested and expected to vest at December 31, 2020
|
91,044
|
$
|
-
|
$
|
-
|
$
|
-
|
|||||||||
As of December 31, 2020 and 2019, there were approximately $0 and $67,000, respectively, of total unrecognized compensation expense related to nonvested share option awards granted. That expense is expected to be
recognized over a weighted-average period of 3 years.
| Note 14. |
Non-Controlling Interest-Issued of Preferred Stock by Subsidiary
|
On April 9, 2019, The Company’s subsidiary, I-ON Co., Ltd. (Korea) issued redeemable convertible preferred stock with proceeds of KRW549,997,000 and issued 157,142 shares of preferred stock at a price of KRW3,500 per share. The
convertible preferred stock agreement contain provisions as follows:
| ● |
Voting rights – The preferred shareholder may have same voting rights as common stock shareholder (1:1)
|
| ● |
2% annual dividend
|
| ● |
Liquidating rights
|
| ● |
Conversion rights to common stock
|
| o |
Call option by preferred shareholder – Preferred stock may be converted to common stock anytime at a fixed conversion price of KRW 3,500
|
| o |
Call option by I-ON Digital – Should I-ON Digital exercise to redeem preferred stock, I-ON Digital is required to repurchase for KRW 3,500 per share and 7% annual interest compounded.
|
The Company accounted the issuance of preferred stock under ASC 810-10-45-23, Consolidation, and was accounted for as equity transaction as the parent’s ownership interest retains control of a subsidiary. The
preferred stock issuance by a subsidiary to noncontrolling interest holders should be reflected as a noncontrolling interest in the financial statements of the parent at the amount of the cash proceeds received.
The convertible preferred shares meet definition of equity instrument and contain a put option that is not outside the Company’s control and the conversion to common stock is at a fixed determinable share
conversion price at KRW 3,500 per share.
| Note 15. |
Subsequent Events
|
The Company evaluates subsequent events and transactions that occur after the balance sheet date up to the date that the financial statements are available to be issued. Any material events that occur between the
balance sheet date and the date that the financial statements were available for issuance are disclosed as subsequent events, while the financial statements are adjusted to reflect any conditions that existed at the balance sheet date. Based upon
this review, except as disclosed within the footnotes, the Company did not identify any recognized or non-recognized subsequent events that would have required adjustment or disclosure in the financial statements.
26