Attached files
| file | filename |
|---|---|
| EX-99.1 - EX-99.1 - TPG Pace Beneficial Finance Corp. | d119159dex991.htm |
| 8-K - 8-K - TPG Pace Beneficial Finance Corp. | d119159d8k.htm |
Exhibit 99.2
EVBox Group Investor Presentation March 2021
Important Information Use of Projections This presentation contains financial forecasts prepared by TPG Pace
Beneficial Finance Corp. (“TPG Pace”) with respect to certain financial metrics of EV Charged B.V., a Dutch private limited liability company (besloten vennootschap met beperkte aansprakelijkheid) (“EV Charged”), including, but
not limited to, revenues, gross profit, gross margin, adjusted gross margin, operating expenses, EBITDA, and capital expenditures. Neither TPG Pace’s independent auditors, nor the independent registered public accounting firm of EV Charged,
audited, reviewed, compiled, or performed any procedures with respect to the projections for the purpose of their inclusion in this presentation, and accordingly, neither of them expressed an opinion or provided any other form of assurance with
respect thereto for the purpose of this presentation. The financial forecasts and projections in this presentation were prepared by TPG Pace and not by the management of EV Charged, and these financial forecasts and projections should not be relied
upon as being necessarily indicative of future results. Neither TPG Pace nor EV Charged undertakes any commitment to update or revise the projections, whether as a result of new information, future events, or otherwise. Further the financial
forecasts and historical numbers included throughout this presentation have been prepared using generally accepted accounting principles in the United States (“U.S. GAAP”), whereas EV Charged has historically otherwise prepared financial
statements and maintained records using generally accepted accounting principles in the Netherlands (“Dutch GAAP”). Because the U.S. GAAP audit was not complete at the time the projections contained herein were prepared, such projections
do not take into account certain adjustments made during the audit process. See Slide 7 “Business Combination Update” and Slide 22 “2019 Gross Margin Reconciliation” for additional information. In addition, certain projections
contained herein related to results for the year ended December 31, 2020. Although the U.S. GAAP audit of such results is currently in process, unless otherwise indicated, such results represent projections prepared prior to entry into definitive
agreements relating to the proposed business combination. Unless otherwise indicated, such results are not intended to represent, and do not represent, audited results for such period or preliminary data resulting from such audit process. Customary
reporting processes with respect to such 2020 information have not been completed and EV Charged’s auditors have not completed an audit of such estimates. During the course of the audit and review on EV Charged’s 2020 results, items may be
identified that would result in material adjustments as compared to such projections. Accordingly, you should not place undue reliance on such projections. In this presentation, certain of the above-mentioned projected information has been repeated
(in each case, with an indication that the information is an estimate and is subject to the qualifications presented herein), for purposes of providing comparisons with historical data. The assumptions and estimates underlying the prospective
financial information are inherently uncertain and are subject to a wide variety of significant business, economic, and competitive risks and uncertainties that could cause actual results to differ materially from those contained in the prospective
financial information. Accordingly, there can be no assurance that the prospective forecasts are indicative of the future performance of TPG Pace, EV Charged or the combined company after completion of any proposed business combination or that
actual results will not differ materially from those presented in the prospective financial information. Inclusion of the prospective financial information in this presentation should not be regarded as a representation by any person that the
results contained in the prospective financial information will be achieved. Forward-Looking Statements The information included herein and in any oral statements made in connection herewith include “forward-looking statements” within the
meaning of Section 27A of the Securities Act of 1933, as amended (the “Securities Act”), and Section 21E of the Securities Exchange Act of 1934, as amended. All statements, other than statements of present or historical fact included
herein, regarding the proposed merger of TPG Pace into New TPG Pace Beneficial Finance Corp., an exempted company incorporated in the Cayman Islands with limited liability under company number 368739 (“New SPAC”) and the proposed
acquisition of the common shares of EV Charged by Edison Holdco B.V., a Dutch private limited liability company (besloten vennootschap met beperkte aansprakelijkheid) (“Dutch Holdco”), Dutch Holdco’s and TPG Pace’s ability to
consummate the transaction, the benefits of the transaction and Dutch Holdco’s future financial performance following the transaction, as well as Dutch Holdco’s, EV Charged’s and TPG Pace’s strategy, future operations, financial
position, estimated revenues, and losses, projected costs, prospects, plans and objectives of management are forward looking statements. When used herein, including any oral statements made in connection herewith, the words “outlook,”
“believes,” “expects,” “potential,” “continues,” “may,” “will,” “should,” “could,” “seeks,” “approximately,” “predicts,”
“intends,” “plans,” “estimates,” “anticipates,” the negative of such terms and other similar expressions are intended to identify forward-looking statements, although not all forward-looking statements contain
such identifying words. These forward-looking statements are based on management’s current expectations and assumptions about future events and are based on currently available information as to the outcome and timing of future events. Except
as otherwise required by applicable law, Dutch Holdco and TPG Pace disclaim any duty to update any forward-looking statements, all of which are expressly qualified by the statements in this section, to reflect events or circumstances after the date
hereof. Dutch Holdco and TPG Pace caution you that these forward-looking statements are subject to risks and uncertainties, most of which are difficult to predict and many of which are beyond the control of Dutch Holdco and TPG Pace. These risks
include, but are not limited to, (1) the inability to complete the transactions contemplated by the proposed business combination; (2) the inability to recognize the anticipated benefits of the proposed business combination, which may be affected
by, among other things, competition, and the ability of the combined business to grow and manage growth profitably; (3) risks related to the rollout of EV Charged’s business and expansion strategy; (4) consumer failure to accept and adopt
electric vehicles; (5) overall demand for electric vehicle charging and the potential for reduced demand if governmental rebates, tax credits and other financial incentives are reduced, modified or eliminated; (6) the possibility that EV
Charged’s technology and products could have undetected defects or errors; (7) the effects of competition on EV Charged’s future business; (8) the inability to successfully retain or recruit officers, key employees, or directors following
the proposed business combination; (9) effects on TPG Pace’s public securities’ liquidity and trading; (10) the market’s reaction to the proposed business combination; (11) the lack of a market for TPG Pace’s securities; (12) TPG
Pace’s and EV Charged’s financial performance following the proposed business combination; (13) costs related to the proposed business combination; (14) changes in applicable laws or regulations; (15) the possibility that the novel
coronavirus (“COVID-19”) may hinder TPG Pace’s ability to consummate the business combination; (16) the possibility that COVID-19 may adversely affect the results of operations, financial position and cash flows of TPG Pace, Dutch
Holdco or EV Charged; (17) the possibility that TPG Pace or EV Charged may be adversely affected by other economic, business, and/or competitive factors; and (18) other risks and uncertainties indicated from time to time in documents filed or to be
filed with the SEC by TPG Pace. Should one or more of the risks or uncertainties described herein and in any oral statements made in connection therewith occur, or should underlying assumptions prove incorrect, actual results and plans could differ
materially from those expressed in any forward-looking statements. Additional information concerning these and other factors that may impact Dutch Holdco’s and TPG Pace’s expectations and projections can be found in TPG Pace’s initial
public offering prospectus, which was filed with the SEC on October 8, 2020. In addition, TPG Pace’s periodic reports and other SEC filings are available publicly on the SEC’s website at http://www.sec.gov. TPG PACE BENEFICIAL FINANCE
CORP. 2
Important Information (Continued) Use of Non-GAAP Financial Measures This presentation includes non-GAAP financial measures, including EBITDA and adjusted gross margin. EBITDA is calculated as Revenue less cost of goods sold, and operating expenses. Adjusted gross margin is calculated as gross profit plus inventory write downs divided by revenue. Management believes that these non-GAAP measures of financial results provide useful information to management and investors regarding certain financial and business trends relating to EV Charged’s financial condition and results of operations. TPG Pace believes that the use of these non-GAAP financial measures provides an additional tool for investors to use in evaluating ongoing operating results and trends. Management does not consider these non-GAAP measures in isolation or as an alternative to financial measures determined in accordance with GAAP. Other companies may calculate non-GAAP measures differently, and therefore the non-GAAP measures of EV Charged included in this presentation may not be directly comparable to similarly titled measures of other companies. Industry and Market Data; Trademarks and Trade Names Information and opinions in this presentation rely on and refer to information and statistics regarding the sectors in which EV Charged competes and other industry data. TPG Pace obtained this information and statistics from third-party sources, including reports by market research firms. TPG Pace and EV Charged have not independently verified the information and make no representation or warranty, express or implied, as to its accuracy or completeness. TPG Pace and EV Charged have supplemented this information where necessary with information from EV Charged’s own internal estimates, taking into account publicly available information about other industry participants and EV Charged’s management’s best view as to information that is not publicly available. The industry and market data included herein presents information only as of and for the periods indicated, is subject to change at any time, and is not, and should not be assumed to be, complete or to constitute all the information necessary to adequately make an informed decision regarding your engagement with TPG Pace or EV Charged. TPG Pace and EV Charged also own or have rights to various trademarks, service marks and trade names that they use in connection with the operation of their respective businesses. This presentation also contains trademarks, service marks and trade names of third parties, which are the property of their respective owners. The use or display of third parties’ trademarks, service marks, trade names or products in this presentation is not intended to, and does not imply, a relationship with TPG Pace or EV Charged, or an endorsement or sponsorship by or of TPG Pace or EV Charged. Solely for convenience, the trademarks, service marks and trade names referred to in this presentation may appear without the ®, TM or SM symbols, but such references are not intended to indicate, in any way, that TPG Pace or EV Charged will not assert, to the fullest extent under applicable law, their rights or the right of the applicable licensor to these trademarks, service marks and trade names. No Offer or Solicitation This presentation is for informational purposes only and shall not constitute an offer to sell or the solicitation of an offer to buy any securities pursuant to the proposed business combination or otherwise, nor shall there be any sale of securities in any jurisdiction in which the offer, solicitation or sale would be unlawful prior to the registration or qualification under the securities laws of any such jurisdiction. No offer of securities shall be made except by means of a prospectus meeting the requirements of Section 10 of the Securities Act. Confidentiality All recipients agree that they will keep confidential all information contained herein and not already in the public domain and will use this presentation solely for evaluation purposes. Recipient will maintain all such information in strict confidence, including in strict accordance with any underlying contractual obligations and all applicable laws, including United States federal and state securities laws. This presentation is not intended to constitute and should not be construed as investment advice and does not constitute investment, tax, or legal advice. Important Information For Investors and Stockholders This communication does not constitute an offer to sell or the solicitation of an offer to buy any securities or a solicitation of any vote or approval. In connection with the proposed business combination, Dutch Holdco has confidentially submitted with the SEC a draft registration statement on Form F-4, which includes a prospectus of Dutch Holdco and a proxy statement of TPG Pace. Dutch Holdco and TPG Pace also plan to publicly file the registration statement on Form F-4 and to file other documents with the SEC regarding the proposed transaction. After the registration statement has been declared effective by the SEC, a definitive proxy statement/prospectus will be mailed to the shareholders of TPG Pace. INVESTORS AND SHAREHOLDERS OF TPG PACE ARE URGED TO READ THE PROXY STATEMENT/PROSPECTUS (INCLUDING ALL AMENDMENTS AND SUPPLEMENTS THERETO) AND OTHER DOCUMENTS RELATING TO THE PROPOSED BUSINESS COMBINATION THAT WILL BE FILED WITH THE SEC CAREFULLY AND IN THEIR ENTIRETY WHEN THEY BECOME AVAILABLE BECAUSE THEY WILL CONTAIN IMPORTANT INFORMATION ABOUT THE PROPOSED BUSINESS COMBINATION. Investors and shareholders will be able to obtain free copies of the proxy statement/prospectus and other documents containing important information about Dutch Holdco and TPG Pace once such documents are filed with the SEC, through the website maintained by the SEC at http://www.sec.gov. Participants in the Solicitation Dutch Holdco, TPG Pace, ENGIE New Business S.A.S. (“ENGIE Seller”) and their respective directors and executive officers may be deemed to be participants in the solicitation of proxies from shareholders of TPG Pace in connection with the proposed transaction. Information about the directors and executive officers of TPG Pace is set forth in TPG Pace’s initial public offering prospectus, which was filed with the SEC on October 8, 2020. Other information regarding the participants in the proxy solicitation and a description of their direct and indirect interests, by security holdings or otherwise, will be contained in the proxy statement/prospectus and other relevant materials to be filed with the SEC when they become available. TPG PACE BENEFICIAL FINANCE CORP. 3
Important Information (Continued) Additional Information About the Business Combination and Where to Find It In connection with the proposed business combination, Dutch Holdco has confidentially submitted a draft registration statement on Form F 4 and the related proxy statement/prospectus with the SEC. Additionally, Dutch Holdco and TPG Pace will publicly file the registration statement on Form F-4 and will file other relevant materials with the SEC in connection with the proposed merger of TPG Pace into New SPAC and the proposed acquisition from ENGIE Seller of the common shares of EV Charged by Dutch Holdco. The materials to be filed by Dutch Holdco and TPG Pace with the SEC may be obtained free of charge at the SEC’s website at www.sec.gov. Investors and security holders of TPG Pace are urged to read the proxy statement/prospectus and the other relevant materials when they become available before making any voting or investment decision with respect to the proposed business combination because they will contain important information about the business combination and the parties to the business combination. Dutch Holdco, TPG Pace, ENGIE Seller and their respective directors and executive officers may be deemed to be participants in the solicitation of proxies of TPG Pace’s stockholders in connection with the proposed business combination. Investors and security holders may obtain more detailed information regarding the names, affiliations and interests of certain of TPG Pace’s executive officers and directors in the solicitation by reading TPG Pace’s initial public offering prospectus, which was filed with the SEC on October 8, 2020, and the proxy statement and other relevant materials filed with the SEC in connection with the business combination when they become available. Other information concerning the interests of participants in the solicitation, which may, in some cases, be different than those of their stockholders generally, will be set forth in the proxy statement/prospectus relating to the business combination when it becomes available 4
Transaction Summary Sponsored Public Listing NYSE: TPGY NYSE: EVB Transaction Overview • On December 10, 2020, TPG Pace Beneficial Finance Corp. (“Pace Beneficial” or “TPGY”) announced it had entered into an agreement to merger with EVBox Group • EVBox Group is a leading charging solutions platform for electric vehicles in Europe, with more than 235,000 charge ports sold as February 2021 • EVBox Group will be a Netherlands based company listed on the NYSE with a majority independent board • Following the transaction existing owner ENGIE New Business S.A.S. (“ENGIE Seller”), a subsidiary of Engie S.A., a multi-national utility based in France, will retain a more than 40%1 ownership stake in the company and expects to continue as a key partner • In connection with the transaction, TPGY raised a $225 million PIPE of common equity, in a private placement anchored by funds and accounts managed by BlackRock, Inclusive Capital Partners, Neuberger Berman funds and Wellington Management as well as several other leading institutional investors EVBox is a leading charging solutions platform for electric vehicles in Europe, with 235,000 charge ports sold to date TPG PACE BENEFICIAL FINANCE CORP. 5
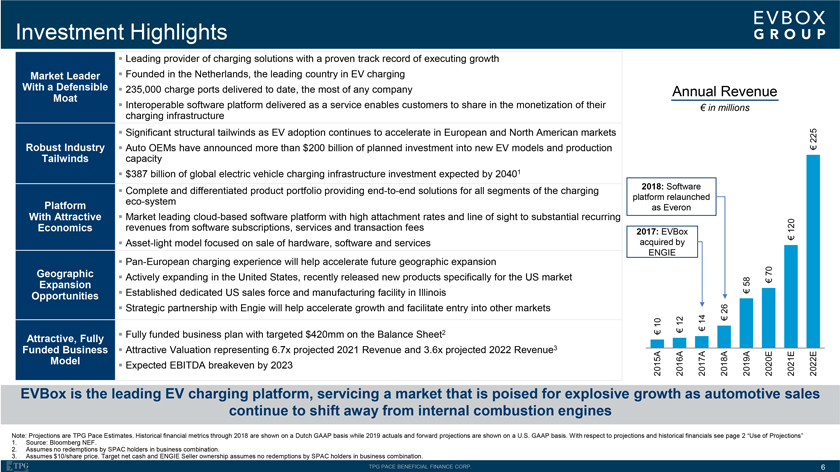
Investment Highlights Leading provider of charging solutions with a proven track record of executing growth Market Leader Founded in the Netherlands, the leading country in EV charging With a Defensible 235,000 charge ports delivered to date, the most of any company Annual Revenue Moat Interoperable software platform delivered as a service enables customers to share in the monetization of their € in millions charging infrastructure Significant structural tailwinds as EV adoption continues to accelerate in European and North American markets 225 Robust Industry Auto OEMs have announced more than $200 billion of planned investment into new EV models and production € Tailwinds capacity $387 billion of global electric vehicle charging infrastructure investment expected by 20401 2018: Software Complete and differentiated product portfolio providing end-to-end solutions for all segments of the charging platform relaunched eco-system Platform as Everon With Attractive Market leading cloud-based software platform with high attachment rates and line of sight to substantial recurring Economics revenues from software subscriptions, services and transaction fees 120 2017: EVBox Asset-light model focused on sale of hardware, software and services acquired by ENGIE Pan-European charging experience will help accelerate future geographic expansion Geographic 70 Actively expanding in the United States, recently released new products specifically for the US market Expansion 58 Opportunities Established dedicated US sales force and manufacturing facility in Illinois Strategic partnership with Engie will help accelerate growth and facilitate entry into other markets 26 12 14 10 Fully funded business plan with targeted $420mm on the Balance Sheet2 Attractive, Fully Funded Business Attractive Valuation representing 6.7x projected 2021 Revenue and 3.6x projected 2022 Revenue3 Model Expected EBITDA breakeven by 2023 2015A 2016A 2017A 2018A 2019A 2020E 2021E 2022E EVBox is the leading EV charging platform, servicing a market that is poised for explosive growth as automotive sales continue to shift away from internal combustion engines Note: Projections are TPG Pace Estimates. Historical financial metrics through 2018 are shown on a Dutch GAAP basis while 2019 actuals and forward projections are shown on a U.S. GAAP basis. With respect to projections and historical financials see page 2 Use of Projections 1. Source: Bloomberg NEF. 2. Assumes no redemptions by SPAC holders in business combination. 3. Assumes $10/share price. Target net cash and ENGIE Seller ownership assumes no redemptions by SPAC holders in business combination. TPG PACE BENEFICIAL FINANCE CORP. 6
Business Combination Update EVBox Group recently completed the re-audit of the 2019 financials on a U.S. GAAP basis (existing 2019 audit was done on a Dutch GAAP basis) 2019 Revenue was consistent with expectations 2019 Aggregate Cost of Goods Sold and Operating Expenses were consistent with expectations U.S. GAAP conversion reallocated ~ €4 million of Operating Expenses into Cost of Goods Sold, including functions such as supply chain, post-sales customer support and associated overhead On March 24, 2021, Pace Beneficial confidentially submitted the initial draft of the F-4 (merger proxy) for the business combination with the Securities Exchange Commission (“SEC”) which initiates the SEC’s review process Assuming that EVBox Group completes its 2020 audit on a U.S. GAAP basis by early May, we expect to close the business combination in June of 2021 On March 15, 2021, Pace Beneficial and ENGIE Seller amended the Business Combination Agreement (“BCA”) to allow Pace Beneficial the ability to extend the outside closing date of the BCA from June 8th by 90 days to September 6th • ENGIE Seller is currently funding all operating cash requirements through closing Following completion of 2020 U.S. GAAP Audit, the Business Combination is expected to close in June TPG PACE BENEFICIAL FINANCE CORP. 7
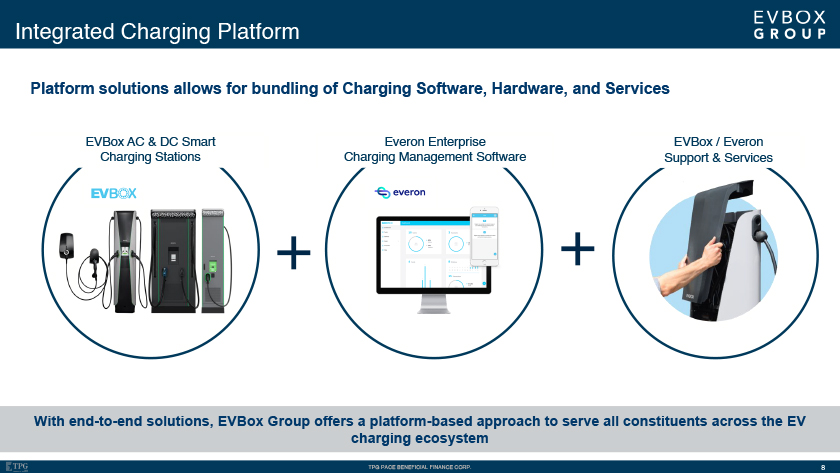
Integrated Charging Platform Platform solutions allows for bundling of Charging Software, Hardware, and Services EVBox AC & DC Smart Charging Stations Everon Enterprise Charging Management Software EVBox / Everon Support & Services With end-to-end solutions, EVBox Group offers a platform-based approach to serve all constituents across the EV charging ecosystem TPG PACE BENEFICIAL FINANCE CORP.
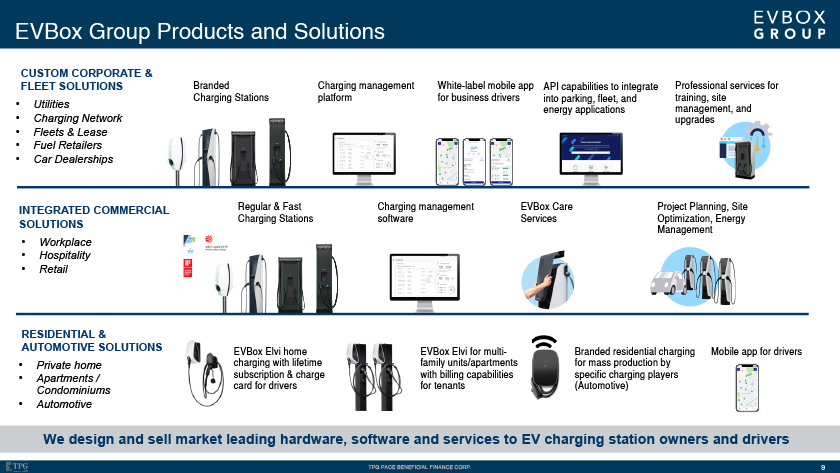
EVBox Group Products and Solutions CUSTOM CORPORATE & FLEET SOLUTIONS Branded Charging management White-label mobile app API capabilities to integrate Professional services for Charging Stations platform for business drivers into parking, fleet, and training, site • Utilities management, and energy applications • Charging Network upgrades • Fleets & Lease • Fuel Retailers • Car Dealerships INTEGRATED COMMERCIAL Regular & Fast Charging management EVBox Care Project Planning, Site Charging Stations software Services Optimization, Energy SOLUTIONS Management • Workplace • Hospitality • Retail RESIDENTIAL & AUTOMOTIVE SOLUTIONS EVBox Elvi home EVBox Elvi for multi- Branded residential charging Mobile app for drivers • Private home charging with l family units/apartments for mass production by • Apartments / subscription & with billing capabilities specific charging players Condominiums card for drivers for tenants (Automotive) • Automotive We design and sell market leading hardware, software and services to EV charging station owners and drivers
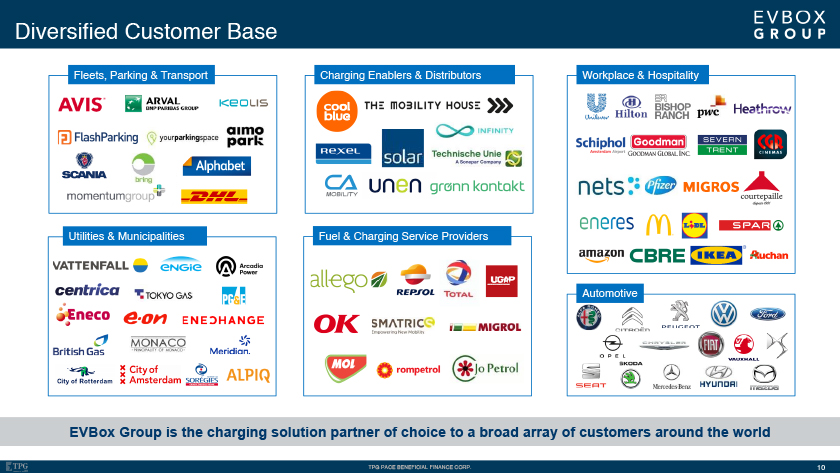
Diversified Customer Base Fleets, Parking & Transport Charging Enablers & Distributors Workplace & Hospitality Utilities & Municipalities Fuel & Charging Service Providers Automotive EVBox Group is the charging solution partner of choice to a broad array of customers around the world
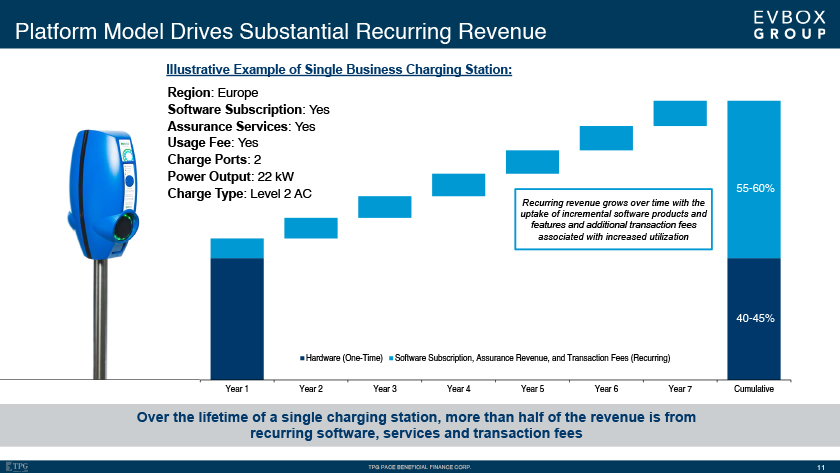
Platform Model Drives Substantial Recurring Revenue Illustrative Example of Single Business Charging Station: Region: Europe Software Subscription: Yes rance Services: Yes e Fee: Yes Ports: 2 r Output: 22 kW Type: Level 2 AC Recurring revenue grows over time with the uptake of incremental software products and features and additional transaction fees associated with increased utilization Hardware (One-Time) Software Subscription, Assurance Revenue, and Transaction Fees (Recurring) Over the lifetime of a single charging station, more than half of the revenue is from recurring software, services and transaction fees
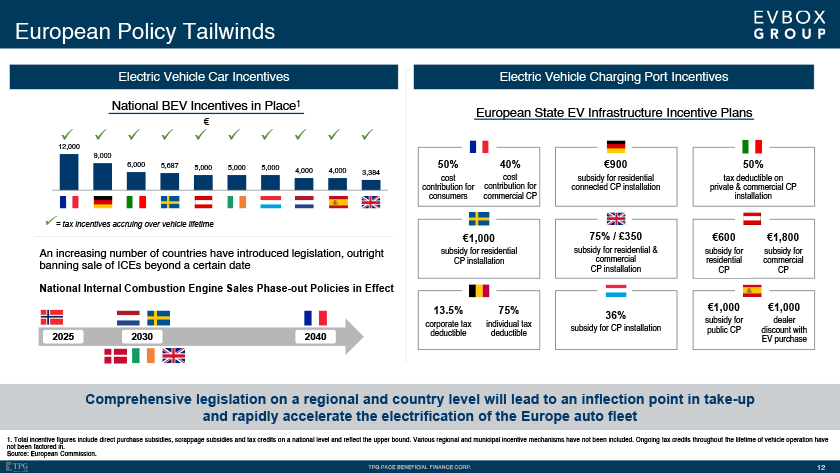
European Policy Tailwinds Electric Vehicle Car Incentives National BEV Incentives in Place1 An increasing number of countries have introduced legislation, outright banning sale of ICEs beyond a certain date National Internal Combustion Engine Sales Phase-out Policies in Effect Electric Vehicle Charging Port Incentives European State EV Infrastructure Incentive Plans 50% 40% €900 50% cost cost subsidy for residential tax deductible on contribution for contribution for connected CP installation private & commercial CP consumers commercial CP installation €1,000 75% / £350 €600 €1,800 subsidy for residential subsidy for residential & subsidy for subsidy for CP installation commercial residential commercial CP installation CP CP 13.5% 75% €1,000 €1,000 36% corporate tax individual tax subsidy for dealer subsidy for CP installation public CP discount with deductible deductible EV purchase Comprehensive legislation on a regional and country level will lead to an inflection point in take-up and rapidly accelerate the electrification of the Europe auto fleet 1. Total incentive figures include direct purchase subsidies, scrappage subsidies and tax credits on a national level and reflect the upper bound. Various regional and municipal incentive mechanisms have not been included. Ongoing tax credits throughout the lifetime of vehicle operation have not been factored in. Source: European Commission.
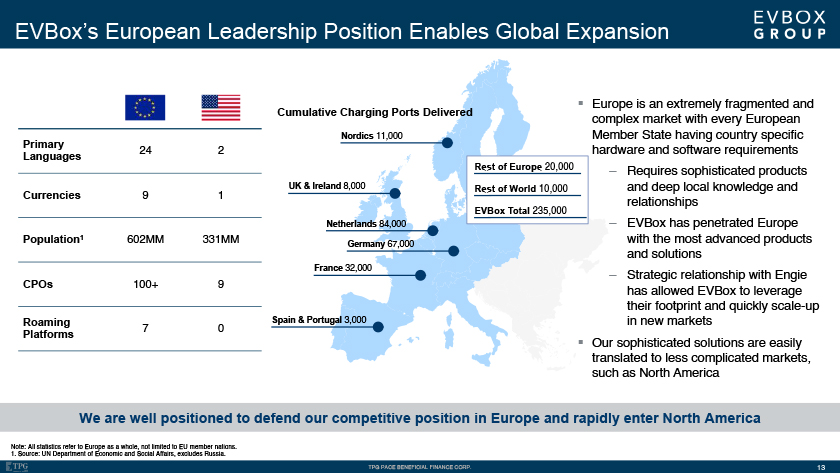
EVBox’s European Leadership Position Enables Global Expansion Cumulative Charging Ports Delivered Primary Nordics 11,000 24 2 Languages Rest of Europe 20,000 Currencies 9 1 UK & Ireland 8,000 Rest of World 10,000 EVBox Total 235,000 Netherlands 84,000 Population1 602MM 331MM Germany 67,000 France 32,000 CPOs 100+ 9 Roaming 7 0 Spain & Portugal 3,000 Platforms Europe is an extremely fragmented and complex market with every European Member State having country specific hardware and software requirements – Requires sophisticated products and deep local knowledge and relationships – EVBox has penetrated Europe with the most advanced products and solutions – Strategic relationship with Engie has allowed EVBox to leverage their footprint and quickly scale-up in new markets Our sophisticated solutions are easily translated to less complicated markets, such as North America We are well positioned to defend our competitive position in Europe and rapidly enter North America Note: All statistics refer to Europe as a whole, not limited to EU member nations. 1. Source: UN Department of Economic and Social Affairs, excludes Russia.
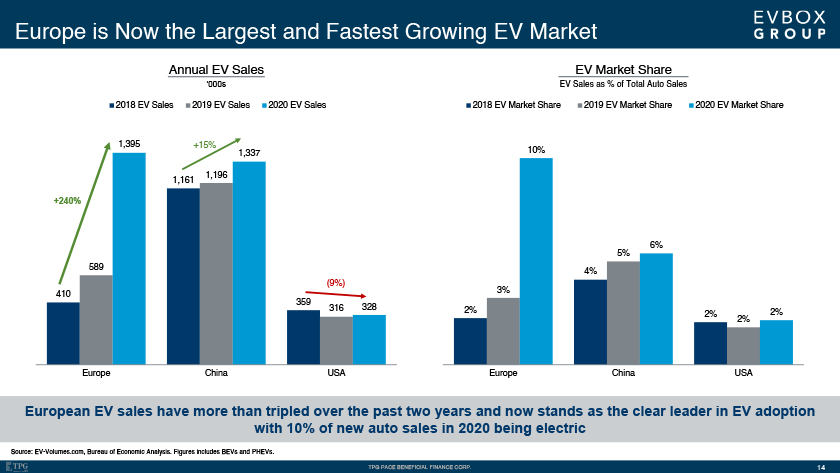
Europe is Now the Largest and Fastest Growing EV Market Annual EV Sales ‘000s 2018 EV Sales 2019 EV Sales 2020 EV Sales EV Market Share EV Sales as % of Total Auto Sales 2018 EV Market Share 2019 EV Market Share 2020 EV Market Share European EV sales have more than tripled over the past two years and now stands as the clear leader in EV adoption with 10% of new auto sales in 2020 being electric Source: EV-Volumes.com, Bureau of Economic Analysis. Figures includes BEVs and PHEVs.
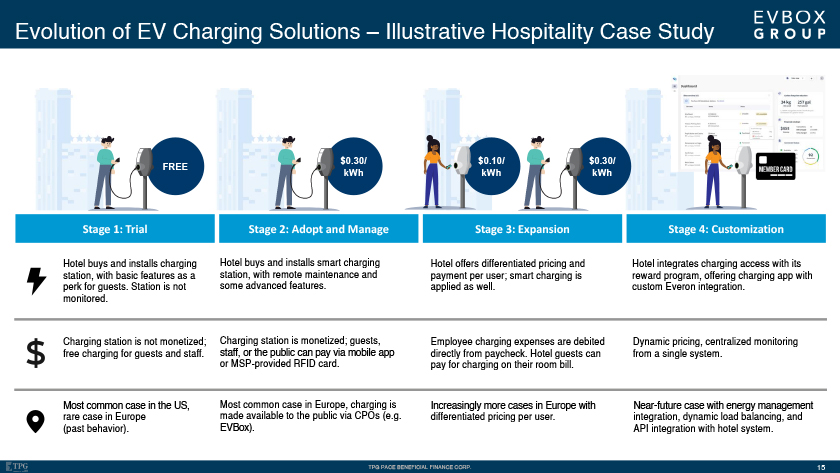
Evolution of EV Charging Solutions – Illustrative Hospitality Case Study Stage 1: Trial Hotel buys and installs charging station, with basic features as a perk for guests. Station is not monitored. Charging station is not monetized; free charging for guests and staff. Most common case in the US, rare case in Europe (past behavior). Stage 2: Adopt and Manage Hotel buys and installs smart charging station, with remote maintenance and some advanced features. Charging station is monetized; guests, staff, or the public can pay via mobile app or MSP-provided RFID card. Most common case in Europe, charging is made available to the public via CPOs (e.g. EVBox). Stage 3: Expansion Hotel offers differentiated pricing and payment per user; smart charging is applied as well. Employee charging expenses are debited directly from paycheck. Hotel guests can pay for charging on their room bill. Increasingly more cases in Europe with differentiated pricing per user. Stage 4: Customization Hotel integrates charging access with its reward program, offering charging app with custom Everon integration. Dynamic pricing, centralized monitoring from a single system. Near-future case with energy management integration, dynamic load balancing, and API integration with hotel system.
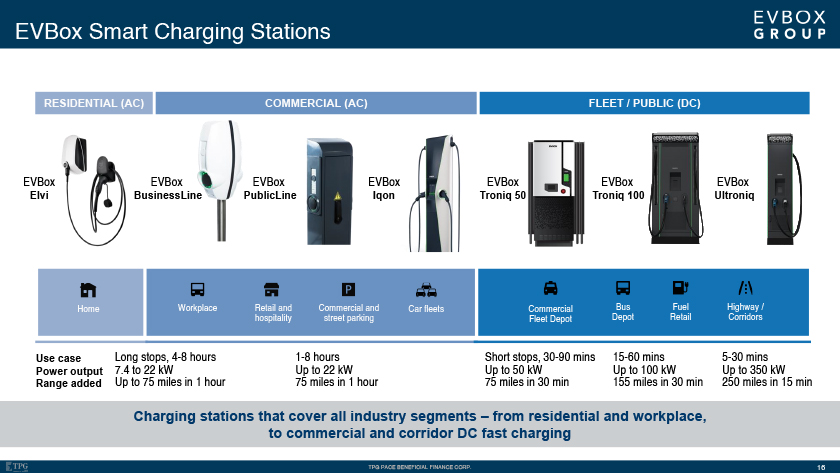
EVBox Smart Charging Stations RESIDENTIAL (AC) COMMERCIAL (AC) FLEET / PUBLIC (DC) EVBox EVBox EVBox EVBox EVBox EVBox EVBox Elvi BusinessLine PublicLine Iqon Troniq 50 Troniq 100 Ultroniq Home Workplace Retail and Commercial and Car fleets Commercial Bus Fuel Highway / hospitality street parking Fleet Depot Depot Retail Corridors Use case Long stops, 4-8 hours 1-8 hours Short stops, 30-90 mins 15-60 mins 5-30 mins Power output 7.4 to 22 kW Up to 22 kW Up to 50 kW Up to 100 kW Up to 350 kW Range added Up to 75 miles in 1 hour 75 miles in 1 hour 75 miles in 30 min 155 miles in 30 min 250 miles in 15 min Charging stations that cover all industry segments – from residential and workplace, to commercial and corridor DC fast charging
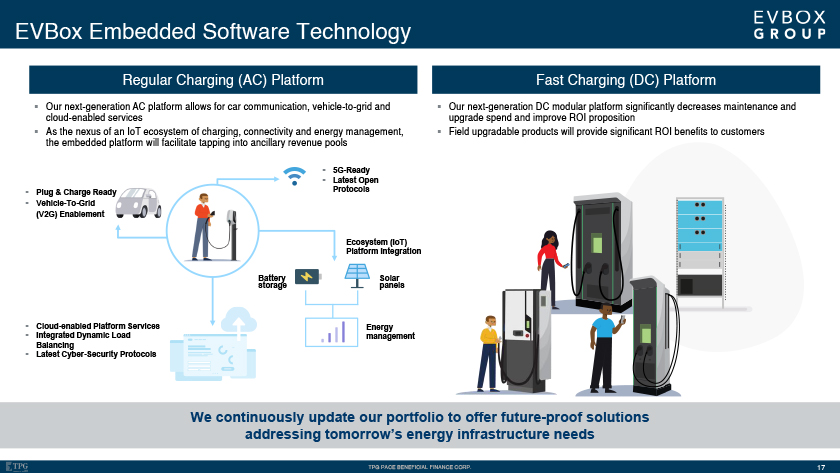
EVBox Embedded Software Technology Regular Charging (AC) Platform Fast Charging (DC) Platform â–ª Our next-generation AC platform allows for car communication, vehicle-to-grid and â–ª Our next-generation DC modular platform significantly decreases maintenance and cloud-enabled services upgrade spend and improve ROI proposition â–ª As the nexus of an IoT ecosystem of charging, connectivity and energy management, â–ª Field upgradable products will provide significant ROI benefits to customers the embedded platform will facilitate tapping into ancillary revenue pools â–ª 5G-Ready â–ª Latest Open â–ª Plug & Charge Ready Protocols â–ª Vehicle-To-Grid (V2G) Enablement Ecosystem (IoT) Platform Integration Battery Solar storage panels â–ª Cloud-enabled Platform Services Energy â–ª Integrated Dynamic Load management Balancing â–ª Latest Cyber-Security Protocols We continuously update our portfolio to offer future-proof solutions addressing tomorrow’s energy infrastructure needs 17
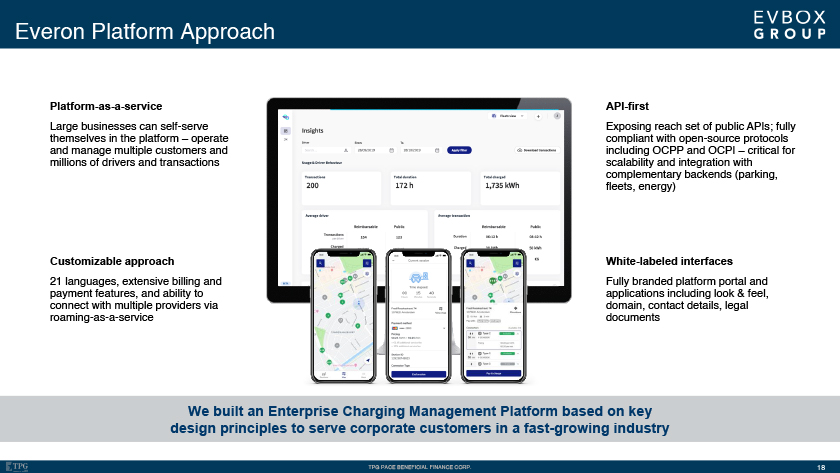
Everon Platform Approach Platform-as-a-service Large businesses can self-serve themselves in the platform – operate and manage multiple customers and millions of drivers and transactions Customizable approach 21 languages, extensive billing and payment features, and ability to connect with multiple providers via roaming-as-a-service API-first Exposing reach set of public APIs; fully compliant with open-source protocols including OCPP and OCPI – critical for scalability and integration with complementary backends (parking, fleets, energy) White-labeled interfaces Fully branded platform portal and applications including look & feel, domain, contact details, legal documents We built an Enterprise Charging Management Platform based on key design principles to serve corporate customers in a fast-growing industry
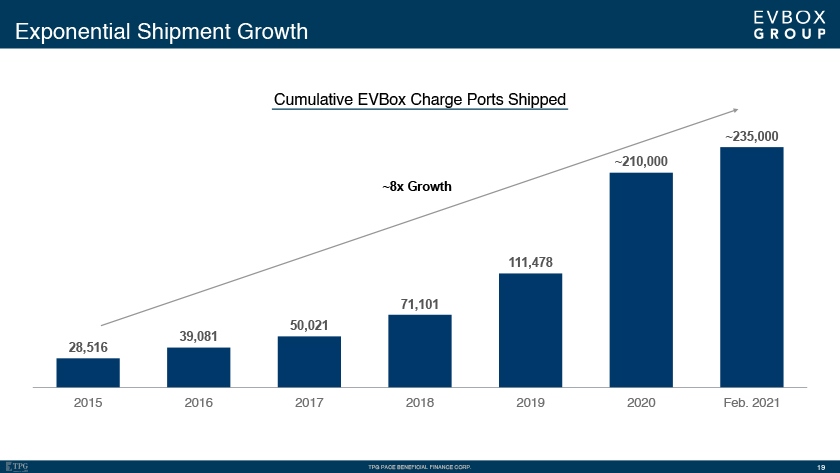
Exponential Shipment Growth Cumulative EVBox Charge Ports Shipped
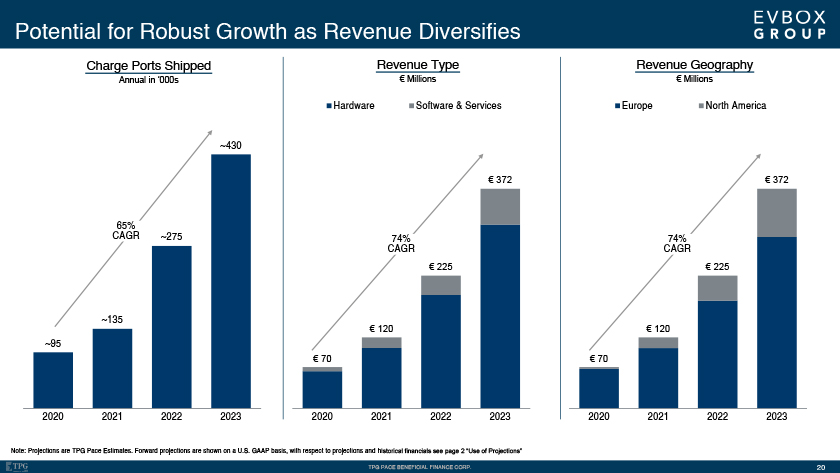
Potential for Robust Growth as Revenue Diversifies Charge Ports Shipped Annual in ‘000s Revenue Type € Millions Hardware Software & Services Revenue Geography € Millions Europe North America Note: Projections are TPG Pace Estimates. Forward projections are shown on a U.S. GAAP basis, with respect to projections and historical financials see page 2 “Use of Projections”
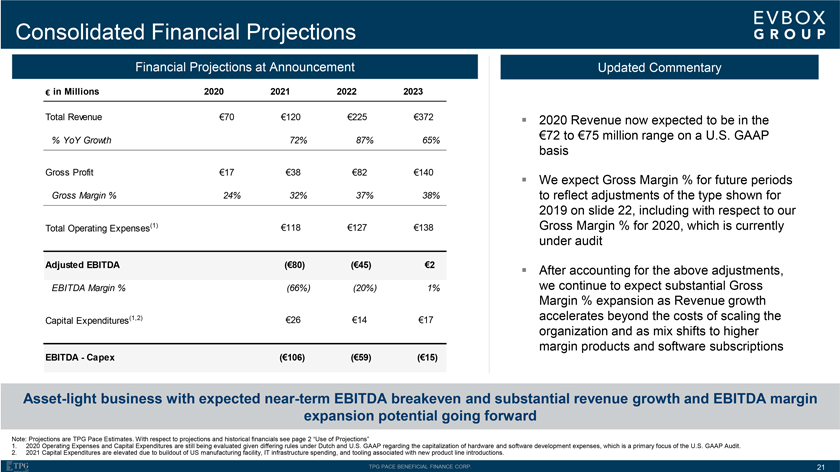
Consolidated Financial Projections Financial Projections at Announcement Updated Commentary € in Millions 2020 2021 2022 2023 Total Revenue €70 €120 €225 €372 2020 Revenue now expected to be in the 72 to 75 million range on a U.S. GAAP % YoY Growth 72% 87% 65% basis Gross Profit 17 38 82 140 We expect Gross Margin % for future periods Gross Margin % 24% 32% 37% 38% to reflect adjustments of the type shown for 2019 on slide 22, including with respect to our Total Operating Expenses(1) 118 127 138 Gross Margin % for 2020, which is currently under audit Adjusted EBITDA (80) (45) 2 After accounting for the above adjustments, EBITDA Margin % (66%) (20%) 1% we continue to expect substantial Gross Margin % expansion as Revenue growth Capital Expenditures(1,2) 26 14 17 accelerates beyond the costs of scaling the organization and as mix shifts to higher margin products and software subscriptions EBITDA - Capex (106) (59) (15) Asset-light business with expected near-term EBITDA breakeven and substantial revenue growth and EBITDA margin expansion potential going forward Note: Projections are TPG Pace Estimates. With respect to projections and historical financials see page 2 Use of Projections 1. 2020 Operating Expenses and Capital Expenditures are still being evaluated given differing rules under Dutch and U.S. GAAP regarding the capitalization of hardware and software development expenses, which is a primary focus of the U.S. GAAP Audit. 2. 2021 Capital Expenditures are elevated due to buildout of US manufacturing facility, IT infrastructure spending, and tooling associated with new product line introductions. TPG PACE BENEFICIAL FINANCE CORP. 21
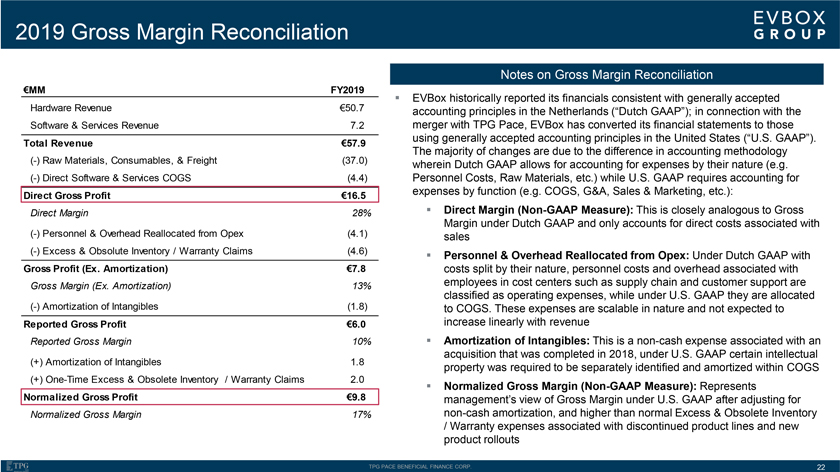
2019 Gross Margin Reconciliation Notes on Gross Margin Reconciliation €MM FY2019 EVBox historically reported its financials consistent with generally accepted Hardware Revenue 50.7 accounting principles in the Netherlands (Dutch GAAP); in connection with the Software & Services Revenue 7.2 merger with TPG Pace, EVBox has converted its financial statements to those using generally accepted accounting principles in the United States (U.S. GAAP). Total Revenue 57.9 The majority of changes are due to the difference in accounting methodology (-) Raw Materials, Consumables, & Freight (37.0) wherein Dutch GAAP allows for accounting for expenses by their nature (e.g. (-) Direct Software & Services COGS (4.4) Personnel Costs, Raw Materials, etc.) while U.S. GAAP requires accounting for expenses by function (e.g. COGS, G&A, Sales & Marketing, etc.): Direct Gross Profit 16.5 Direct Margin 28% Direct Margin (Non-GAAP Measure): This is closely analogous to Gross Margin under Dutch GAAP and only accounts for direct costs associated with (-) Personnel & Overhead Reallocated from Opex (4.1) sales (-) Excess & Obsolute Inventory / Warranty Claims (4.6) Personnel & Overhead Reallocated from Opex: Under Dutch GAAP with Gross Profit (Ex. Amortization) 7.8 costs split by their nature, personnel costs and overhead associated with Gross Margin (Ex. Amortization) 13% employees in cost centers such as supply chain and customer support are classified as operating expenses, while under U.S. GAAP they are allocated (-) Amortization of Intangibles (1.8) to COGS. These expenses are scalable in nature and not expected to Reported Gross Profit 6.0 increase linearly with revenue Reported Gross Margin 10% Amortization of Intangibles: This is a non-cash expense associated with an (+) Amortization of Intangibles 1.8 acquisition that was completed in 2018, under U.S. GAAP certain intellectual property was required to be separately identified and amortized within COGS (+) One-Time Excess & Obsolete Inventory / Warranty Claims 2.0 Normalized Gross Margin (Non-GAAP Measure): Represents Normalized Gross Profit 9.8 management’s view of Gross Margin under U.S. GAAP after adjusting for Normalized Gross Margin 17% non-cash amortization, and higher than normal Excess & Obsolete Inventory / Warranty expenses associated with discontinued product lines and new product rollouts TPG PACE BENEFICIAL FINANCE CORP. 22
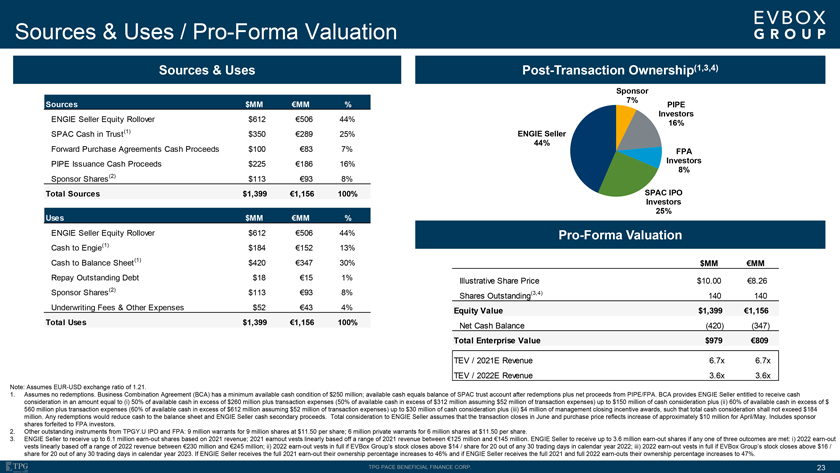
Sources & Uses / Pro-Forma Valuation Sources & Uses Post-Transaction Ownership(1,3,4) Sponsor 7% Sources $MM €MM % PIPE Investors ENGIE Seller Equity Rollover $612 €506 44% 16% SPAC Cash in Trust(1) $350 €289 25% ENGIE Seller 44% Forward Purchase Agreements Cash Proceeds $100 €83 7% FPA PIPE Issuance Cash Proceeds $225 €186 16% Investors 8% Sponsor Shares(2) $113 €93 8% Total Sources $1,399 €1,156 100% SPAC IPO Investors Uses $MM €MM % 25% ENGIE Seller Equity Rollover $612 €506 44% Pro-Forma Valuation Cash to Engie(1) $184 €152 13% Cash to Balance Sheet(1) $420 €347 30% $MM €MM Repay Outstanding Debt $18 €15 1% Illustrative Share Price $10.00 €8.26 (2) Sponsor Shares $113 €93 8% Shares Outstanding(3,4) 140 140 Underwriting Fees & Other Expenses $52 €43 4% Equity Value $1,399 €1,156 Total Uses $1,399 €1,156 100% Net Cash Balance (420) (347) Total Enterprise Value $979 €809 TEV / 2021E Revenue 6.7x 6.7x TEV / 2022E Revenue 3.6x 3.6x Note: Assumes EUR-USD exchange ratio of 1.21. 1. Assumes no redemptions. Business Combination Agreement (BCA) has a minimum available cash condition of $250 million; available cash equals balance of SPAC trust account after redemptions plus net proceeds from PIPE/FPA. BCA provides ENGIE Seller entitled to receive cash consideration in an amount equal to (i) 50% of available cash in excess of $260 million plus transaction expenses (50% of available cash in excess of $312 million assuming $52 million of transaction expenses) up to $150 million of cash consideration plus (ii) 60% of available cash in excess of $ 560 million plus transaction expenses (60% of available cash in excess of $612 million assuming $52 million of transaction expenses) up to $30 million of cash consideration plus (iii) $4 million of management closing incentive awards, such that total cash consideration shall not exceed $184 million. Any redemptions would reduce cash to the balance sheet and ENGIE Seller cash secondary proceeds. Total consideration to ENGIE Seller assumes that the transaction closes in June and purchase price reflects increase of approximately $10 million for April/May. Includes sponsor shares forfeited to FPA investors. 2. Other outstanding instruments from TPGY.U IPO and FPA: 9 million warrants for 9 million shares at $11.50 per share; 6 million private warrants for 6 million shares at $11.50 per share. 3. ENGIE Seller to receive up to 6.1 million earn-out shares based on 2021 revenue; 2021 earnout vests linearly based off a range of 2021 revenue between €125 million and €145 million. ENGIE Seller to receive up to 3.6 million earn-out shares if any one of three outcomes are met: i) 2022 earn-out vests linearly based off a range of 2022 revenue between €230 million and €245 million; ii) 2022 earn-out vests in full if EVBox Group’s stock closes above $14 / share for 20 out of any 30 trading days in calendar year 2022; iii) 2022 earn-out vests in full if EVBox Group’s stock closes above $16 / share for 20 out of any 30 trading days in calendar year 2023. If ENGIE Seller receives the full 2021 earn-out their ownership percentage increases to 46% and if ENGIE Seller receives the full 2021 and full 2022 earn-outs their ownership percentage increases to 47%. TPG PACE BENEFICIAL FINANCE CORP. 23
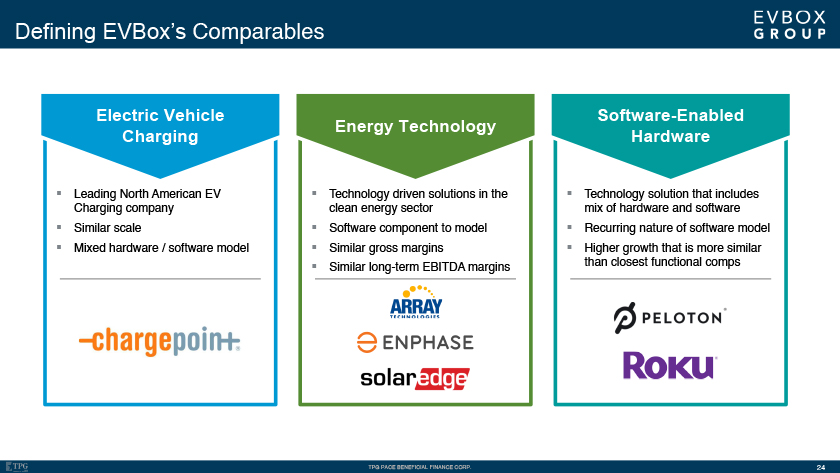
Defining EVBox’s Comparables Electric Vehicle Charging â–ª Leading North American EV Charging company â–ª Similar scale â–ª Mixed hardware / software model Energy Technology â–ª Technology driven solutions in the clean energy sector â–ª Software component to model â–ª Similar gross margins â–ª Similar long-term EBITDA margins Software-Enabled Hardware â–ª Technology solution that includes mix of hardware and software â–ª Recurring nature of software model â–ª Higher growth that is more similar than closest functional comps
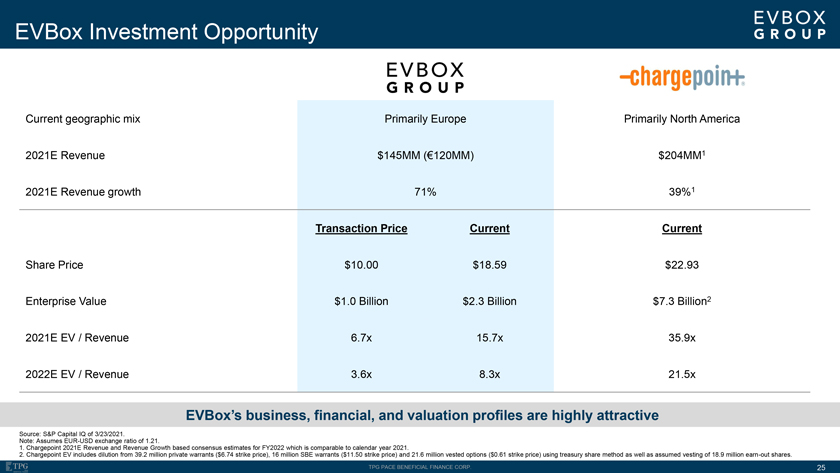
EVBox Investment Opportunity Current geographic mix Primarily Europe Primarily North America 2021E Revenue $145MM (€120MM) $204MM1 2021E Revenue growth 71% 39%1 Transaction Price Current Current Share Price $10.00 $18.59 $22.93 Enterprise Value $1.0 Billion $2.3 Billion $7.3 Billion2 2021E EV / Revenue 6.7x 15.7x 35.9x 2022E EV / Revenue 3.6x 8.3x 21.5x EVBox’s business, financial, and valuation profiles are highly attractive Source: S&P Capital IQ of 3/23/2021. Note: Assumes EUR-USD exchange ratio of 1.21. 1. Chargepoint 2021E Revenue and Revenue Growth based consensus estimates for FY2022 which is comparable to calendar year 2021. 2. Chargepoint EV includes dilution from 39.2 million private warrants ($6.74 strike price), 16 million SBE warrants ($11.50 strike price) and 21.6 million vested options ($0.61 strike price) using treasury share method as well as assumed vesting of 18.9 million earn-out shares. TPG PACE BENEFICIAL FINANCE CORP. 25
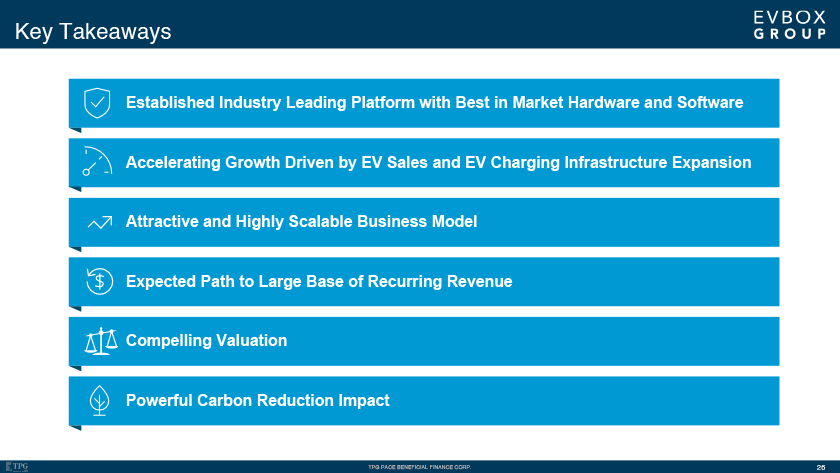
Key Takeaways Established Industry Leading Platform with Best in Market Hardware and Software Accelerating Growth
Driven by EV Sales and EV Charging Infrastructure Expansion Attractive and Highly Scalable Business Model Expected Path to Large Base of Recurring Revenue Compelling Valuation Powerful Carbon Reduction Impact
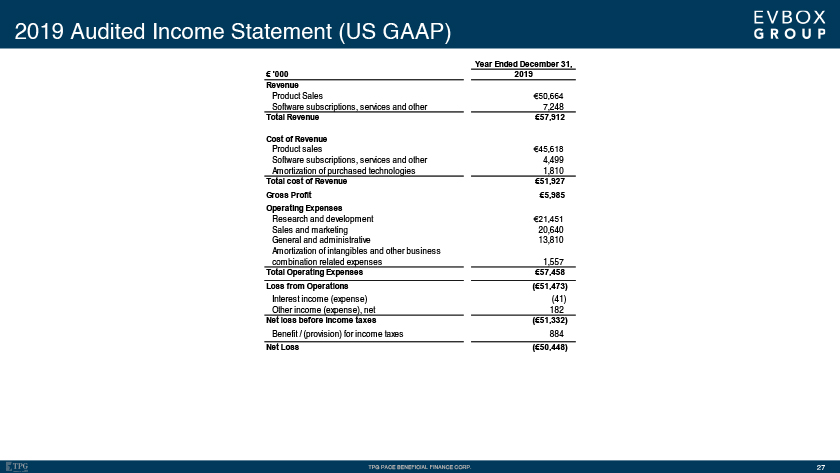
2019 Audited Income Statement (US GAAP) Year Ended December 31, € ‘000 2019 Revenue Product Sales €50,664 Software subscriptions, services and other 7,248 Total Revenue €57,912 Cost of Revenue Product sales €45,618 Software subscriptions, services and other 4,499 Amortization of purchased technologies 1,810 Total cost of Revenue €51,927 Gross Profit €5,985 Operating Expenses Research and development €21,451 Sales and marketing 20,640 General and administrative 13,810 Amortization of intangibles and other business combination related expenses 1,557 Total Operating Expenses €57,458 Loss from Operations (€51,473) Interest income (expense) (41) Other income (expense), net 182 Net loss before income taxes (€51,332) Benefit / (provision) for income taxes 884 Net Loss (€50,448)
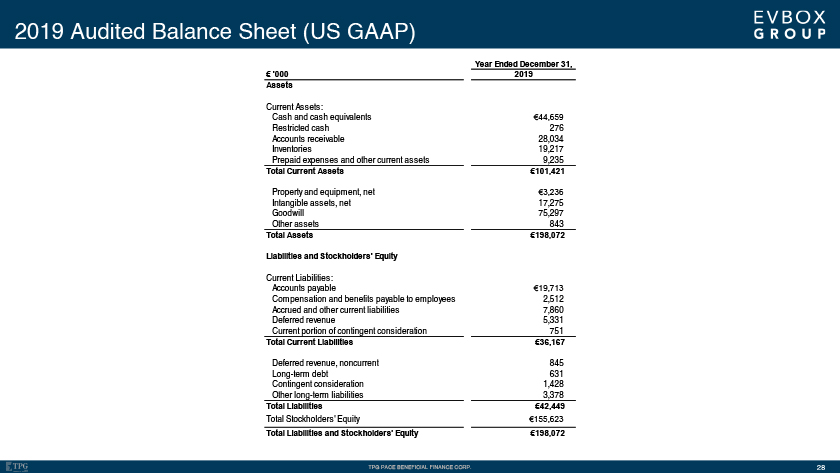
2019 Audited Balance Sheet (US GAAP) Year Ended December 31, € ‘000 2019 Assets Current Assets: Cash and cash equivalents €44,659 Restricted cash 276 Accounts receivable 28,034 Inventories 19,217 Prepaid expenses and other current assets 9,235 Total Current Assets €101,421 Property and equipment, net €3,236 Intangible assets, net 17,275 Goodwill 75,297 Other assets 843 Total Assets €198,072 Liabilities and Stockholders’ Equity Current Liabilities: Accounts payable €19,713 Compensation and benefits payable to employees 2,512 Accrued and other current liabilities 7,860 Deferred revenue 5,331 Current portion of contingent consideration 751 Total Current Liabilities €36,167 Deferred revenue, noncurrent 845 Long-term debt 631 Contingent consideration 1,428 Other long-term liabilities 3,378 Total Liabilities €42,449 Total Stockholders’ Equity €155,623 Total Liabilities and Stockholders’ Equity €198,072
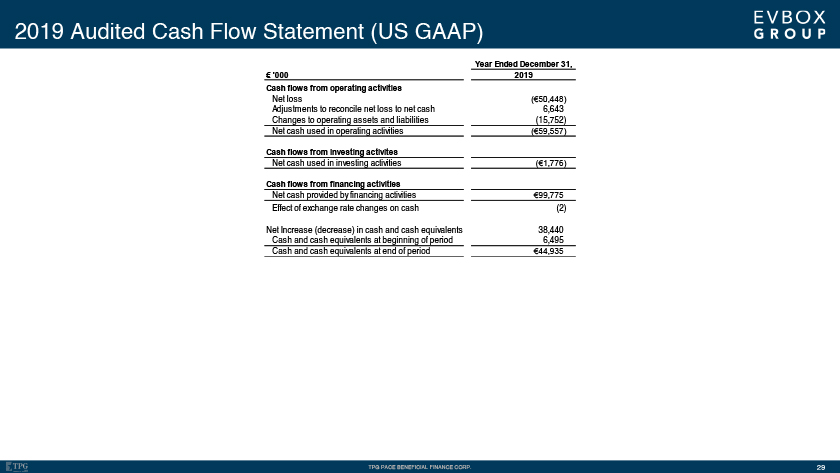
2019 Audited Cash Flow Statement (US GAAP) Year Ended December 31, € ‘000 2019 Cash flows from operating activities Net loss (€50,448) Adjustments to reconcile net loss to net cash 6,643 Changes to operating assets and liabilities (15,752) Net cash used in operating activities (€59,557) Cash flows from investing activites Net cash used in investing activities (€1,776) Cash flows from financing activities Net cash provided by financing activities €99,775 Effect of exchange rate changes on cash (2) Net Increase (decrease) in cash and cash equivalents 38,440 Cash and cash equivalents at beginning of period 6,495 Cash and cash equivalents at end of period €44,935
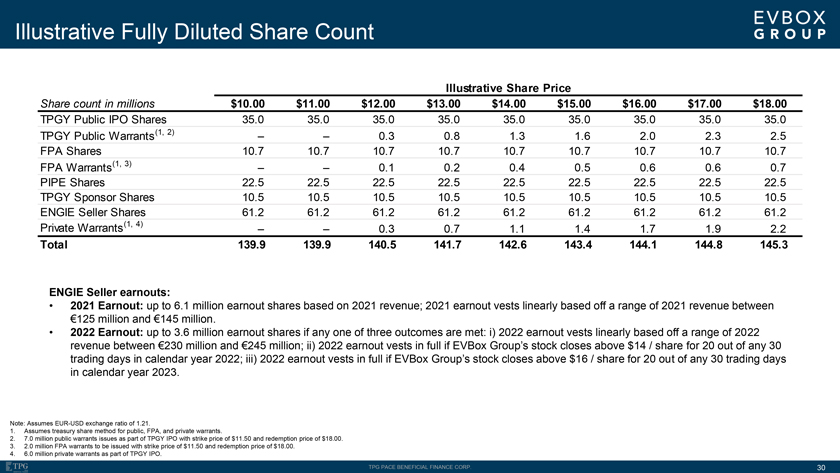
Illustrative Fully Diluted Share Count Illustrative Share Price Share count in millions $10.00 $11.00 $12.00 $13.00
$14.00 $15.00 $16.00 $17.00 $18.00 TPGY Public IPO Shares 35.0 35.0 35.0 35.0 35.0 35.0 35.0 35.0 35.0 TPGY Public Warrants(1, 2) – – 0.3 0.8 1.3 1.6 2.0 2.3 2.5 FPA Shares 10.7 10.7 10.7 10.7 10.7 10.7 10.7 10.7 10.7 FPA Warrants(1, 3)
– – 0.1 0.2 0.4 0.5 0.6 0.6 0.7 PIPE Shares 22.5 22.5 22.5 22.5 22.5 22.5 22.5 22.5 22.5 TPGY Sponsor Shares 10.5 10.5 10.5 10.5 10.5 10.5 10.5 10.5 10.5 ENGIE Seller Shares 61.2 61.2 61.2 61.2 61.2 61.2 61.2 61.2 61.2 Private Warrants(1,
4) – – 0.3 0.7 1.1 1.4 1.7 1.9 2.2 Total 139.9 139.9 140.5 141.7 142.6 143.4 144.1 144.8 145.3 ENGIE Seller earnouts: • 2021 Earnout: up to 6.1 million earnout shares based on 2021 revenue; 2021 earnout vests linearly based off a
range of 2021 revenue between €125 million and €145 million. • 2022 Earnout: up to 3.6 million earnout shares if any one of three outcomes are met: i) 2022 earnout vests linearly based off a range of 2022 revenue between €230
million and €245 million; ii) 2022 earnout vests in full if EVBox Group’s stock closes above $14 / share for 20 out of any 30 trading days in calendar year 2022; iii) 2022 earnout vests in full if EVBox Group’s stock closes above $16
/ share for 20 out of any 30 trading days in calendar year 2023. Note: Assumes EUR-USD exchange ratio of 1.21. 1. Assumes treasury share method for public, FPA, and private warrants. 2. 7.0 million public warrants issues as part of TPGY IPO with
strike price of $11.50 and redemption price of $18.00. 3. 2.0 million FPA warrants to be issued with strike price of $11.50 and redemption price of $18.00. 4. 6.0 million private warrants as part of TPGY IPO. TPG PACE BENEFICIAL FINANCE CORP. 30