Attached files
|
OVBC
|
|
ANNUAL REPORT
|
|
2020
|
[Picture of Rio Grande Office]
Honoring 50 years in Rio Grande
|
A note about the cover:
Throughout much of this report you will see how your company faced the challenges of the COVID-19 global pandemic that changed
everything. There is no doubt that when we mark this year in history, the pandemic will always be front and center. However, it should also be noted that there were other things that happened in 2020. Fantastic things. Positive milestones
and achievements that deserved not to be swept aside and forgotten. And for this reason, we chose to adorn this year’s cover not with masks, but with a celebration. Help us in congratulating the community bankers at OVB Rio Grande on the
50th anniversary of Ohio Valley Bank’s first branch.
|
[Picture]
Remote workstation technology was set up for 71 employees in just two weeks,
securing the continuancy of financial services for our communities. Pictured in mask is Chairman Wiseman; on screen is President Miller.
Message from Management
Dear Neighbors and Friends,
Before the 2020 pandemic, the CDC notes the Flu Pandemic of 1918 as the most severe in recent history. OVB survived that one too.
We have always attributed the bank’s longevity to the loyal support of our community. We returned that support with interest during this pandemic.
When we had to close Ohio Valley Bank lobbies, we extended drive-thru hours and invested over $170,000 in advancing contactless banking services. When the IRS sent over 3,000
stimulus checks to Loan Central instead of to the people, we didn’t just send them back to the IRS as our competitors did. We got each one to its rightful owner. When gatherings of more than ten were banned, we secured the means to hold the first
virtual Annual Meeting in the company’s history. When the big banks used their might to try to scoop up all the Paycheck Protection Program (PPP) funding, we worked through the nights and weekends to secure over $35 million for our local
businesses.
Ohio Valley Bank and Loan Central did not lay off any workers or permanently close any
offices. As a matter of fact, it was all hands on deck as we accelerated technology projects, put in overtime, sought opportunities for expansion, and worked to be there for our communities in new ways.
And though we were able to keep business as usual for the most part, special honors had
to be delayed. Milestones like the completion of OVB on the Square and the retirement celebration for the distinguished career of former Chairman Jeff Smith were put on hold. We do still plan to celebrate both when Governor DeWine lifts gathering
restrictions.
Another event you can count on, though it will be a virtual event, is our 2021 Annual Shareholders
Meeting. Plan to join us online May 19th at 3:00 p.m. Have your control number, found with your voting information, ready when you log in. We plan to return to the Ariel Theatre in 2022. Until then, know that your teams here at Ohio Valley Banc
Corp. deeply appreciate your ongoing support and will continue working to pay it forward to the communities we share.
Sincerely,
Thomas E. Wiseman
Chairman of the Board & CEO
Ohio Valley Banc Corp.

Larry E. Miller, II
President & Chief Operating Officer
Ohio Valley Banc Corp.
1
[Picture]
Hometown commercial loan officers like Shelly Boothe and Pat Tackett
worked into the wee hours of the morning for several days to secure PPP funding for local businesses.

With lobbies closed for much of 2020, contactless banking channels such as mobile banking, ATMs, and drive-thru windows took center stage. With a
robust technology infrastructure already in place, Ohio Valley Bank was well prepared for the challenges of the year.
OVB’s ATM network includes 35 locally installed machines and customer surcharge-free access to more than 37,000 through the MoneyPass network. The added convenience
of drive-thru ATMs at 12 locations, made banking even easier.
Ohio Valley Bank introduced a major upgrade to its OVB Line telephone banking in May. The project was in progress before the pandemic, but couldn’t come at a better
time. The improved OVB Line fielded over 10,000 calls in its first month, answering customer needs on the first ring.
Users flocked to NetTeller internet banking and the OVB Mobile App each month. More than
2,000 customers discovered the ease of mobile banking for the first time in 2020. Text Message Banking received a record 35,358 requests for balances and history.
These electronic channels provided access 24/7 during the unprecedented crisis, but they could never replace the special touch of our hometown community bankers. These remarkable folks found ways
to work with safety protocols to continue to provide unmatched service, as proven by the more than 450,000 estimated transactions conducted at OVB drive-thru windows during the year
and outreach in the form of six-months of deferred loan payments, waived early closeout fees for Christmas Savings accounts, and financial support for charities committed to helping our communities.
2020 by
the numbers
$35,000,000
In 100% forgiveable loans secured by OVB for businesses through the SBA.
$10,649,306.02
Deposited using a cell phone or tablet on the go.
Over a million in the month of December alone!
225,566
Statements and notices contactlessly delivered by OVB eDelivery.
116,640
Online bill payments sent by customers.
678,320
Safe and secure transactions at the ATM.
214,553
People shopped for their next vehicle at the online OVB Auto Loan Center.
77,903
Calls answered by OVB Line telephone banking, assisting customers with
transfers, loan payments, debit card activation and more.
$172,000,000
Increase in total deposits at December 31 over the prior year.
[Picture]

Our employees found many ways to work with pandemic restrictions and still be there for our communities who needed us.
Above: Community bankers Maranda Prevatt, Rachel Stevens, and Leigh Anne Roten have a little fun during a clean sweep of the high touch
areas at the Barboursville Office lobby.
Right Page Top Row Left: In March, several improvements were made to the Waverly Office including new concrete and
lights for the exterior. Middle: 2020 OVB 4-H Scholar Olivia Harrison with OVB’s Larry Miller and Tom Wiseman. Special thanks to the Gallia Co. 4-H Advisors for allowing us to present this honor during their
awards when COVID restrictions cancelled the event where we usually bestow the honor. Right: Larry Miller presents a donation to God’s Hands at Work to help them provide winter heating bill assistance for
those financially burdened by the pandemic.
Right Page Middle Row Left: “Penny Bandit”, OVB Jackson’s entry in this year’s Farm Bureau Hog Wild fundraiser made the Top 15 in donations
raised. Outfitted in a custom made mask, she was hard to resist. Middle: Community Banker Alex White shines up the drive- thru window at OVB Rio Grande as they prepare for another day of contactless
banking. Right: President and Chief Operating Officer Larry Miller delivered a Merry Christmas message to all from the rooftop patio at OVB on the Square overlooking the OVB Tree at Gallipolis in Lights. OVB
on the Square participated in the event for the first time with lighted window displays, rooftop lights, and red and green spotlights at the base of each of the building’s massive windows.
Right Page Bottom Row Left: In July, community banker Crystal Ramey was excited to welcome customers back into the OVB Milton bank lobby. Like all OVB
branches, Milton is equipped with safety barriers and social distancing markers for the continued health of our customers. Middle: OVBC Chairman Tom Wiseman personally delivers the bank’s donation of
10,000 masks to Holzer Health for frontline healthcare workers in need of PPE. Right: Though the bank’s Veteran’s Action Committee (VAC) was unable to hold their annual Ruck Walk fundraiser, they still
raised $2,400 for local veterans organizations, largely through the Community First Debit Card program’s veterans designs. Pictured are Tom Wiseman and VAC Chair Johnnie Wamsley presenting the donations to representatives from the American Legion
Post 23 in Point Pleasant, Gallia/Meigs/Mason Marine Corps League Detachment 1180, and the Gallipolis VFW.
[ Pictures Only]

OVBC DIRECTORS
Thomas E. Wiseman
Chairman and Chief Executive Officer, Ohio Valley Banc Corp.
and Ohio Valley Bank
Larry E. Miller, II
President & Chief Operating Officer, Ohio Valley Banc Corp. and
Ohio Valley Bank
David W. Thomas, Lead Director
Former Chief Examiner, Ohio Division of Financial Institutions
bank supervision and regulation
Anna P. Barnitz
Treasurer & CFO, Bob’s Market & Greenhouses, Inc.
wholesale horticultural products and retail landscaping stores
Brent A. Saunders
Chairman of the Board, Holzer Health System
Attorney, Halliday, Sheets & Saunders
healthcare
Harold A. Howe
Self-employed, Real Estate Investment and Rental Property
Brent R. Eastman
President and Co-owner, Ohio Valley Supermarkets
Partner, Eastman Enterprises
Kimberly A. Canady
Owner, Canady Farms, LLC
agricultural products and agronomy services
Edward J. Robbins
President & CEO, Ohio Valley Veneer, Inc.
wood harvesting, processing and manufacturing of dry
lumber & flooring in Ohio, Kentucky, and Tennessee
OHIO VALLEY BANK DIRECTORS
Thomas E. Wiseman Brent R. Eastmam
DavidW. Thomas K imberly A. Canady Harold A. Howe Edward J. Robbins
Anna P. Barnitz Larry E. Miller, II
Brent A. Saunders
|
OVBC OFFICERS
Thomas E. Wiseman, Chairman and Chief Executive Officer
Larry E. Miller, II, President & Chief Operating Officer
Scott W. Shockey, Senior Vice President & Chief Financial Officer
Tommy R. Shepherd, Senior Vice President & Secretary
Bryan F. Stepp, Senior Vice President - Lending/Credit
Mario P. Liberatore, Vice President
Cherie A. Elliott, Vice President
Frank W. Davison, Vice President
Ryan J. Jones, Vice President
Allen W. Elliott, Vice President
Shawn R. Siders, Vice President
Bryna S. Butler, Vice President
Marilyn G. Kearns, Vice President
Paula W. Clay, Assistant Secretary
Cindy H. Johnston, Assistant Secretary
LOAN CENTRAL DIRECTORS
Larry E. Miller, II
Cherie A. Elliott
Ryan J. Jones
LOAN CENTRAL OFFICERS
Larry E. Miller, II Chairman of the Board
Cherie A. Elliott President
Timothy R. Brumfield Vice President & Secretary
Manager, Gallipolis Office
John J. Holtzapfel Compliance Officer &
Manager, Wheelersburg Office
T. Joe Wilson Manager, Waverly Office
Joseph I. Jones
Manager, South Point Office
Gregory G. Kauffman Manager,
Chillicothe Office
Steven B. Leach Manager, Jackson Office
WEST VIRGINIA ADVISORY BOARD
Mario P. Liberatore E. Allen Bell
Richard L. Handley John A. Myers
Stephen L. Johnson
DIRECTORS EMERITUS
W. Lowell Call Barney A. Molnar
Steven B. Chapman Jeffrey E. Smith
Robert E. Daniel Wendell B. Thomas
John G. Jones Lannes C.
Williamson
|
|
OHIO VALLEY BANK OFFICERS
EXECUTIVE OFFICERS
Thomas E. Wiseman
Larry E. Miller, II
Scott W. Shockey
Tommy R. Shepherd
Bryan F. Stepp
Mario P. Liberatore
SENIOR VICE PRESIDENTS
FrankW.Davison
Ryan J.Jones
Allen W.Elliott
Shawn R. Siders
Bryna S. Butler
Marilyn G. Kearns
VICE PRESIDENTS
Patrick H. Tackett
Rick A. Swain
Tamela D. LeMaster
Christopher L. Preston
Gregory A. Phillips
Diana L. Parks
John A. Anderson
Kyla R. Carpenter
E. Kate Cox
Brian E. Hall
Daniel T. Roush
Adam D. Massie
Jay D. Miller
Jody M. DeWees
Christopher S. Petro
Benjamin F. Pewitt
Lori A. Edwards
Brandon O. Huff
ASSISTANT VICE PRESIDENTS
Melissa P. Wooten
Kimberly R. Williams
Paula W. Clay
Cindy H. Johnston
Joe J. Wyant
Brenda G. Henson
Barbara A. Patrick
Richard P. Speirs
Raymond G. Polcyn
Anita M. Good
Angela S. Kinnaird
Terri M. Camden
Shelly N. Boothe
Stephenie L. Peck
|
Chairman and Chief Executive Officer
President and Chief Operating Officer
Executive Vice President, Chief Financial Officer
Executive Vice President and Secretary
Executive Vice President,Lending/Credit
President, OVB West Virginia
Financial Bank Group
Chief Risk Officer
Branch Administration
Chief Credit Officer
Corporate Communications
Human Resources
Western Division Branch Manager
Branch Administration/CRM
Business Development West Virginia
Consumer Lending
Internal Audit Liaison
Director of Loan Operations
Director of Marketing
Director of Cultural Enhancement
Corporate Banking
Senior Compliance Officer
Northern Region Manager
Business Development Officer
Trust
Comptroller
Business Development
Residential Loan Operations Manager
Director of IT
Systems Officer
Assistant Secretary
Assistant Secretary
Region Manager Jackson County
Manager Deposit Services
BSA Officer/Loss Prevention
Facilities Manager /Security Officer
Manager of Buying Department
Branch Retail Banking Officer
Customer Support Manager
Human Resources Officer
Business Development Officer
Regional Branch Administrator
|
OUR
VISION is
to
remain an
independent
community bank
ASSISTANT CASHIERS
Lois J. Scherer EFT Officer
Glen P. Arrowood, II Manager of Indirect Lending
Anthony W. Staley Product Development
Business Sales & Support
Jon C. Jones Western Cabell Region Manager
Daniel F. Short Bend Area
Region Manager
Pamela K. Smith Eastern Cabell Region Manager
William F. Richards Advertising Manager
|
[Picture]
Secure the Legacy
Ohio Valley Bank celebrates 150 years in business in 2022. This American institution has
survived two World Wars, the Great Depression, the Great Recession, and now two global pandemics.
The company’s continued success lies in large part with our loyal OVBC shareholders who join Ohio Valley Bank and
Loan Central in our work to put Community First. Our shareholders reinvested over $1 million of their dividends in Ohio Valley Banc Corp. stock in 2020 through the Dividend Reinvestment Program and Employee
Stock Ownership Plan. They didn’t stop there. OVBC shareholders then went on to invest close to $600,000 in supplemental investments in the company. When we pay a dividend and shareholders overwhelmingly choose to invest that money back into the
company, we know we are doing something right.
As we look to the future of Ohio Valley Banc Corp., it is important to think about securing the legacy of what our shareholders, customers, and employees have worked so hard
to build. As a shareholder, you can help by making plans to pass on shares to heirs who will not just sell them on the open market, but to those who will be dedicated to following your
example. Let your family and friends know that you support OVBC and its importance in your life and community. Ensure
that your shares will go to those who believe, as you do, in the importance of giving back to our community.
We urge you to make plans now to not only secure the legacy of Ohio Valley Banc Corp., but to secure your role in the continuation of this local success story.
Want to get your family involved now? Did you know that you can transfer ownership of shares at any time without brokerage fees? Gifting shares to a
child, grandchild, or anyone you wish is simple. If you are a registered shareholder, contact our Shareholder Relations Department at 800-468-6682 or email investorrelations@ ovbc.com for information.
Thank you for playing a vital role in OVBC’s past, present, and future. We look forward to serving you and your loved ones for many generations to come.

OHIO VALLEY BANC CORP.
ANNUAL REPORT 2020
FINANCIALS
SELECTED FINANCIAL DATA
|
|
Years Ended December 31
|
|||||||||||||||||||
|
|
2020
|
2019
|
2018
|
2017
|
2016
|
|||||||||||||||
|
(dollars in thousands, except share and per share data)
|
||||||||||||||||||||
|
|
||||||||||||||||||||
|
SUMMARY OF OPERATIONS:
|
||||||||||||||||||||
|
|
||||||||||||||||||||
|
Total interest income
|
$
|
46,173
|
$
|
50,317
|
$
|
49,197
|
$
|
45,708
|
$
|
39,348
|
||||||||||
|
Total interest expense
|
6,191
|
7,265
|
5,471
|
3,975
|
3,022
|
|||||||||||||||
|
Net interest income
|
39,982
|
43,052
|
43,726
|
41,733
|
36,326
|
|||||||||||||||
|
Provision for loan losses
|
2,980
|
1,000
|
1,039
|
2,564
|
2,826
|
|||||||||||||||
|
Total other income
|
11,438
|
9,166
|
8,938
|
9,435
|
8,239
|
|||||||||||||||
|
Total other expenses
|
36,133
|
39,498
|
37,426
|
36,609
|
32,899
|
|||||||||||||||
|
Income before income taxes
|
12,307
|
11,720
|
14,199
|
11,995
|
8,840
|
|||||||||||||||
|
Income taxes
|
2,048
|
1,813
|
2,255
|
4,486
|
1,920
|
|||||||||||||||
|
Net income
|
10,259
|
9,907
|
11,944
|
7,509
|
6,920
|
|||||||||||||||
|
|
||||||||||||||||||||
|
PER SHARE DATA:
|
||||||||||||||||||||
|
|
||||||||||||||||||||
|
Earnings per share
|
$
|
2.14
|
$
|
2.08
|
$
|
2.53
|
$
|
1.60
|
$
|
1.59
|
||||||||||
|
Cash dividends declared per share
|
$
|
0.84
|
$
|
0.84
|
$
|
0.84
|
$
|
0.84
|
$
|
0.82
|
||||||||||
|
Book value per share
|
$
|
28.48
|
$
|
26.77
|
$
|
24.87
|
$
|
23.26
|
$
|
22.40
|
||||||||||
|
Weighted average number of common shares outstanding
|
4,787,446
|
4,767,279
|
4,725,971
|
4,685,067
|
4,351,748
|
|||||||||||||||
|
|
||||||||||||||||||||
|
AVERAGE BALANCE SUMMARY:
|
||||||||||||||||||||
|
|
||||||||||||||||||||
|
Total loans
|
$
|
811,434
|
$
|
775,860
|
$
|
773,995
|
$
|
753,204
|
$
|
644,690
|
||||||||||
|
Securities(1)
|
205,532
|
189,187
|
223,390
|
193,199
|
196,389
|
|||||||||||||||
|
Deposits
|
906,315
|
850,400
|
886,639
|
845,227
|
749,054
|
|||||||||||||||
|
Other borrowed funds(2)
|
40,416
|
45,850
|
48,967
|
47,663
|
39,553
|
|||||||||||||||
|
Shareholders’ equity
|
131,038
|
122,314
|
112,393
|
108,110
|
98,133
|
|||||||||||||||
|
Total assets
|
1,096,191
|
1,035,230
|
1,063,256
|
1,014,115
|
899,209
|
|||||||||||||||
|
|
||||||||||||||||||||
|
PERIOD END BALANCES:
|
||||||||||||||||||||
|
|
||||||||||||||||||||
|
Total loans
|
$
|
848,664
|
$
|
772,774
|
$
|
777,052
|
$
|
769,319
|
$
|
734,901
|
||||||||||
|
Securities(1)
|
255,662
|
166,761
|
184,925
|
189,941
|
151,985
|
|||||||||||||||
|
Deposits
|
993,739
|
821,471
|
846,704
|
856,724
|
790,452
|
|||||||||||||||
|
Shareholders’ equity
|
136,324
|
128,179
|
117,874
|
109,361
|
104,528
|
|||||||||||||||
|
Total assets
|
1,186,932
|
1,013,272
|
1,030,493
|
1,026,290
|
954,640
|
|||||||||||||||
|
|
||||||||||||||||||||
|
KEY RATIOS:
|
||||||||||||||||||||
|
|
||||||||||||||||||||
|
Return on average assets
|
.94
|
%
|
.96
|
%
|
1.12
|
%
|
0.74
|
%
|
0.77
|
%
|
||||||||||
|
Return on average equity
|
7.83
|
%
|
8.10
|
%
|
10.63
|
%
|
6.95
|
%
|
7.05
|
%
|
||||||||||
|
Dividend payout ratio
|
39.20
|
%
|
40.37
|
%
|
33.20
|
%
|
52.36
|
%
|
51.79
|
%
|
||||||||||
|
Average equity to average assets
|
11.95
|
%
|
11.82
|
%
|
10.57
|
%
|
10.66
|
%
|
10.91
|
%
|
||||||||||
(1) Securities include interest-bearing deposits with banks and restricted investments in bank stocks.
(2) Other borrowed funds include subordinated debentures.
consolidated statements of condition
|
|
As of December 31
|
|||||||
|
|
2020
|
2019
|
||||||
|
(dollars in thousands, except share and per share data)
|
||||||||
|
|
||||||||
|
Assets
|
||||||||
|
|
||||||||
|
Cash and noninterest-bearing deposits with banks
|
$
|
14,989
|
$
|
12,812
|
||||
|
Interest-bearing deposits with banks
|
123,314
|
39,544
|
||||||
|
Total cash and cash equivalents
|
138,303
|
52,356
|
||||||
|
|
||||||||
|
Certificates of deposit in financial institutions
|
2,500
|
2,360
|
||||||
|
Securities available for sale
|
112,322
|
105,318
|
||||||
|
Securities held to maturity (estimated fair value: 2020 - $10,344; 2019 - $12,404)
|
10,020
|
12,033
|
||||||
|
Restricted investments in bank stocks
|
7,506
|
7,506
|
||||||
|
|
||||||||
|
Total loans
|
848,664
|
772,774
|
||||||
|
Less: Allowance for loan losses
|
(7,160
|
)
|
(6,272
|
)
|
||||
|
Net loans
|
841,504
|
766,502
|
||||||
|
|
||||||||
|
Premises and equipment, net
|
21,312
|
19,217
|
||||||
|
Premises and equipment held for sale, net
|
637
|
653
|
||||||
|
Other real estate owned, net
|
49
|
540
|
||||||
|
Accrued interest receivable
|
3,319
|
2,564
|
||||||
|
Goodwill
|
7,319
|
7,319
|
||||||
|
Other intangible assets, net
|
112
|
174
|
||||||
|
Bank owned life insurance and annuity assets
|
35,999
|
30,596
|
||||||
|
Operating lease right-of-use asset, net
|
880
|
1,053
|
||||||
|
Other assets
|
5,150
|
5,081
|
||||||
|
Total assets
|
$
|
1,186,932
|
$
|
1,013,272
|
||||
|
|
||||||||
|
Liabilities
|
||||||||
|
|
||||||||
|
Noninterest-bearing deposits
|
$
|
314,777
|
$
|
222,607
|
||||
|
Interest-bearing deposits
|
678,962
|
598,864
|
||||||
|
Total deposits
|
993,739
|
821,471
|
||||||
|
|
||||||||
|
Other borrowed funds
|
27,863
|
33,991
|
||||||
|
Subordinated debentures
|
8,500
|
8,500
|
||||||
|
Operating lease liability
|
880
|
1,053
|
||||||
|
Accrued liabilities
|
19,626
|
20,078
|
||||||
|
Total liabilities
|
1,050,608
|
885,093
|
||||||
|
|
||||||||
|
Commitments and Contingent Liabilities (See Note L)
|
----
|
----
|
||||||
|
|
||||||||
|
Shareholders’ Equity
|
||||||||
|
|
||||||||
|
Common stock ($1.00 stated value per share, 10,000,000 shares authorized; 2020 – 5,447,185 shares issued; 2019 - 5,447,185 shares issued)
|
5,447
|
5,447
|
||||||
|
Additional paid-in capital
|
51,165
|
51,165
|
||||||
|
Retained earnings
|
92,988
|
86,751
|
||||||
|
Accumulated other comprehensive income
|
2,436
|
528
|
||||||
|
Treasury stock, at cost (659,739 shares)
|
(15,712
|
)
|
(15,712
|
)
|
||||
|
Total shareholders’ equity
|
136,324
|
128,179
|
||||||
|
Total liabilities and shareholders’ equity
|
$
|
1,186,932
|
$
|
1,013,272
|
||||
See accompanying notes to consolidated financial statements
Consolidated Statements of Income
|
For the years ended December 31
|
2020
|
2019
|
2018
|
|||||||||
|
(dollars in thousands, except per share data)
|
||||||||||||
|
|
||||||||||||
|
Interest and dividend income:
|
||||||||||||
|
Loans, including fees
|
$
|
43,204
|
$
|
45,766
|
$
|
44,365
|
||||||
|
Securities:
|
||||||||||||
|
Taxable
|
2,164
|
2,542
|
2,377
|
|||||||||
|
Tax exempt
|
286
|
344
|
369
|
|||||||||
|
Dividends
|
245
|
393
|
440
|
|||||||||
|
Interest-bearing deposits with banks
|
226
|
1,221
|
1,608
|
|||||||||
|
Other interest
|
48
|
51
|
38
|
|||||||||
|
|
46,173
|
50,317
|
49,197
|
|||||||||
|
Interest expense:
|
||||||||||||
|
Deposits
|
5,254
|
6,026
|
4,155
|
|||||||||
|
Other borrowed funds
|
729
|
883
|
986
|
|||||||||
|
Subordinated debentures
|
208
|
356
|
330
|
|||||||||
|
|
6,191
|
7,265
|
5,471
|
|||||||||
|
Net interest income
|
39,982
|
43,052
|
43,726
|
|||||||||
|
Provision for loan losses
|
2,980
|
1,000
|
1,039
|
|||||||||
|
Net interest income after provision for loan losses
|
37,002
|
42,052
|
42,687
|
|||||||||
|
|
||||||||||||
|
Noninterest income:
|
||||||||||||
|
Service charges on deposit accounts
|
1,685
|
2,118
|
2,084
|
|||||||||
|
Trust fees
|
257
|
264
|
263
|
|||||||||
|
Income from bank owned life insurance and annuity assets
|
820
|
704
|
717
|
|||||||||
|
Mortgage banking income
|
1,254
|
310
|
342
|
|||||||||
|
Electronic refund check / deposit fees
|
----
|
5
|
1,579
|
|||||||||
|
Debit / credit card interchange income
|
4,031
|
3,905
|
3,662
|
|||||||||
|
Loss on other real estate owned
|
(35
|
)
|
(65
|
)
|
(559
|
)
|
||||||
|
Net gain on branch divestitures
|
----
|
1,256
|
----
|
|||||||||
|
Tax preparation fees
|
644
|
----
|
----
|
|||||||||
|
Litigation settlement
|
2,000
|
----
|
----
|
|||||||||
|
Other
|
782
|
669
|
850
|
|||||||||
|
|
11,438
|
9,166
|
8,938
|
|||||||||
|
Noninterest expense:
|
||||||||||||
|
Salaries and employee benefits
|
21,636
|
23,524
|
22,191
|
|||||||||
|
Occupancy
|
1,817
|
1,771
|
1,754
|
|||||||||
|
Furniture and equipment
|
1,096
|
1,060
|
1,023
|
|||||||||
|
Professional fees
|
1,519
|
2,508
|
2,016
|
|||||||||
|
Marketing expense
|
613
|
841
|
777
|
|||||||||
|
FDIC insurance
|
165
|
113
|
447
|
|||||||||
|
Data processing
|
2,170
|
1,996
|
2,115
|
|||||||||
|
Software
|
1,454
|
1,705
|
1,533
|
|||||||||
|
Foreclosed assets
|
128
|
266
|
238
|
|||||||||
|
Amortization of intangibles
|
62
|
206
|
135
|
|||||||||
|
Other
|
5,473
|
5,508
|
5,197
|
|||||||||
|
|
36,133
|
39,498
|
37,426
|
|||||||||
|
Income before income taxes
|
12,307
|
11,720
|
14,199
|
|||||||||
|
Provision for income taxes
|
2,048
|
1,813
|
2,255
|
|||||||||
|
NET INCOME
|
$
|
10,259
|
$
|
9,907
|
$
|
11,944
|
||||||
|
Earnings per share
|
$
|
2.14
|
$
|
2.08
|
$
|
2.53
|
||||||
See accompanying notes to consolidated financial statements
Consolidated Statements of
Comprehensive Income
|
For the years ended December 31
|
2020
|
2019
|
2018
|
|||||||||
|
(dollars in thousands)
|
||||||||||||
|
|
||||||||||||
|
NET INCOME
|
$
|
10,259
|
$
|
9,907
|
$
|
11,944
|
||||||
|
Other comprehensive income (loss):
|
||||||||||||
|
Change in unrealized gain (loss) on available for sale securities
|
2,415
|
3,371
|
(1,373
|
)
|
||||||||
|
Related tax (expense) benefit
|
(507
|
)
|
(708
|
)
|
289
|
|||||||
|
Total other comprehensive income (loss), net of tax
|
1,908
|
2,663
|
(1,084
|
)
|
||||||||
|
Total comprehensive income
|
$
|
12,167
|
$
|
12,570
|
$
|
10,860
|
||||||
See accompanying notes to consolidated financial statements
Consolidated Statements of Changes in
Shareholders’ Equity
|
For the years ended December 31, 2020, 2019, and 2018
|
||||||||||||||||||||||||
|
(dollars in thousands, except share and per share data)
|
||||||||||||||||||||||||
|
|
Common
Stock
|
Additional
Paid-In
Capital
|
Retained
Earnings
|
Accumulated Other Comprehensive Income (Loss)
|
Treasury
Stock
|
Total
Shareholders' Equity
|
||||||||||||||||||
|
Balances at January 1, 2018
|
$
|
5,362
|
$
|
47,895
|
$
|
72,694
|
$
|
(878
|
)
|
$
|
(15,712
|
)
|
$
|
109,361
|
||||||||||
|
Net income
|
----
|
----
|
11,944
|
----
|
----
|
11,944
|
||||||||||||||||||
|
Other comprehensive income (loss), net
|
----
|
----
|
----
|
(1,084
|
)
|
----
|
(1,084
|
)
|
||||||||||||||||
|
Amount reclassified out of accumulated other
comprehensive income (loss) per ASU 2018-02
|
----
|
----
|
173
|
(173
|
)
|
---- |
----
|
|||||||||||||||||
|
Common stock issued to ESOP, 7,294 shares
|
7
|
288
|
----
|
----
|
----
|
295
|
||||||||||||||||||
|
Common stock issued through dividend reinvestment,
30,766 shares
|
31
|
1,294
|
----
|
----
|
----
|
1,325
|
||||||||||||||||||
|
Cash dividends, $.84 per share
|
----
|
----
|
(3,967
|
)
|
----
|
----
|
(3,967
|
)
|
||||||||||||||||
|
Balances at December 31, 2018
|
5,400
|
49,477
|
80,844
|
(2,135
|
)
|
(15,712
|
)
|
117,874
|
||||||||||||||||
|
Net income
|
----
|
----
|
9,907
|
----
|
----
|
9,907
|
||||||||||||||||||
|
Other comprehensive income (loss), net
|
----
|
----
|
----
|
2,663
|
----
|
2,663
|
||||||||||||||||||
|
Common stock issued to ESOP, 8,333 shares
|
8
|
320
|
----
|
----
|
----
|
328
|
||||||||||||||||||
|
Common stock issued through dividend reinvestment,
38,787 shares
|
39
|
1,368
|
----
|
----
|
----
|
1,407
|
||||||||||||||||||
|
Cash dividends, $.84 per share
|
----
|
----
|
(4,000
|
)
|
----
|
----
|
(4,000
|
)
|
||||||||||||||||
|
Balances at December 31, 2019
|
5,447
|
51,165
|
86,751
|
528
|
(15,712
|
)
|
128,179
|
|||||||||||||||||
|
Net income
|
----
|
----
|
10,259
|
----
|
----
|
10,259
|
||||||||||||||||||
|
Other comprehensive income (loss), net
|
----
|
----
|
----
|
1,908
|
----
|
1,908
|
||||||||||||||||||
|
Cash dividends, $.84 per share
|
----
|
----
|
(4,022
|
)
|
----
|
----
|
(4,022
|
)
|
||||||||||||||||
|
Balances at December 31, 2020
|
$
|
5,447
|
$
|
51,165
|
$
|
92,988
|
$
|
2,436
|
$
|
(15,712
|
)
|
$
|
136,324
|
|||||||||||
See accompanying notes to consolidated financial statements
CONSOLIDATED STATEMENTS OF CASH FLOWS
|
For the years ended December 31
|
2020
|
2019
|
2018
|
|||||||||
|
(dollars in thousands)
|
||||||||||||
|
|
||||||||||||
|
Cash flows from operating activities:
|
||||||||||||
|
Net income
|
$
|
10,259
|
$
|
9,907
|
$
|
11,944
|
||||||
|
Adjustments to reconcile net income to net cash provided by operating activities:
|
||||||||||||
|
Depreciation of premises and equipment
|
1,341
|
1,183
|
1,141
|
|||||||||
|
Net (accretion) of purchase accounting adjustments
|
(42
|
)
|
(494
|
)
|
(188
|
)
|
||||||
|
Net amortization of securities
|
459
|
173
|
260
|
|||||||||
|
Proceeds from sale of loans in secondary market
|
40,158
|
9,840
|
11,034
|
|||||||||
|
Loans disbursed for sale in secondary market
|
(38,904
|
)
|
(9,530
|
)
|
(10,692
|
)
|
||||||
|
Amortization of mortgage servicing rights
|
126
|
68
|
55
|
|||||||||
|
Impairment of mortgage servicing rights
|
11
|
----
|
----
|
|||||||||
|
Gain on sale of loans
|
(1,391
|
)
|
(378
|
)
|
(397
|
)
|
||||||
|
Amortization of intangible assets
|
62
|
206
|
135
|
|||||||||
|
Deferred tax (benefit) expense
|
12
|
367
|
(134
|
)
|
||||||||
|
Provision for loan losses
|
2,980
|
1,000
|
1,039
|
|||||||||
|
Common stock issued to ESOP
|
----
|
328
|
295
|
|||||||||
|
Earnings on bank owned life insurance and annuity assets
|
(820
|
)
|
(704
|
)
|
(717
|
)
|
||||||
|
Loss on sale of other real estate owned
|
35
|
57
|
21
|
|||||||||
|
Net write-down of other real estate owned
|
----
|
8
|
538
|
|||||||||
|
Net gain on branch divestitures
|
----
|
(1,256
|
)
|
----
|
||||||||
|
Change in accrued interest receivable
|
(755
|
)
|
74
|
(135
|
)
|
|||||||
|
Change in accrued liabilities
|
(632
|
)
|
2,376
|
1,946
|
||||||||
|
Change in other assets
|
(408
|
)
|
1,528
|
1,996
|
||||||||
|
Net cash provided by operating activities
|
12,491
|
14,753
|
18,141
|
|||||||||
|
|
||||||||||||
|
Cash flows from investing activities:
|
||||||||||||
|
Payments related to branch divestitures
|
----
|
(26,326
|
)
|
----
|
||||||||
|
Proceeds from maturities and paydowns of securities available for sale
|
36,154
|
20,199
|
21,139
|
|||||||||
|
Purchases of securities available for sale
|
(41,162
|
)
|
(20,126
|
)
|
(23,757
|
)
|
||||||
|
Proceeds from calls and maturities of securities held to maturity
|
2,694
|
3,754
|
1,711
|
|||||||||
|
Purchases of securities held to maturity
|
(721
|
)
|
----
|
----
|
||||||||
|
Proceeds from maturities of certificates of deposit in financial institutions
|
980
|
----
|
----
|
|||||||||
|
Purchases of certificates of deposit in financial institutions
|
(1,120
|
)
|
(295
|
)
|
(245
|
)
|
||||||
|
Net change in loans
|
(78,038
|
)
|
2,323
|
(9,981
|
)
|
|||||||
|
Proceeds from sale of other real estate owned
|
548
|
392
|
1,132
|
|||||||||
|
Purchases of premises and equipment
|
(3,450
|
)
|
(6,232
|
)
|
(2,725
|
)
|
||||||
|
Disposals of premises and equipment
|
13
|
402
|
----
|
|||||||||
|
Purchases of bank owned life insurance and annuity assets
|
(4,583
|
)
|
(500
|
)
|
----
|
|||||||
|
Net cash (used in) investing activities
|
(88,685
|
)
|
(26,409
|
)
|
(12,726
|
)
|
||||||
|
|
||||||||||||
|
Cash flows from financing activities:
|
||||||||||||
|
Change in deposits
|
172,290
|
1,147
|
(9,930
|
)
|
||||||||
|
Proceeds from common stock through dividend reinvestment
|
----
|
1,407
|
1,325
|
|||||||||
|
Cash dividends
|
(4,022
|
)
|
(4,000
|
)
|
(3,967
|
)
|
||||||
|
Proceeds from Federal Home Loan Bank borrowings
|
----
|
----
|
8,000
|
|||||||||
|
Repayment of Federal Home Loan Bank borrowings
|
(5,093
|
)
|
(3,676
|
)
|
(3,162
|
)
|
||||||
|
Change in other long-term borrowings
|
(405
|
)
|
(2,046
|
)
|
(989
|
)
|
||||||
|
Change in other short-term borrowings
|
(629
|
)
|
----
|
(85
|
)
|
|||||||
|
Net cash provided by (used in) by financing activities
|
162,141
|
(7,168
|
)
|
(8,808
|
)
|
|||||||
|
|
||||||||||||
|
Cash and cash equivalents:
|
||||||||||||
|
Change in cash and cash equivalents
|
85,947
|
(18,824
|
)
|
(3,393
|
)
|
|||||||
|
Cash and cash equivalents at beginning of year
|
52,356
|
71,180
|
74,573
|
|||||||||
|
Cash and cash equivalents at end of year
|
$
|
138,303
|
$
|
52,356
|
$
|
71,180
|
||||||
|
Supplemental disclosure:
|
||||||||||||
|
Cash paid for interest
|
$
|
6,681
|
$
|
6,931
|
$
|
5,008
|
||||||
|
Cash paid for income taxes
|
2,050
|
890
|
2,050
|
|||||||||
|
Transfers from loans to other real estate owned
|
92
|
570
|
547
|
|||||||||
|
Initial recognition of operating lease right-of-use asset
|
----
|
1,280
|
----
|
|||||||||
|
Operating lease liability arising from obtaining right-of-use asset
|
----
|
1,280
|
----
|
|||||||||
See accompanying notes to consolidated financial statements
Amounts are in thousands, except share and per share data.
NOTES TO THE CONSOLIDATED FINANCIAL STATEMENTS
Note A - Summary of Significant Accounting Policies
Description of Business: Ohio Valley Banc Corp. (“Ohio Valley”) is a financial holding company registered under the Bank Holding Company Act of 1956. Ohio Valley has one banking subsidiary, The Ohio Valley
Bank Company (the “Bank”), an Ohio state-chartered bank that is a member of the Federal Reserve Bank (“FRB”) and is regulated primarily by the Ohio Division of Financial Institutions and the Federal Reserve Board. Ohio Valley also has a subsidiary
that engages in consumer lending generally to individuals with higher credit risk history, Loan Central, Inc.; a subsidiary insurance agency that facilitates the receipts of insurance commissions, Ohio Valley Financial Services Agency, LLC; and a
limited purpose property and casualty insurance company, OVBC Captive, Inc. The Bank has one wholly-owned subsidiary, Ohio Valley REO, LLC ("Ohio Valley REO"), an Ohio limited liability company, to which the Bank transfers certain real estate
acquired by the Bank through foreclosure for sale by Ohio Valley REO. Ohio Valley and its subsidiaries are collectively referred to as the “Company.”
The Company provides a full range of commercial and retail banking services from 21 offices located in southeastern Ohio and western West Virginia. It accepts deposits in checking, savings, time and
money market accounts and makes personal, commercial, floor plan, student, construction and real estate loans. Substantially all loans are secured by specific items of collateral, including business assets, consumer assets, and commercial and
residential real estate. Commercial loans are expected to be repaid from cash flow from business operations. The Company also offers safe deposit boxes, wire transfers and other standard banking products and services. The Bank’s deposits are insured
by the Federal Deposit Insurance Corporation (“FDIC”). In addition to accepting deposits and making loans, the Bank invests in U. S. Government and agency obligations, interest-bearing deposits in other financial institutions and investments
permitted by applicable law.
The Bank’s trust department provides a wide variety of fiduciary services for trusts, estates and benefit plans and also provides investment and security services as an agent for its customers.
Principles of Consolidation: The consolidated financial statements include the accounts of Ohio Valley and its wholly-owned subsidiaries, the Bank, Loan Central, Inc., Ohio Valley Financial Services Agency, LLC,
and OVBC Captive, Inc. All material intercompany accounts and transactions have been eliminated.
Industry Segment Information: Internal financial information is primarily reported and aggregated in two lines of business, banking and consumer finance.
Use of Estimates: To prepare financial statements in conformity with accounting principles generally accepted in the U.S., management makes estimates and assumptions based on available information. These estimates
and assumptions affect the amounts reported in the financial statements and the disclosures provided, and actual results could differ.
Cash and Cash Equivalents: Cash and cash equivalents include cash on hand, noninterest-bearing deposits with banks, federal funds sold and interest-bearing deposits with banks with maturity terms of less than 90
days. Generally, federal funds are purchased and sold for one-day periods. The Company reports net cash flows for customer loan transactions, deposit transactions, short-term borrowings and interest-bearing deposits with other financial institutions.
Certificates of deposit in financial institutions: Certificates of deposit in financial institutions are carried at cost and have maturity terms of 90 days or greater. The longest maturity date is May 31, 2023.
Securities: The Company classifies securities into held to maturity and available for sale categories. Held to maturity securities are those which the Company has the positive intent and ability to hold to
maturity and are reported at amortized cost. Securities classified as available for sale include securities that could be sold for liquidity, investment management or similar reasons even if there is not a present intention of such a sale. Available
for sale securities are reported at fair value, with unrealized gains or losses included in other comprehensive income, net of tax.
Premium amortization is deducted from, and discount accretion is added to, interest income on securities using the level yield method without anticipating prepayments, except for mortgage-backed
securities where prepayments are anticipated. Gains and losses are recognized upon the sale of specific identified securities on the completed trade date.
NOTES TO THE CONSOLIDATED FINANCIAL STATEMENTS
Note A - Summary of Significant Accounting Policies (continued)
Other-Than-Temporary Impairments of Securities: In determining an other-than-temporary impairment (“OTTI”), management considers many factors, including: (1) the length of time and the extent to which the fair
value has been less than cost, (2) the financial condition and near-term prospects of the issuer, (3) whether the market decline was affected by macroeconomic conditions, and (4) whether the Company has the intent to sell the debt security or more
likely than not will be required to sell the debt security before its anticipated recovery. The assessment of whether an OTTI decline exists involves a high degree of subjectivity and judgment and is based on the information available to management at
a point in time.
When an OTTI occurs, the amount of the OTTI recognized in earnings depends on whether an entity intends to sell the security or it is more likely than not it will be required to sell the security
before recovery of its amortized cost basis, less any current-period credit loss. If an entity intends to sell or it is more likely than not it will be required to sell the security before recovery of its amortized cost basis, less any current-period
credit loss, the OTTI shall be recognized in earnings equal to the entire difference between the investment’s amortized cost basis and its fair value at the balance sheet date. If an entity does not intend to sell the security and it is not more likely
than not that the entity will be required to sell the security before recovery of its amortized cost basis less any current-period loss, the OTTI shall be separated into the amount representing the credit loss and the amount related to all other
factors. The amount of the total OTTI related to the credit loss is determined based on the present value of cash flows expected to be collected and is recognized in earnings. The amount of the total OTTI related to other factors is recognized in other
comprehensive income, net of applicable taxes. The previous amortized cost basis less the OTTI recognized in earnings becomes the new amortized cost basis of the investment.
Restricted Investments in Bank Stocks: As a member of the Federal Home Loan Bank (“FHLB”) system and the FRB system, the Bank is required to own a certain amount of stock based on its level of borrowings and
other factors and may invest in additional amounts. FHLB stock and FRB stock are carried at cost, classified as restricted securities, and periodically evaluated for impairment based on ultimate recovery of par value. Both cash and stock dividends
are reported as income. The Company has additional investments in other restricted bank stocks that are not material to the financial statements.
Loans: Loans that management has the intent and ability to hold for the foreseeable future or until maturity or payoff are reported at the principal balance outstanding, net of unearned interest, deferred loan
fees and costs, and an allowance for loan losses. Interest income is reported on an accrual basis using the interest method and includes amortization of net deferred loan fees and costs over the loan term using the level yield method without
anticipating prepayments. The amount of the Company’s recorded investment is not materially different than the amount of unpaid principal balance for loans.
Interest income is discontinued and the loan moved to non-accrual status when full loan repayment is in doubt, typically when the loan is impaired or payments are past due 90 days or over unless the
loan is well-secured or in process of collection. Past due status is based on the contractual terms of the loan. In all cases, loans are placed on nonaccrual or charged-off at an earlier date if collection of principal or interest is considered
doubtful. Nonaccrual loans and loans past due 90 days or over and still accruing include both smaller balance homogeneous loans that are collectively evaluated for impairment and individually classified impaired loans.
All interest accrued but not received for loans placed on nonaccrual is reversed against interest income. Interest received on such loans is accounted for on the cash-basis method until qualifying for
return to accrual. Loans are returned to accrual status when all the principal and interest amounts contractually due are brought current and future payments are reasonably assured.
The Bank also originates long-term, fixed-rate mortgage loans, with full intention of being sold to the secondary market. These loans are considered held for sale during the period of time after the
principal has been advanced to the borrower by the Bank, but before the Bank has been reimbursed by the Federal Home Loan Mortgage Corporation, typically within a few business days. Loans sold to the secondary market are carried at the lower of
aggregate cost or fair value. As of December 31, 2020, there were $70 in loans held for sale by the Bank, as compared to no loans held for sale at December 31, 2019.
NOTES TO THE CONSOLIDATED FINANCIAL STATEMENTS
Note A - Summary of Significant Accounting Policies (continued)
Allowance for Loan Losses: The allowance for loan losses is a valuation allowance for probable incurred credit losses. Loan losses are charged against the allowance when management believes the uncollectibility
of a loan balance is confirmed. Subsequent recoveries, if any, are credited to the allowance. Management estimates the allowance balance required using past loan loss experience, the nature and volume of the portfolio, information about specific
borrower situations and estimated collateral values, economic conditions, and other factors. Allocations of the allowance may be made for specific loans, but the entire allowance is available for any loan that, in management’s judgment, should be
charged-off.
The allowance consists of specific and general components. The specific component relates to loans that are individually classified as impaired. A loan is impaired when, based on current information
and events, it is probable that the Company will be unable to collect all amounts due according to the contractual terms of the loan agreement. Loans for which the terms have been modified and for which the borrower is experiencing financial
difficulties are considered troubled debt restructurings and classified as impaired.
Factors considered by management in determining impairment include payment status, collateral value, and the probability of collecting scheduled principal
and interest payments when due. Loans that experience insignificant payment delays and payment shortfalls generally are not classified as impaired. Management determines the significance of payment delays and payment shortfalls on a case-by-case
basis, taking into consideration all of the circumstances surrounding the loan and the borrower, including the length and reasons for the delay, the borrower’s prior payment record, and the amount of shortfall in relation to the principal and
interest owed.
Commercial and commercial real estate loans are individually evaluated for impairment. If a loan is impaired, a portion of the allowance is allocated so that the loan is reported, net, at the present
value of estimated future cash flows using the loan’s existing rate or at the fair value of collateral if repayment is expected solely from the collateral. Smaller balance homogeneous loans, such as consumer and most residential real estate, are
collectively evaluated for impairment, and accordingly, they are not separately identified for impairment disclosure. Troubled debt restructurings are measured at the present value of estimated future cash flows using the loan’s effective rate at
inception. If a troubled debt restructuring is considered to be a collateral dependent loan, the loan is reported, net, at the fair value of the collateral. For troubled debt restructurings that subsequently default, the Company determines the amount
of reserve in accordance with the accounting policy for the allowance for loan losses.
The general component covers non-impaired loans and impaired loans that are not individually reviewed for impairment and is based on historical loss experience adjusted for current factors. The
historical loss experience is determined by portfolio segment and is based on the actual loss history experienced by the Company over the most recent 3 years for the consumer and real estate portfolio segment and 5 years for the commercial portfolio
segment. The total loan portfolio’s actual loss experience is supplemented with other economic factors based on the risks present for each portfolio segment. These economic factors include consideration of the following: levels of and trends in
delinquencies and impaired loans; levels of and trends in charge-offs and recoveries; trends in volume and terms of loans; effects of any changes in risk selection and underwriting standards; other changes in lending policies, procedures, and
practices; experience, ability, and depth of lending management and other relevant staff; national and local economic trends and conditions; industry conditions; and effects of changes in credit concentrations. The following portfolio segments have
been identified: Commercial and Industrial, Commercial Real Estate, Residential Real Estate, and Consumer.
Commercial and industrial loans consist of borrowings for commercial purposes to individuals, corporations, partnerships, sole proprietorships, and other business enterprises. Commercial and
industrial loans are generally secured by business assets such as equipment, accounts receivable, inventory, or any other asset excluding real estate and generally made to finance capital expenditures or operations. The Company’s risk exposure is
related to deterioration in the value of collateral securing the loan should foreclosure become necessary. Generally, business assets used or produced in operations do not maintain their value upon foreclosure, which may require the Company to write
down the value significantly to sell.
NOTES TO THE CONSOLIDATED FINANCIAL STATEMENTS
Note A - Summary of Significant Accounting Policies (continued)
Commercial real estate consists of nonfarm, nonresidential loans secured by owner-occupied and nonowner-occupied commercial real estate as well as
commercial construction loans. An owner-occupied loan relates to a borrower purchased building or space for which the repayment of principal is dependent upon cash flows from the ongoing business operations conducted by the party, or an affiliate of
the party, who owns the property. Owner-occupied loans that are dependent on cash flows from operations can be adversely affected by current market conditions for their product or service. A nonowner-occupied loan is a property loan for
which the repayment of principal is dependent upon rental income associated with the property or the subsequent sale of the property. Nonowner-occupied loans that are dependent upon rental income are primarily impacted by local economic conditions
which dictate occupancy rates and the amount of rent charged. Commercial construction loans consist of borrowings to purchase and develop raw land into 1-4 family residential properties. Construction loans are extended to individuals as well as
corporations for the construction of an individual or multiple properties and are secured by raw land and the subsequent improvements. Repayment of the loans to real estate developers is dependent upon the sale of properties to third parties in a
timely fashion upon completion. Should there be delays in construction or a downturn in the market for those properties, there may be significant erosion in value which may be absorbed by the Company.
Residential real estate loans consist of loans to individuals for the purchase of 1-4 family primary residences with repayment primarily through wage or other income sources of the individual
borrower. The Company’s loss exposure to these loans is dependent on local market conditions for residential properties as loan amounts are determined, in part, by the fair value of the property at origination.
Consumer loans are comprised of loans to individuals secured by automobiles, open-end home equity loans and other loans to individuals for household, family, and other personal expenditures, both
secured and unsecured. These loans typically have maturities of 6 years or less with repayment dependent on individual wages and income. The risk of loss on consumer loans is elevated as the collateral securing these loans, if any, rapidly depreciate
in value or may be worthless and/or difficult to locate if repossession is necessary. The Company has allocated the highest percentage of its allowance for loan losses as a percentage of loans to the other identified loan portfolio segments due to the
larger dollar balances associated with such portfolios.
At December 31, 2020, there were no changes to the accounting policies or methodologies within any of the Company’s loan portfolio segments from the prior period.
Concentrations of Credit Risk: The Company grants residential, consumer and commercial loans to customers located primarily in the southeastern Ohio and western West Virginia areas.
The following represents the composition of the Company’s loan portfolio as of December 31:
|
% of Total Loans
|
||||||||
|
2020
|
2019
|
|||||||
|
Residential real estate loans
|
36.00
|
%
|
40.15
|
%
|
||||
|
Commercial real estate loans
|
29.86
|
%
|
28.75
|
%
|
||||
|
Consumer loans
|
15.56
|
%
|
18.16
|
%
|
||||
|
Commercial and industrial loans
|
18.58
|
%
|
12.94
|
%
|
||||
|
100.00
|
%
|
100.00
|
%
|
|||||
Approximately 4.22% of total loans were unsecured at December 31, 2020, down from 5.00% at December 31, 2019.
The Bank, in the normal course of its operations, conducts business with correspondent financial institutions. Balances in correspondent accounts, investments in federal funds, certificates of
deposit and other short-term securities are closely monitored to ensure that prudent levels of credit and liquidity risks are maintained. At December 31, 2020, the Bank’s primary correspondent balance was $121,148 on deposit at the FRB, Cleveland,
Ohio.
Premises and Equipment: Land is carried at cost. Premises and equipment are stated at cost less accumulated depreciation, which is computed using the straight-line method over the estimated useful life of the
owned asset and, for leasehold improvement, over the remaining term of the leased facility, whichever is shorter. The useful lives range from 3 to 8 years for equipment, furniture and fixtures and 7 to 39 years for buildings and improvements.
Foreclosed assets: Assets acquired through or instead of loan foreclosure are initially recorded at fair value less costs to sell when acquired, establishing a new cost basis. Physical possession of residential
real estate property collateralizing a consumer mortgage loan occurs when legal title is obtained upon completion of foreclosure or when the borrower conveys all interest in the property to satisfy the loan through completion of a deed in lieu of
foreclosure or through a similar legal agreement. These assets are subsequently accounted for at lower of cost or fair value less estimated costs to sell. If fair value declines subsequent to foreclosure, a valuation allowance is recorded through
expense. Operating costs after acquisition are expensed. Foreclosed assets totaled $49 and $540 at December 31, 2020 and 2019.
NOTES TO THE CONSOLIDATED FINANCIAL STATEMENTS
Note A - Summary of Significant Accounting Policies (continued)
Goodwill: Goodwill arises from business combinations and is generally determined as the excess of the fair value of the consideration transferred, plus the fair value of any noncontrolling interests in the
acquiree, over the fair value of the net assets acquired and liabilities assumed as of the acquisition date. Goodwill acquired in a purchase business combination and determined to have an indefinite useful life are not amortized, but tested for
impairment at least annually. Goodwill is the only intangible asset with an indefinite life on our balance sheet. The Company has selected December 31 as the date to perform its annual qualitative impairment test. Given that the Company’s stock price
had traded below book value for an extended period throughout 2020, management could not conclude using a qualitative assessment that its fair value of goodwill exceeded the carrying amount during the year ended December 31, 2020. Therefore, the
Company performed a quantitative impairment test to conclude that there was no goodwill impairment for the year ended December 31, 2020. For the year ended December 31, 2019, the Company used a qualitative assessment based on profitability and positive
equity to determine that it was more likely than not that the fair value of goodwill was more than the carrying amount, resulting in no impairment. See Note F for more specific disclosures related to goodwill impairment testing.
Long-term Assets: Premises and equipment and other long-term assets are reviewed for impairment when events indicate their carrying amount may not be recoverable from future undiscounted cash flows. If impaired,
the assets are recorded at fair value.
Mortgage Servicing Rights: A mortgage servicing right (“MSR”) is a contractual agreement where the right to service a mortgage loan is sold by the original lender to another party. When the Company sells mortgage
loans to the secondary market, it retains the servicing rights to these loans. The Company’s MSR is recognized separately when acquired through sales of loans and is initially recorded at fair value with the income statement effect recorded in mortgage
banking income. Subsequently, the MSR is then amortized in proportion to and over the period of estimated future servicing income of the underlying loan. The MSR is then evaluated for impairment periodically based upon the fair value of the rights as
compared to the carrying amount, with any impairment being recognized through a valuation allowance. Fair value of the MSR is based on market prices for comparable mortgage servicing contracts. Impairment is determined by stratifying rights into
groupings based on predominant risk characteristics, such as interest rate, loan type and investor type. If the Company later determines that all or a portion of the impairment no longer exists for a particular grouping, a reduction of the allowance
may be recorded as an increase to income. At December 31, 2020 and 2019, the Company’s MSR assets were $458 and $357, respectively.
Earnings Per Share: Earnings per share is based on net income divided by the following weighted average number of common shares outstanding during the periods: 4,787,446 for 2020; 4,767,279 for 2019; 4,725,971 for 2018. Ohio Valley had no dilutive effect and no potential common shares issuable under stock options or other agreements for any period presented.
Earnings Per Share: Earnings per share is based on net income divided by the following weighted average number of common shares outstanding during the periods: 4,787,446 for 2020; 4,767,279 for 2019; 4,725,971 for 2018. Ohio Valley had no dilutive effect and no potential common shares issuable under stock options or other agreements for any period presented.
Income Taxes: Income tax expense is the sum of the current year income tax due or refundable and the change in deferred tax assets and liabilities. Deferred tax assets and liabilities are the expected future tax
consequences of temporary differences between the carrying amounts and tax bases of assets and liabilities, computed using enacted tax rates. The effect on deferred tax assets and liabilities of a change in tax rates is recognized at the time of
enactment of such change in tax rates. A valuation allowance, if needed, reduces deferred tax assets to the amount expected to be realized.
A tax position is recognized as a benefit only if it is “more likely than not” that the tax position would be sustained in a tax examination, with a tax examination being presumed to occur. The amount
recognized is the largest amount of tax benefit that is greater than 50% likely of being realized on examination. For tax positions not meeting the “more likely than not” test, no tax benefit is recorded. The Company recognizes interest and/or
penalties related to income tax matters in income tax expense.
Comprehensive Income: Comprehensive income consists of net income and other comprehensive income (loss). Other comprehensive income (loss) includes unrealized gains and losses on securities available for sale
which are also recognized as separate components of equity, net of tax.
NOTES TO THE CONSOLIDATED FINANCIAL STATEMENTS
Note A - Summary of Significant Accounting Policies (continued)
Loss Contingencies: Loss contingencies, including claims and legal actions arising in the ordinary course of business, are recorded as liabilities when the likelihood of loss is probable and an amount or range of
loss can be reasonably estimated. Management does not believe there now are such matters that will have a material effect on the financial statements.
Bank Owned Life Insurance and Annuity Assets: The Company has purchased life insurance policies on certain key executives. Bank owned life insurance is recorded at the amount that can be realized under the
insurance contract at the balance sheet date, which is the cash surrender value adjusted for other charges or other amounts due that are probable at settlement. The Company also purchased an annuity investment for a certain key executive that earns
interest.
Employee Stock Ownership Plan: Compensation expense is based on the market price of shares as they are committed to be allocated to participant accounts.
Dividend Reinvestment Plan: The Company maintains a Dividend Reinvestment Plan. The plan enables shareholders to elect to have their cash dividends on all or a portion of shares held automatically reinvested in
additional shares of the Company’s common stock. The stock is issued out of the Company’s authorized shares and credited to participant accounts at fair market value. Dividends are reinvested on a quarterly basis.
Loan Commitments and Related Financial Instruments: Financial instruments include off-balance sheet credit instruments, such as commitments to make loans and commercial letters of credit, issued to meet customer
financing needs. The face amount for these items represents the exposure to loss, before considering customer collateral or ability to repay. These financial instruments are recorded when they are funded. See Note L for more specific disclosure
related to loan commitments.
Dividend Restrictions: Banking regulations require maintaining certain capital levels and may limit the dividends paid by the Bank to Ohio Valley or by Ohio Valley to its shareholders. See Note P for more
specific disclosure related to dividend restrictions.
Restrictions on Cash: Cash on hand or on deposit with a third-party correspondent and the FRB totaled $121,839 at year-end 2020, and was not limited to any regulatory reserve or clearing requirements. Cash on
hand or on deposit with a third-party correspondent and the FRB totaled $38,794 at year-end 2019, and was subject to regulatory reserve and clearing requirements. The balances on deposit with a third-party correspondent do not earn interest.
Derivatives: At the inception of a derivative contract, the Company designates the derivative as one of three types based on the Company’s intentions and belief as to likely effectiveness as a hedge. These
three types are (1) a hedge of the fair value of a recognized asset or liability or of an unrecognized firm commitment (“fair value hedge”), (2) a hedge of a forecasted transaction or the variability of cash flows to be received or paid related to a
recognized asset or liability (“cash flow hedge”), or (3) an instrument with no hedging designation (“stand-alone derivative”).
Net cash settlements on derivatives that qualify for hedge accounting are recorded in interest income or interest expense, based on the item being hedged. Net cash settlements on derivatives that do
not qualify for hedge accounting are reported in noninterest income. Cash flows on hedges are classified in the cash flow statement the same as the cash flows of the items being hedged.
At December 31, 2020 and 2019, the Company’s only derivatives on hand were interest rate swaps, which are classified as stand-alone derivatives. See Note H for more specific disclosures related to
interest rate swaps.
Fair Value of Financial Instruments: Fair values of financial instruments are estimated using relevant market information and other assumptions, as more fully disclosed in Note O. Fair value estimates involve
uncertainties and matters of significant judgment regarding interest rates, credit risk, prepayments, and other factors, especially in the absence of broad markets for particular items. Changes in assumptions or in market conditions could
significantly affect the estimates.
Reclassifications: The consolidated financial statements for 2019 and 2018 have been reclassified to conform with the presentation for 2020. These reclassifications had no effect on the net
results of operations or shareholders’ equity.
NOTES TO THE CONSOLIDATED FINANCIAL STATEMENTS
Note A - Summary of Significant Accounting Policies (continued)
Current Events: In March 2020, the World Health Organization declared the outbreak of the coronavirus (“COVID-19”) as a global pandemic.
COVID-19 has continued to negatively impact the global economy, disrupt global supply chains, create significant volatility, disrupt financial markets, and increase unemployment levels. The resulting temporary closure of many businesses and the
implementation of social distancing and sheltering-in-place policies has impacted, and may continue to impact, many of the Company’s customers.
The continued financial impact of COVID-19 depends largely on the actions taken by governmental authorities and other third parties. In addition, COVID-19 may continue to adversely impact several
industries within our geographic footprint for some time and impair the ability of our customers to fulfill their contractual obligations to the Company. This could result in a material adverse effect on our business operations, asset valuations,
liquidity, financial condition, and results of operations. Effects may include:
| ● |
Increased provision for loan losses. Continued uncertainty regarding the severity and duration of COVID-19 and related economic effects will continue to affect the accounting for loan losses. It also is possible
that asset quality could worsen, and that loan charge-offs could increase. The Company is actively participating in the Paycheck Protection Program (“PPP”) by providing loans to small businesses
negatively impacted by COVID-19. PPP loans are fully guaranteed by the U.S. government, and if that should change, the Company could be required to increase its allowance for loan losses through an additional provision for loan losses charged
to earnings.
|
| ● |
Valuation and fair value measurement challenges. Material adverse impacts of COVID-19 may result in valuation impairments on the Company’s securities, impaired loans, goodwill, other real estate owned, and interest
rate swap agreements.
|
Adoption of New Accounting Standard Updates (“ASU”): In August 2018, the Financial Accounting Standards Board (“FASB”) issued ASU 2018-13, Disclosure Framework - Changes to the Disclosure Requirements for Fair
Value Measurement. This ASU eliminates, adds and modifies certain disclosure requirements for fair value measurements. Among the changes, entities will no longer be required to disclose the amount of and reasons for transfers between Level 1 and Level
2 of the fair value hierarchy but will be required to disclose the range and weighted average used to develop significant unobservable inputs for Level 3 fair value measurements. ASU 2018-13 is effective for interim and annual reporting periods
beginning after December 15, 2019, and early adoption is permitted. The adoption of this ASU did not have a material impact on the Company’s consolidated financial position or results of operations.
In January 2017, the FASB amended ASU 2017-04, Intangibles – Goodwill and Other (Topic 350): Simplifying the Test for Goodwill. The amendment was to simplify the goodwill impairment
measurement test by eliminating Step 2. The amendment requires the Company to perform the goodwill impairment test by comparing the fair value of a reporting unit with its carrying amount and recognizing an impairment charge for the amount by which
the carrying amount exceeds the fair value. Additionally, an entity should consider the tax effects from any tax deductible goodwill on the carrying amount when measuring the impairment loss. This amendment is effective for public business entities
for reporting periods beginning after December 15, 2019, including interim periods within that reporting period. The adoption of this ASU did not have a material impact on the Company’s consolidated financial position or results of
operations.
Accounting Guidance to be Adopted in Future Periods: In June 2016, the FASB issued ASU No. 2016-13, “Financial Instruments - Credit Losses”. ASU 2016-13 requires entities to replace the current “incurred loss”
model with an “expected loss” model, which is referred to as the current expected credit loss (“CECL”) model. These expected credit losses for financial assets held at the reporting date are to be based on historical experience, current conditions,
and reasonable and supportable forecasts. This ASU will also require enhanced disclosures to help investors and other financial statement users better understand significant estimates and judgments used in estimating credit losses, as well as the
credit quality and underwriting standards of an entity’s portfolio. These disclosures include qualitative and quantitative requirements that provide additional information about the amounts recorded in the financial statements. A CECL steering
committee has developed a CECL model and is evaluating the source data, various credit loss methodologies and model results in relation to the new ASU guidance. Management expects to recognize a one-time cumulative effect adjustment to the allowance
for loan losses as of the beginning of the first reporting period in which the new standard is effective. Management expects the adoption will result in a material increase to the allowance for loan losses balance. At this time, the impact is being
evaluated. On October 16, 2019, the FASB confirmed it would delay the effective date of this ASU for smaller reporting companies, such as the Company, until fiscal years beginning after December 15, 2022.
NOTES TO THE CONSOLIDATED FINANCIAL STATEMENTS
Note B - Securities
The following table summarizes the amortized cost and fair value of securities available for sale and securities held to maturity at December 31, 2020 and 2019 and the corresponding amounts of gross
unrealized gains and losses recognized in accumulated other comprehensive income (loss) and gross unrecognized gains and losses:
|
|
Amortized
Cost
|
Gross Unrealized
Gains
|
Gross Unrealized
Losses
|
Estimated
Fair Value
|
||||||||||||
|
Securities Available for Sale
|
||||||||||||||||
|
December 31, 2020
|
||||||||||||||||
|
U.S. Government sponsored entity securities
|
$
|
17,814
|
$
|
339
|
$
|
----
|
$
|
18,153
|
||||||||
|
Agency mortgage-backed securities, residential
|
91,425
|
2,748
|
(4
|
)
|
94,169
|
|||||||||||
|
Total securities
|
$
|
109,239
|
$
|
3,087
|
$
|
(4
|
)
|
$
|
112,322
|
|||||||
|
|
||||||||||||||||
|
December 31, 2019
|
||||||||||||||||
|
U.S. Government sponsored entity securities
|
$
|
16,579
|
$
|
163
|
$
|
(6
|
)
|
$
|
16,736
|
|||||||
|
Agency mortgage-backed securities, residential
|
88,071
|
807
|
(296
|
)
|
88,582
|
|||||||||||
|
Total securities
|
$
|
104,650
|
$
|
970
|
$
|
(302
|
)
|
$
|
105,318
|
|||||||
|
|
Amortized
Cost
|
Gross Unrecognized
Gains
|
Gross Unrecognized
Losses
|
Estimated
Fair Value
|
||||||||||||
|
Securities Held to Maturity
|
||||||||||||||||
|
December 31, 2020
|
||||||||||||||||
|
Obligations of states and political subdivisions
|
$
|
10,018
|
$
|
324
|
$
|
----
|
$
|
10,342
|
||||||||
|
Agency mortgage-backed securities, residential
|
2
|
----
|
----
|
2
|
||||||||||||
|
Total securities
|
$
|
10,020
|
$
|
324
|
$
|
----
|
$
|
10,344
|
||||||||
|
|
||||||||||||||||
|
December 31, 2019
|
||||||||||||||||
|
Obligations of states and political subdivisions
|
$
|
12,031
|
$
|
372
|
$
|
(1
|
)
|
$
|
12,402
|
|||||||
|
Agency mortgage-backed securities, residential
|
2
|
----
|
----
|
2
|
||||||||||||
|
Total securities
|
$
|
12,033
|
$
|
372
|
$
|
(1
|
)
|
$
|
12,404
|
|||||||
At year-end 2020 and 2019, there were no holdings of securities of any one issuer, other than the U.S. Government and its agencies, in an amount greater than 10% of shareholders’ equity.
There were no sales of debt securities during 2020, 2019 and 2018.
Securities with a carrying value of approximately $83,344 at December 31, 2020 and $78,418 at December 31, 2019 were pledged to secure public deposits and repurchase agreements and for other purposes
as required or permitted by law.
Unrealized losses on the Company’s debt securities have not been recognized into income because the issuers’ securities are of high credit quality as of December 31, 2020, and management does not
intend to sell and it is likely that management will not be required to sell the securities prior to their anticipated recovery. Management does not believe any individual unrealized loss at December 31, 2020 and 2019 represents an OTTI.
NOTES TO THE CONSOLIDATED FINANCIAL STATEMENTS
Note B - Securities (continued)
The amortized cost and estimated fair value of debt securities at December 31, 2020, by contractual maturity, are shown below. Actual maturities may differ from contractual maturities because certain
issuers may have the right to call or prepay the debt obligations prior to their contractual maturities. Securities not due at a single maturity are shown separately.
|
|
Available for Sale
|
Held to Maturity
|
||||||||||||||
|
Debt Securities:
|
Amortized
Cost
|
Estimated
Fair
Value
|
Amortized
Cost
|
Estimated
Fair
Value
|
||||||||||||
|
Due in one year or less
|
$
|
4,599
|
$
|
4,612
|
$
|
2,016
|
$
|
2,048
|
||||||||
|
Due in one to five years
|
8,215
|
8,531
|
4,107
|
4,276
|
||||||||||||
|
Due in five to ten years
|
5,000
|
5,010
|
3,895
|
4,018
|
||||||||||||
|
Agency mortgage-backed securities, residential
|
91,425
|
94,169
|
2
|
2
|
||||||||||||
|
Total debt securities
|
$
|
109,239
|
$
|
112,322
|
$
|
10,020
|
$
|
10,344
|
||||||||
The following table summarizes securities with unrealized losses at December 31, 2020 and December 31, 2019, aggregated by major security type and length of time in a continuous unrealized loss
position:
|
December 31, 2020
|
Less than 12 Months
|
12 Months or More
|
Total
|
|||||||||||||||||||||
|
Securities Available for Sale
|
Fair
Value
|
Unrealized
Loss
|
Fair
Value
|
Unrealized
Loss
|
Fair
Value
|
Unrealized
Loss
|
||||||||||||||||||
|
Agency mortgage-backed securities, residential
|
$
|
14,517
|
$
|
(4
|
)
|
$
|
----
|
$
|
----
|
$
|
14,517
|
$
|
(4
|
)
|
||||||||||
|
Total available for sale
|
$
|
14,517
|
$
|
(4
|
)
|
$
|
----
|
$
|
----
|
$
|
14,517
|
$
|
(4
|
)
|
||||||||||
|
December 31, 2019
|
Less than 12 Months
|
12 Months or More
|
Total
|
|||||||||||||||||||||
|
Securities Available for Sale
|
Fair
Value
|
Unrealized
Loss
|
Fair
Value
|
Unrealized
Loss
|
Fair
Value
|
Unrealized
Loss
|
||||||||||||||||||
|
U.S. Government sponsored entity securities
|
$
|
----
|
$
|
----
|
$
|
1,999
|
$
|
(6
|
)
|
$
|
1,999
|
$
|
(6
|
)
|
||||||||||
|
Agency mortgage-backed securities, residential
|
15,041
|
(84
|
)
|
21,344
|
(212
|
)
|
36,385
|
(296
|
)
|
|||||||||||||||
|
Total available for sale
|
$
|
15,041
|
$
|
(84
|
)
|
$
|
23,343
|
$
|
(218
|
)
|
$
|
38,384
|
$
|
(302
|
)
|
|||||||||
|
Less than 12 Months
|
12 Months or More
|
Total
|
||||||||||||||||||||||
|
Securities Held to Maturity
|
Fair
Value
|
Unrecognized
Loss
|
Fair
Value
|
Unrecognized
Loss
|
Fair
Value
|
Unrecognized
Loss
|
||||||||||||||||||
|
Obligations of states and political subdivisions
|
$
|
204
|
$
|
(1
|
)
|
$
|
----
|
$
|
----
|
$
|
204
|
$
|
(1
|
)
|
||||||||||
|
Total held to maturity
|
$
|
204
|
$
|
(1
|
)
|
$
|
----
|
$
|
----
|
$
|
204
|
$
|
(1
|
)
|
||||||||||
NOTES TO THE CONSOLIDATED FINANCIAL STATEMENTS
Note C - Loans and Allowance for Loan Losses
Loans are comprised of the following at December 31:
|
|
2020
|
2019
|
||||||
|
Residential real estate
|
$
|
305,478
|
$
|
310,253
|
||||
|
Commercial real estate:
|
||||||||
|
Owner-occupied
|
51,863
|
55,825
|
||||||
|
Nonowner-occupied
|
164,523
|
131,398
|
||||||
|
Construction
|
37,063
|
34,913
|
||||||
|
Commercial and industrial
|
157,692
|
100,023
|
||||||
|
Consumer:
|
||||||||
|
Automobile
|
55,241
|
63,770
|
||||||
|
Home equity
|
19,993
|
22,882
|
||||||
|
Other
|
56,811
|
53,710
|
||||||
|
|
848,664
|
772,774
|
||||||
|
Less: Allowance for loan losses
|
(7,160
|
)
|
(6,272
|
)
|
||||
|
|
||||||||
|
Loans, net
|
$
|
841,504
|
$
|
766,502
|
||||
Commercial and industrial loans include $27,933 of loans originated under the PPP at December 31, 2020. These loans are guaranteed by the SBA.
The following table presents the activity in the allowance for loan losses by portfolio segment for the years ended December 31, 2020, 2019 and 2018:
|
December 31, 2020
|
Residential
Real Estate
|
Commercial
Real Estate
|
Commercial
& Industrial
|
Consumer
|
Total
|
|||||||||||||||
|
Allowance for loan losses:
|
||||||||||||||||||||
|
Beginning balance
|
$
|
1,250
|
$
|
1,928
|
$
|
1,447
|
$
|
1,647
|
$
|
6,272
|
||||||||||
|
Provision for loan losses
|
413
|
946
|
443
|
1,178
|
2,980
|
|||||||||||||||
|
Loans charged off
|
(340
|
)
|
(559
|
)
|
(185
|
)
|
(1,949
|
)
|
(3,033
|
)
|
||||||||||
|
Recoveries
|
157
|
116
|
71
|
597
|
941
|
|||||||||||||||
|
Total ending allowance balance
|
$
|
1,480
|
$
|
2,431
|
$
|
1,776
|
$
|
1,473
|
$
|
7,160
|
||||||||||
|
December 31, 2019
|
Residential
Real Estate
|
Commercial
Real Estate
|
Commercial
& Industrial
|
Consumer
|
Total
|
|||||||||||||||
|
Allowance for loan losses:
|
||||||||||||||||||||
|
Beginning balance
|
$
|
1,583
|
$
|
2,186
|
$
|
1,063
|
$
|
1,896
|
$
|
6,728
|
||||||||||
|
Provision for loan losses
|
98
|
(1,745
|
)
|
1,807
|
840
|
1,000
|
||||||||||||||
|
Loans charged off
|
(1,060
|
)
|
(602
|
)
|
(1,513
|
)
|
(1,917
|
)
|
(5,092
|
)
|
||||||||||
|
Recoveries
|
629
|
2,089
|
90
|
828
|
3,636
|
|||||||||||||||
|
Total ending allowance balance
|
$
|
1,250
|
$
|
1,928
|
$
|
1,447
|
$
|
1,647
|
$
|
6,272
|
||||||||||
|
December 31, 2018
|
Residential
Real Estate
|
Commercial
Real Estate
|
Commercial
& Industrial
|
Consumer
|
Total
|
|||||||||||||||
|
Allowance for loan losses:
|
||||||||||||||||||||
|
Beginning balance
|
$
|
1,470
|
$
|
2,978
|
$
|
1,024
|
$
|
2,027
|
$
|
7,499
|
||||||||||
|
Provision for loan losses
|
772
|
(1,311
|
)
|
(80
|
)
|
1,658
|
1,039
|
|||||||||||||
|
Loans charged off
|
(874
|
)
|
(4
|
)
|
(208
|
)
|
(2,514
|
)
|
(3,600
|
)
|
||||||||||
|
Recoveries
|
215
|
523
|
327
|
725
|
1,790
|
|||||||||||||||
|
Total ending allowance balance
|
$
|
1,583
|
$
|
2,186
|
$
|
1,063
|
$
|
1,896
|
$
|
6,728
|
||||||||||
NOTES TO THE CONSOLIDATED FINANCIAL STATEMENTS
Note C - Loans and Allowance for Loan Losses (continued)
The following table presents the balance in the allowance for loan losses and the recorded investment of loans by portfolio segment and based on impairment method as of December 31, 2020 and 2019:
|
December 31, 2020
|
Residential
Real Estate
|
Commercial
Real Estate
|
Commercial
& Industrial
|
Consumer
|
Total
|
|||||||||||||||
|
Allowance for loan losses:
|
||||||||||||||||||||
|
Ending allowance balance attributable to loans:
|
||||||||||||||||||||
|
Individually evaluated for impairment
|
$
|
----
|
$
|
----
|
$
|
----
|
$
|
----
|
$
|
----
|
||||||||||
|
Collectively evaluated for impairment
|
1,480
|
2,431
|
1,776
|
1,473
|
7,160
|
|||||||||||||||
|
Total ending allowance balance
|
$
|
1,480
|
$
|
2,431
|
$
|
1,776
|
$
|
1,473
|
$
|
7,160
|
||||||||||
|
|
||||||||||||||||||||
|
Loans:
|
||||||||||||||||||||
|
Loans individually evaluated for impairment
|
$
|
411
|
$
|
5,845
|
$
|
4,686
|
$
|
84
|
$
|
11,026
|
||||||||||
|
Loans collectively evaluated for impairment
|
305,067
|
247,604
|
153,006
|
131,961
|
837,638
|
|||||||||||||||
|
Total ending loans balance
|
$
|
305,478
|
$
|
253,449
|
$
|
157,692
|
$
|
132,045
|
$
|
848,664
|
||||||||||
|
December 31, 2019
|
Residential
Real Estate
|
Commercial
Real Estate
|
Commercial
& Industrial
|
Consumer
|
Total
|
|||||||||||||||
|
Allowance for loan losses:
|
||||||||||||||||||||
|
Ending allowance balance attributable to loans:
|
||||||||||||||||||||
|
Individually evaluated for impairment
|
$
|
----
|
$
|
385
|
$
|
303
|
$
|
119
|
$
|
807
|
||||||||||
|
Collectively evaluated for impairment
|
1,250
|
1,543
|
1,144
|
1,528
|
5,465
|
|||||||||||||||
|
Total ending allowance balance
|
$
|
1,250
|
$
|
1,928
|
$
|
1,447
|
$
|
1,647
|
$
|
6,272
|
||||||||||
|
|
||||||||||||||||||||
|
Loans:
|
||||||||||||||||||||
|
Loans individually evaluated for impairment
|
$
|
438
|
$
|
11,300
|
$
|
4,910
|
$
|
487
|
$
|
17,135
|
||||||||||
|
Loans collectively evaluated for impairment
|
309,815
|
210,836
|
95,113
|
139,875
|
755,639
|
|||||||||||||||
|
Total ending loans balance
|
$
|
310,253
|
$
|
222,136
|
$
|
100,023
|
$
|
140,362
|
$
|
772,774
|
||||||||||
NOTES TO THE CONSOLIDATED FINANCIAL STATEMENTS
Note C – Loans and Allowance for Loan Losses (continued)
The following table presents information related to loans individually evaluated for impairment by class of loans as of the years ended December 31, 2020, 2019 and 2018:
|
December 31, 2020
|
Unpaid
Principal
Balance
|
Recorded
Investment
|
Allowance for
Loan Losses
Allocated
|
Average
Impaired
Loans
|
Interest
Income
Recognized
|
Cash Basis
Interest
Recognized
|
||||||||||||||||||
|
With an allowance recorded:
|
$
|
----
|
$
|
----
|
$
|
----
|
$
|
----
|
$
|
----
|
$
|
----
|
||||||||||||
|
With no related allowance recorded:
|
||||||||||||||||||||||||
|
Residential real estate
|
418
|
411
|
----
|
423
|
21
|
21
|
||||||||||||||||||
|
Commercial real estate:
|
||||||||||||||||||||||||
|
Owner-occupied
|
5,256
|
5,256
|
----
|
3,417
|
260
|
260
|
||||||||||||||||||
|
Nonowner-occupied
|
632
|
589
|
----
|
626
|
29
|
29
|
||||||||||||||||||
|
Commercial and industrial
|
4,686
|
4,686
|
----
|
3,772
|
196
|
196
|
||||||||||||||||||
|
Consumer:
|
||||||||||||||||||||||||
|
Home equity
|
34
|
34
|
----
|
28
|
2
|
2
|
||||||||||||||||||
|
Other
|
50
|
50
|
----
|
10
|
2
|
2
|
||||||||||||||||||
|
Total
|
$
|
11,076
|
$
|
11,026
|
$
|
----
|
$
|
8,276
|
$
|
510
|
$
|
510
|
||||||||||||
|
December 31, 2019
|
Unpaid
Principal
Balance
|
Recorded
Investment
|
Allowance for
Loan Losses
Allocated
|
Average
Impaired
Loans
|
Interest
Income
Recognized
|
Cash Basis
Interest
Recognized
|
||||||||||||||||||
|
With an allowance recorded:
|
||||||||||||||||||||||||
|
Commercial real estate:
|
||||||||||||||||||||||||
|
Owner-occupied
|
$
|
2,030
|
$
|
2,030
|
$
|
385
|
$
|
1,375
|
$
|
197
|
$
|
197
|
||||||||||||
|
Commercial and industrial
|
4,861
|
4,861
|
303
|
4,796
|
319
|
319
|
||||||||||||||||||
|
Consumer:
|
||||||||||||||||||||||||
|
Automobile
|
8
|
8
|
8
|
2
|
----
|
----
|
||||||||||||||||||
|
Other
|
111
|
111
|
111
|
22
|
9
|
9
|
||||||||||||||||||
|
With no related allowance recorded:
|
||||||||||||||||||||||||
|
Residential real estate
|
438
|
438
|
----
|
453
|
23
|
23
|
||||||||||||||||||
|
Commercial real estate:
|
||||||||||||||||||||||||
|
Owner-occupied
|
1,778
|
1,778
|
----
|
1,902
|
113
|
113
|
||||||||||||||||||
|
Nonowner-occupied
|
7,492
|
7,492
|
----
|
6,160
|
477
|
477
|
||||||||||||||||||
|
Commercial and industrial
|
49
|
49
|
----
|
300
|
111
|
111
|
||||||||||||||||||
|
Consumer:
|
||||||||||||||||||||||||
|
Home equity
|
368
|
368
|
----
|
143
|
19
|
19
|
||||||||||||||||||
|
Total
|
$
|
17,135
|
$
|
17,135
|
$
|
807
|
$
|
15,153
|
$
|
1,268
|
$
|
1,268
|
||||||||||||
NOTES TO THE CONSOLIDATED FINANCIAL STATEMENTS
Note C – Loans and Allowance for Loan Losses (continued)
|
December 31, 2018
|
Unpaid
Principal
Balance
|
Recorded
Investment
|
Allowance for
Loan Losses
Allocated
|
Average
Impaired
Loans
|
Interest
Income
Recognized
|
Cash Basis
Interest
Recognized
|
||||||||||||||||||
|
With an allowance recorded:
|
||||||||||||||||||||||||
|
Commercial real estate:
|
||||||||||||||||||||||||
|
Nonowner-occupied
|
$
|
362
|
$
|
362
|
$
|
98
|
$
|
367
|
$
|
15
|
$
|
15
|
||||||||||||
|
|
||||||||||||||||||||||||
|
With no related allowance recorded:
|
||||||||||||||||||||||||
|
Residential real estate
|
1,667
|
1,667
|
----
|
511
|
101
|
101
|
||||||||||||||||||
|
Commercial real estate:
|
||||||||||||||||||||||||
|
Owner-occupied
|
2,527
|
2,527
|
----
|
2,475
|
141
|
141
|
||||||||||||||||||
|
Nonowner-occupied
|
2,368
|
946
|
----
|
1,912
|
57
|
57
|
||||||||||||||||||
|
Construction
|
336
|
----
|
----
|
----
|
20
|
20
|
||||||||||||||||||
|
Commercial and industrial
|
7,116
|
7,116
|
----
|
5,802
|
414
|
414
|
||||||||||||||||||
|
Total
|
$
|
14,376
|
$
|
12,618
|
$
|
98
|
$
|
11,067
|
$
|
748
|
$
|
748
|
||||||||||||
The recorded investment of a loan is its carrying value excluding accrued interest and deferred loan fees.
Nonaccrual loans and loans past due 90 days or more and still accruing include both smaller balance homogenous loans that are collectively evaluated for impairment and individually classified as
impaired loans.
The Company transfers loans to other real estate owned, at fair value less cost to sell, in the period the Company obtains physical possession of the property (through legal title or through a deed in
lieu). As of December 31, 2020 and December 31, 2019, other real estate owned for residential real estate properties totaled $43 and $68, respectively. In addition, nonaccrual residential mortgage loans that are in the process of foreclosure had a
recorded investment of $1,097 and $1,780 as of December 31, 2020 and December 31, 2019, respectively.
The following table presents the recorded investment of nonaccrual loans and loans past due 90 days or more and still accruing by class of loans as of December 31, 2020 and 2019:
|
|
Loans Past Due 90 Days
And Still Accruing
|
Nonaccrual
|
||||||
|
December 31, 2020
|
||||||||
|
Residential real estate
|
$
|
127
|
$
|
5,256
|
||||
|
Commercial real estate:
|
||||||||
|
Owner-occupied
|
----
|
205
|
||||||
|
Nonowner-occupied
|
----
|
362
|
||||||
|
Construction
|
----
|
156
|
||||||
|
Commercial and industrial
|
15
|
149
|
||||||
|
Consumer:
|
||||||||
|
Automobile
|
146
|
129
|
||||||
|
Home equity
|
----
|
210
|
||||||
|
Other
|
136
|
36
|
||||||
|
Total
|
$
|
424
|
$
|
6,503
|
||||
NOTES TO THE CONSOLIDATED FINANCIAL STATEMENTS
Note C – Loans and Allowance for Loan Losses (continued)
|
|
Loans Past Due 90 Days
And Still Accruing
|
Nonaccrual
|
||||||
|
December 31, 2019
|
||||||||
|
Residential real estate
|
$
|
255
|
$
|
6,119
|
||||
|
Commercial real estate:
|
||||||||
|
Owner-occupied
|
----
|
863
|
||||||
|
Nonowner-occupied
|
----
|
804
|
||||||
|
Construction
|
----
|
229
|
||||||
|
Commercial and industrial
|
----
|
590
|
||||||
|
Consumer:
|
||||||||
|
Automobile
|
239
|
61
|
||||||
|
Home equity
|
----
|
392
|
||||||
|
Other
|
395
|
91
|
||||||
|
Total
|
$
|
889
|
$
|
9,149
|
||||
The following table presents the aging of the recorded investment of past due loans by class of loans as of December 31, 2020 and 2019:
|
December 31, 2020
|
30-59
Days
Past Due
|
60-89
Days
Past Due
|
90 Days
Or More
Past Due
|
Total
Past Due
|
Loans Not
Past Due
|
Total
|
||||||||||||||||||
|
Residential real estate
|
$
|
2,845
|
$
|
496
|
$
|
1,663
|
$
|
5,004
|
$
|
300,474
|
$
|
305,478
|
||||||||||||
|
Commercial real estate:
|
||||||||||||||||||||||||
|
Owner-occupied
|
470
|
1003
|
193
|
1,666
|
50,197
|
51,863
|
||||||||||||||||||
|
Nonowner-occupied
|
94
|
----
|
362
|
456
|
164,067
|
164,523
|
||||||||||||||||||
|
Construction
|
----
|
82
|
----
|
82
|
36,981
|
37,063
|
||||||||||||||||||
|
Commercial and industrial
|
1,112
|
11
|
164
|
1,287
|
156,405
|
157,692
|
||||||||||||||||||
|
Consumer:
|
||||||||||||||||||||||||
|
Automobile
|
831
|
131
|
258
|
1,220
|
54,021
|
55,241
|
||||||||||||||||||
|
Home equity
|
204
|
81
|
113
|
398
|
19,595
|
19,993
|
||||||||||||||||||
|
Other
|
446
|
76
|
172
|
694
|
56,117
|
56,811
|
||||||||||||||||||
|
|
||||||||||||||||||||||||
|
Total
|
$
|
6,002
|
$
|
1,880
|
$
|
2,925
|
$
|
10,807
|
$
|
837,857
|
$
|
848,664
|
||||||||||||
|
December 31, 2019
|
30-59
Days
Past Due
|
60-89
Days
Past Due
|
90 Days
Or More
Past Due
|
Total
Past Due
|
Loans Not
Past Due
|
Total
|
||||||||||||||||||
|
Residential real estate
|
$
|
4,015
|
$
|
1,314
|
$
|
1,782
|
$
|
7,111
|
$
|
303,142
|
$
|
310,253
|
||||||||||||
|
Commercial real estate:
|
||||||||||||||||||||||||
|
Owner-occupied
|
383
|
59
|
144
|
586
|
55,239
|
55,825
|
||||||||||||||||||
|
Nonowner-occupied
|
12
|
----
|
697
|
709
|
130,689
|
131,398
|
||||||||||||||||||
|
Construction
|
186
|
19
|
49
|
254
|
34,659
|
34,913
|
||||||||||||||||||
|
Commercial and industrial
|
1,320
|
312
|
241
|
1,873
|
98,150
|
100,023
|
||||||||||||||||||
|
Consumer:
|
||||||||||||||||||||||||
|
Automobile
|
986
|
329
|
246
|
1,561
|
62,209
|
63,770
|
||||||||||||||||||
|
Home equity
|
106
|
18
|
279
|
403
|
22,479
|
22,882
|
||||||||||||||||||
|
Other
|
559
|
139
|
443
|
1,141
|
52,569
|
53,710
|
||||||||||||||||||
|
|
||||||||||||||||||||||||
|
Total
|
$
|
7,567
|
$
|
2,190
|
$
|
3,881
|
$
|
13,638
|
$
|
759,136
|
$
|
772,774
|
||||||||||||
NOTES TO THE CONSOLIDATED FINANCIAL STATEMENTS
Note C – Loans and Allowance for Loan Losses (continued)
Troubled Debt Restructurings:
A troubled debt restructuring (“TDR”) occurs when the Company has agreed to a loan modification in the form of a concession for a borrower who is experiencing financial difficulty. All TDRs are
considered to be impaired. The modification of the terms of such loans included one or a combination of the following: a reduction of the stated interest rate of the loan; an extension of the maturity date at a stated rate of interest lower than the
current market rate for new debt with similar risk; a reduction in the contractual principal and interest payments of the loan; or short-term interest-only payment terms.
The Company has allocated reserves for a portion of its TDRs to reflect the fair values of the underlying collateral or the present value of the concessionary terms granted to the customer.
The following table presents the types of TDR loan modifications by class of loans as of December 31, 2020 and December 31, 2019:
|
|
TDRs
Performing to
Modified Terms
|
TDRs Not
Performing to
Modified Terms
|
Total
TDRs
|
|||||||||
|
December 31, 2020
|
||||||||||||
|
Residential real estate:
|
||||||||||||
|
Interest only payments
|
$
|
202
|
$
|
----
|
$
|
202
|
||||||
|
Commercial real estate:
|
||||||||||||
|
Owner-occupied
|
||||||||||||
|
Reduction of principal and interest payments
|
1,486
|
----
|
1,486
|
|||||||||
|
Maturity extension at lower stated rate than market rate
|
351
|
----
|
351
|
|||||||||
|
Credit extension at lower stated rate than market rate
|
384
|
----
|
384
|
|||||||||
|
Nonowner-occupied
|
||||||||||||
|
Credit extension at lower stated rate than market rate
|
390
|
----
|
390
|
|||||||||
|
Commercial and industrial
|
||||||||||||
|
Interest only payments
|
4,400
|
----
|
4,400
|
|||||||||
|
Total TDRs
|
$
|
7,213
|
$
|
----
|
$
|
7,213
|
||||||
|
|
TDRs
Performing to
Modified Terms
|
TDRs Not
Performing to
Modified Terms
|
Total
TDRs
|
|||||||||
|
December 31, 2019
|
||||||||||||
|
Residential real estate:
|
||||||||||||
|
Interest only payments
|
$
|
209
|
$
|
----
|
$
|
209
|
||||||
|
Commercial real estate:
|
||||||||||||
|
Owner-occupied
|
||||||||||||
|
Interest only payments
|
882
|
----
|
882
|
|||||||||
|
Reduction of principal and interest payments
|
1,521
|
----
|
1,521
|
|||||||||
|
Maturity extension at lower stated rate than market rate
|
393
|
----
|
393
|
|||||||||
|
Credit extension at lower stated rate than market rate
|
393
|
----
|
393
|
|||||||||
|
Nonowner-occupied
|
||||||||||||
|
Credit extension at lower stated rate than market rate
|
395
|
----
|
395
|
|||||||||
|
Commercial and industrial
|
||||||||||||
|
Interest only payments
|
4,574
|
----
|
4,574
|
|||||||||
|
Reduction of principal and interest payments
|
185
|
----
|
185
|
|||||||||
|
Total TDRs
|
$
|
8,552
|
$
|
----
|
$
|
8,552
|
||||||
NOTES TO THE CONSOLIDATED FINANCIAL STATEMENTS
Note C – Loans and Allowance for Loan Losses (continued)
At December 31, 2020, the balance in TDR loans decreased $1,339, or 15.7%, from year-end 2019. The Company had no specific allocations in reserves to customers whose loan terms have been modified in
TDRs at December 31, 2020, as compared to $227 at December 31, 2019. At December 31, 2020, the Company had $1,100 in commitments to lend additional amounts to customers with outstanding loans that are classified as TDRs, as compared to $941 at
December 31, 2019.
There were no TDR loan modifications that occurred during the years ended December 31, 2020 and December 31, 2018. The following table present the pre- and post-modification balances of TDR loan
modifications by class of loans that occurred during the year ended December 31, 2019:
|
|
TDRs
Performing to Modified Terms
|
TDRs Not
Performing to Modified Terms
|
||||||||||||||||||
|
|
Number
of
Loans
|
Pre-Modification
Recorded
Investment
|
Post-Modification
Recorded
Investment
|
Pre-Modification
Recorded
Investment
|
Post-Modification
Recorded
Investment
|
|||||||||||||||
|
December 31, 2019
|
||||||||||||||||||||
|
Commercial real estate:
|
||||||||||||||||||||
|
Owner-occupied
|
||||||||||||||||||||
|
Reduction of principal and interest payments
|
1
|
$
|
1,036
|
$
|
1,036
|
$
|
----
|
$
|
----
|
|||||||||||
|
Commercial and industrial:
|
||||||||||||||||||||
|
Reduction of principal and interest payments
|
1
|
199
|
199
|
----
|
----
|
|||||||||||||||
|
|
||||||||||||||||||||
|
Total TDRs
|
2
|
$
|
1,235
|
$
|
1,235
|
$
|
----
|
$
|
----
|
|||||||||||
The TDRs described above increased the provision expense and the allowance for loan losses by $185 during the year ended December 31, 2019, with no corresponding charge-offs.
The Company had no TDRs that occurred during the year ended December 31, 2020 and December 31, 2019 that experienced any payment defaults within twelve months following their loan modification. During
the twelve months ended December 31, 2018, a commercial real estate TDR totaling $362 became past due 90 days or more. A default is considered to have occurred once the TDR is past due 90 days or more or it has been placed on nonaccrual. TDR loans are
returned to accrual status when all the principal and interest amounts contractually due are brought current and future payments are reasonably assured.
The Coronavirus Aid, Relief, and Economic Security Act (“CARES Act”) was signed into law on March 27, 2020 and provided guidance on the modification of loans as a result of COVID-19, which
outlined, among other criteria, that short-term modifications made on a good faith basis to borrowers who were current as defined under the CARES Act prior to any relief, are not TDRs. This includes short-term modifications such as payment
deferrals, fee waivers, extensions of repayment terms, or other delays in payment that are insignificant. Borrowers are considered current under the CARES Act and related regulatory guidance if they are less than 30 days past due on their
contractual payments at December 31, 2019, or at the time a modification program is implemented, respectively. During the year ended December 31, 2020, the Company had modified 827 loans related to COVID-19 with an aggregate loan balance
of $153,263 at December 31, 2020 that were not reported as TDRs. As of December 31, 2020, the Company had 116 modified loans remaining that were related to COVID-19 with an aggregate loan balance of $7,287 that were
not reported as TDRs in the tables presented above.
The terms of certain other loans were modified during the years ended December 31, 2020 and 2019 that did not meet the definition of a TDR. These loans have a total recorded investment of $57,893 as
of December 31, 2020 and $50,586 as of December 31, 2019. The modification of these loans primarily involved the modification of the terms of a loan to borrowers who were not experiencing financial difficulties.
NOTES TO THE CONSOLIDATED FINANCIAL STATEMENTS
Note C - Loans and Allowance for Loan Losses (continued)
Credit Quality Indicators:
The Company categorizes loans into risk categories based on relevant information about the ability of borrowers to service their debt, such as: current financial information, historical payment
experience, credit documentation, public information, and current economic trends, among other factors. These risk categories are represented by a loan grading scale from 1 through 11. The Company analyzes loans individually with a higher credit risk
rating and groups these loans into categories called “criticized” and ”classified” assets. The Company considers its criticized assets to be loans that are graded 8 and its classified assets to be loans that are graded 9 through 11. The Company’s risk
categories are reviewed at least annually on loans that have aggregate borrowing amounts that meet or exceed $1,000.
The Company uses the following definitions for its criticized loan risk ratings:
Special Mention. Loans classified as special mention indicate considerable risk due to deterioration of repayment (in the earliest stages) due to potential weak primary repayment
source, or payment delinquency. These loans will be under constant supervision, are not classified and do not expose the institution to sufficient risks to warrant classification. These deficiencies should be correctable within the normal course of
business, although significant changes in company structure or policy may be necessary to correct the deficiencies. These loans are considered bankable assets with no apparent loss of principal or interest envisioned. The perceived risk in continued
lending is considered to have increased beyond the level where such loans would normally be granted. Credits that are defined as a troubled debt restructuring should be graded no higher than special mention until they have been reported as performing
over one year after restructuring.
The Company uses the following definitions for its classified loan risk ratings:
Substandard. Loans classified as substandard represent very high risk, serious delinquency, nonaccrual, or unacceptable credit. Repayment through the primary source of repayment
is in jeopardy due to the existence of one or more well defined weaknesses and the collateral pledged may inadequately protect collection of the loans. Loss of principal is not likely if weaknesses are corrected, although financial statements normally
reveal significant weakness. Loans are still considered collectible, although loss of principal is more likely than with special mention loan grade 8 loans. Collateral liquidation is considered likely to satisfy debt.
Doubtful. Loans classified as doubtful display a high probability of loss, although the amount of actual loss at the time of classification is undetermined. This should be a
temporary category until such time that actual loss can be identified, or improvements made to reduce the seriousness of the classification. These loans exhibit all substandard characteristics with the addition that weaknesses make collection or
liquidation in full highly questionable and improbable. This classification consists of loans where the possibility of loss is high after collateral liquidation based upon existing facts, market conditions, and value. Loss is deferred until certain
important and reasonable specific pending factors which may strengthen the credit can be more accurately determined. These factors may include proposed acquisitions, liquidation procedures, capital injection, and receipt of additional collateral,
mergers, or refinancing plans. A doubtful classification for an entire credit should be avoided when collection of a specific portion appears highly probable with the adequately secured portion graded substandard.
Loss. Loans classified as loss are considered uncollectible and are of such little value that their continuance as bankable assets is not warranted. This classification does not
mean that the credit has absolutely no recovery or salvage value, but rather it is not practical or desirable to defer writing off this asset yielding such a minimum value even though partial recovery may be affected in the future. Amounts classified
as loss should be promptly charged off.
Criticized and classified loans will mostly consist of commercial and industrial and commercial real estate loans. The Company considers its loans that do not meet the criteria for a criticized and
classified asset rating as pass rated loans, which will include loans graded from 1 (Prime) to 7 (Watch). All commercial loans are categorized into a risk category either at the time of origination or re-evaluation date.
NOTES TO THE CONSOLIDATED FINANCIAL STATEMENTS
Note C - Loans and Allowance for Loan Losses (continued)
As of December 31, 2020 and December 31, 2019, and based on the most recent analysis performed, the risk category of commercial loans by class of loans is as follows:
|
December 31, 2020
|
Pass
|
Criticized
|
Classified
|
Total
|
||||||||||||
|
Commercial real estate:
|
||||||||||||||||
|
Owner-occupied
|
$
|
46,604
|
$
|
669
|
$
|
4,590
|
$
|
51,863
|
||||||||
|
Nonowner-occupied
|
160,324
|
3,629
|
570
|
164,523
|
||||||||||||
|
Construction
|
37,063
|
----
|
----
|
37,063
|
||||||||||||
|
Commercial and industrial
|
150,786
|
2,064
|
4,842
|
157,692
|
||||||||||||
|
Total
|
$
|
394,777
|
$
|
6,362
|
$
|
10,002
|
$
|
411,141
|
||||||||
|
December 31, 2019
|
Pass
|
Criticized
|
Classified
|
Total
|
||||||||||||
|
Commercial real estate:
|
||||||||||||||||
|
Owner-occupied
|
$
|
49,486
|
$
|
2,889
|
$
|
3,450
|
$
|
55,825
|
||||||||
|
Nonowner-occupied
|
123,847
|
----
|
7,551
|
131,398
|
||||||||||||
|
Construction
|
34,864
|
----
|
49
|
34,913
|
||||||||||||
|
Commercial and industrial
|
89,749
|
298
|
9,976
|
100,023
|
||||||||||||
|
Total
|
$
|
297,946
|
$
|
3,187
|
$
|
21,026
|
$
|
322,159
|
||||||||
The Company also obtains the credit scores of its borrowers upon origination (if available by the credit bureau) but not thereafter. The Company focuses mostly on the performance and repayment ability
of the borrower as an indicator of credit risk and does not consider a borrower’s credit score to be a significant influence in the determination of a loan’s credit risk grading.
For residential and consumer loan classes, the Company evaluates credit quality based on the aging status of the loan, which was previously presented, and by payment activity. The following table
presents the recorded investment of residential and consumer loans by class of loans based on payment activity as of December 31, 2020 and December 31, 2019:
|
|
Consumer
|
|||||||||||||||||||
|
December 31, 2020
|
Automobile
|
Home Equity
|
Other
|
Residential
Real Estate
|
Total
|
|||||||||||||||
|
Performing
|
$
|
54,966
|
$
|
19,783
|
$
|
56,639
|
$
|
300,095
|
$
|
431,483
|
||||||||||
|
Nonperforming
|
275
|
210
|
172
|
5,383
|
6,040
|
|||||||||||||||
|
Total
|
$
|
55,241
|
$
|
19,993
|
$
|
56,811
|
$
|
305,478
|
$
|
437,523
|
||||||||||
|
|
Consumer
|
|||||||||||||||||||
|
December 31, 2019
|
Automobile
|
Home Equity
|
Other
|
Residential
Real Estate
|
Total
|
|||||||||||||||
|
Performing
|
$
|
63,470
|
$
|
22,490
|
$
|
53,224
|
$
|
303,879
|
$
|
443,063
|
||||||||||
|
Nonperforming
|
300
|
392
|
486
|
6,374
|
7,552
|
|||||||||||||||
|
Total
|
$
|
63,770
|
$
|
22,882
|
$
|
53,710
|
$
|
310,253
|
$
|
450,615
|
||||||||||
The Company, through its subsidiaries, grants residential, consumer, and commercial loans to customers located primarily in the southeastern area of Ohio as well as the western counties of West
Virginia. Approximately 4.22% of total loans were unsecured at December 31, 2020, down from 5.00% at December 31, 2019.
NOTES TO THE CONSOLIDATED FINANCIAL STATEMENTS
Note D - Premises and Equipment
Following is a summary of premises and equipment at December 31:
|
|
2020
|
2019
|
||||||
|
Land
|
$
|
2,719
|
$
|
2,633
|
||||
|
Buildings
|
22,081
|
20,890
|
||||||
|
Leasehold improvements
|
1,302
|
1,267
|
||||||
|
Furniture and equipment
|
8,892
|
6,847
|
||||||
|
|
34,994
|
31,637
|
||||||
|
Less accumulated depreciation
|
13,682
|
12,420
|
||||||
|
Total premises and equipment
|
$
|
21,312
|
$
|
19,217
|
||||
Following is a summary of premises and equipment held for sale at December 31:
|
|
2020
|
2019
|
||||||
|
Land
|
$
|
153
|
$
|
153
|
||||
|
Buildings
|
564
|
563
|
||||||
|
|
717
|
716
|
||||||
|
Less accumulated depreciation
|
80
|
63
|
||||||
|
Total premises and equipment held for sale
|
$
|
637
|
$
|
653
|
||||
Note E – Leases
The Company enters into leases in the normal course of business primarily for branch buildings and office space to conduct business. The Company’s leases have remaining terms ranging from 9 months to
16.5 years, some of which include options to extend the leases for up to 15 years.
The Company includes lease extension and termination options in the lease term if, after considering relevant economic factors, it is reasonably certain the Company will exercise the option. In
addition, the Company has elected to account for any non-lease components in its real estate leases as part of the associated lease component. The Company has also elected to not recognize leases with original lease terms of 12 months or less
(short-term leases) on the Company’s balance sheet.
Leases are classified as operating or finance leases at the lease commencement date. Lease expense for operating leases and short-term leases is recognized on a straight-line basis over the lease
term. ROU assets represent our right to use an underlying asset for the lease term and lease liabilities are recognized at the lease commencement date based on the estimated present value of lease payments over the lease term. At December 31, 2020,
the Company did not have any finance leases.
The Company’s operating lease ROU assets and operating lease liabilities are valued based on the present value of future minimum lease payments, discounted with an incremental borrowing rate for the
same term as the underlying lease. The Company has one lease arrangement that contains variable lease payments that are adjusted periodically for an index. Upon adoption of the new lease guidance on January 1, 2019, an initial ROU asset of $1,280 was
recognized as a non-cash asset addition to the consolidated balance sheet.
Balance sheet information related to leases was as follows:
|
December 31, 2020
|
December 31, 2019
|
|||||||
|
Operating leases:
|
||||||||
|
Operating lease right-of-use assets
|
$
|
880
|
$
|
1,053
|
||||
|
Operating lease liabilities
|
880
|
1,053
|
||||||
NOTES TO THE CONSOLIDATED FINANCIAL STATEMENTS
Note E – Leases (continued)
The components of lease cost were as follows for the year ending:
|
December 31, 2020
|
December 31, 2019
|
|||||||
|
Operating lease cost
|
$
|
170
|
$
|
282
|
||||
|
Short-term lease expense
|
31
|
52
|
||||||
Future undiscounted lease payments for operating leases with initial terms of one year or more as of December 31, 2020 are as follows:
|
Operating Leases
|
||||
|
2021
|
$
|
157
|
||
|
2022
|
157
|
|||
|
2023
|
116
|
|||
|
2024
|
95
|
|||
|
2025
|
94
|
|||
|
Thereafter
|
452
|
|||
|
Total lease payments
|
1,071
|
|||
|
Less: Imputed Interest
|
(191
|
)
|
||
|
Total operating leases
|
$
|
880
|
||
Other information was as follows:
|
December 31, 2020
|
December 31, 2019
|
|||||||
|
Weighted-average remaining lease term for operating leases
|
9.6 years
|
10.6 years
|
||||||
|
Weighted-average discount rate for operating leases
|
2.79%
|
|
2.76%
|
|
||||
Note F – Goodwill and Intangible Assets
Goodwill: The change in goodwill during the year is as follows:
|
|
2020
|
2019
|
2018
|
|||||||||
|
Beginning of year
|
$
|
7,319
|
$
|
7,371
|
$
|
7,371
|
||||||
|
Finalization of Milton branch sale
|
----
|
(52
|
)
|
----
|
||||||||
|
End of year
|
$
|
7,319
|
$
|
7,319
|
$
|
7,371
|
||||||
Impairment exists when a reporting unit’s carrying value of goodwill exceeds its fair value. During 2020, the general economic conditions the Company operates in had trended from generally stable to
somewhat challenged in relation to the pandemic. At December 31, 2020, the Company’s reporting unit remained profitable and had positive equity. However, earnings for 2020 had been negatively impacted by adding general reserves to the allowance in
relation to the pandemic and to a lower net interest margin in relation to the first quarter rate cuts. As a result, the Company’s stock price experienced a decrease in value during 2020, and was trading below book value at December 31, 2020. Given the
economic outlook, the challenge of growing earnings going forward in this environment, and the Company’s stock price trading below book value, management could not conclude that evidence provided by a qualitative assessment would support that it would
be more likely than not the fair value of goodwill is more than the carrying amount. Therefore, the Company proceeded to complete the quantitative impairment test.
The quantitative impairment test includes comparing the carrying value of the reporting unit, including the existing goodwill and intangible assets, to the fair value of the reporting unit. If the
carrying amount of the reporting unit exceeds its fair value, a goodwill impairment charge is recorded for the amount in which the carrying value of the reporting unit exceeds the fair value of the reporting unit, up to the amount of goodwill
attributed to the reporting unit. After performing the quantitative testing, it was determined that the reporting unit’s fair value exceeded the reporting unit’s carrying value, resulting in no impairment for the year ended December 31, 2020.
At December 31, 2019, the Company’s reporting unit had positive equity and the Company elected to perform a qualitative assessment to determine if it was more likely than not that fair value of the
reporting unit exceeded its carrying value, including goodwill. The qualitative assessment indicated that it is more likely than not that fair value of goodwill is more than the carrying value, resulting in no impairment for the year ended December
31, 2019. Therefore, the Company did not proceed to step one of the annual goodwill impairment testing requirement.
NOTES TO THE CONSOLIDATED FINANCIAL STATEMENTS
Note F – Goodwill and Intangible Assets (continued)
Acquired intangible assets: Acquired intangible assets were as follows at year-end:
|
|
2020
|
2019
|
||||||||||||||
|
|
Gross Carrying Amount
|
Accumulated Amortization
|
Gross Carrying Amount
|
Accumulated Amortization
|
||||||||||||
| Amortized intangible assets: |
||||||||||||||||
|
Core deposit intangibles
|
$
|
738
|
$
|
626
|
$
|
738
|
$
|
564
|
||||||||
Aggregate amortization expense was $62 for 2020, $206 for 2019 and $135 for 2018.
Estimated amortization expense for each of the next five years:
|
2021
|
$
|
48
|
||
|
2022
|
35
|
|||
|
2023
|
21
|
|||
|
2024
|
8
|
|||
|
2025
|
----
|
|||
|
Total
|
$
|
112
|
Note G - Deposits
Following is a summary of interest-bearing deposits at December 31:
|
|
2020
|
2019
|
||||||
|
NOW accounts
|
$
|
185,364
|
$
|
158,434
|
||||
|
Savings and Money Market
|
286,937
|
230,672
|
||||||
|
Time:
|
||||||||
|
In denominations of $250,000 or less
|
165,834
|
175,334
|
||||||
|
In denominations of more than $250,000
|
40,827
|
34,424
|
||||||
|
Total time deposits
|
206,661
|
209,758
|
||||||
|
Total interest-bearing deposits
|
$
|
678,962
|
$
|
598,864
|
||||
Following is a summary of total time deposits by remaining maturity at December 31, 2020:
|
2021
|
$
|
136,634
|
||
|
2022
|
51,677
|
|||
|
2023
|
13,727
|
|||
|
2024
|
3,289
|
|||
|
2025
|
1,147
|
|||
|
Thereafter
|
187
|
|||
|
Total
|
$
|
206,661
|
Brokered deposits, included in time deposits, were $18,834 and $25,797 at December 31, 2020 and 2019, respectively.
NOTES TO THE CONSOLIDATED FINANCIAL STATEMENTS
Note H - Interest Rate Swaps
The Company manages economic risks, including interest rate, liquidity, and credit risk, primarily by managing the amount, sources, and duration of its assets and liabilities. The Company utilizes
interest rate swap agreements as part of its asset/liability management strategy to help manage its interest rate risk position. As part of this strategy, the Company provides its customer with a fixed-rate loan while creating a variable-rate asset
for the Company by the customer entering into an interest rate swap with the Company on terms that match the loan. The Company offsets its risk exposure by entering into an offsetting interest rate swap with an unaffiliated institution. These
interest rate swaps do not qualify as designated hedges; therefore, each swap is accounted for as a standalone derivative. At December 31, 2020, the Company had interest rate swaps associated with commercial loans with a notional value of $10,967 and
a fair value of $913. This is compared to interest rate swaps with a notional value of $7,633 and a fair value of $459 at December 31, 2019. The notional amount of the interest rate swaps does not represent amounts exchanged by the parties. The
amount exchanged is determined by reference to the notional amount and the other terms of the individual interest rate swap agreement. To further offset the risk exposure related to market value fluctuations of its interest rate swaps, the Company
maintains collateral deposits on hand with a third-party correspondent, which totaled $1,250 at December 31, 2020 and $750 at December 31, 2019.
Note I - Other Borrowed Funds
Other borrowed funds at December 31, 2020 and 2019 are comprised of advances from the FHLB of Cincinnati and promissory notes.
|
FHLB Borrowings
|
Promissory Notes
|
Totals | ||||||||||
|
2020
|
$
|
24,665
|
$
|
3,198
|
$
|
27,863
|
||||||
|
2019
|
$
|
29,758
|
$
|
4,233
|
$
|
33,991
|
||||||
Pursuant to collateral agreements with the FHLB, advances are secured by $297,281 in qualifying mortgage loans, $57,457 in commercial loans and $5,365 in FHLB stock at December 31, 2020. Fixed-rate
FHLB advances of $24,665 mature through 2042 and have interest rates ranging from 1.53% to 3.31% and a year-to-date weighted average cost of 2.40% and 2.39% at December 31, 2020 and 2019, respectively. There were no variable-rate FHLB borrowings at
December 31, 2020.
At December 31, 2020, the Company had a cash management line of credit enabling it to borrow up to $100,000 from the FHLB. All cash management advances have an original maturity of 90 days. The line
of credit must be renewed on an annual basis. There was $100,000 available on this line of credit at December 31, 2020.
Based on the Company’s current FHLB stock ownership, total assets and pledgeable loans, the Company had the ability to obtain borrowings from the FHLB up to a maximum of $204,060 at December 31, 2020.
Of this maximum borrowing capacity of $204,060, the Company had $102,656 available to use as additional borrowings, of which $100,000 could be used for short-term, cash management advances, as mentioned above.
Promissory notes, issued primarily by Ohio Valley, are due at various dates through a final maturity date of December 9, 2021, and have fixed rates ranging from 1.00% to 2.85% and a year-to-date
weighted average cost of 2.20% at December 31, 2020, as compared to 2.73% at December 31, 2019. At December 31, 2020, there were six promissory notes payable by Ohio Valley to related parties totaling $3,198. See Note M for further discussion of
related party transactions. There were no Promissory notes payable to other banks at December 31, 2020, as compared to $405 at December 31, 2019.
Letters of credit issued on the Bank’s behalf by the FHLB to collateralize certain public unit deposits as required by law totaled $76,740 at December 31, 2020 and $56,500 at December 31, 2019.
NOTES TO THE CONSOLIDATED FINANCIAL STATEMENTS
Note I - Other Borrowed Funds (continued)
|
Scheduled principal payments over the next five years:
|
FHLB Borrowings
|
Promissory Notes
|
Totals
|
|||||||||
|
2021
|
$
|
3,134
|
$
|
3,198
|
$
|
6,332
|
||||||
|
2022
|
2,683
|
----
|
2,683
|
|||||||||
|
2023
|
2,542
|
----
|
2,542
|
|||||||||
|
2024
|
2,173
|
----
|
2,173
|
|||||||||
|
2025
|
1,897
|
----
|
1,897
|
|||||||||
|
Thereafter
|
12,236
|
----
|
12,236
|
|||||||||
|
$
|
24,665
|
$
|
3,198
|
$
|
27,863
|
|||||||
Note J - Subordinated Debentures and Trust Preferred Securities
On March 22, 2007, a trust formed by Ohio Valley issued $8,500 of adjustable-rate trust preferred securities as part of a pooled offering of such securities. The rate on these trust preferred
securities was fixed at 6.58% for five years, and then converted to a floating-rate term on March 15, 2012, based on a rate equal to the 3-month LIBOR plus 1.68%. The interest rate on these trust preferred securities was 1.90% at December 31, 2020 and
3.57% at December 31, 2019. There were no debt issuance costs incurred with these trust preferred securities. The Company issued subordinated debentures to the trust in exchange for the proceeds of the offering. The subordinated debentures must be
redeemed no later than June 15, 2037.
Under the provisions of the related indenture agreements, the interest payable on the trust preferred securities is deferrable for up to five years and any such deferral is not considered a default.
During any period of deferral, the Company would be precluded from declaring or paying dividends to shareholders or repurchasing any of the Company’s common stock. Under generally accepted accounting principles, the trusts are not
consolidated with the Company. Accordingly, the Company does not report the securities issued by the trust as liabilities, and instead reports as liabilities the subordinated debentures issued by the Company and held by
the trust. Since the Company’s equity interest in the trusts cannot be received until the subordinated debentures are repaid, these amounts have been netted. The subordinated debentures may be included in Tier 1 capital (with certain limitations
applicable) under current regulatory guidelines and interpretations.
Note K - Income Taxes
The provision for income taxes consists of the following components:
|
|
2020
|
2019
|
2018
|
|||||||||
|
Current tax expense
|
$
|
2,036
|
$
|
1,446
|
$
|
2,389
|
||||||
|
Deferred tax (benefit) expense
|
12
|
367
|
(134
|
)
|
||||||||
|
Total income taxes
|
$
|
2,048
|
$
|
1,813
|
$
|
2,255
|
||||||
The source of deferred tax assets and deferred tax liabilities at December 31:
|
|
2020
|
2019
|
||||||
|
Items giving rise to deferred tax assets:
|
||||||||
|
Allowance for loan losses
|
$
|
1,557
|
$
|
1,364
|
||||
|
Deferred compensation
|
1,822
|
1,700
|
||||||
|
Deferred loan fees/costs
|
136
|
110
|
||||||
|
Other real estate owned
|
1
|
4
|
||||||
|
Accrued bonus
|
212
|
204
|
||||||
|
Purchase accounting adjustments
|
18
|
24
|
||||||
|
Net operating loss
|
99
|
115
|
||||||
|
Lease liability
|
235
|
274
|
||||||
|
Other
|
339
|
346
|
||||||
|
Items giving rise to deferred tax liabilities:
|
||||||||
|
Mortgage servicing rights
|
(100
|
)
|
(77
|
)
|
||||
|
FHLB stock dividends
|
(676
|
)
|
(676
|
)
|
||||
|
Unrealized gain on securities available for sale
|
(647
|
)
|
(140
|
)
|
||||
|
Prepaid expenses
|
(202
|
)
|
(182
|
)
|
||||
|
Depreciation and amortization
|
(894
|
)
|
(579
|
)
|
||||
|
Right-of-use asset
|
(235
|
)
|
(274
|
)
|
||||
|
Other
|
----
|
----
|
||||||
|
Net deferred tax asset
|
$
|
1,665
|
$
|
2,213
|
||||
NOTES TO THE CONSOLIDATED FINANCIAL STATEMENTS
Note K - Income Taxes (continued)
The Company determined that it was not required to establish a valuation allowance for deferred tax assets since management believes that the deferred tax assets are likely to be realized through the
future reversals of existing taxable temporary differences, deductions against forecasted income and tax planning strategies.
At December 31, 2020, the Company’s deferred tax asset related to Section 382 net operating loss carryforwards was $471, which will expire in 2026.
The difference between the financial statement tax provision and amounts computed by applying the statutory federal income tax rate of 21% to income before taxes is as follows:
|
|
2020
|
2019
|
2018
|
|||||||||
|
Statutory tax
|
$
|
2,584
|
$
|
2,461
|
$
|
2,982
|
||||||
|
Effect of nontaxable interest
|
(348
|
)
|
(336
|
)
|
(352
|
)
|
||||||
|
Effect of nontaxable insurance premiums
|
(210
|
)
|
(212
|
)
|
(218
|
)
|
||||||
|
Income from bank owned insurance, net
|
(161
|
)
|
(141
|
)
|
(142
|
)
|
||||||
|
Effect of postretirement benefits
|
124
|
54
|
20
|
|||||||||
|
Effect of state income tax
|
125
|
100
|
33
|
|||||||||
|
Tax credits
|
(102
|
)
|
(145
|
)
|
(217
|
)
|
||||||
|
Other items
|
36
|
32
|
149
|
|||||||||
|
Total income taxes
|
$
|
2,048
|
$
|
1,813
|
$
|
2,255
|
||||||
At December 31, 2020 and December 31, 2019, the Company had no unrecognized tax benefits. The Company does not expect the amount of unrecognized tax benefits to significantly change within the next
twelve months. The Company did not recognize any interest and/or penalties related to income tax matters for the periods presented.
The Company is subject to U.S. federal income tax as well as West Virginia state income tax. The Company is no longer subject to federal or state examination for years prior to 2017. The tax years
2017-2019 remain open to federal and state examinations.
Note L - Commitments and Contingent Liabilities
The Bank is a party to financial instruments with off-balance sheet risk in the normal course of business to meet the financing needs of its customers. These financial instruments include commitments
to extend credit, standby letters of credit and financial guarantees. The Bank’s exposure to credit loss in the event of nonperformance by the other party to the financial instrument for commitments to extend credit and standby letters of credit, and
financial guarantees written, is represented by the contractual amount of those instruments. The Bank uses the same credit policies in making commitments and conditional obligations as it does for instruments recorded on the balance sheet.
NOTES TO THE CONSOLIDATED FINANCIAL STATEMENTS
Note L - Commitments and Contingent Liabilities (continued)
Following is a summary of such commitments at December 31:
|
|
2020
|
2019
|
||||||
|
Fixed rate
|
$
|
1,127
|
$
|
660
|
||||
|
Variable rate
|
83,956
|
70,561
|
||||||
|
Standby letters of credit
|
3,373
|
3,957
|
||||||
At December 31, 2020, the fixed-rate commitments have interest rates ranging from 2.50% to 6.25% and maturities ranging from 15 years to 30 years.
Commitments to extend credit are agreements to lend to a customer as long as there is no violation of any condition established in the contract. Commitments generally have fixed expiration dates or
other termination clauses and may require payment of a fee. Standby letters of credit are conditional commitments issued by the Bank to guarantee the performance of a customer to a third party. Since many of the commitments are expected to expire
without being drawn upon, the total commitment amounts do not necessarily represent future cash requirements. The Bank evaluates each customer’s credit worthiness on a case-by-case basis. The amount of collateral obtained, if deemed necessary by the
Bank upon extension of credit, is based on management’s credit evaluation of the counterparty. Collateral held varies but may include accounts receivable, inventory, property, plant and equipment and income-producing commercial properties.
During the years covered by these consolidated financial statements, the Company participated as a facilitator of tax refunds pursuant to a clearing agreement with a third-party tax refund product
provider. The clearing agreement required the Bank to process electronic refund checks (“ERC’s”) and electronic refund deposits (“ERD’s”) presented for payment on behalf of taxpayers containing taxpayer refunds. The Bank received a fee paid by the
third-party tax refund product provider for each transaction that is processed. In 2018, the third-party tax refund product provider ceased utilizing the services of the Bank.
There are various contingent liabilities that are not reflected in the financial statements, including claims and legal actions arising in the ordinary course of business. In the opinion of management,
after consultation with legal counsel, the ultimate disposition of these matters is not expected to have a material effect on financial condition or results of operations.
Note M - Related Party Transactions
Certain directors, executive officers and companies with which they are affiliated were loan customers during 2020. A summary of activity on these borrower relationships with aggregate debt greater
than $120 is as follows:
|
Total loans at January 1, 2020
|
$
|
3,974
|
||
|
New loans
|
54
|
|||
|
Repayments
|
(1,588
|
)
|
||
|
Other changes
|
289
|
|||
|
Total loans at December 31, 2020
|
$
|
2,729
|
Other changes include adjustments for loans applicable to one reporting period that are excludable from the other reporting period, such as changes in persons classified as directors, executive
officers and companies’ affiliates.
Deposits from principal officers, directors, and their affiliates at year-end 2020 and 2019 were $94,056 and $47,911. In addition, the Company had promissory notes outstanding with directors and their
affiliates totaling $3,198 at year-end 2020 and $3,558 at year-end 2019. The interest rates ranged from 1.00% to 2.85%, with terms ranging from 10 to 24 months.
NOTES TO THE CONSOLIDATED FINANCIAL STATEMENTS
Note N - Employee Benefits
The Bank has a profit-sharing plan for the benefit of its employees and their beneficiaries. Contributions to the plan are determined by the Board of Directors of Ohio Valley. Contributions charged to
expense were $242, $264, and $352 for 2020, 2019 and 2018.
Ohio Valley maintains an Employee Stock Ownership Plan (“ESOP”) covering substantially all employees of the Company. Ohio Valley issues shares to the ESOP, purchased by the ESOP with subsidiary cash
contributions, which are allocated to ESOP participants based on relative compensation. The total number of shares held by the ESOP, all of which have been allocated to participant accounts, were 298,294 and 365,274 at December 31, 2020 and 2019. In
addition, the subsidiaries made contributions to its ESOP Trust as follows:
|
|
Years ended December 31
|
|||||||||||
|
|
2020
|
2019
|
2018
|
|||||||||
|
|
||||||||||||
|
Number of shares issued
|
----
|
8,333
|
7,294
|
|||||||||
|
|
||||||||||||
|
Fair value of stock contributed
|
$
|
----
|
$
|
328
|
$
|
295
|
||||||
|
|
||||||||||||
|
Cash contributed
|
614
|
500
|
500
|
|||||||||
|
|
||||||||||||
|
Total expense
|
$
|
614
|
$
|
828
|
$
|
795
|
||||||
Life insurance contracts with a cash surrender value of $33,829 and annuity assets of $2,170 at December 31, 2020 have been purchased by the Company, the owner of the policies. The purpose of these
contracts was to replace a current group life insurance program for executive officers, implement a deferred compensation plan for directors and executive officers, implement a director retirement plan and implement supplemental retirement plans for
certain officers. Under the deferred compensation plan, Ohio Valley pays each participant the amount of fees deferred plus interest over the participant’s desired term, upon termination of service. Under the director retirement plan, participants are
eligible to receive ongoing compensation payments upon retirement subject to length of service. The supplemental retirement plans provide payments to select executive officers upon retirement based upon a compensation formula determined by Ohio
Valley’s Board of Directors. The present value of payments expected to be provided are accrued during the service period of the covered individuals and amounted to $8,377 and $7,815 at December 31, 2020 and 2019. Expenses related to the plans for each
of the last three years amounted to $743, $627, and $602. In association with the split-dollar life insurance plan, the present value of the postretirement benefit totaled $3,721 at December 31, 2020 and $3,130 at December 31, 2019.
Note O - Fair Value of Financial Instruments
Fair value is the exchange price that would be received for an asset or paid to transfer a liability (exit price) in the principal or most advantageous market for the asset or liability in an orderly
transaction between market participants on the measurement date. There are three levels of inputs that may be used to measure fair values:
Level 1: Quoted prices (unadjusted) for identical assets or liabilities in active markets that the entity has the ability to access as of the measurement date.
Level 2: Significant other observable inputs other than Level 1 prices, such as quoted prices for similar assets or liabilities, quoted prices in markets that are not active, or
other inputs that are observable or can be corroborated by observable market data.
Level 3: Significant unobservable inputs that reflect a company’s own assumptions about the assumptions that market participants would use in pricing an asset or liability.
NOTES TO THE CONSOLIDATED FINANCIAL STATEMENTS
Note O - Fair Value of Financial Instruments (continued)
The following is a description of the Company’s valuation methodologies used to measure and disclose the fair values of its financial assets and liabilities on a recurring or nonrecurring basis:
Securities: The fair values for securities are determined by quoted market prices, if available (Level 1). For securities where quoted prices are not available, fair values are
calculated based on market prices of similar securities (Level 2). For securities where quoted prices or market prices of similar securities are not available, fair values are calculated using discounted cash flows or other market indicators (Level 3).
During times when trading is more liquid, broker quotes are used (if available) to validate the model. Rating agency and industry research reports as well as defaults and deferrals on individual securities are reviewed and incorporated into the
calculations.
Impaired Loans: At the time a loan is considered impaired, it is valued at the lower of cost or fair value. Impaired loans carried at fair value generally receive specific
allocations of the allowance for loan losses. For collateral dependent loans, fair value is commonly based on recent real estate appraisals. These appraisals may utilize a single valuation approach or a combination of approaches including comparable
sales and the income approach. Adjustments are routinely made in the appraisal process by the independent appraisers to adjust for differences between the comparable sales and income data available. Such adjustments are usually significant and
typically result in a Level 3 classification of the inputs for determining fair value. Non-real estate collateral may be valued using an appraisal, net book value per the borrower’s financial statements, or aging reports, adjusted or discounted based
on management’s historical knowledge, changes in market conditions from the time of the valuation, and management’s expertise and knowledge of the client and client’s business, resulting in a Level 3 fair value classification. In some instances, fair
value adjustments can be made based on a quoted price from an observable input, such as a purchase agreement. Such adjustments would be classified as a Level 2 classification. Impaired loans are evaluated on a quarterly basis for additional impairment
and adjusted accordingly.
Other Real Estate Owned: Assets acquired through or instead of loan foreclosure are initially recorded at fair value less costs to sell when acquired, establishing a new cost
basis. These assets are subsequently accounted for at lower of cost or fair value less estimated costs to sell. Fair value is commonly based on recent real estate appraisals. These appraisals may utilize a single valuation approach or a combination of
approaches including comparable sales and the income approach. Adjustments are routinely made in the appraisal process by the independent appraisers to adjust for differences between the comparable sales and income data available. Such adjustments are
usually significant and typically result in a Level 3 classification of the inputs for determining fair value. In some instances, fair value adjustments can be made based on a quoted price from an observable input, such as a purchase agreement. Such
adjustments would be classified as a Level 2 classification.
Appraisals for both collateral-dependent impaired loans and other real estate owned are performed by certified general appraisers (for commercial properties) or certified residential appraisers (for
residential properties) whose qualifications and licenses have been reviewed and verified by the Company. Once received, a member of management reviews the assumptions and approaches utilized in the appraisal as well as the overall resulting fair value
in comparison with management’s own assumptions of fair value based on factors that include recent market data or industry-wide statistics. On an as-needed basis, the Company reviews the fair value of collateral, taking into consideration current
market data, as well as all selling costs that typically approximate 10%.
Interest Rate Swap Agreements: The fair value of interest rate swap agreements is determined using the market standard methodology of netting the discounted
future fixed cash payments (or receipts) and the discounted expected variable cash receipts (or payments). The variable cash receipts (or payments) are based on the expectation of future interest rates (forward curves) derived from observed market
interest rate curves (Level 2).
NOTES TO THE CONSOLIDATED FINANCIAL STATEMENTS
Note O - Fair Value of Financial Instruments (continued)
Assets and Liabilities Measured on a Recurring Basis
Assets and liabilities measured at fair value on a recurring basis are summarized below:
|
|
Fair Value Measurements at December 31, 2020, Using
|
|||||||||||
|
|
Quoted Prices in
Active Markets
for Identical
Assets
(Level 1)
|
Significant Other
Observable
Inputs
(Level 2)
|
Significant
Unobservable
Inputs
(Level 3)
|
|||||||||
|
Assets:
|
||||||||||||
|
U.S. Government sponsored entity securities
|
----
|
$
|
18,153
|
----
|
||||||||
|
Agency mortgage-backed securities, residential
|
----
|
94,169
|
----
|
|||||||||
|
Interest rate swap derivatives
|
----
|
928
|
----
|
|||||||||
|
Liabilities:
|
||||||||||||
|
Interest rate swap derivatives
|
----
|
(928
|
)
|
----
|
||||||||
|
|
Fair Value Measurements at December 31, 2019, Using
|
|||||||||||
|
|
Quoted Prices in
Active Markets
for Identical
Assets
(Level 1)
|
Significant Other
Observable
Inputs
(Level 2)
|
Significant
Unobservable
Inputs
(Level 3)
|
|||||||||
|
Assets:
|
||||||||||||
|
U.S. Government sponsored entity securities
|
----
|
$
|
16,736
|
----
|
||||||||
|
Agency mortgage-backed securities, residential
|
----
|
88,582
|
----
|
|||||||||
|
Interest rate swap derivatives
|
----
|
465
|
----
|
|||||||||
|
Liabilities:
|
||||||||||||
|
Interest rate swap derivatives
|
----
|
(465
|
)
|
----
|
||||||||
Assets and Liabilities Measured on a Nonrecurring Basis
There were no assets or liabilities measured at fair value on a nonrecurring basis at December 31, 2020. Assets and liabilities measured at fair value on a nonrecurring basis at December 31, 2019 are summarized below:
|
|
Fair Value Measurements at December 31, 2019, Using
|
|||||||||||
|
|
Quoted Prices in
Active Markets
for Identical
Assets
(Level 1)
|
Significant Other
Observable
Inputs
(Level 2)
|
Significant
Unobservable
Inputs
(Level 3)
|
|||||||||
|
Assets:
|
||||||||||||
|
Impaired loans:
|
||||||||||||
|
Commercial real estate:
|
||||||||||||
|
Nonowner-occupied
|
$
|
----
|
$
|
----
|
$
|
1,644
|
||||||
|
Commercial and Industrial
|
----
|
----
|
4,559
|
|||||||||
At December 31, 2020, the Company had no recorded investment of impaired loans measured for impairment using the fair value of collateral for collateral-dependent loans and, therefore, recorded no
impact to provision expense during the year ended December 31, 2020. At December 31, 2019, the recorded investment of impaired loans measured for impairment using the fair value of collateral for collateral-dependent loans totaled $7,010, with a
corresponding valuation allowance of $807, resulting in an increase of $807 in provision expense during the year ended December 31, 2019, with no corresponding charge-offs recognized.
There was no other real estate owned that was measured at fair value less costs to sell at December 31, 2020 and 2019. Furthermore, there were no corresponding write-downs during the years ended
December 31, 2020 and 2019.
NOTES TO THE CONSOLIDATED FINANCIAL STATEMENTS
Note O - Fair Value of Financial Instruments (continued)
The following table presents quantitative information about Level 3 fair value measurements for financial instruments measured at fair value on a non-recurring basis at December 31, 2019:
|
December 31, 2019
|
Fair Value
|
Valuation
Technique(s)
|
Unobservable
Input(s)
|
Range
|
(Weighted
Average)
|
||||||||
|
Impaired loans:
|
|||||||||||||
|
Commercial real estate:
|
|||||||||||||
|
Owner-occupied
|
$
|
1,644
|
Sales approach
|
Adjustment to comparables
|
0% to 20%
|
9.7%
|
|
||||||
|
Commercial and Industrial
|
4,559
|
Sales approach
|
Adjustment to comparables
|
0% to 61%
|
10.3%
|
|
|||||||
The carrying amounts and estimated fair values of financial instruments at December 31, 2020 and December 31, 2019 are as follows:
|
|
Fair Value Measurements at December 31, 2020 Using:
|
|||||||||||||||||||
|
|
Carrying
Value
|
Level 1
|
Level 2
|
Level 3
|
Total
|
|||||||||||||||
|
Financial Assets:
|
||||||||||||||||||||
|
Cash and cash equivalents
|
$
|
138,303
|
$
|
138,303
|
$
|
----
|
$
|
----
|
$
|
138,303
|
||||||||||
|
Certificates of deposit in financial institutions
|
2,500
|
----
|
2,500
|
----
|
2,500
|
|||||||||||||||
|
Securities available for sale
|
112,322
|
----
|
112,322
|
----
|
112,322
|
|||||||||||||||
|
Securities held to maturity
|
10,020
|
----
|
4,989
|
5,355
|
10,344
|
|||||||||||||||
|
Loans, net
|
841,504
|
----
|
----
|
837,387
|
837,387
|
|||||||||||||||
|
Interest rate swap derivatives
|
928
|
----
|
928
|
----
|
928
|
|||||||||||||||
|
Accrued interest receivable
|
3,319
|
----
|
283
|
3,036
|
3,319
|
|||||||||||||||
|
|
||||||||||||||||||||
|
Financial Liabilities:
|
||||||||||||||||||||
|
Deposits
|
993,739
|
314,777
|
680,904
|
----
|
995,681
|
|||||||||||||||
|
Other borrowed funds
|
27,863
|
----
|
29,807
|
----
|
29,807
|
|||||||||||||||
|
Subordinated debentures
|
8,500
|
----
|
5,556
|
----
|
5,556
|
|||||||||||||||
|
Interest rate swap derivatives
|
928
|
----
|
928
|
----
|
928
|
|||||||||||||||
|
Accrued interest payable
|
1,100
|
1
|
1,099
|
----
|
1,100
|
|||||||||||||||
|
|
Fair Value Measurements at December 31, 2019 Using:
|
|||||||||||||||||||
|
|
Carrying
Value
|
Level 1
|
Level 2
|
Level 3
|
Total
|
|||||||||||||||
|
Financial Assets:
|
||||||||||||||||||||
|
Cash and cash equivalents
|
$
|
52,356
|
$
|
52,356
|
$
|
----
|
$
|
----
|
$
|
52,356
|
||||||||||
|
Certificates of deposit in financial institutions
|
2,360
|
----
|
2,360
|
----
|
2,360
|
|||||||||||||||
|
Securities available for sale
|
105,318
|
----
|
105,318
|
----
|
105,318
|
|||||||||||||||
|
Securities held to maturity
|
12,033
|
----
|
6,446
|
5,958
|
12,404
|
|||||||||||||||
|
Loans, net
|
766,502
|
----
|
----
|
771,285
|
771,285
|
|||||||||||||||
|
Interest rate swap derivatives
|
465
|
----
|
465
|
----
|
465
|
|||||||||||||||
|
Accrued interest receivable
|
2,564
|
----
|
315
|
2,249
|
2,564
|
|||||||||||||||
|
|
||||||||||||||||||||
|
Financial Liabilities:
|
||||||||||||||||||||
|
Deposits
|
821,471
|
222,607
|
599,937
|
----
|
822,544
|
|||||||||||||||
|
Other borrowed funds
|
33,991
|
----
|
34,345
|
----
|
34,345
|
|||||||||||||||
|
Subordinated debentures
|
8,500
|
----
|
6,275
|
----
|
6,275
|
|||||||||||||||
|
Interest rate swap derivatives
|
465
|
----
|
465
|
----
|
465
|
|||||||||||||||
|
Accrued interest payable
|
1,589
|
3
|
1,586
|
----
|
1,589
|
|||||||||||||||
Fair value estimates are made at a specific point in time, based on relevant market information and information about the financial instrument. These estimates do not reflect any premium or discount
that could result from offering for sale at one time the Company’s entire holdings of a particular financial instrument. Because no market exists for a significant portion of the Company’s financial instruments, fair value estimates are based on
judgments regarding future expected loss experience, current economic conditions, risk characteristics of various financial instruments and other factors. These estimates are subjective in nature and involve uncertainties and matters of significant
judgment and therefore cannot be determined with precision. Changes in assumptions could significantly affect the estimates.
NOTES TO THE CONSOLIDATED FINANCIAL STATEMENTS
Note P - Regulatory Matters
Banks and bank holding companies are subject to regulatory capital requirements administered by federal banking agencies. Capital adequacy guidelines and, additionally for banks, prompt corrective
action regulations, involve quantitative measures of assets, liabilities, and certain off-balance-sheet items calculated under regulatory accounting practices. Capital amounts and classifications are also subject to qualitative judgements by
regulators. Failure to meet capital requirements can initiate regulatory action. The net unrealized gain or loss on available for sale securities is not included in computing regulatory capital. Management believes as of December 31, 2020, the Company
and Bank met all capital adequacy requirements to which they are subject.
Prompt corrective action regulations applicable to insured depository institutions provide five classifications: well capitalized, adequately capitalized, undercapitalized, significantly
undercapitalized, and critically undercapitalized, although these terms are not used to represent overall financial condition. If adequately capitalized, regulatory approval is required to accept brokered deposits. If undercapitalized, capital
distributions are limited, as is asset growth and expansion, and capital restoration plans are required. At year-end 2020 and 2019, the Bank met the capital requirements to be deemed well capitalized under the regulatory framework for prompt corrective
action. There are no conditions or events since year-end 2020 and 2019 that management believes have changed the institution's well capitalized category.
In 2019, the federal banking agencies jointly issued a final rule that provides for an optional, simplified measure of capital adequacy, the community bank leverage ratio ("CBLR") framework, for
qualifying community banking organizations (banks and holding companies), consistent with Section 201 of the Economic Growth, Regulatory Relief, and Consumer Protection Act. The final rule became effective on January 1, 2020 and was elected by the Bank
as of March 31, 2020. In April 2020, the federal banking agencies issued an interim final rule that makes temporary changes to the CBLR framework, pursuant to Section 4012 of the Coronavirus Aid, Relief, and Economic Security CARES Act, and a second
interim final rule that provides a graduated increase in the CBLR requirement after the expiration of the temporary changes implemented pursuant to Section 4012 of the CARES Act.
The CBLR removes the requirement for qualifying banking organizations to calculate and report risk-based capital but rather only requires a Tier 1 to average assets ("leverage") ratio. Qualifying
banking organizations that elect to use the CBLR framework and that maintain a leverage ratio of greater than required minimums will be considered to have satisfied the generally applicable risk based and leverage capital requirements in the agencies'
capital rules and, if applicable, will be considered to have met the well capitalized ratio requirements for purposes of Section 38 of the Federal Deposit Insurance Act. Under the interim final rules, the CBLR minimum requirement is 8% as of December
31, 2020, 8.5% for calendar year 2021, and 9% for calendar year 2022 and beyond. The interim rule allows for a two-quarter grace period to correct a ratio that falls below the required amount, provided that the Bank maintains a leverage ratio of 7% as
of December 31, 2020, 7.5% for calendar year 2021, and 8% for calendar year 2022 and beyond.
Under the final rule, an eligible banking organization can opt out of the CBLR framework and revert back to the risk-weighting framework without restriction. As of December 31, 2020, both the Company
and the Bank were qualifying community banking organizations as defined by the federal banking agencies and elected to measure capital adequacy under the CBLR framework.
The following tables summarize the actual and required capital amounts of the Company and the Bank as of year-end.
|
Actual
|
To Be Well Capitalized
Under Prompt Corrective
Action Regulations
|
|||||||||||||||
|
2020
|
Amount
|
Ratio
|
Amount
|
Ratio
|
||||||||||||
|
Tier 1 capital (to average assets)
|
||||||||||||||||
|
Consolidated
|
$
|
134,957
|
11.7%
|
|
$
|
91,937
|
8.0%
|
|
||||||||
|
Bank
|
120,989
|
10.7
|
|
90,407
|
8.0
|
|||||||||||
NOTES TO THE CONSOLIDATED FINANCIAL STATEMENTS
Note P – Regulatory Matters (continued)
|
Actual
|
Minimum Regulatory
|
Minimum
To Be Well
|
||||||||||||||
|
2019
|
Amount
|
Ratio
|
Capital Ratio (2)
|
Capitalized (1)
|
||||||||||||
|
Total capital (to risk weighted assets)
|
||||||||||||||||
|
Consolidated
|
$
|
134,930
|
18.7%
|
|
8.0%
|
|
10.0%
|
|
||||||||
|
Bank
|
120,716
|
17.0
|
8.0
|
10.0
|
||||||||||||
|
Common equity Tier 1 capital (to risk weighted assets)
|
||||||||||||||||
|
Consolidated
|
120,158
|
16.6
|
4.5
|
N/A
|
||||||||||||
|
Bank
|
114,772
|
16.1
|
4.5
|
6.5
|
||||||||||||
|
Tier 1 capital (to risk weighted assets)
|
||||||||||||||||
|
Consolidated
|
128,658
|
17.8
|
6.0
|
6.0
|
||||||||||||
|
Bank
|
114,772
|
16.1
|
6.0
|
8.0
|
||||||||||||
|
Tier 1 capital (to average assets)
|
||||||||||||||||
|
Consolidated
|
128,658
|
12.5
|
4.0
|
N/A
|
||||||||||||
|
Bank
|
114,772
|
11.3
|
4.0
|
5.0
|
||||||||||||
|
(1)
|
For the Company, these amounts would be required for the Company to engage in activities permissible only for a bank holding company that meets the
financial holding company requirements if the Company were not subject to the SBHCP. For the Bank, these are the amounts required for the Bank to be deemed well capitalized under the prompt corrective action regulations.
|
|
(2)
|
Excludes capital conservation buffer of 2.50%.
|
Dividends paid by the subsidiaries are the primary source of funds available to Ohio Valley for payment of dividends to shareholders and for other working capital needs. The payment of dividends by the
subsidiaries to Ohio Valley is subject to restrictions by regulatory authorities and state law. These restrictions generally limit dividends to the current and prior two years retained earnings of the Bank and Loan Central, Inc., and 90% of the prior
year’s net income of OVBC Captive, Inc. At January 1, 2021 approximately $13,465 of the subsidiaries’ retained earnings were available for dividends under these guidelines. In addition to these restrictions, dividend payments cannot reduce regulatory
capital levels below minimum regulatory guidelines. The amount of dividends payable by the Bank is also restricted if the Bank does not hold a capital conservation buffer. The ability of Ohio Valley to borrow funds from the Bank is limited as to amount
and terms by banking regulations. The Board of Governors of the Federal Reserve System also has a policy requiring Ohio Valley to provide notice to the FRB in advance of the payment of a dividend to Ohio Valley’s shareholders under certain
circumstances, and the FRB may disapprove of such dividend payment if the FRB determines the payment would be an unsafe or unsound practice.
Note Q - Parent Company Only Condensed Financial Information
Below is condensed financial information of Ohio Valley. In this information, Ohio Valley’s investment in its subsidiaries is stated at cost plus equity in undistributed earnings of the subsidiaries
since acquisition. This information should be read in conjunction with the consolidated financial statements of the Company.
CONDENSED STATEMENTS OF CONDITION
|
|
Years ended December 31:
|
|||||||
|
Assets
|
2020
|
2019
|
||||||
|
Cash and cash equivalents
|
$
|
4,112
|
$
|
4,308
|
||||
|
Investment in subsidiaries
|
143,424
|
134,910
|
||||||
|
Notes receivable – subsidiaries
|
1,603
|
1,963
|
||||||
|
Other assets
|
32
|
48
|
||||||
|
Total assets
|
$
|
149,171
|
$
|
141,229
|
||||
|
|
||||||||
|
Liabilities
|
||||||||
|
Notes payable
|
$
|
3,198
|
$
|
4,233
|
||||
|
Subordinated debentures
|
8,500
|
8,500
|
||||||
|
Other liabilities
|
1,149
|
317
|
||||||
|
Total liabilities
|
12,847
|
13,050
|
||||||
|
|
||||||||
|
Shareholders’ Equity
|
||||||||
|
Total shareholders’ equity
|
136,324
|
128,179
|
||||||
|
Total liabilities and shareholders’ equity
|
$
|
149,171
|
$
|
141,229
|
||||
NOTES TO THE CONSOLIDATED FINANCIAL STATEMENTS
Note Q - Parent Company Only Condensed Financial Information (continued)
CONDENSED STATEMENTS OF INCOME
|
|
Years ended December 31:
|
|||||||||||
|
Income:
|
2020
|
2019
|
2018
|
|||||||||
|
Interest on notes
|
$
|
41
|
$
|
47
|
$
|
53
|
||||||
|
Dividends from subsidiaries
|
4,125
|
4,375
|
4,225
|
|||||||||
|
Expenses:
|
||||||||||||
|
Interest on notes
|
82
|
139
|
185
|
|||||||||
|
Interest on subordinated debentures
|
208
|
356
|
330
|
|||||||||
|
Operating expenses
|
344
|
377
|
351
|
|||||||||
|
Income before income taxes and equity in undistributed earnings of subsidiaries
|
3,532
|
3,550
|
3,412
|
|||||||||
|
Income tax benefit
|
121
|
169
|
164
|
|||||||||
|
Equity in undistributed earnings of subsidiaries
|
6,606
|
6,188
|
8,368
|
|||||||||
|
Net Income
|
$
|
10,259
|
$
|
9,907
|
$
|
11,944
|
||||||
|
Comprehensive Income
|
$
|
12,167
|
$
|
12,570
|
$
|
10,860
|
||||||
CONDENSED STATEMENTS OF CASH FLOWS
|
|
Years ended December 31:
|
|||||||||||
|
Cash flows from operating activities:
|
2020
|
2019
|
2018
|
|||||||||
|
Net Income
|
$
|
10,259
|
$
|
9,907
|
$
|
11,944
|
||||||
|
Adjustments to reconcile net income to net cash provided by operating activities:
|
||||||||||||
|
Equity in undistributed earnings of subsidiaries
|
(6,606
|
)
|
(6,188
|
)
|
(8,368
|
)
|
||||||
|
Common stock issued to ESOP
|
----
|
328
|
295
|
|||||||||
|
Change in other assets
|
16
|
45
|
(26
|
)
|
||||||||
|
Change in other liabilities
|
832
|
(214
|
)
|
262
|
||||||||
|
Net cash provided by operating activities
|
4,501
|
3,878
|
4,107
|
|||||||||
|
|
||||||||||||
|
Cash flows from investing activities:
|
||||||||||||
|
Change in notes receivable
|
360
|
1,037
|
320
|
|||||||||
|
Net cash provided by investing activities
|
360
|
1,037
|
320
|
|||||||||
|
Cash flows from financing activities:
|
||||||||||||
|
Change in notes payable
|
(1,035
|
)
|
(2,046
|
)
|
(1,045
|
)
|
||||||
|
Proceeds from common stock through dividend reinvestment
|
----
|
1,407
|
1,325
|
|||||||||
|
Cash dividends paid
|
(4,022
|
)
|
(4,000
|
)
|
(3,967
|
)
|
||||||
|
Net cash used in financing activities
|
(5,057
|
)
|
(4,639
|
)
|
(3,687
|
)
|
||||||
|
Cash and cash equivalents:
|
||||||||||||
|
Change in cash and cash equivalents
|
(196
|
)
|
276
|
740
|
||||||||
|
Cash and cash equivalents at beginning of year
|
4,308
|
4,032
|
3,292
|
|||||||||
|
Cash and cash equivalents at end of year
|
$
|
4,112
|
$
|
4,308
|
$
|
4,032
|
||||||
NOTES TO THE CONSOLIDATED FINANCIAL STATEMENTS
Note R - Segment Information
The reportable segments are determined by the products and services offered, primarily distinguished between banking and consumer finance. They are also distinguished by the level of information
provided to the chief operating decision maker, who uses such information to review performance of various components of the business which are then aggregated if operating performance, products/services, and customers are similar. Loans, investments,
and deposits provide the majority of the net revenues from the banking operation, while loans provide the majority of the net revenues for the consumer finance segment. All Company segments are domestic.
Total revenues from the banking segment, which accounted for the majority of the Company’s total revenues, totaled 94.3%, 94.2%, and 92.9% of total consolidated revenues for the years ended December
31, 2020, 2019 and 2018, respectively.
The accounting policies used for the Company’s reportable segments are the same as those described in Note A - Summary of Significant Accounting Policies. Income taxes are allocated based on income
before tax expense. All goodwill is in the Banking segment.
Segment information is as follows:
|
|
Year Ended December 31, 2020
|
|||||||||||
|
|
Banking
|
Consumer Finance
|
Total Company
|
|||||||||
|
Net interest income
|
$
|
37,825
|
$
|
2,157
|
$
|
39,982
|
||||||
|
Provision expense
|
2,945
|
35
|
2,980
|
|||||||||
|
Noninterest income
|
10,344
|
1,094
|
11,438
|
|||||||||
|
Noninterest expense
|
33,693
|
2,440
|
36,133
|
|||||||||
|
Tax expense
|
1,886
|
162
|
2,048
|
|||||||||
|
Net income
|
9,645
|
614
|
10,259
|
|||||||||
|
Assets
|
1,173,820
|
13,112
|
1,186,932
|
|||||||||
|
|
Year Ended December 31, 2019
|
|||||||||||
|
|
Banking
|
Consumer Finance
|
Total Company
|
|||||||||
|
Net interest income
|
$
|
39,865
|
$
|
3,187
|
$
|
43,052
|
||||||
|
Provision expense
|
875
|
125
|
1,000
|
|||||||||
|
Noninterest income
|
8,989
|
177
|
9,166
|
|||||||||
|
Noninterest expense
|
37,026
|
2,472
|
39,498
|
|||||||||
|
Tax expense
|
1,653
|
160
|
1,813
|
|||||||||
|
Net income
|
9,300
|
607
|
9,907
|
|||||||||
|
Assets
|
1,000,315
|
12,957
|
1,013,272
|
|||||||||
|
|
Year Ended December 31, 2018
|
|||||||||||
|
|
Banking
|
Consumer Finance
|
Total Company
|
|||||||||
|
Net interest income
|
$
|
40,380
|
$
|
3,346
|
$
|
43,726
|
||||||
|
Provision expense
|
850
|
189
|
1,039
|
|||||||||
|
Noninterest income
|
8,243
|
695
|
8,938
|
|||||||||
|
Noninterest expense
|
34,841
|
2,585
|
37,426
|
|||||||||
|
Tax expense
|
1,990
|
265
|
2,255
|
|||||||||
|
Net income
|
10,942
|
1,002
|
11,944
|
|||||||||
|
Assets
|
1,017,902
|
12,591
|
1,030,493
|
|||||||||
NOTES TO THE CONSOLIDATED FINANCIAL STATEMENTS
Note S - Consolidated Quarterly Financial Information (unaudited)
|
Quarters Ended
|
||||||||||||||||
|
Mar. 31
|
Jun. 30
|
Sept. 30
|
Dec. 31
|
|||||||||||||
|
2020
|
||||||||||||||||
|
Total interest income
|
$
|
11,785
|
$
|
11,399
|
$
|
11,574
|
$
|
11,415
|
||||||||
|
Total interest expense
|
1,781
|
1,604
|
1,492
|
1,314
|
||||||||||||
|
Net interest income
|
10,004
|
9,795
|
10,082
|
10,101
|
||||||||||||
|
Provision for loan losses
|
3,846
|
(393
|
)
|
(2
|
)
|
(471
|
)
|
|||||||||
|
Noninterest income
|
4,442
|
2,249
|
2,434
|
2,313
|
||||||||||||
|
Noninterest expense
|
9,519
|
9,602
|
9,891
|
7,121
|
||||||||||||
|
Net income
|
1,002
|
2,263
|
2,294
|
4,700
|
||||||||||||
|
|
||||||||||||||||
|
Earnings per share
|
$
|
0.21
|
$
|
0.47
|
$
|
0.48
|
$
|
0.98
|
||||||||
|
|
||||||||||||||||
|
2019
|
||||||||||||||||
|
Total interest income
|
$
|
13,058
|
$
|
12,483
|
$
|
12,521
|
$
|
12,255
|
||||||||
|
Total interest expense
|
1,671
|
1,830
|
1,895
|
1,869
|
||||||||||||
|
Net interest income
|
11,387
|
10,653
|
10,626
|
10,386
|
||||||||||||
|
Provision for loan losses
|
2,377
|
(806
|
)
|
444
|
(1,015
|
)
|
||||||||||
|
Noninterest income
|
1,846
|
2,003
|
2,107
|
3,210
|
||||||||||||
|
Noninterest expense
|
9,568
|
9,791
|
9,738
|
10,401
|
||||||||||||
|
Net income
|
1,193
|
3,079
|
2,137
|
3,498
|
||||||||||||
|
|
||||||||||||||||
|
Earnings per share
|
$
|
0.25
|
$
|
0.65
|
$
|
0.45
|
$
|
0.73
|
||||||||
REPORT OF INDEPENDENT REGISTERED
PUBLIC ACCOUNTING FIRM
To the Board of Directors and Shareholders
Ohio Valley Banc Corp.
Gallipolis, Ohio
Opinion on the Financial Statements
We have audited the accompanying consolidated statements of condition of Ohio Valley Banc Corp. (the "Company") as of December 31, 2020 and 2019, the
related consolidated statements of income, comprehensive income, changes in shareholders’ equity, and cash flows for each of the years in the three year period ended December 31, 2020, and the related notes (collectively referred to as the "financial
statements"). In our opinion, the financial statements referred to above present fairly, in all material respects, the financial position of the Company as of December 31, 2020 and 2019, and the results of its operations and its cash flows for each
of the years in the three-year period ended December 31, 2020 in conformity with accounting principles generally accepted in the United States of America.
Basis for Opinion
These financial statements are the responsibility of the Company's management. Our responsibility is to express an opinion on the Company's financial
statements based on our audits. We are a public accounting firm registered with the PCAOB and are required to be independent with respect to the Company in accordance with the U.S. federal securities laws and the applicable rules and regulations of
the Securities and Exchange Commission and the PCAOB.
We conducted our audits in accordance with the standards of the PCAOB. Those standards require that we plan and perform the audit to obtain reasonable
assurance about whether the financial statements are free of material misstatement, whether due to error or fraud. The Company is not required to have, nor were we engaged to perform, an audit of its internal control over financial reporting. As part
of our audits we are required to obtain an understanding of internal control over financial reporting but not for the purpose of expressing an opinion on the effectiveness of the Company's internal control over financial reporting. Accordingly, we
express no such opinion.
Our audits included performing procedures to assess the risks of material misstatement of the financial statements, whether due to error or fraud, and
performing procedures that respond to those risks. Such procedures included examining, on a test basis, evidence regarding the amounts and disclosures in the financial statements. Our audits also included evaluating the accounting principles used and
significant estimates made by management, as well as evaluating the overall presentation of the financial statements. We believe that our audits provide a reasonable basis for our opinion.
Critical Audit Matter
The critical audit matter communicated below is a matter arising from the current period audit of the consolidated financial statements that was
communicated or required to be communicated to the audit committee and that: (1) relates to accounts or disclosures that are material to the consolidated financial statements and (2) involved our especially challenging, subjective, or complex
judgments. The communication of critical audit matters does not alter in any way our opinion on the consolidated financial statements, taken as a whole, and we are not, by communicating the critical audit matter below, providing a separate opinion
on the critical audit matter or on the accounts or disclosures to which it relates.
Allowance for Loan Losses – Qualitative Factors
As more fully described in Note A and Note C to the consolidated financial statements, the Company’s allowance for loan losses represents management’s best estimate of probable incurred
losses in the loan portfolio. For loans that are not specifically identified for impairment, management performs a quantitative and qualitative analysis to determine the general reserve portion of the allowance for loan losses. The quantitative
component consists of historical loss experience determined by portfolio segment and is based on the actual loss history experienced by the Company. Actual loss experience is supplemented with other economic factors based on the risks present for
each portfolio segment. These economic factors include consideration of the following: levels of and trends in delinquencies and impaired loans; levels of and trends in charge-offs and recoveries; trends in volume and terms of loans; effects of
any changes in risk selection and underwriting standards; other changes in lending policies, procedures, and practices; experience, ability, and depth of lending management and other relevant staff; national and local economic trends and
conditions; industry conditions; and effects of changes in credit concentrations. The Company analyzes loans individually with a higher credit risk rating and groups these loans into categories called “criticized” and ”classified” assets. Levels
of criticized and classified assets impact the qualitative reserve. Management exercised significant judgment when assessing these qualitative factors in estimating the allowance for loan losses.
REPORT OF INDEPENDENT REGISTERED
PUBLIC ACCOUNTING FIRM
We identified the qualitative factor component of the allowance for loan losses as a critical audit matter as auditing this component of the allowance for loan losses involved especially subjective
auditor judgment. The principal consideration for our determination of this matter as a critical audit matter is that adjustments for qualitative factors depend significantly on management’s judgment.
The primary audit procedures we performed to address this critical audit matter included the following:
|
•
|
Tested the operating effectiveness of controls over the Company’s loan grading
|
|
•
|
Performed testing over the completeness and accuracy of criticized and classified assets
|
|
•
|
Evaluated the relevance of management’s judgements, assumptions, and data used in the development of the qualitative factors
|
|
•
|
Evaluated management’s judgments and assumptions used to determine the qualitative adjustments for reasonableness, and the reliability of the underlying data on which these adjustments are based
|
|
•
|
Performed data validation of inputs and tested mathematical accuracy of management’s calculation
|
|
•
|
Performed substantive analytical procedures by analyzing underlying credit quality metrics of the loan portfolio and directional consistency of the allowance for loan losses balance and provision expense
|
|
/s/Crowe LLP
|
|
Crowe LLP
|
We have served as the Company’s auditor since 1992.
Louisville, Kentucky
March 24, 2021
MANAGEMENT'S REPORT ON INTERNAL CONTROL
OVER FINANCIAL REPORTING
Board of Directors and Shareholders
Ohio Valley Banc Corp.
The management of Ohio Valley Banc Corp. (the Company) is responsible for establishing and maintaining adequate internal control over financial reporting as defined in Rules 13a-15(f) and 15d-15(f) under the Securities
Exchange Act of 1934. The Company's internal control over financial reporting is designed to provide reasonable assurance regarding the reliability of financial reporting and the preparation of financial statements for external purposes in accordance
with generally accepted accounting principles. The Company's internal control over financial reporting includes those policies and procedures that: (i) pertain to the maintenance of records that, in reasonable detail, accurately and fairly reflect the
transactions and dispositions of the assets of the Company; (ii) provide reasonable assurance that transactions are recorded as necessary to permit preparation of financial statements in accordance with generally accepted accounting principles, and
that receipts and expenditures of the Company are being made only in accordance with authorizations of management and directors of the Company; and (iii) provide reasonable assurance regarding prevention or timely detection of unauthorized acquisition,
use or disposition of the Company's assets that could have a material effect on the financial statements.
The system of internal control over financial reporting as it relates to the consolidated financial statements is evaluated for effectiveness by management. Because of its inherent limitations, internal control over
financial reporting may not prevent or detect misstatements. Also, projections of any evaluation of effectiveness to future periods are subject to the risk that controls may become inadequate because of changes in conditions, or that the degree of
compliance with the policies or procedures may deteriorate.
Management assessed Ohio Valley Banc Corp.’s system of internal control over financial reporting as of December 31, 2020, in relation to criteria for effective internal control over financial reporting as described in
the 2013 “Internal Control Integrated Framework,” issued by the Committee of Sponsoring Organizations of the Treadway Commission (COSO). Based on this assessment, management concluded that, as of December 31, 2020, its system of internal control over
financial reporting is effective and meets the criteria of the “Internal Control Integrated Framework.”
Crowe LLP, independent registered public accounting firm, has not issued an integrated audit report on Ohio Valley Banc Corp.’s internal control over financial reporting.
Ohio Valley Banc Corp.
| /s/Thomas E. Wiseman |
/s/Scott W. Shockey |
|
Thomas E. Wiseman
Chief Executive Officer
|
Scott W. Shockey
Senior Vice President, CFO
|
|
March 24, 2021
|
PERFORMANCE GRAPH
OHIO VALLEY BANC CORP.
Year ended December 31, 2020
The following graph sets forth a comparison of five-year cumulative total returns among the Company's common shares (indicated “Ohio Valley Banc Corp.” on the Performance Graph), the S & P 500
Index (indicated “S & P 500” on the Performance Graph), and SNL Securities SNL $1 Billion-$5 Billion Bank Asset-Size Index (indicated “SNL $1 B-$5 B Bank Index”) for fiscal years indicated. Information reflected on the graph assumes an investment
of $100 on December 31, 2015, in the common shares of each of the Company, the S & P 500 Index, and the SNL $1B-$5B Bank Index. Cumulative total return assumes reinvestment of dividends. The SNL $1 B-$5 B Bank Index represents the stock performance
of 146 banks located throughout the United States, including the Company, within the respective asset range as selected by SNL Securities of Charlottesville, Virginia.
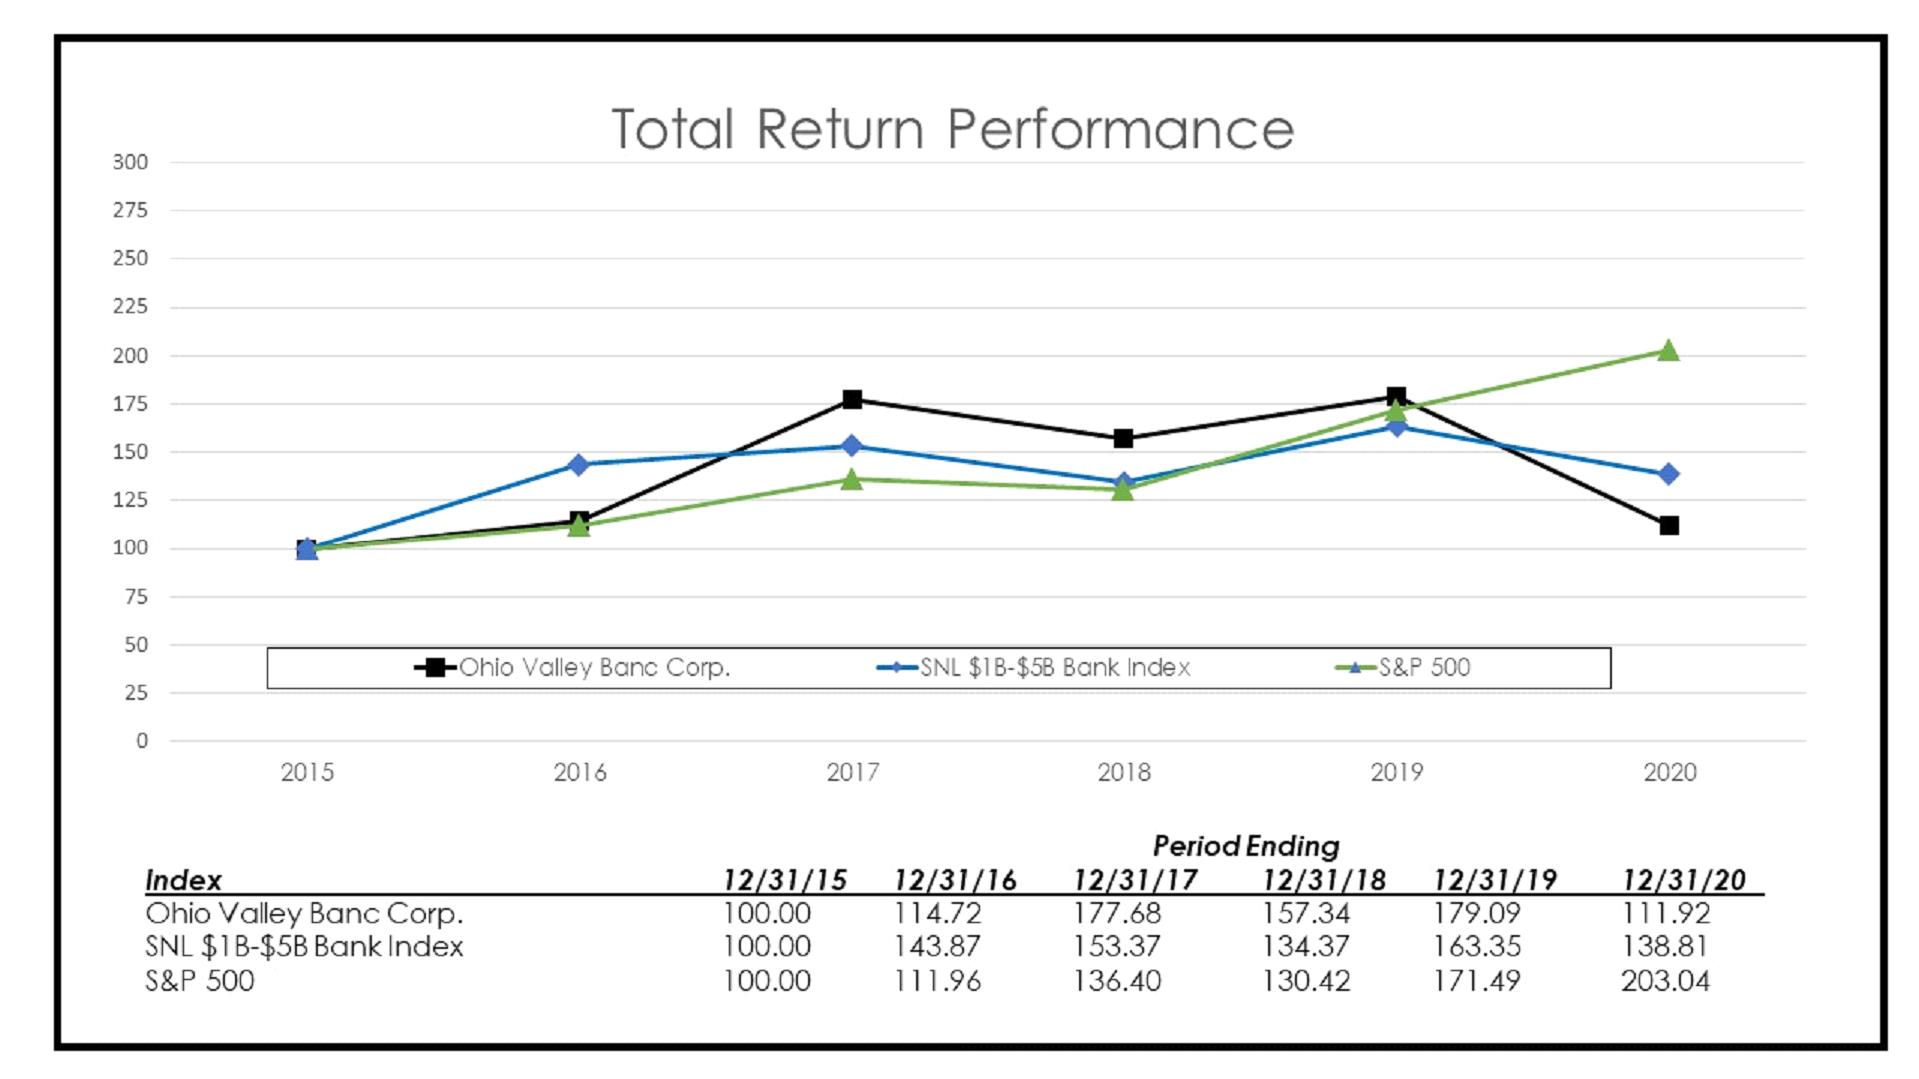
MANAGEMENT'S DISCUSSION AND ANALYSIS OF
FINANCIAL CONDITION AND RESULTS OF OPERATIONS
FORWARD LOOKING STATEMENTS
Certain statements contained in this report and other publicly available documents incorporated herein by reference constitute "forward looking statements" within the
meaning of Section 27A of the Securities Act of 1933, as amended, and Section 21E of the Securities Act of 1934, as amended (the “Exchange Act”), and as defined in the Private Securities Litigation Reform Act of 1995. Such statements are often, but
not always, identified by the use of such words as “believes,” “anticipates,” “expects,” “intends,” “plan,” “goal,” “seek,” “project,” “estimate,” “strategy,” “future,” “likely,” “may,” “should,” “will,” and other similar expressions. Such statements
involve various important assumptions, risks, uncertainties, and other factors, many of which are beyond our control, particularly with regard to developments related to the Coronavirus (“COVID-19”) pandemic, and which could cause actual results to
differ materially from those expressed in such forward looking statements. These factors include, but are not limited to: the effects of COVID-19 on our business, operations, customers and capital position; higher default rates on loans made to our
customers related to COVID-19 and its impact on our customers’ operations and financial condition; the impact of COVID-19 on local, national and global economic conditions; unexpected changes in interest rates or disruptions in the mortgage market
related to COVID-19; the effects of various governmental responses to COVID-19; political uncertainty caused by, among other things, political parties and tensions surrounding the current socioeconomic landscape; changes in political, economic or other
factors, such as inflation rates, recessionary or expansive trends, taxes, the effects of implementation of legislation and the continuing economic uncertainty in various parts of the world; competitive pressures; fluctuations in interest rates; the
level of defaults and prepayment on loans made by the Company; unanticipated litigation, claims, or assessments; fluctuations in the cost of obtaining funds to make loans; and regulatory changes. Additional detailed information concerning such factors
is available in the Company’s filings with the Securities and Exchange Commission, under the Exchange Act, including the disclosure under the heading “Item 1A. Risk Factors” of Part I of the Company’s Annual Report on Form 10-K for the fiscal year
ended December 31, 2020. Readers are cautioned not to place undue reliance on such forward looking statements, which speak only as of the date hereof. The Company undertakes no obligation and disclaims any intention to republish revised or updated
forward looking statements, whether as a result of new information, unanticipated future events or otherwise.
ANALYSIS OF FINANCIAL CONDITION AND RESULTS OF OPERATIONS
The purpose of this discussion is to provide an analysis of the financial condition and results of operations of Ohio Valley Banc Corp. (“Ohio Valley” or the “Company”)
that is not otherwise apparent from the audited consolidated financial statements included in this report. The accompanying consolidated financial information has been prepared by management in conformity with U.S. generally accepted accounting
principles (“US GAAP”) and is consistent with that reported in the consolidated financial statements. Reference should be made to those statements and the selected financial data presented elsewhere in this report for an understanding of the following
tables and related discussion. All dollars are reported in thousands, except share and per share data.
BUSINESS OVERVIEW:
The Company is primarily engaged in commercial and retail banking through its wholly-owned subsidiary, The Ohio Valley Bank Company (the “Bank”), offering a blend of commercial and
consumer banking services within southeastern Ohio, as well as western West Virginia. The banking services offered by the Bank include the acceptance of deposits in checking, savings, time and money market accounts; the making and servicing of
personal, commercial, floor plan and student loans; the making of construction and real estate loans; and credit card services. The Bank also offers individual retirement accounts, safe deposit boxes, wire transfers and other standard banking products
and services. Ohio Valley also has a subsidiary that engages in consumer lending generally to individuals with higher credit risk history, Loan Central, Inc. (“Loan Central”), a subsidiary insurance agency that facilitates the receipt of insurance
commissions, Ohio Valley Financial Services Agency, LLC, and a limited purpose property and casualty insurance company, OVBC Captive, Inc. (the “Captive”). The Bank has one wholly-owned subsidiary, Ohio Valley REO, LLC, to which the Bank transfers
certain real estate acquired by the Bank through foreclosure for sale.
MANAGEMENT'S DISCUSSION AND ANALYSIS OF
FINANCIAL CONDITION AND RESULTS OF OPERATIONS
In January 2020, the Bank began offering Tax Refund Advance Loans (“TALs”) to Loan Central tax customers. A TAL represents a short-term loan offered by the Bank to tax preparation
customers of Loan Central. Previously, Loan Central offered and originated tax refund anticipation loans that represented a large composition of its annual earnings. However, new Ohio laws that became effective in April 2019 placed numerous
restrictions on short-term and small loans extended by certain non-bank lenders in Ohio. As a result, Loan Central is no longer able to directly offer the service to its tax preparation customers, but it is able to do so through the Bank. After Loan
Central prepares a customer’s tax return, the customer is offered the opportunity to have immediate access to a portion of the anticipated tax refund by entering into a TAL with the Bank. As part of the process, the tax customer completes a loan
application and authorizes the expected tax refund to be deposited with the Bank once it is issued by the IRS. Once the Bank receives the tax refund, the refund is used to repay the TAL and Loan Central’s tax preparation fees, then the remainder of
the refund is remitted to Loan Central’s tax customer.
IMPACT of COVID-19:
COVID-19 has continued to cause significant disruption in the United States and international economies and financial markets. The primary markets served by the Company
in southeastern Ohio and western West Virginia have been significantly impacted by COVID-19, which has changed the way we live and work. The actions taken by the Governors of the States of Ohio and West Virginia beginning in March of 2020 were imposed
to mitigate the spread and lessen the public health impact of COVID-19. During this time, the Bank’s primary channels of serving our customers have primarily consisted of drive-thru, mobile, and online banking services and appointment-only lobby
services. We have leveraged our digital banking platform with our customers, and we have implemented company-wide remote working arrangements. Management will continue to closely monitor the impact of COVID-19 and will consider re-opening the lobbies
of all the Bank’s financial service centers when it is safe to do so.
On March 27, 2020, the Coronavirus Aid, Relief, and Economic Security Act ("CARES Act") was signed into law. The CARES Act provides assistance to small businesses
through the establishment of the Paycheck Protection Program ("PPP"). The PPP provides small businesses with funds to pay up to 8 weeks of payroll costs, including benefits. The funds are provided in the form of loans that will be fully forgiven when
used for payroll costs, interest on mortgages, rent, utilities, and certain other expenses. Forgiveness of the PPP loans is based on the employer maintaining or quickly rehiring employees and maintaining compensation levels. The Company continues to
support its clients who have experienced financial hardship due to COVID-19 through participation in the PPP, assistance with expedited deposits of CARES Act stimulus payments, and loan modifications, as needed.
MANAGEMENT'S DISCUSSION AND ANALYSIS OF
FINANCIAL CONDITION AND RESULTS OF OPERATIONS
RESULTS OF OPERATIONS:
SUMMARY
2020 v. 2019
Ohio Valley generated net income of $10,259 for 2020, an increase of $352, or 3.6%, from 2019. Earnings per share were $2.14 for 2020, an increase of 2.9% from 2019.
The increase in net income and earnings per share for 2020 was impacted by higher noninterest income and lower noninterest expense, which collectively contributed to a $5,637 increase in earnings from 2019. Noninterest income growth during 2020 came
mostly from proceeds of $2,000 received in a litigation settlement with a third-party. Further growth also came from higher tax preparation fees and mortgage banking income, partially offset by lower service charge fees and a net gain recorded from
the sale of two branches in 2019. Lower noninterest expense was impacted primarily by an 8.0% decrease in salaries and employee benefit costs and a 39.4% decrease in professional fees, while software and marketing expenses collectively decreased 18.8%
from 2019 to 2020. The positive effects from higher noninterest income and reduced overhead costs were partially offset by lower net interest income and higher provision expense during 2020, as compared to 2019. Net interest income was negatively
affected by a net interest margin compression in relation to decreases in market rates in response to COVID-19 that contributed to lower earning asset yields during 2020. Average earning assets increased by 5.4% and loan fees increased by 3.3% during
2020, which partially offset the negative effects from lower asset yields. The increase in provision expense in 2020 was primarily due to an increase in general reserves related to COVID-19.
The Company’s net interest income in 2020 was $39,982, representing a decrease of $3,070, or 7.1%, from 2019. Impacting net interest income was the decrease in net
interest margin in relation to the decrease in market rates. During the second half of 2019, the FRB reduced interest rates by 75 basis points, followed by another reduction of 150 basis points in March 2020 due to concerns about the impact of COVID-19
on the economy. Although the effects of lower market rates had reduced earning asset yields, the effects had not yet fully impacted the Company’s interest-bearing deposit costs, particularly time deposits. Furthermore, certain interest-bearing
deposits were already at or near their interest rate floors, which also limited the Company’s ability to reduce deposit costs to the same magnitude as earning assets during 2020. Due to this lagging effect of deposit cost reduction combined with a more
rate-sensitive earning asset portfolio, the Company’s net interest margin finished at 3.97% during the year ended December 31, 2020, a decrease of 54 basis points from the 4.51% net interest margin during the same period in 2019. Net interest income
was also affected by lower loan fees impacted by the change in the Company’s business model for Loan Central’s assessment of fees for TALs as described above. This resulted in an $853 decrease in loan fees during 2020, as compared to 2019. Loan
Central’s tax preparation fee income from TAL offerings during 2020 was recorded as noninterest income, as discussed below. Partially offsetting the negative impact from lower asset yields and fee revenue was growth in average earning assets, up
$51,919 during 2020, as compared to 2019. The growth came largely from the impact of $35,141 in PPP loans that were originated during 2020, contributing to higher commercial and industrial loans at December 31, 2020. Average earning asset growth also
came from the Company’s interest-bearing deposit account at the FRB, driven by heightened deposit balances received in relation to customers receiving stimulus funds from various government programs and their desire to preserve cash during this
uncertain economic environment.
The Company’s provision expense during 2020 totaled $2,980, an increase of $1,980 compared to 2019. The increase in provision expense was largely impacted by the
economic effects of COVID-19, which resulted in a higher general allocation of the allowance for loan losses. Based on declining economic conditions and increasing unemployment levels, management increased general reserves by $2,315 to reflect higher
anticipated losses due to COVID-19. The Company will continue to closely monitor COVID-19 and will make appropriate adjustments to the allowance for loan losses as needed.
MANAGEMENT'S DISCUSSION AND ANALYSIS OF
FINANCIAL CONDITION AND RESULTS OF OPERATIONS
The Company’s noninterest income increased $2,272, or 24.8%, from 2019. The year-to-date increase in noninterest income was largely impacted by proceeds of $2,000
received in a litigation settlement with a third-party. The payment was paid to the Bank as part of a settlement agreement signed during the first quarter of 2020. The settlement agreement was related to the previously disclosed litigation the Bank
filed against a third-party tax software product provider for early termination of its tax processing contract. For the year ended December 31, 2020, mortgage banking income increased $944 over the same period in 2019. Mortgage banking income has
grown in response to the record low mortgage rates that have generated a significant volume of mortgages being refinanced in 2020. Further contributing to noninterest income growth was the Company’s change in its business model in 2020 from assessing
TAL fees to now assessing tax preparation fees in response to a state law enacted in 2019. This change resulted in $644 of tax preparation fee income to be recorded during the year ended December 31, 2020. Partially offsetting the increases from the
prior year was a net gain of $1,256 recorded on the sale of the Company’s Mount Sterling and New Holland, Ohio branches during the fourth quarter of 2019. Also having a negative impact on noninterest income was lower service charges on deposit
accounts, which decreased $433 in 2020 compared to 2019. This was primarily related to customers maintaining higher deposit balances due to various economic stimulus payments, which led to lower overdraft fees.
The Company’s noninterest expenses during 2020 decreased $3,365, or 8.5%, from 2019. This decrease was impacted by salary and employee benefit expense, which decreased
by $1,888, or 8.0%, during the year ended December 31, 2020, as compared to the same period in 2019. The decrease was largely the result of a voluntary severance package offered to select employees meeting certain criteria during the fourth quarter of
2019, which resulted in a one-time expense of $1,507. The Company realized additional savings in personnel expense during 2020 in connection with the voluntary early retirement program and the sale of the two branches during that same period. Lower
noninterest expense was also impacted by professional fees, which decreased $989 during 2020 as a result of lower legal fees associated with collecting troubled loans and litigation related to the terminated tax processing contract. The Company also
recognized less software expense in 2020, decreasing $251 from 2019, due to a transition from the use of various software platforms in 2019 that required an acceleration of expense on the remaining balance of those software assets being retired. The
Company’s marketing expenses also decreased by $228 during the year ended December 31, 2020, compared to the same period in 2019, in large part due to the pandemic environment that limited the use of promotional items and the ability to execute other
marketing strategies during 2020.
The Company’s provision for income taxes increased $235 during 2020, largely due to the changes in taxable income affected by the factors mentioned above.
2019 v. 2018
Ohio Valley generated net income of $9,907 in 2019, a decrease of $2,037, or 17.1%, from 2018. Earnings per share were $2.08 for 2019, a decrease of 17.8% from 2018.
The decrease in net income and earnings per share for 2019 was impacted by lower net interest income and higher noninterest expense, which collectively contributed to a $2,746 decrease in earnings from 2018. Net interest income was negatively affected
by a 3.2% decrease in average earning assets, primarily from lower interest-bearing deposits with banks. Further reducing net interest income was a deposit composition shift to higher costing time and money market deposits. Higher noninterest expense
was impacted primarily by a 6.0% increase in salaries and employee benefit costs and a 24.4% increase in professional fees. These negative impacts to earnings were partially offset by higher noninterest income and stable provision expense during 2019,
as compared to 2018. Noninterest income was positively impacted by a net gain from the sale of two branches during the fourth quarter of 2019 and lower losses on the sale of other real estate owned (“OREO”) properties, partially offset by lower tax
processing fees. The change in provision expense was minimal due to lower net charge-offs and lower criticized loans during 2019.
MANAGEMENT'S DISCUSSION AND ANALYSIS OF
FINANCIAL CONDITION AND RESULTS OF OPERATIONS
The Company’s net interest income in 2019 was $43,052, representing a decrease of $674, or 1.5%, from 2018. Average earning assets decreased during 2019 by $32,338, or
3.2%, as compared to 2018, coming primarily from interest-bearing balances with other banks. The Company’s average interest-bearing Federal Reserve clearing account balance decreased $36,528, or 39.0%, during 2019, mostly due to not processing tax
refunds in 2019. Prior to 2019, the Bank had facilitated the payment of tax refunds through a third-party tax refund product provider. In 2018, the third-party tax refund product provider elected to terminate its contract with the Bank early,
effectively ceasing the receipt of future tax refunds at the end of 2018. Due to the absence of seasonal deposits from no tax processing activity, the Bank experienced a significant decline in its average Federal Reserve balances during 2019, as
compared to 2018. In addition, the FRB’s action to decrease short-term interest rates by 75 basis points from August 2019 to October 2019 further limited interest earnings during the year. Net interest income was also negatively impacted by higher
interest expense on deposits, which increased over 32.0% during 2019. The interest expense increase was largely attributable to time deposits, particularly CDs, repricing at higher market rates, as well as a consumer shift to higher-costing money
market deposit accounts. The weighted average costs for time deposits and money market accounts increased 52 and 27 basis points in 2019 and 2018, respectively. Positive contributions to net interest income came primarily from the Company’s loans,
with asset yields increasing 16 basis points and average balances increasing $1,865, or 0.2%, during 2019, as compared to 2018. Average loan growth came mostly from the residential and commercial real estate loan portfolios. While earning assets were
down, the Company’s net interest margin increased in 2019, finishing at 4.51% in 2019, as compared to 4.43% in 2018. Lower balances maintained at the Federal Reserve, which diluted the net interest margin from the previous year due to the yield on
those balances being less than other earning assets, such as loans and securities, contributed the most to the increase in net interest margin.
The Company’s provision expense in 2019 remained comparable to that of 2018, finishing with $1,000 in 2019 compared to $1,039 in 2018. During 2019, the Company
experienced a decrease of $354 in net charge-offs, as well as the continuing trend of improved asset quality and economic risk factors, which were impacted by lower criticized assets and historical loan loss. As a result of this risk factor
improvement, the general allocations of the allowance for loan losses decreased by 17.8% from year-end 2018. The impact from lower general allocations was partially offset by an increase in specific allocations on collateral dependent impaired loans
from year-end 2018.
The Company’s noninterest income increased $228, or 2.6%, from 2018. The year-to-date increase in noninterest income was largely impacted by a net gain of $1,256 on the
sale of its Mount Sterling and New Holland, Ohio branches during the fourth quarter of 2019. Lower costs on the sale of OREO, which decreased by $494, or 88.4%, from 2018, also improved noninterest revenue. Lower OREO expense in 2019 was primarily
impacted by an asset write-down recorded during the fourth quarter of 2018 to lower the appraised value of one land development property. Noninterest revenue improvement in 2019 also came from interchange income growth, which increased 6.6% from 2018,
driven primarily by the rising volume of debit and credit card transactions during 2019. Partially offsetting these growth areas of noninterest income were lower revenues from tax processing fees, which decreased $1,574 from 2018 as a result of the
third-party tax refund product provider terminating its contract with the Bank.
MANAGEMENT'S DISCUSSION AND ANALYSIS OF
FINANCIAL CONDITION AND RESULTS OF OPERATIONS
The Company’s noninterest expenses during 2019 increased $2,072, or 5.5%, from 2018. This increase was impacted by salary and employee benefit expense, which grew
$1,333, or 6.0%, during 2019, as compared to 2018. The increase was largely the result of a voluntary severance package offered to select employees meeting certain criteria during the fourth quarter of 2019. Offering this severance package resulted
in a one-time expense of $1,507. Noninterest expense growth was also affected by a $492 increase in professional fees related to higher audit and litigation legal fees. Noninterest expense increases were partially offset by lower FDIC premium costs
associated with lower assessment rates and the receipt of a portion of the Bank’s premium credit granted by the FDIC during the second half of 2019.
The Company’s provision for income taxes decreased $442 during 2019, largely due to the changes in taxable income affected by the factors mentioned above.
NET INTEREST INCOME
The most significant portion of the Company's revenue, net interest income, results from properly managing the spread between interest income on earning assets and
interest expense incurred on interest-bearing liabilities. The Company earns interest and dividend income from loans, investment securities and short-term investments while incurring interest expense on interest-bearing deposits and short- and
long-term borrowings. Net interest income is affected by changes in both the average volume and mix of assets and liabilities and the level of interest rates for financial instruments. Changes in net interest income are measured by net interest
margin and net interest spread. Net interest margin is expressed as the percentage of net interest income to average interest-earning assets. Net interest spread is the difference between the average yield earned on interest-earning assets and the
average rate paid on interest-bearing liabilities. Both of these are reported on a fully tax-equivalent (“FTE”) basis. Net interest margin exceeds the net interest rate spread because noninterest-bearing sources of funds, principally
noninterest-bearing demand deposits and stockholders' equity, also support interest-earning assets. The following is a discussion of changes in interest-earning assets, interest-bearing liabilities and the associated impact on interest income and
interest expense for the three years ended December 31, 2020, 2019, and 2018. Tables I and II have been prepared to summarize the significant changes outlined in this analysis.
Net interest income in 2020 totaled $40,422 on an FTE basis, down $3,059, or 7.0%, from 2019. This negative change reflects the impact of a 54 basis point decrease in
earning asset yield, partially offset by a 5.4% increase in average earning assets and a 48 basis point decrease in average interest-bearing liability cost. The average earning asset yield was impacted by the FRB’s action to lower rates by 75 basis
points during the second half of 2019 and by 150 basis points in March 2020. The increase in average earning assets came mostly from interest-bearing balances with banks and loans, which increased 28.6% and 4.6% during 2020, respectively, as compared
to the same period in 2019. Market rate decreases during 2019 and 2020 had a corresponding impact to lower average deposit costs, primarily within time, savings and money market deposits. The net interest margin decrease of 54 basis points reflected a
20 basis point positive impact from lower funding costs that was completely offset by a 68 basis point negative impact from the mix and yield on earning assets and a 6 basis point negative impact from the use of noninterest-bearing funding (i.e.,
demand deposits and shareholders’ equity).
MANAGEMENT'S DISCUSSION AND ANALYSIS OF
FINANCIAL CONDITION AND RESULTS OF OPERATIONS
Net interest income decreased in 2020 primarily due to the decrease in average earning asset yield, partially offset by the increase in average volume of earning assets
plus the decrease in average cost of interest-bearing liabilities. The decrease in average earning asset yield was responsible for lowering FTE interest income by $6,418 during 2020 compared to 2019. This impact was partially offset by $2,285 in
additional FTE interest income from higher average earning assets, and a reduction in interest expense of $1,042 associated with the average cost decrease in average interest-bearing liabilities. The decline in average earning asset yields for 2020 was
partly impacted by interest-bearing balances with other banks. Balances within interest-bearing deposits with banks are driven primarily by the Company’s interest-bearing Federal Reserve clearing account. The rate cuts from the FRB in 2019 and 2020 had
an immediate effect on reducing the interest income generated by the Company’s Federal Reserve clearing account. Beginning in August 2019, the FRB reduced short-term interest rates by 25 basis points for three consecutive months, lowering the clearing
account interest rate to 1.75% at October 2019. In response to COVID-19, the FRB reduced rates again by 150 basis points in March 2020, which lowered the clearing account interest rate to 0.25%. As a result, the average yield factor on interest-bearing
balances with other banks had a negative impact on 2020’s earnings, decreasing interest income by $1,285 in 2020, as compared to growth in interest income of $325 during 2019. The average volume on interest-bearing balances with other banks contributed
to $287 in interest income growth during 2020, primarily from excess deposits within the Federal Reserve clearing account. The Company utilizes its interest-bearing Federal Reserve clearing account to manage excess funds, as well as to assist in
funding earning asset growth. Higher levels of excess funds within the clearing account were impacted by the pandemic environment of 2020, which included customer deposits of stimulus monies from various government relief programs. The volume increase
in the Bank’s Federal Reserve clearing account during 2020 led to a $17,415, or 28.6%, increase in average interest-bearing balances with other banks during 2020 compared to 2019, and also led to a higher composition of average interest-bearing
balances with other banks, finishing at 7.7% of average earning assets in 2020, as compared to 6.3% in 2019.
In March, 2020, the Bank announced that it settled the lawsuit the Bank filed against the third-party tax refund provider alleging breach of contract. The settlement
agreement required the third-party to make a $2,000 payment during the first quarter of 2020. In addition, the Bank entered into a new agreement with the third-party tax refund provider to process future electronic refund checks and deposits presented
for payment on behalf of taxpayers through accounts containing taxpayer refunds. The new agreement provides that the Bank will process refunds for five tax seasons, beginning with the 2021 tax season and going through the 2025 tax season. This is
expected to lead to higher volumes of excess funds during such periods.
Net interest income was negatively impacted by loans, particularly with the decrease in average yield. The decrease in short-term rates during the second half of 2019
and in March 2020 had a direct impact on the repricings of a portion of the Company’s loan portfolio that reduced earnings in 2020. This decreased the average loan yield by 57 basis points to 5.37% at year-end 2020, as compared to 5.94% at year-end
2019, which caused FTE interest income to decrease by $4,584 during 2020. Partially offsetting the effects from loan yields was a $35,574, or 4.6%, increase in average loans, which contributed to $2,048 in additional FTE interest income during 2020
compared to 2019. This growth came predominantly from the commercial real estate and commercial and industrial loan segments. This was partly due to the increase in government-guaranteed PPP loans in 2020, as well as organic commercial loan growth
within the Company’s primary market areas. While average loans increased in 2020, interest-bearing deposits with other banks experienced more accelerated growth in 2020. As a result, the Company’s average loan composition decreased slightly to 79.8% of
average earning assets at year-end 2020, as compared to 80.4% for 2019.
Average securities of $127,321 at year-end 2020 represented a 0.8% decrease from the $128,391 in average securities at year-end 2019. Average taxable securities in 2020
increased 0.5% over the prior year, particularly from purchases within the agency mortgage-backed investment segment, while average tax exempt securities were down 15.0% from the prior year, largely related to maturities of state and municipal
investments. The decline in average state and municipal investments contributed to a lower asset composition of average securities in 2020, finishing at 12.5% of average earning assets at year-end 2020, as compared to 13.3% at year-end 2019.
Management continues to focus on generating loan growth as loans provide the greatest return to the Company. Management also maintains securities at a dollar level adequate enough to provide ample liquidity and cover pledging requirements.
MANAGEMENT'S DISCUSSION AND ANALYSIS OF
FINANCIAL CONDITION AND RESULTS OF OPERATIONS
Net interest income was positively impacted by a decline in the average cost of interest-bearing liabilities, particularly with the Company’s core deposit segments that
include negotiable order of withdrawal (“NOW”), savings and money market accounts. Interest expense was significantly impacted by a decrease in the average costs of this core group of interest-bearing liabilities, particularly savings and money market
accounts. This is largely due to the short-term rate cuts made by the FRB in March 2020 that influenced the repricings of various deposit products and drove down average costs. This caused the average cost of savings and money market accounts to
decrease from 0.55% in 2019 to 0.36% in 2020, which led to a $469 decrease in interest expense during 2020. However, customer deposits increased during 2020 within these core deposit segments impacted by stimulus relief monies and a consumer
preference to preserve these customer deposit proceeds during the pandemic. As a result, average balances during 2020 increased 8.8% within NOW accounts and 9.3% within savings and money market accounts, altogether representing 63.4% of average
interest-bearing liabilities in 2020, as compared to 60.5% in 2019.
Lower interest rates also had a significant impact on time deposits during 2020, particularly CD balances. The average cost of time deposits decreased 20 basis points
from 1.95% in 2019 to 1.75% in 2020, which contributed to a $427 decrease in interest expense for the year. Short-term rate decreases from 2019 and 2020 have had an impact on lowering CD rate offerings, which has generated less consumer demand for CD
products. As a result, the average time deposit segment decreased $3,469, or 1.6%, during 2020, which led to a decrease in the composition of average time deposits from 32.6% of interest-bearing liabilities at year-end 2019 to 30.8% at year-end 2020.
In addition, the Company’s other borrowings and subordinated debentures collectively decreased $5,434, or 11.9%, during 2020. The decrease was related to the principal
repayments applied to various FHLB advances. Borrowings and subordinated debentures continue to represent the smallest composition of average interest-bearing liabilities, finishing at 5.9% and 7.0% at the end of 2020 and 2019, respectively.
Comparing 2019 to 2018, net interest income totaled $43,481 on an FTE basis in 2019, down $691, or 1.6%, from 2018. This negative change reflects the impact of a 3.2%
decrease in average earning assets and a 27 basis point increase in average interest-bearing liabilities, partially offset by a 28 basis point increase in earning asset yield. The drop in average earning assets included a $35,973, or 37.2%,
year-over-year decrease in average interest-bearing balances with other banks. Market rate increases during 2018 had a corresponding effect on average deposit costs, primarily within time and money market deposits. The rate increases in time deposits
during 2018 contributed to a higher consumer demand for CDs, which generated most of the increase in average interest-bearing liabilities. Consumer depositors also migrated to higher-costing money market accounts, which contributed to higher average
costs within that deposit segment. Elevated earning asset yields were also impacted by the rise in short-term rates during 2018, which affected loans and deposits with other banks. The net interest margin increase reflected a 27 basis point negative
impact in funding costs, which were completely offset by a 28 basis point positive impact from the mix and yield on earning assets and a 7 basis point increase in the benefit from noninterest-bearing funding (i.e., demand deposits and shareholders’
equity).
MANAGEMENT'S DISCUSSION AND ANALYSIS OF
FINANCIAL CONDITION AND RESULTS OF OPERATIONS
Net interest income decreased in 2019 primarily due to the decrease in average volume of earning assets plus the increase in average cost of interest-bearing
liabilities, partially offset by the increase in average earning asset yield. The volume decrease in average earning assets was responsible for lowering FTE interest income by $568 in 2019, while the average cost increase in average interest-bearing
liabilities generated an additional $1,784 in interest expense during the same periods. These effects were partially offset by $1,671 in additional FTE interest income from the average earning asset yield increase. Average earning assets for 2019
decreased $32,338, or 3.2%, from the prior year, mostly from interest-bearing balances with other banks. The average volume on interest-bearing balances with other banks contributed most to the $374 decrease in interest income from these earning asset
deposits during 2019. Balances within interest-bearing deposits with other banks are driven primarily by the Company’s interest-bearing Federal Reserve clearing account. The Company utilizes its Federal Reserve clearing account to fund earning asset
growth and, prior to 2019, utilized such account to manage seasonal tax refund deposits. The processing of tax refund items prior to 2019 generated a stable source of income, as the Company would experience significant levels of excess funds impacted
by the large volume of ERC/ERD transactions that were maintained within its Federal Reserve clearing account. The Bank acted as the facilitator for these ERC/ERD transactions and earned a fee for each cleared item. For the short time the Bank held
such refunds, constituting noninterest-bearing deposits, the Bank would increase its deposits with the Federal Reserve. As previously mentioned, the Bank’s third-party tax refund product provider ceased utilizing the services of the Bank at the end of
2018. This absence of seasonal excess funds from no tax processing activity in 2019 led to a 39.0% decrease in average Federal Reserve clearing account balances, which contributed to lower interest income. Further limiting the interest income generated
by the clearing account was a reduction in short-term interest rates during 2019. In 2018, the FRB increased short-term rates by 100 basis points, which increased the interest rate on this clearing account from 1.50% to 2.50% at year-end 2018.
Despite having lower average balances entering 2019, the average yield on this clearing account was up over the prior year. Beginning in August 2019, the FRB reduced short-term interest rates by 25 basis points for three consecutive months, lowering
the clearing account interest rate to 1.75% at October 2019. As a result, the average yield factor on interest-bearing balances with other banks had less of an impact to 2019’s earnings, growing interest income by an additional $325 in 2019, as
compared to $674 in additional interest income during 2018. The volume decrease of the Bank’s Federal Reserve clearing account in 2019 led to a lower composition of average interest-bearing balances with other banks, finishing at 6.3% of average
earning assets in 2019, as compared to 9.7% in 2018.
Net interest income was positively impacted by the Company’s loan portfolio, particularly with the change in average yield. The rise in short-term rates during 2018 had
a direct impact on the repricings of a portion of the Company’s loan portfolio that improved earnings in 2019. This increased the average loan yield by 16 basis points to 5.94% at year-end 2019, as compared to 5.78% at year-end 2018, and also
contributed to $1,283 in additional FTE interest income during 2019 over 2018. The Company also experienced average loan growth, which increased $1,865, or 0.2%, during 2019. This growth came mostly from the residential and commercial real estate loan
segments. The impact from the average volume growth in loans contributed to $108 in additional FTE interest income during 2019 over 2018. While average loans were up only modestly in 2019, the Company also experienced a large decline in excess fund
balances being maintained within the Federal Reserve clearing account. As a result, the Company finished with a larger composition of average loans to average earning assets at year-end 2019 of 80.4%, as compared to 77.6% for 2018.
Average securities of $128,391 at year-end 2019 represented a 1.4% increase from $126,621 at year-end 2018. Average taxable securities in 2019 increased 2.8% over the
prior year, primarily as a result of purchases within the agency mortgage-backed investment segment, while average tax exempt securities were down 12.0% from the prior year, largely related to maturities of state and municipal investments. The
purchases of new taxable securities combined with the significant decrease in average interest-bearing balances with other banks contributed to a higher asset composition of average securities in 2019, finishing at 13.3% of average earning assets at
year-end 2019, as compared to 12.7% at year-end 2018. Management continues to focus on generating loan growth as loans provide the greatest return to the Company. Management also maintains securities at a dollar level adequate to provide ample
liquidity and to cover pledging requirements.
MANAGEMENT'S DISCUSSION AND ANALYSIS OF
FINANCIAL CONDITION AND RESULTS OF OPERATIONS
CONSOLIDATED AVERAGE BALANCE SHEET & ANALYSIS OF NET INTEREST INCOME
|
December 31
|
||||||||||||||||||||||||||||||||||||
|
Table I
|
2020
|
2019
|
2018
|
|||||||||||||||||||||||||||||||||
|
(dollars in thousands)
|
Average Balance
|
Income/
Expense
|
Yield/
Average
|
Average Balance
|
Income/
Expense
|
Yield/
Average
|
Average Balance
|
Income/
Expense
|
Yield/
Average
|
|||||||||||||||||||||||||||
|
Assets
|
||||||||||||||||||||||||||||||||||||
|
Interest-earning assets:
|
||||||||||||||||||||||||||||||||||||
|
Interest-bearing balances with banks
|
$
|
78,211
|
$
|
274
|
0.35
|
%
|
$
|
60,796
|
$
|
1,272
|
2.09
|
%
|
$
|
96,769
|
$
|
1,646
|
1.70
|
%
|
||||||||||||||||||
|
Securities:
|
||||||||||||||||||||||||||||||||||||
|
Taxable
|
118,090
|
2,409
|
2.04
|
117,530
|
2,935
|
2.50
|
114,278
|
2,817
|
2.46
|
|||||||||||||||||||||||||||
|
Tax exempt
|
9,231
|
359
|
3.90
|
10,861
|
432
|
3.98
|
12,343
|
464
|
3.76
|
|||||||||||||||||||||||||||
|
Loans
|
811,434
|
43,571
|
5.37
|
775,860
|
46,107
|
5.94
|
773,995
|
44,716
|
5.78
|
|||||||||||||||||||||||||||
|
Total interest-earning assets
|
1,016,966
|
46,613
|
4.58
|
%
|
965,047
|
50,746
|
5.26
|
%
|
997,385
|
49,643
|
4.98
|
%
|
||||||||||||||||||||||||
|
|
||||||||||||||||||||||||||||||||||||
|
Noninterest-earning assets:
|
||||||||||||||||||||||||||||||||||||
|
Cash and due from banks
|
13,619
|
12,259
|
13,027
|
|||||||||||||||||||||||||||||||||
|
Other nonearning assets
|
73,395
|
65,397
|
60,825
|
|||||||||||||||||||||||||||||||||
|
Allowance for loan losses
|
(7,789
|
)
|
(7,473
|
)
|
(7,981
|
)
|
||||||||||||||||||||||||||||||
|
Total noninterest-earning assets
|
79,225
|
70,183
|
65,871
|
|||||||||||||||||||||||||||||||||
|
Total assets
|
$
|
1,096,191
|
$
|
1,035,230
|
$
|
1,063,256
|
||||||||||||||||||||||||||||||
|
|
||||||||||||||||||||||||||||||||||||
|
Liabilities and Shareholders’ Equity
|
||||||||||||||||||||||||||||||||||||
|
Interest-bearing liabilities:
|
||||||||||||||||||||||||||||||||||||
|
NOW accounts
|
$
|
177,170
|
$
|
618
|
0.35
|
%
|
$
|
162,910
|
$
|
538
|
0.33
|
%
|
$
|
162,899
|
$
|
508
|
0.31
|
%
|
||||||||||||||||||
|
Savings and money market
|
258,434
|
932
|
0.36
|
236,496
|
1,290
|
0.55
|
235,992
|
657
|
0.28
|
|||||||||||||||||||||||||||
|
Time deposits
|
211,909
|
3,704
|
1.75
|
215,378
|
4,198
|
1.95
|
209,714
|
2,990
|
1.43
|
|||||||||||||||||||||||||||
|
Other borrowed money
|
31,916
|
729
|
2.28
|
37,350
|
883
|
2.37
|
40,467
|
986
|
2.44
|
|||||||||||||||||||||||||||
|
Subordinated debentures
|
8,500
|
208
|
2.44
|
8,500
|
356
|
4.18
|
8,500
|
330
|
3.89
|
|||||||||||||||||||||||||||
|
Total int.-bearing liabilities
|
687,929
|
6,191
|
0.90
|
%
|
660,634
|
7,265
|
1.10
|
%
|
657,572
|
5,471
|
0.83
|
%
|
||||||||||||||||||||||||
|
|
||||||||||||||||||||||||||||||||||||
|
Noninterest-bearing liabilities:
|
||||||||||||||||||||||||||||||||||||
|
Demand deposit accounts
|
258,802
|
235,616
|
278,034
|
|||||||||||||||||||||||||||||||||
|
Other liabilities
|
18,422
|
16,666
|
15,257
|
|||||||||||||||||||||||||||||||||
|
Total noninterest-bearing liabilities
|
277,224
|
252,282
|
293,291
|
|||||||||||||||||||||||||||||||||
|
|
||||||||||||||||||||||||||||||||||||
|
Shareholders’ equity
|
131,038
|
122,314
|
112,393
|
|||||||||||||||||||||||||||||||||
|
Total liabilities and shareholders’ equity
|
$
|
1,096,191
|
$
|
1,035,230
|
$
|
1,063,256
|
||||||||||||||||||||||||||||||
|
|
||||||||||||||||||||||||||||||||||||
|
Net interest earnings
|
$
|
40,422
|
$
|
43,481
|
$
|
44,172
|
||||||||||||||||||||||||||||||
|
Net interest earnings as a percent of interest-earning assets
|
3.97
|
%
|
4.51
|
%
|
4.43
|
%
|
||||||||||||||||||||||||||||||
|
Net interest rate spread
|
3.68
|
%
|
4.16
|
%
|
4.15
|
%
|
||||||||||||||||||||||||||||||
|
Average interest-bearing liabilities to average earning assets
|
67.65
|
%
|
68.46
|
%
|
65.93
|
%
|
||||||||||||||||||||||||||||||
Fully taxable equivalent yields are reported for tax exempt securities and loans and calculated assuming a 21% tax rate, net of nondeductible interest expense. Tax-equivalent
adjustments for securities during the years ended December 31, 2020, 2019 and 2018 totaled $73, $88, and $95, respectively. Tax-equivalent adjustments for loans during the years ended December 31, 2020, 2019 and 2018 totaled $367, $341, and $351,
respectively. Average balances are computed on an average daily basis. The average balance for available for sale securities includes the market value adjustment. However, the calculated yield is based on the securities’ amortized cost. Average loan
balances include nonaccruing loans. Loan income includes cash received on nonaccruing loans.
MANAGEMENT'S DISCUSSION AND ANALYSIS OF
FINANCIAL CONDITION AND RESULTS OF OPERATIONS
RATE VOLUME ANALYSIS OF CHANGES IN INTEREST INCOME & EXPENSE
Table II
|
(dollars in thousands)
|
2020
|
2019
|
||||||||||||||||||||||
|
|
Increase (Decrease)
From Previous Year Due to
|
Increase (Decrease)
From Previous Year Due to
|
||||||||||||||||||||||
|
|
Volume
|
Yield/Rate
|
Total
|
Volume
|
Yield/Rate
|
Total
|
||||||||||||||||||
|
Interest income
|
||||||||||||||||||||||||
|
Interest-bearing balances with banks
|
$
|
287
|
$
|
(1,285
|
)
|
$
|
(998
|
)
|
$
|
(699
|
)
|
$
|
325
|
$
|
(374
|
)
|
||||||||
|
Securities:
|
||||||||||||||||||||||||
|
Taxable
|
14
|
(540
|
)
|
(526
|
)
|
81
|
37
|
118
|
||||||||||||||||
|
Tax exempt
|
(64
|
)
|
(9
|
)
|
(73
|
)
|
(58
|
)
|
26
|
(32
|
)
|
|||||||||||||
|
Loans
|
2,048
|
(4,584
|
)
|
(2,536
|
)
|
108
|
1,283
|
1,391
|
||||||||||||||||
|
Total interest income
|
2,285
|
(6,418
|
)
|
(4,133
|
)
|
(568
|
)
|
1,671
|
1,103
|
|||||||||||||||
|
|
||||||||||||||||||||||||
|
Interest expense
|
||||||||||||||||||||||||
|
NOW accounts
|
49
|
31
|
80
|
----
|
30
|
30
|
||||||||||||||||||
|
Savings and money market
|
111
|
(469
|
)
|
(358
|
)
|
2
|
631
|
633
|
||||||||||||||||
|
Time deposits
|
(67
|
)
|
(427
|
)
|
(494
|
)
|
83
|
1,125
|
1,208
|
|||||||||||||||
|
Other borrowed money
|
(125
|
)
|
(29
|
)
|
(154
|
)
|
(75
|
)
|
(28
|
)
|
(103
|
)
|
||||||||||||
|
Subordinated debentures
|
----
|
(148
|
)
|
(148
|
)
|
----
|
26
|
26
|
||||||||||||||||
|
Total interest expense
|
(32
|
)
|
(1,042
|
)
|
(1,074
|
)
|
10
|
1,784
|
1,794
|
|||||||||||||||
|
Net interest earnings
|
$
|
2,317
|
$
|
(5,376
|
)
|
$
|
(3,059
|
)
|
$
|
(578
|
)
|
$
|
(113
|
)
|
$
|
(691
|
)
|
|||||||
The change in interest due to volume and rate is determined as follows: Volume Variance - change in volume multiplied by the previous year's rate; Yield/Rate Variance - change in rate
multiplied by the previous year's volume; Total Variance – change in volume multiplied by the change in rate. The change in interest due to both volume and rate has been allocated to volume and rate changes in proportion to the relationship of the
absolute dollar amounts of the change in each. The tax exempt securities and loan income is presented on an FTE basis. FTE yield assumes a 21% tax rate, net of related nondeductible interest expense.
Net interest income in 2019 was negatively impacted by an increase in the average cost of interest-bearing liabilities, particularly time deposits. With higher average
year-to-date loans compared to 2018, the Company utilized more CD balances as a funding source to help keep pace with earning assets. Short-term rate increases from 2018 have had an impact on the repricing of CD rates and have generated more consumer
demand for CD products. The average cost of time deposits increased 52 basis points from 1.43% in 2018 to 1.95% in 2019, which generated $1,125 in additional interest expense for the year. To a smaller extent, the volume impact from average time
deposit growth of $5,664, or 2.7%, generated $83 in additional interest expense for the year. The growth in time deposits led to an increase in the composition of average time deposits to interest-bearing liabilities from 31.9% at year-end 2018 to
32.6% at year-end 2019.
The Company’s core deposit segment of interest-bearing liabilities consists of NOW, savings and money market accounts. During 2019, average balances on these deposits
remained relatively stable, increasing $515, or 0.1%, and together, these deposits represented 60.5% of average interest-bearing liabilities in 2019, as compared to 60.7% in 2018. As a result, the impact to interest expense from this stable movement
of average balances was minimal. However, interest expense was significantly impacted by an increase in the average costs of this core group of interest-bearing liabilities, particularly money market accounts. In the fourth quarter of 2018, the
Company’s Prime Investment money market product was introduced in an effort to attract new deposits. The account offers a more competitive rate that is higher than the Company’s prior money market account. In addition to attracting new deposits,
existing savings and money market accounts have migrated to the new product. This caused the average cost of savings and money market accounts to increase from 0.28% in 2018 to 0.55% in 2019, which generated $631 in additional interest expense for the
year.
MANAGEMENT'S DISCUSSION AND ANALYSIS OF
FINANCIAL CONDITION AND RESULTS OF OPERATIONS
In addition, the Company’s other borrowings and subordinated debentures collectively decreased $3,117, or 6.4%, during 2019. The decrease was related to the principal
repayments applied to various FHLB advances. Borrowings and subordinated debentures continue to represent the smallest composition of average interest-bearing liabilities, finishing at 7.0% and 7.5% at the end of 2019 and 2018, respectively.
During 2020, total interest income on average earning assets decreased $4,133, or 8.1%, compared to 2019. During 2019, total interest income on average earning assets
increased $1,120, or 2.3%, compared to 2018. The contrasting differences in interest income during 2020 and 2019 were largely the result of a decline in market rates during the second half of 2019 and in March 2020. The Company’s interest and fees
from its consumer portfolio decreased $1,726, or 14.3%, during 2020, and increased $247, or 2.1%, during 2019. The change in 2020 was impacted by lower consumer loan yields impacted by the low rate environment and a 5.2% decrease in average consumer
loans, which was primarily attributable to the automobile and home equity line segments. Further contributing to lower consumer loan revenue in 2020 was a $922 decrease in fee income. This was primarily due to a change in the Company’s business model
with Loan Central that was necessary to comply with new regulations, which resulted in Loan Central not assessing any loan fees for tax refund loan advances during 2020. Rather, Loan Central began assessing a fee for preparing a tax return in
combination with a reduced loan fee. The fee income for preparing the tax return was recorded as noninterest income. The change in 2019 was impacted mostly by average balance growth associated with increased home equity loan balances, as well as
all-terrain and recreational vehicle loan financings.
The Company’s interest and fees from its commercial loan portfolio decreased by $157, or 0.8%, during 2020, but increased $846, or 4.4%, during 2019. The
change in 2020 was impacted by lower commercial loan yields that completely offset the positive impacts of higher average commercial loan balances and higher commercial loan fees during 2020. Commercial loan yields were negatively impacted by the low
rate environment in 2020. Average commercial loans grew by 17.2% and came primarily from $35,141 in PPP loan originations as part of the government’s relief program for businesses impacted by COVID-19. Loan fees of $1,175 were collected from the SBA
during 2020, of which, $705 were recorded to income as part of the PPP loan program. While PPP loans contributed to higher commercial loan balances, they also had a dilutive effect on loan yields as a result of the 1% interest rate associated
with each loan. The change in 2019 was impacted mostly by improved asset yields as a result of the rise in interest rates in 2018. The earnings from elevated commercial loan yields in 2019 completely offset a decrease in
average commercial loan balances in 2019, which were down 0.6% from 2018.
The Company’s interest and fees from its residential real estate loan portfolio decreased by $679, or 5.0%, during 2020, but increased $308, or 2.3%, during 2019. The
change in 2020 was impacted by lower residential real estate loan yields that completely offset higher loan fees. Residential real estate loan yields were negatively impacted by the low rate environment in 2020. The impact of lower loan yields
completely offset a $132 increase in loan fees during 2020. Higher loan fees were largely the result of loan modifications that were generated under the CARES Act. Average residential real estate loan balances during 2020 were largely comparable to
2019. The Company experienced average residential real estate loan growth from the Bank's warehouse lending volume. Warehouse lending consists of a line of credit provided by the Bank to another mortgage lender that makes loans for the purchase of
one- to four-family residential real estate properties. The mortgage lender eventually sells the loans and repays the Bank. Average warehouse lending balances increased from $22,029 in 2019 to $25,110 in 2020. Positive earnings from higher warehouse
lending volume was completely offset by decreases in other residential real estate assets. The low interest rate environment in 2020 caused a significant amount of mortgage refinancings to occur. As a result, the Company experienced a portfolio shift
from payoffs and maturities within its long-term fixed-rate mortgages to new short-term adjustable-rate mortgages during 2020. Furthermore, the Company sold a portion of its long-term, fixed-rate real estate loans to the Federal Home Loan Mortgage
Corporation, while retaining the servicing rights for those mortgages. This strategy was successful in generating a significant amount of loan sale and servicing fee revenue within noninterest income during 2020. The change in 2019 was largely due to
a $13,765 average balance increase in warehouse lending balances, which completely offset the negative effects from decreases in long-term fixed-rate mortgages and short-term adjustable-rate mortgages.
MANAGEMENT'S DISCUSSION AND ANALYSIS OF
FINANCIAL CONDITION AND RESULTS OF OPERATIONS
The Company’s interest income from taxable investment securities decreased $526, or 17.9%, in 2020 and $118, or 4.2%, in 2019. Average balances grew
during both 2020 and 2019 from increased purchases of U.S. Government sponsored entity securities and Agency mortgage-backed securities. Interest income on taxable securities was negatively affected by a 46 basis point decrease in yield from 2019
to 2020, primarily due to investment purchases and reinvestment of maturities at market rates lower than the average portfolio yield. Market rates in 2020 were influenced by the short-term rate decreases in March 2020 in response to COVID-19. For
2019, interest income on taxable securities was positively affected by a 4 basis point increase in yield from 2018.
Total interest expense incurred on the Company’s interest-bearing liabilities decreased $1,074, or 14.8%, during 2020, but increased $1,794, or 32.8%, in
2019. The contrasting differences in interest expense during 2020 and 2019 were largely the result of a decline in market rates during the second half of 2019 and in March 2020. The Company’s strategy continues to focus on funding earning asset
growth with lower cost, core deposit funding sources to further reduce, or limit growth in, interest expense. With the FRB’s action to reduce short-term rates in 2019 and 2020, the Bank saw many of its interest-bearing deposit products reprice
downward. This led to a decrease in the Company’s weighted average costs from 1.10% at year-end 2019 to 0.90% at year-end 2020. However, the pace of interest expense savings has slowed due to a lag in repricing on deposits. Given the Company’s
asset-sensitivity, decreases in short-term interest rates have had a negative impact on net interest income in that interest-earning assets have repriced faster than interest-bearing liabilities. This caused a lagging effect during most of 2020 on
the impact that decreasing market rates have had on reducing deposit expense, particularly with CDs. Since CD rates have repriced downward, the Company will benefit from lower interest expense only to the extent that new CDs at lower rates can be
issued. Lower rates on deposits contributed to less of a consumer demand for CDs in 2020, which caused a shift into more NOW, savings and money market balances and less time deposit balances. In addition to the effects from lower market rates, the
composition shift from higher-costing CDs to lower-costing NOW, savings and money market accounts helped reduce the Company’s interest expense during 2020. During 2019, the change in interest expense was impacted by the improvement in average
loan balances, and as a result, the Company utilized more CD balances as a funding source. In addition, market rates on the Company’s CDs in 2019 repriced at higher rates as a result of the short-term rate increases in 2018, which contributed to more
consumer demand for CDs during both 2018 and 2019. The Company also experienced a composition shift within its money market portfolio, which led to higher interest expense. This was impacted by the new Prime
Investment money market product that was introduced in the fourth quarter of 2018. Consumers migrated to this new product in 2019 due to the fact that the new account offered a more competitive rate. Although the composition of average interest-bearing deposits consists mostly of lower-costing NOW, savings and money market balances, the Company’s weighted average costs still increased in 2019. This was primarily from an increasing consumer demand of
higher-costing CDs and a composition shift to the new higher-costing money market deposit product. These factors contributed to an increase in the Company’s weighted average cost from 0.83% at year-end 2018 to 1.10% at year-end 2019.
The Company’s interest expenses were also impacted by other borrowed money and subordinated debentures, which were
down collectively by $302, or 24.4% during the year ended 2020, and $77, or 5.9%, during the year ended 2019. The decreases were primarily from the average balance decrease in FHLB borrowings caused by principal repayments during both 2019 and 2020,
and the average cost decrease of subordinated debentures during 2020.
MANAGEMENT'S DISCUSSION AND ANALYSIS OF
FINANCIAL CONDITION AND RESULTS OF OPERATIONS
During 2020, the Company’s net interest margin was negatively impacted by the decreasing market rates that contributed to lower earning asset yields during that same
period. Interest rates were reduced in the first quarter of 2020 primarily as a result of the growing concern that COVID-19 would have a significant negative impact on the economy. The margin was also negatively impacted by a larger amount of excess
deposits being maintained at the Federal Reserve yielding below 0.25%. Furthermore, the Company’s ability to reduce deposit expenses in a low rate environment was limited for most of 2020 by a lagging effect in CD rates. These factors contributed to a
decline in the net interest margin from 4.51% in 2019 to 3.97% in 2020. During 2019, the Company’s net interest margin benefited from a smaller composition of interest-bearing balances being maintained at the Federal Reserve yielding just 1.75%. In
prior years, the higher balances being maintained at the Federal Reserve diluted the net interest margin due to the yield on those balances being less than other earning assets, such as loans and securities. In 2019, the Company also maintained most of
its deposit mix in lower-cost core deposits. These factors were key to completely offsetting the negative impacts of growing interest costs associated with CDs and money market accounts. This contributed to net interest margin improvement from 4.43% in
2018 to 4.51% in 2019. Although the lagging effect of reducing CD expense was evident for most of 2020, average CD rates have decreased more steadily during the fourth quarter of 2020 and into 2021. Furthermore, the Company’s PPP loan originations that
carry a 1% contract rate have continued to payoff, resulting in higher loan fees and less of a dilutive effect to the margin. The Company’s primary focus is to invest its funds into higher-yielding assets, particularly loans, as opportunities arise.
However, if loan balances do not continue to expand and remain a larger component of overall earning assets, the Company will face pressure within its net interest income and margin improvement.
PROVISION EXPENSE
Credit risk is inherent in the business of originating loans. The Company sets aside an allowance for loan losses through charges to income, which are reflected in the
consolidated statement of income as the provision for loan losses. Provision for loan loss is recorded to achieve an allowance for loan losses that is adequate to absorb losses in the Company’s loan portfolio. Management performs, on a quarterly
basis, a detailed analysis of the allowance for loan losses that encompasses loan portfolio composition, loan quality, loan loss experience and other relevant economic factors.
The Company’s provision expense during the years ended 2020, 2019 and 2018 totaled $2,980, $1,000 and $1,039, respectively. These results yielded a $1,980 increase in
provision expense from 2019 to 2020, and a $39 decrease in provision expense from 2018 to 2019. Provision expense was up in 2020 in large part to the addition of a new risk reserve allocation in March 2020 for COVID-19. The risk factor was necessary
to account for the changes in economic conditions resulting from increases in unemployment that would produce higher anticipated losses as a result of COVID-19. Given that the economic scenarios had deteriorated significantly since the pandemic was
declared in early March, it was determined the credit risk in the loan portfolio had increased, resulting in the need for an additional reserve for credit loss. As a result, the general reserve allocation related to COVID-19 totaled $2,315 at December
31, 2020, which had a corresponding impact to provision expense. While the Company has yet to experience any significant charge-offs related to COVID-19, the continued uncertainty regarding the severity and duration of the pandemic and related economic
effects will continue to impact the Company’s estimate of its allowance for loan losses and resulting provision expense.
MANAGEMENT'S DISCUSSION AND ANALYSIS OF
FINANCIAL CONDITION AND RESULTS OF OPERATIONS
Provision expense was further impacted by a $134, or 9.2%, increase in net-charge offs during 2020 on loans that had not already been specifically allocated for in
prior years. Gross charge-offs totaled $3,033 during 2020, a decrease of $2,059 compared to 2019. Gross charge-offs during 2020 included $502 that had been previously allocated for in 2019 and did not require corresponding provision expense in 2020.
The decrease in gross charge-offs came primarily from losses recorded on one commercial and industrial loan relationship in September 2019. Gross recoveries decreased $2,695 during 2020, primarily from two large commercial real estate recoveries in
December 2019.
Excluding the risk factors from COVID-19, the Company also recognized additional provision expense from general allocations during 2020. The Company’s general
allocation evaluates several factors that include: loan volume, average historical loan loss trends, credit risk, regional unemployment conditions, asset quality, and changes in classified and criticized assets. Provision expense increases arising from
general allocations were mostly impacted by an increase in loan balances during 2020. The Company’s average earning assets grew 5.4% in 2020, largely from a $35,574 increase in average loans. The risk associated with growth in loans generated higher
general reserves and a corresponding increase to provision expense. Further contributing to higher provision expense was an increase in the Company’s historical loan loss factor, which trended upward from 0.23% at year-end 2019 to 0.24% at year-end
2020. Partially offsetting these effects from loan growth and historical loss were improvements resulting from lower classified assets and nonperforming levels that yielded less general allocation provision during 2020. Lower classified loans were
largely impacted by the commercial loan portfolio, with classified balances decreasing $11,024, or 52.4%, from year-end 2019 to year-end 2020. Furthermore, the Company’s nonperforming loans to total loans were 0.82% at year-end 2020, as compared to
1.30% at year-end 2019, while nonperforming assets to total assets were 0.59% at year-end 2020 and 1.04% at year-end 2019.
Partially offsetting the increasing effects to provision expense mentioned above were lower specific allocations. Specific allocations of the allowance
for loan losses identify loan impairment by measuring fair value of the underlying collateral and the present value of estimated future cash flows. When re-evaluating impaired loan balances to their corresponding collateral values at December
31, 2020, the Company identified no impairment for which a specific allocation was necessary. This is compared to an $807 specific allocation that was needed to fund the allowance for loan losses at December 31, 2019, within the commercial real
estate, commercial and industrial, and consumer loan segments. This reserve allocation was impacted mostly by two impaired loan relationships and required a corresponding increase to provision for loan losses expense during 2019.
The provision expense in 2019 was comparable to 2018 largely due to the increase in specific allocations being offset by decreases in net charge-offs,
general allocations and a decline in loan balances. When re-evaluating impaired loan balances to their corresponding collateral values at December 31, 2019, a specific allocation of $807 was needed to fund the allowance for loan losses within
the commercial real estate, commercial and industrial, and consumer loan segments. This reserve allocation was impacted mostly by two impaired loan relationships and required a corresponding increase to provision for loan losses expense. As a result,
specific allocations increased by $709 from year-end 2018 to year-end 2019.
MANAGEMENT'S DISCUSSION AND ANALYSIS OF
FINANCIAL CONDITION AND RESULTS OF OPERATIONS
The increase in specific reserves during 2019 was partially offset by a $354, or 19.6%, decrease in net-charge offs. Gross charge-offs increased $1,492 during 2019,
primarily from charge-offs recorded on one commercial and industrial loan relationship in September 2019. Gross recoveries increased $1,846 during 2019, primarily from two large commercial real estate recoveries in December 2019.
Further offsetting the impact of higher specific reserves in 2019 was lower general allocations. At December 31, 2019, general allocations decreased $1,165, or 17.6%,
from $6,630 at December 31, 2018, to $5,465 at December 31, 2019. In association with heightened recoveries, the Company’s average historical loan loss factors continued to trend down in 2019, while its criticized asset risk factor decreased, as well.
This, combined with a general decline in loan portfolio balances, contributed to lower general allocations at year-end 2019. Partially offsetting these positive factors to general reserves were increases in classified assets and nonperforming levels.
The Company’s nonperforming loans to total loans were 1.30% at year-end 2019, compared to 1.25% at year-end 2018, while nonperforming assets to total assets were 1.04% at year-end 2019 and 0.99% at year-end 2018. The reduction in general reserves
contributed to lower provision expense during 2019, as compared to 2018.
Management believes that the allowance for loan losses was adequate at December 31, 2020, and reflected probable incurred losses in the portfolio. The allowance for
loan losses was 0.84% of total loans at December 31, 2020, as compared to 0.81% at December 31, 2019, and 0.87% at December 31, 2018. There can be no assurance, however, that adjustments to the allowance for loan losses will not be required in the
future. Changes in the circumstances of particular borrowers, as well as adverse developments in the economy, particularly with respect to COVID-19, could cause further increases in the required allowance for loan losses and require additional
provision expense. Asset quality will continue to remain a key focus, as management continues to stress not just loan growth, but quality in loan underwriting as well. Future provisions to the allowance for loan losses will continue to be based on
management’s quarterly in-depth evaluation that is discussed in further detail below under the caption “Critical Accounting Policies - Allowance for Loan Losses” within this Management’s Discussion and Analysis.
NONINTEREST INCOME
During 2020, total noninterest income increased $2,272, or 24.8%, as compared to 2019. The increase in noninterest revenue was primarily impacted by proceeds of $2,000
received in a litigation settlement with a third-party tax software product provider.
Noninterest revenue improvement was also driven by higher mortgage banking income affected by an increase in the volume of real estate loans sold to the secondary
market. To help manage consumer demand for longer-termed, fixed-rate real estate mortgages during the year ended 2020, the Company sold a portion of the real estate loans it originated during that period. The decision to sell long-term fixed-rate
mortgages at lower rates also helps to minimize the interest rate risk exposure to rising rates. During 2020, the Company experienced an increase in the number of loans sold to the secondary market by 177 loans, as compared to 2019. This generated an
increase in mortgage banking income of $944 during the year ended 2020, as compared to the same period in 2019.
Noninterest income was also positively impacted in 2020 by an increase in the Company’s tax preparation fee income. As previously discussed, the Company changed its
business model in 2020 from assessing TAL fees to now assessing tax preparation fees in response to a state law enacted in 2019. By charging for the tax preparation services, the Company recorded $644 in tax preparation fee income during the year ended
December 31, 2020.
Partially offsetting these positive contributors to noninterest income in 2020 was a net gain on the sale of the Company’s Mount Sterling and New Holland, Ohio branches
recorded in 2019. The Company sold both branches to North Valley Bank on December 6, 2019, which yielded a net gain of $1,256. This gain was related to a 5% premium on the deposits that were sold.
MANAGEMENT'S DISCUSSION AND ANALYSIS OF
FINANCIAL CONDITION AND RESULTS OF OPERATIONS
Also negatively impacting noninterest income during 2020 were lower service charges on deposits. The Company recorded $1,685 in service charge fees during 2020,
compared to $2,118 in service charge fees during 2019, a decrease of $433, or 20.4%. This was largely due to growing economic uncertainties and lower overdraft fees impacted by economic stimulus proceeds received by customers in connection with
COVID-19.
The Company’s remaining noninterest income categories increased $373, or 6.8%, during the year ended 2020 as compared to 2019. This was in large part due to a $222
increase in interest rate swap revenue impacted by higher fees from increased originations in 2020. The Company utilizes interest rate swaps to satisfy the desire of large commercial customers to have a fixed-rate loan while permitting the Company to
originate a variable-rate loan, which helps mitigate interest rate risk. Also increasing noninterest income was interchange income, up $126 from 2019 to 2020, as the volume of transactions and new card issuances of the Company’s debit card products
continued to grow. The Company also experienced a $116 increase in income from bank owned life insurance (“BOLI”) and annuity assets during 2020, in large part to new BOLI issuances that contributed to a $5,403 increase in BOLI and annuity plan
balances.
During 2019, total noninterest income increased $228, or 2.6%, as compared to 2018. The increase in noninterest revenue was primarily impacted by a net gain on the
sale of the Company’s Mount Sterling and New Holland, Ohio branches.
Also contributing to the increase in noninterest income were lower losses on OREO properties, which finished with a net loss of $65 at year-end 2019, as compared to a
net loss of $559 at year-end 2018. OREO losses were elevated in 2018 mostly from the liquidation of one foreclosed land development property during the fourth quarter of 2018 that resulted in a loss on sale of $594.
Noninterest income was also positively impacted in 2019 by an increase in the Company’s interchange income, as the volume of transactions and new card issuances of its
debit and credit card products continue to grow. The Company has also been successful in promoting the use of both debit and credit cards by offering incentives that permit their users to redeem accumulated points for merchandise, as well as cash
incentives. As a result, debit and credit card interchange income increased $243, or 6.6%, during 2019, as compared to 2018. While incenting debit and credit card customers has increased customer use of electronic payments, which has contributed to
higher interchange revenue, the strategy also fits well with the Company's emphasis on growing and enhancing its customer relationships.
Partially offsetting these positive contributors to noninterest income in 2019 was a reduction in seasonal tax refund processing revenue classified as ERC/ERD fees.
During the year ended 2019, the Company’s ERC/ERD fees decreased by $1,574, or 99.7%, compared to 2018. As previously mentioned, the Bank’s third-party tax refund product provider ceased utilizing the services of the Bank at the end of 2018.
The Company’s remaining noninterest income categories were down $191, or 4.5%, during the year ended 2019 compared to 2018. This was in large part due to a $114
decrease in overdraft income in 2019 impacted by a lower volume of non-sufficient fund activity. Furthermore, interest rate swap revenue decreased $84 in 2019 due to lower fees resulting from a large origination in 2018. The Company utilizes interest
rate swaps to satisfy the desire of large commercial customers to have a fixed-rate loan while permitting the Company to originate a variable-rate loan, which helps mitigate interest rate risk. In association with establishing an interest rate swap
agreement, the Company earns a swap fee at the time of origination. The dollar amount of originations decreased during 2019, causing lower fee revenue.
MANAGEMENT'S DISCUSSION AND ANALYSIS OF
FINANCIAL CONDITION AND RESULTS OF OPERATIONS
NONINTEREST EXPENSE
Management continues to work diligently to minimize noninterest expense. For 2020, total noninterest expense decreased $3,365, or 8.5%, as compared to 2019. The
decrease was mostly from salaries and employee benefits, the Company’s largest noninterest expense item. During the year ended December 31, 2020, salaries and employee benefits decreased $1,888, or 8.0%, compared to 2019. During the fourth quarter of
2019, the Company offered a voluntary severance package to select employees meeting certain criteria. Those that accepted the early retirement package retired effective December 31, 2019. In connection with this severance package, the Company incurred
a one-time expense of $1,507 in December 2019, which was primarily responsible for the decline in personnel expense in 2020. Furthermore, the Company realized additional savings in salaries and employee benefit expense during 2020 due to a lower number
of employees as a result of the voluntary severance program and the sale of two branches in December 2019. The Company’s full-time equivalent employee base decreased from 284 employees at year-end 2019 to 264 employees at year-end 2020. This cost
savings more than offset the expenses associated with annual merit increases and higher insurance expense.
The Company also experienced a decrease in professional fees, which lowered by $989, or 39.4%, during 2020, as compared to 2019. The decrease in professional fees was
affected by lower litigation costs associated with the Bank’s lawsuit against the third-party tax software product provider. As previously discussed, a settlement was reached with the third-party during the first quarter of 2020, which contributed to
lower legal costs. Furthermore, the number of bankruptcy-related loan cases has decreased significantly due to the effects of COVID-19, which has shut down municipal courts at various times during the pandemic. Additionally, the Company incurred lower
audit-related expenses during 2020. This was related to costs from 2019 associated with the “expected loss” allowance model that the Company was prepared to adopt in 2020. In the fourth quarter of 2019, it was announced this required accounting
guidance would be delayed until 2023 for smaller reporting companies.
Lower software costs also reduced noninterest expense by $251, or 14.7%, during 2020, compared to 2019. This was largely impacted by the disposal of various pieces of
incompatible software during the fourth quarter of 2019.
Also contributing to lower noninterest expense was the Company’s marketing costs, which decreased $228, or 27.1%, during 2020 compared to 2019. With COVID-19
significantly disrupting consumer behavior, and with banking center lobbies being limited or closed, the opportunities to advertise and promote the brand of the Company were limited in 2020. The pandemic environment, consisting of social distancing,
self-quarantining and remote working arrangements, slowed many of the marketing goals that were set in 2020, which led to lower expense.
The remaining noninterest expense categories decreased $9, or 0.1%, during the year-ended 2020, as compared to 2019. This net decrease was impacted by
various activities, including intangible expense (down $144) and, foreclosed asset costs (down $138), which were partially offset by data processing expense (up $174), and occupancy/furniture and equipment costs (up $82). The elimination of the core
deposit intangible amount associated with the two branches that were sold in December 2019 caused intangible expense to decrease in 2020. Foreclosure expense decreased in relation to the pandemic environment of 2020. The increase in data
processing expense was primarily due to a $186 expense associated with the platform used to facilitate PPP loans during the second quarter of 2020. Occupancy/furniture and equipment expense increased primarily due to an increase in depreciable assets
during 2020.
MANAGEMENT'S DISCUSSION AND ANALYSIS OF
FINANCIAL CONDITION AND RESULTS OF OPERATIONS
Total noninterest expense in 2019 increased $2,072, or 5.5%, compared to 2018. The increase was mostly attributable to salaries and employee benefits, the Company’s
largest noninterest expense item. During the year ended December 31, 2019, salaries and employee benefits increased $1,333, or 6.0%, compared to the same period in 2018. As previously mentioned, the Company offered a voluntary severance package to
select employees during the fourth quarter of 2019, which led to the early retirements of various employees at December 31, 2019. The Company incurred a one-time expense of $1,507 in December 2019 in relation to the severance package payout. While the
severance expense was a significant cost to the Company in 2019, it contributed to lower salaries and employee benefit costs in 2020. Absent the severance payout, salaries and employee benefit expense would have decreased in 2019, compared to 2018,
primarily due to the lower number of employees in 2019, which more than offset the expenses associated with annual merit increases and higher insurance expense.
The Company also experienced an increase in professional fees, which grew $492, or 24.4%, during 2019, compared to 2018. The increase in professional fees was mostly
affected by legal expenses associated with the Bank’s lawsuit against the third-party tax software product provider related to the early termination of the Bank’s tax refund processing contract.
Noninterest expense was also negatively affected by higher software costs, which increased $172, or 11.2%, during 2019, as compared to 2018. This was largely impacted
by the disposal of various pieces of incompatible software during the fourth quarter of 2019.
Partially offsetting the increase in noninterest expense in 2019 were lower FDIC premiums. FDIC premium expense decreased $334, or 74.7%, during 2019, as compared to
2018. The decrease in premium expense was primarily related to lower assessment rates in 2019. FDIC assessments were further reduced by the FDIC crediting back a portion of the Bank’s premium because the Deposit Insurance Fund (“DIF”) exceeded the
statutory minimum of 1.35%. As a result, the FDIC issued credits to banks with assets of less than $10 billion. The credits were based on the portion of bank assessments that had contributed to the DIF reaching 1.35%. The FDIC calculated the Bank’s
associated credit to be $253. In September and December 2019, the Bank was able to utilize $138 of its FDIC credit to fully absorb its third and fourth quarter 2019 FDIC assessments. The Bank utilized the remaining credits during its first and second
quarter 2020 FDIC assessments.
Data processing expenses also provided cost savings to the Company’s overhead, decreasing $119, or 5.6%, in 2019, as compared to 2018. The impact was primarily from
nonrecurring transition costs associated with changing debit card processing providers in 2018.
Other noninterest expenses increased $311, or 6.0%, during 2019, as compared to 2018. This increase was impacted by various activities, including consulting fees (up
$90), fraudulent expense (up $74), customer incentives (up $68), examination costs (up $38), and loan expense (up $29). Increases in consulting fees were largely associated with the branch sale of the Mount Sterling and New Holland offices. The
increase in fraudulent expenses was primarily the result of increased consumer spending on retail transactions. Customer incentive costs continued to trend higher during 2019 as part of management’s emphasis on further building and maintaining core
deposit relationships while increasing interchange revenue. Examination costs were impacted by an increase in annual assessments on Ohio-chartered banks during the second half of 2019, as well as higher trust department examination costs.
The remaining noninterest expense categories increased $217, or 5.5%, during the year-ended 2019, as compared to 2018. The increases were primarily from higher costs
associated with occupancy, furniture and equipment, marketing and intangible amortization expense.
MANAGEMENT'S DISCUSSION AND ANALYSIS OF
FINANCIAL CONDITION AND RESULTS OF OPERATIONS
The Company's efficiency ratio is defined as noninterest expense as a percentage of fully tax-equivalent net interest income plus noninterest income. The effects from
provision expense are excluded from the efficiency ratio. Management continues to place emphasis on managing its balance sheet mix and interest rate sensitivity as well as developing more innovative ways to generate noninterest revenue. During 2020,
the Company’s asset yields were negatively impacted by market rate reductions related to COVID-19, which led to a 7.1% decrease in net interest income. However, this was completely offset by a 24.8% increase in noninterest revenue, which was impacted
by $2,000 in income from a litigation settlement and a $944 increase in mortgage banking fee income. Furthermore, the severance package offering and the sale of two branch offices in December 2019 contributed to an 8.0% decrease in personnel expense.
This, combined with a $989 decline in professional fees, contributed to an 8.5% decrease in overhead expense during 2020. As a result, the Company’s efficiency number improved from 75.02% at December 31, 2019, to 69.67% at December 31, 2020. During
2019, the Company’s net interest income finished below the previous year primarily due to a decrease in average earning assets combined with higher deposit costs related to CDs and money market accounts. Furthermore, noninterest expenses increased
5.5%, outpacing the 2.6% growth in noninterest revenue. As a result, the Company's efficiency number increased (regressed) from 70.47% at December 31, 2018, to 75.02% at December 31, 2019.
PROVISION FOR INCOME TAXES
The provision for income taxes during 2020 totaled $2,048, compared to $1,813 in 2019 and $2,255 in 2018. The effective tax rates for 2020, 2019 and 2018 were 16.6%,
15.5% and 15.9%, respectively. The increase in the effective tax rate from 2019 to 2020 reflects additional costs associated with certain nondeductible retirement benefit plans. The change in the effective tax rate from 2018 to 2019 was minimal.
FINANCIAL CONDITION:
CASH AND CASH EQUIVALENTS
The Company’s cash and cash equivalents consist of cash, as well as interest- and non-interest bearing balances due from other banks. The amounts of cash and cash
equivalents fluctuate on a daily basis due to customer activity and liquidity needs. At December 31, 2020, cash and cash equivalents had increased $85,947 to $138,303, compared to $52,356 at December 31, 2019. The increase in cash and cash
equivalents came mostly from higher interest-bearing deposits on hand with correspondent banks. At December 31, 2020, the Company’s interest-bearing Federal Reserve clearing account represented over 87% of cash and cash equivalents. The Company
utilizes its interest-bearing Federal Reserve clearing account to manage excess funds, as well as to assist in funding earning asset growth. The primary factor for the significant influx in clearing account balances was the investment of heightened
deposit balances received during 2020 as a result of the pandemic environment. At December 31, 2020, total deposits increased $172,268 from year-end 2019 in relation to customers receiving stimulus funds from various government programs and their
desire to preserve cash during this uncertain economic environment. Furthermore, commercial business customers received PPP loan proceeds as part of the government’s regulatory relief for COVID-19, which also generated higher levels of investable
deposits during 2020. During the second half of 2019, the rate associated with the Company’s Federal Reserve clearing account decreased 75 basis points to 1.75% as a result of the FRB’s action to decrease short-term market rates. The FRB again
reduced short-term rates by 150 basis points in March 2020 due to concerns about the impact of COVID-19 on the economy, resulting in a target federal funds rate range of 0% to 0.25%. Although interest-bearing deposits in the Federal Reserve are the
Company's lowest-yielding interest-earning asset, the investment rate is higher than the rate the Company would have received from its investments in federal funds sold. Furthermore, Federal Reserve balances are 100% secured.
As liquidity levels continuously vary based on consumer activities, amounts of cash and cash equivalents can vary widely at any given point in time. The Company’s focus
during periods of heightened liquidity will be to invest excess funds into longer-term, higher-yielding assets, primarily loans, when the opportunities arise. Further information regarding the Company’s liquidity can be found below under the caption
“Liquidity” in this Management’s Discussion and Analysis.
MANAGEMENT'S DISCUSSION AND ANALYSIS OF
FINANCIAL CONDITION AND RESULTS OF OPERATIONS
CERTIFICATES OF DEPOSIT IN FINANCIAL INSTITUTIONS
At December 31, 2020, the Company had $2,500 in CDs owned by the Captive, up $140, or 5.9%, from year-end 2019. The deposits on hand at December 31, 2020, consist
of eleven certificates with remaining maturity terms ranging from less than 3 months up to 29 months.
SECURITIES
Management's goal in structuring its investment securities portfolio is to maintain a prudent level of liquidity and to provide an acceptable rate of return without
sacrificing asset quality. During 2020, the balance of total securities increased $4,991, or 4.3%, compared to year-end 2019. The Company’s investment securities portfolio is made up mostly of Agency mortgage-backed securities, representing 77.0% of
total investments at December 31, 2020. During the year ended 2020, the Company invested $36,162 in new Agency mortgage-backed securities, while receiving principal repayments of $32,383. The monthly repayment of principal has been the primary
advantage of Agency mortgage-backed securities as compared to other types of investment securities, which deliver proceeds upon maturity or at a specified call date. Security asset growth was partially offset by increased maturities and principal
repayments associated with state and municipal securities, which decreased $2,013, or 16.7%, compared to year-end 2019.
In addition, decreasing market rates during 2020 led to a $2,415 increase in the net unrealized gain position associated with the Company’s available for sale
securities, which increased the fair value of securities at December 31, 2020. The fair value of an investment security moves inversely to interest rates, so as rates decreased, the unrealized gain in the portfolio increased. These changes in rates
are typical and do not impact earnings of the Company as long as the securities are held to full maturity.
Maturing securities provided the Company with sufficient liquidity in 2019 and 2020 so as to obviate the need for other sources of fundraising, such as debt offerings.
| Investment Portfolio Composition |
|
| at December 31, 2020 |
at December 31, 2019 |
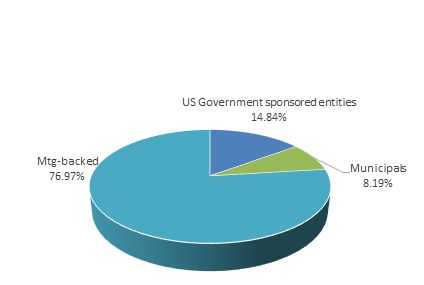 |
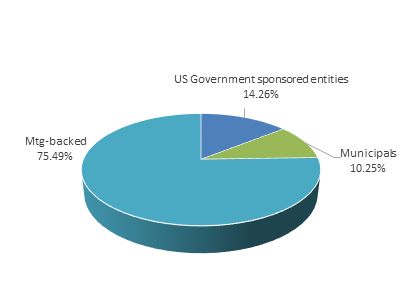 |
MANAGEMENT'S DISCUSSION AND ANALYSIS OF
FINANCIAL CONDITION AND RESULTS OF OPERATIONS
SECURITIES
Table III
|
|
MATURING
|
|||||||||||||||||||||||||||||||
|
As of December 31, 2020
|
Within
One Year
|
After One but Within Five Years
|
After Five but Within Ten Years
|
After Ten Years
|
||||||||||||||||||||||||||||
|
(dollars in thousands)
|
Amount
|
Yield
|
Amount
|
Yield
|
Amount
|
Yield
|
Amount
|
Yield
|
||||||||||||||||||||||||
|
|
||||||||||||||||||||||||||||||||
|
U.S. Government sponsored entity
securities
|
$
|
4,612
|
2.56
|
%
|
$
|
8,531
|
2.25
|
%
|
$
|
5,010
|
0.75
|
%
|
$
|
----
|
----
|
|||||||||||||||||
|
Obligations of states and political
subdivisions
|
2,048
|
4.39
|
%
|
4,276
|
4.84
|
%
|
4,018
|
4.12
|
%
|
----
|
----
|
|||||||||||||||||||||
|
Agency mortgage-backed securities,
residential
|
179
|
3.15
|
%
|
79,038
|
2.43
|
%
|
14,954
|
1.82
|
%
|
----
|
----
|
|||||||||||||||||||||
|
Total securities
|
$
|
6,839
|
3.12
|
%
|
$
|
91,845
|
2.53
|
%
|
$
|
23,982
|
1.98
|
%
|
$
|
----
|
----
|
|||||||||||||||||
Tax-equivalent adjustments of $73 have been made in calculating yields on obligations of states and political subdivisions using a 21% rate. Weighted average yields
are calculated on the basis of the cost and effective yields weighted for the scheduled maturity of each security. Mortgage-backed securities, which have prepayment provisions, are assigned to a maturity category based on estimated average lives.
Securities are shown at their fair values, which include the market value adjustments for available for sale securities.
Prior to 2020, the reinvestment rates on debt securities provided steady returns due to market rate increases. Short-term rate increases of 100 basis points in 2018
had a lagging, but positive, impact to the yield on average securities. As a result, the weighted average FTE yield on debt securities improved to 2.46% at December 31, 2019, as compared to 2.39% at December 31, 2018. Short-term rates began to
decrease during the second half of 2019 and during the first quarter of 2020, in large part due to COVID-19. As a result, the weighted average FTE yield on debt securities decreased from 2.46% at December 31, 2019, to 2.11% at December 31, 2020. The
Company’s focus will be to generate interest revenue primarily through loan growth, as loans generate the highest yields of total earning assets. Table III provides a summary of the securities portfolio by category and remaining contractual maturity.
Issues classified as equity securities have no stated maturity date and are not included in Table III.
LOANS
In 2020, the Company's primary category of earning assets and most significant source of interest income, total loans, increased $75,890, or 9.8%, to $848,664. The
increase in loan balances from year-end 2019 came primarily from the commercial loan portfolio, being partially offset by balance decreases in the residential real estate and consumer loan portfolios.
Management continues to place emphasis on its commercial lending, which generally yields a higher return on investment as compared to other types of loans. The
commercial lending segment increased $88,982, or 27.6%, from year-end 2019, which came mostly from the commercial and industrial loan portfolio, which increased $57,669, or 57.7%, from year-end 2019. Commercial and industrial loans consist of loans to
corporate borrowers primarily in small to mid-sized industrial and commercial companies that include service, retail and wholesale merchants. Collateral securing these loans includes equipment, inventory, and stock. Over 48% of the increase in
commercial and industrial loans came from the origination of PPP loans. In response to COVID-19 during the first quarter of 2020, the Company was authorized to originate PPP loans under the CARES Act. PPP loans are guaranteed by the Small Business
Administration (“SBA”) and have an interest rate of 1.0%, a two-year loan term to maturity, and principal and interest payments are deferred for six months from the date of disbursement. The Company originated $35,141 in PPP loans in 2020, $27,933 of
which were still outstanding at December 31, 2020. The commercial real estate loan segment comprised the largest portion of the Company's total commercial loan portfolio at December 31, 2020, representing 61.6% of such portfolio. Commercial real estate
consists of owner-occupied, nonowner-occupied and construction loans. Owner-occupied loans consist of nonfarm, nonresidential properties. A commercial owner-occupied loan is a borrower purchased building or space for which the repayment of principal
is dependent upon cash flows from the ongoing operations conducted by the party, or an affiliate of the party, who owns the property. Owner-occupied loans of the Company include loans secured by hospitals, churches, and hardware and convenience
stores. Nonowner-occupied loans are property loans for which the repayment of principal is dependent upon rental income associated with the property or the subsequent sale of the property, such as apartment buildings, condominiums, hotels and motels.
These loans are primarily impacted by local economic conditions, which dictate occupancy rates and the amount of rent charged. Commercial construction loans are extended to individuals as well as corporations for the construction of an individual
property or multiple properties and are secured by raw land and the subsequent improvements. Commercial real estate also includes loan participations with other banks outside the Company’s primary market area. Although the Company is not actively
seeking to participate in loans originated outside its primary market area, it has taken advantage of the relationships it has with certain lenders in those areas where the Company believes it can profitably participate with an acceptable level of
risk. Commercial real estate loans totaled $253,449 at December 31, 2020, an increase of $31,313, or 14.1%, over the balance of commercial real estate loans at year-end 2019. Most of this growth came from nonowner-occupied loan originations, with
balances increasing $33,125, or 25.2%, from year-end 2019. Nonowner-occupied loan originations during 2020 came mostly from the Waverly and Athens, Ohio and West Virginia market areas. Furthermore, construction loans related to one-to-four family
residential homes, as well as multi-family residential and land development properties, increased $2,150, or 6.2%, from year-end 2019. Partially offsetting increases in the commercial nonowner-occupied and construction loan segment were larger payoffs
from the owner-occupied loan segment, which decreased $3,962, or 7.1%, from year-end 2019.
MANAGEMENT'S DISCUSSION AND ANALYSIS OF
FINANCIAL CONDITION AND RESULTS OF OPERATIONS
While management believes lending opportunities exist in the Company's markets, future commercial lending activities will depend upon economic and related conditions,
such as general demand for loans in the Company's primary markets, interest rates offered by the Company, the effects of competitive pressure and normal underwriting considerations.
|
Loan Portfolio Composition
|
|
|
at December 31, 2020
|
at December 31, 2019
|
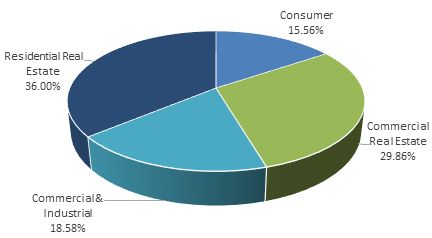 |
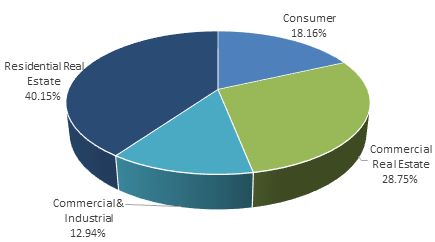 |
Partially offsetting commercial loan growth during 2020 were decreases within the Company’s consumer loan portfolio, which lowered by $8,317, or 5.9%, from year-end
2019. The Company’s consumer loans are primarily secured by automobiles, mobile homes, recreational vehicles and other personal property. Personal loans and unsecured credit card receivables are also included as consumer loans. The consumer loan
portfolio during 2020 was impacted most by lower automobile loans, which decreased $8,529, or 13.4%, from year-end 2019. Automobile loans represent the Company's largest consumer loan segment at 41.8% of total consumer loans. Automobile loans
decreased primarily as a result of COVID-19 and the stay-at-home orders that limited automobile sales within the Company’s market areas during 2020. Further limiting the volume of automobile loan originations were heightened incentives being
offered from the captive auto finance companies in response to the pandemic. The remaining consumer loan portfolio increased $212, or 0.3%, from year-end 2019, led by increases in unsecured loans, partially offset by lower home equity lines of
credit. The Company will continue to attempt to increase its auto lending segment while maintaining strict loan underwriting processes to limit future loss exposure. However, the Company will place more emphasis on loan portfolios (i.e. commercial
and, to a smaller extent, residential real estate) with higher returns than auto loans. Indirect automobile loans bear additional costs from dealers that partially offset interest revenue and lower the rate of return.
MANAGEMENT'S DISCUSSION AND ANALYSIS OF
FINANCIAL CONDITION AND RESULTS OF OPERATIONS
Generating residential real estate loans remains a significant focus of the Company’s lending efforts. The residential real estate loan segment comprises the largest
portion of the Company's overall loan portfolio at 36.0% and consists primarily of one-to-four family residential mortgages and carries many of the same customer and industry risks as the commercial loan portfolio. During 2020, residential real estate
loans decreased $4,775, or 1.5%, as compared to year-end 2019. The decrease in residential real estate loans was largely from the Bank's warehouse lending balances. Warehouse lending consists of a line of credit provided by the Bank to another mortgage
lender that makes loans for the purchase of one-to-four family residential real estate properties. The mortgage lender eventually sells the loans and repays the Bank. As mortgage refinancings reached their peak during the second and third quarters of
2020, the volume of warehouse lending balances decreased during the fourth quarter of 2020, finishing at $18,786 at December 31, 2020, as compared to $24,128 at December 31, 2019. The heavy volume of mortgage refinancings also caused a shift into more
long-term fixed-rate mortgages (up $3,679) and less short-term adjustable-rate mortgages (down $5,786) at year-end 2020. As part of management’s interest rate risk strategy, the Company sold the majority of its long-term fixed-rate residential
mortgages to the Federal Home Loan Mortgage Corporation, while maintaining the servicing rights for those mortgages.
The Company will continue to follow its secondary market strategy until long-term interest rates increase to a range that falls within an acceptable level of interest
rate risk for the Company. Furthermore, the Company will continue to monitor the pace of its loan volume and will remain consistent in its approach to sound underwriting practices with a focus on asset quality.
ALLOWANCE FOR LOAN LOSSES
Tables IV and V have been provided to enhance the understanding of the loan portfolio and the allowance for loan losses. Management evaluates the adequacy of the
allowance for loan losses quarterly based on several factors, including, but not limited to, general economic conditions, loan portfolio composition, prior loan loss experience, and management's estimate of probable incurred losses. Management
continually monitors the loan portfolio to identify potential portfolio risks and to detect potential credit deterioration in the early stages, and then establishes reserves based upon its evaluation of these inherent risks. Actual losses on loans are
reflected as reductions in the reserve and are referred to as charge-offs. The amount of the provision for loan losses charged to operating expenses is the amount necessary, in management's opinion, to maintain the allowance for loan losses at an
adequate level that is reflective of probable and inherent loss. The allowance required is primarily a function of the relative quality of the loans in the loan portfolio, the mix of loans in the portfolio and the rate of growth of outstanding loans.
Impaired loans, which include loans classified as TDRs, are considered in the determination of the overall adequacy of the allowance for loan losses.
MANAGEMENT'S DISCUSSION AND ANALYSIS OF
FINANCIAL CONDITION AND RESULTS OF OPERATIONS
Management continues to focus on improving asset quality and lowering credit risk while working to maintain its relationships with its borrowers. During
2020, the Company’s allowance for loan losses increased $888, or 14.2%, to $7,160, compared to $6,272 at year-end 2019. The allowance was impacted by a new risk factor that was added to the evaluation of the allowance for loan losses during
the first quarter of 2020 pertaining to COVID-19. The risk factor was necessary to account for the changes in economic conditions resulting from increases in unemployment that would
produce higher anticipated losses as a result of COVID-19. Given that the economic scenarios had deteriorated significantly since the pandemic was declared in early March, it was determined the credit risk in the loan portfolio had increased,
resulting in the need for an additional reserve for credit loss. As a result, the general reserve allocation related to COVID-19 totaled $2,315 (0.28% of total loans) at December 31, 2020. While the Company has yet to experience any significant
charge-offs related to COVID-19, the continued uncertainty regarding the severity and duration of the pandemic and the related economic effects arising therefrom, including those that arise in connection with any stimulus programs, will continue to
impact the Company’s estimate of its allowance for loan losses and resulting provision expense.
Excluding the new risk factor from COVID-19, the Company experienced decreases in other general allocations of the allowance for loan losses, which finished at $4,845
in 2020, compared to $5,465 in 2019. As part of the Company’s quarterly analysis of the allowance for loan losses, management reviewed various factors that directly impact the general allocation needs of the allowance, which include: historical loan
losses, loan delinquency levels, local economic conditions and unemployment rates, criticized/classified asset coverage levels and loan loss recoveries. From year-end 2019, the Company’s historical loss factor increased by 1 basis point in 2020 from
0.23% to 0.24%, while the economic risk factor decreased by 12 basis points from 0.46% to 0.34%, which contributed to lower general allocations of the allowance for loan losses at December 31, 2020. The increase in the average historical loss factor
was impacted by lower annualized loan recoveries during the year ended December 31, 2020, as well as an increase in average net charge-offs to average loans from 0.19% at year-end 2019 to 0.26% at year-end 2020. This was completely offset by a lower
classified asset risk factor from year-end 2019, impacted by various commercial loan upgrades as a result of improvements in the financial performance of certain borrowers’ ability to repay their loans. This contributed to lower classified assets from
year-end 2019, particularly within the commercial nonowner-occupied and commercial and industrial loan segments. Furthermore, the Company’s delinquency levels decreased from year-end 2019, with nonperforming loans to total loans of 0.82% at December
31, 2020, compared to 1.30% at December 31, 2019, and lower nonperforming assets to total assets of 0.59% at December 31, 2020, compared to 1.04% at year-end 2019. The large increase in PPP loans during 2020 had minimal to no impact on the general
allocations of the allowance for loan losses due to those loans being fully guaranteed by the SBA.
Specific allocations of the allowance for loan losses identify loan impairment by measuring fair value of the underlying collateral and the present value of estimated
future cash flows. At year-end 2020, the Company identified no impairment on loans being specifically evaluated, as compared to $807 in specific allocations at year-end 2019. The change in specific reserves from year-end 2019 was primarily attributable
to the loan payoff of one commercial borrower during the first quarter of 2020.
MANAGEMENT'S DISCUSSION AND ANALYSIS OF
FINANCIAL CONDITION AND RESULTS OF OPERATIONS
ALLOCATION OF THE ALLOWANCE FOR LOAN LOSSES
Table IV
|
(dollars in thousands)
|
Years Ended December 31
|
|||||||||||||||||||
|
|
||||||||||||||||||||
|
|
2020
|
2019
|
2018
|
2017
|
2016
|
|||||||||||||||
|
Commercial loans(1)
|
$
|
4,207
|
$
|
3,375
|
$
|
3,249
|
$
|
4,002
|
$
|
5,222
|
||||||||||
|
Percentage of loans to total loans
|
48.44
|
%
|
41.68
|
%
|
42.41
|
%
|
41.66
|
%
|
42.81
|
%
|
||||||||||
|
Residential real estate loans
|
1,480
|
1,250
|
1,583
|
1,470
|
939
|
|||||||||||||||
|
Percentage of loans to total loans
|
36.00
|
%
|
40.15
|
%
|
39.13
|
%
|
40.19
|
%
|
38.92
|
%
|
||||||||||
|
Consumer loans(2)
|
1,473
|
1,647
|
1,896
|
2,027
|
1,538
|
|||||||||||||||
|
Percentage of loans to total loans
|
15.56
|
%
|
18.17
|
%
|
18.46
|
%
|
18.15
|
%
|
18.27
|
%
|
||||||||||
|
Allowance for loan losses
|
$
|
7,160
|
$
|
6,272
|
$
|
6,728
|
$
|
7,499
|
$
|
7,699
|
||||||||||
|
|
100.00
|
%
|
100.00
|
%
|
100.00
|
%
|
100.00
|
%
|
100.00
|
%
|
||||||||||
|
Ratio of net charge-offs to average loans
|
.26
|
%
|
.19
|
%
|
.23
|
%
|
.37
|
%
|
.28
|
%
|
||||||||||
The above allocation is based on estimates and subjective judgments and is not necessarily indicative of the specific amounts or loan categories in which losses may ultimately occur.
(1) Includes commercial and industrial and commercial real estate loans.
(2) Includes automobile, home equity and other consumer loans.
SUMMARY OF NONPERFORMING, PAST DUE AND RESTRUCTURED LOANS
Table V
|
(dollars in thousands)
|
At December 31
|
|||||||||||||||||||
|
|
||||||||||||||||||||
|
|
2020
|
2019
|
2018
|
2017
|
2016
|
|||||||||||||||
|
Impaired loans
|
$
|
11,026
|
$
|
17,135
|
$
|
12,618
|
$
|
18,108
|
$
|
22,709
|
||||||||||
|
Past due 90 days or more and still accruing
|
424
|
889
|
1,067
|
334
|
327
|
|||||||||||||||
|
Nonaccrual
|
6,503
|
9,149
|
8,677
|
10,112
|
8,961
|
|||||||||||||||
|
Accruing loans past due 90 days or more to total loans
|
.05
|
%
|
.12
|
%
|
.14
|
%
|
.04
|
%
|
.04
|
%
|
||||||||||
|
Nonaccrual loans as a % of total loans
|
.77
|
%
|
1.18
|
%
|
1.11
|
%
|
1.32
|
%
|
1.22
|
%
|
||||||||||
|
Impaired loans as a % of total loans
|
1.30
|
%
|
2.22
|
%
|
1.62
|
%
|
2.35
|
%
|
3.09
|
%
|
||||||||||
|
Allowance for loan losses as a % of total loans
|
.84
|
%
|
.81
|
%
|
.87
|
%
|
.97
|
%
|
1.05
|
%
|
||||||||||
The impaired loan disclosures are comparable to the nonperforming loan disclosures except that the impaired loan disclosures do not include single-family residential or consumer loans which are
analyzed in the aggregate for loan impairment purposes. All of the Company’s troubled debt restructurings are classified as impaired.
Management formally considers placing a loan on nonaccrual status when collection of principal or interest has become doubtful. Furthermore, a loan should not be returned to the accrual status unless
either all delinquent principal or interest has been brought current or the loan becomes well secured and is in the process of collection.
MANAGEMENT'S DISCUSSION AND ANALYSIS OF
FINANCIAL CONDITION AND RESULTS OF OPERATIONS
MATURITY AND REPRICING DATA OF LOANS
As of December 31, 2020
Table VI
|
(dollars in thousands)
|
MATURING / REPRICING
|
|||||||||||||||
|
|
Within One Year
|
After One but Within Five Years
|
After Five Years
|
Total
|
||||||||||||
|
Residential real estate loans
|
$
|
75,246
|
$
|
155,908
|
$
|
74,324
|
$
|
305,478
|
||||||||
|
Commercial loans(1)
|
139,261
|
197,860
|
74,020
|
411,141
|
||||||||||||
|
Consumer loans(2)
|
40,791
|
64,961
|
26,293
|
132,045
|
||||||||||||
|
Total loans
|
$
|
255,298
|
$
|
418,729
|
$
|
174,637
|
$
|
848,664
|
||||||||
|
Loans maturing or repricing after one year with:
|
||||
|
Variable interest rates
|
$
|
326,723
|
||
|
Fixed interest rates
|
266,643
|
|||
|
Total
|
$
|
593,366
|
||
(1) Includes commercial and industrial and commercial real estate loans.
(2) Includes automobile, home equity and other consumer loans.
At December 31, 2020, the ratio of the allowance for loan losses increased to 0.84%, compared to 0.81% at December 31, 2019. Management believes that the allowance for
loan losses at December 31, 2020, was adequate and reflected probable incurred losses in the loan portfolio. There can be no assurance, however, that adjustments to the allowance for loan losses will not be required in the future. Changes in the
circumstances of particular borrowers, as well as adverse developments in the economy, particularly with respect to COVID-19, are factors that could change, and management will make adjustments to the allowance for loan losses as needed. Asset quality
will continue to remain a key focus of the Company, as management continues to stress not just loan growth, but also quality in loan underwriting. Future provisions to the allowance for loan losses will continue to be based on management’s quarterly
in-depth evaluation that is discussed in further detail below under the caption “Critical Accounting Policies - Allowance for Loan Losses” within this Management’s Discussion and Analysis.
DEPOSITS
Deposits are used as part of the Company’s liquidity management strategy to meet obligations for depositor withdrawals, to fund the borrowing needs of loan customers,
and to fund ongoing operations. Deposits, both interest- and noninterest-bearing, continue to be the most significant source of funds used by the Company to support earning assets. Deposits are attractive sources of funding because of their stability
and general low cost as compared to other funding sources. The Company seeks to maintain a proper balance of core deposit relationships on hand while also utilizing various wholesale deposit sources, such as brokered and internet CD balances, as an
alternative funding source to manage efficiently the net interest margin. Deposits are influenced by changes in interest rates, economic conditions and competition from other banks. Table VII shows the composition of total deposits as of December 31,
2020, 2019 and 2018. Total deposits increased $172,268, or 21.0%, from year-end 2019 to $993,739 at December 31, 2020. This significant increase was largely attributable to an inflow of funds from government stimulus programs such as the PPP and other
consumer economic impact payments.
MANAGEMENT'S DISCUSSION AND ANALYSIS OF
FINANCIAL CONDITION AND RESULTS OF OPERATIONS
Total deposits consist mostly of “core” deposits, which include noninterest-bearing deposits, as well as interest-bearing demand, savings, and money market deposits.
The Bank focuses on core deposit relationships with consumers from local markets who can maintain multiple accounts and services at the Bank. The Company believes such core deposits are more stable and less sensitive to changing interest rates and
other economic factors. The increase in total deposits came primarily from noninterest-bearing balances, which increased $92,170, or 41.4%, from year-end 2019. The increase came mostly from the Company’s business and incentive-based checking account
balances.
Higher deposits also came from interest-bearing deposits, which increased $80,098, or 13.4%, from year-end 2019. The increase in interest-bearing deposit balances came
mostly from the Company’s money market account balances, which were up $36,427, or 27.9%, from year-end 2019. This increase was caused by a shift in consumer preference to the new Prime Investment account, a more competitive, higher-costing money
market product that was introduced in December 2018. This increase was partially offset by a decrease in brokered money market balances due to a favorable liquidity position from elevated retail deposits. NOW account balances were also up $26,930, or
17.0%, from year-end 2019, largely driven by higher municipal NOW product balances within the Gallia County, Ohio, and Mason County, West Virginia, market areas. Savings deposits also increased $19,838, or 19.8%, from year-end 2019. The increases came
primarily from higher statement savings account balances impacted by the government stimulus proceeds previously mentioned.
| Composition of Total Deposits |
|
| at December 31, 2020 |
at December 31, 2019 |
 |
 |
Increases in interest-bearing deposit balances were partially offset by lower time deposits, which include CDs and individual retirement accounts. Total time deposits
decreased $3,097, or 1.5%, from year-end 2019. This decrease came largely from the Company's retail CDs, which decreased $6,020, or 3.4% from year-end 2019. The Company had experienced a resurgence in consumer demand for CDs during 2018, caused by a
rise in market rates that resulted in competitive CD rate offerings. After experiencing a large volume of retail CD deposits during 2018, new growth in CDs during 2019 began to normalize, while market rates began to move back down. Entering 2020, the
FRB reduced short-term rates by 150 basis points due to COVID-19, which contributed to more decline in product rate offerings in 2020. This contributed to the decrease in CD balances from year-end 2019. While the Company's preference is to fund earning
asset demand with retail core deposits, wholesale deposits are utilized to help satisfy earning asset growth. With consumers having invested less into CD balances during 2020, the Company’s brokered and internet CD issuances increased $2,923, or 9.3%,
from year-end 2019. The Company will continue to evaluate its use of wholesale deposits to manage the Company’s liquidity position and interest rate risk associated with longer-term, fixed-rate asset loan demand.
MANAGEMENT'S DISCUSSION AND ANALYSIS OF
FINANCIAL CONDITION AND RESULTS OF OPERATIONS
DEPOSITS
Table VII
|
|
As of December 31
|
|||||||||||
|
(dollars in thousands)
|
2020
|
2019
|
2018
|
|||||||||
|
Interest-bearing deposits:
|
||||||||||||
|
NOW accounts
|
$
|
185,364
|
$
|
158,434
|
$
|
155,166
|
||||||
|
Money market
|
166,812
|
130,385
|
121,294
|
|||||||||
|
Savings accounts
|
120,125
|
100,287
|
116,574
|
|||||||||
|
IRA accounts
|
40,613
|
41,898
|
43,249
|
|||||||||
|
Certificates of deposit
|
166,048
|
167,860
|
172,600
|
|||||||||
|
|
678,962
|
598,864
|
608,883
|
|||||||||
|
Noninterest-bearing deposits:
|
||||||||||||
|
Demand deposits
|
314,777
|
222,607
|
237,821
|
|||||||||
|
Total deposits
|
$
|
993,739
|
$
|
821,471
|
$
|
846,704
|
||||||
The Company will continue to experience increased competition for deposits in its market areas, which could challenge its net growth. The Company will continue to
emphasize growth and retention within its core deposit relationships during 2021, reflecting the Company’s efforts to reduce its reliance on higher cost funding and improving net interest income.
OTHER BORROWED FUNDS
The Company also accesses other funding sources, including short-term and long-term borrowings, to fund potential asset growth and satisfy short-term liquidity needs.
Other borrowed funds consist primarily of FHLB advances and promissory notes. During 2020, other borrowed funds were down $6,128, or 18.0%, from year-end 2019. The decrease was related primarily to the principal repayments applied to various FHLB
advances during 2020. Furthermore, the Company took advantage of its heightened liquidity position in the second and fourth quarters of 2020 to apply an additional $1,723 in principal prepayments to various FHLB advances to further reduce interest
expense on higher-cost funding sources. While deposits continue to be the primary source of funding for growth in earning assets, management will continue to utilize FHLB advances and promissory notes to help manage interest rate sensitivity and
liquidity.
SUBORDINATED DEBENTURES
The Company received proceeds from the issuance of one trust preferred security on March 22, 2007, totaling $8,500 at a fixed rate of 6.58%. The trust preferred
security is now at an adjustable rate equal to the 3-month LIBOR plus 1.68%. The Company does not report the securities issued by the trust as a liability, but instead, reports as a liability the subordinated debenture issued by the Company and held
by the trust.
MANAGEMENT'S DISCUSSION AND ANALYSIS OF
FINANCIAL CONDITION AND RESULTS OF OPERATIONS
OFF-BALANCE SHEET ARRANGEMENTS
As discussed in Notes I and L to the financial statements at December 31, 2020, the Company engages in certain off-balance sheet credit-related activities, including
commitments to extend credit and standby letters of credit, which could require the Company to make cash payments in the event that specified future events occur. Commitments to extend credit are agreements to lend to a customer as long as there is no
violation of any condition established in the contract. Commitments generally have fixed expiration dates or other termination clauses and may require payment of a fee. Standby letters of credit are conditional commitments to guarantee the performance
of a customer to a third party. While these commitments are necessary to meet the financing needs of the Company’s customers, many of these commitments are expected to expire without being drawn upon. Therefore, the total amount of commitments does not
necessarily represent future cash requirements. Management does not anticipate that the Company’s current off-balance sheet activities will have a material impact on the results of operations or financial condition.
CAPITAL RESOURCES
Federal regulators have classified and defined capital into the following components: (i) Tier 1 capital, which includes tangible shareholders’ equity for common
stock, qualifying preferred stock and certain qualifying hybrid instruments, and (ii) Tier 2 capital, which includes a portion of the allowance for loan losses, certain qualifying long-term debt, preferred stock and hybrid instruments which do not
qualify as Tier 1 capital.
In September 2019, consistent with Section 201 of the Economic Growth, Regulatory Relief, and Consumer Protection Act, the federal banking agencies issued a final
rule providing simplified capital requirements for certain community banking organizations (banks and holding companies). Under the rule, a qualifying community banking organization (“QCBO”) is eligible to opt into the Community Bank Leverage Ratio
(“CBLR”) framework in lieu of the Basel III capital requirements if it has less than $10 billion in total consolidated assets, limited amounts of certain trading assets and liabilities, limited amounts of off-balance sheet exposure and a leverage ratio
greater than 9.0%. The final rule became effective on January 1, 2020 and was elected by the Bank as of March 31, 2020. Therefore, the Bank will not be required to comply with the Basel III capital requirements.
A QCBO opting into the CBLR framework must maintain a CBLR of 9.0%, subject to a two quarter grace period to come back into compliance, provided that the QCBO
maintains a leverage ratio of more than 8.0% during the grace period. A QCBO failing to satisfy these requirements must comply with the existing Basel III capital requirements as implemented by the banking regulators in July 2013.
The numerator of the CBLR is Tier 1 capital, as calculated under present rules. The denominator of the CBLR is the QCBO’s average assets, calculated in accordance
with the QCBO’s Call Report instructions and less assets deducted from Tier 1 capital.
Pursuant to the CARES Act, the federal banking regulators in April 2020 issued interim final rules to set the CBLR at 8% beginning in the second quarter of 2020
through the end of 2020. Beginning in 2021, the CBLR will increase to 8.5% for the calendar year. QCBOs will have until January 1, 2022 before the CBLR requirement will return to 9%.
As detailed in Note P to the financial statements at December 31, 2020, both the Company and the Bank were deemed to be “well capitalized” under applicable prompt
corrective action regulations. Total shareholders' equity at December 31, 2020 of $136,324 increased $8,145, or 6.4%, as compared to $128,179 at December 31, 2019. Capital growth during 2020 came primarily from year-to-date net income of $10,259, less
dividends paid of $4,022. Capital growth during 2020 also came from a $1,908 increase in net unrealized gains on available for sale securities from year-end 2019, as market rates decreased during 2020 causing an increase in the fair value of the
Company’s investment portfolio.
MANAGEMENT'S DISCUSSION AND ANALYSIS OF
FINANCIAL CONDITION AND RESULTS OF OPERATIONS
LIQUIDITY
Liquidity relates to the Company's ability to meet the cash demands and credit needs of its customers and is provided by the ability to readily convert assets to cash
and raise funds in the market place. Total cash and cash equivalents, held to maturity securities maturing within one year, and available for sale securities, which totaled $252,641, represented 21.3% of total assets at December 31, 2020 compared to
$158,315 and 15.6% of total assets at December 31, 2019. The COVID-19 pandemic had a significant impact on higher levels of excess funds in 2020, which included customer deposits of stimulus monies from various government relief programs. To further
enhance the Bank’s ability to meet liquidity demands, the FHLB offers advances to the Bank. At December 31, 2020, the Bank could borrow an additional $102,656 from the FHLB, of which $100,000 could be used for short-term, cash management advances.
Furthermore, the Bank has established a borrowing line with the Federal Reserve. At December 31, 2020, this line had total availability of $59,103. Lastly, the Bank also has the ability to purchase federal funds from a correspondent bank. For further
cash flow information, see the condensed consolidated statement of cash flows above. Management does not rely on any single source of liquidity and monitors the level of liquidity based on many factors affecting the Company’s financial condition.
INFLATION
Consolidated financial data included herein has been prepared in accordance with US GAAP. Presently, US GAAP requires the Company to measure financial position and
operating results in terms of historical dollars with the exception of securities available for sale, which are carried at fair value. Changes in the relative value of money due to inflation or deflation are generally not considered.
In management's opinion, changes in interest rates affect the financial institution to a far greater degree than changes in the inflation rate. While interest rates
are greatly influenced by changes in the inflation rate, they do not change at the same rate or in the same manner as the inflation rate. Rather, interest rate volatility is based on changes in the expected rate of inflation, as well as monetary and
fiscal policies. A financial institution's ability to be relatively unaffected by changes in interest rates is a good indicator of its capability to perform in today's volatile economic environment. The Company seeks to insulate itself from interest
rate volatility by ensuring that rate sensitive assets and rate sensitive liabilities respond to changes in interest rates in a similar time frame and to a similar degree.
CRITICAL ACCOUNTING POLICIES
The most significant accounting policies followed by the Company are presented in Note A to the consolidated financial statements. These policies, along with the
disclosures presented in the other financial statement notes, provide information on how significant assets and liabilities are valued in the financial statements and how those values are determined. Management views critical accounting policies to be
those that are highly dependent on subjective or complex judgments, estimates, and assumptions, and where changes in those estimates and assumptions could have a significant impact on the financial statements. Management currently views the adequacy
of the allowance for loan losses and goodwill to be critical accounting policies.
MANAGEMENT'S DISCUSSION AND ANALYSIS OF
FINANCIAL CONDITION AND RESULTS OF OPERATIONS
Allowance for Loan Losses:
The allowance for loan losses is a valuation allowance for probable incurred credit losses. Loan losses are charged against the allowance when management believes the
uncollectibility of a loan balance is confirmed. Subsequent recoveries, if any, are credited to the allowance. Management estimates the allowance balance required using past loan loss experience, the nature and volume of the portfolio, information
about specific borrower situations and estimated collateral values, economic conditions, and other factors. Allocations of the allowance may be made for specific loans, but the entire allowance is available for any loan that, in management’s judgment,
should be charged off.
The allowance consists of specific and general components. The specific component relates to loans that are individually classified as impaired. A loan is impaired
when, based on current information and events, it is probable that the Company will be unable to collect all amounts due according to the contractual terms of the loan agreement. Impaired loans generally consist of loans with balances of $200 or more
on nonaccrual status or nonperforming in nature. Loans for which the terms have been modified, and for which the borrower is experiencing financial difficulties, are considered troubled debt restructurings and classified as impaired.
Factors considered by management in determining impairment include payment status, collateral value, and the probability of collecting scheduled principal and interest
payments when due. Loans that experience insignificant payment delays and payment shortfalls generally are not classified as impaired. Management determines the significance of payment delays and payment shortfalls on a case-by-case basis, taking
into consideration all of the circumstances surrounding the loan and the borrower, including the length and reasons for the delay, the borrower’s prior payment record, and the amount of shortfall in relation to the principal and interest owed.
CONTRACTUAL OBLIGATIONS
Table VIII
The following table presents, as of December 31, 2020, significant fixed and determinable contractual obligations to third parties by payment date. Further discussion of the nature of each obligation is included in
the referenced note to the consolidated financial statements.
|
|
Payments Due In
|
|||||||||||||||||||||||
|
(dollars in thousands)
|
Note Reference
|
Less than One Year
|
One to Three Years
|
Three to Five Years
|
Over Five Years
|
Total
|
||||||||||||||||||
|
Deposits without a stated maturity
|
G |
|
$
|
787,078
|
$
|
----
|
$
|
----
|
$
|
----
|
$
|
787,078
|
||||||||||||
|
Consumer and brokered time deposits
|
G |
|
136,634
|
65,404
|
4,436
|
187
|
206,661
|
|||||||||||||||||
|
Other borrowed funds
|
I |
|
6,332
|
5,225
|
4,070
|
12,236
|
27,863
|
|||||||||||||||||
|
Subordinated debentures
|
J |
|
----
|
----
|
----
|
8,500
|
8,500
|
|||||||||||||||||
|
Lease obligations
|
151
|
168
|
39
|
----
|
358
|
|||||||||||||||||||
|
Total
|
$
|
930,195
|
$
|
70,797
|
$
|
8,545
|
$
|
20,923
|
$
|
1,030,460
|
||||||||||||||
MANAGEMENT'S DISCUSSION AND ANALYSIS OF
FINANCIAL CONDITION AND RESULTS OF OPERATIONS
Commercial and commercial real estate loans are individually evaluated for impairment. If a loan is impaired, a portion of the allowance is allocated so that the loan
is reported, net, at the present value of estimated future cash flows using the loan’s existing rate or at the fair value of collateral if repayment is expected solely from the collateral. Smaller balance homogeneous loans, such as consumer and most
residential real estate, are collectively evaluated for impairment, and accordingly, they are not separately identified for impairment disclosure. Troubled debt restructurings are measured at the present value of estimated future cash flows using the
loan’s effective rate at inception. If a troubled debt restructuring is considered to be a collateral dependent loan, the loan is reported, net, at the fair value of the collateral. For troubled debt restructurings that subsequently default, the
Company determines the amount of reserve in accordance with the accounting policy for the allowance for loan losses.
The general component covers non-impaired loans and impaired loans that are not individually reviewed for impairment and is based on historical loss experience
adjusted for current factors. The historical loss experience is determined by portfolio segment and is based on the actual loss history experienced by the Company over the most recent 3 years for the consumer and real estate portfolio segment and 5
years for the commercial portfolio segment. The total loan portfolio's actual loss experience is supplemented with other economic factors based on the risks present for each portfolio segment. These economic factors include consideration of the
following: levels of and trends in delinquencies and impaired loans; levels of and trends in charge-offs and recoveries; trends in volume and terms of loans; effects of any changes in risk selection and underwriting standards; other changes in lending
policies, procedures, and practices; experience, ability, and depth of lending management and other relevant staff; national and local economic trends and conditions; industry conditions; and effects of changes in credit concentrations. The following
portfolio segments have been identified: Commercial Real Estate, Commercial and Industrial, Residential Real Estate, and Consumer.
Commercial and industrial loans consist of borrowings for commercial purposes to individuals, corporations, partnerships, sole proprietorships, and other business
enterprises. Commercial and industrial loans are generally secured by business assets such as equipment, accounts receivable, inventory, or any other asset excluding real estate and generally made to finance capital expenditures or operations. The
Company’s risk exposure is related to deterioration in the value of collateral securing the loan should foreclosure become necessary. Generally, business assets used or produced in operations do not maintain their value upon foreclosure, which may
require the Company to write-down the value significantly to sell.
KEY RATIOS
Table IX
|
|
2020
|
2019
|
2018
|
2017
|
2016
|
|||||||||||||||
|
|
||||||||||||||||||||
|
Return on average assets
|
.94
|
%
|
.96
|
%
|
1.12
|
%
|
.74
|
%
|
.77
|
%
|
||||||||||
|
Return on average equity
|
7.83
|
%
|
8.10
|
%
|
10.63
|
%
|
6.95
|
%
|
7.05
|
%
|
||||||||||
|
Dividend payout ratio
|
39.20
|
%
|
40.37
|
%
|
33.20
|
%
|
52.36
|
%
|
51.79
|
%
|
||||||||||
|
Average equity to average assets
|
11.95
|
%
|
11.82
|
%
|
10.57
|
%
|
10.66
|
%
|
10.91
|
%
|
||||||||||
MANAGEMENT'S DISCUSSION AND ANALYSIS OF
FINANCIAL CONDITION AND RESULTS OF OPERATIONS
Commercial real estate consists of nonfarm, nonresidential loans secured by owner-occupied and nonowner-occupied commercial real estate as well as commercial
construction loans. An owner-occupied loan relates to a borrower purchased building or space for which the repayment of principal is dependent upon cash flows from the ongoing business operations conducted by the party, or an affiliate of the party,
who owns the property. Owner-occupied loans that are dependent on cash flows from operations can be adversely affected by current market conditions for their product or service. A nonowner-occupied loan is a property loan for which the repayment of
principal is dependent upon rental income associated with the property or the subsequent sale of the property. Nonowner-occupied loans that are dependent upon rental income are primarily impacted by local economic conditions which dictate occupancy
rates and the amount of rent charged. Commercial construction loans consist of borrowings to purchase and develop raw land into one-to-four family residential properties. Construction loans are extended to individuals as well as corporations for the
construction of an individual or multiple properties and are secured by raw land and the subsequent improvements. Repayment of the loans to real estate developers is dependent upon the sale of properties to third parties in a timely fashion upon
completion. Should there be delays in construction or a downturn in the market for those properties, there may be significant erosion in value which may be absorbed by the Company.
Residential real estate loans consist of loans to individuals for the purchase of one-to-four family primary residences with repayment primarily through wage or other
income sources of the individual borrower. The Company’s loss exposure to these loans is dependent on local market conditions for residential properties as loan amounts are determined, in part, by the fair value of the property at origination.
Consumer loans are comprised of loans to individuals secured by automobiles, open-end home equity loans and other loans to individuals for household, family, and other
personal expenditures, both secured and unsecured. These loans typically have maturities of 6 years or less with repayment dependent on individual wages and income. The risk of loss on consumer loans is elevated as the collateral securing these
loans, if any, rapidly depreciate in value or may be worthless and/or difficult to locate if repossession is necessary. During the last several years, one of the most significant portions of the Company’s net loan charge-offs have been from consumer
loans. Nevertheless, the Company has allocated the highest percentage of its allowance for loan losses as a percentage of loans to the other identified loan portfolio segments due to the larger dollar balances associated with such portfolios.
Goodwill:
Goodwill resulting from business combinations represents the excess of the purchase price over the fair value of the net assets of businesses acquired. Goodwill resulting from business combinations is
generally determined as the excess of the fair value of the consideration transferred, plus the fair value of any noncontrolling interests in the acquiree, over the fair value of the net assets acquired and liabilities assumed as of the acquisition
date. Goodwill and intangible assets acquired in a purchase business combination and determined to have an indefinite useful life are not amortized, but tested for impairment at least annually. The Company has selected December 31 as the date to
perform the annual impairment test. Goodwill is the only intangible asset with an indefinite life on the Company’s balance sheet. No impairment to Goodwill was indicated based on year-end testing.
CONCENTRATIONS OF CREDIT RISK
The Company maintains a diversified credit portfolio, with residential real estate loans currently comprising the most significant portion. Credit risk is primarily
subject to loans made to businesses and individuals in southeastern Ohio and western West Virginia. Management believes this risk to be general in nature, as there are no material concentrations of loans to any industry or consumer group. To the
extent possible, the Company diversifies its loan portfolio to limit credit risk by avoiding industry concentrations.