Attached files
| file | filename |
|---|---|
| EX-32.2 - EXHIBIT 32.2 - Oxford Square Capital Corp. | s130411_ex32-2.htm |
| EX-32.1 - EXHIBIT 32.1 - Oxford Square Capital Corp. | s130411_ex32-1.htm |
| EX-31.2 - EXHIBIT 31.2 - Oxford Square Capital Corp. | s130411_ex31-2.htm |
| EX-31.1 - EXHIBIT 31.1 - Oxford Square Capital Corp. | s130411_ex31-1.htm |
| EX-23.1 - EXHIBIT 23.1 - Oxford Square Capital Corp. | s130411_ex23-1.htm |
| EX-4.8 - EXHIBIT 4.8 - Oxford Square Capital Corp. | s130411_ex4-8.htm |
UNITED STATES
SECURITIES AND EXCHANGE COMMISSION
WASHINGTON, D.C. 20549
_______________________________
FORM 10-K
_______________________________
S ANNUAL REPORT PURSUANT TO SECTION 13 OR 15(d) OF THE SECURITIES EXCHANGE ACT OF 1934
FOR THE FISCAL YEAR ENDED DECEMBER 31, 2020
OR
£ TRANSITION REPORT PURSUANT TO SECTION 13 OR 15(d) OF THE SECURITIES EXCHANGE ACT OF 1934
FOR THE TRANSITION PERIOD FROM TO
COMMISSION FILE NUMBER: 814-00638
_______________________________
OXFORD SQUARE CAPITAL CORP.
(Exact name of registrant as specified in its charter)
_______________________________
|
Maryland |
20-0188736 |
|
|
(State of Incorporation) |
(I.R.S. Employer Identification Number) |
8 Sound Shore Drive, Suite 255
Greenwich, CT 06830
(Address of principal executive offices) (Zip Code)
Registrant’s telephone number, including area code: (203) 983-5275
Securities registered pursuant to Section 12(b) of the Act:
|
Title of Each Class |
Trading Symbol(s) |
Name of Each Exchange On Which |
||
|
Common Stock, par value $0.01 per share |
OXSQ |
NASDAQ Global Select Market LLC |
||
|
6.50% Notes due 2024 |
OXSQL |
NASDAQ Global Select Market LLC |
||
|
6.25% Notes due 2026 |
OXSQZ |
NASDAQ Global Select Market LLC |
Securities registered pursuant to Section 12(g) of the Act:
None
_______________________________
Indicate by check mark if the registrant is a well-known seasoned issuer, as defined in Rule 405 of the Securities Act. Yes £ No S.
Indicate by check mark if the registrant is not required to file reports pursuant to Section 13 or Section 15(d) of the Act. Yes £ No S.
Indicate by check mark whether the Registrant (1) has filed all reports required to be filed by Section 13 or 15(d) of the Securities Exchange Act of 1934 during the preceding 12 months (or for such shorter period that the Registrant was required to file such reports), and (2) has been subject to such filing requirements for the past 90 days. Yes S No £.
Indicate by check mark whether the registrant has submitted electronically every Interactive Data File required to be submitted pursuant to Rule 405 of Regulation S-T (§232.405 of this chapter) during the preceding 12 months (or for such shorter period that the registrant was required to submit such files). Yes £ No £
Indicate by check mark whether the registrant is a large accelerated filer, an accelerated filer, a non-accelerated filer, a smaller reporting company, or emerging growth company. See definition of “large accelerated filer,” “accelerated filer”, “smaller reporting company” and “emerging growth company” in Rule 12b-2 of the Exchange Act. (Check one):
|
Large accelerated filer £ |
Accelerated filer £ |
|||
|
Non-accelerated filer S |
Smaller reporting company £ |
|||
|
Emerging growth company £ |
If an emerging growth company, indicate by check mark if the registrant has elected not to use the extended transition period for complying with any new or revised financial accounting standards provided pursuant to Section 13(a) of the Exchange Act. £
Indicate by check mark whether the registrant is a shell company (as defined in Rule 12b-2 of the Act). Yes £ No S.
Indicate by check mark whether the registrant has filed a report on and attestation to its management’s assessment of the effectiveness of its internal control over financial reporting under Section 404(b) of the Sarbanes-Oxley Act (15 USC. 7262(b)) by the registered public accounting firm that prepared or issued its audit report. Yes £ No S.
The aggregate market value of common stock held by non-affiliates of the Registrant on June 30, 2020, based on the closing price on that date of $2.80 on the NASDAQ Global Select Market, was $127,270,209. For the purposes of calculating this amount only, all directors and executive officers of the Registrant have been treated as affiliates. There were 49,589,607 shares of the Registrant’s common stock outstanding as of March 19, 2021.
OXFORD SQUARE CAPITAL CORP.
FORM 10-K FOR THE FISCAL YEAR
ENDED DECEMBER 31, 2020
TABLE OF CONTENTS
|
Page |
||||
|
PART I |
||||
|
ITEM 1. |
1 |
|||
|
ITEM 1A. |
27 |
|||
|
ITEM 1B. |
58 |
|||
|
ITEM 2. |
58 |
|||
|
ITEM 3. |
58 |
|||
|
ITEM 4. |
58 |
|||
|
PART II |
||||
|
ITEM 5. |
59 |
|||
|
ITEM 6. |
64 |
|||
|
ITEM 7. |
MANAGEMENT’S DISCUSSION AND ANALYSIS OF FINANCIAL CONDITION AND RESULTS OF OPERATIONS |
65 |
||
|
ITEM 7A. |
83 |
|||
|
ITEM 8. |
84 |
|||
|
ITEM 9. |
85 |
|||
|
ITEM 9A. |
85 |
|||
|
ITEM 9B. |
85 |
|||
|
PART III |
||||
|
ITEM 10. |
86 |
|||
|
ITEM 11. |
89 |
|||
|
ITEM 12. |
SECURITY OWNERSHIP OF CERTAIN BENEFICIAL OWNERS AND MANAGEMENT AND RELATED STOCKHOLDER MATTERS |
90 |
||
|
ITEM 13. |
CERTAIN RELATIONSHIPS AND RELATED TRANSACTIONS, AND DIRECTOR INDEPENDENCE |
92 |
||
|
ITEM 14. |
93 |
|||
|
PART IV |
||||
|
ITEM 15. |
95 |
|||
|
ITEM 16. |
97 |
|||
|
98 |
||||
i
PART I
Oxford Square Capital Corp. (“OXSQ,” “Company,” “we,” “us,” or “our”) is a closed-end, non-diversified management investment company that has elected to be regulated as a business development company (“BDC”) under the Investment Company Act of 1940, as amended (the “1940 Act”). We have elected to be treated for tax purposes as a regulated investment company (“RIC”) under Subchapter M of the Internal Revenue Code of 1986, as amended (the “Code”) beginning with our 2003 taxable year. Our investment objective is to maximize our portfolio’s total return. Our primary current focus is to seek an attractive risk-adjusted total return by investing primarily in corporate debt securities and collateralized loan obligation (“CLO”) structured finance investments that own corporate debt securities. CLO investments may also include warehouse facilities, which are early-stage CLO vehicles intended to aggregate loans that may be used to form the basis of a traditional CLO vehicle. We may also invest in publicly traded debt and/or equity securities. As a BDC, we may not acquire any asset other than “qualifying assets” unless, at the time we make the acquisition, the value of our qualifying assets represents at least 70% of the value of our total assets.
Our capital is generally used by our corporate borrowers to finance organic growth, acquisitions, recapitalizations and working capital. Our investment decisions are based on extensive analysis of potential portfolio companies’ business operations supported by an in-depth understanding of the quality of their recurring revenues and cash flow, variability of costs and the inherent value of their assets, including proprietary intangible assets and intellectual property. In making our CLO investments, we consider the indenture structure for that vehicle, its operating characteristics and compliance with its various indenture provisions, as well as its corporate loan-based collateral pool.
We generally expect to invest between $5.0 million and $50.0 million in each of our portfolio investments, although this investment size may vary as the size of our capital base changes and market conditions warrant. We invest in both fixed and variable interest rate structures. We expect that our investment portfolio will be diversified among a large number of investments with few investments, if any, exceeding 5% of the total portfolio.
The structures of our investments will vary and we seek to invest across a wide range of different industries. We seek to invest in entities that, as a general matter, have been operating for at least one year prior to the date of our investment and that will, at the time of our investment, have employees and revenues, and which are cash flow positive. Many of these companies are expected to have financial backing provided by other financial or strategic sponsors at the time we make an investment. The portfolio companies in which we invest, however, will generally be considered below investment grade, and their debt securities may in turn be referred to as “junk.” A portion of our investment portfolio may consist of debt investments for which issuers are not required to make significant principal payments until the maturity of the senior loans, which could result in a substantial loss to us if such issuers are unable to refinance or repay their debt at maturity. In addition, many of the debt securities we hold typically contain interest reset provisions that may make it more difficult for a borrower to repay the loan, heightening the risk that we may lose all or part of our investment.
We also purchase portions of equity and junior debt tranches of CLO vehicles. Substantially all of the CLO vehicles in which we may invest would be deemed to be investment companies under the 1940 Act but for the exceptions set forth in section 3(c)(1) or section 3(c)(7). Other than CLO vehicles, we do not intend to invest, and we would be limited to 15% of our net assets if we did invest, in any types of entities that rely on the exceptions set forth in section 3(c)(1) or section 3(c)(7) of the 1940 Act. Structurally, CLO vehicles are entities that are formed to originate and manage a portfolio of loans. The loans within the CLO vehicle are limited to loans which meet established credit criteria and are subject to concentration limitations in order to limit a CLO vehicle’s exposure to a single credit. A CLO vehicle is formed by raising various classes or “tranches” of debt (with the most senior tranches being rated “AAA” to the most junior tranches typically being rated “BB” or “B”) and equity. The tranches of CLO vehicles rated “BB” or “B” may be referred to as “junk.” The equity of a CLO vehicle is generally required to absorb the CLO’s losses before any of the CLO’s other tranches, yet it also has the lowest level of payment priority among the CLO’s tranches; therefore, the equity is typically the riskiest of CLO investments which, if it were rated, may also be referred to as “junk.” We primarily focus on investing in the junior tranches and the equity of CLO vehicles.
1
The CLO vehicles which we focus on are collateralized primarily by senior secured loans made to companies whose debt is unrated or is rated below investment grade, and generally have very little or no direct exposure to real estate, mortgage loans or to pools of consumer-based debt, such as credit card receivables or auto loans. However, there can be no assurance that the collateral securing such senior secured loans would satisfy all of the unpaid principal and interest of our investment in the CLO vehicle in the event of default and the junior tranches, especially the equity tranches, of CLO vehicles are the last tranches to be paid, if at all, in the event of a default. Our investment strategy may also include warehouse facilities, which are early stage CLO vehicles intended to aggregate loans that may be used to form the basis of a traditional CLO vehicle.
We have historically borrowed funds to make investments and may continue to do so. As a result, we are exposed to the risks of leverage, which may be considered a speculative investment technique. Borrowings, also known as leverage, magnify the potential for gain and loss on amounts invested and therefore increase the risks associated with investing in our securities. In addition, the costs associated with our borrowings, including any increase in the advisory fee payable to our investment adviser, Oxford Square Management, LLC (“Oxford Square Management”), will be borne by our common stockholders.
6.50% Unsecured Notes
On April 12, 2017, we completed an underwritten public offering of approximately $64.4 million in aggregate principal amount of our 6.50% unsecured notes due 2024, or the “6.50% Unsecured Notes.” The 6.50% Unsecured Notes will mature on March 30, 2024, and may currently be redeemed in whole or in part at any time or from time to time at our option (on or after March 30, 2020). The 6.50% Unsecured Notes bear interest at a rate of 6.50% per year payable quarterly on March 30, June 30, September 30, and December 30 of each year. The 6.50% Unsecured Notes are listed on the NASDAQ Global Select Market under the trading symbol “OXSQL.”
6.25% Unsecured Notes
On April 3, 2019, we completed an underwritten public offering of approximately $44.8 million in aggregate principal amount of our 6.25% unsecured notes due 2026, or the “6.25% Unsecured Notes.” The 6.25% Unsecured Notes will mature on April 30, 2026, and may be redeemed in whole or in part at any time or from time to time at our option on or after April 30, 2022. The 6.25% Unsecured Notes bear interest at a rate of 6.25% per year payable quarterly on January 31, April 30, July 31, and October 31 of each year. The 6.25% Unsecured Notes are listed on the NASDAQ Global Select Market under the trading symbol “OXSQZ.”
ATM Offering
On August 1, 2019, we entered into an Equity Distribution Agreement with Ladenburg Thalmann & Co. through which we may offer for sale, from time to time, up to $150.0 million of our common stock through an At-the-Market (“ATM”) offering. We sold a total of 1,098,277 shares of common stock pursuant to the ATM during the year ended December 31, 2020. The total amount of capital raised (net of underwriting fees and offering costs) under the ATM during the year ended December 31, 2020 was approximately $5.8 million.
Organizational and Regulatory Structure
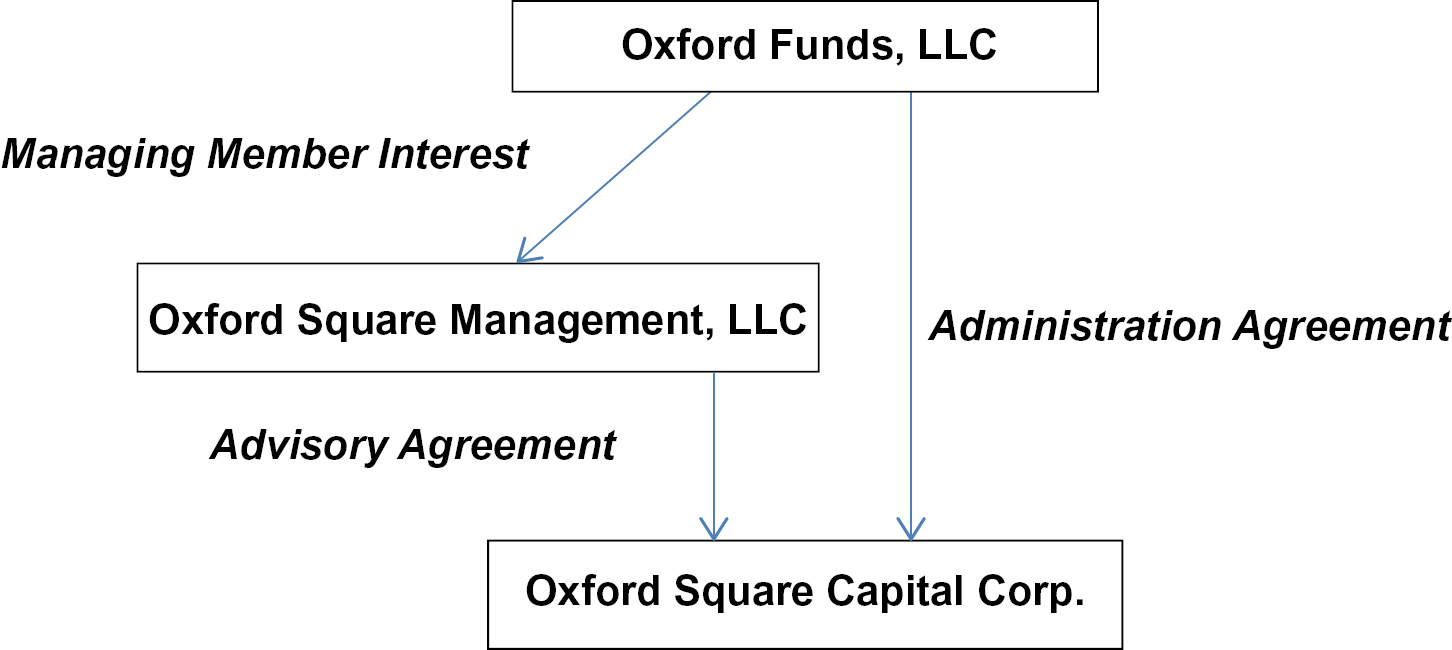
Our investment activities are managed by Oxford Square Management. Oxford Square Management is an investment adviser registered under the Investment Advisers Act of 1940, as amended (the “Advisers Act”). Oxford Square Management is owned by Oxford Funds, LLC (“Oxford Funds”), its managing member, and Charles M. Royce, a member of our Board of Directors (the “Board”) who holds a minority, non-controlling interest in Oxford Square Management. Jonathan H. Cohen, our Chief Executive Officer, and Saul B. Rosenthal, our President and Chief Operating Officer, directly or indirectly own or control all of the outstanding equity interests of Oxford Funds. Under the investment advisory agreement, we have agreed to pay Oxford Square Management an annual base advisory fee based on our gross assets as well as an incentive fee based on our performance. Refer to “— Investment Advisory Agreement”.
2
We were founded in July 2003 and completed an initial public offering of shares of our common stock in November 2003. We are a Maryland corporation and a closed-end, non-diversified management investment company that has elected to be regulated as a BDC under the 1940 Act. As a BDC, we are required to meet certain regulatory tests, including the requirement to invest at least 70% of our total assets in eligible portfolio companies. Refer to “— Regulation as a Business Development Company.” In addition, we have elected to be treated for U.S. federal income tax purposes, and intend to qualify annually, as a RIC under Subchapter M of the Internal Revenue Code of 1986, as amended (the “Code”).
Set forth below is a chart detailing our organizational structure.
Our headquarters are located at 8 Sound Shore Drive, Suite 255, Greenwich, Connecticut and our telephone number is (203) 983-5275.
We file annual, quarterly and current reports, proxy statements and other information with the Securities and Exchange Commission (“SEC”). This information is available on our website at http://oxfordsquarecapital.com/. The information we file with the SEC is available free of charge by contacting us at 8 Sound Shore Drive, Suite 255, Greenwich, CT 06830 or by telephone at (203) 983-5275. The SEC also maintains a website that contains reports, proxy statements and other information regarding registrants, including us, that file such information electronically with the SEC. The address of the SEC’s website is http://www.sec.gov. Information contained on our website or on the SEC’s website about us is not incorporated into this report and you should not consider information contained on our website or on the SEC’s website to be part of this report.
MARKET OVERVIEW AND OPPORTUNITY
The broader corporate loan and CLO equity market exhibited volatility in 2020. Significant weakness during the first quarter of 2020 was followed by significant strength during the remainder of the year. During the first quarter of 2020, the S&P/LSTA Leveraged Loan Index decreased from a price of 96.72% at the end of December 2019 to 82.85% at the end of March 2020. During this period, lower credit quality loans significantly underperformed higher credit quality loans. The S&P/LSTA Leveraged Loan Index ended the year at a price of 96.19%, with lower credit quality loans outperforming higher credit quality loans during the period of March 2020 through December 2020. For the full year, BB rated loan prices decreased 0.72%, B rated loan prices increased 0.67%, and CCC rated loan prices increased 5.46%. We believe that the significant volatility of the loan market during 2020 was driven by the negative impact of the COVID-19 pandemic on the global economic outlook and individual loan issuers followed by improvement in this outlook over the course of 2020. We believe that while the U.S. loan market has stabilized, conditions continue to exhibit weakness versus the end of 2019 as exhibited by an increase in default rates to 3.8% at the end of 2020 versus 1.4% at the end of 2019. This environment may allow corporate loan and CLO managers to buy performing loan assets in the secondary market at discounts to par, which may build CLO asset value and spread over time, ultimately accruing to the benefit of CLO equity. Moreover, as we execute our corporate loan strategy of focusing primarily on smaller broadly syndicated loans, narrowly syndicated loans and private deals, through purchases in both the primary and secondary markets, we remain mindful of maintaining overall portfolio liquidity. We believe this strategy allows us to maintain corporate debt investments which have sufficient liquidity in order to take advantage of market opportunities.
3
COMPETITIVE ADVANTAGES
We believe that we are well positioned to provide financing to corporate borrowers and structured finance vehicles that, in turn, provide capital to corporate borrowers for the following reasons:
• Expertise in credit analysis and monitoring investments; and
• Established transaction sourcing network.
Expertise in credit analysis and monitoring investments
While our investment focus is on middle-market companies, we have invested, and in the future will likely continue to invest, in larger and smaller companies and in other investment structures on an opportunistic basis, including CLO investment vehicles. We believe our experience in analyzing middle-market companies and CLO investment structures, as detailed in the biographies of Oxford Square Management’s senior investment professionals, affords us a sustainable competitive advantage over lenders with limited experience in investing in these markets. In particular, we have expertise in evaluating the investment merits of middle-market companies as well as the structural features of CLO investments, and monitoring the credit risk of such investments after closing until full repayment.
• Jonathan H. Cohen, our Chief Executive Officer, has more than 25 years of experience in debt and equity research and investment. Mr. Cohen has also served as Chief Executive Officer and a Director of Oxford Lane Capital Corp. (NasdaqGS: OXLC), a registered closed-end fund, and as Chief Executive Officer of its investment adviser, Oxford Lane Management, LLC, or “Oxford Lane Management,” since 2010. Since 2015 and 2018, respectively, Mr. Cohen has also served as Chief Executive Officer of Oxford Bridge Management, LLC, or “Oxford Bridge Management,” the investment adviser to Oxford Bridge, LLC and Oxford Bridge II, LLC (collectively, the “Oxford Bridge Funds”), and Oxford Gate Management, LLC, or “Oxford Gate Management,” the investment adviser to Oxford Gate Master Fund, LLC, Oxford Gate, LLC and Oxford Gate (Bermuda), LLC (collectively, the “Oxford Gate Funds”). The Oxford Bridge Funds and the Oxford Gate Funds are private investment funds. Previously, Mr. Cohen managed technology equity research groups at Wit Capital, Merrill Lynch, UBS and Smith Barney. Mr. Cohen is a member of the Board of Trustees of Connecticut College. Mr. Cohen received a B.A. in Economics from Connecticut College and an M.B.A. from Columbia University.
• Saul B. Rosenthal, our President and Chief Operating Officer, has more than 20 years of experience in the capital markets, with a focus on middle-market transactions. In addition, Mr. Rosenthal has served as President and a Director of Oxford Lane Capital Corp. (NasdaqGS: OXLC), a registered closed-end fund, and as President of Oxford Lane Management, since 2010. Mr. Rosenthal has also served as President of Oxford Bridge Management, the investment adviser to the Oxford Bridge Funds and Oxford Gate Management, the investment adviser to the Oxford Gate Funds, since 2015 and 2018, respectively. Mr. Rosenthal was previously an attorney at the law firm of Shearman & Sterling LLP. Mr. Rosenthal serves on the board of the National Museum of Mathematics. Mr. Rosenthal received a B.S., magna cum laude, from the Wharton School of the University of Pennsylvania, a J.D. from Columbia University Law School, where he was a Harlan Fiske Stone Scholar, and a LL.M. (Taxation) from New York University School of Law.
• Darryl Monasebian is the Executive Vice President and head of risk and portfolio management of Oxford Square Management, and also holds those same positions at Oxford Lane Management, the investment adviser to Oxford Lane Capital Corp., Oxford Bridge Management, the investment adviser to the Oxford Bridge Funds and Oxford Gate Management, the investment adviser to the Oxford Gate Funds. Prior to joining Oxford Square Management, Mr. Monasebian was a director in the Merchant Banking Group at BNP Paribas, and prior to that he was a director at Swiss Bank Corporation and a senior account officer at Citibank. He began his business career at Metropolitan Life Insurance Company as an investment analyst in the Corporate Investments Department. Mr. Monasebian received a B.S. in Management Science/Operations Research from Case Western Reserve University and a Masters of Business Administration from Boston University’s Graduate School of Management.
4
• Debdeep Maji is a Senior Managing Director of Oxford Square Management, and also holds the same position at Oxford Lane Management, the investment adviser to Oxford Lane Capital Corp., at Oxford Bridge Management, the investment adviser to the Oxford Bridge Funds and Oxford Gate Management, the investment adviser to the Oxford Gate Funds. Mr. Maji graduated from the Jerome Fisher Program in Management and Technology at the University of Pennsylvania where he received a Bachelor of Science degree in Economics from the Wharton School (and was designated a Joseph Wharton Scholar) and a Bachelor of Applied Science from the School of Engineering.
• Kevin Yonon is a Managing Director of Oxford Square Management, and also holds the same position at Oxford Lane Management, the investment adviser to Oxford Lane Capital Corp., at Oxford Bridge Management, the investment adviser to the Oxford Bridge Funds and Oxford Gate Management, the investment adviser to the Oxford Gate Funds. Previously, Mr. Yonon was an Associate at Deutsche Bank Securities and prior to that he was an Analyst at Blackstone Mezzanine Partners. Before joining Blackstone, he worked as an Analyst at Merrill Lynch in the Mergers & Acquisitions group. Mr. Yonon received a B.S. in Economics with concentrations in Finance and Accounting from the Wharton School at the University of Pennsylvania, where he graduated magna cum laude, and an M.B.A. from the Harvard Business School.
Established deal sourcing network
Through the investment professionals of Oxford Square Management, we have extensive contacts and sources from which to generate investment opportunities. These contacts and sources include private equity funds, companies, brokers and bankers. We believe that senior professionals of Oxford Square Management have developed strong relationships within the investment community over their years within the banking, investment management and equity research fields.
INVESTMENT PROCESS
Identification
We identify opportunities in the CLO market through our network of brokers, dealers, agent banks, collateral mangers and sponsors that we have worked with for several years. The CLO vehicles which we focus on are collateralized primarily by senior secured loans made to companies whose debt is unrated or is rated below investment grade, and generally have very little or no direct exposure to real estate, mortgage loans or to pools of consumer-based debt, such as credit card receivables or auto loans.
We identify and source new prospective corporate debt investments through brokers, investment banks and direct company relationships. We have identified several criteria that we believe are important in seeking our investment objective. These criteria provide general guidelines for our investment decisions; however, we do not require each prospective investment to meet all or any specific number of these criteria.
• Experienced management. We generally require that our portfolio companies have an experienced management team. We also prefer the portfolio companies to have in place proper incentives to induce management to succeed and to act in concert with our interests as investors, including having significant equity interests.
• Significant financial or strategic sponsor and/or strategic partner. We prefer to invest in companies in which established private equity or venture capital funds or other financial or strategic sponsors have previously invested and are willing to make an ongoing contribution to the management of the business, including participation as board members or as business advisers.
• Strong competitive position in industry. We seek to invest in companies that have developed a competitive position within their respective sector or niche of a specific industry.
• Profitable on a cash flow basis. We focus on companies that are profitable or nearly profitable on an operating cash flow basis. Typically, we would not expect to invest in start-up companies.
5
• Clearly defined exit strategy. Prior to making a direct corporate equity investment and/or an investment in a debt security that is accompanied by an equity-based security in a portfolio company, we analyze the potential for that company to increase the liquidity of its common equity through a future event that would enable us to realize appreciation, if any, in the value of our equity interest. Liquidity events may include an initial public offering, a merger or an acquisition of the company, a private sale of our equity interest to a third party, or a purchase of our equity position by the company or one of its stockholders.
• Liquidation value of assets. Although we do not operate as an asset-based lender, the prospective liquidation value of the assets, if any, collateralizing the debt securities that we hold is a consideration in our credit analysis. We consider both tangible assets, such as accounts receivable, inventory and equipment, and intangible assets, such as intellectual property, software code, customer lists, networks and databases.
Due Diligence
Our due diligence process generally includes some or all of the following elements:
Corporate Loans
Management team and financial sponsor
• management assessment including a review of management’s track record with respect to product development, sales and marketing, mergers and acquisitions, alliances, collaborations, research and development outsourcing and other strategic activities; and
• financial sponsor reputation, track record, experience and knowledge (where a financial sponsor is present in a transaction).
Business
• industry and competitive analysis;
• assessment of likely exit strategies; and
• potential regulatory/legal issues.
Financial condition
• detailed review of the historical financial performance and the quality of earnings;
• development of detailed pro forma financial projections; and
• review of assets and liabilities, including contingent liabilities.
Structured Finance Vehicles
• review of indenture structures;
• review of underlying collateral loans;
• analysis of projected future cash flows; and
• analysis of compliance with covenants.
Contemporaneous with our due diligence process, the investment team presents the investment proposal to our Investment Committee, which currently consists of Messrs. Cohen, Rosenthal and Monasebian. Our Investment Committee reviews and approves each of our portfolio investments.
6
Investment Characteristics
In identifying corporate debt investments, we seek to ascertain the asset quality as well as the earnings quality of our prospective portfolio companies. Frequently, we obtain a senior secured position and thus receive a perfected, first or second priority security interest in substantially all of our portfolio companies’ assets, which entitles us to a preferred position on payments in the event of liquidation. It should be noted, however, that because we are not primarily an asset-based lender, in the current economic environment, the value of collateral and security interests may dissipate rapidly. In addition, in certain investments we seek loan covenants or to participate in syndicated loans that incorporate loan covenants that assist in the early identification of risk. Our loan documents may include affirmative covenants that require the portfolio company to take specific actions such as: periodic financial reporting; notification of material events and compliance with laws; restrictive covenants that prevent portfolio companies from taking a range of significant actions such as incurring additional indebtedness or making acquisitions without our consent; covenants requiring the portfolio company to maintain or achieve specified financial ratios such as debt to cash flow and interest coverage; and operating covenants requiring them to maintain certain operational benchmarks such as minimum revenue or minimum cash flow. Our loan documents also provide protection against customary events of default such as non-payment, breach of covenant, insolvency and change of control.
In identifying CLO investments, we seek to ascertain the asset quality of the underlying collateral pool, the structural integrity of the CLO liability capital structure, the expected return profile of the CLO equity or debt tranche we are investing in as well as the quality of the prospective collateral manager. The underlying portfolio of each CLO investment is typically diversified across approximately 100 to 250 broadly syndicated loans which are predominantly 1st lien senior secured term loans to U.S. corporations. Additionally, these collateral pools typically do not have direct exposure to real estate, mortgages, or consumer-based credit assets. Our investment focus is generally agnostic between the primary and secondary CLO markets. In both markets, we pursue opportunities which we view to have attractive optionality with regards to the ability to refinance or “reset” the CLO liability capital structure at some point in the future. A CLO “reset” typically includes an extension of the CLO’s reinvestment period in addition to the refinancing of the CLO liabilities. We continue to prefer CLO equity investments which have longer reinvestment periods which may give CLO managers additional time to rebuild collateral value from potential credit losses as well as take advantage of a potential disruption in the broader credit markets.
MONITORING RELATIONSHIPS WITH PORTFOLIO COMPANIES
Monitoring
We monitor the financial trends of each portfolio company to assess the appropriate course of action for each investment and to evaluate overall portfolio quality. We closely monitor the status and performance of each individual company on at least a quarterly and, in some cases, a monthly basis.
We have several methods of evaluating and monitoring the performance of our investments, including but not limited to the following:
• assessment of business development success, and the portfolio company’s overall adherence to its business plan; and
• review of monthly and/or quarterly financial statements and financial projections for portfolio companies.
In addition, we may from time to time identify investments that require closer monitoring or become workout assets. In such cases, we will develop a strategy for workout assets and periodically gauge our progress against that strategy. As a private debt holder, we may incur losses from our investing activities from time to time; however, we attempt, where possible, to work with troubled portfolio companies in order to recover as much of our investments as is practicable.
7
Portfolio Grading
We have developed a credit grading system to monitor the quality of our debt investment portfolio. We use an investment rating scale of 1 to 5. The following table provides a description of the conditions associated with each debt investment. Equity securities, including CLO equity tranches, are not graded.
|
Grade |
Summary Description |
|
|
1 |
Company is ahead of expectations and/or outperforming financial covenant requirements of the specific tranche and such trend is expected to continue. |
|
|
2 |
Full repayment of the outstanding amount of OXSQ’s cost basis and interest is expected for the specific tranche. |
|
|
3 |
Closer monitoring is required. Full repayment of the outstanding amount of OXSQ’s cost basis and interest is expected for the specific tranche. |
|
|
4 |
A loss of interest income has occurred or is expected to occur and, in most cases, the investment is placed on non-accrual status. Full repayment of the outstanding amount of OXSQ’s cost basis is expected for the specific tranche. |
|
|
5 |
Full repayment of the outstanding amount of OXSQ’s cost basis is not expected for the specific tranche and the investment is placed on non-accrual status. |
Significant Managerial Assistance
As a BDC, we are required to offer significant managerial assistance to portfolio companies. This assistance, were it to be accepted, would typically involve monitoring the operations of portfolio companies, participating in their board and management meetings, consulting with and advising their officers and providing other organizational and financial guidance.
Portfolio Overview
We seek to create a portfolio that includes primarily CLO investments, senior secured loans, senior subordinated and junior subordinated debt investments, as well as warrants and other equity instruments we may receive in connection with such debt investments. We generally expect to invest between $5 million and $50 million in each of our portfolio companies. We expect that our investment portfolio will be diversified among a large number of investments with few investments, if any, exceeding 5% of the total portfolio.
The following is a representative list of the industries in which we have invested:
|
• Structured Finance |
• IT Consulting |
|||
|
• Business Services |
• Utilities |
|||
|
• Software |
• Aerospace and Defense |
|||
|
• Healthcare |
• Education |
|||
|
• Telecommunication Services |
• Plastics Manufacturing |
|||
|
• Diversified Insurance |
During the fiscal year ended December 31, 2020, we purchased approximately $93.8 million of investments, comprised of approximately $39.2 million in senior secured notes, $46.5 million in CLO equity, and $8.2 million in CLO debt. As of December 31, 2020, our portfolio was invested in approximately 58.4% in senior secured notes and 41.6% in CLO equity.
8
TEN LARGEST PORTFOLIO INVESTMENTS AS OF DECEMBER 31, 2020
Our ten largest portfolio company investments as of December 31, 2020, based on the combined fair value of the debt and equity securities (including CLO side letter related investments) we hold in each portfolio company, were as follows:
|
December 31, 2020 |
|||||||||||
|
($ in millions) |
|||||||||||
|
Portfolio Company |
Industry |
Cost |
Fair |
Fair Value |
|||||||
|
Octagon Investment Partners 49, Ltd. |
Structured Finance |
$ |
22.6 |
$ |
22.3 |
7.6 |
% |
||||
|
Keystone Acquisition Corp. |
Healthcare |
|
20.3 |
|
18.5 |
6.3 |
% |
||||
|
Sound Point CLO XVI, Ltd. |
Structured Finance |
|
36.0 |
|
18.2 |
6.2 |
% |
||||
|
Access CIG, LLC |
Business Services |
|
16.8 |
|
16.5 |
5.6 |
% |
||||
|
Premiere Global Services, Inc. |
Business Services |
|
23.6 |
|
15.9 |
5.4 |
% |
||||
|
Cambium Learning Group, Inc. |
Education |
|
14.5 |
|
14.6 |
5.0 |
% |
||||
|
Viant Medical Holdings, Inc. |
Healthcare |
|
14.7 |
|
13.8 |
4.7 |
% |
||||
|
Verifone Systems, Inc. |
Business Services |
|
13.2 |
|
13.4 |
4.5 |
% |
||||
|
Quest Software, Inc. |
Software |
|
13.2 |
|
13.3 |
4.5 |
% |
||||
|
OMNIA Partners, Inc. |
Business Services |
|
13.9 |
|
13.1 |
4.4 |
% |
||||
|
$ |
188.8 |
$ |
159.6 |
54.2 |
% |
||||||
For a description of the factors relevant to the changes in the value of the above portfolio investments for the year ended December 31, 2020, refer to “Management’s Discussion and Analysis of Financial Condition and Results of Operations — Portfolio Grading.”
Set forth below are descriptions of the ten largest portfolio investments as of December 31, 2020:
Octagon Investment Partners 49, Ltd.
Octagon Investment Partners 49, Ltd. is a collateralized loan obligation investing primarily in U.S.-based senior secured loans. As of December 31, 2020, approximately $28.9 million remained outstanding on our investment.
Keystone Acquisition Corp.
Keystone Acquisition Corp. is a Quality Improvement Organization that is involved in healthcare management, quality assurance, and cost containment services for providers of physical and behavioral health services. As of December 31, 2020, approximately $7.4 million and $13.0 million remained outstanding on our investment in the first lien notes and second lien notes, respectively.
Sound Point CLO XVI, Ltd.
Sound Point CLO XVI, Ltd. is a collateralized loan obligation investing primarily in U.S.-based senior secured loans. As of December 31, 2020, approximately $45.5 million remained outstanding on our investment.
Access CIG, LLC
Access CIG, LLC is a records and documents storage firm. As of December 31, 2020, approximately $16.8 million remained outstanding on our investment in the second lien notes.
Premiere Global Services, Inc.
Premiere Global Services, Inc. is a provider of audio conferencing, web-based and video collaboration services. As of December 31, 2020, approximately $14.3 million and $11.4 million remained outstanding on our investment in the first lien notes and second lien notes, respectively.
9
Cambium Learning Group, Inc.
Cambium Learning Group, Inc. is an educational solutions and services provider offering learning intervention solutions, instructional materials, and implementation-related services. As of December 31, 2020, approximately $15.0 million remained outstanding on our investment in the second lien notes.
Viant Medical Holdings, Inc.
Viant Medical Holdings, Inc., through its subsidiaries, provides vertically integrated plastics processing solutions for medical devices. They design, engineer, and produce precision custom molded thermoplastic, rubber, and elastomer components and molds for the healthcare and pharmaceutical, and industrial markets. As of December 31, 2020, approximately $9.8 million and $5.0 million remained outstanding on our investment in the first lien notes and second lien notes, respectively.
Verifone Systems, Inc.
Verifone Systems, Inc. develops technology that enables electronic payment transactions and value-added services at the point of sale. They serve financial institutions, payment processors, petroleum distributors, large retailers, government organizations, and healthcare sectors. As of December 31, 2020, approximately $13.8 million remained outstanding on our investment in the first lien notes.
Quest Software, Inc.
Quest Software, Inc. is an infrastructure software provider. They have five main product/service offerings: Platform Management, Information Management, Identity Management, Data Protection, and Endpoint Management. As of December 31, 2020, approximately $13.4 million remained outstanding on our investment in the second lien notes.
OMNIA Partners, Inc.
OMNIA Partners, Inc. is a group purchasing organization operating through both the public and private sectors. As of December 31, 2020, approximately $14.0 million remained outstanding on our investment in the second lien notes.
INVESTMENT ADVISORY AGREEMENT
Management Services
Oxford Square Management serves as our investment adviser. Oxford Square Management is registered as an investment adviser under the Advisers Act. Subject to the overall supervision of our Board, Oxford Square Management manages our day-to-day operations and provides investment advisory services to us. Under the terms of our Investment Advisory Agreement with Oxford Square Management (the “Investment Advisory Agreement”), Oxford Square Management:
• determines the composition of our portfolio, the nature and timing of the changes to our portfolio and the manner of implementing such changes;
• identifies, evaluates and negotiates the structure of the investments we make;
• closes, monitors and services the investments we make; and
• determines what securities we will purchase, retain or sell.
Oxford Square Management’s services under the Investment Advisory Agreement are not exclusive, and it is free to furnish similar services to other entities so long as its services to us are not impaired. Oxford Square Management has agreed that, during the term of its Investment Advisory Agreement with us, it will not serve as investment adviser to any other public or private entity that utilizes a principal investment strategy of providing debt financing to middle-market companies similar to those we target.
10
Advisory Fee
General Terms
We pay Oxford Square Management an advisory fee for its services under the Investment Advisory Agreement consisting of a base advisory fee (the “Base Fee”) and two types of incentive fees.
The Base Fee is payable quarterly in arrears, calculated based on a percentage of the average value of our gross assets at the end of the two most recently completed calendar quarters, and appropriately prorated for any partial quarter.
The incentive fees are commonly referred to as the “income incentive fee” and the “capital gains incentive fee,” with the first fee payable quarterly in arrears and the second fee payable in arrears at the end of each calendar year.
• The first fee, which we refer to as the “Net Investment Income Incentive Fee,” is determined by reference to the Company’s “Pre-Incentive Fee Net Investment Income” (as defined below). Given that this incentive fee is payable without regard to any gain, loss or unrealized depreciation that may occur during the quarter, Oxford Square Management’s incentive fee may be payable notwithstanding a decline in net asset value that quarter.
• The second fee, which we refer to as the “Capital Gains Incentive Fee,” equals 20% of our “Incentive Fee Capital Gains,” which consists of our realized capital gains for each calendar year, computed net of all realized capital losses and unrealized capital depreciation for that calendar year. For accounting purposes under U.S. generally accepted accounting principles (“GAAP”), the Capital Gains Incentive Fee is based on a hypothetical liquidation of the Company. In such a calculation, in order to reflect the theoretical Capital Gains Incentive Fee that would have been payable for a given period as if all unrealized gains were realized, we will accrue a Capital Gains Incentive Fee based upon net realized gains and unrealized depreciation for that calendar year (in accordance with the terms of the Investment Advisory Agreement), plus unrealized appreciation on investments held at the end of the period. It should be noted that a fee so calculated and accrued would not necessarily be payable under the Investment Advisory Agreement, and may never be paid based upon the computation of Capital Gains Incentive Fees in subsequent periods. Amounts paid under the Investment Advisory Agreement will be consistent with the formula in the Investment Advisory Agreement.
The cost of both the Base Fee payable to Oxford Square Management and any incentive fees earned by Oxford Square Management are ultimately borne by our common stockholders.
Calculation of Fees under the Investment Advisory Agreement and 2016 Fee Waiver
The Investment Advisory Agreement specifies the calculation of the advisory fee payable thereunder, as described in greater detail below. However, Oxford Square Management unilaterally determined to waive, under certain circumstances, part of its total fees payable under the Investment Advisory Agreement, pursuant to a fee waiver letter effective April 1, 2016 (the “2016 Fee Waiver”).
The Investment Advisory Agreement provides for a series of calculations to be used in determining the Base Fee and Net Investment Income Incentive Fee payable to Oxford Square Management. The 2016 Fee Waiver operates by providing for a second series of calculations to be run alongside the calculations of the Base Fee and Net Investment Income Incentive Fee under the Investment Advisory Agreement. In the event that the second set of calculations produces a higher combined Base Fee and Net Investment Income Incentive Fee for any quarterly period, those combined fees are set to the original (lower) level, calculated pursuant to the Investment Advisory Agreement. In the event that the second set of calculations produces lower combined Base Fee and Net Investment Income Incentive Fee for that quarterly period, those lower combined fees are adopted for that quarterly period. In either case, the lower level of combined fees is used for that quarter, and, accordingly, the advisory fee payable to Oxford Square Management can only be reduced, and never increased, as a result of the 2016 Fee Waiver.
11
Calculation of Fees under the Investment Advisory Agreement. Under the Investment Advisory Agreement, and without applying the 2016 Fee Waiver, the total advisory fee would be calculated as follows:
1) Base Fee: The Base Fee is calculated at an annual rate of 2.00% of our gross assets, and appropriately adjusted for any equity or debt capital raises, repurchases or redemptions during the current calendar quarter.
2) Net Investment Income Incentive Fee: The Net Investment Income Incentive Fee is calculated based on our “Pre-Incentive Fee Net Investment Income” for the immediately preceding calendar quarter.
a. For this purpose, “Pre-Incentive Fee Net Investment Income” means interest income, dividend income and any other income (including any other fees, such as commitment, origination, structuring, diligence and consulting fees or other fees that we receive from portfolio companies) accrued during the calendar quarter minus our operating expenses for the quarter (including the Base Fee, expenses payable under our administration agreement, and any interest expense and dividends paid on any issued and outstanding preferred stock, but excluding the incentive fee). Pre-Incentive Fee Net Investment Income includes, in the case of investments with a deferred interest feature (such as original issue discount, debt instruments with payment-in-kind (“PIK”) interest, and zero coupon securities), accrued income that we have not yet received in cash. Pre-Incentive Fee Net Investment Income does not include any realized capital gains, realized capital losses or unrealized capital appreciation or depreciation.
b. Pre-Incentive Fee Net Investment Income, expressed as a rate of return on the value of our net assets at the end of the immediately preceding calendar quarter, is compared to one-fourth of an annual “hurdle rate.” The annual hurdle rate is determined as of the immediately preceding December 31st by adding 5.0% to the interest rate then payable on the most recently issued five-year U.S. Treasury Notes, up to a maximum annual hurdle rate of 10.0%. The annual hurdle rates for the 2020, 2019 and 2018 calendar years, calculated as of December 31, were approximately 6.69%, 7.51%, and 7.20%, respectively, under the terms of the Investment Advisory Agreement. Our net investment income (to the extent not distributed to our shareholders) used to calculate the Net Investment Income Incentive Fee was also included in the amount of our gross assets used to calculate the 2.00% Base Fee.
c. The operation of the incentive fee with respect to our Pre-Incentive Fee Net Investment Income for each quarter is as follows:
i. no incentive fee was payable to Oxford Square Management in any calendar quarter in which our Pre-Incentive Fee Net Investment Income did not exceed one fourth of the annual hurdle rate (approximately 6.69% for the 2020 calendar year).
ii. 20% of the amount of our Pre-Incentive Fee Net Investment Income, if any, that exceeds one-fourth of the annual hurdle rate (approximately 6.69% for the 2020 calendar year) in any calendar quarter was payable to Oxford Square Management (i.e., once the hurdle rate is reached, 20% of all Pre-Incentive Fee Net Investment Income thereafter was allocated to Oxford Square Management).
3) Capital Gains Incentive Fee. The “Capital Gains Incentive Fee,” is determined as described above.
For more information about the calculation of the advisory fee under the Investment Advisory Agreement prior to effectiveness of the 2016 Fee Waiver, refer to our Annual Report on Form 10-K for the fiscal year ended December 31, 2016.
Calculation of Fees under the 2016 Fee Waiver. Following the effectiveness of the 2016 Fee Waiver, a second set of calculations is applied each quarter, and, if (and only if) those calculations result in a lower total advisory fee (i.e., the combination of the Base Fee and any incentive fees), they are used to calculate the total advisory fee
12
payable to Oxford Square Management for a particular quarter. No individual element of those calculations is applicable by itself – only the totality of those calculations is considered. Generally, and as described in greater detail below, under the second set of calculations provided for by the 2016 Fee Waiver:
1) Base Fee:
a. The calculation of the Base Fee component is reduced from 2.00% to 1.50%; and
b. No Base Fee is calculated on funds received in connection with any capital raises until the funds are invested.
2) Net Investment Income Incentive Fee:
a.The calculation of our Net Investment Income Incentive Fee is revised to include a Total Return Requirement (as defined below). Under the Total Return Requirement, we are only required to pay Oxford Square Management a Net Investment Income Incentive Fee if 20% of the “cumulative net increase in net assets resulting from operations” (as defined below) — during the calendar quarter for which such fees are being calculated and the eleven (11) preceding quarters — is greater than the cumulative Net Investment Income Incentive Fees accrued and/or paid over for the same period, even when our net investment income exceeds the minimum return to our stockholders required to be achieved before Oxford Square Management is entitled to receive a Net Investment Income Incentive Fee (which minimum return is commonly referred to as the “preferred return” or “hurdle rate”);
b. The calculation of our Net Investment Income Incentive Fee incorporates a “catch-up” provision that provides that Oxford Square Management will receive 100% of our net investment income with respect to that portion of such net investment income, if any, that exceeds the preferred return but is less than 2.1875% quarterly (8.75% annualized) and 20% of any net investment income thereafter; and
c. The hurdle rate used to calculate the Net Investment Income Incentive Fee is changed from a variable rate, based on the five-year U.S. Treasury note plus 5.00% (with a maximum of 10%), to a fixed rate of 7.00%.
More specifically, for the purpose of calculating the amount of total advisory fees (if any) to be waived during a particular calendar quarter, the Base Fee and Net Investment Income Incentive Fee are calculated as follows under the 2016 Fee Waiver:
1) Base Fee: The Base Fee is calculated at an annual rate of 1.50%, adjusted pro rata for any share issuances, debt issuances, repurchases or redemptions during the current calendar quarter; provided, however, that no Base Fee is payable on the cash proceeds received by us in connection with any share or debt issuances until such proceeds have been invested in accordance with our investment objectives. The Base Fee for any partial month or quarter is pro-rated.
2) Net Investment Income Incentive Fee: The Income Incentive Fee is calculated based on the amount by which (x) the “Pre-Incentive Fee Net Investment Income” (as defined below) for the calendar quarter exceeds (y) the “Preferred Return Amount” (as defined below) for the calendar quarter.
a. A “Preferred Return Amount” is calculated on a quarterly basis by multiplying 1.75% by the Company’s net asset value at the end of the immediately preceding calendar quarter.
b. The Net Investment Income Incentive Fee is then calculated as follows:
(i) no Net Investment Income Incentive Fee is payable to Oxford Square Management in any calendar quarter in which the “Pre-Incentive Fee Net Investment Income” does not exceed the “Preferred Return Amount”;
(ii) 100% of the “Pre-Incentive Fee Net Investment Income” for such quarter, if any, that exceeds the “Preferred Return Amount” but is less than or equal to a “Catch-Up Amount” determined on a quarterly basis by multiplying 2.1875% by OXSQ’s net asset value at the end of such calendar quarter; and
(iii) for any quarter in which the “Pre-Incentive Fee Net Investment Income” exceeds the “Catch-Up Amount,” the Net Investment Income Incentive Fee will be calculated at the rate of 20% of the amount of the “Pre-Incentive Fee Net Investment Income” for such quarter.
13
c. There is no accumulation of amounts from quarter to quarter for the “Preferred Return Amount,” and accordingly there is no claw back of amounts previously paid to Oxford Square Management if the “Pre-Incentive Fee Net Investment Income” for subsequent quarters is below the quarterly “Preferred Return Amount”.
d. The calculation of the Company’s Net Investment Income Incentive Fee is subject to a total return requirement (the “Total Return Requirement”) that provides that a Net Investment Income Incentive Fee will not be payable to Oxford Square Management except to the extent 20% of the “cumulative net increase in net assets resulting from operations” (which is the amount, if positive, of the sum of the “Pre-Incentive Fee Net Investment Income,” realized gains and losses and unrealized appreciation and depreciation) during the calendar quarter for which such fees are being calculated and the eleven (11) preceding quarters exceeds the cumulative Net Investment Income Incentive Fees accrued and/or paid for such eleven (11) preceding quarters.
3) Capital Gains Incentive Fee. The second part of the incentive fee, the “Capital Gains Incentive Fee,” is determined as described above.
Example 1: Net Investment Income Portion of Incentive Fee for Each Calendar Quarter (applying 2016 Fee Waiver)
Hypothetical Scenario 1
Quarterly Investment income (including interest, dividends, fees, etc.) = 1.25%
Quarterly Hurdle rate = 1.75%
Base Fee(1) = 0.375%
Quarterly Other expenses (legal, accounting, custodian, transfer agent, etc.) = 0.2%
Pre-Incentive Fee Net Investment Income (investment income – (Base Fee + other expenses)) = 0.675%
Pre-Incentive Fee Net Investment Income does not exceed hurdle rate, therefore there is no income-related incentive fee.
Hypothetical Scenario 2
Quarterly Investment income (including interest, dividends, fees, etc.) = 2.50%
Quarterly Hurdle rate = 1.75%
Base Fee(1) = 0.375%
Quarterly Other expenses (legal, accounting, custodian, transfer agent, etc.) = 0.2%
Pre-Incentive Fee Net Investment Income (investment income – (Base Fee + other expenses)) = 1.925%
The Total Return Requirement is met (no Net Investment Income Incentive Fee would be payable if the Total Return Requirement were not met).
Incentive fee = 100%* Pre-Incentive Fee Net Investment Income in excess of the hurdle rate but less than 2.1875% and 20% of any Pre-Incentive Fee Net Investment Income thereafter.
= 100%* (1.925% – 1.75%)
= 100%* 0.175%
= 0.175%
Pre-Incentive Fee Net Investment Income exceeds the hurdle rate but is less than 2.1875%. Therefore the income-related incentive fee is 0.175%.
14
Hypothetical Scenario 3
Quarterly Investment income (including interest, dividends, fees, etc.) = 4.00%
Quarterly Hurdle rate = 1.75%
Base Fee(1) = 0.375%
Quarterly Other expenses (legal, accounting, custodian, transfer agent, etc.) = 0.2%
Pre-Incentive Fee Net Investment Income (investment income – (Base Fee + other expenses)) = 3.425%
The Total Return Requirement is met (no Net Investment Income Incentive Fee would be payable if the Total Return Requirement were not met).
Incentive fee = 100% * Pre-Incentive Fee Net Investment Income in excess of the hurdle rate but less than 2.1875% and 20% of any Pre-Incentive Fee Net Investment Income thereafter.
= 100%* (2.1875% – 1.75%) + 20%* (3.425% – 2.1875%)
= 100%* 0.4375% + 20%* 1.2375%
= 0.4375% + 0.2475%
= 0.685%
Pre-Incentive Fee Net Investment Income exceeds the hurdle rate and 2.1875%. Therefore the income-related incentive fee is 0.685%.
____________
(1) Represents 1.50% annualized Base Fee.
Example 2: Capital Gains Portion of Incentive Fee (*)
Capital Gains Incentive Fee = 20% × Incentive Fee Capital Gains (i.e., our realized capital gains for each calendar year, computed net of all realized capital losses and unrealized capital depreciation for that calendar year)
Hypothetical Scenarios:
• Year 1 = no realized capital gains or losses
• Year 2 = 9% realized capital gains, 0% realized capital losses, 1% unrealized depreciation and 0% unrealized appreciation
• Year 3 = 12% realized capital gains, 0% realized capital losses, 2% unrealized depreciation and 2% unrealized appreciation
|
Year 1 incentive fee |
• Total Incentive Fee Capital Gains = 0 |
|
|
• No Capital Gains Incentive Fee paid to Oxford Square Management in Year 1 |
||
|
Year 2 incentive fee |
• Total Incentive Fee Capital Gains = 8% |
|
|
(9% realized capital gains less 1% unrealized depreciation) |
||
|
• Total Capital Gains Incentive Fee paid to Oxford Square Management in Year 2 |
||
|
= 20% × 8% |
||
|
= 1.6% |
||
15
|
Year 3 incentive fee |
• Total Incentive Fee Capital Gains = 10% |
|
|
(12% realized capital gains less 2% unrealized depreciation; unrealized appreciation has no effect) |
||
|
• Total Capital Gains Incentive Fee paid to Oxford Square Management in Year 3 |
||
|
= 20% × 10% |
||
|
= 2% |
____________
(*) The theoretical amounts of returns shown are based on a percentage of our total net assets and assume no leverage. There is no guarantee that positive returns will be realized, and actual returns may vary from those shown in this example.
Payment of our Expenses
Our primary operating expenses are: i) the payment of advisory fees under the Investment Advisory Agreement, and ii) the allocable portion of overhead and various other expenses incurred by Oxford Funds on our behalf, including rent and the provision of personnel and facilities. Our investment advisory fee compensates Oxford Square Management for acting as our investment adviser, managing the investment and reinvestment of our assets, and, specifically for its work in identifying, evaluating, negotiating, executing and servicing our investments. We bear all other expenses of our operations and transactions, including (without limitation) fees and expenses relating to:
• expenses of offering our debt and equity securities;
• the investigation and monitoring of our investments, including expenses and travel fees incurred in connection with investment due diligence and on-site visits;
• the cost of calculating our net asset value (“NAV”);
• the cost of effecting sales and repurchases of shares of our common stock and other securities;
• investment management and incentive fees payable pursuant to the Investment Advisory Agreement;
• fees payable to third parties relating to, or associated with, making investments and valuing investments (including third-party valuation firms);
• transfer agent, trustee and custodial fees;
• interest payments and other costs related to our borrowings;
• fees and expenses associated with our website, public relations and marketing efforts (including attendance at industry and investor conferences and similar events);
• federal and state registration fees;
• any exchange listing fees;
• federal, state and local taxes;
• independent directors’ fees and expenses, including travel expenses, and other costs of the Board’s meetings and other costs associated with the performance of independent directors’ responsibilities;
• brokerage commissions;
• costs of preparing and mailing proxy statements, stockholders’ reports and notices, including annual proxy solicitations and shareholder meetings;
• costs of preparing government filings, including periodic and current reports with the SEC;
16
• fidelity bond, directors and officers/errors and omissions liability insurance and other insurance premiums; and
• direct costs such as printing, mailing, long distance telephone, staff, rent, independent audits and outside legal costs and all other expenses incurred by either Oxford Funds or us in connection with administering our business, including payments under the Administration Agreement that will be based upon our allocable portion of overhead and other expenses incurred by Oxford Funds on our behalf under the Administration Agreement, including a portion of the rent and the compensation and related expenses of our Chief Financial Officer, our accounting support staff and other administrative support personnel. Related expenses include but are not limited to employee benefit costs, payroll taxes and travel and training expenses. The costs associated with the functions performed by our Chief Compliance Officer are paid by us pursuant to the terms of an agreement between the Company and Alaric Compliance Services, LLC.
All of these expenses are ultimately borne by our common stockholders.
All personnel of our investment adviser when and to the extent engaged in providing investment advisory services, and the compensation and related expenses of such personnel allocable to such services, will be provided and paid for by Oxford Funds, the investment adviser’s managing member.
Duration and Termination
Unless earlier terminated as described below, the Investment Advisory Agreement will remain in effect if approved annually by our Board or by the affirmative vote of the holders of a majority of our outstanding voting securities, including, in either case, approval by a majority of our directors who are not interested persons. The Investment Advisory Agreement will automatically terminate in the event of its assignment. The Investment Advisory Agreement may be terminated by either party without penalty upon 60 days’ written notice to the other. Refer to “Item 1A. Risk Factors — Risks relating to our business and structure — We are dependent upon Oxford Square Management’s key management personnel for our future success, particularly Jonathan H. Cohen and Saul B. Rosenthal.”
Indemnification
The Investment Advisory Agreement provides that, absent willful misfeasance, bad faith or gross negligence in the performance of their respective duties or by reason of the reckless disregard of their respective duties and obligations, Oxford Square Management and its officers, managers, agents, employees, controlling persons, members and any other person or entity affiliated with it, including without limitation Oxford Funds, are entitled to indemnification from OXSQ for any damages, liabilities, costs and expenses (including reasonable attorneys’ fees and amounts reasonably paid in settlement) arising from the rendering of Oxford Square Management’s services under the Investment Advisory Agreement or otherwise as an investment adviser of OXSQ.
Organization of the Investment Adviser
Oxford Square Management is a Delaware limited liability company that is registered as an investment adviser under the Advisers Act. Oxford Funds, a Delaware limited liability company, is Oxford Square Management’s managing member and provides it with all personnel necessary to manage our day-to-day operations and provide the services under the Investment Advisory Agreement. The principal address of Oxford Square Management and of Oxford Funds is 8 Sound Shore Drive, Suite 255, Greenwich, Connecticut 06830.
Oxford Funds is the managing member of Oxford Square Management. Charles M. Royce, a member of our Board, has a minority, non-controlling interest in Oxford Square Management.
17
ADMINISTRATION AGREEMENT
Pursuant to a separate Administration Agreement, Oxford Funds furnishes us with office facilities, together with equipment and clerical, bookkeeping and record keeping services at such facilities. Under the Administration Agreement, Oxford Funds also performs, or oversees the performance of, our required administrative services, which includes being responsible for the financial records which we are required to maintain and preparing reports to our stockholders and reports filed with the SEC. In addition, Oxford Funds assists us in determining and publishing our net asset value, overseeing the preparation and filing of our tax returns and the printing and dissemination of reports to our stockholders, and generally overseeing the payment of our expenses and the performance of administrative and professional services rendered to us by others. Payments under the Administration Agreement are based upon our allocable portion of overhead and other expenses incurred by Oxford Funds on our behalf under the Administration Agreement, including a portion of the rent and the compensation of our Chief Financial Officer, our accounting support staff and other administrative support personnel. The Administration Agreement may be terminated by either party without penalty upon 60 days’ written notice to the other party.
The Administration Agreement provides that, absent willful misfeasance, bad faith or gross negligence in the performance of their respective duties or by reason of the reckless disregard of their respective duties and obligations, Oxford Funds and its officers, managers, agents, employees, controlling persons, members and any other person or entity affiliated with it are entitled to indemnification from OXSQ for any damages, liabilities, costs and expenses (including reasonable attorneys’ fees and amounts reasonably paid in settlement) arising from the rendering of Oxford Funds’ services under the Administration Agreement or otherwise as administrator for OXSQ.
Summary Risk Factors
The risk factors described below are a summary of the principal risk factors associated with an investment in us. These are not the only risks we face. You should carefully consider these risk factors, together with the risk factors set forth in Item 1A. of this Annual Report on Form 10-K and the other reports and documents filed by us with the SEC.
Risks Relating to the Economy
• Events outside of our control, including public health crises, could negatively affect our portfolio companies and our results of our operations.
• We are currently operating in a period of capital markets disruption and economic uncertainty.
• Adverse developments in the credit markets may impair our ability to secure debt financing.
• The current period of capital markets disruption and economic uncertainty may make it difficult to extend the maturity of, or refinance, our existing indebtedness or obtain new indebtedness and any failure to do so could have a material adverse effect on our business, financial condition or results of operations.
Risks Relating to Our Business and Structure
• Any failure on our part to maintain our status as a business development company would reduce our operating flexibility, including our ability to borrow money.
• We are dependent upon Oxford Square Management’s key management personnel for our future success, particularly Jonathan H. Cohen and Saul B. Rosenthal.
• Our financial condition and results of operations will depend on our ability to manage our existing portfolio and future growth effectively.
• Our business and operation could be negatively affected if we become subject to any securities litigation or shareholder activism, which could cause us to incur significant expense, hinder execution of our investment strategy and impact our stock price.
• We operate in a highly competitive market for investment opportunities.
18
• Our business model depends to a significant extent upon strong referral relationships with financial sponsors, and the inability of the senior investment professionals of our investment adviser to maintain or develop these relationships, or the failure of these relationships to generate investment opportunities, could adversely affect our business.
• There will be uncertainty as to the value of our portfolio investments, which may impact our net asset value.
• Further downgrades of the U.S. credit rating, impending automatic spending cuts or another government shutdown could negatively impact our liquidity, financial condition and earnings.
• Our business is subject to increasingly complex corporate governance, public disclosure and accounting requirements that could adversely affect our business and financial results.
• Changes relating to the LIBOR calculation process may adversely affect the value of our portfolio of the LIBOR-indexed, floating-rate debt securities.
• A disruption in the capital markets and the credit markets could negatively affect our business.
• We are permitted to borrow money, which magnifies the potential for gain or loss on amounts invested and may increase the risk of investing in us.
• Regulations governing our operation as a BDC affect our ability to, and the way in which we raise additional capital, which may expose us to risks, including the typical risks associated with leverage.
• Our Board of Directors is authorized to reclassify any unissued shares of common stock into one or more classes of preferred stock, which could convey special rights and privileges to its owners.
• Our ability to enter into transactions involving derivatives and financial commitment transactions may be limited.
• We will be subject to corporate-level U.S. federal income tax if we are unable to qualify for tax treatment as a RIC for U.S. federal income tax purposes.
• There are significant potential conflicts of interest between OXSQ and our management team.
• Our Board of Directors may change our investment objective, operating policies and strategies without prior notice or stockholder approval.
Risks Relating to Our Investments
• Our investment portfolio may be concentrated in a limited number of portfolio companies, which will subject us to a risk of significant loss if any of these companies defaults on its obligations under any of its debt securities that we hold or if the sectors in which we invest experience a market downturn.
• The lack of liquidity in our investments may adversely affect our business.
• If we cannot obtain additional capital because of either regulatory or market price constraints, we could be forced to curtail or cease our new lending and investment activities, our net asset value could decrease and our level of distributions and liquidity could be affected adversely.
• Our investments in the companies that we target may be extremely risky and we could lose all or part of our investments.
• Our incentive fee may induce Oxford Square Management to use leverage and to make speculative investments.
• Our portfolio companies may incur debt that ranks equally with, or senior to, our investments in such companies.
• Our investments in CLO vehicles are riskier and less transparent to us and our stockholders than direct investments in the underlying senior loans.
19
Risks Relating to an Investment in Our Securities
• Our common stock price may be volatile.
• Our shares of common stock have traded at a discount from net asset value and may do so in the future.
• If the current period of capital market disruption and instability continues for an extended period of time, there is a risk that investors in our equity securities may not receive distributions consistent with historical levels or at all or that our distributions may not grow over time and a portion of our distributions may be a return of capital.
• Due to the COVID-19 pandemic or other disruptions in the economy, we may not be able to increase our dividends and may reduce or defer our dividends and choose to incur U.S. federal excise tax in order to preserve cash and maintain flexibility.
• We may choose to pay distributions in our own common stock, in which case, our stockholders may be required to pay U.S. federal income taxes in excess of the cash distributions they receive.
COMPETITION
Our primary competitors to provide financing to primarily non-public companies include private equity and venture capital funds, other equity and non-equity based investment funds, including other BDCs, and investment banks and other sources of financing, including traditional financial services companies such as commercial banks and specialty finance companies. Many of these entities may have greater financial and managerial resources than we have. For additional information concerning the competitive risks we face, refer to “Item 1A. Risk Factors — Risks Relating to Our Business and Structure — We operate in a highly competitive market for investment opportunities.”
EMPLOYEES
We have no employees. Our day-to-day investment operations are managed by Oxford Square Management. In addition, we reimburse Oxford Funds for an allocable portion of expenses incurred by it on our behalf under the Administration Agreement, including a portion of the rent and the compensation of our Chief Financial Officer, accounting staff and other administrative support personnel. We will also pay the costs associated with the functions performed by our Chief Compliance Officer under the terms of an agreement between the Company and Alaric Compliance Services.
CERTAIN U.S. FEDERAL INCOME TAX CONSIDERATIONS
As a BDC, we have elected to be treated, and intend to qualify annually, as a RIC under Subchapter M of the Code, beginning with our 2003 taxable year. As a RIC, we generally will not have to pay corporate-level U.S. federal income taxes on any ordinary income or capital gains that we timely distribute to our stockholders as dividends. To continue to qualify as a RIC, we must, among other things, meet certain source-of-income and asset diversification requirements (as described below). In addition, to qualify for RIC tax treatment we must distribute to our stockholders, for each taxable year, at least 90% of our “investment company taxable income,” which is generally our ordinary income plus the excess of our realized net short-term capital gains over our realized net long-term capital losses (the “Annual Distribution Requirement”).
Taxation as a RIC
If we qualify as a RIC; and satisfy the Annual Distribution Requirement, then we will not be subject to U.S. federal income tax on the portion of our investment company taxable income and net capital gain (i.e., realized net long-term capital gains in excess of realized net short-term capital losses) we distribute to stockholders. We will be subject to U.S. federal income tax at the regular corporate rates on any income or capital gains not distributed (or deemed distributed) to our stockholders.
20
We will be subject to a 4% nondeductible U.S. federal excise tax on certain undistributed income unless we distribute in a timely manner an amount at least equal to the sum of (1) 98% of our net ordinary income for each calendar year, (2) 98.2% of our capital gain net income for the one-year period ending October 31 in that calendar year and (3) any income and net capital gain that we recognized in preceding years but were not distributed in such years, and on which we paid no corporate-level U.S. federal income tax (the “Excise Tax Avoidance Requirement”). We generally will endeavor in each taxable year to make sufficient distributions to our stockholders to satisfy the Excise Tax Avoidance Requirement.
In order to qualify as a RIC for U.S. federal income tax purposes, we must, among other things:
• at all times during each taxable year, be registered under the 1940 Act as a management company or unit investment trust, or have in effect an election under the 1940 Act to be treated as a BDC;
• derive in each taxable year at least 90% of our gross income from dividends, interest, payments with respect to loans of certain securities, gains from the sale of stock or other securities, net income from certain “qualified publicly traded partnerships,” or other income derived with respect to our business of investing in such stock or securities (the “90% Income Test”); and
• diversify our holdings so that at the end of each quarter of the taxable year:
• at least 50% of the value of our assets consists of cash, cash equivalents, U.S. government securities, securities of other RICs, and other securities if such other securities of any one issuer do not represent more than 5% of the value of our assets or more than 10% of the outstanding voting securities of the issuer; and
• no more than 25% of the value of our assets is invested in the securities, other than U.S. government securities or securities of other RICs, of one issuer, of two or more issuers that are controlled, as determined under applicable Code rules, by us and that are engaged in the same or similar or related trades or businesses or of certain “qualified publicly traded partnerships” (the “Diversification Tests”).
We may be required to recognize taxable income in circumstances in which we do not receive cash. For example, if we hold debt obligations that are treated under applicable tax rules as having original issue discount (such as debt instruments with PIK interest or, in certain cases, increasing interest rates or issued with warrants), we must include in income each year a portion of the original issue discount that accrues over the life of the obligation, regardless of whether cash representing such income is received by us in the same taxable year. We may also have to include in income other amounts that we have not yet received in cash, such as PIK interest and deferred loan origination fees that are paid after origination of the loan or are paid in non-cash compensation such as warrants or stock. Because any original issue discount or other amounts accrued will be included in our investment company taxable income for the year of accrual, we may be required to make a distribution to our stockholders in order to satisfy the Annual Distribution Requirement, even though we will not have received any corresponding cash amount. In addition, we may be required to accrue for U.S. federal income tax purposes amounts attributable to our investment in CLOs that may differ from the distributions received in respect of such investments. Although we do not presently expect to do so, we are authorized to borrow funds, to sell assets and to make taxable distributions of our stock and debt securities in order to satisfy distribution requirements. Our ability to dispose of assets to meet our distribution requirements may be limited by (1) the illiquid nature of our portfolio and/or (2) other requirements relating to our status as a RIC, including the Diversification Tests. If we dispose of assets in order to meet the Annual Distribution Requirement or the Excise Tax Avoidance Requirement, we may make such dispositions at times that, from an investment standpoint, are not advantageous. If we are unable to obtain cash from other sources to satisfy the Annual Distribution Requirement, we may fail to qualify for tax treatment as a RIC and become subject to tax as an ordinary corporation.
Under the 1940 Act, we are not permitted to make distributions to our stockholders while our debt obligations and other senior securities are outstanding unless certain “asset coverage” tests are met. If we are prohibited to make distributions, we may fail to qualify for tax treatment as a RIC and become subject to tax as an ordinary corporation.
We have purchased and may in the future purchase residual or subordinated interests in CLOs that are treated for U.S. federal income tax purposes as shares in a “passive foreign investment company” or a PFIC. We may be subject to U.S. federal income tax on our allocable share of a portion of any “excess distribution” received on, or any gain from the disposition of, such shares, even if our allocable share of such income is distributed as a taxable distribution to the PFIC’s stockholders. Additional charges, in the nature of interest, generally will be imposed on
21
us in respect of deferred taxes arising from any such excess distribution or gain. If we elect to treat a PFIC as a “qualified electing fund” under the Code (a “QEF”), in lieu of the foregoing requirements, we will be required to include in income each year our proportionate share of the ordinary earnings and net capital gain of the QEF, even if such income is not distributed by the QEF. Alternatively, we may be able to elect to mark-to-market at the end of each taxable year our shares in a PFIC; in this case, we will recognize as ordinary income our allocable share of any increase in the value of such shares, and as ordinary loss our allocable share of any decrease in such value to the extent that any such decrease does not exceed prior increases included in our income. Under either election, we may be required to recognize in a year income in excess of distributions from PFICs and proceeds from dispositions of PFIC shares during that year, and such income will nevertheless be subject to the Annual Distribution Requirement and will be taken into account for purposes of the Excise Tax Avoidance Requirement.
If we hold more than 10% of the shares in a foreign corporation that is treated as a controlled foreign corporation or a CFC (including equity tranche investments in a CLO treated as a CFC), we may be treated as receiving a deemed distribution (taxable as ordinary income) each year from such foreign corporation in an amount equal to our pro rata share of the corporation’s income for the tax year (including both ordinary earnings and capital gains), whether or not the corporation makes an actual distribution during such year. This deemed distribution is required to be included in the income of a U.S. Stockholder (as defined below) of a CFC regardless of whether the stockholder has made a QEF election with respect to such CFC. In general, a foreign corporation will be classified as a CFC if more than 50% of the shares of the corporation, measured by reference to combined voting power or value, is owned (directly, indirectly or by attribution) by U.S. Stockholders. A “U.S. Stockholder,” for this purpose, is any U.S. person that possesses (actually or constructively) 10% or more of the combined voting power or value of all classes of shares of a corporation. If we are treated as receiving a deemed distribution from a CFC, we will be required to include such distribution in our investment company taxable income regardless of whether we receive any actual distributions from such CFC, and we must distribute such income to satisfy the Annual Distribution Requirement and the Excise Tax Avoidance Requirement.
Income inclusions from a QEF or a CFC will be “good income” for purposes of the 90% Income Test provided that they are derived in connection with our business of investing in stocks and securities or the QEF or the CFC distribute such income to us in the same taxable year to which the income is included in our income.
Failure to Qualify as a RIC
If we were unable to qualify for treatment as a RIC, and certain cure provisions are not met, we would be subject to tax on all of our taxable income at regular corporate rates, regardless of whether we make any distributions to our stockholders. Distributions would not be required, and any distributions made would be taxable to our stockholders as ordinary dividend income that, subject to certain limitations, may be eligible for the 20.0% maximum rate to the extent of our current and accumulated earnings and profits. Subject to certain limitations under the Code, corporate distributees would be eligible for the dividends-received deduction. Distributions in excess of our current and accumulated earnings and profits would be treated first as a return of capital to the extent of the stockholder’s tax basis, and any remaining distributions would be treated as a capital gain. To requalify as a RIC in a subsequent taxable year, we would be required to satisfy the RIC qualification requirements for that year and dispose of any earnings and profits from any year in which we failed to qualify as a RIC. Subject to a limited exception applicable to RICs that qualified as such under the Code for at least one year prior to disqualification and that requalify as a RIC no later than the second year following the nonqualifying year, we would be subject to tax on any unrealized net built-in gains in the assets held by us during the period in which we failed to qualify as a RIC that are recognized within the subsequent 5 years, unless we made a special election to pay corporate-level U.S. federal income tax on such built-in gains at the time of our requalification as a RIC.
REGULATION AS A BUSINESS DEVELOPMENT COMPANY
General
A BDC is regulated by the 1940 Act. A BDC must be organized in the United States for the purpose of investing in or lending to primarily private companies and making managerial assistance available to them. A BDC may use capital provided by public stockholders and from other sources to invest in long-term, private investments in businesses. A BDC provides stockholders the ability to retain the liquidity of a publicly traded stock, while sharing in the possible benefits, if any, of investing in primarily privately owned companies.
22
We may not change the nature of our business so as to cease to be, or withdraw our election as, a BDC unless authorized by the vote of a majority of the outstanding voting securities, as required by the 1940 Act. A majority of the outstanding voting securities of a company is defined under the 1940 Act as the lesser of: (i) 67% or more of such company’s voting securities present at a meeting if more than 50% of the outstanding voting securities of such company are present or represented by proxy, or (ii) more than 50% of the outstanding voting securities of such company. We currently do not anticipate any substantial change in the nature of our business.
As with other companies regulated by the 1940 Act, a BDC must adhere to certain substantive regulatory requirements. A majority of our directors must be persons who are not interested persons, as that term is defined in the 1940 Act. Additionally, we are required to provide and maintain a bond issued by a reputable fidelity insurance company to protect the BDC. Furthermore, as a BDC, we are prohibited from protecting any director or officer against any liability to the company or our stockholders arising from willful misfeasance, bad faith, gross negligence or reckless disregard of the duties involved in the conduct of such person’s office.
As a BDC, we are required to meet a coverage ratio of the value of total assets to total senior securities, which includes all of our borrowings and any preferred stock we may issue in the future. On April 6, 2018, the Board, including a “required majority” (as such term is defined in Section 57(o) of the 1940 Act) of the Board, approved the modified asset coverage requirements set forth in Section 61(a)(2) of the 1940 Act. As a result, our asset coverage requirement under the 1940 Act for senior securities was changed from 200% to 150%, effective as of April 6, 2019. In other words, under the 1940 Act, we are able to borrow $2 for investment purposes for every $1 of investor equity. We may also be prohibited under the 1940 Act from knowingly participating in certain transactions with our affiliates without the prior approval of our directors who are not interested persons and, in some cases, prior approval by the SEC.
We are not generally able to sell our common stock at a price below net asset value per share. Refer to “Risk Factors — Risks Relating to our Business and Structure — Regulations governing our operation as a BDC affect our ability to, and the way in which we raise additional capital, which may expose us to risks, including the typical risks associated with leverage.” We may, however, sell our common stock at a price below net asset value per share (i) in connection with a rights offering to our existing stockholders, (ii) with the consent of the majority of our common stockholders, or (iii) under such other circumstances as the SEC may permit. For example, we may sell our common stock, or warrants, options or rights to acquire our common stock, at a price below the then current net asset value of our common stock if our Board determines that such sale is in our best interests and the best interests of our stockholders, and our stockholders approve our policy and practice of making such sales. In any such case, under such circumstances, the price at which our common stock is to be issued and sold may not be less than a price which, in the determination of our Board, closely approximates the market value of such common stock. In addition, we may generally issue new shares of our common stock at a price below the net asset value in rights offerings to existing stockholders, in payment of distributions and in certain other limited circumstances
We may be examined by the SEC for compliance with the 1940 Act.
As a BDC, we are subject to certain risks and uncertainties. Refer to “Item 1A. Risk Factors — Risks Relating to our Business and Structure.”
Qualifying Assets
As a BDC, we may not acquire any asset other than “qualifying assets” unless, at the time we make the acquisition, the value of our qualifying assets represent at least 70% of the value of our total assets. The principal categories of qualifying assets relevant to our business are:
• securities purchased in transactions not involving any public offering, the issuer of which is an eligible portfolio company;
• securities received in exchange for or distributed with respect to securities described in the bullet above or pursuant to the exercise of options, warrants or rights relating to such securities; and
• cash, cash items, government securities or high quality debt securities (within the meaning of the 1940 Act), maturing in one year or less from the time of investment.
23
An eligible portfolio company is generally a domestic company that is not an investment company (other than a small business investment company wholly owned by a BDC) and that:
• does not have a class of securities with respect to which a broker may extend margin credit at the time the acquisition is made;
• is controlled by the BDC and has an affiliate of the BDC on its board of directors;
• does not have any class of securities listed on a national securities exchange;
• is a public company that lists its securities on a national securities exchange with a market capitalization of less than $250 million; or
• meets such other criteria as may be established by the SEC.
Control, as defined by the 1940 Act, is presumed to exist where a BDC beneficially owns more than 25% of the outstanding voting securities of the portfolio company.
In addition, a BDC must have been organized and have its principal place of business in the United States and must be operated for the purpose of making investments in eligible portfolio companies, or in other securities that are consistent with its purpose as a BDC.
Significant Managerial Assistance
BDCs generally must offer to make available to the issuer of the securities significant managerial assistance, except in circumstances where either (i) the BDC controls such issuer of securities or (ii) the BDC purchases such securities in conjunction with one or more other persons acting together and one of the other persons in the group makes available such managerial assistance. Making available managerial assistance means, among other things, any arrangement whereby the BDC offers to provide, and, if accepted, does so provide, significant guidance and counsel concerning the management, operations or business objectives and policies of a portfolio company. The Administrator or its affiliate provides such managerial assistance on our behalf to portfolio companies that request this assistance.
Code of Ethics and Insider Trading Policy
As required by the 1940 Act, we maintain a Code of Ethics and Insider Trading Policy, or “Code of Ethics,” that establishes procedures for personal investments and restricts certain transactions by our personnel. Refer to “Item 1A. Risk Factors — Risks Relating to our Business and Structure — There are significant potential conflicts of interest between OXSQ and our management team.” Our Code of Ethics generally does not permit investments by our employees in securities that may be purchased or held by us. The Code of Ethics is available on the EDGAR Database on the SEC’s website at http://www.sec.gov. You may obtain copies of the Code of Ethics, after paying a duplicating fee, by electronic request at the following email address: publicinfo@sec.gov. Our Code of Ethics is also available on our website at http://oxfordsquarecapital.com/.
Compliance Policies and Procedures
We and our investment adviser have adopted and implemented written policies and procedures reasonably designed to prevent violation of the federal securities laws, and are required to review these compliance policies and procedures annually for their adequacy and the effectiveness of their implementation, and to designate a Chief Compliance Officer to be responsible for administering the policies and procedures.
Sarbanes-Oxley Act of 2002
The Sarbanes-Oxley Act of 2002 (the “Sarbanes-Oxley Act”) imposes a wide variety of regulatory requirements on publicly-held companies and their insiders. Many of these requirements affect us. For example:
• pursuant to Rule 13a-14 of the Securities Exchange Act of 1934, as amended, (the “Exchange Act”), our Chief Executive Officer and Chief Financial Officer must certify the accuracy of the financial statements contained in our periodic reports;
24
• pursuant to Item 307 of Regulation S-K, our periodic reports must disclose our conclusions about the effectiveness of our disclosure controls and procedures;
• pursuant to Rule 13a-15 of the Exchange Act, our management must prepare a report regarding its assessment of our internal control over financial reporting; and
• pursuant to Item 308 of Regulation S-K and Rule 13a-15 of the Exchange Act, our periodic reports must disclose whether there were significant changes in our internal controls or in other factors that could significantly affect these controls subsequent to the date of their evaluation, including any corrective actions with regard to significant deficiencies and material weaknesses.
The Sarbanes-Oxley Act requires us to review our current policies and procedures to determine whether we comply with the Sarbanes-Oxley Act and the regulations promulgated thereunder. We will continue to monitor our compliance with all regulations that are adopted under the Sarbanes-Oxley Act and will take actions necessary to ensure that we are in compliance therewith.
Proxy Voting Policies and Procedures
We have delegated our proxy voting responsibility to our investment adviser, Oxford Square Management. The Proxy Voting Policies and Procedures of Oxford Square Management are set forth below. The guidelines are reviewed periodically by Oxford Square Management, and, accordingly, are subject to change.
Introduction
As an investment adviser registered under the Advisers Act, Oxford Square Management has a fiduciary duty to act solely in the best interests of its clients. As part of this duty, Oxford Square Management recognizes that it must vote client securities in a timely manner free of conflicts of interest and in the best interests of its clients.
These policies and procedures for voting proxies for Oxford Square Management’s investment advisory clients are intended to comply with Section 206 of, and Rule 206(4)-6 under, the Advisers Act.
Proxy Policies
Oxford Square Management will vote proxies relating to our portfolio securities in the best interests of our stockholders. Oxford Square Management will review on a case-by-case basis each proposal submitted to a stockholder vote to determine its impact on the portfolio securities held by OXSQ. Although Oxford Square Management will generally vote against proposals that may have a negative impact on our portfolio securities, it may vote for such a proposal if there exist compelling long-term reasons to do so. Oxford Square Management will abstain from voting only in unusual circumstances and where there is a compelling reason to do so.
The proxy voting decisions of Oxford Square Management are made by the senior officers of Oxford Square Management who are responsible for monitoring each of our investments. To ensure that its vote is not the product of a conflict of interest, Oxford Square Management requires that: (i) anyone involved in the decision making process disclose to Oxford Square Management’s Chief Compliance Officer any potential conflict that he or she is aware of and any contact that he or she has had with any interested party regarding a proxy vote; and (ii) employees involved in the decision making process or vote administration are prohibited from revealing how Oxford Square Management intends to vote on a proposal without the prior approval of the Chief Compliance Officer and senior management in order to reduce any attempted influence from interested parties.
Proxy Voting Records
You may obtain information about how Oxford Square Management voted proxies by making a written request for proxy voting information to: Chief Compliance Officer, Oxford Square Management, LLC, 8 Sound Shore Drive, Suite 255, Greenwich, CT 06830.
25
Periodic Reporting and Audited Financial Statements
We have registered our common stock under the Exchange Act, and have reporting obligations thereunder, including the requirement that we file annual and quarterly reports with the SEC. In accordance with the requirements of the Exchange Act, this annual report contains financial statements audited and reported on by our independent registered public accounting firm. You may obtain our annual reports on Form 10-K, our quarterly reports on Form 10-Q, and our current reports on Form 8-K on our website at http://oxfordsquarecapital.com/ free of charge as soon as reasonably practicable after we file such reports electronically with the SEC.
NASDAQ Global Select Market Requirements
We have adopted certain policies and procedures intended to comply with the NASDAQ Global Select Market’s corporate governance rules. We will continue to monitor our compliance with all future listing standards that are approved by the SEC and will take actions necessary to ensure that we are in compliance therewith.
26
Investing in our securities involves a number of significant risks. In addition to the other information contained in this Annual Report, you should consider carefully the following information before making an investment in our securities. The risk factors described below are the principal risk factors associated with an investment in our securities, as well as those factors generally associated with a business development company with investment objectives, investment policies, capital structure or trading markets similar to ours, including the risks associated with investing in a portfolio of small and developing or financially troubled businesses. Additional risks and uncertainties not presently known to us or not presently deemed material by us might also impair our operations and performance. If any of the following events occur, our business, financial condition and results of operations could be materially and adversely affected. In such case, our net asset value and the trading price of our common stock could decline, and you may lose all or part of your investment.
RISKS RELATING TO THE ECONOMY
Events outside of our control, including public health crises, could negatively affect our portfolio companies and our results of our operations.
Periods of market volatility have occurred and could continue to occur in response to pandemics or other events outside of our control. These types of events have adversely affected and could continue to adversely affect operating results for us and for our portfolio companies. For example, the COVID-19 pandemic has delivered a shock to the global economy. This outbreak has led and for an unknown period of time will continue to lead to disruptions in local, regional, national and global markets and economies affected thereby, including a recession and a steep increase in unemployment in the United States.
With respect to the U.S. credit markets (in particular for middle market loans), this outbreak has resulted in, and until fully resolved is likely to continue to result in, the following among other things: (i) government imposition of various forms of shelter-in-place orders and the closing of “non-essential” businesses, resulting in significant disruption to the businesses of many middle-market loan borrowers including supply chains, demand and practical aspects of their operations, as well as in lay-offs of employees, and, while these effects are hoped to be temporary, some effects could be persistent or even permanent; (ii) increased draws by borrowers on revolving lines of credit; (iii) increased requests by borrowers for amendments and waivers of their credit agreements to avoid default, increased defaults by such borrowers and/or increased difficulty in obtaining refinancing at the maturity dates of their loans; (iv) volatility and disruption of these markets including greater volatility in pricing and spreads and difficulty in valuing loans during periods of increased volatility, and liquidity issues; and (v) rapidly evolving proposals and/or actions by state and federal governments to address problems being experienced by the markets and by businesses and the economy in general which will not necessarily adequately address the problems facing the loan market and middle market businesses.
While several countries, as well as certain states, counties and cities in the United States, have relaxed initial public health restrictions with the view to partially or fully reopening their economies, many cities have since experienced a surge in the reported number of cases, hospitalizations and deaths related to the COVID-19 pandemic. These surges have led to the re-introduction of such restrictions and business shutdowns in certain states in the United States and globally and could continue to lead to the re-introduction of such restrictions elsewhere. Health advisors warn that recurring COVID-19 outbreaks will continue if reopening is pursued too soon or in the wrong manner, which may lead to the re-introduction or continuation of certain public health restrictions (such as instituting quarantines, prohibitions on travel and the closure of offices, businesses, schools, retail stores and other public venues). Additionally, as of late December 2020, travelers from the United States are not allowed to visit Canada, Australia or the majority of countries in Europe, Asia, Africa and South America. These continued travel restrictions may prolong the global economic downturn. In addition, although the Federal Food and Drug Administration authorized vaccines for emergency use starting in December 2020, it remains unclear how quickly the vaccines will be distributed nationwide and globally or when “herd immunity” will be achieved and the restrictions that were imposed to slow the spread of the virus will be lifted entirely. The delay in distributing the vaccines could lead people to continue to self-isolate and not participate in the economy at pre-pandemic levels for a prolonged period of time. Even after the COVID-19 pandemic subsides, the U.S. economy and most other major global economies may continue to experience a recession, and we anticipate our business and operations could be materially adversely affected by a prolonged recession in the United States and other major markets.
27
This outbreak is having, and any future outbreaks could have, an adverse impact on the markets and the economy in general, which could have a material adverse impact on, among other things, the ability of lenders to originate loans, the volume and type of loans originated, and the volume and type of amendments and waivers granted to borrowers and remedial actions taken in the event of a borrower default, each of which could negatively impact the amount and quality of loans available for investment by us and returns to us, among other things. As of the date of this annual report on Form 10-K, it is impossible to determine the scope of this outbreak, or any future outbreaks, how long any such outbreak, market disruption or uncertainties may last, the effect any governmental actions will have or the full potential impact on us and our portfolio companies. Any potential impact to our results of operations will depend to a large extent on future developments and new information that could emerge regarding the duration and severity of COVID-19 and the actions taken by authorities and other entities to contain COVID-19 or treat its impact, all of which are beyond our control. These potential impacts, while uncertain, could adversely affect our and our portfolio companies’ operating results.
If the economy is unable to substantially reopen, and high levels of unemployment continue for an extended period of time, loan delinquencies, loan non-accruals, problem assets, and bankruptcies may increase. In addition, collateral for our loans may decline in value, which could cause loan losses to increase and the net worth and liquidity of loan guarantors could decline, impairing their ability to honor commitments to us. An increase in loan delinquencies and non-accruals or a decrease in loan collateral and guarantor net worth could result in increased costs and reduced income which would have a material adverse effect on our business, financial condition or results of operations. Additionally, oil prices collapsed to an 18-year low on supply glut concerns, as shutdowns across the global economy sharply reduced oil demand while Saudi Arabia and Russia engaged in a price war. Central banks and governments have responded with liquidity injections to ease the strain on financial systems and stimulus measures to buffer the shock to businesses and consumers. These measures have helped stabilize certain portions of the financial markets over the short term, but volatility will likely remain elevated until the health crisis itself is under control (via fewer new cases, lower infection rates and/or verified treatments). There are still many unknowns and new information is incoming daily, compounding the difficulty of modeling outcomes for epidemiologists and economists alike.
We cannot be certain as to the duration or magnitude of the economic impact of the COVID-19 pandemic in the markets in which we and our portfolio companies operate, including with respect to travel restrictions, business closures, mitigation efforts (whether voluntary, suggested, or mandated by law) and corresponding declines in economic activity that may negatively impact the U.S. economy and the markets for the various types of goods and services provided by U.S. middle market companies. Depending on the duration, magnitude and severity of these conditions and their related economic and market impacts, certain portfolio companies may suffer declines in earnings and could experience financial distress, which could cause them to default on their financial obligations to us and their other lenders.
We will also be negatively affected if our operations and effectiveness or the operations and effectiveness of a portfolio company (or any of the key personnel or service providers of the foregoing) is compromised or if necessary or beneficial systems and processes are disrupted.
Any public health emergency, including the COVID-19 pandemic or any outbreak of other existing or new epidemic diseases, or the threat thereof, and the resulting financial and economic market uncertainty could have a significant adverse impact on us and the fair value of our investments. Our valuations, and particularly valuations of private investments and private companies, are inherently uncertain, may fluctuate over short periods of time and are often based on estimates, comparisons and qualitative evaluations of private information that may not show the complete impact of the COVID-19 pandemic and the resulting measures taken in response thereto. These potential impacts, while uncertain, could adversely affect our and our portfolio companies’ operating results.
Global economic, regulatory and market conditions may adversely affect our business, results of operations and financial condition, including our revenue growth and profitability.
The current worldwide financial market situation, as well as various social and political tensions in the United States and around the world, may contribute to increased market volatility, may have long-term effects on the U.S. and worldwide financial markets, and may cause economic uncertainties or deterioration in the United States and worldwide. The U.S. and global capital markets experienced extreme volatility and disruption during the economic downturn that began in mid-2007, and the U.S. economy was in a recession for several consecutive calendar quarters during the same period.
28
Volatility in the global financial markets resulting from relapse of the Eurozone crisis, geopolitical developments in Eastern Europe, turbulence in the Chinese stock markets and global commodity markets, the United Kingdom’s departure from the European Union or otherwise could have a material adverse effect on our business, financial condition and results of operations.
Volatility in the global financial markets could have an adverse effect on the United States and could result from a number of causes, including a relapse in the Eurozone crisis, geopolitical developments in Eastern Europe, turbulence in the Chinese stock markets and global commodity markets or otherwise. In 2010, a financial crisis emerged in Europe, triggered by high budget deficits and rising direct and contingent sovereign debt in Greece, Ireland, Italy, Portugal and Spain, which created concerns about the ability of these nations to continue to service their sovereign debt obligations. While the financial stability of many of such countries has improved significantly, risks resulting from any future debt crisis in Europe or any similar crisis could have a detrimental impact on the global economic recovery, sovereign and non-sovereign debt in these countries and the financial condition of European financial institutions.
Market and economic disruptions have affected, and may in the future affect, consumer confidence levels and spending, personal bankruptcy rates, levels of incurrence and default on consumer debt and home prices, among other factors. Uncertainty between the United States and other countries with respect to trade policies, treaties and tariffs, among other factors, have caused disruptions in the global markets, including markets in which we participate. We cannot assure you that these market conditions will not continue or worsen in the future. Furthermore, we cannot assure you that market disruptions in Europe, including the increased cost of funding for certain governments and financial institutions, will not impact the global economy, and we cannot assure you that assistance packages will be available, or if available, be sufficient to stabilize countries and markets in Europe or elsewhere affected by a financial crisis. To the extent uncertainty regarding any economic recovery in Europe negatively impacts consumer confidence and consumer credit factors, our business, financial condition and results of operations could be significantly and adversely affected.
In the second quarter of 2015, stock prices in China experienced a significant drop, resulting primarily from continued sell-off of shares trading in Chinese markets. In addition, in August 2015, Chinese authorities sharply devalued China’s currency. Since then, the Chinese capital markets have continued to experience periods of instability. These market and economic disruptions have affected, and may in the future affect, the U.S. capital markets, which could adversely affect our business, financial condition or results of operations.
The occurrence of events similar to those in recent years, such as the aftermath of the war in Iraq, instability in Afghanistan, Pakistan, Egypt, Libya, Syria, Russia, Ukraine and the Middle East, ongoing epidemics of infectious diseases in certain parts of the world, such as the COVID-19 outbreak, terrorist attacks in the U.S. and around the world, social and political discord, debt crises (such as the Greek crisis), sovereign debt downgrades, continued tensions between North Korea and the United States and the international community generally, new and continued political unrest in various countries, such as Venezuela, the exit or potential exit of one or more countries from the European Union (the “EU”) or the Economic and Monetary Union (the “EMU”), the change in the U.S. president and the new administration, among others, may result in market volatility, may have long term effects on the U.S. and worldwide financial markets, and may cause further economic uncertainties in the U.S. and worldwide.
In June 2016, the United Kingdom (the “UK”) held a referendum in which voters approved an exit from the European Union, or “Brexit,” and, accordingly, on February 1, 2017, the U.K. Parliament voted in favor of allowing the U.K. government to begin the formal process of Brexit. The initial negotiations on Brexit commenced in June 2017. Brexit created political and economic uncertainty and instability in the global markets (including currency and credit markets), and especially in the United Kingdom and the European Union, and this uncertainty and instability may last indefinitely. On January 31, 2020, the UK ended its membership in the European Union. Under the terms of the withdrawal agreement negotiated and agreed between the UK and the European Union, the UK’s departure from the European Union was followed by a transition period (the “Transition Period”), which ran until December 31, 2020 and during which the UK continued to apply European Union law and was treated for all material purposes as if it were still a member of the European Union.
On December 24, 2020, the European Union and UK governments signed a trade deal that became provisionally effective on January 1, 2021 and that now governs the relationship between the UK and European Union (the “Trade Agreement”). The Trade Agreement implements significant regulation around trade, transport of goods and travel
29
restrictions between the UK and the European Union. Notwithstanding the foregoing, the longer term economic, legal, political and social implications of Brexit are unclear at this stage and are likely to continue to lead to ongoing political and economic uncertainty and periods of increased volatility in both the UK and in wider European markets for some time. In particular, Brexit could lead to calls for similar referendums in other European jurisdictions, which could cause increased economic volatility in the European and global markets. This mid- to long-term uncertainty could have adverse effects on the economy generally and on our ability to earn attractive returns. In particular, currency volatility could mean that our returns are adversely affected by market movements. Potential decline in the value of the British Pound and/or the Euro against other currencies, along with the potential further downgrading of the UK’s sovereign credit rating, could also have an impact on the performance of certain investments made in the UK or Europe. There is continued concern about national-level support for the Euro and the accompanying coordination of fiscal and wage policy among European Economic and Monetary Union member countries.
In addition, the fiscal policy of foreign nations, such as Russia and China, may have a severe impact on the worldwide and U.S. financial markets.
Increased geopolitical unrest, terrorist attacks, or acts of war may affect any market for our common stock, impact the businesses in which we invest, and harm our business, operating results, and financial conditions.
Terrorist activity and the continued threat of terrorism and acts of civil or international hostility, both within the United States and abroad, as well as ongoing military and other actions and heightened security measures in response to these types of threats, may cause significant volatility and declines in the global markets, loss of life, property damage, disruptions to commerce and reduced economic activity, which may negatively impact the businesses in which we invest directly or indirectly and, in turn, could have a material adverse impact on our business, operating results, and financial condition. Losses from terrorist attacks are generally uninsurable.
We are currently operating in a period of capital markets disruption and economic uncertainty.
The U.S. capital markets have experienced extreme volatility and disruption following the global outbreak of COVID-19 that began in December 2019. The global impact of the outbreak continues to evolve, and many countries have reacted by instituting quarantines, prohibitions on travel and the closure of offices, businesses, schools, retail stores and other public venues. Businesses have also implemented similar precautionary measures. Such measures, as well as the general uncertainty surrounding the dangers and impact of COVID-19, (including the preventative measures taken in response thereto and additional uncertainty regarding the new variants of COVID-19 that have emerged in the U.K., South Africa and Brazil) have created significant disruption in supply chains and economic activity. While several countries, as well as certain states in the United States, have begun to lift public health restrictions with the view to reopening their economies, recurring COVID-19 outbreaks have led to the re-introduction of such restrictions in certain states in the United States and globally and could continue to lead to the re-introduction of such restrictions elsewhere.
Although the Federal Food and Drug Administration has authorized vaccines for emergency use starting in December 2020, it remains unclear how quickly the vaccines will be distributed nationwide and globally, when “herd immunity” will be achieved in the United States and globally, and when the restrictions that were imposed to slow the spread of the virus will be lifted entirely. The delay in distributing the vaccines could lead people to continue to self-isolate and not participate in the economy at pre-pandemic levels for a prolonged period of time.
Even after the COVID-19 pandemic subsides, the U.S. economy and most other major global economies may continue to experience a recession, and we anticipate our business and operations could be materially adversely affected by a prolonged recession in the United States and other major markets. Additionally, as of late December 2020, travelers from the United States are not allowed to visit Canada, Australia or the majority of countries in Europe, Asia, Africa and South America. These continued travel restrictions may prolong the global economic downturn.
Adverse developments in the credit markets may impair our ability to secure debt financing.
In past economic downturns, such as the financial crisis in the United States that began in mid-2007 and during other times of extreme market volatility, many commercial banks and other financial institutions stopped lending or significantly curtailed their lending activity. In addition, in an effort to stem losses and reduce their exposure to segments of the economy deemed to be high risk, some financial institutions limited routine refinancing and loan modification
30
transactions and even reviewed the terms of existing facilities to identify bases for accelerating the maturity of existing lending facilities. If these conditions recur, for example as a result of the COVID-19 pandemic, it may be difficult for us to obtain desired financing to finance the growth of our investments on acceptable economic terms, or at all.
So far, the COVID-19 pandemic has resulted in, and until fully resolved is likely to continue to result in, among other things, increased draws by borrowers on revolving lines of credit and increased requests by borrowers for amendments, modifications and waivers of their credit agreements to avoid default or change payment terms, increased defaults by such borrowers and/or increased difficulty in obtaining refinancing at the maturity dates of their loans. In addition, the duration and effectiveness of responsive measures implemented by governments and central banks cannot be predicted. The commencement, continuation, or cessation of government and central bank policies and economic stimulus programs, including changes in monetary policy involving interest rate adjustments or governmental policies, may contribute to the development of or result in an increase in market volatility, illiquidity and other adverse effects that could negatively impact the credit markets and the Company.
If we are unable to consummate credit facilities on commercially reasonable terms, our liquidity may be reduced significantly. If we are unable to repay amounts outstanding under any facility we may enter into and are declared in default or are unable to renew or refinance any such facility, it would limit our ability to initiate significant originations or to operate our business in the normal course. These situations may arise due to circumstances that we may be unable to control, such as inaccessibility of the credit markets, a severe decline in the value of the U.S. dollar, a further economic downturn or an operational problem that affects third parties or us, and could materially damage our business. Moreover, we are unable to predict when economic and market conditions may become more favorable. Even if such conditions improve broadly and significantly over the long term, adverse conditions in particular sectors of the financial markets could adversely impact our business.
RISKS RELATING TO OUR BUSINESS AND STRUCTURE
Any failure on our part to maintain our status as a business development company would reduce our operating flexibility, including our ability to borrow money.
If we do not remain a BDC, we might be regulated as a closed-end investment company under the 1940 Act, which would subject us to substantially more regulatory restrictions under the 1940 Act and correspondingly decrease our operating flexibility, including our ability to borrow money.
We are dependent upon Oxford Square Management’s key management personnel for our future success, particularly Jonathan H. Cohen and Saul B. Rosenthal.
We depend on the diligence, skill and network of business contacts of the senior management of Oxford Square Management. The senior management, together with other investment professionals, will evaluate, negotiate, structure, close, monitor and service our investments. Our future success will depend to a significant extent on the continued service and coordination of the senior management team, particularly Jonathan H. Cohen, the Chief Executive Officer of Oxford Square Management, and Saul B. Rosenthal, the President and Chief Operating Officer of Oxford Square Management. Neither Mr. Cohen nor Mr. Rosenthal will devote all of their business time to our operations, and both will have other demands on their time as a result of their other activities. Neither Mr. Cohen nor Mr. Rosenthal is subject to an employment contract. The departure of either of these individuals could have a material adverse effect on our ability to achieve our investment objective. In addition, due to Oxford Square Management’s relatively small staff size, the departure of any of Oxford Square Management’s personnel, including investment, accounting and compliance professionals, could have a material adverse effect on us.
Our financial condition and results of operations will depend on our ability to manage our existing portfolio and future growth effectively.
Our ability to achieve our investment objective will depend on our ability to manage our existing investment portfolio and to grow, which will depend, in turn, on our investment adviser’s ability to identify, analyze, invest in and finance companies that meet our investment criteria, and our ability to raise and retain debt and equity capital. Accomplishing this result on a cost-effective basis is largely a function of our investment adviser’s structuring of the investment process, its ability to provide competent, attentive and efficient services to us and our access to financing on acceptable terms.
31
We and Oxford Square Management, through its managing member, Oxford Funds, will need to continue to hire, train, supervise and manage new employees. Failure to manage our future growth effectively could have a material adverse effect on our business, financial condition and results of operations.
Our business and operation could be negatively affected if we become subject to any securities litigation or shareholder activism, which could cause us to incur significant expense, hinder execution of our investment strategy and impact our stock price.
In the past, following periods of volatility in the market price of a company’s securities, securities class action litigation has often been brought against such company. Shareholder activism, which could take many forms or arise in a variety of situations, has been increasing in the BDC space recently. While we are currently not subject to any securities litigation, due to the volatility of our stock price and for a variety of other reasons, we may in the future become the target of additional securities litigation and the subject of additional shareholder activism. If at any time our current investment advisory agreement is terminated we may not be able to find a new investment adviser or hire internal management with similar expertise and ability to provide the same or equivalent services on acceptable terms. If we are unable to do so quickly, our operations are likely to experience a disruption, our financial condition, business and results of operations as well as our ability to pay distributions are likely to be adversely affected and the market price of our shares may decline.
Securities litigation and shareholder activism, including potential proxy contests, could result in substantial costs and divert management’s and our board of directors’ attention and resources from our business. Additionally, such securities litigation and shareholder activism could give rise to perceived uncertainties as to our future, adversely affect our relationships with service providers and make it more difficult to attract and retain qualified personnel. Also, we may be required to incur significant legal fees and other expenses related to any securities litigation and activist shareholder matters. Further, our stock price could be subject to significant fluctuation or otherwise be adversely affected by the events, risks and uncertainties of any securities litigation and shareholder activism.
The SEC has raised questions regarding certain non-traditional investments, including investments in CLOs.
The staff of the Division of Investment Management has, in correspondence with certain BDCs, raised questions about the level and special risks of investments in CLOs. While it is not possible to predict what conclusions the staff will reach in these areas, or what recommendations the staff might make to the SEC, the imposition of limitations on investments by BDCs in CLOs could adversely impact our ability to implement our investment strategy and/or our ability to raise capital through public offerings, or cause us to take certain actions with potential negative impacts on our financial condition and results of operations. We are unable at this time to assess the likelihood or timing of any such regulatory development.
We operate in a highly competitive market for investment opportunities.
A large number of entities compete with us to make the types of investments that we make. We compete with a large number of hedge funds and CLO investment vehicles, other equity and non-equity based investment funds, including other BDCs, investment banks and other sources of financing, including traditional financial services companies such as commercial banks and specialty finance companies. Many of our competitors are substantially larger than us and have considerably greater financial, technical and marketing resources than we do. For example, some competitors may have a lower cost of funds and access to funding sources that are not available to us. In addition, some of our competitors may have higher risk tolerances or different risk assessments, which could allow them to consider a wider variety of investments and establish more relationships than us. Furthermore, many of our competitors are not subject to the regulatory restrictions that the 1940 Act imposes on us as a BDC. If we are unable to source attractive investments, we may hold a greater percentage of our assets in cash than anticipated, which could impact potential returns on our portfolio. There can be no assurance that the competitive pressures we face will not have a material adverse effect on our business, financial condition and results of operations. Also, as a result of this competition, we may not be able to take advantage of attractive investment opportunities from time to time, and we can offer no assurance that we will be able to identify and make investments that are consistent with our investment objective.
32
Our business model depends to a significant extent upon strong referral relationships with financial sponsors, and the inability of the senior investment professionals of our investment adviser to maintain or develop these relationships, or the failure of these relationships to generate investment opportunities, could adversely affect our business.
We expect that the principals of our investment adviser will maintain and develop their relationships with financial sponsors, brokers and agents and we will rely to a significant extent upon these relationships to provide us with potential investment opportunities. If the senior investment professionals of our investment adviser fail to maintain their existing relationships or develop new relationships with other sponsors or sources of investment opportunities, we will not be able to grow our investment portfolio. In addition, individuals with whom the senior investment professionals of our investment adviser have relationships are not obligated to provide us with investment opportunities, and, therefore, there is no assurance that such relationships will generate investment opportunities for us. If our investment adviser is unable to source investment opportunities, we may hold a greater percentage of our assets in cash than anticipated, which could impact potential returns on our portfolio.
There will be uncertainty as to the value of our portfolio investments, which may impact our net asset value.
A large percentage of our portfolio investments are in the form of securities that are not publicly traded. The fair value of securities and other investments that are not publicly traded may not be readily determinable. We value these securities on a quarterly basis in accordance with our valuation policy, which is consistent with U.S. generally accepted accounting principles (“GAAP”). Our board of directors utilizes the services of third-party valuation firms to aid it in determining the fair value of certain securities. The board of directors discusses valuations and determines the fair value in good faith based on the input of our investment adviser and the respective third-party valuation firms. The factors that may be considered in fair value pricing our investments include the nature and realizable value of any collateral, the portfolio company’s ability to make payments and its earnings, the markets in which the portfolio company does business, comparisons to publicly traded companies, discounted cash flow and other relevant factors. Because such valuations, and particularly valuations of private securities and private companies, are inherently uncertain, may fluctuate over short periods of time and may be based on estimates, our determinations of fair value may differ materially from the values that would have been used if a ready market for these securities existed. Our net asset value could be adversely affected if our determinations regarding the fair value of our investments were materially higher than the values that we ultimately realize upon the disposal of such securities.
Market conditions affect debt and equity capital markets in the U.S. and abroad and may in the future have a negative impact on our business and operations.
Equity capital may be difficult to raise because, subject to some limited exceptions which apply to us, as a BDC we are generally not able to issue additional shares of our common stock at a price less than net asset value. In addition, our ability to incur indebtedness (including by issuing preferred stock) is limited by applicable regulations such that our asset coverage, as defined in the 1940 Act, must equal at least 150% immediately after each time we incur indebtedness. The debt capital that will be available, if at all, may be at a higher cost and on less favorable terms and conditions in the future. Any inability to raise capital could have a negative effect on our business, financial condition and results of operations.
The illiquidity of our investments may make it difficult for us to sell such investments if required. As a result, we may realize significantly less than the value at which we have recorded our investments. In addition, significant changes in the capital markets, including the recent period of extreme volatility and disruption, have had, and may in the future have, a negative effect on the valuations of our investments and on the potential for liquidity events involving our investments. An inability to raise capital, and any required sale of our investments for liquidity purposes, could have a material adverse impact on our business, financial condition or results of operations.
33
Further downgrades of the U.S. credit rating, impending automatic spending cuts or another government shutdown could negatively impact our liquidity, financial condition and earnings.
U.S. debt ceiling and budget deficit concerns have increased the possibility of additional credit-rating downgrades and economic slowdowns, or a recession in the United States. Although U.S. lawmakers passed legislation to raise the federal debt ceiling on multiple occasions, including a suspension of the federal debt ceiling in August 2019, ratings agencies have lowered or threatened to lower the long-term sovereign credit rating on the United States. Further, the federal debt ceiling is scheduled to come back into effect on August 1, 2021, unless Congress takes legislative action to further extend or defer it.
The impact of this or any further downgrades to the U.S. government’s sovereign credit rating or its perceived creditworthiness could adversely affect the U.S. and global financial markets and economic conditions. Absent further quantitative easing by the Federal Reserve, these developments could cause interest rates and borrowing costs to rise, which may negatively impact our ability to access the debt markets on favorable terms. In addition, disagreement over the federal budget has caused the U.S. federal government to shut down for periods of time. Continued adverse political and economic conditions could have a material adverse effect on our business, financial condition and results of operations.
Our business is subject to increasingly complex corporate governance, public disclosure and accounting requirements that could adversely affect our business and financial results.
We are subject to changing rules and regulations of federal and state government as well as the stock exchange on which our common stock is listed. These entities, including the Public Company Accounting Oversight Board, the SEC and the NASDAQ Stock Market, have issued a significant number of new and increasingly complex requirements and regulations over the course of the last several years and continue to develop additional regulations and requirements in response to laws enacted by Congress. Our efforts to comply with these requirements have resulted in, and are likely to continue to result in, an increase in expenses and a diversion of management’s time from other business activities.
The interest rates of our term loans to our portfolio companies that extend beyond 2021 might be subject to change based on recent regulatory changes.
The London Interbank Offered Rate (“LIBOR”) is the basic rate of interest used in lending transactions between banks on the London interbank market and is widely used as a reference for setting the interest rate on loans globally. We typically use LIBOR as a reference rate in term loans we extend to portfolio companies such that the interest due to us pursuant to a term loan extended to a portfolio company is calculated using LIBOR. The terms of our debt investments generally include minimum interest rate floors which are calculated based on LIBOR.
On March 5, 2021, the United Kingdom’s Financial Conduct Authority (the “FCA”), which regulates LIBOR, announced that (i) 24 LIBOR settings would cease to exist immediately after December 31, 2021 (all seven euro LIBOR settings; all seven Swiss franc LIBOR settings; the Spot Next, 1-week, 2-month, and 12-month Japanese yen LIBOR settings; the overnight, 1-week, 2-month, and 12-month sterling LIBOR settings; and the 1-week and 2-month US dollar LIBOR settings); (ii) the overnight and 12-month US LIBOR settings would cease to exist after June 30, 2023; and (iii) the FCA would consult on whether the remaining nine LIBOR settings should continue to be published on a synthetic basis for a certain period using the FCA’s proposed new powers that the UK government is legislating to grant to them. Central banks and regulators in a number of major jurisdictions (for example, United States, United Kingdom, European Union, Switzerland and Japan) have convened working groups to find, and implement the transition to, suitable replacements for interbank offered rates (“IBORs”). To identify a successor rate for U.S. dollar LIBOR, the Alternative Reference Rates Committee (“ARRC”), a U.S.-based group convened by the Federal Reserve Board and the Federal Reserve Bank of New York, was formed. The ARRC has identified the Secured Overnight Financing Rate (“SOFR”) as its preferred alternative rate for LIBOR. SOFR is a measure of the cost of borrowing cash overnight, collateralized by U.S. Treasury securities, and is based on directly observable U.S. Treasury-backed repurchase transactions. Although SOFR appears to be the preferred replacement rate for U.S. dollar LIBOR, at this time, it is not possible to predict the effect of any such changes, any establishment of alternative reference rates or other reforms to LIBOR that may be enacted in the United States, United Kingdom or elsewhere or, whether the COVID-19 outbreak will have further effect on LIBOR transition plans.
34
The elimination of LIBOR or any other changes or reforms to the determination or supervision of LIBOR could have an adverse impact on the market and/or transferability of value of any LIBOR-linked securities, loans, and other financial obligations or extensions of credit held by or due to us or on our overall financial condition or results of operations. In addition, while the majority of our LIBOR-linked loans contemplate that LIBOR may cease to exist and allow for amendment to a new base rate without the approval of 100% of the lenders we will still need to renegotiate the credit agreements extending beyond 2021 with our portfolio companies that utilize LIBOR as a factor in determining the interest rate, in order to replace LIBOR with the new standard that is established, which may have an adverse effect on our overall financial condition or results of operations. Following the replacement of LIBOR, some or all of these credit agreements may bear interest at a lower interest rate, which could have an adverse impact on the value and liquidity of our investment in these portfolio companies and our results of operations. Moreover, we may need to renegotiate certain terms of our credit facilities. If we are unable to do so, amounts drawn under our credit facilities may bear interest at a higher rate, which would increase the cost of our borrowings and, in turn, affect our results of operations.
A disruption in the capital markets and the credit markets could negatively affect our business.
As a BDC, we seek to maintain our ability to raise additional capital for investment purposes. Without sufficient access to the capital markets or credit markets, we may not be able to pursue new business opportunities. Disruptive conditions in the financial industry and the impact of new legislation in response to those conditions could restrict our business operations and could adversely impact our results of operations and financial condition.
Our ability to grow our business could be impaired by an inability to access the capital markets or to enter into new credit facilities. Reflecting concern about the stability of the financial markets, many lenders and institutional investors have reduced or ceased providing funding to borrowers. This market disruption and tightening of credit has led to increased market volatility and widespread reduction of business activity generally. If we are unable to raise additional equity capital or consummate new credit facilities on terms that are acceptable to us, we may not be able to initiate significant originations.
These situations may arise due to circumstances that we may be unable to control, such as access to the credit markets, a severe decline in the value of the U.S. dollar, a further economic downturn or an operational problem that affects third parties or us, and could materially harm our business. Even though such conditions have improved broadly and significantly over the short-term, adverse conditions in particular sectors of the financial markets could adversely impact our business over the long-term.
Even in the event the value of your investment declines, the Base Fee and, in certain circumstances, the Net Investment Income Incentive Fee will still be payable.
The Base Fee is calculated as a percentage of our gross assets at a specific time. Accordingly, the Base Fee will be payable regardless of whether the value of our gross assets and/or your investment have decreased. Moreover, a portion of the incentive fee is payable if our net investment income for a calendar quarter exceeds a designated hurdle rate. Although this portion of the incentive fee (the Net Investment Income Incentive Fee) is subject to the Total Return Requirement, the Net Investment Income Incentive Fee may still be payable during a quarter with net capital losses. Accordingly, this portion of our adviser’s incentive fee may also be payable notwithstanding a decline in net asset value that quarter. In addition, in the event we recognize PIK loan interest or PIK preferred dividends in excess of our available capital, we may be required to liquidate assets in order to pay a portion of the incentive fee. Oxford Square Management, however, is not required to reimburse us for the portion of any fees attributable to accrued deferred loan interest or dividends in the event of a default or other non-payment by the obligor.
35
Price declines and illiquidity in the corporate debt markets have adversely affected, and may continue to adversely affect, the fair value of our portfolio investments, reducing our net asset value through increased net unrealized depreciation. Any unrealized depreciation that we experience on our loan portfolio may be an indication of future realized losses, which could reduce our income available for distribution and could adversely affect our ability to service our outstanding borrowings.
As a BDC, we are required to carry our investments at fair value as determined in good faith by or under the direction of our Board of Directors. Decreases in fair values of our investments are recorded as unrealized depreciation. Any unrealized depreciation in our loan portfolio could be an indication of a portfolio company’s inability to meet its repayment obligations to us with respect to the affected loans. This could result in realized losses in the future and ultimately in reductions of our income available for distribution in future periods and could materially adversely affect our ability to service our outstanding borrowings. Depending on market conditions, we may incur substantial losses in future periods, which could have a material adverse impact on our business, financial condition and results of operations.
PIK interest/dividend payments we receive will increase our assets under management and, as a result, will increase the amount of Base Fee and incentive fees payable by us to our investment adviser.
Certain of our debt and preferred stock investments contain provisions providing for the payment of contractual PIK interest or dividends. Because PIK interest/dividends results in an increase in the size of the loan/preferred stock balance of the underlying investment, the receipt by us of PIK interest/dividend will have the effect of increasing our assets under management. As a result, because the Base Fee that we pay to our investment adviser is based on the value of our gross assets, the receipt by us of PIK interest/dividend will result in an increase in the amount of the Base Fee payable by us. In addition, any such increase in an investment balance due to the receipt of PIK interest/dividend will cause such investment to accrue interest/dividend on the higher investment balance, which will result in an increase in our pre-incentive fee net investment income and, as a result, a potential increase in incentive fees that are payable by us to our investment adviser.
Our investment adviser is not obligated to reimburse us for any part of the incentive fee it receives that is based on accrued income that we never receive.
Part of the incentive fee payable by us to our investment adviser that relates to our net investment income is computed and paid on income that may include interest that has been accrued but not yet received in cash, such as market discount, debt instruments with PIK interest, preferred stock with PIK dividends and zero coupon securities. If a portfolio company defaults on a loan that is structured to provide accrued interest, it is possible that accrued interest previously used in the calculation of the incentive fee will become uncollectible. Our investment adviser will not be under any obligation to reimburse us for any part of the incentive fee it received that was based on accrued income that we never receive as a result of a default by an entity on the obligation that resulted in the accrual of such income.
Our investment adviser can resign on 60 days’ notice, and we may not be able to find a suitable replacement within that time, resulting in a disruption in our operations that could adversely affect our financial condition, business and results of operations.
Our investment adviser has the right, under our investment advisory agreement, to resign at any time upon 60 days’ written notice, whether we have found a replacement or not. If our investment adviser resigns, we may not be able to find a new investment adviser or hire internal management with similar expertise and ability to provide the same or equivalent services on acceptable terms within 60 days, or at all. If we are unable to do so quickly, our operations are likely to experience a disruption, our financial condition, business and results of operations as well as our ability to pay distributions are likely to be adversely affected and the market price of our shares may decline. In addition, the coordination of our internal management and investment activities is likely to suffer if we are unable to identify and reach an agreement with a single institution or group of executives having the expertise possessed by our investment adviser and its affiliates. Even if we are able to retain comparable management, whether internal or external, the integration of such management and their lack of familiarity with our investment objective may result in additional costs and time delays that may adversely affect our financial condition, business and results of operations.
36
We are permitted to borrow money, which magnifies the potential for gain or loss on amounts invested and may increase the risk of investing in us.
Borrowings, also known as leverage, magnify the potential for gain or loss on amounts invested and, therefore, increase the risks associated with investing in our securities. We may borrow from and issue senior debt securities to banks, insurance companies, and other lenders. Lenders of these senior securities have fixed dollar claims on our assets that are superior to the claims of our common stockholders. If the value of our assets increases, then leveraging would cause the net asset value attributable to our common stock to increase more sharply than it would have had we not leveraged. Conversely, if the value of our assets decreases, leveraging would cause net asset value to decline more sharply than it otherwise would have had we not leveraged. Similarly, any increase in our income in excess of interest payable on the borrowed funds would cause our net income to increase more than it would without the leverage, while any decrease in our income would cause net income to decline more sharply than it would have had we not borrowed. Such a decline could negatively affect our ability to make common stock distribution payments. Leverage is generally considered a speculative investment technique. Our ability to service any debt that we incur will depend largely on our financial performance and will be subject to prevailing economic conditions and competitive pressures. Moreover, as the Base Fee (and a portion of the incentive fee) payable to Oxford Square Management will be payable on our gross assets, including those assets acquired through the use of leverage, Oxford Square Management may have a financial incentive to incur leverage which may not be consistent with our stockholders’ interests. In addition, our common stockholders will bear the burden of any increase in our expenses as a result of leverage, including any increase in the Base Fee (and incentive fee) payable to Oxford Square Management.
Our asset coverage requirement under the 1940 Act for senior securities is 150%, effective as of April 6, 2019. If we incur additional leverage, general interest rate fluctuations may have a more significant negative impact on our investments and investment opportunities than they would have absent such additional incurrence, and, accordingly, may have a material adverse effect on our investment objectives and rate of return on investment capital.
On April 12, 2017, we completed a public offering of approximately 64.4 million in aggregate principal amount of 6.50% Unsecured Notes. The 6.50% Unsecured Notes will mature on March 30, 2024, and may currently be redeemed in whole or in part at any time or from time to time at our option on or after March 30, 2020. The 6.50% Unsecured Notes bear interest at a rate of 6.50% per year payable quarterly on March 30, June 30, September 30 and December 30. The 6.50% Unsecured Notes are our general unsecured obligations, rank equally in right of payment with our future senior unsecured debt, and rank senior in right of payment to any potential subordinated debt, should any be issued in the future.
On April 3, 2019, we completed an underwritten public offering of approximately $44.8 million in aggregate principal amount of 6.25% Unsecured Notes. The 6.25% Unsecured Notes will mature on April 30, 2026, and may be redeemed in whole or in part at any time or from time to time at our option on or after April 30, 2022. The 6.25% Unsecured Notes bear interest at a rate of 6.25% per year payable quarterly on January 31, April 30, July 31, and October 31, of each year. The 6.25% Unsecured Notes are our general unsecured obligations, rank equally in right of payment with our future senior unsecured debt, and rank senior in right of payment to any potential subordinated debt, should any be issued in the future.
Illustration. The following table illustrates the effect of leverage on returns from an investment in our common stock assuming various annual returns on the portfolio, net of expenses. The calculations in the table below are hypothetical and actual returns may be higher or lower than those appearing in the table below.
|
Assumed total return on our portfolio (net of expenses) |
|||||||||||||||
|
(10.0)% |
(5.0)% |
0.0% |
5.0% |
10.0% |
|||||||||||
|
Corresponding return to stockholder(1) |
(19.2 |
)% |
(11.3 |
)% |
(3.3 |
)% |
4.6 |
% |
12.5 |
% |
|||||
____________
(1) Assumes $357.7 million in total assets and $109.2 million in total debt principal outstanding, which reflects our total assets and total debt outstanding as of December 31, 2020, and a cost of funds of approximately 6.9%.
Our portfolio must have an annual return of at least 2.1% in order to cover the annual interest payments on our current borrowings.
37
If we are unable to comply with the covenants or restrictions in our borrowings, our business could be materially adversely affected.
Our borrowings may include covenants, among others, that, subject to exceptions, restrict our ability to pay distributions, create liens on assets, make investments, make acquisitions and engage in mergers or consolidations. Complying with these restrictions may prevent us from taking actions that we believe would help us grow our business or are otherwise consistent with our investment objective. These restrictions could also limit our ability to plan for or react to market conditions or meet extraordinary capital needs or otherwise restrict corporate activities. In addition, certain covenants or restrictions could limit our ability to make distributions to our stockholders in certain circumstances, which could result in us failing to qualify for tax treatment as a RIC and thus becoming subject to corporate-level U.S. federal income tax (and any applicable state and local taxes).
The breach of any of the covenants or restrictions, unless cured within the applicable grace period, would result in a default under our borrowings that would permit the lender thereunder to declare all amounts outstanding to be due and payable. In such an event, we may not have sufficient assets to repay such indebtedness. As a result, any default could have serious consequences to our financial condition. An event of default or an acceleration under any future borrowings also cause a cross-default or cross-acceleration of another debt instrument or contractual obligation, which would adversely impact our liquidity.
The terms of our future borrowings may contractually limit our ability to incur additional indebtedness.
We will need additional capital to fund new investments and grow our portfolio of investments. We intend to access the capital markets periodically to issue debt or equity securities or borrow from financial institutions in order to obtain such additional capital. We believe that having the flexibility to incur additional leverage could augment the returns to our stockholders and would be in the best interests of our stockholders. Contractual leverage limitations under our future borrowings may limit our ability to incur additional indebtedness. An inability on our part to access additional leverage could limit our ability to take advantage of the benefits described above related to our ability to incur additional leverage and could decrease our earnings, if any, which would have an adverse effect on our results of operations and the value of our shares of common stock.
We may need to raise additional capital to grow because we must distribute most of our income.
We may need additional capital to fund growth in our investments. We expect to issue equity securities and expect to borrow from financial institutions in the future. A reduction in the availability of new capital could limit our ability to grow. We must distribute at least 90% of our investment company taxable income to our stockholders to maintain our tax treatment as a regulated investment company. As a result, any such cash earnings may not be available to fund investment originations. We expect to borrow from financial institutions and issue additional debt and equity securities. If we fail to obtain funds from such sources or from other sources to fund our investments, it could limit our ability to grow, which may have an adverse effect on the value of our securities. In addition, as a BDC, our ability to borrow or issue preferred stock may be restricted if our total assets are less than 150% of our total borrowings and preferred stock.
Regulations governing our operation as a BDC affect our ability to, and the way in which we raise additional capital, which may expose us to risks, including the typical risks associated with leverage.
Our ability to grow our business requires a substantial amount of capital, which we may acquire from the following sources:
Senior Securities and Other Indebtedness
We may issue debt securities or preferred stock and/or borrow money from banks or other financial institutions, which we refer to collectively as “senior securities,” up to the maximum amount permitted by the 1940 Act. Under the provisions of the 1940 Act, we are permitted, as a BDC, to issue senior securities in amounts such that our asset coverage ratio, as defined in the 1940 Act, equals at least 150% immediately after each issuance of senior securities.
38
This requirement of sustaining a 150% asset coverage ratio limits the amount that we may borrow. Because we will continue to need capital to grow our loan and investment portfolio, this limitation may prevent us from incurring debt. Further additional debt financing may not be available on favorable terms, if at all, or may be restricted by the terms of our debt facilities. If we are unable to incur additional debt, we may be required to raise additional equity at a time when it may be disadvantageous to do so.
As a result of the issuance of senior securities, including preferred stock and debt securities, we are exposed to typical risks associated with leverage, including an increased risk of loss and an increase in expenses, which are ultimately borne by our common stockholders. Because we may incur leverage to make investments, a decrease in the value of our investments would have a greater negative impact on the value of our common stock. When we issue debt securities or preferred stock, it is likely that such securities will be governed by an indenture or other instrument containing covenants restricting our operating flexibility. In addition, such securities may be rated by rating agencies, and in obtaining a rating for such securities, we may be required to abide by operating and investment guidelines that could further restrict our operating flexibility. Refer to “— We are permitted to borrow money, which magnifies the potential for gain or loss on amounts invested and may increase the risk of investing in us” for a description of our outstanding senior securities.
Our ability to pay distributions or issue additional senior securities may be restricted if our asset coverage ratio is not at least 150%. If the value of our assets declines, we may be unable to satisfy this test. If that happens, we may be required to sell a portion of our investments and, depending on the nature of our leverage, repay a portion of our indebtedness at a time when such sales may be disadvantageous. Furthermore, any amounts that we use to service our indebtedness would not be available for distributions to our common stockholders.
Common Stock
We are not generally able to issue and sell our common stock at a price below net asset value per share. We may, however, sell our common stock, or warrants, options or rights to acquire our common stock, at a price below the then-current net asset value of our common stock if our Board of Directors determines that such sale is in the best interests of OXSQ and its stockholders, and our stockholders approve such sale.
In certain limited circumstances, we may also issue shares at a price below net asset value in connection with a transferable rights offering so long as: (1) the offer does not discriminate among stockholders; (2) we use our best efforts to ensure an adequate trading market exists for the rights; and (3) the ratio of the offering does not exceed one new share for each three rights held. If we raise additional funds by issuing more common stock or senior securities convertible into, or exchangeable for, our common stock, the percentage ownership of our stockholders at that time would decrease and they may experience dilution. Moreover, we can offer no assurance that we will be able to issue and sell additional equity securities in the future, on favorable terms or at all.
Our Board of Directors is authorized to reclassify any unissued shares of common stock into one or more classes of preferred stock, which could convey special rights and privileges to its owners.
Our charter permits our Board of Directors to reclassify any authorized but unissued shares of stock into one or more classes of preferred stock. We are currently authorized to issue up to 100,000,000 shares of common stock, of which 49,589,607 shares are issued and outstanding as of March 19, 2021. In the event our Board of Directors opts to reclassify a portion of our unissued shares of common stock into a class of preferred stock, those preferred shares would have a preference over our common stock with respect to distributions and liquidation. The cost of any such reclassification would be borne by our existing common stockholders. The class voting rights of any preferred shares we may issue could make it more difficult for us to take some actions that may, in the future, be proposed by our Board of Directors and/or the holders of our common stock, such as a merger, exchange of securities, liquidation, or alteration of the rights of a class of our securities, if these actions were perceived by the holders of preferred shares as not in their best interests. The issuance of preferred shares convertible into shares of common stock might also reduce the net income and net asset value per share of our common stock upon conversion. These effects, among others, could have an adverse effect on your investment in our common stock.
39
A change in interest rates may adversely affect our profitability and we may expose ourselves to risks if we engage in hedging transactions to mitigate changes in interest rates.
Currently, all of the debt investments in our investment portfolio are at variable rates. In addition, our CLO equity investments are sensitive to risks associated with changes in interest rates. Although we have not done so in the past, we may in the future choose to hedge against interest rate fluctuations by using standard hedging instruments such as futures, forward contracts, options and interest rate swaps, caps, collars and floors to seek to hedge against fluctuations in the relative values of our portfolio positions from changes in market interest rates. Hedging against a decline in the values of our portfolio positions does not eliminate the possibility of fluctuations in the values of such positions or prevent losses if the values of such positions decline. However, such hedging can establish other positions designed to gain from those same developments, thereby offsetting the decline in the value of such portfolio positions. Such hedging transactions may also limit the opportunity for gain if the values of the underlying portfolio positions should increase. It may not be possible to hedge against an interest rate fluctuation that is so generally anticipated that we are not able to enter into a hedging transaction at an acceptable price.
The success of our hedging transactions will depend on our ability to correctly predict movements in interest rates. Therefore, while we may enter into such transactions to seek to reduce interest rate risks, unanticipated changes in interest rates may result in poorer overall investment performance than if we had not engaged in any such hedging transactions. In addition, the degree of correlation between price movements of the instruments used in a hedging strategy and price movements in the portfolio positions being hedged may vary. Moreover, for a variety of reasons, we may not seek to establish a perfect correlation between such hedging instruments and the portfolio holdings being hedged. Any such imperfect correlation may prevent us from achieving the intended hedge and expose us to risk of loss. To the extent we engage in hedging transactions, we also face the risk that counterparties to the derivative instruments we hold may default, which may expose us to unexpected losses from positions where we believed that our risk had been appropriately hedged. These activities may limit our ability to participate in the benefits of lower interest rates with respect to the hedged portfolio. Adverse developments resulting from changes in interest rates or hedging transactions could have a material adverse effect on our business, financial condition and results of operations. Also, we have limited experience in entering into hedging transactions, and we will initially have to purchase or develop such expertise if we choose to employ hedging strategies in the future.
Our ability to enter into transactions involving derivatives and financial commitment transactions may be limited.
Through comprehensive new global regulatory regimes impacting derivatives (e.g., the Dodd-Frank Act, European Market Infrastructure Regulation (“EMIR”), Markets in Financial Investments Regulation (“MIFIR”)/Markets in Financial Instruments Directive (“MIFID II”)), certain over-the-counter derivatives transactions in which we may engage are either now or will soon be subject to various requirements, such as mandatory central clearing of transactions which include additional margin requirements and in certain cases trading on electronic platforms, pre-and post-trade transparency reporting requirements and mandatory bi-lateral exchange of initial margin for non-cleared swaps. The Dodd-Frank Act also created new categories of regulated market participants, such as “swap dealers,” “security-based swap dealers,” “major swap participants,” and “major security-based swap participants” who are subject to significant new capital, registration, recordkeeping, reporting, disclosure, business conduct and other regulatory requirements. The EU and some other jurisdictions are implementing similar requirements. Because these requirements are new and evolving (and some of the rules are not yet final), their ultimate impact remains unclear. However, even if the Company itself is not located in a particular jurisdiction or directly subject to the jurisdiction’s derivatives regulations, we may still be impacted to the extent we enter into a derivatives transaction with a regulated market participant or counterparty that is organized in that jurisdiction or otherwise subject to that jurisdiction’s derivatives regulations.
Based on information available as of the date of this annual report on Form 10-K, the effect of such requirements will be likely to (directly or indirectly) increase our overall costs of entering into derivatives transactions. In particular, new margin requirements, position limits and significantly higher capital charges resulting from new global capital regulations, even if not directly applicable to us, may cause an increase in the pricing of derivatives transactions entered into by market participants to whom such requirements apply or affect our overall ability to enter into derivatives transactions with certain counterparties. Such new global capital regulations
40
and the need to satisfy the various requirements by counterparties are resulting in increased funding costs, increased overall transaction costs, and significantly affecting balance sheets, thereby resulting in changes to financing terms and potentially impacting our ability to obtain financing. Administrative costs, due to new requirements such as registration, recordkeeping, reporting, and compliance, even if not directly applicable to us, may also be reflected in our derivatives transactions. New requirements to trade certain derivatives transactions on electronic trading platforms and trade reporting requirements may lead to (among other things) fragmentation of the markets, higher transaction costs or reduced availability of derivatives, and/or a reduced ability to hedge, all of which could adversely affect the performance of certain of our trading strategies. In addition, changes to derivatives regulations may impact the tax and/or accounting treatment of certain derivatives, which could adversely impact us.
In November 2020, the SEC adopted new rules regarding the ability of a BDC (or a registered investment company) to use derivatives and other transactions that create future payment or delivery obligations. BDCs that use derivatives would be subject to a value-at-risk leverage limit, certain other derivatives risk management program and testing requirements and requirements related to board reporting. These new requirements would apply unless the BDC qualified as a “limited derivatives user,” as defined in the SEC’s adopted rules. A BDC that enters into reverse repurchase agreements or similar financing transactions would need to aggregate the amount of indebtedness associated with the reverse repurchase agreements or similar financing transactions could either (i) comply with the asset coverage requirements of the Section 18 of the 1940 Act when engaging in reverse repurchase agreements or (ii) choose to treat such agreements as derivative transactions under the adopted rule. Under the adopted rule, a BDC may enter into an unfunded commitment agreement that is not a derivatives transaction, such as an agreement to provide financing to a portfolio company, if the BDC has a reasonable belief, at the time it enters into such an agreement, that it will have sufficient cash and cash equivalents to meet its obligations with respect to all of its unfunded commitment agreements, in each case as it becomes due. If the BDC cannot meet this test, it is required to treat unfunded commitments as a derivatives transaction subject to the requirements of the rule. Collectively, these requirements may limit our ability to use derivatives and/or enter into certain other financial contracts.
We will be subject to corporate-level U.S. federal income tax if we are unable to qualify for tax treatment as a RIC for U.S. federal income tax purposes.
To remain entitled to the tax benefits accorded to RICs under the Code, we must meet certain income source, asset diversification and Annual Distribution Requirements. In order to qualify as a RIC, we must derive each taxable year at least 90% of our gross income from dividends, interest, payments with respect to certain securities loans, gains from the sale of stock or other securities, or other income derived with respect to our business of investing in such stock or securities. The Annual Distribution Requirement for a RIC is satisfied if we distribute at least 90% of our ordinary income and realized net short-term capital gains in excess of realized net long-term capital losses, if any, to our stockholders on an annual basis. Because we use debt financing, we are subject to certain asset coverage ratio requirements under the 1940 Act and financial covenants under loan and credit agreements that could, under certain circumstances, restrict us from making distributions necessary to satisfy the Annual Distribution Requirement. If we are unable to obtain cash from other sources, we may fail to qualify for special tax treatment as a RIC and, thus, may be subject to corporate-level U.S. federal income tax on all of our income.
To qualify as a RIC, we must also meet certain asset diversification requirements at the end of each calendar quarter. Failure to meet these tests may result in our having to dispose of certain investments quickly in order to prevent the loss of RIC treatment. Because most of our investments will be in private companies, any such dispositions could be made at disadvantageous prices and may result in substantial losses. If we fail to qualify for tax treatment as a RIC for any reason and remain or become subject to corporate income tax, the resulting corporate taxes could substantially reduce our net assets, the amount of income available for distribution and the amount of our distributions. Such a failure would have a material adverse effect on us and our stockholders.
Our investments in CLOs may be subject to special anti-deferral provisions that could result in us incurring tax or recognizing income prior to receiving cash distributions related to such income.
We have purchased and may in the future purchase residual or subordinated interests in CLOs that are treated for U.S. federal income tax purposes as shares in a passive foreign investment company or PFIC. If we acquire investments in a PFIC (including equity tranche investments in CLOs that are PFICs), we may be subject to U.S. federal income tax on a portion of any “excess distribution” or gain from the disposition of such shares even if
41
such income is distributed as a taxable distribution by us to our stockholders. Certain elections may be available to mitigate or eliminate such tax on excess distributions, but such elections (if available) will generally require us to recognize our share of the PFICs income for each year regardless of whether we receive any distributions from such PFICs. We must nonetheless distribute such income to maintain our tax treatment as a RIC.
If we hold more than 10% of the shares in a foreign corporation that is treated as a controlled foreign corporation or CFC (including equity tranche investments in a CLO treated as CFC), we may be treated as receiving a deemed distribution (taxable as ordinary income) each year from such foreign corporation in an amount equal to our pro rata share of the corporation’s income for the tax year (including both ordinary earnings and capital gains). If we are required to include such deemed distributions from a CFC in our income, we will be required to distribute such income to maintain our RIC tax treatment regardless of whether or not the CFC makes an actual distribution during such year.
If we are required to include amounts in income prior to receiving distributions representing such income, we may have to sell some of our investments at times and/or at prices we would not consider advantageous, raise additional debt or equity capital or forgo new investment opportunities for this purpose. If we are not able to obtain cash from other sources, we may fail to qualify for RIC tax treatment and thus become subject to corporate-level U.S. federal income tax.
If we do not receive timely distributions from our CLO investments, we may fail to qualify as a RIC.
We are required to include in our taxable income our proportionate share of the income of certain CLO investments to the extent that such CLOs are PFICs for which we have made a qualifying electing fund, or “QEF,” election or are CFCs. To the extent that such CLOs do not distribute all of their earnings and profits on a current basis, we may fail to qualify as a RIC. To qualify as a RIC, we must, among other thing, derive in each taxable year at least 90% of our gross income from certain sources specified in the Code, or the “90% Income Test.” Income inclusions from a QEF or a CFC will be “good income” for purposes of the 90% Income Test provided that they are derived in connection with our business of investing in stocks and securities or the QEF or the CFC distribute such income to us in the same taxable year to which the income is included in our income.
The CLOs in which we invest may be subject to withholding tax if they fail to comply with certain reporting requirements.
Legislation commonly referred to as the Foreign Account Tax Compliance Act, or FATCA, imposes a withholding tax of 30% on payments of U.S. source interest and distributions to certain non-U.S. entities, including certain non-U.S. financial institutions and investment funds, unless such non-U.S. entity complies with certain reporting requirements regarding its U.S. account holders and its U.S. owners. While existing U.S. Treasury regulations would also require withholding on payments of the gross proceeds from the sale of any property that could produce U.S. source interest or dividends, the U.S. Treasury Department has indicated its intent to eliminate this requirement in subsequent proposed regulations, which state that taxpayers may rely on the proposed regulations until final regulations are issued. Most CLO vehicles in which we invest will be treated as non-U.S. financial entities for this purpose, and therefore will be required to comply with these reporting requirements to avoid the 30% withholding. If a CLO vehicle in which we invest fails to properly comply with these reporting requirements, it could reduce the amounts available to distribute to equity and junior debt holders in such CLO vehicle, which could materially and adversely affect our operating results and cash flows.
We may have difficulty paying our required distributions if we recognize income before or without receiving cash representing such income.
For U.S. federal income tax purposes, we will include in income certain amounts that we have not yet received in cash, such as original issue discount or OID, which may arise if we receive warrants in connection with the making of a loan or possibly in other circumstances, or contracted PIK interest, which represents contractual interest added to the loan balance and due at the end of the loan term. In addition, we may be required to accrue for U.S. federal income tax purposes amounts attributable to our investment in CLOs that may differ from the distributions received in respect of such investments. We also may be required to include in income certain other amounts that we will not receive in cash.
Because in certain cases we may recognize income before or without receiving cash representing such income, we may have difficulty satisfying the Annual Distribution Requirement applicable to RICs. Accordingly, we may have to sell some of our investments at times we would not consider advantageous, raise additional debt or equity
42
capital, reduce new investments or make taxable distributions of our stock or debt securities to meet that distribution requirement. If we are not able to obtain cash from other sources, we may fail to qualify for RIC tax treatment and thus be subject to corporate-level U.S. federal income tax.
In addition, OID income for certain portfolio investments may or may not be included as a factor in the determination of the fair value of such investments.
There are significant potential conflicts of interest between OXSQ and our management team.
In the course of our investing activities, we pay management and incentive fees to Oxford Square Management, and reimburse Oxford Funds for certain expenses it incurs on our behalf. As a result, investors in our common stock invest on a “gross” basis and receive distributions on a “net” basis after expenses, resulting in, among other things, a lower rate of return than one might achieve through direct investments. As a result of this arrangement, there may be times when the management team of Oxford Square Management has interests that differ from those of our stockholders, giving rise to a conflict.
Oxford Square Management receives a quarterly incentive fee based, in part, on our “Pre-Incentive Fee Net Investment Income,” if any, for the immediately preceding calendar quarter. This incentive fee is subject to a quarterly hurdle rate before providing an incentive fee return to Oxford Square Management. To the extent we or Oxford Square Management are able to exert influence over our portfolio companies, the quarterly pre-incentive fee may provide Oxford Square Management with an incentive to induce our portfolio companies to accelerate or defer interest or other obligations owed to us from one calendar quarter to another.
In addition, our executive officers and directors, and the executive officers of Oxford Square Management, and its managing member, Oxford Funds, serve or may serve as officers and directors of entities that operate in a line of business similar to our own. Accordingly, they may have obligations to investors in those entities, the fulfillment of which might not be in the best interests of us or our stockholders. Charles M. Royce, a member of our Board of Directors, holds a minority, non-controlling interest in our investment adviser.
Messrs. Cohen and Rosenthal currently serve as Chief Executive Officer and President, respectively, of Oxford Lane Capital Corp., a non-diversified closed-end management investment company that currently invests primarily in CLO debt and equity tranches, and its investment adviser, Oxford Lane Management. Messrs. Cohen and Rosenthal also currently serve as Chief Executive Officer and President, respectively, at Oxford Bridge Management, the investment adviser to the Oxford Bridge Funds and Oxford Gate Management, the investment adviser to the Oxford Gate Funds. The Oxford Bridge Funds and Oxford Gate Funds are private funds that invest principally in CLO debt and equity. Oxford Funds is the managing member of Oxford Bridge Management, LLC. As a result, certain conflicts of interest may arise with respect to the management of our portfolio by Messrs. Cohen and Rosenthal, on the one hand, and the obligations of Messrs. Cohen and Rosenthal to manage the portfolios of Oxford Lane Capital Corp., the Oxford Bridge Funds and the Oxford Gate Funds, respectively, on the other hand. In addition, Bruce L. Rubin, our Chief Financial Officer, Corporate Secretary and Treasurer, currently serves in similar capacities for Oxford Lane Capital Corp. Mr. Rubin also currently serves as the Chief Financial Officer and Secretary of Oxford Lane Management, Oxford Square Management, LLC, Oxford Bridge Management, LLC, Oxford Gate Management, LLC and Oxford Funds. Further, Mr. Gerald Cummins, our Chief Compliance Officer, currently serves in similar capacities for Oxford Lane Management, Oxford Lane Capital Corp., Oxford Square Management, LLC, Oxford Bridge Management, LLC and Oxford Gate Management, LLC. Because of these possible conflicts of interest, these individuals may direct potential business and investment opportunities to other entities rather than to us or such individuals may undertake or otherwise engage in activities or conduct on behalf of such other entities that is not in, or which may be adverse to, our best interests.
Oxford Square Management, Oxford Lane Management, LLC, Oxford Bridge Management, LLC and Oxford Gate Management, LLC are subject to a written policy with respect to the allocation of investment opportunities among Oxford Square, Oxford Lane Capital Corp., the Oxford Bridge Funds and the Oxford Gate Funds. Where investments are suitable for more than one entity, the allocation policy generally provides that, depending on size and subject to current and anticipated cash availability, the absolute size of the investment as well as its relative size compared to the total assets of each entity, current and anticipated weighted average costs of capital, and whether the proposed investment is an add-on investment to an existing investment, among other factors, an investment amount will be determined by the adviser to each entity. If the investment opportunity is sufficient for each entity to receive its investment amount, then each entity receives the investment amount; otherwise, the investment amount is reduced pro rata.
43
On October 13, 2016, we filed an exemptive application with the SEC to permit us to co-invest with funds or entities managed by Oxford Square Management or its affiliates in certain negotiated transactions where co-investing would otherwise be prohibited under the 1940 Act. On June 14, 2017, the SEC issued an order permitting Oxford Square and certain of its affiliates to complete negotiated co-investment transactions in portfolio companies, subject to certain conditions, or the “Order.” Subject to satisfaction of certain conditions to the Order, Oxford Square and certain of its affiliates are now permitted, together with any future BDCs, registered closed-end funds and certain private funds, each of whose investment adviser is Oxford Square’s investment adviser or an investment adviser controlling, controlled by, or under common control with Oxford Square’s investment adviser, to co-invest in negotiated investment opportunities where doing so would otherwise be prohibited under the 1940 Act, providing Oxford Square’s stockholders with access to a broader array of investment opportunities. Pursuant to the Order, we are permitted to co-invest in such investment opportunities with our affiliates if a “required majority” (as defined in Section 57(o) of the 1940 Act) of our independent directors make certain conclusions in connection with a co-investment transaction, including, but not limited to, that (1) the terms of the potential co-investment transaction, including the consideration to be paid, are reasonable and fair to us and our stockholders and do not involve overreaching in respect of us or our stockholders on the part of any person concerned, and (2) the potential co-investment transaction is consistent with the interests of our stockholders and is consistent with our then-current investment objective and strategies.
In the ordinary course of business, we may enter into transactions with portfolio companies that may be considered related party transactions. In order to ensure that we do not engage in any prohibited transactions with any persons affiliated with us, we have implemented certain policies and procedures whereby our executive officers screen each of our transactions for any possible affiliations between the proposed portfolio investment, us, companies controlled by us and our employees and directors. We will not enter into any agreements unless and until we are satisfied that doing so will not raise concerns under the 1940 Act or, if such concerns exist, we have taken appropriate actions to seek board review and approval or exemptive relief for such transaction. Our Board of Directors reviews these procedures on an annual basis.
We have also adopted a Code of Business Conduct and Ethics which applies to, among others, our senior officers, including our Chief Executive Officer and Chief Financial Officer, as well as all of our officers, directors and employees. Our Code of Business Conduct and Ethics requires that all employees and directors avoid any conflict, or the appearance of a conflict, between an individual’s personal interests and our interests. Pursuant to our Code of Business Conduct and Ethics, each employee and director must disclose any conflicts of interest, or actions or relationships that might give rise to a conflict. Our Audit Committee is charged with approving any waivers under our Code of Business Conduct and Ethics. As required by the NASDAQ Global Select Market corporate governance listing standards, the Audit Committee of our Board of Directors is also required to review and approve any transactions with related parties (as such term is defined in Item 404 of Regulation S-K).
Changes in laws or regulations governing our operations may adversely affect our business.
Changes in the laws or regulations, or the interpretations of the laws and regulations, which govern BDCs, RICs or non-depository commercial lenders could significantly affect our operations and our cost of doing business. We are subject to federal, state and local laws and regulations and are subject to judicial and administrative decisions that affect our operations, including our loan originations, maximum interest rates, fees and other charges, disclosures to portfolio companies, the terms of secured transactions, collection and foreclosure procedures, and other trade practices. If these laws, regulations or decisions change, or if we expand our business into jurisdictions that have adopted more stringent requirements than those in which we currently conduct business, then we may have to incur significant expenses in order to comply or we may have to restrict our operations. In addition, if we do not comply with applicable laws, regulations and decisions, then we may lose licenses needed for the conduct of our business and be subject to civil fines and criminal penalties, any of which could have a material adverse effect upon our business results of operations or financial condition.
If we do not invest a sufficient portion of our assets in qualifying assets, we could fail to qualify as a business development company or be precluded from investing according to our current business strategy.
As a BDC, we may not acquire any assets other than “qualifying assets” unless, at the time of such acquisition, at least 70% of our total assets are qualifying assets.
44
We believe that most of our portfolio investments will constitute qualifying assets. However, we may be precluded from investing in what we believe are attractive investments if such investments are not qualifying assets for purposes of the 1940 Act. If we do not invest a sufficient portion of our assets in qualifying assets, we could lose our status as a BDC, which would have a material adverse effect on our business, financial condition and results of operations. Similarly, these rules could prevent us from making follow-on investments in existing portfolio companies (which could result in the dilution of our position) or could require us to dispose of investments at inappropriate times in order to comply with the 1940 Act. If we need to dispose of such investments quickly, it would be difficult to dispose of such investments on favorable terms. For example, we may have difficulty in finding a buyer and, even if we do find a buyer, we may have to sell the investments at a substantial loss.
Provisions of the Maryland General Corporation Law and of our charter and bylaws could deter takeover attempts and have an adverse impact on the price of our common stock.
The Maryland General Corporation Law and our charter and bylaws contain provisions that may discourage, delay or make more difficult a change in control of OXSQ or the removal of our directors. We are subject to the Maryland Business Combination Act, subject to any applicable requirements of the 1940 Act. Our board of directors has adopted a resolution exempting from the Business Combination Act any business combination between us and any other person, subject to prior approval of such business combination by our board, including approval by a majority of our disinterested directors. If the resolution exempting business combinations is repealed or our board does not approve a business combination, the Business Combination Act may discourage third parties from trying to acquire control of us and increase the difficulty of consummating such an offer. Our bylaws exempt from the Maryland Control Share Acquisition Act acquisitions of our stock by any person. If we amend our bylaws to repeal the exemption from the Control Share Acquisition Act, the Control Share Acquisition Act also may make it more difficult for a third party to obtain control of us and increase the difficulty of consummating such a transaction. The SEC staff has rescinded its position that, under the 1940 Act, an investment company may not avail itself of the Maryland Control Share Acquisition Act. As a result, we will amend our bylaws to be subject to the Maryland Control Share Act only if our Board of Directors determines it would be in our best interest.
We have also adopted measures that may make it difficult for a third party to obtain control of us, including provisions of our charter classifying our board of directors in three classes serving staggered three-year terms, and authorizing our board of directors to classify or reclassify shares of our stock in one or more classes or series, to cause the issuance of additional shares of our stock and to amend our charter without stockholder approval to increase or decrease the number of shares of stock that we have authority to issue. These provisions, as well as other provisions of our charter and bylaws, may delay, defer or prevent a transaction or a change in control that might otherwise be in the best interests of our stockholders.
The foregoing provisions are expected to discourage certain coercive takeover practices and inadequate takeover bids and to encourage persons seeking to acquire control of us to negotiate first with our Board of Directors. However, these provisions may deprive a stockholder of the opportunity to sell such stockholder’s shares at a premium to a potential acquirer. We believe that the benefits of these provisions outweigh the potential disadvantages of discouraging any such acquisition proposals because, among other things, the negotiation of such proposals may improve their terms. Our Board of Directors has considered both the positive and negative effects of the foregoing provisions and determined that they are in the best interest of our stockholders.
Our board of directors may change our investment objective, operating policies and strategies without prior notice or stockholder approval.
Our board of directors has the authority to modify or waive certain of our operating policies and strategies without prior notice (except as required by the 1940 Act) and without stockholder approval. However, absent stockholder approval, we may not change the nature of our business so as to cease to be, or withdraw our election as a BDC. We cannot predict the effect any changes to our current operating policies and strategies would have on our business, operating results and value of our stock. Nevertheless, the effects may adversely affect our business and impact our ability to make distributions.
45
RISKS RELATING TO OUR INVESTMENTS
Our investment portfolio may be concentrated in a limited number of portfolio companies, which will subject us to a risk of significant loss if any of these companies defaults on its obligations under any of its debt securities that we hold or if the sectors in which we invest experience a market downturn.
A consequence of our limited number of investments is that the aggregate returns we realize may be significantly adversely affected if a small number of investments perform poorly or if we need to write down the value of any one investment. Beyond the asset diversification requirements applicable to RICs, we do not have fixed guidelines for diversification, and our investments could be concentrated in relatively few issuers. While we have historically focused on the technology sector, we are actively seeking new investment opportunities outside this sector that otherwise meet our investment criteria. As a result, a market downturn, including a downturn in the sectors in which we invest, could materially adversely affect us.
The lack of liquidity in our investments may adversely affect our business.
As stated above, our investments are generally not in publicly traded securities. Substantially all of these securities are subject to legal and other restrictions on resale or will otherwise be less liquid than publicly traded securities. For example, there is a limited secondary market for any of our investments in warehouse facilities and our investments in warehouse facilities are less liquid than our investments in CLOs. The illiquidity of our investments may make it difficult for us to sell such investments if the need arises. Also, if we are required to liquidate all or a portion of our portfolio quickly, we may realize significantly less than the value at which we have previously recorded our investments.
In addition, because we generally invest in debt securities with a term of up to seven years and generally intend to hold such investments until maturity of the debt, we do not expect realization events, if any, to occur in the near-term. We expect that our holdings of equity securities may require several years to appreciate in value, and we can offer no assurance that such appreciation will occur.
If we cannot obtain additional capital because of either regulatory or market price constraints, we could be forced to curtail or cease our new lending and investment activities, our net asset value could decrease and our level of distributions and liquidity could be affected adversely.
Our ability to secure additional financing and satisfy our financial obligations under indebtedness outstanding from time to time will depend upon our future operating performance, which is subject to the prevailing general economic and credit market conditions, including interest rate levels and the availability of credit generally, and financial, business and other factors, many of which are beyond our control. The worsening of current economic and capital market conditions could have a material adverse effect on our ability to secure financing on favorable terms, if at all.
If we are unable to obtain debt capital, then our equity investors will not benefit from the potential for increased returns on equity resulting from leverage to the extent that our investment strategy is successful and we may be limited in our ability to make new commitments or fundings to our portfolio companies.
Most of our debt investments will not fully amortize during their lifetime, which may subject us to the risk of loss of our principal in the event a portfolio company is unable to repay us prior to maturity.
Most of our debt investments are not structured to fully amortize during their lifetime. Accordingly, if a portfolio company has not previously pre-paid its debt investment to us, a significant portion of the principal amount due on such a debt investment may be due at maturity. In order to create liquidity to pay the final principal payment, a portfolio company typically must raise additional capital. If it is unable to raise sufficient funds to repay us, the debt investment may go into default, which may compel us to foreclose on the borrower’s assets, even if the debt investment was otherwise performing prior to maturity. This may prevent us from immediately obtaining full recovery on the debt investment and may prevent or delay the reinvestment of the investment proceeds in other, possibly more profitable investments.
46
Our portfolio companies may prepay loans, which may reduce our yields if capital returned cannot be invested in transactions with equal or greater expected yields.
The loans in our investment portfolio may be prepaid at any time, generally with little advance notice. Whether a loan is prepaid will depend both on the continued positive performance of the portfolio company and the existence of favorable financing market conditions that allow such company the ability to replace existing financing with less expensive capital. As market conditions change, we do not know when, and if, prepayment may be possible for each portfolio company. In some cases, the prepayment of a loan may reduce our achievable yield if the capital returned cannot be invested in transactions with equal or greater expected yields, which could have a material adverse effect on our business, financial condition and results of operations.
The application of the risk retention rules to CLOs may have broader effects on the CLO and loan markets in general, potentially resulting in fewer or less desirable investment opportunities for the Company.
Section 941 of the Dodd-Frank Act added a provision to the Exchange Act requiring the seller, sponsor or securitizer of a securitization vehicle to retain no less than five percent of the credit risk in assets it sells into a securitization and prohibiting such securitizer from directly or indirectly hedging or otherwise transferring the retained credit risk. The responsible federal agencies adopted final rules implementing these restrictions on October 22, 2014 and the final rules became effective on December 24, 2016. Under the final rules, the asset manager of a CLO is considered the sponsor of a securitization vehicle and is required to retain five percent of the credit risk in the CLO, which may be retained horizontally in the equity tranche of the CLO or vertically as a five percent interest in each tranche of the securities issued by the CLO. Although the final rules contain an exemption from such requirements for the asset manager of a CLO if, among other things, the originator or lead arranger of all of the loans acquired by the CLO retain such risk at the asset level and, at origination of such asset, takes a loan tranche of at least 20% of the aggregate principal balance, it is possible that the originators and lead arrangers of loans in this market will not agree to assume this risk or provide such retention at origination of the asset in a manner that would provide meaningful relief from the risk retention requirements for CLO managers.
Collateral managers of “open market CLOs” are no longer required to comply with the U.S. risk retention rules at this time. On February 9, 2018, a three-judge panel of the United States Court of Appeals for the District of Columbia Circuit ruled that managers of so-called “open market CLOs” are not “securitizers” under Section 941 of the Dodd-Frank Act and, therefore, are not subject to the requirements of the U.S. risk retention rules. On April 5, 2018, the United States District Court for the District of Columbia entered an order implementing the D.C. Circuit ruling and thereby vacated the U.S. Risk Retention Rules insofar as they apply to CLO managers of “open market CLOs”.
It is possible that some collateral managers of open market CLOs will decide to dispose of the notes constituting the “eligible vertical interest” or “eligible horizontal interest” they were previously required to retain, or decide to take other action with respect to such notes that is not otherwise permitted by the U.S. risk retention rules. As a result of this decision, certain CLO managers of “open market CLOs” will no longer be required to comply with the U.S. risk retention rules solely because of their roles as managers of “open market CLOs”, and there may be no “sponsor” of such securitization transactions and no party may be required to acquire and retain an economic interest in the credit risk of the securitized assets of such transactions.
There can be no assurance or representation that any of the transactions, structures or arrangements currently under consideration by or currently used by CLO market participants will comply with the U.S. risk retention rules to the extent such rules are reinstated or otherwise become applicable to open market CLOs. The ultimate impact of the U.S. risk retention rules on the loan securitization market and the leveraged loan market generally remains uncertain, and any negative impact on secondary market liquidity for securities comprising a CLO may be experienced due to the effects of the U.S. risk retention rules on market expectations or uncertainty, the relative appeal of other investments not impacted by the U.S. risk retention rules and other factors.
Our investments in the companies that we target may be extremely risky and we could lose all or part of our investments.
Although a prospective portfolio company’s assets are one component of our analysis when determining whether to provide debt capital, we generally do not base investment decisions primarily on the liquidation value of a company’s balance sheet assets. Instead, given the nature of the companies that we invest in, we also review the company’s historical and projected cash flows, equity capital and “soft” assets, including intellectual property
47
(patented and non-patented), databases, business relationships (both contractual and non-contractual) and the like. Accordingly, considerably higher levels of overall risk will likely be associated with our portfolio compared with that of a traditional asset-based lender whose security consists primarily of receivables, inventories, equipment and other tangible assets. Interest rates payable by our portfolio companies may not compensate for these additional risks, any of which could cause us to lose part or all of our investment.
Specifically, investment in certain of the companies that we are invested in involves a number of significant risks, including:
• these companies may have limited financial resources and may be unable to meet their obligations under their debt securities that we hold, which may be accompanied by a deterioration in the value of any collateral and a reduction in the likelihood of us realizing any value from the liquidation of such collateral;
• they may have limited operating histories, narrower product lines and smaller market shares than larger businesses, which may tend to render them more vulnerable to competitors’ actions and market conditions, as well as general economic downturns;
• because many of them tend to be privately owned, there is generally little publicly available information about these businesses; therefore, although Oxford Square Management’s agents will perform “due diligence” investigations on these portfolio companies, their operations and their prospects, we may not learn all of the material information we need to know regarding these businesses;
• some of these companies are more likely to depend on the management talents and efforts of a small group of persons; therefore, the death, disability, resignation or termination of one or more of these persons could have a material adverse impact on our portfolio company and, in turn, on us;
• some of these companies may have less predictable operating results, may from time to time be parties to litigation, may be engaged in rapidly changing businesses with products subject to a substantial risk of obsolescence, and may require substantial additional capital to support their operations, finance expansion or maintain their competitive position; and
• many of these companies may be more susceptible to economic recessions or downturns than other better capitalized companies that operate in less capital-intensive industries.
A portfolio company’s failure to satisfy financial or operating covenants imposed by us or other lenders could lead to defaults and, potentially, termination of its loans and foreclosure on its assets, which could trigger cross-defaults under other agreements and jeopardize our portfolio company’s ability to meet its obligations under the debt securities that we hold. We may incur expenses to the extent necessary to seek recovery upon default or to negotiate new terms with a defaulting portfolio company. In addition, if a portfolio company goes bankrupt, even though we may have structured our interest as senior debt, depending on the facts and circumstances, including the extent to which we actually provided significant “managerial assistance” to that portfolio company, a bankruptcy court might recharacterize our debt holding and subordinate all or a portion of our claim to that of other creditors.
Our failure to make follow-on investments in our portfolio companies could impair the value of our investment portfolio.
Following an initial investment in a portfolio company, we may make additional investments in that portfolio company as “follow-on” investments, in order to: (i) increase or maintain in whole or in part our equity ownership percentage; (ii) exercise warrants, options or convertible securities that were acquired in the original or subsequent financing; or (iii) attempt to preserve or enhance the value of our investment.
We may elect not to make follow-on investments or otherwise lack sufficient funds to make those investments. We have the discretion to make any follow-on investments, subject to the availability of capital resources. The failure to make follow-on investments may, in some circumstances, jeopardize the continued viability of a portfolio company and our initial investment, or may result in a missed opportunity for us to increase our participation in a successful operation. Even if we have sufficient capital to make a desired follow-on investment, we may elect not to make a follow-on investment because we may not want to increase our concentration of risk, because we prefer other opportunities, or because we are inhibited by compliance with BDC requirements or the desire to maintain our tax status.
48
Our incentive fee may induce Oxford Square Management to use leverage and to make speculative investments.
The incentive fee payable by us to Oxford Square Management may create an incentive for Oxford Square Management to use leverage and to make investments on our behalf that are risky or more speculative than would be the case in the absence of such compensation arrangement. The way in which the incentive fee on “Pre-Incentive Fee Net Investment Income” is determined, which is calculated as a percentage of the return on invested capital, may encourage Oxford Square Management to use leverage to increase the return on our equity capital. Under certain circumstances, the use of leverage may increase the likelihood of default, which would disfavor holders of our common stock. Similarly, because Oxford Square Management may also receive an incentive fee based, in part, upon the capital gains realized on our investments, the investment adviser may invest more than would otherwise be appropriate in companies whose securities are likely to yield capital gains, as compared to income producing securities. Such a practice could result in our investing in more speculative securities than would otherwise be the case, which could result in higher investment losses, particularly during an economic downturn.
Our portfolio companies may incur debt that ranks equally with, or senior to, our investments in such companies.
We intend to invest primarily in senior debt securities, but may also invest in subordinated debt securities, issued by our portfolio companies. In some cases, portfolio companies will be permitted to have other debt that ranks equally with, or senior to, the debt securities in which we invest. By their terms, such debt instruments may provide that the holders thereof are entitled to receive payment of interest or principal on or before the dates on which we are entitled to receive payments in respect of the debt securities in which we invest. Also, in the event of insolvency, liquidation, dissolution, reorganization or bankruptcy of a portfolio company, holders of debt instruments ranking senior to our investment in that portfolio company would typically be entitled to receive payment in full before we receive any distribution in respect of our investment. After repaying such senior creditors, such portfolio company may not have any remaining assets to use for repaying its obligations to us. In the case of debt ranking equally with debt securities in which we invest, we would have to share on an equal basis any distributions with other creditors holding such debt in the event of an insolvency, liquidation, dissolution, reorganization or bankruptcy of the relevant portfolio company. In addition, we will not be in a position to control any portfolio company by investing in its debt securities. As a result, we are subject to the risk that a portfolio company in which we invest may make business decisions with which we disagree and the management of such companies, as representatives of the holders of their common equity, may take risks or otherwise act in ways that do not best serve our interests as debt investors.
We may not realize gains from our equity investments.
When we invest in debt securities, we may acquire warrants or other equity securities as well. However, the equity interests we receive may not appreciate in value and, in fact, may decline in value. Accordingly, we may not be able to realize gains from our equity interests, and any gains that we do realize on the disposition of any equity interests may not be sufficient to offset any other losses we experience.
Because we generally do not hold controlling equity interests in our portfolio companies, we may not be in a position to exercise control over our portfolio companies or to prevent decisions by the managements of our portfolio companies that could decrease the value of our investments.
Although we have taken and may in the future take controlling equity positions in our portfolio companies from time to time, we generally do not do so. As a result, we are subject to the risk that a portfolio company may make business decisions with which we disagree, and the stockholders and management of a portfolio company may take risks or otherwise act in ways that are adverse to our interests. Due to the lack of liquidity for the debt and equity investments that we typically hold in our portfolio companies, we may not be able to dispose of our investments in the event we disagree with the actions of a portfolio company, and may therefore suffer a decrease in the value of our investments.
49
Our investments in CLO vehicles are riskier and less transparent to us and our stockholders than direct investments in the underlying senior loans.
We have invested principally in equity and junior debt tranches issued by CLO vehicles. Generally, there may be less information available to us regarding the underlying debt investments held by such CLO vehicles than if we had invested directly in the debt of the underlying companies. As a result, our stockholders may not know the details of the underlying securities of the CLO vehicles in which we will invest. Our CLO investments will also be subject to the risk of leverage associated with the debt issued by such CLOs and the repayment priority of senior debt holders in such CLO vehicles. Additionally, CLOs in which we invest are often governed by a complex series of legal documents and contracts. As a result, the risk of dispute over interpretation or enforceability of the documentation may be higher relative to other types of investments. For example, some documents governing the loans underlying our CLO investments may allow for “priming transactions,” in connection with which majority lenders or debtors can amend loan documents to the detriment of other lenders, amend loan documents in order to move collateral, or amend documents in order to facilitate capital outflow to other parties/subsidiaries in a capital structure, any of which may adversely affect the rights and security priority of the CLOs in which we are invested.
The accounting and tax implications of such investments are complicated. In particular, reported earnings from the equity tranche investments of these CLO vehicles are recorded under GAAP based upon an effective yield calculation. Current taxable earnings on these investments, however, will generally not be determinable until after the end of the fiscal year of each individual CLO vehicle that ends within the Company’s fiscal year, even though the investments are generating cash flow. In general, the tax treatment of these investments may result in higher distributable earnings in the early years and a capital loss at maturity, while for reporting purposes the totality of cash flows are reflected in a constant yield to maturity.
Some instruments issued by CLO vehicles may not be readily marketable and may be subject to restrictions on resale. Securities issued by CLO vehicles are generally not listed on any U.S. national securities exchange and no active trading market may exist for the securities of CLO vehicles in which we may invest. Although a secondary market may exist for our investments in CLO vehicles, the market for our investments in CLO vehicles may be subject to irregular trading activity, wide bid/ask spreads and extended trade settlement periods. As a result, these types of investments may be more difficult to value.
Failure by a CLO vehicle in which we are invested to satisfy certain tests will harm our operating results.
The failure by a CLO vehicle in which we invest to satisfy certain financial covenants, specifically those with respect to adequate collateralization and/or interest coverage tests, could lead to a reduction in its payments to us. In the event that a CLO vehicle failed these certain tests, holders of debt senior to us may be entitled to additional payments that would, in turn, reduce the payments we would otherwise be entitled to receive. Separately, we may incur expenses to the extent necessary to seek recovery upon default or to negotiate new terms, which may include the waiver of certain financial covenants, with a defaulting CLO vehicle or any other investment we may make. If any of these occur, it could materially and adversely affect our operating results and cash flows.
Our financial results may be affected adversely if one or more of our significant equity or junior debt investments in a CLO vehicle defaults on its payment obligations or fails to perform as we expect or if the market price fluctuates significantly in such illiquid investments.
As a BDC, we may not acquire equity and junior debt investments in CLO vehicles unless, at the time of such acquisition, at least 70% of our total assets are “qualifying assets.” CLO vehicles that we invest in are typically very highly levered, and therefore, the junior debt and equity tranches that we invest in are subject to a higher degree of risk of total loss. As of December 31, 2020, the CLO vehicles in which we were invested had average leverage of 9.6 times and ranged from approximately 3.3 times to 13.3 times levered. In particular, investors in CLO vehicles indirectly bear risks of the underlying debt investments held by such CLO vehicles. We will generally have the right to receive payments only from the CLO vehicles, and will generally not have direct rights against the underlying borrowers or the entity that sponsored the CLO vehicle. While the CLO vehicles we have and continue to target generally enable the investor to acquire interests in a pool of leveraged corporate loans without the expenses associated with directly holding the same investments, we will generally indirectly pay a proportionate share of the CLO vehicles’ administrative and other expenses. Although it is difficult to predict whether the prices of indices and securities underlying CLO vehicles
50
will rise or fall, these prices (and, therefore, the prices of the CLO vehicles) will be influenced by the same types of political and economic events that affect issuers of securities and capital markets generally. The failure by a CLO vehicle in which we invest to satisfy certain financial covenants, including as a result of the COVID-19 pandemic, and specifically those with respect to adequate collateralization and/or interest coverage tests, could lead to a reduction in its payments to us. In the event that a CLO vehicle failed those tests, holders of debt senior to us may be entitled to additional payments that would, in turn, reduce the payments we would otherwise be entitled to receive. Separately, we may incur expenses to the extent necessary to seek recovery upon default or to negotiate new terms with a defaulting CLO vehicle or any other investment we may make. If any of these occur, it could materially and adversely affect our operating results and cash flows.
The interests we intend to acquire in CLO vehicles will likely be thinly traded or have only a limited trading market. CLO vehicles are typically privately offered and sold, even in the secondary market. As a result, investments in CLO vehicles may be characterized as illiquid securities. In addition to the general risks associated with investing in debt securities, CLO vehicles carry additional risks, including, but not limited to: (i) the possibility that distributions from collateral securities will not be adequate to make interest or other payments; (ii) the quality of the collateral may decline in value or default; (iii) the fact that our investments in CLO tranches will likely be subordinate to other senior classes of note tranches thereof; and (iv) the complex structure of the security may not be fully understood at the time of investment and may produce disputes with the CLO vehicle or unexpected investment results. Our net asset value may also decline over time if our principal recovery with respect to CLO equity investments is less than the price we paid for those investments
Investments in structured vehicles, including equity and junior debt instruments issued by CLO vehicles, involve risks, including credit risk and market risk. Changes in interest rates and credit quality may cause significant price fluctuations. Additionally, changes in the underlying leveraged corporate loans held by a CLO vehicle may cause payments on the instruments we hold to be reduced, either temporarily or permanently. During fiscal 2020, the CLO equity market experienced volatility resulting from the COVID-19 pandemic. For example, in the first quarter of 2020, the S&P/LSTA Leveraged Loan Index decreased from a price of 96.72% at the end of December 2019 to 82.85% at the end of March 2020. The S&P/LSTA Leveraged Loan Index stood at 96.19% as of December 31, 2020. Although the U.S. loan market did stabilize in the second half of fiscal 2020, any future or continued volatility in the U.S. loan market could have an adverse impact on the CLO vehicles in which we invest and may impact their ability to make payments on the instruments we hold.
Structured investments, particularly the subordinated interests in which we intend to invest, are less liquid than many other types of securities and may be more volatile than the leveraged corporate loans underlying the CLO vehicles we intend to target. Fluctuations in interest rates may also cause payments on the tranches of CLO vehicles that we hold to be reduced, either temporarily or permanently.
Investments in foreign securities formed under the laws of the Cayman Islands may involve significant risks in addition to the risks inherent in U.S. investments.
Our investment strategy involves investments in securities issued by foreign entities, including foreign CLO vehicles that are formed under the laws of the Cayman Islands. Investing in foreign entities formed under the laws of the Cayman Islands may expose us to additional risks not typically associated with investing in U.S. issues. These risks include changes in exchange control regulations, political and social instability, expropriation, imposition of foreign taxes, less liquid markets and less available information than is generally the case in the U.S., higher transaction costs, less government supervision of exchanges, brokers and issuers, less developed bankruptcy laws, difficulty in enforcing contractual obligations, lack of uniform accounting and auditing standards and greater price volatility. Further, we, and the CLO vehicles in which we invest, may have difficulty enforcing creditor’s rights in foreign jurisdictions, such as the Cayman Islands. In addition, the underlying companies of the CLO vehicles in which we invest may be foreign, which may create greater exposure for us to foreign economic developments.
Although we expect that most of our investments will be U.S. dollar-denominated, any investments denominated in a foreign currency will be subject to the risk that the value of a particular currency will change in relation to one or more other currencies. Among the factors that may affect currency values are trade balances, the level of short-term interest rates, differences in relative values of similar assets in different currencies, long-term opportunities for investment and capital appreciation, and political developments. We may employ hedging techniques to minimize these risks, but we can offer no assurance that we will, in fact, hedge currency risk, or that if we do, such strategies will be effective.
51
We will have no influence on management of underlying investments managed by non-affiliated third party CLO collateral managers.
We are not responsible for and have no influence over the asset management of the portfolios underlying the CLO investments we hold as those portfolios are managed by non-affiliated third party CLO collateral managers. Similarly, we are not responsible for and have no influence over the day-to-day management, administration or any other aspect of the issuers of the individual securities. As a result, the values of the portfolios underlying our CLO investments could decrease as a result of decisions made by third party CLO collateral managers.
RISKS RELATING TO AN INVESTMENT IN OUR SECURITIES
Our common stock price may be volatile.
The trading price of our common stock may fluctuate substantially depending on many factors, some of which are beyond our control and may not be directly related to our operating performance. These factors include, but are not limited to, the following:
• price and volume fluctuations in the overall stock market from time to time;
• significant volatility in the market price and trading volume of securities of regulated investment companies, BDCs or other financial services companies;
• exclusion of our common stock from certain indices, such as the Russell 2000 Financial Services Index, which could reduce the ability of certain investment funds to own our common stock and put short-term selling pressure on our common stock;
• changes in regulatory policies or tax guidelines with respect to regulated investment companies or BDCs;
• actual or anticipated changes in our earnings or fluctuations in our operating results or changes in the expectations of securities analysts;
• general economic conditions and trends;
• loss of a major funding source; or
• departures of key personnel.
In the past, following periods of volatility in the market price of a company’s securities, securities class action litigation has often been brought against such company. Due to the potential volatility of our stock price, we may therefore be the target of securities litigation in the future. Securities litigation could result in substantial costs and divert management’s attention and resources from our business. Refer to “Risks relating to our business and structure — Our business and operation could be negatively affected if we become subject to any additional securities litigation or shareholder activism, which could cause us to incur significant expense, hinder execution of our investment strategy and impact our stock price.”
Our shares of common stock have traded at a discount from net asset value and may do so in the future.
Shares of BDCs have frequently traded at a market price that is less than the net asset value that is attributable to those shares. Our common stock traded below our net asset value per share during some periods from 2010 through March 2021. Our common stock could trade at a discount to net asset value at any time in the future. The possibility that our shares of common stock may trade at a discount from net asset value over the long term is separate and distinct from the risk that our net asset value will decrease. As a result of the COVID-19 pandemic, the stocks of BDCs as an industry, including shares of our common stock, have traded below NAV, at or near historic lows as a result of concerns over liquidity, leverage restrictions and distribution requirements.
If our common stock trades below its net asset value, we will generally not be able to issue additional shares of our common stock at its market price without first obtaining the approval for such issuance from our stockholders and our independent directors. If additional funds are not available to us, we could be forced to curtail or cease our new lending and investment activities, and our net asset value could decrease and our level of distributions could be impacted. Our net asset value may also decline over time if our principal recovery with respect to CLO equity investments is less than the price that we paid for those investments.
52
If the current period of capital market disruption and instability continues for an extended period of time, there is a risk that investors in our equity securities may not receive distributions consistent with historical levels or at all or that our distributions may not grow over time and a portion of our distributions may be a return of capital.
We cannot assure you that we will achieve investment results or maintain a tax treatment that will allow or require any specified level of cash distributions or year-to-year increases in cash distributions. In particular, our future distributions are dependent upon the investment income we receive on our portfolio investments, including our higher-yielding CLO equity investments. To the extent such investment income, including income from our CLO equity investments (which we expect to decline as those vehicles de-leverage after the end of their respective re-investment periods), declines or if we transition our portfolio into lower-yielding investments, our ability to pay future distributions may be harmed.
Our ability to pay distributions might also be adversely affected by the impact of one or more of the risk factors described in this annual report or incorporated herein by reference, including the COVID-19 pandemic. For example, if the temporary closure of many corporate offices, retail stores, and manufacturing facilities and factories in the jurisdictions, including the United States, affected by the COVID-19 pandemic were to continue for an extended period of time, it could result in reduced cash flows to us from our existing portfolio companies, which could reduce cash available for distribution to our stockholders. If we violate certain covenants under our existing or future credit facilities or other leverage, we may be limited in our ability to make distributions. If we declare a distribution and if more stockholders opt to receive cash distributions rather than participate in our dividend reinvestment plan, we may be forced to sell some of our investments in order to make cash distribution payments. To the extent we make distributions to stockholders that include a return of capital, such portion of the distribution essentially constitutes a return of the stockholder’s investment. Although such return of capital may not be taxable, such distributions would generally decrease a stockholder’s basis in our common stock and may therefore increase such stockholder’s tax liability for capital gains upon the future sale of such stock. A return of capital distribution may cause a stockholder to recognize a capital gain from the sale of our common stock even if the stockholder sells its shares for less than the original purchase price.
Due to the COVID-19 pandemic or other disruptions in the economy, we may not be able to increase our dividends and may reduce or defer our dividends and choose to incur U.S. federal excise tax in order preserve cash and maintain flexibility.
As a BDC, we are not required to make any distributions to shareholders other than in connection with our election to be taxed as a RIC under subchapter M of the Code. In order to maintain our tax treatment as a RIC, we must distribute to shareholders for each taxable year at least 90% of our investment company taxable income (i.e., net ordinary income plus realized net short-term capital gains in excess of realized net long-term capital losses). If we qualify for taxation as a RIC, we generally will not be subject to corporate-level US federal income tax on our investment company taxable income and net capital gains (i.e., realized net long-term capital gains in excess of realized net short-term capital losses) that we timely distribute to shareholders. We will be subject to a 4% U.S. federal excise tax on undistributed earnings of a RIC unless we distribute each calendar year at least the sum of (i) 98.0% of our ordinary income for the calendar year, (ii) 98.2% of our capital gains in excess of capital losses for the one-year period ending on October 31 of the calendar year, and (iii) any ordinary income and net capital gains for preceding years that were not distributed during such years and on which we paid no federal income tax.
Under the Code, we may satisfy certain of our RIC distributions with dividends paid after the end of the current year. In particular, if we pay a distribution in January of the following year that was declared in October, November, or December of the current year and is payable to shareholders of record in the current year, the dividend will be treated for all US federal income tax purposes as if it were paid on December 31 of the current year. In addition, under the Code, we may pay dividends, referred to as “spillover dividends,” that are paid during the following taxable year that will allow us to maintain our qualification for taxation as a RIC and eliminate our liability for corporate-level U.S. federal income tax. Under these spillover dividend procedures, we may defer distribution of income earned during the current year until December of the following year. For example, we may defer distributions of income earned during 2020 until as late as December 31, 2021. If we choose to pay a spillover dividend, we will incur the 4% U.S. federal excise tax on some or all of the distribution.
53
Due to the COVID-19 pandemic or other disruptions in the economy, we may take certain actions with respect to the timing and amounts of our distributions in order to preserve cash and maintain flexibility. For example, we may not be able to increase our dividends. In addition, we may reduce our dividends and/or defer our dividends to the following taxable year. If we defer our dividends, we may choose to utilize the spillover dividend rules discussed above and incur the 4% U.S. federal excise tax on such amounts. To further preserve cash, we may combine these reductions or deferrals of dividends with one or more distributions that are payable partially in our stock as discussed below under “We may choose to pay distributions in our own stock, in which case our stockholders may be required to pay U.S. federal income taxes in excess of the cash distributions they receive.”
We may choose to pay distributions in our own common stock, in which case, our stockholders may be required to pay U.S. federal income taxes in excess of the cash distributions they receive.
We may distribute taxable distributions that are payable in cash or shares of our common stock at the election of each stockholder. Under certain applicable provisions of the Code and the published guidance, distributions payable of a publicly offered RIC that are in cash or in shares of stock at the election of stockholders may be treated as taxable distributions. The Internal Revenue Service has a revenue procedure indicating that this rule will apply if the total amount of cash to be distributed is not less than 20% of the total distribution. Under this revenue procedure, if too many stockholders elect to receive their distributions in cash, the cash available for distribution must be allocated among the stockholders electing to receive cash (with the balance of distributions paid in stock). In no event will any stockholder, electing to receive cash, receive less than the lesser of (a) the portion of the distribution such stockholder has elected to receive in cash or (b) an amount equal to his or her entire distribution times the percentage limitation on cash available for distribution. If we decide to make any distributions consistent with this revenue procedure that are payable in part in our stock, taxable stockholders receiving such distributions will be required to include the full amount of the distribution (whether received in cash, our stock, or a combination thereof) as ordinary income (or as long-term capital gain to the extent such distribution is properly reported as a capital gain distribution) to the extent of our current and accumulated earnings and profits for U.S. federal income tax purposes. As a result, a U.S. stockholder may be required to pay tax with respect to such distributions in excess of any cash received. If a U.S. stockholder sells the stock it receives as a distribution in order to pay this tax, the sales proceeds may be less than the amount included in income with respect to the distribution, depending on the market price of our stock at the time of the sale. Furthermore, with respect to non-U.S. stockholders, we may be required to withhold U.S. tax with respect to such distributions, including in respect of all or a portion of such distribution that is payable in stock. If a significant number of our stockholders determine to sell shares of our stock in order to pay taxes owed on distributions, it may put downward pressure on the trading price of our stock. Furthermore, with respect to non-U.S. stockholders, we may be required to withhold U.S. tax with respect to such distributions, including in respect of all or a portion of such distribution that is payable in stock. If a significant number of our stockholders determine to sell shares of our stock in order to pay taxes owed on distributions, it may put downward pressure on the trading price of our stock.
Your interest in us may be diluted if you do not fully exercise your subscription rights in any rights offering.
In the event we issue subscription rights or warrants to purchase shares of our common stock, stockholders who do not fully exercise their rights or warrants should expect that they will, at the completion of the offer, own a smaller proportional interest in us than would otherwise be the case if they fully exercised their rights or warrants. We cannot state precisely the amount of any such dilution in share ownership because we do not know at this time what proportion of the shares will be purchased as a result of the offer.
In addition, if the subscription price is less than our net asset value per share, then our stockholders would experience an immediate dilution of the aggregate net asset value of their shares as a result of the offer. The amount of any decrease in net asset value is not predictable because it is not known at this time what the subscription price, warrant exercise price or net asset value per share will be on the expiration date of such rights offering or what proportion of the shares will be purchased as a result of the offer. Such dilution could be substantial.
54
If we issue preferred stock, the net asset value and market value of our common stock will likely become more volatile.
We cannot assure you that the issuance of preferred stock would result in a higher yield or return to the holders of the common stock. The issuance of preferred stock would likely cause the net asset value and market value of the common stock to become more volatile. If the distribution rate on the preferred stock were to approach the net rate of return on our investment portfolio, the benefit of leverage to the holders of the common stock would be reduced. If the distribution rate on the preferred stock were to exceed the net rate of return on our portfolio, the leverage would result in a lower rate of return to the holders of common stock than if we had not issued preferred stock. Any decline in the net asset value of our investments would be borne entirely by the holders of common stock. Therefore, if the market value of our portfolio were to decline, the leverage would result in a greater decrease in net asset value to the holders of common stock than if we were not leveraged through the issuance of preferred stock. This greater net asset value decrease would also tend to cause a greater decline in the market price for the common stock. We might be in danger of failing to maintain the required asset coverage of the preferred stock or of losing our ratings, if any, on the preferred stock or, in an extreme case, our current investment income might not be sufficient to meet the distribution requirements on the preferred stock. In order to counteract such an event, we might need to liquidate investments in order to fund a redemption of some or all of the preferred stock. In addition, we would pay (and the holders of common stock would bear) all costs and expenses relating to the issuance and ongoing maintenance of the preferred stock, including a likely higher advisory fee. Holders of preferred stock may have different interests than holders of common stock and may at times have disproportionate influence over our affairs.
Holders of any preferred stock we might issue would have the right to elect members of our Board of Directors and class voting rights on certain matters.
Holders of any preferred stock we might issue, voting separately as a single class, would have the right to elect two members of our Board of Directors at all times and in the event distributions become two full years in arrears would have the right to elect a majority of the directors until such arrearage is completely eliminated. In addition, preferred stockholders have class voting rights on certain matters, including changes in fundamental investment restrictions and conversion to open-end status, and accordingly can veto any such changes. Restrictions imposed on the declarations and payment of distributions or other distributions to the holders of our common stock and preferred stock, both by the 1940 Act and by requirements imposed by rating agencies, if any, or the terms of our credit facilities, if any, might impair our ability to maintain our tax treatment as a RIC for U.S. federal income tax purposes. While we would intend to redeem our preferred stock to the extent necessary to enable us to distribute our income as required to maintain our qualification as a RIC, there can be no assurance that such actions could be effected in time to meet the tax requirements.
The net asset value per share of our common stock may be diluted if we sell shares of our common stock in one or more offerings at prices below the then current net asset value per share of our common stock.
If we were to sell shares of our common stock below its then current net asset value per share, such sales would result in an immediate dilution to the net asset value per share of our common stock. This dilution would occur as a result of the sale of shares at a price below the then current net asset value per share of our common stock and a proportionately greater decrease in the stockholders’ interest in our earnings and assets and their voting interest in us than the increase in our assets resulting from such issuance. Because the number of shares of common stock that could be so issued and the timing of any issuance is not currently known, the actual dilutive effect cannot be predicted.
Further, if our current stockholders do not purchase any shares to maintain their percentage interest, regardless of whether such offering is above or below the then current net asset value per share, their voting power will be diluted. For example, if we sell an additional 10% of our common shares at a 10% discount from net asset value, a stockholder who does not participate in that offering for its proportionate interest will suffer net asset value dilution of up to 1.0% or $10 per $1,000 of net asset value.
55
GENERAL RISKS
There is uncertainty surrounding potential legal, regulatory and policy changes by new presidential administrations in the United States that may directly affect financial institutions and the global economy.
As a result of the United States presidential election, which occurred on November 3, 2020, the Democratic Party controls the executive branch of government. The Democratic Party also currently controls both the Senate and House of Representatives portions of the legislative branch of government. Changes in federal policy, including tax policies, and at regulatory agencies that occur over time through policy and personnel changes following elections, could lead to changes involving the level of oversight and focus on the financial services industry or the tax rates paid by corporate entities. The nature, timing and economic and political effects of potential changes to the current legal and regulatory framework affecting financial institutions remain highly uncertain. Uncertainty surrounding future changes may adversely affect our operating environment and therefore our business, financial condition, results of operations and growth prospects.
Uncertainty about presidential administration initiatives could negatively impact our business, financial condition and results of operations.
The current administration has called for significant changes to U.S. trade, healthcare, immigration, foreign and government regulatory policy. In this regard, there is significant uncertainty with respect to legislation, regulation and government policy at the federal level, as well as the state and local levels. Recent events have created a climate of heightened uncertainty and introduced new and difficult-to-quantify macroeconomic and political risks with potentially far-reaching implications. There has been a corresponding meaningful increase in the uncertainty surrounding interest rates, inflation, foreign exchange rates, trade volumes and fiscal and monetary policy. To the extent the U.S. Congress or the current administration implements changes to U.S. policy, those changes may impact, among other things, the U.S. and global economy, international trade and relations, unemployment, immigration, corporate taxes, healthcare, the U.S. regulatory environment, inflation and other areas. Although we cannot predict the impact, if any, of these changes to our business, they could adversely affect our business, financial condition, operating results and cash flows. Until we know what policy changes are made and how those changes impact our business and the business of our competitors over the long term, we will not know if, overall, we will benefit from them or be negatively affected by them.
The effect of global climate change may impact the operations of our portfolio companies.
There may be evidence of global climate change. Climate change creates physical and financial risk and some of our portfolio companies may be adversely affected by climate change. For example, the needs of customers of energy companies vary with weather conditions, primarily temperature and humidity. To the extent weather conditions are affected by climate change, energy use could increase or decrease depending on the duration and magnitude of any changes. Increases in the cost of energy could adversely affect the cost of operations of our portfolio companies if the use of energy products or services is material to their business. A decrease in energy use due to weather changes may affect some of our portfolio companies’ financial condition, through decreased revenues. Extreme weather conditions in general require more system backup, adding to costs, and can contribute to increased system stresses, including service interruptions. Energy companies could also be affected by the potential for lawsuits against or taxes or other regulatory costs imposed on greenhouse gas emitters, based on links drawn between greenhouse gas emissions and climate change.
In December 2015 the United Nations, of which the U.S. is a member, adopted a climate accord (the ‘‘Paris Agreement’’) with the long-term goal of limiting global warming and the short-term goal of significantly reducing greenhouse gas emissions. On November 4, 2016, the past administration announced that the U.S. would cease participation in the Paris Agreement with the withdrawal taking effect on November 4, 2020. However, on January 20, 2021, President Joseph R. Biden signed an executive order to rejoin the Paris Agreement. As a result, some of our portfolio companies may become subject to new or strengthened regulations or legislation, which could increase their operating costs and/or decrease their revenues.
56
Changes to United States tariff and import/export regulations may have a negative effect on our portfolio companies and, in turn, harm us.
There has been ongoing discussion and commentary regarding potential significant changes to United States trade policies, treaties and tariffs. There is significant uncertainty about the future relationship between the United States and other countries with respect to the trade policies, treaties and tariffs. These developments, or the perception that any of them could occur, may have a material adverse effect on global economic conditions and the stability of global financial markets, and may significantly reduce global trade and, in particular, trade between the impacted nations and the United States. Any of these factors could depress economic activity and restrict our portfolio companies’ access to suppliers or customers and have a material adverse effect on their business, financial condition and results of operations, which in turn would negatively impact us.
Internal and external cyber threats, as well as other disasters, could impair our ability to conduct business effectively.
The occurrence of a disaster such as a cyber-attack against us or against a third-party that has access to our data or networks, a natural catastrophe, an industrial accident, a terrorist attack or war, disease pandemics, events unanticipated in our disaster recovery systems, or a support failure from external providers, could have an adverse effect on our ability to conduct business and on our results of operations and financial condition, particularly if those events affect our computer-based data processing, transmission, storage, and retrieval systems or destroy data.
We depend heavily upon computer systems to perform necessary business functions. Despite our implementation of a variety of security measures, our computers, networks, and data, like those of other companies, could be subject to cyber-attacks and unauthorized access, use, alteration, or destruction, such as from physical and electronic break-ins or unauthorized tampering. If one or more of these events occurs, it could potentially jeopardize the confidential, proprietary and other information processed, stored in, and transmitted through our computer systems and networks. Such an attack could cause interruptions or malfunctions in our operations, which could result in financial losses, litigation, regulatory penalties, client dissatisfaction or loss, reputational damage, and increased costs associated with mitigation of damages and remediation.
Third parties with which we do business may also be sources of cybersecurity or other technological risk. We outsource certain functions and these relationships allow for the storage and processing of our information, as well as client, counterparty, employee, and borrower information. While we engage in actions to reduce our exposure resulting from outsourcing, ongoing threats may result in unauthorized access, loss, exposure, destruction, or other cybersecurity incident that affects our data, resulting in increased costs and other consequences as described above.
We and our service providers currently are impacted by quarantines and similar measures being enacted by governments in response to COVID-19, which are obstructing the regular functioning of business workforces (including requiring employees to work from external locations and their homes). In response to the outbreak, our investment adviser has instituted an optional work from home policy whereby employees of the investment adviser may elect to work remotely until it is deemed safe to return to the office. Policies of extended periods of remote working, whether by us or our service providers, could strain technology resources, introduce operational risks and otherwise heighten the risks described above. Remote working environments may be less secure and more susceptible to hacking attacks, including phishing and social engineering attempts that seek to exploit the COVID-19 pandemic. Accordingly, the risks described above are heightened under current conditions.
We are highly dependent on information systems and systems failures could significantly disrupt our business, which may, in turn, negatively affect the market price of our common stock and our ability to pay distributions.
Our business is highly dependent on our and third parties’ communications and information systems. Any failure or interruption of those systems, including as a result of the termination of an agreement with any third-party service providers, could cause delays or other problems in our activities. Our financial, accounting, data processing, backup or other operating systems and facilities may fail to operate properly or become disabled or damaged as a result of a number of factors including events that are wholly or partially beyond our control and adversely affect our business. There could be:
• sudden electrical or telecommunications outages;
57
• natural disasters such as earthquakes, tornadoes and hurricanes;
• events arising from local or larger scale political or social matters, including terrorist acts; and
• cyber-attacks
These events, in turn, could have a material adverse effect on our operating results and negatively affect the market price of our common stock and our ability to pay distributions to our stockholders.
Certain historical data regarding our business, results of operations, financial condition and liquidity does not reflect the impact of the COVID-19 pandemic and related containment measures and therefore does not purport to be representative of our future performance.
The information included in this Annual report on Form 10-K and our other reports filed with the SEC includes information regarding our business, results of operations, financial condition and liquidity as of dates and for periods before and during the impact of the COVID-19 pandemic and related containment measures (including quarantines and governmental orders requiring the closure of certain businesses, limiting travel, requiring that individuals stay at home or shelter in place and closing borders). Therefore, certain historical information therefore does not reflect the adverse impacts of the COVID-19 pandemic and the related containment measures. Accordingly, investors are cautioned not to unduly rely on such historical information regarding our business, results of operations, financial condition or liquidity, as that data does not reflect the adverse impact of the COVID-19 pandemic and therefore does not purport to be representative of the future results of operations, financial condition, liquidity or other financial or operating results of us, or our business.
Item 1B. Unresolved Staff Comments
Not applicable.
We do not own any real estate or other physical properties materially important to our operation. Our headquarters are located at 8 Sound Shore Drive, Suite 255, Greenwich, Connecticut, where we occupy our office space pursuant to our Administration Agreement with Oxford Funds. We believe that our office facilities are suitable and adequate for our business as it is presently conducted.
We and our consolidated subsidiaries are not currently subject to any pending material legal proceedings. From time to time, we and our consolidated subsidiaries may be a party to certain legal proceedings in the ordinary course of business, including proceedings relating to the enforcement of our rights under contracts with our portfolio companies. While the outcome of these legal proceedings cannot be predicted with certainty, we do not expect that these proceedings will have a material effect upon our financial condition or results of operations.
Item 4. Mine Safety Disclosures
Not applicable.
58
Item 5. Market for Registrant’s Common Equity, Related Stockholder Matters and Issuer Purchases of Equity Securities
PRICE RANGE OF COMMON STOCK AND DISTRIBUTIONS
Our common stock is traded on the Nasdaq Global Select Market under the symbol “OXSQ.” The following table sets forth, for each fiscal quarter during the last two fiscal years, the net asset value, or “NAV,” per share of our common stock, the high and low intraday sales prices for our common stock, such sales prices as a percentage of NAV per share and quarterly distributions per share.
|
Price Range |
Premium or |
Premium or |
Distributions |
|||||||||||||||
|
NAV(1) |
High |
Low |
||||||||||||||||
|
Fiscal 2020 |
|
|
|
|
|
|
||||||||||||
|
Fourth Quarter |
$ |
4.55 |
$ |
3.47 |
$ |
2.36 |
(23.7 |
)% |
(48.1 |
)% |
$ |
0.105 |
||||||
|
Third Quarter |
$ |
3.85 |
$ |
3.00 |
$ |
2.29 |
(22.1 |
)% |
(40.5 |
)% |
$ |
0.105 |
||||||
|
Second Quarter |
$ |
3.54 |
$ |
3.74 |
$ |
2.10 |
5.6 |
% |
(40.7 |
)% |
$ |
0.201 |
||||||
|
First Quarter |
$ |
3.32 |
$ |
6.26 |
$ |
2.04 |
88.6 |
% |
(38.6 |
)% |
$ |
0.201 |
||||||
|
Fiscal 2019 |
|
|
|
|
|
|
||||||||||||
|
Fourth Quarter |
$ |
5.12 |
$ |
6.28 |
$ |
5.02 |
22.7 |
% |
(2.0 |
)% |
$ |
0.201 |
||||||
|
Third Quarter |
$ |
5.42 |
$ |
6.76 |
$ |
6.04 |
24.7 |
% |
11.4 |
% |
$ |
0.201 |
||||||
|
Second Quarter |
$ |
6.31 |
$ |
6.62 |
$ |
6.19 |
4.9 |
% |
(1.9 |
)% |
$ |
0.201 |
||||||
|
First Quarter |
$ |
6.67 |
$ |
7.45 |
$ |
6.16 |
11.7 |
% |
(7.6 |
)% |
$ |
0.200 |
||||||
____________
(1) Net asset value per share is determined as of the last day in the relevant quarter and therefore may not reflect the net asset value per share on the date of the high and low sales prices. The net asset values shown are based on outstanding shares at the end of each period.
(2) Calculated as the respective high or low intraday sales price divided by NAV and subtracting 1.
(3) Represents the cash distributions, including dividends, dividends reinvested and returns of capital, if any, per share that we have declared on our common stock in the specified quarter.
On March 19, 2021, the last reported sales price of our common stock was $4.11 per share. As of March 18, 2021, we had 148 stockholders of record.
Shares of BDCs may trade at a market price that is less than the value of the net assets attributable to those shares. The possibility that our shares of common stock will trade at a discount from net asset value or at premiums that are unsustainable over the long term are separate and distinct from the risk that our net asset value will decrease. Since 2008, our shares of common stock have traded both at a premium and a discount to the net assets attributable to those shares. As of March 19, 2021, our shares of common stock traded at a discount equal to approximately 9.7% of the net asset value per share as of December 31, 2020. It is not possible to predict whether the shares offered hereby will trade at, above, or below net asset value.
Distributions
We currently intend to distribute a minimum of 90% of our ordinary income and short-term capital gains (net of short-term capital losses), if any, on a quarterly basis to our stockholders, in accordance with our election to be treated, and intention to qualify annually, as a RIC under Subchapter M of the Code. For a more detailed discussion of the requirements under Subchapter M, please refer to the discussion in “Business — Certain U.S. Federal Income Tax Considerations” set forth above. In order to qualify as a RIC and to avoid corporate-level U.S. federal income tax on the income we distribute to our stockholders, we are required, under Subchapter M of the Code, to distribute at least 90% of our ordinary income and realized net short-term capital gains in excess of realized net long-term capital losses to our stockholders on an annual basis.
59
A written statement identifying the nature of our distributions for tax reporting purposes was posted on our website. The final determination of the nature of distribution can only be made upon the filing of our tax return. We may not be able to achieve operating results that will allow us to make distributions at a specific level or to increase the amount of these distributions from time to time. In addition, we may be limited in our ability to make distributions due to the asset coverage requirements applicable to us as a BDC under the 1940 Act. If we do not distribute a certain percentage of our income annually, we will suffer adverse tax consequences, including possible loss of RIC tax treatment. We cannot assure stockholders that they will receive any distributions.
To the extent our taxable earnings fall below the total amount of our distributions for that fiscal year, a portion of those distributions may be deemed a tax return of capital to our stockholders. Thus, the source of a distribution to our stockholders may be the original capital invested by the stockholder rather than our taxable ordinary income or capital gains. Stockholders should read any written disclosure accompanying a distribution payment carefully and should not assume that the source of any distribution is taxable ordinary income or capital gains.
Recent Sales of Unregistered Securities
We did not engage in unregistered sales of equity securities during the year ended December 31, 2020, however, we issued a total of 42,343 shares of common stock under our distribution reinvestment plan. This issuance was not subject to the registration requirements of the Securities Act of 1933, as amended. The aggregate value for the shares of common stock issued under the distribution reinvestment plan was approximately $0.2 million. Also, during the year ended December 31, 2020, as part of our distribution reinvestment plan for our common stockholders, our distribution reinvestment administrator purchased 169,713 shares of our common stock for approximately $0.5 million in the open market to satisfy the reinvestment portion of our distribution.
Issuer Purchases of Equity Securities
During the year ended December 31, 2020, no common stock was repurchased.
60
Performance Graph
The graph below compares the cumulative stockholder return on our common stock with that of the NASDAQ Composite Index and the NASDAQ Financial 100, as we do not believe there is an appropriate index of companies with an investment strategy similar to our own with which to compare the return on our common stock, for the period from December 31, 2015 through December 31, 2020. The graph assumes that, on December 31, 2015, a person invested $100 in each of our common stock, the NASDAQ Composite Index and the NASDAQ Financial 100, which includes the 100 largest domestic and international financial organizations listed on the NASDAQ Stock Market based on market capitalization. The NASDAQ Financial 100 contains banks and savings institutions and related holding companies, insurance companies, broker-dealers, investment companies and financial services organizations.
The graph measures cumulative total stockholder return, which takes into account both changes in stock price and distributions. It assumes that distributions paid are reinvested in like securities.
The graph and the information furnished under this Part II Item 5 of this Form 10-K shall not be deemed to be “soliciting material” or to be “filed” with the SEC or subject to Regulation 14A or 14C, or to the liabilities of Section 18 of the Exchange Act. The stock price performance included in the below graph is not necessarily indicative of future stock price performance.
61
FEES AND EXPENSES
The following table is intended to assist you in understanding the costs and expenses that you will bear directly or indirectly. We caution you that some of the percentages indicated in the table below are estimates and may vary. Except where the context suggests otherwise, whenever this Annual Report on Form 10-K contains a reference to fees or expenses paid by “us” or “OXSQ,” or that “we” will pay fees or expenses, you will indirectly bear such fees or expenses as an investor in OXSQ. The fee table and example below include all fees and expenses of our consolidated subsidiary.
|
Stockholder transaction expenses: |
|
||
|
Sales load (as a percentage of offering price) |
— |
%(1) |
|
|
Offering expenses borne by our common stockholders (as a percentage of offering price) |
— |
%(2) |
|
|
Distribution reinvestment plan expenses |
None |
(3) |
|
|
Total stockholder transaction expenses (as a percentage of offering price) |
— |
% |
|
|
Annual expenses (as a percentage of net assets attributable to our common stock): |
|
||
|
Base management fee |
2.22 |
%(4) |
|
|
Incentive fees payable under our investment advisory agreement |
— |
%(5) |
|
|
Interest payments on borrowed funds |
2.73 |
%(6) |
|
|
Other expenses (includes OXSQ’s consolidated subsidiary) |
1.46 |
%(7) |
|
|
Total annual expenses |
6.41 |
%(8) |
Example
The following example demonstrates the projected dollar amount of total cumulative expenses that would be incurred over various periods with respect to a hypothetical investment in our common stock, assuming (1) a 2.00% sales load (underwriting discounts and commissions) and offering expenses totaling 0.37%, (2) total net estimated annual expenses of 6.41% of average net assets attributable to our common stock as set forth in the table above and (3) a 5% annual return.
|
1 Year |
3 Years |
5 Years |
10 Years |
|||||||||
|
You would pay the following expenses on a $1,000 investment, assuming a 5% annual return |
$ |
86 |
$ |
207 |
$ |
326 |
$ |
607 |
||||
The example and the expenses in the tables above should not be considered a representation of our future expenses, and actual expenses may be greater or less than those shown. Moreover, while the example assumes, as required by the SEC, a 5.0% annual return, our performance will vary and may result in a return greater or less than 5.0%. The incentive fee under the Investment Advisory Agreement, which, assuming a 5.0% annual return, would either not be payable or have a de minimis effect, is nonetheless included in the example for illustrative purposes based upon the estimated annual expenses relating thereto as set forth above. If we achieve sufficient returns on our investments to trigger an incentive fee of a material amount, our expenses, and returns to our investors, would be higher. In addition, while the example assumes reinvestment of all distributions at net asset value, participants in our distribution reinvestment plan may receive shares valued at the market price in effect at that time. This price may be at, above or below net asset value. See “Distribution Reinvestment Plan” for additional information regarding our distribution reinvestment plan.
____________
(1) If applicable, the prospectus or prospectus supplement relating to an offering of our securities will disclose the applicable sales load and the “Example” will be updated accordingly.
(2) If applicable, the prospectus or prospectus supplement relating to an offering of our securities will disclose the applicable offering expenses and total stockholder transaction expenses as a percentage of the offering price.
(3) The expenses of the distribution reinvestment plan are included in “other expenses.” The plan administrator’s fees will be paid by us. We will not charge any brokerage charges or other charges to stockholders who participate in the plan. However, your own broker may impose brokerage charges in connection with your participation in the plan.
(4) Assumes gross assets (which equals the total assets on our Consolidated Statements of Assets and Liabilities adjusted as described in this footnote) of $407.7 million and $106.9 million of leverage (including $64.4 million in aggregate principal of our 6.50% Unsecured Notes and $44.8 million in aggregate principal of our 6.25% Unsecured Notes, in each case, as of December 31, 2020 and less any respective amortization of deferred issuance costs), and assumes net assets of $275.4 million (which has been adjusted to reflect the issuance of an additional $50.0 million of common stock). The above calculation presents our base management fee as a percentage of our net assets. Our base management fee under the Investment Advisory Agreement, however, is based on our gross assets, which is defined as all the assets of Oxford
62
Square Capital Corp., including those acquired using borrowings for investment purposes. As a result, to the extent we use additional leverage, it would have the effect of increasing our base management fee as a percentage of our net assets. See “Investment Advisory Agreement” in this prospectus for additional information.
(5) Assumes no annual incentive fees earned by Oxford Square Management. Oxford Square Management did not earn incentive fees during the year ended December 31, 2020 due to the Total Return Requirement described under Item 1. Business — Investment Advisory Agreement — Advisory Fee in this Annual Report on Form 10-K. In subsequent periods, incentive fees may be earned by Oxford Square Management if, and to the extent that, we earn greater interest income through our investments in portfolio companies and realize additional gains upon the sale of warrants or other equity investments in such companies. For a detailed discussion of the calculation of the incentive fees, see Item 1 — Business — Investment Advisory Agreement — Advisory Fee in this Annual Report on Form 10-K.
(6) Assumes that we have $109.2 million of outstanding principal borrowings as of December 31, 2020. The calculation also assumes an effective interest rate of 6.99% (including amortization of deferred issuance costs) on the approximately $64.4 million of 6.50% Unsecured Notes outstanding as of December 31, 2020 and an effective interest rate of 6.75% (including amortization of deferred issuance costs) on the approximately $44.8 million of 6.25% Unsecured Notes outstanding as of December 31, 2020. This table includes all of the commitment fees, interest expense and amortized financing costs of the 6.50% Unsecured Notes and the 6.25% Unsecured Notes, as well as the fees and expenses of issuing and servicing any other borrowings or leverage that the Company expects to incur during the 12 months following effectiveness of the registration statement of which the prospectus forms a part. We may issue preferred stock, which may be considered a form of leverage, pursuant to the registration statement of which the prospectus forms a part, although we have no current plans to do so during the 12 months following effectiveness of such registration statement.
(7) “Other expenses” ($4.0 million) are based on the actual expenses for the year ended December 31, 2020, and adjusted for any new and non-recurring expenses, such as the offering costs on an assumed issuance of an additional $50.0 million of common stock. These expenses include certain expenses allocated to the Company under the Investment Advisory Agreement, such as travel expenses incurred in connection with the investigation and monitoring of our investments. In the event of a debt restructuring or extinguishment, we may incur a loss comprised of deferred financing costs and note discount which may cause actual expenses to exceed those amounts projected in the table.
(8) “Total annual expenses” is presented as a percentage of net assets attributable to common stockholders, because the holders of shares of our common stock (and not the holders of our debt securities or preferred stock, if any) bear all of our fees and expenses, including the fees and expenses of any wholly-owned consolidated subsidiary, all of which are included in this fee table presentation. The indirect expenses associated with the Company’s CLO equity investments are not included in the fee table presentation, but if such expenses were included in the fee table presentation then OXSQ’s total annual expenses would have been 16.54%.
63
Item 6. Selected Financial and Other Data
The following selected financial data for the years ended December 31, 2020, 2019, 2018, 2017, and 2016 is derived from our consolidated financial statements, which have been audited by PricewaterhouseCoopers LLP, our independent registered public accounting firm. Other data included below is unaudited. The data should be read in conjunction with our consolidated financial statements and related notes thereto and “Management’s Discussion and Analysis of Financial Condition and Results of Operations” included elsewhere in this report.
|
($ in millions, except share data) |
Year Ended |
Year Ended |
Year Ended |
Year Ended |
Year Ended |
|||||||||||||||
|
Total Investment Income |
$ |
35.9 |
|
$ |
62.7 |
|
$ |
56.3 |
|
$ |
61.4 |
|
$ |
69.3 |
|
|||||
|
Total Expenses |
$ |
16.2 |
|
$ |
24.2 |
|
$ |
22.8 |
|
$ |
30.7 |
|
$ |
42.5 |
|
|||||
|
Net Investment Income |
$ |
19.7 |
|
$ |
38.5 |
|
$ |
33.5 |
|
$ |
30.7 |
|
$ |
26.8 |
|
|||||
|
Net Increase (Decrease) in Net Assets Resulting from Operations |
$ |
1.7 |
|
$ |
(32.8 |
) |
$ |
(9.2 |
) |
$ |
43.6 |
|
$ |
110.4 |
|
|||||
|
Per Share Data: |
|
|
|
|
|
|
|
|
|
|
||||||||||
|
Net Increase in Net Assets Resulting from Net Investment Income per common share (Basic and Diluted)(1) |
$ |
0.40 |
|
$ |
0.81 |
|
$ |
0.67 |
|
$ |
0.60 |
|
$ |
0.52 |
|
|||||
|
Net Increase (Decrease) in Net Assets Resulting from Operations per common share (Basic) |
$ |
0.03 |
|
$ |
(0.69 |
) |
$ |
(0.19 |
) |
$ |
0.85 |
|
$ |
2.13 |
|
|||||
|
Net Increase (Decrease) in Net Assets Resulting from Operations per common share (Diluted)(1) |
$ |
0.03 |
|
$ |
(0.69 |
) |
$ |
(0.19 |
) |
$ |
0.83 |
|
$ |
1.90 |
|
|||||
|
Distributions Declared per Share |
$ |
0.61 |
|
$ |
0.80 |
|
$ |
0.80 |
|
$ |
0.80 |
|
$ |
1.16 |
|
|||||
|
Balance Sheet Data: |
|
|
|
|
|
|
|
|
|
|
||||||||||
|
Total Assets |
$ |
357.7 |
|
$ |
385.3 |
|
$ |
467.1 |
|
$ |
454.1 |
|
$ |
612.5 |
|
|||||
|
Total Long Term Debt |
$ |
106.9 |
|
$ |
134.4 |
|
$ |
148.2 |
|
$ |
62.3 |
|
$ |
220.0 |
|
|||||
|
Total Net Assets |
$ |
225.4 |
|
$ |
248.0 |
|
$ |
314.7 |
|
$ |
388.4 |
|
$ |
386.0 |
|
|||||
|
Other Data: |
|
|
|
|
|
|
|
|
|
|
||||||||||
|
Number of Portfolio Companies at Period End |
|
44 |
|
|
48 |
|
|
50 |
|
|
51 |
|
|
60 |
|
|||||
|
Purchases of Securities |
$ |
93.8 |
|
$ |
54.8 |
|
$ |
244.6 |
|
$ |
208.8 |
|
$ |
171.6 |
|
|||||
|
Debt Repayments |
$ |
80.4 |
|
$ |
43.9 |
|
$ |
131.5 |
|
$ |
189.2 |
|
$ |
115.2 |
|
|||||
|
Proceeds from Sales of Securities |
$ |
54.2 |
|
$ |
15.9 |
|
$ |
25.9 |
|
$ |
171.4 |
|
$ |
176.8 |
|
|||||
|
Reductions to CLO Equity |
$ |
13.0 |
(5) |
$ |
12.8 |
(6) |
$ |
18.8 |
(7) |
$ |
37.1 |
(8) |
$ |
34.2 |
(9) |
|||||
|
Total Return Based on Market |
|
(31.75 |
)% |
|
(4.14 |
)% |
|
26.95 |
% |
|
(2.01 |
)% |
|
33.29 |
% |
|||||
|
Total Return Based on Net Asset Value(3) |
|
0.82 |
% |
|
(10.26 |
)% |
|
(1.99 |
)% |
|
11.33 |
% |
|
35.31 |
% |
|||||
|
Weighted Average Yield on Debt Investments at Period End(4) |
|
8.0 |
% |
|
9.1 |
% |
|
9.7 |
% |
|
9.7 |
% |
|
8.3 |
% |
|||||
____________
(1) Due to the anti-dilutive effect on the computation of net increase in net assets resulting from net investment income (diluted) per share for the years ended December 31, 2017, and 2016, the adjustments for interest and deferred issuance costs on the 7.50% Senior Convertible Notes due 2017 (the “Convertible Notes”) and the related impact on the Base Fees and Net Investment Income Incentive Fees, as well as weighted average common shares outstanding adjustments for the dilutive effect of the Convertible Notes, were excluded from the respective period’s diluted earnings per share computation.
(2) Total return based on market value equals the increase or decrease of ending market value over beginning market value, plus distributions, divided by the beginning market value per share, assuming distribution reinvestment at prices obtained under our distribution reinvestment plan, excluding any discounts.
(3) Total return based on net asset value equals the increase or decrease of ending net asset value over beginning net asset value, plus distributions, divided by the beginning net asset value.
64
(4) Weighted average yield calculation includes the impact of any loans on non-accrual status as of the year end.
(5) Reduction to cost value on our CLO equity investments represents the difference between distributions received, or entitled to be received, of approximately $28.4 million and the effective yield interest income recognized on our CLO equity subordinated notes and the amortized cost adjusted income on our CLO equity fee notes of approximately $15.4 million.
(6) Reduction to cost value on our CLO equity investments represents the difference between distributions received, or entitled to be received, of approximately $38.0 million and the effective yield interest income of approximately $25.2 million.
(7) Reduction to cost value on our CLO equity investments represents the difference between distributions received, or entitled to be received, of approximately $46.6 million and the effective yield interest income of approximately $27.8 million.
(8) Reduction to cost value on our CLO equity investments represents the difference between distributions received, or entitled to be received, of approximately $70.4 million and the effective yield interest income of approximately $33.3 million.
(9) Reduction to cost value on our CLO equity investments represents the difference between distributions received, or entitled to be received, of approximately $66.7 million and the effective yield interest income of approximately $32.5 million.
Item 7. Management’s Discussion and Analysis of Financial Condition and Results of Operations
CAUTIONARY STATEMENT REGARDING FORWARD-LOOKING STATEMENTS
This Annual Report on Form 10-K contains forward-looking statements that involve substantial risks and uncertainties. These forward-looking statements are not historical facts, but rather are based on current expectations, estimates and projections about OXSQ, our current and prospective portfolio investments, our industry, our beliefs, and our assumptions. Words such as “anticipates,” “expects,” “intends,” “plans,” “will,” “may,” “continue,” “believes,” “seeks,” “estimates,” “would,” “could,” “should,” “targets,” “projects,” and variations of these words and similar expressions are intended to identify forward-looking statements. The forward-looking statements contained in this Annual Report on Form 10-K involve risks and uncertainties, including statements as to:
• our future operating results, including our ability to achieve objectives as a result of the current COVID-19 pandemic;
• our business prospects and the prospects of our portfolio companies;
• the impact of investments that we expect to make;
• our contractual arrangements and relationships with third parties;
• the dependence of our future success on the general economy and its impact on the industries in which we invest and the impact of the COVID-19 pandemic thereon;
• the ability of our portfolio companies and CLO investments to achieve their objectives, including as a result of the COVID-19 pandemic;
• the valuation of our investments in portfolio companies and CLOs, particularly those having no liquid trading market, and the impact of the COVID-19 pandemic thereon;
• market conditions and our ability to access alternative debt markets and additional debt and equity capital, and the impact of the COVID-19 pandemic thereon;
• our expected financings and investments;
• the adequacy of our cash resources and working capital;
• the timing of cash flows, if any, from the operations of our portfolio companies and CLO investments and the impact of the COVID-19 pandemic thereon; and
• the ability of our investment adviser to locate suitable investments for us and monitor and administer our investments and the impact of the COVID-19 pandemic thereon.
These statements are not guarantees of future performance and are subject to risks, uncertainties, and other factors, some of which are beyond our control and difficult to predict and could cause actual results to differ materially from those expressed or forecasted in the forward-looking statements, including without limitation:
• an economic downturn, including as a result of the COVID-19 pandemic, could impair our portfolio companies’ and CLO investments’ ability to continue to operate, which could lead to the loss of some or all of our investments in such portfolio companies and CLO investments;
• a contraction of available credit and/or an inability to access the equity markets, including as a result of the COVID-19 pandemic, could impair our lending and investment activities;
65
• interest rate volatility could adversely affect our results, particularly because we use leverage as part of our investment strategy;
• currency fluctuations could adversely affect the results of our investments in foreign companies, particularly to the extent that we receive payments denominated in foreign currency rather than U.S. dollars; and
• the risks, uncertainties and other factors we identify in Item 1A. — Risk Factors and elsewhere in this Annual Report on Form 10-K and in our filings with the SEC.
Although we believe that the assumptions on which these forward-looking statements are based are reasonable, any of those assumptions could prove to be inaccurate, and as a result, the forward-looking statements based on those assumptions also could be inaccurate. Important assumptions include our ability to originate new loans and investments, certain margins and levels of profitability and the availability of additional capital. In light of these and other uncertainties, the inclusion of a projection or forward-looking statement in this annual report on Form 10-K should not be regarded as a representation by us that our plans and objectives will be achieved. These risks and uncertainties include those described or identified in Item 1A. — Risk Factors and elsewhere in this annual report on Form 10-K. You should not place undue reliance on these forward-looking statements, which apply only as of the date of this annual report on Form 10-K.
The following analysis of our financial condition and results of operations should be read in conjunction with our consolidated financial statements and the related notes thereto contained elsewhere in this Form 10-K.
OVERVIEW
Our investment objective is to maximize our portfolio’s total return. Our primary current focus is to seek an attractive risk-adjusted total return by investing primarily in corporate debt securities and in collateralized loan obligation (“CLO”) structured finance investments that own corporate debt securities. CLO investments may also include warehouse facilities, which are early-stage CLO vehicles intended to aggregate loans that may be used to form the basis of a traditional CLO vehicle. We operate as a closed-end, non-diversified management investment company and have elected to be regulated as a BDC under the 1940 Act. We have elected to be treated for tax purposes as a RIC, under the Code, beginning with our 2003 taxable year.
Our investment activities are managed by Oxford Square Management, LLC (“Oxford Square Management”), a registered investment adviser under the Investment Advisers Act of 1940, as amended. Oxford Square Management is owned by Oxford Funds, LLC (“Oxford Funds”), its managing member, and Charles M. Royce, a member of our Board who holds a minority, non-controlling interest in Oxford Square Management. Jonathan H. Cohen, our Chief Executive Officer, and Saul B. Rosenthal, our President and Chief Operating Officer, are the controlling members of Oxford Funds. Under an investment advisory agreement (the “Investment Advisory Agreement”), we have agreed to pay Oxford Square Management an annual Base Fee calculated on gross assets, and an incentive fee based upon our performance. Under an amended and restated administration agreement (the “Administration Agreement”), we have agreed to pay or reimburse Oxford Funds, as administrator, for certain expenses incurred in operating OXSQ on our behalf. Our executive officers and directors, and the executive officers of Oxford Square Management and Oxford Funds, serve or may serve as officers and directors of entities that operate in a line of business similar to our own. Accordingly, they may have obligations to investors in those entities, the fulfillment of which might not be in the best interests of us or our stockholders.
We generally expect to invest between $5 million and $50 million in each of our portfolio companies, although this investment size may vary proportionately as the size of our capital base changes and market conditions warrant. We invest in both fixed and variable interest rate structures. We expect that our investment portfolio will be diversified among a large number of investments with few investments, if any, exceeding 5.0% of the total portfolio. As of December 31, 2020, our debt investments had stated interest rates of between 3.90% and 10.25% and maturity dates of between 22 and 87 months. In addition, our total portfolio had a weighted average yield on debt investments of approximately 8.03%.
The weighted average yield of our debt investments is not the same as a return on investment for our stockholders but, rather, relates to a portion of our investment portfolio and is calculated before the payment of all of our fees and expenses. The weighted average yield was computed using the effective interest rates as of December 31, 2020, including accretion of original issue discount (“OID”) and excluding any debt investments on non-accrual status. There can be no assurance that the weighted average yield will remain at its current level.
We have historically borrowed funds to make investments and may continue to borrow funds to make investments. As a result, we are exposed to the risks of leverage, which may be considered a speculative investment technique. Borrowings, also known as leverage, magnify the potential for gain and loss on amounts invested and
66
therefore increase the risks associated with investing in our securities. In addition, the costs associated with our borrowings, including any increase in the Base Fee and incentive fees payable to Oxford Square Management, will be borne by our common stockholders.
In addition, as a BDC under the 1940 Act, we are required to make available significant managerial assistance, for which we may receive fees, to our portfolio companies. These fees would be generally non-recurring, however in some instances they may have a recurring component. We have received no fee income for managerial assistance to date.
Prior to making an investment, we may enter into a non-binding term sheet with the potential portfolio company. These term sheets are generally subject to a number of conditions, including but not limited to the satisfactory completion of our due diligence investigations of the company’s business and legal documentation for the loan.
To the extent possible, we will generally seek to invest in loans that are collateralized by a security interest in the borrower’s assets or guaranteed by a principal to the transaction. Interest payments, if not deferred, are normally payable quarterly with most debt investments having scheduled principal payments on a monthly or quarterly basis. When we receive a warrant to purchase stock in a portfolio company, the warrant will typically have a nominal strike price, and will entitle us to purchase a modest percentage of the borrower’s stock.
PORTFOLIO COMPOSITION AND INVESTMENT ACTIVITY
The total fair value of our investment portfolio was approximately $294.7 million and $364.8 million as of December 31, 2020 and December 31, 2019, respectively. The decrease in the value of investments during the year ended December 31, 2020 was due primarily to a net change in unrealized depreciation on our investment portfolio of approximately $9.8 million (which incorporates reductions to CLO equity cost value of $13.0 million), debt repayments and sales of securities totaling approximately $134.6 million, partially offset by purchases of investments of approximately $93.8 million. Refer to the table below, which reconciles the investment portfolio for the year ended December 31, 2020 and the year ended December 31, 2019.
A reconciliation of the investment portfolio for the years ended December 31, 2020 and 2019 follows:
|
($ in millions) |
December 31, |
December 31, |
||||||
|
Beginning investment portfolio |
$ |
364.8 |
|
$ |
445.0 |
|
||
|
Portfolio investments acquired |
|
93.8 |
|
|
54.8 |
|
||
|
Debt repayments |
|
(80.4 |
) |
|
(43.9 |
) |
||
|
Sales of securities |
|
(54.2 |
) |
|
(15.9 |
) |
||
|
Reductions to CLO equity cost value(1) |
|
(13.0 |
) |
|
(12.8 |
) |
||
|
Non-cash interest and dividend income due to PIK |
|
0.3 |
|
|
8.0 |
|
||
|
Accretion of discounts on investments |
|
1.4 |
|
|
0.8 |
|
||
|
Net change in unrealized appreciation/depreciation on investments |
|
(9.8 |
) |
|
(69.5 |
) |
||
|
Net realized losses on investments |
|
(8.2 |
) |
|
(1.7 |
) |
||
|
Ending investment portfolio |
$ |
294.7 |
|
$ |
364.8 |
|
||
____________
(1) For the year ended December 31, 2020, the reduction to cost value on our CLO equity investments of approximately $13.0 million represented the difference between distributions received, or entitled to be received, on our investments held in CLO equity subordinated notes and fee notes, for the year ended December 31, 2020, of approximately $28.4 million and the effective yield interest income recognized on our CLO equity subordinated notes and the amortized cost adjusted income on our CLO equity fee notes of approximately $15.4 million. For the year ended December 31, 2019, reduction to cost value on our CLO equity investments represented the difference between distributions received, or entitled to be received, for the year ended December 31, 2019, of approximately $38.0 million and the effective yield interest income of approximately $25.2 million.
During the year ended December 31, 2020, we purchased approximately $93.8 million in portfolio investments, including additional investments of approximately $22.1 million in existing portfolio companies and approximately $71.8 million in new portfolio companies. During the year ended December 31, 2019, we purchased approximately $54.8 million in portfolio investments, including additional investments of approximately $14.3 million in existing portfolio companies and approximately $40.4 million in new portfolio companies.
In certain instances, we receive payments based on scheduled amortization of the outstanding balances. In addition, we receive repayments of some of our debt investments prior to their scheduled maturity date. The frequency or volume of these repayments may fluctuate significantly from period to period.
67
For the years ended December 31, 2020 and December 31, 2019, we had loan principal repayments of approximately $80.4 million and approximately $43.9 million, respectively. The repayments during the year ended December 31, 2020 were as follows ($ in millions):
|
Portfolio Company |
2020 |
||
|
ECI Software Solutions, Inc. |
$ |
17.8 |
|
|
Shift4 Payments, LLC (f/k/a Lighthouse Network, LLC) |
|
16.4 |
|
|
Healthport Technologies, LLC |
|
15.7 |
|
|
Capstone Logistics Acquisition, Inc. |
|
10.9 |
|
|
AmeriLife Group, LLC |
|
9.9 |
|
|
Edmentum, Inc. (f/k/a Plato, Inc.) |
|
6.3 |
|
|
Net all other |
|
3.4 |
|
|
Total repayments |
$ |
80.4 |
|
Portfolio activity also reflects sales of securities in the amounts of approximately $54.2 million and approximately $15.9 million for the years ended December 31, 2020 and 2019, respectively. The sales during the year ended December 31, 2020 were as follows ($ in millions):
|
Portfolio Company |
2020 |
||
|
THL Credit Wind River 2012-1 CLO, Ltd. |
$ |
9.8 |
|
|
Quest Software, Inc. |
|
7.4 |
|
|
OMNIA Partners |
|
5.9 |
|
|
Ivy Hill Middle Market Credit Fund VII, Ltd. |
|
5.4 |
|
|
AMMC CLO XII, Ltd. |
|
4.7 |
|
|
CLEAResult Consulting, Inc. |
|
4.0 |
|
|
Net all other |
|
17.0 |
|
|
Total sales |
$ |
54.2 |
|
As of December 31, 2020, we had investments in debt securities of, or loans to, 16 portfolio companies, with a fair value of approximately $172.2 million, and CLO equity investments of approximately $122.5 million. Interest income on our debt investments included approximately $0.3 million in PIK interest, which, as described in “— Overview” above, is added to the carrying value of our investments, reduced by repayments of principal. As of December 31, 2019, we had investments in debt securities of, or loans to, 21 portfolio companies, with a fair value of approximately $241.4 million, and equity investments of approximately $123.4 million. Our debt and preferred stock investments included approximately $8.0 million in PIK interest/dividends, which, as described in “— Overview” above, is added to the carrying value of our investments, reduced by repayments of principal.
The following table indicates the quarterly portfolio investment activity for the years ended December 31, 2020 and 2019:
|
($ in millions) |
Purchases of |
Debt |
Sales of |
Reductions to |
||||||||
|
Quarter ended |
|
|
|
|
||||||||
|
December 31, 2020 |
$ |
46.9 |
$ |
51.1 |
$ |
25.4 |
$ |
6.4 |
||||
|
September 30, 2020 |
|
18.3 |
|
0.6 |
|
8.3 |
|
2.0 |
||||
|
June 30, 2020 |
|
21.3 |
|
16.7 |
|
9.5 |
|
2.6 |
||||
|
March 31, 2020 |
|
7.4 |
|
12.0 |
|
11.1 |
|
2.0 |
||||
|
Total(2) |
$ |
93.8 |
$ |
80.4 |
$ |
54.2 |
$ |
13.0 |
||||
|
|
|
|
|
|||||||||
|
December 31, 2019 |
$ |
3.9 |
$ |
19.7 |
$ |
— |
$ |
5.5 |
||||
|
September 30, 2019 |
|
— |
|
0.2 |
|
4.9 |
|
3.2 |
||||
|
June 30, 2019 |
|
46.4 |
|
23.5 |
|
7.4 |
|
2.6 |
||||
|
March 31, 2019 |
|
4.4 |
|
0.4 |
|
3.6 |
|
1.4 |
||||
|
Total(2) |
$ |
54.8 |
$ |
43.9 |
$ |
15.9 |
$ |
12.8 |
||||
____________
(1) Represents reductions to CLO equity cost value (representing distributions received, or entitled to be received, in excess of effective yield interest income and amortized cost adjusted CLO fee note income).
(2) Totals may not sum due to rounding.
68
The following table shows the fair value of our portfolio of investments by asset class as of December 31, 2020 and 2019:
|
2020 |
2019 |
|||||||||||
|
($ in millions) |
Investments at |
Percentage of |
Investments at |
Percentage of |
||||||||
|
Senior Secured Notes |
$ |
172.2 |
58.4 |
% |
$ |
240.5 |
65.9 |
% |
||||
|
CLO Debt |
|
— |
0.0 |
% |
|
0.8 |
0.2 |
% |
||||
|
CLO Equity |
|
122.5 |
41.6 |
% |
|
120.6 |
33.1 |
% |
||||
|
Equity and Other Investments |
|
— |
0.0 |
% |
|
2.8 |
0.8 |
% |
||||
|
Total(1) |
$ |
294.7 |
100.0 |
% |
$ |
364.8 |
100.0 |
% |
||||
____________
(1) Totals may not sum due to rounding.
Qualifying assets must represent at least 70% of the Company’s total assets at the time of acquisition of any additional non-qualifying assets. As of December 31, 2020, we held qualifying assets that represented 63.3% of the total assets. No additional non-qualifying assets were acquired during the periods, if any, when qualifying assets were less than 70% of the total assets.
The following table shows our portfolio of investments by industry at fair value, in millions, as of December 31, 2020 and 2019:
|
December 31, 2020 |
December 31, 2019 |
|||||||||||||
|
Investments at |
Percentage of |
Investments at |
Percentage of |
|||||||||||
|
|
($ in millions |
) |
|
|
($ in millions |
) |
|
|||||||
|
Structured finance(1) |
$ |
122.5 |
|
41.6 |
% |
$ |
121.4 |
|
33.3 |
% |
||||
|
Business services |
|
60.4 |
|
20.5 |
% |
|
59.3 |
|
16.3 |
% |
||||
|
Healthcare |
|
41.7 |
|
14.1 |
% |
|
59.6 |
|
16.3 |
% |
||||
|
Education |
|
14.6 |
|
5.0 |
% |
|
5.6 |
|
1.5 |
% |
||||
|
Software |
|
13.3 |
|
4.5 |
% |
|
40.2 |
|
11.0 |
% |
||||
|
Telecommunication services |
|
11.8 |
|
4.0 |
% |
|
14.5 |
|
4.0 |
% |
||||
|
Diversified insurance |
|
10.8 |
|
3.7 |
% |
|
9.9 |
|
2.7 |
% |
||||
|
Utilities |
|
7.2 |
|
2.4 |
% |
|
12.2 |
|
3.3 |
% |
||||
|
Plastics Manufacturing |
|
7.0 |
|
2.4 |
% |
|
— |
|
— |
% |
||||
|
Aerospace and defense |
|
5.4 |
|
1.8 |
% |
|
5.4 |
|
1.5 |
% |
||||
|
Financial intermediaries |
|
— |
|
— |
% |
|
21.2 |
|
5.8 |
% |
||||
|
Logistics |
|
— |
|
— |
% |
|
12.7 |
|
3.5 |
% |
||||
|
IT consulting |
|
— |
|
— |
% |
|
2.8 |
|
0.8 |
% |
||||
|
Total |
$ |
294.7 |
|
100.0 |
% |
$ |
364.8 |
|
100.0 |
% |
||||
____________
(1) Reflects our debt and equity investments in CLOs as of December 31, 2020 and December 31, 2019, respectively.
69
The following tables present the top ten industries (based upon Moody’s industry classifications) of the aggregate holdings of the CLOs included in our portfolio, based on par value, as of December 31, 2020 and December 31, 2019.
|
Top Ten Industries |
December 31, 2020 |
||
|
Banking, Finance, Insurance & Real Estate |
9.5 |
% |
|
|
Healthcare & Pharmaceuticals |
9.4 |
% |
|
|
High Tech Industries |
8.7 |
% |
|
|
Business Services |
8.5 |
% |
|
|
Media: Broadcasting & Subscription |
5.8 |
% |
|
|
Hotels, Gaming & Leisure |
5.6 |
% |
|
|
Telecommunications |
5.0 |
% |
|
|
Chemicals, Plastics & Rubber |
4.3 |
% |
|
|
Beverage, Food & Tobacco |
3.7 |
% |
|
|
Construction & Building |
3.3 |
% |
|
|
Total |
63.8 |
% |
|
|
Top Ten Industries |
December 31, 2019 |
||
|
Healthcare & Pharmaceuticals |
9.8 |
% |
|
|
Banking, Finance, Insurance & Real Estate |
8.9 |
% |
|
|
High Tech Industries |
8.4 |
% |
|
|
Business Services |
7.9 |
% |
|
|
Hotel, Gaming, and Leisure |
5.2 |
% |
|
|
Telecommunications |
4.9 |
% |
|
|
Media: Broadcasting and Subscription |
4.4 |
% |
|
|
Chemicals, Plastics, and Rubber |
4.3 |
% |
|
|
Beverage, Food & Tobacco |
4.1 |
% |
|
|
Retail |
3.9 |
% |
|
|
Total |
61.8 |
% |
|
70
PORTFOLIO GRADING
We have adopted a credit grading system to monitor the quality of our debt investment portfolio. Equity securities are not graded. As of December 31, 2020 and 2019 our portfolio had a weighted average grade of 2.1 and 2.2, respectively, based upon the fair value of the debt investments in the portfolio.
At December 31, 2020 and 2019, our debt investment portfolio was graded as follows:
|
($ in millions) |
December 31, 2020 |
|||||||||||||
|
Grade |
Summary Description |
Principal |
Percentage of |
Portfolio at |
Percentage of |
|||||||||
|
1 |
Company is ahead of expectations and/or outperforming financial covenant requirements of the specific tranche and such trend is expected to continue. |
$ |
— |
— |
% |
$ |
— |
— |
% |
|||||
|
2 |
Full repayment of the outstanding amount of OXSQ’s cost basis and interest is expected for the specific tranche. |
|
167.9 |
80.5 |
% |
|
156.1 |
90.7 |
% |
|||||
|
3 |
Closer monitoring is required. Full repayment of the outstanding amount of OXSQ’s cost basis and interest is expected for the specific tranche. |
|
14.3 |
6.8 |
% |
|
11.8 |
6.9 |
% |
|||||
|
4 |
A loss of interest income has occurred or is expected to occur and, in most cases, the investment is placed on non-accrual status. Full repayment of the outstanding amount of OXSQ’s cost basis is expected for the specific tranche. |
|
— |
0.0 |
% |
|
— |
0.0 |
% |
|||||
|
5 |
Full repayment of the outstanding amount of OXSQ’s cost basis is not expected for the specific tranche and the investment is placed on non-accrual status. |
|
26.4 |
12.7 |
% |
|
4.2 |
2.5 |
% |
|||||
|
Total(1) |
$ |
208.5 |
100.0 |
% |
$ |
172.2 |
100.0 |
% |
||||||
____________
(1) Totals may not sum due to rounding.
|
($ in millions) |
December 31, 2019 |
|||||||||||||
|
Grade |
Summary Description |
Principal |
Percentage of |
Portfolio at |
Percentage of |
|||||||||
|
1 |
Company is ahead of expectations and/or outperforming financial covenant requirements of the specific tranche and such trend is expected to continue. |
$ |
— |
— |
% |
$ |
— |
— |
% |
|||||
|
2 |
Full repayment of the outstanding amount of OXSQ’s cost basis and interest is expected for the specific tranche. |
|
206.6 |
75.3 |
% |
|
200.5 |
83.1 |
% |
|||||
|
3 |
Closer monitoring is required. Full repayment of the outstanding amount of OXSQ’s cost basis and interest is expected for the specific tranche. |
|
42.5 |
15.5 |
% |
|
35.1 |
14.5 |
% |
|||||
|
4 |
A loss of interest income has occurred or is expected to occur and, in most cases, the investment is placed on non-accrual status. Full repayment of the outstanding amount of OXSQ’s cost basis is expected for the specific tranche. |
|
10.2 |
3.7 |
% |
|
3.6 |
1.5 |
% |
|||||
|
5 |
Full repayment of the outstanding amount of OXSQ’s cost basis is not expected for the specific tranche and the investment is placed on non-accrual status. |
|
15.0 |
5.5 |
% |
|
2.3 |
0.9 |
% |
|||||
|
Total(1) |
$ |
274.2 |
100.0 |
% |
$ |
241.4 |
100.0 |
% |
||||||
____________
(1) Totals may not sum due to rounding.
71
We expect that a portion of our investments will be in the Grades 3, 4 or 5 categories from time to time, and, as such, we will be required to work with troubled portfolio companies to improve their business and protect our investment. The number and amount of investments included in Grade 3, 4 or 5 may fluctuate from year to year.
RESULTS OF OPERATIONS
Set forth below is a comparison of our results of operations for the years ended December 31, 2020 and 2019. For information regarding results of operations for the year ended December 31, 2018, refer to Part II Item 7 in our Form 10-K for the year ended December 31, 2019, as filed with the SEC on February 26, 2020, which is incorporated by reference herein.
Investment Income
The following table sets forth the components of investment income for the years ended December 31, 2020 and 2019:
|
December 31, |
December 31, |
|||||
|
Interest Income |
|
|
||||
|
Stated interest income |
$ |
17,374,998 |
$ |
26,701,382 |
||
|
Original issue discount and market discount income |
|
1,397,699 |
|
819,595 |
||
|
Non-cash interest income due to PIK |
|
271,034 |
|
271,642 |
||
|
Discount income derived from unscheduled remittances at par |
|
1,208,324 |
|
207,664 |
||
|
Total interest income |
|
20,252,055 |
|
28,000,283 |
||
|
Income from securitization vehicles and investments |
|
15,014,000 |
|
25,244,866 |
||
|
Non-cash dividend income due to PIK |
|
— |
|
7,710,805 |
||
|
Other income |
|
|
||||
|
Fee letters |
|
369,231 |
|
884,493 |
||
|
Loan prepayment and bond call fees |
|
200,000 |
|
315,000 |
||
|
All other fees |
|
107,219 |
|
494,941 |
||
|
Total other income |
|
676,450 |
|
1,694,434 |
||
|
Total investment income |
$ |
35,942,505 |
$ |
62,650,388 |
||
The decrease in total investment income for the year ended December 31, 2020 as compared to the year ended December 31, 2019 was largely due to a reduction of stated interest income (approximately $9.3 million) resulting primarily from a smaller portfolio due to loan sale activity as we sold certain assets to fund the repayment of the Credit Facility with Citibank, N.A. during the quarter ended March 2020, as well as, lower weighted average yield on our debt investment portfolio. Additionally, income from securitization vehicles declined (approximately $10.2 million) in 2020 largely the result of volatility in the corporate loan market and a lower cost basis in the CLO equity portfolio. Non-cash dividend income due to PIK declined in 2020 by approximately $7.7 million compared to 2019 due mainly to the cumulative preferred stock dividend income recognized during the quarter ended June 30, 2019.
The total principal outstanding on income producing debt investments as of December 31, 2020 and December 31, 2019 was approximately $182.2 million and $249.0 million, respectively. As of December 31, 2020, our debt investments had stated interest rates of between 3.90% and 10.25% and maturity dates of between 22 and 87 months. As of December 31, 2019, our debt investments had stated interest rates of between 5.19% and 12.56% and maturity dates of between 17 and 139 months. In addition, our total portfolio had a weighted average yield on debt investments of approximately 8.0% as of December 31, 2020, compared to a weighted average yield on debt investments of 9.1% as of December 31, 2019.
72
Operating Expenses
The following table sets forth the components of operating expenses for the years ended December 31, 2020 and 2019:
|
December 31, |
December 31, |
|||||
|
Interest expense |
$ |
7,878,906 |
$ |
9,901,426 |
||
|
Base Fee |
|
4,525,034 |
|
6,704,467 |
||
|
Professional fees |
|
1,545,279 |
|
1,454,942 |
||
|
Compensation expense |
|
708,350 |
|
832,256 |
||
|
Director’s fees |
|
441,500 |
|
417,500 |
||
|
Insurance |
|
330,746 |
|
281,146 |
||
|
Transfer agent and custodian fees |
|
206,686 |
|
239,323 |
||
|
General and administrative |
|
591,512 |
|
829,476 |
||
|
Net Investment Income Incentive Fees |
|
— |
|
3,511,493 |
||
|
Total operating expenses |
$ |
16,228,013 |
$ |
24,172,029 |
||
Total operating expenses for the year ended December 31, 2020 decreased by approximately $7.9 million compared to the year ended December 31, 2019. The decrease in 2020 is attributable primarily to lower interest expense, Base Fee, and Net Investment Income Incentive Fee.
Interest expense decreased by approximately $2.0 million in 2020 compared to 2019. The decrease in 2020 was a result of the repayment of the Credit Facility. The aggregate accrued interest which remained payable as of December 31, 2020 and 2019 was approximately $0.5 million and $0.6 million, respectively.
The calculation of the Base Fee decreased approximately $2.2 million in 2020 compared to the prior year due to lower average adjusted gross assets in 2020. The Base Fee which remained payable to Oxford Square Management as of December 31, 2020 and 2019 was approximately $1.2 million and $1.5 million, respectively.
Professional fees, consisting of legal, valuation, compliance, audit and tax fees increased by approximately $0.1 million due to increased legal fees incurred during the year ended December 31, 2020.
Compensation expense reflects the allocation of compensation expenses for the services of our Chief Financial Officer, accounting personnel, and other administrative support staff. The decrease in 2020 was largely the result of staffing changes during these periods. As of December 31, 2020 and 2019, no compensation expenses remained payable for each respective date.
General and administrative expenses consist primarily of listing fees, office supplies, facilities costs and other miscellaneous expenses, decreased by approximately $0.2 million in 2020. Office supplies, facilities costs and other expenses are allocated to us under the terms of the Administration Agreement.
The calculation of the Net Investment Income Incentive Fee decreased by approximately $3.5 million in 2020 compared to 2019. The decrease in 2020 was a result of the Net Investment Income Incentive Fee being reduced as the result of the Total Return Requirement. The Net Investment Income Incentive Fee is calculated and payable quarterly in arrears based on the amount by which (x) the “Pre-Incentive Fee Net Investment Income” for the immediately preceding calendar quarter exceeds (y) the “Preferred Return Amount” for the calendar quarter. For this purpose, “Pre-Incentive Fee Net Investment Income” means interest income, dividend income and any other income accrued during the calendar quarter minus our operating expenses for the quarter (including the Base Fee, expenses payable under the Administration Agreement with Oxford Funds, and any interest expense and dividends paid on any issued and outstanding preferred stock, but excluding the incentive fee). Refer to “Note 7. Related Party Transactions” in the notes to our consolidated financial statements.
The expense attributable to the capital gains incentive fee, as reported under GAAP, is calculated as if the Company’s entire portfolio had been liquidated at period end, and therefore is calculated on the basis of net realized and unrealized gains and losses at the end of each period. That expense (or the reversal of such an expense) related to that hypothetical liquidation of the portfolio (and assuming no other changes in realized or unrealized gains and losses) would only become payable to our investment adviser in the event of a complete liquidation of our portfolio as of period end and the termination of the Investment Advisory Agreement on such date. For the years ended
73
December 31, 2020 and 2019, no accrual was required as a result of the impact of accumulated net unrealized depreciation and net realized losses on our portfolio.
The amount of the Capital Gains Incentive Fee which will actually be payable is determined in accordance with the terms of the Investment Advisory Agreement and is calculated as of the end of each calendar year (or upon termination of the Investment Advisory Agreement). The terms of the Investment Advisory Agreement state that the Capital Gains Incentive Fee calculation is based on net realized gains, if any, offset by gross unrealized depreciation for the calendar year. No effect is given to gross unrealized appreciation in this calculation.
Realized and Unrealized Gains/Losses on Investments
For the year ended December 31, 2020, we recognized net realized losses on investments of approximately $8.2 million, which primarily represents the losses from the sale of several CLO equity investments.
For the year ended December 31, 2020, our net change in unrealized depreciation was approximately $9.8 million, composed of approximately $11.9 million in gross unrealized appreciation, approximately $30.9 million in gross unrealized depreciation and approximately $9.2 million relating to the reversal of prior period net unrealized depreciation as investment gains and losses were realized. This includes net unrealized appreciation of approximately $13.0 million resulting from reductions to the cost value of our CLO equity investments representing the difference between distributions received, or entitled to be received, on our investments held in CLO equity subordinated notes and fee notes, of approximately $28.4 million and the effective yield interest income recognized on our CLO equity subordinated notes and the amortized cost adjusted income on our CLO equity fee notes of approximately $15.4 million.
The components of the net change in unrealized appreciation/depreciation during the year ended December 31, 2020 were as follows ($ in millions):
|
Portfolio Company |
Changes in unrealized appreciation/ (depreciation) |
|||
|
Premiere Global Services, Inc. |
$ |
3.7 |
|
|
|
AMMC CLO XII, Ltd. |
|
2.8 |
|
|
|
Ivy Hill Middle Market Credit Fund VII, Ltd. |
|
2.7 |
|
|
|
Madison Park Funding XVIII, Ltd. |
|
1.6 |
|
|
|
Telos CLO 2013-3, Ltd. |
|
(1.5 |
) |
|
|
Zais CLO 6, Ltd. |
|
(1.6 |
) |
|
|
Global Tel Link Corp. |
|
(2.7 |
) |
|
|
Unitek Global Services, Inc. |
|
(2.8 |
) |
|
|
Nassau 2019-I, Ltd. |
|
(3.1 |
) |
|
|
Telos CLO 2014-5, Ltd. |
|
(6.9 |
) |
|
|
Net all other |
|
(2.0 |
) |
|
|
Total |
$ |
(9.8 |
) |
|
For the year ended December 31, 2019, we recognized net realized losses on investments of approximately $1.7 million, which primarily represents the losses from the sale of several CLO equity investments.
For the year ended December 31, 2019, our net change in unrealized depreciation was approximately $69.5 million, composed of approximately $5.1 million in gross unrealized appreciation, approximately $77.0 million in gross unrealized depreciation and approximately $2.4 million relating to the reversal of prior period net unrealized depreciation as investment gains and losses were realized. This includes net unrealized appreciation of approximately $12.8 million as a result of reductions to the cost value of our CLO equity investments under the effective yield accounting methodology, whereby the cost value of the respective investments are reduced by the excess of actual cash received and record date distributions to be received over the calculated income using the effective yield method.
74
The components of the net change in unrealized appreciation/depreciation during the year ended December 31, 2019 were as follows ($ in millions):
|
Portfolio Company |
Changes in unrealized appreciation/ (depreciation) |
|||
|
KVK CLO 2013-2, Ltd. |
$ |
1.5 |
|
|
|
Global Tel-Link Corporation |
|
(2.0 |
) |
|
|
Telos CLO 2013-4, Ltd. |
|
(2.4 |
) |
|
|
Zais CLO 6, Ltd. |
|
(2.5 |
) |
|
|
Nassau 2019-I CLO, Ltd. |
|
(3.3 |
) |
|
|
Telos CLO 2014-5, Ltd. |
|
(6.3 |
) |
|
|
Premiere Global Services, Inc. |
|
(7.6 |
) |
|
|
Imagine! Print Solutions, LLC |
|
(11.1 |
) |
|
|
Sound Point CLO XVI, Ltd. |
|
(13.3 |
) |
|
|
Unitek Global Services, Inc. |
|
(19.4 |
) |
|
|
Net all other |
|
(3.1 |
) |
|
|
Total |
$ |
(69.5 |
) |
|
Net Increase in Net Assets Resulting from Net Investment Income
Net investment income for the year ended December 31, 2020 was approximately $19.7 million, compared to $38.5 million for the year ended December 31, 2019. The change was primary the result of lower total investment income, as discussed above. For the year ended December 31, 2020, the net increase in net assets resulting from net investment income per common share was $0.40 (basic and diluted), compared to $0.81 (basic and diluted) for the year ended December 31, 2019, based on the weighted average common shares outstanding for the respective period.
Net Increase in Net Assets Resulting from Operations
Net increase in net assets resulting from operations for the year ended December 31, 2020 was approximately $1.7 million, compared to a net decrease of $32.8 million for year ended December 31, 2019. These changes were largely due to a net change in unrealized depreciation, as discussed above. For the year ended December 31, 2020, the net increase in net assets resulting from operations per common share was $0.03 (basic and diluted), compared to a net decrease in net assets per common share of $0.69 (basic and diluted) for the year ended December 31, 2019, based on the weighted average common shares outstanding for the respective period.
LIQUIDITY AND CAPITAL RESOURCES
During the year ended December 31, 2020, cash, cash equivalents and restricted cash increased from approximately $16.5 million at the beginning of the period to approximately $59.1 million at the end of the period. Net cash provided by operating activities for the year ended December 31, 2020, consisting primarily of the items described in “— Results of Operations,” was approximately $95.1 million, largely reflecting repayments of principal of approximately $80.4 million and proceeds from the sale of investments of approximately $53.3 million, partially offset by purchases of new investments of approximately $70.7 million. During the year ended December 31, 2020, net cash used in financing activities was approximately $52.4 million, reflecting the payment of distributions of approximately $30.1 million and repayment of the Credit Facility of approximately $28.1 million, partially offset by proceeds from issuance of common stock of approximately $5.9 million.
Contractual Obligations
We have certain obligations with respect to the investment advisory and administration services we receive. Refer to “— Overview”. We incurred approximately $4.5 million for the Base Fee and approximately $1.6 million for administrative services for the year ended December 31, 2020. There were no Net Investment Income Incentive Fees incurred during the year ended December 31, 2020. Refer to “Note 7. Related Party Transactions” in the notes to our consolidated financial statements.
75
A summary of our significant contractual payment obligations is as follows as of December 31, 2020. Refer to “Note 5. Borrowings” in the notes to our consolidated financial statements.
|
Contractual obligations (in millions) |
Principal |
Payments Due by Period |
|||||||||||||
|
Less than |
1 – 3 years |
3 – 5 years |
More than |
||||||||||||
|
Long-term debt obligations: |
|
|
|
|
|
||||||||||
|
6.50% Unsecured Notes |
$ |
64.4 |
$ |
— |
$ |
— |
$ |
64.4 |
$ |
— |
|||||
|
6.25% Unsecured Notes |
|
44.8 |
|
— |
|
— |
|
— |
|
44.8 |
|||||
|
$ |
109.2 |
$ |
— |
$ |
— |
$ |
64.4 |
$ |
44.8 |
||||||
Off-Balance Sheet Arrangements
On October 18, 2019, the Company entered into a $10 million repurchase transaction facility (the “Repo Facility”) with Nomura Securities International, Inc. (“Nomura”). Pursuant to the Master Repurchase Agreement (“MRA”) and a transaction facility confirmation, the Company may sell securities to Nomura from time to time with a corresponding repurchase obligation at an agreed-upon price 30 to 60 days after the sale date (“Reverse Repo”). The Repo Facility has a funding cost of 1-month LIBOR plus 2.05% per annum for each Reverse Repo transaction and is subject to a facility fee of 0.85% per annum on the full $10 million facility amount. The Company accounts for these Reverse Repo transactions as secured financings for financial reporting purposes in accordance with GAAP. As of December 31, 2020, there was no outstanding principal, or securities sold under the Repo Facility, as the Repo Facility expired on October 18, 2020. The Company accrued approximately $69,000 in undrawn fees during the year ended December 31, 2020, which is classified as interest expense on the Statement of Operations.
Share Issuance and Repurchase Programs
On August 1, 2019, the Company entered into an Equity Distribution Agreement with Ladenburg Thalmann & Co. through which the Company may offer for sale, from time to time, up to $150.0 million of the Company’s common stock through an At-the-Market (“ATM”) offering. The Company sold a total of 1,098,277 shares of common stock pursuant to the ATM during the year ended December 31, 2020. The total amount of capital raised under the ATM during the year ended December 31, 2020 was approximately $5.8 million. The Company sold a total of 774,803 shares of common stock pursuant to the ATM during the year ended December 31, 2019. The total amount of capital raised under the ATM during the year ended December 31, 2019 was approximately $4.4 million.
Borrowings
In accordance with the 1940 Act, with certain limited exceptions, the Company is only allowed to borrow amounts such that its asset coverage, as defined in the 1940 Act, is at least 150% immediately after such borrowing. As of December 31, 2020, the Company’s asset coverage for borrowed amounts was approximately 304%.
The following are the Company’s outstanding principal amounts, carrying values and fair values of the Company’s borrowings as of December 31, 2020 and December 31, 2019. The fair value of the 6.50% Unsecured Notes and 6.25% Unsecured Notes are based upon the closing price on the last day of the period. The 6.50% Unsecured Notes and 6.25% Unsecured Notes are listed on the NASDAQ Global Select Market (trading symbol “OXSQL” and “OXSQZ”, respectively). The Credit Facility was fully repaid on March 24, 2020 and its fair value represents the par amount as of December 31, 2019.
|
As of |
||||||||||||||||||
|
December 31, 2020 |
December 31, 2019 |
|||||||||||||||||
|
($ in millions) |
Principal |
Carrying |
Fair |
Principal |
Carrying |
Fair |
||||||||||||
|
6.50% Unsecured Notes |
$ |
64.4 |
$ |
63.3 |
$ |
64.3 |
$ |
64.4 |
$ |
63.0 |
$ |
65.6 |
||||||
|
Credit Facility |
|
— |
|
— |
|
— |
|
28.1 |
|
28.1 |
|
28.1 |
||||||
|
6.25% Unsecured Notes |
|
44.8 |
|
43.5 |
|
45.1 |
|
44.8 |
|
43.3 |
|
45.6 |
||||||
|
Total(1) |
$ |
109.2 |
$ |
106.9 |
$ |
109.4 |
$ |
137.3 |
$ |
134.4 |
$ |
139.3 |
||||||
____________
(1) Totals may not sum due to rounding.
76
The weighted average stated interest rate and weighted average maturity on all our debt outstanding as of December 31, 2020 were 6.40% and 4.1 years, respectively, and as of December 31, 2019 were 5.94% and 4.2 years, respectively. The aggregate accrued interest which remained payable at December 31, 2020 and 2019, was approximately $0.5 million and $0.6 million, respectively.
The tables below summarize the components of interest expense for the years ended December 31, 2020 and 2019:
|
Year Ended December 31, 2020 |
|||||||||
|
($ in thousands) |
Stated Interest |
Amortization of |
Total |
||||||
|
Credit Facility |
$ |
262.2 |
$ |
4.8 |
$ |
267.0 |
|||
|
6.25% Unsecured Notes |
|
2,799.4 |
|
233.8 |
|
3,033.2 |
|||
|
6.50% Unsecured Notes |
|
4,184.1 |
|
325.6 |
|
4,509.7 |
|||
|
Repo Facility |
|
68.9 |
|
— |
|
68.9 |
|||
|
Total(1) |
$ |
7,314.6 |
$ |
564.2 |
$ |
7,878.9 |
|||
____________
(1) Totals may not sum due to rounding.
|
Year Ended December 31, 2019 |
|||||||||
|
($ in thousands) |
Stated Interest |
Amortization of |
Total |
||||||
|
Credit Facility |
$ |
3,043.3 |
$ |
74.1 |
$ |
3,117.4 |
|||
|
6.25% Unsecured Notes |
|
2,084.0 |
|
173.5 |
|
2,257.5 |
|||
|
6.50% Unsecured Notes |
|
4,184.1 |
|
324.7 |
|
4,508.8 |
|||
|
Repo Facility |
|
17.7 |
|
— |
|
17.7 |
|||
|
Total |
$ |
9,329.1 |
$ |
572.3 |
$ |
9,901.4 |
|||
Distributions
In order to qualify for tax treatment as a RIC and to avoid corporate level tax on the income we distribute to our stockholders, we are required, under Subchapter M of the Code, to distribute at least 90% of our ordinary income and realized net short-term capital gains in excess of realized net long-term capital losses to our stockholders on an annual basis.
A written statement identifying the nature of these distributions for tax reporting purposes was posted on our website. We may not be able to achieve operating results that will allow us to make distributions at a specific level or to increase the amount of these distributions from time to time. In addition, we may be limited in our ability to make distributions due to the asset coverage requirements applicable to us as a BDC under the 1940 Act. If we do not distribute a certain percentage of our income annually, we will suffer adverse tax consequences, including possible loss of favorable regulated investment company tax treatment. We cannot assure stockholders that they will receive any distributions.
To the extent our taxable earnings fall below the total amount of our distributions for that fiscal year, a portion of those distributions may be deemed a return of capital to our stockholders. Thus, the source of a distribution to our stockholders may be the original capital invested by the stockholder rather than our taxable ordinary income or capital gains. Stockholders should read any written disclosure accompanying a distribution payment carefully and should not assume that the source of any distribution is taxable ordinary income or capital gains. The final determination of the nature of our distributions can only be made upon the filing of our tax return. We have until October 15, 2021 to file our U.S. federal income tax return for the year ended December 31, 2020.
77
The following table reflects the cash distributions, including distributions reinvested, if any, per share that we have paid on our common stock since the beginning of the 2018 fiscal year through 2020:
|
Date Declared |
Record Date |
Payment Date |
Total |
GAAP net |
Distributions in |
|||||||||||
|
Fiscal 2020 |
|
|
|
|
|
|
||||||||||
|
September 11, 2020 |
December 16, 2020 |
December 31, 2020 |
$ |
0.035 |
|
$ |
N/A |
|
$ |
— |
|
|||||
|
September 11, 2020 |
November 13, 2020 |
November 30, 2020 |
|
0.035 |
|
|
N/A |
|
|
— |
|
|||||
|
September 11, 2020 |
October 16, 2020 |
October 30, 2020 |
|
0.035 |
|
|
N/A |
|
|
— |
|
|||||
|
Total (Fourth Quarter 2020) |
|
0.105 |
|
|
0.10 |
|
|
— |
|
|||||||
|
|
|
|
|
|
|
|||||||||||
|
June 1, 2020 |
September 16, 2020 |
September 30, 2020 |
|
0.035 |
|
|
N/A |
|
|
— |
|
|||||
|
June 1, 2020 |
August 17, 2020 |
August 31, 2020 |
|
0.035 |
|
|
N/A |
|
|
— |
|
|||||
|
June 1, 2020 |
July 17, 2020 |
July 31, 2020 |
|
0.035 |
|
|
N/A |
|
|
— |
|
|||||
|
Total (Third Quarter 2020) |
|
0.105 |
|
|
0.09 |
|
|
0.01 |
|
|||||||
|
|
|
|
|
|
|
|||||||||||
|
February 24, 2020 |
June 15, 2020 |
June 30, 2020 |
|
0.067 |
|
|
N/A |
|
|
— |
|
|||||
|
February 24, 2020 |
May 14, 2020 |
May 29, 2020 |
|
0.067 |
|
|
N/A |
|
|
— |
|
|||||
|
February 24, 2020 |
April 15, 2020 |
April 30, 2020 |
|
0.067 |
|
|
N/A |
|
|
— |
|
|||||
|
Total (Second Quarter 2020) |
|
0.201 |
|
|
0.09 |
|
|
0.11 |
|
|||||||
|
|
|
|
|
|
|
|||||||||||
|
October 25, 2019 |
March 17, 2020 |
March 31, 2020 |
|
0.067 |
|
|
N/A |
|
|
— |
|
|||||
|
October 25, 2019 |
February 14, 2020 |
February 28, 2020 |
|
0.067 |
|
|
N/A |
|
|
— |
|
|||||
|
October 25, 2019 |
January 17, 2020 |
January 31, 2020 |
|
0.067 |
|
|
N/A |
|
|
— |
|
|||||
|
Total (First Quarter 2020) |
|
0.201 |
|
|
0.13 |
|
|
0.07 |
|
|||||||
|
Total (2020) |
$ |
0.612 |
(1) |
$ |
0.40 |
(5) |
$ |
0.21 |
(5) |
|||||||
|
|
|
|
|
|
|
|||||||||||
|
Fiscal 2019(4) |
|
|
|
|
|
|
||||||||||
|
July 25, 2019 |
December 18, 2019 |
December 31, 2019 |
$ |
0.067 |
|
$ |
N/A |
|
$ |
— |
|
|||||
|
July 25, 2019 |
November 15, 2019 |
November 29, 2019 |
|
0.067 |
|
|
N/A |
|
|
— |
|
|||||
|
July 25, 2019 |
October 21, 2019 |
October 31, 2019 |
|
0.067 |
|
|
N/A |
|
|
— |
|
|||||
|
Total (Fourth Quarter 2019) |
|
0.201 |
|
|
0.18 |
|
|
0.02 |
|
|||||||
|
|
|
|
|
|
|
|||||||||||
|
April 23, 2019 |
September 23, 2019 |
September 30, 2019 |
|
0.067 |
|
|
N/A |
|
|
— |
|
|||||
|
April 23, 2019 |
August 23, 2019 |
August 30, 2019 |
|
0.067 |
|
|
N/A |
|
|
— |
|
|||||
|
April 23, 2019 |
July 24, 2019 |
July 31, 2019 |
|
0.067 |
|
|
N/A |
|
|
— |
|
|||||
|
Total (Third Quarter 2019) |
|
0.201 |
|
|
0.19 |
|
|
0.01 |
|
|||||||
|
|
|
|
|
|
|
|||||||||||
|
February 22, 2019 |
June 21, 2019 |
June 28, 2019 |
|
0.067 |
|
|
N/A |
|
|
— |
|
|||||
|
February 22, 2019 |
May 24, 2019 |
May 31, 2019 |
|
0.067 |
|
|
N/A |
|
|
— |
|
|||||
|
February 22, 2019 |
April 23, 2019 |
April 30, 2019 |
|
0.067 |
|
|
N/A |
|
|
— |
|
|||||
|
Total (Second Quarter 2019) |
|
0.201 |
|
|
0.27 |
|
|
(0.07 |
) |
|||||||
|
|
|
|
|
|
|
|||||||||||
|
February 22, 2019 |
March 15, 2019 |
March 29, 2019 |
|
0.200 |
|
|
0.18 |
|
|
0.02 |
|
|||||
|
Total (First Quarter 2019) |
|
0.200 |
|
|
0.18 |
|
|
0.02 |
|
|||||||
|
Total (2019) |
$ |
0.803 |
(2) |
$ |
0.81 |
(5) |
$ |
(0.01 |
)(5) |
|||||||
|
|
|
|
|
|
|
|||||||||||
|
Fiscal 2018 |
|
|
|
|
|
|
||||||||||
|
October 26, 2018 |
December 17, 2018 |
December 31, 2018 |
$ |
0.20 |
|
$ |
0.18 |
|
$ |
0.02 |
|
|||||
|
July 26, 2018 |
September 14, 2018 |
September 28, 2018 |
|
0.20 |
|
|
0.18 |
|
|
0.02 |
|
|||||
|
April 24, 2018 |
June 15, 2018 |
June 29, 2018 |
|
0.20 |
|
|
0.15 |
|
|
0.05 |
|
|||||
|
February 22, 2018 |
March 16, 2018 |
March 30, 2018 |
|
0.20 |
|
|
0.17 |
|
|
0.03 |
|
|||||
|
Total (2018) |
$ |
0.80 |
(3) |
$ |
0.67 |
(5) |
$ |
0.13 |
(5) |
|||||||
____________
(1) The tax characterization of cash distributions for the year ended December 31, 2020 will not be known until the tax return for such year is finalized. For the year ended December 31, 2020, the amounts and sources of distributions reported are only estimates and are not being provided for U.S. tax reporting purposes. The final determination of the source of all distributions in 2020 will be made after year-end and the amounts represented may be materially different from the amounts disclosed in the final Form 1099-DIV notice. The actual amounts and sources of the amounts for tax reporting purposes will depend upon the Company’s investment performance and may be subject to change based on tax regulations.
78
(2) Cash distributions for the year ended December 31, 2019 includes a tax return of capital of approximately $0.11 per share for tax purposes.
(3) Cash distributions for the year ended December 31, 2018 includes a tax return of capital of approximately $0.26 per share for tax purposes.
(4) Beginning February 22, 2019, the Board began to declare monthly distributions in lieu of quarterly distributions.
(5) Totals may not sum due to rounding.
RELATED PARTIES
We have a number of business relationships with affiliated or related parties, including the following:
• We have entered into the Investment Advisory Agreement with Oxford Square Management. Oxford Square Management is controlled by Oxford Funds, its managing member. In addition to Oxford Funds, Oxford Square Management is owned by Charles M. Royce, a member of our Board, who holds a minority, non-controlling interest in Oxford Square Management as the non-managing member. Oxford Funds, as the managing member of Oxford Square Management, manages the business and internal affairs of Oxford Square Management. In addition, Oxford Funds provides us with office facilities and administrative services pursuant to the Administration Agreement.
• Messrs. Cohen and Rosenthal also currently serve as Chief Executive Officer and President, respectively, at Oxford Bridge Management, LLC, the investment adviser to the Oxford Bridge Funds, and at Oxford Gate Management, LLC, the investment adviser to the Oxford Gate Funds. Oxford Funds is the managing member of both Oxford Bridge Management, LLC and Oxford Gate Management, LLC. In addition, Bruce L. Rubin serves as the Chief Financial Officer and Secretary, and Gerald Cummins serves as the Chief Compliance Officer, respectively, of both Oxford Bridge Management, LLC and Oxford Gate Management, LLC.
• Messrs. Cohen and Rosenthal currently serve as Chief Executive Officer and President, respectively, of Oxford Lane Capital Corp., a non-diversified closed-end management investment company that invests primarily in equity and junior debt tranches of CLO vehicles, and its investment adviser, Oxford Lane Management, LLC. Oxford Funds provides Oxford Lane Capital Corp. with office facilities and administrative services pursuant to an administration agreement and also serves as the managing member of Oxford Lane Management, LLC. In addition, Bruce L. Rubin serves as the Chief Financial Officer, Treasurer and Corporate Secretary of Oxford Lane Capital Corp. and Chief Financial Officer and Treasurer of Oxford Lane Management, LLC, and Mr. Cummins serves as the Chief Compliance Officer of Oxford Lane Capital Corp. and Oxford Lane Management, LLC.
As a result, certain conflicts of interest may arise with respect to the management of our portfolio by Messrs. Cohen and Rosenthal on the one hand, and the obligations of Messrs. Cohen and Rosenthal to manage Oxford Lane Capital Corp., the Oxford Bridge Funds and the Oxford Gate Funds, respectively, on the other hand.
Oxford Square Management, Oxford Lane Management, LLC, Oxford Bridge Management, LLC and Oxford Gate Management, LLC are subject to a written policy with respect to the allocation of investment opportunities among the Company, Oxford Lane Capital Corp., the Oxford Bridge Funds and the Oxford Gate Funds. Where investments are suitable for more than one entity, the allocation policy generally provides that, depending on size and subject to current and anticipated cash availability, the absolute size of the investment as well as its relative size compared to the total assets of each entity, current and anticipated weighted average costs of capital, among other factors, an investment amount will be determined by the adviser to each entity. If the investment opportunity is sufficient for each entity to receive its investment amount, then each entity receives the investment amount; otherwise, the investment amount is reduced pro rata. On June 14, 2017, the Securities and Exchange Commission issued an order permitting the Company and certain of its affiliates to complete negotiated co-investment transactions in portfolio companies, subject to certain conditions (the “Order”). Subject to satisfaction of certain conditions to the Order, the Company and certain of its affiliates are now permitted, together with any future BDCs, registered closed-end funds and certain private funds, each of whose investment adviser is the Company’s investment adviser or an investment adviser controlling, controlled by, or under common control with the Company’s investment adviser, to co-invest in negotiated investment opportunities where doing so would otherwise be prohibited under the 1940 Act, providing the Company’s stockholders with access to a broader array of investment opportunities. Pursuant to the Order, we are permitted to co-invest in such investment opportunities with our affiliates if a “required majority” (as defined in Section 57(o) of the 1940 Act) of our independent directors make certain conclusions in connection with a co-investment transaction, including, but not limited to, that (1) the terms of the potential co-investment transaction, including the consideration to be paid, are
79
reasonable and fair to us and our stockholders and do not involve overreaching in respect of us or our stockholders on the part of any person concerned, and (2) the potential co-investment transaction is consistent with the interests of our stockholders and is consistent with our then-current investment objective and strategies.
In the ordinary course of business, we may enter into transactions with portfolio companies that may be considered related party transactions. In order to ensure that we do not engage in any prohibited transactions with any persons affiliated with us, we have implemented certain policies and procedures whereby our executive officers screen each of our transactions for any possible affiliations between the proposed portfolio investment, us, companies controlled by us and our employees and directors. We will not enter into any agreements unless and until we are satisfied that doing so will not raise concerns under the 1940 Act or, if such concerns exist, we have taken appropriate actions to seek board review and approval or exemptive relief for such transaction. Our Board reviews these procedures on an annual basis.
We have also adopted a Code of Business Conduct and Ethics which applies to, among others, our senior officers, including our Chief Executive Officer and Chief Financial Officer, as well as all of our officers, directors and employees. Our Code of Business Conduct and Ethics requires that all employees and directors avoid any conflict, or the appearance of a conflict, between an individual’s personal interests and our interests. Pursuant to our Code of Business Conduct and Ethics, each employee and director must disclose any conflicts of interest, or actions or relationships that might give rise to a conflict. Our Audit Committee is charged with approving any waivers under our Code of Ethics. As required by the NASDAQ Global Select Market corporate governance listing standards, the Audit Committee of our Board is also required to review and approve any transactions with related parties (as such term is defined in Item 404 of Regulation S-K).
Information concerning related party transactions is included in the consolidated financial statements and related notes, appearing elsewhere in this annual report on Form 10-K.
CRITICAL ACCOUNTING POLICIES
The preparation of consolidated financial statements and related disclosures in conformity with generally accepted accounting principles in the United States (“GAAP”) requires management to make estimates and assumptions that affect the reported amounts of assets and liabilities, disclosure of contingent assets and liabilities at the date of the consolidated financial statements, and revenues and expenses during the periods reported. Actual results could materially differ from those estimates. We have identified investment valuation and investment income as critical accounting policies.
Investment Valuation
We fair value our investment portfolio in accordance with the provisions of ASC 820, Fair Value Measurement and Disclosure. Estimates made in the preparation of our consolidated financial statements include the valuation of investments and the related amounts of unrealized appreciation and depreciation of investments recorded. We believe that there is no single definitive method for determining fair value in good faith. As a result, determining fair value requires that judgment be applied to the specific facts and circumstances of each portfolio investment while employing a consistently applied valuation process for the types of investments we make.
ASC 820-10 clarified the definition of fair value and requires companies to expand their disclosure about the use of fair value to measure assets and liabilities in interim and annual periods subsequent to initial recognition. ASC 820-10 defines fair value as the price that would be received to sell an asset or paid to transfer a liability in an orderly transaction between market participants at the measurement date. ASC 820-10 also establishes a three-tier fair value hierarchy, which prioritizes the inputs used in measuring fair value. These tiers include: Level 1, defined as observable inputs such as quoted prices in active markets; Level 2, which includes inputs such as quoted prices for similar securities in active markets and quoted prices for identical securities in markets that are not active; and Level 3, defined as unobservable inputs for which little or no market data exists, therefore requiring an entity to develop its own assumptions. We consider the attributes of current market conditions on an on-going basis and have determined that due to the general illiquidity of the market for its investment portfolio, whereby little or no market data exists, almost all of our investments are based upon “Level 3” inputs as of December 31, 2020.
Our Board determines the value of our investment portfolio each quarter. In connection with that determination, members of Oxford Square Management’s portfolio management team prepare a quarterly analysis of each portfolio investment using the most recent portfolio company financial statements, forecasts and other relevant financial and operational information. Since March 2004, we have engaged third-party valuation firms to provide assistance in
80
valuing certain of its syndicated loans and bilateral investments, including related equity investments, although our Board ultimately determines the appropriate valuation of each such investment. Changes in fair value, as described above, are recorded in the consolidated statement of operations as net change in unrealized appreciation/depreciation.
Syndicated Loans (Including Senior Secured Notes)
In accordance with ASC 820-10, our valuation procedures specifically provide for the review of indicative quotes supplied by the large agent banks that make a market for each security. However, the marketplace from which we obtain indicative bid quotes for purposes of determining the fair value of our syndicated loan investments has shown attributes of illiquidity as described by ASC-820-10. During such periods of illiquidity, when we believe that the non-binding indicative bids received from agent banks for certain syndicated investments that we own may not be determinative of their fair value or when no market indicative quote is available, we may engage third-party valuation firms to provide assistance in valuing certain syndicated investments that we own. The third-party valuation firms may use the income or market approach in arriving at a valuation. Unobservable inputs utilized could include discount rates derived from estimated credit spreads and EBITDA multiples. In addition, Oxford Square Management analyzes each syndicated loan by reviewing the company’s financial statements, covenant compliance and recent trading activity in the security (if known), and other business developments related to the portfolio company. All available information, including non-binding indicative bids which may not be determinative of fair value, is presented to the Valuation Committee to consider in its determination of fair value. In some instances, there may be limited trading activity in a security even though the market for the security is considered not active. In such cases the Valuation Committee will consider the number of trades, the size and timing of each trade, and other circumstances around such trades, to the extent such information is available, in its determination of fair value. The Valuation Committee will evaluate the impact of such additional information, and factor it into its consideration of the fair value that is indicated by the analysis provided by third-party valuation firms, if any.
Collateralized Loan Obligations — Debt and Equity
We have acquired a number of debt and equity positions in CLO investment vehicles and CLO warehouse investments. These investments are special purpose financing vehicles. In valuing such investments, we consider the indicative prices provided by a recognized industry pricing service as a primary source, and the implied yield of such prices, supplemented by actual trades executed in the market at or around period-end, as well as the indicative prices provided by the broker who arranges transactions in such investment vehicles. We also consider those instances in which the record date for an equity distribution payment falls on the last day of the period, and the likelihood that a prospective purchaser would require a downward adjustment to the indicative price representing substantially all of the pending distribution. Additional factors include any available information on other relevant transactions including firm bids and offers in the market and information resulting from bids-wanted-in-competition. In addition, we consider the operating metrics of the specific investment vehicle, including compliance with collateralization tests, defaulted and restructured securities, and payment defaults, if any. Oxford Square Management or the Valuation Committee may request an additional analysis by a third-party firm to assist in the valuation process of CLO investment vehicles. All information is presented to our Board for its determination of fair value of these investments.
Bilateral Investments (Including Equity)
Bilateral investments for which market quotations are readily available are valued by an independent pricing agent or market maker. If such market quotations are not readily available, under the valuation procedures approved by our Board upon the recommendation of the Valuation Committee, a third-party valuation firm will prepare valuations for each of our bilateral investments that, when combined with all other investments in the same portfolio company, (i) have a value as of the previous quarter of greater than or equal to 2.5% of its total assets as of the previous quarter, and (ii) have a value as of the current quarter of greater than or equal to 2.5% of its total assets as of the previous quarter, after taking into account any repayment of principal during the current quarter. In addition, in those instances where a third-party valuation is prepared for a portfolio investment which meets the parameters noted in (i) and (ii) above, the frequency of those third-party valuations is based upon the grade assigned to each such security under its credit grading system as follows: Grade 1, at least annually; Grade 2, at least semi-annually; Grades 3, 4, and 5, at least quarterly. Bilateral investments which do not meet the parameters in (i) and (ii) above are not required to have a third-party valuation and, in those instances, a valuation analysis will be prepared by Oxford Square Management. Oxford Square Management also retains the authority to seek, on our behalf, additional third party valuations with respect to both our bilateral portfolio securities and our syndicated loan investments. Our Board retains ultimate authority as to the third-party review cycle as well as the appropriate valuation of each investment.
81
The term “Bilateral investments” means debt and equity investments directly negotiated between the Company and a portfolio company, but excludes syndicated loans (i.e., corporate loans arranged by an agent on behalf of a company, portions of which are held by multiple investors in addition to OXSQ).
Refer to “Note 3. Fair Value” in the notes to our consolidated financial statements for more information on investment valuation and our portfolio of investments.
INVESTMENT INCOME:
Interest Income
Interest income is recorded on an accrual basis using the contractual rate applicable to each debt investment and includes the accretion of market discounts and/or original issue discount (“OID”) and amortization of market premiums. Discounts from and premiums to par value on securities purchased are accreted/amortized into interest income over the life of the respective security using the effective yield method. The amortized cost of investments represents the original cost adjusted for the accretion of discounts and amortization of premiums, if any.
Generally, when interest and/or principal payments on a loan become past due, or if we otherwise do not expect the borrower to be able to service its debt and other obligations, we will place the loan on non-accrual status and will generally cease recognizing interest income on that loan for financial reporting purposes until all principal and interest have been brought current through payment or due to restructuring such that the interest income is deemed to be collectible. We generally restore non-accrual loans to accrual status when past due principal and interest is paid and, in our judgment, is likely to remain current. As of December 31, 2020 and 2019, we had two debt investments that were on non-accrual status.
Interest income also includes a payment-in-kind (“PIK”) component on certain investments in our portfolio. Refer to the section below, “Payment-In-Kind,” for a description of PIK income and its impact on interest income.
Payment-In-Kind
We have debt and preferred stock investments in our portfolio that contain contractual payment-in-kind (“PIK”) provisions. PIK interest and preferred stock dividends are computed at their contractual rates and are accrued into income and added to the principal balances on the capitalization dates. Upon capitalization, the PIK portions of the investments are valued at their respective fair values. If we believe that a PIK is not fully expected to be realized, the PIK investment would be placed on non-accrual status. When a PIK investment is placed on non-accrual status, the accrued, uncapitalized interest or dividends would be reversed from the related receivable through interest or dividend income, respectively. PIK investments on non-accrual status are restored to accrual status once it becomes probable that such PIK will be ultimately collectible in cash. For the year ended December 31, 2020, no PIK preferred stock dividends were recognized as dividend income.
Income from Securitization Vehicles and Equity Investments
Income from investments in the equity class securities of CLO vehicles (typically income notes or subordinated notes) is recorded using the effective yield method in accordance with the provisions of ASC 325-40, based upon estimated cash flows, amounts and timing including those CLO equity investments that have not made their inaugural distribution for the relevant period end. We monitor the expected residual payments, and effective yield is determined and updated periodically, as needed. Accordingly, investment income recognized on CLO equity securities in the GAAP statement of operations differs from both the tax-basis investment income and from the cash distributions actually received by us during the period.
Other Income
Other income includes prepayment, amendment, and other fees earned by our loan investments, distributions from fee letters and success fees associated with portfolio investments. Distributions from fee letters are an enhancement to the return on a CLO equity investment and are based upon a percentage of the collateral manager’s fees above the amortized cost, and are recorded as other income when earned. We may also earn success fees associated with our investments in certain securitization vehicles or CLO warehouse facilities, which are contingent upon a repayment of the warehouse by a permanent CLO structure; such fees are earned and recognized when the repayment is completed.
82
RECENT DEVELOPMENTS
The following distributions payable to stockholders are shown below:
|
Date Declared |
Record Date |
Payable Dates |
Per Share Distribution |
|||
|
October 22, 2020 |
January 15, 2021 |
January 29, 2021 |
$0.035 |
|||
|
October 22, 2020 |
February 12, 2021 |
February 26, 2021 |
$0.035 |
|||
|
October 22, 2020 |
March 17, 2021 |
March 31, 2021 |
$0.035 |
|||
|
February 23, 2021 |
April 16, 2021 |
April 30, 2021 |
$0.035 |
|||
|
February 23, 2021 |
May 14, 2021 |
May 28, 2021 |
$0.035 |
|||
|
February 23, 2021 |
June 16, 2021 |
June 30, 2021 |
$0.035 |
Item 7A. Quantitative and Qualitative Disclosures About Market Risk
We are subject to financial market risks, including changes in interest rates. As of December 31, 2020, all debt investments in our portfolio were at variable interest rates, representing approximately $208.5 million in principal debt. As of December 31, 2020, all except two of our variable rate investments were income producing. The variable rates are based upon the five-year Treasury note, the Prime rate or LIBOR, and, in the case of our bilateral investments, are generally reset annually, whereas our non-bilateral investments generally reset quarterly. We expect that future debt investments will generally be made at variable rates. Many of the variable rate investments contain interest rate floors.
We may in the future hedge against interest rate fluctuations by using standard hedging instruments such as futures, options and forward contracts. While hedging activities may insulate us against adverse changes in interest rates, they may also limit our ability to participate in the benefits of lower interest rates with respect to the investments in our portfolio with fixed interest rates.
On March 5, 2021, the United Kingdom’s Financial Conduct Authority (the “FCA”), which regulates LIBOR, announced that (i) 24 LIBOR settings would cease to exist immediately after December 31, 2021 (all seven euro LIBOR settings; all seven Swiss franc LIBOR settings; the Spot Next, 1-week, 2-month, and 12-month Japanese yen LIBOR settings; the overnight, 1-week, 2-month, and 12-month sterling LIBOR settings; and the 1-week and 2-month US dollar LIBOR settings); (ii) the overnight and 12-month US LIBOR settings would cease to exist after June 30, 2023; and (iii) the FCA would consult on whether the remaining nine LIBOR settings should continue to be published on a synthetic basis for a certain period using the FCA’s proposed new powers that the UK government is legislating to grant to them.
Based on our Consolidated Statements of Assets and Liabilities as of December 31, 2020, the following table shows the annualized impact on net investment income of hypothetical base rate changes in interest rates for our settled investments (considering interest rate floors for floating rate instruments), excluding CLO equity investments. The base interest rate case assumes the rates on our portfolio investments remain unchanged from the actual effective interest rates as of December 31, 2020. These hypothetical calculations are based on a model of the investments in our portfolio, held as of December 31, 2020, and are only adjusted for assumed changes in the underlying base interest rates. Although management believes that this analysis is indicative of our existing interest rate sensitivity, it does not adjust for changes in the credit quality, size and composition of our portfolio, and other business developments, including a change in the level of our borrowings, that could affect the net increase (or decrease) in net assets resulting from operations. Accordingly, no assurances can be given that actual results would not differ materially from the results under this hypothetical analysis.
|
Hypothetical Change in LIBOR |
Estimated |
||
|
Up 300 basis points |
15.8 |
% |
|
|
Up 200 basis points |
10.5 |
% |
|
|
Up 100 basis points |
5.3 |
% |
|
|
Down 25 basis points |
(0.6 |
)% |
|
83
Item 8. Consolidated Financial Statements and Supplementary Data
Index to Consolidated Financial Statements
84
Report of Independent Registered Public Accounting Firm
To the Board of Directors and Shareholders of Oxford Square Capital Corp.
Opinion on the Financial Statements
We have audited the accompanying consolidated statements of assets and liabilities, including the consolidated schedule of investments, of Oxford Square Capital Corp. and its subsidiaries (the “Company”) as of December 31, 2020 and 2019, and the related consolidated statements of operations, changes in net assets and cash flows for each of the three years in the period ended December 31, 2020, including the related notes (collectively referred to as the “consolidated financial statements”). In our opinion, the consolidated financial statements present fairly, in all material respects, the financial position of the Company as of December 31, 2020 and 2019, and the results of its operations, changes in its net assets and its cash flows for each of the three years in the period ended December 31, 2020 in conformity with accounting principles generally accepted in the United States of America.
Basis for Opinion
These consolidated financial statements are the responsibility of the Company’s management. Our responsibility is to express an opinion on the Company’s consolidated financial statements based on our audits. We are a public accounting firm registered with the Public Company Accounting Oversight Board (United States) (PCAOB) and are required to be independent with respect to the Company in accordance with the U.S. federal securities laws and the applicable rules and regulations of the Securities and Exchange Commission and the PCAOB.
We conducted our audits of these consolidated financial statements in accordance with the standards of the PCAOB. Those standards require that we plan and perform the audit to obtain reasonable assurance about whether the consolidated financial statements are free of material misstatement, whether due to error or fraud. The Company is not required to have, nor were we engaged to perform, an audit of its internal control over financial reporting. As part of our audits we are required to obtain an understanding of internal control over financial reporting but not for the purpose of expressing an opinion on the effectiveness of the Company’s internal control over financial reporting. Accordingly, we express no such opinion.
Our audits included performing procedures to assess the risks of material misstatement of the consolidated financial statements, whether due to error or fraud, and performing procedures that respond to those risks. Such procedures included examining, on a test basis, evidence regarding the amounts and disclosures in the consolidated financial statements. Our audits also included evaluating the accounting principles used and significant estimates made by management, as well as evaluating the overall presentation of the consolidated financial statements. Our procedures included confirmation of securities owned as of December 31, 2020 and 2019 by correspondence with the custodians and brokers. We believe that our audits provide a reasonable basis for our opinion.
Critical Audit Matters
The critical audit matters communicated below are matters arising from the current period audit of the consolidated financial statements that were communicated or required to be communicated to the audit committee and that (i) relate to accounts or disclosures that are material to the consolidated financial statements and (ii) involved our especially challenging, subjective, or complex judgments. The communication of critical audit matters does not alter in any way our opinion on the consolidated financial statements, taken as a whole, and we are not, by communicating the critical audit matters below, providing separate opinions on the critical audit matters or on the accounts or disclosures to which they relate.
F-1
Valuation of Syndicated Loan and CLO Equity Level 3 Investments
As described in Notes 2 and 3 to the consolidated financial statements, the Company’s fair value of syndicated loans (comprised of senior secured notes) and CLO equity investments was $172.2 million and $122.5 million, respectively as of December 31, 2020. Management applies judgment to the specific facts and circumstances of each level 3 investment when determining fair value, which involves the use of significant unobservable inputs with respect to (i) for syndicated loan investments: non-binding indicative bids received from agent banks, discount rates derived from estimated credit spreads, EBITDA multiples, and recent trading activity, and (ii) for CLO equity investments: indicative prices provided by a recognized industry pricing service, and the implied yield of such prices, supplemented by actual trades executed in the market at or around period-end, as well as indicative prices provided by brokers who arrange the transactions. For syndicated loan investments, when determining fair value, management also analyzes each syndicated loan by reviewing the portfolio company’s financial statements, covenant compliance and other business developments. Additionally, for syndicated loans that have certain attributes as discussed in Note 2, management uses a third party valuation firm. For CLO equity investments, management considers, among other factors, operating metrics of the specific investment vehicle, including compliance with collateralization tests, defaulted and restructured securities, and payment defaults in determining fair value.
The principal considerations for our determination that performing procedures relating to the valuation of syndicated loan and CLO equity level 3 investments is a critical audit matter are the significant judgment by management to determine the fair value of syndicated loan and CLO equity level 3 investments due to the use of significant unobservable inputs, which in turn led to a high degree of auditor judgment, subjectivity and effort in performing procedures and evaluating the audit evidence obtained relating to the significant unobservable inputs. Also, the audit effort involved the use of professionals with specialized skill and knowledge.
Addressing the matter involved performing procedures and evaluating audit evidence in connection with forming our overall opinion on the consolidated financial statements. These procedures included testing the effectiveness of controls relating to the valuation of syndicated loan and CLO equity level 3 investments, including controls over management’s methods, significant unobservable inputs, and data. These procedures also included, among others (i) developing an independent fair value estimate by obtaining independent pricing from third party vendors, when available, and comparing management’s estimate to the independent estimate to evaluate the reasonableness of management’s estimate, and/or (ii) for a sample of investments, professionals with specialized skill and knowledge were used to assist in developing an independent range of prices using available market inputs, independently constructed models and independently determined significant unobservable inputs, and comparing management’s estimate to the independent range of prices to evaluate the reasonableness of management’s estimate. Developing an independent range of prices involved testing the completeness and accuracy of data provided by management.
Income from Securitization Vehicles and Investments
As described in Notes 2 and 8 to the consolidated financial statements, the Company recorded income from securitization vehicles and investments of $15.0 million for the year ended December 31, 2020. The Company’s income from investments in the equity class securities of CLO vehicles (typically income notes or subordinated notes) is recorded using the effective yield method based upon estimated cash flow, amounts and timing, including those CLO equity investments that have not made their inaugural distribution for the relevant period end.
The principal considerations for our determination that performing procedures relating to the income from securitization vehicles and investments is a critical audit matter are the significant judgment by management to determine the significant assumptions related to estimated cash flow amounts and timing used in the effective yield method, which in turn led to a high degree of auditor judgment, subjectivity and effort in performing procedures and evaluating the audit evidence obtained relating to the significant assumptions used in the effective yield method. Also, the audit effort involved the use of professionals with specialized skill and knowledge.
F-2
Addressing the matter involved performing procedures and evaluating audit evidence in connection with forming our overall opinion on the consolidated financial statements. These procedures included testing the effectiveness of controls relating to the recognition of income from securitization vehicles and investments, including controls over management’s methods, significant assumptions, and data. These procedures also included, among others (i) developing an independent estimate of income from securitization vehicles and investments for a sample of securities; (ii) comparing the independent estimate to management’s estimate to assess the reasonableness of management’s estimate; and (iii) testing the completeness and accuracy of data provided by management. Professionals with specialized skill and knowledge were used to assist in independently developing a range of effective yields using independently developed significant assumptions for cash flow amounts and timing, based on available market inputs, current information, and events.
/s/ PricewaterhouseCoopers LLP
New York, New York
March 22, 2021
We have served as the Company’s auditor since 2003.
F-3
OXFORD SQUARE CAPITAL CORP.
CONSOLIDATED STATEMENTS OF ASSETS AND LIABILITIES
|
December 31, |
December 31, |
|||||||
|
ASSETS |
|
|
|
|
||||
|
Non-affiliated/non-control investments (cost: $407,547,351 and $467,828,907, respectively) |
$ |
294,674,000 |
|
$ |
361,985,203 |
|
||
|
Affiliated investments (cost: $16,836,822 and $16,836,822, respectively) |
|
— |
|
|
2,816,790 |
|
||
|
Cash equivalents |
|
59,137,284 |
|
|
14,410,486 |
|
||
|
Restricted cash |
|
— |
|
|
2,050,452 |
|
||
|
Interest and distributions receivable |
|
2,299,259 |
|
|
3,480,036 |
|
||
|
Securities sold not settled |
|
950,000 |
|
|
— |
|
||
|
Other assets |
|
597,238 |
|
|
523,626 |
|
||
|
Total assets |
$ |
357,657,781 |
|
$ |
385,266,593 |
|
||
|
LIABILITIES |
|
|
|
|
||||
|
Notes payable – 6.50% Unsecured Notes, net of deferred issuance costs of $1,055,065 and $1,380,658, respectively |
$ |
63,315,160 |
|
$ |
62,989,567 |
|
||
|
Notes payable – 6.25% Unsecured Notes, net of deferred issuance costs of $1,243,082 and $1,476,878, respectively |
|
43,547,668 |
|
|
43,313,872 |
|
||
|
Notes payable – Credit Facility, net of deferred issuance costs of $0 and $10,051, respectively |
|
— |
|
|
28,080,550 |
|
||
|
Securities purchased not settled |
|
23,156,556 |
|
|
— |
|
||
|
Base Fee and Net Investment Income Incentive Fee payable to affiliate |
|
1,159,703 |
|
|
1,480,653 |
|
||
|
Accrued interest payable |
|
478,191 |
|
|
632,235 |
|
||
|
Accrued expenses |
|
573,977 |
|
|
771,174 |
|
||
|
Total liabilities |
|
132,231,255 |
|
|
137,268,051 |
|
||
|
COMMITMENTS AND CONTINGENCIES (Note 9) |
|
|
|
|
||||
|
NET ASSETS |
|
|
|
|
||||
|
Common stock, $0.01 par value, 100,000,000 shares authorized; 49,589,607 and 48,448,987 shares issued and outstanding, respectively |
|
495,895 |
|
|
484,489 |
|
||
|
Capital in excess of par value |
|
452,650,210 |
|
|
451,839,302 |
|
||
|
Total distributable earnings/(accumulated losses) |
|
(227,719,579 |
) |
|
(204,325,249 |
) |
||
|
Total net assets |
|
225,426,526 |
|
|
247,998,542 |
|
||
|
Total liabilities and net assets |
$ |
357,657,781 |
|
$ |
385,266,593 |
|
||
|
Net asset value per common share |
$ |
4.55 |
|
$ |
5.12 |
|
||
See Accompanying Notes.
F-4
OXFORD SQUARE CAPITAL CORP.
CONSOLIDATED SCHEDULE OF INVESTMENTS
December 31, 2020
|
COMPANY/INVESTMENT(1)(20) |
ACQUISITION DATE |
PRINCIPAL AMOUNT |
COST |
FAIR |
% of |
|||||||||
|
Senior Secured Notes |
|
|
|
|
||||||||||
|
Aerospace and Defense |
|
|
|
|
||||||||||
|
Novetta, LLC |
|
|
|
|
||||||||||
|
first lien senior secured notes, 6.00% (LIBOR + 5.00%), (1.00% floor) due October 16, 2022(4)(5)(6)(16) |
November 20, 2014 |
$ |
5,414,630 |
$ |
5,374,499 |
$ |
5,378,514 |
|
||||||
|
Total Aerospace and Defense |
|
$ |
5,374,499 |
$ |
5,378,514 |
2.4 |
% |
|||||||
|
|
|
|
|
|||||||||||
|
Business Services |
|
|
|
|
||||||||||
|
Access CIG, LLC |
|
|
|
|
||||||||||
|
second lien senior secured notes, 7.98% (LIBOR + 7.75%), (0.00% floor) due February 27, 2026(4)(5)(14)(16) |
February 14, 2018 |
$ |
16,754,000 |
$ |
16,833,452 |
$ |
16,502,690 |
|
||||||
|
|
|
|
|
|||||||||||
|
Convergint Technologies, LLC |
|
|
|
|
||||||||||
|
second lien senior secured notes, 7.50% (LIBOR + 6.75%), (0.75% floor) due February 2, 2026(4)(5)(15) |
January 29, 2018 |
|
1,500,000 |
|
1,493,444 |
|
1,440,000 |
|
||||||
|
|
|
|
|
|||||||||||
|
Imagine! Print Solutions, Inc. |
|
|
|
|
||||||||||
|
second lien senior secured notes, 9.75% |
June 14, 2017 |
|
15,000,000 |
|
13,605,559 |
|
175,000 |
|
||||||
|
|
|
|
|
|||||||||||
|
OMNIA Partners, Inc. |
|
|
|
|
||||||||||
|
second lien senior secured notes, 7.75% |
May 17, 2018 |
|
14,000,000 |
|
13,947,515 |
|
13,090,000 |
|
||||||
|
|
|
|
|
|||||||||||
|
Premiere Global Services, Inc. |
|
|
|
|
||||||||||
|
first lien senior secured notes, 7.50% |
October 1, 2019 |
|
14,280,354 |
|
13,809,512 |
|
11,808,425 |
|
||||||
|
second lien senior secured notes, 10.00%, 0.50% Cash, 10.00% PIK (LIBOR + 9.00%) (1.00% floor) due June 6, 2024(3)(4)(5)(14)(16)(17) |
October 1, 2019 |
|
11,383,000 |
|
9,817,795 |
|
4,069,423 |
|
||||||
|
|
|
|
|
|||||||||||
|
Verifone Systems, Inc. |
|
|
|
|
||||||||||
|
first lien senior secured notes, 4.22% (LIBOR + 4.00%), (0.00% floor) due August 20, 2025(4)(5)(6)(14)(16) |
August 9, 2018 |
|
13,839,695 |
|
13,242,682 |
|
13,355,306 |
|
||||||
|
Total Business Services |
|
$ |
82,749,959 |
$ |
60,440,844 |
26.8 |
% |
|||||||
|
|
|
|
|
|||||||||||
|
Diversified Insurance |
|
|
|
|
||||||||||
|
AmeriLife Group LLC |
|
|
|
|
||||||||||
|
second lien senior secured notes, 9.50% (LIBOR + 8.50%), (1.00% floor) due March 18, 2028(4)(5)(6)(10) |
March 18, 2020 |
$ |
11,000,000 |
$ |
10,797,257 |
$ |
10,807,500 |
|
||||||
|
Total Diversified Insurance |
|
$ |
10,797,257 |
$ |
10,807,500 |
4.8 |
% |
|||||||
|
|
|
|
|
|||||||||||
|
Education |
|
|
|
|
||||||||||
|
Cambium Learning Group, Inc. |
|
|
|
|
||||||||||
|
second lien senior secured notes, 9.50% (LIBOR + 8.50%), (1.00% floor) due December 18, 2026(4)(5)(6)(14)(16) |
October 8, 2020 |
$ |
15,000,000 |
$ |
14,521,360 |
$ |
14,587,500 |
|
||||||
|
Total Education |
|
$ |
14,521,360 |
$ |
14,587,500 |
6.5 |
% |
|||||||
(continued on next page)
See Accompanying Notes.
F-5
OXFORD SQUARE CAPITAL CORP.
CONSOLIDATED SCHEDULE OF INVESTMENTS — (continued)
December 31, 2020
|
COMPANY/INVESTMENT(1)(20) |
ACQUISITION DATE |
PRINCIPAL AMOUNT |
COST |
FAIR |
% of |
|||||||||
|
Senior Secured Notes – (continued) |
|
|
|
|
||||||||||
|
Healthcare |
|
|
|
|
||||||||||
|
Keystone Acquisition Corp. |
|
|
|
|
||||||||||
|
first lien senior secured notes, 6.25% (LIBOR + 5.25%), (1.00% floor) due May 1, 2024(4)(5)(6)(14)(16) |
May 10, 2017 |
$ |
7,381,574 |
$ |
7,361,671 |
$ |
6,938,680 |
|
||||||
|
second lien senior secured notes, 10.25% (LIBOR + 9.25%), (1.00% floor) due May 1, 2025(4)(5)(14)(16) |
May 10, 2017 |
|
13,000,000 |
|
12,892,244 |
|
11,570,000 |
|
||||||
|
|
|
|
|
|||||||||||
|
Viant Medical Holdings, Inc. |
|
|
|
|
||||||||||
|
first lien senior secured notes, 3.90% (LIBOR + 3.75%), (0.00% floor) due July 2, 2025(4)(5)(6)(14)(15) |
June 26, 2018 |
|
9,775,000 |
|
9,773,664 |
|
9,424,762 |
|
||||||
|
second lien senior secured notes, 7.90% (LIBOR + 7.75%), (0.00% floor) due July 2, 2026(4)(5)(14)(15) |
June 26, 2018 |
|
5,000,000 |
|
4,960,791 |
|
4,418,750 |
|
||||||
|
|
|
|
|
|||||||||||
|
HealthChannels, Inc. (f/k/a ScribeAmerica, LLC) |
|
|
|
|
||||||||||
|
first lien senior secured notes, 4.65% (LIBOR + 4.50%), (0.00% floor) due April 3, 2025(4)(5)(6)(15) |
October 31, 2018 |
|
9,761,529 |
|
9,711,098 |
|
9,322,260 |
|
||||||
|
Total Healthcare |
|
$ |
44,699,468 |
$ |
41,674,452 |
18.5 |
% |
|||||||
|
|
|
|
|
|||||||||||
|
Plastics Manufacturing |
|
|
|
|
||||||||||
|
Spectrum Holdings III Corp. (f/k/a KPEX Holdings, Inc.) |
|
|
|
|
||||||||||
|
first lien senior secured notes, 4.25% (LIBOR + 3.25%), (1.00% floor) due January 31, 2025(4)(5)(6)(10) |
June 24, 2020 |
$ |
7,441,675 |
$ |
6,692,041 |
$ |
6,995,175 |
|
||||||
|
Total Plastics Manufacturing |
|
$ |
6,692,041 |
$ |
6,995,175 |
3.1 |
% |
|||||||
|
Software |
|
|
|
|
||||||||||
|
Quest Software, Inc. |
|
|
|
|
||||||||||
|
second lien senior secured notes, 8.46% (LIBOR + 8.25%), (0.00% floor) due May 18, 2026(4)(5)(14)(16) |
May 17, 2018 |
$ |
13,353,672 |
$ |
13,224,594 |
$ |
13,286,904 |
|
||||||
|
Total Software |
|
$ |
13,224,594 |
$ |
13,286,904 |
5.9 |
% |
|||||||
|
|
|
|
|
|||||||||||
|
Telecommunications Services |
|
|
|
|
||||||||||
|
Global Tel Link Corp. |
|
|
|
|
||||||||||
|
second lien senior secured notes, 8.40% (LIBOR + 8.25%), (0.00% floor) due November 29, 2026(4)(5)(14)(15) |
November 20, 2018 |
$ |
17,000,000 |
$ |
16,753,439 |
$ |
11,798,000 |
|
||||||
|
Total Telecommunication Services |
|
$ |
16,753,439 |
$ |
11,798,000 |
5.2 |
% |
|||||||
|
|
|
|
|
|||||||||||
|
Utilities |
|
|
|
|
||||||||||
|
CLEAResult Consulting, Inc. |
|
|
|
|
||||||||||
|
second lien senior secured notes, 7.40% (LIBOR + 7.25%), (0.00% floor) due August 10, 2026(4)(5)(15) |
August 3, 2018 |
$ |
7,650,000 |
$ |
7,669,188 |
$ |
7,191,000 |
|
||||||
|
Total Utilities |
|
$ |
7,669,188 |
$ |
7,191,000 |
3.2 |
% |
|||||||
|
Total Senior Secured Notes |
|
$ |
202,481,805 |
$ |
172,159,889 |
76.4 |
% |
|||||||
(continued on next page)
See Accompanying Notes.
F-6
OXFORD SQUARE CAPITAL CORP.
CONSOLIDATED SCHEDULE OF INVESTMENTS — (continued)
December 31, 2020
|
COMPANY/INVESTMENT(1)(20) |
ACQUISITION DATE |
PRINCIPAL AMOUNT |
COST |
FAIR |
% of |
||||||||
|
Collateralized Loan Obligation – Equity Investments |
|
|
|
||||||||||
|
Structured Finance |
|
|
|
||||||||||
|
AMMC CLO XI, Ltd. |
|
|
|
||||||||||
|
CLO subordinated notes, estimated yield 11.32% due April 30, 2031(9)(11)(12)(18)(24) |
March 12, 2015 |
$ |
4,000,000 |
$ |
2,539,582 |
$ |
1,940,000 |
||||||
|
|
|
|
|||||||||||
|
Atlas Senior Loan Fund XI, Ltd. |
|
|
|
||||||||||
|
CLO subordinated notes, estimated yield 0.00% due July 26, 2031(9)(11)(12)(18)(24) |
April 5, 2019 |
|
5,725,000 |
|
4,141,149 |
|
2,633,500 |
||||||
|
|
|
|
|||||||||||
|
Babson CLO Ltd. 2015-I |
|
|
|
||||||||||
|
CLO subordinated notes, estimated yield 0.29% due January 20, 2031(9)(11)(12)(18) |
July 26, 2018 |
|
2,840,000 |
|
1,653,709 |
|
994,000 |
||||||
|
|
|
|
|||||||||||
|
BlueMountain CLO 2014-2 Ltd. |
|
|
|
||||||||||
|
CLO subordinated notes, estimated yield 13.38% due October 20, 2030(9)(11)(12)(18) |
April 3, 2019 |
|
6,374,000 |
|
2,833,521 |
|
1,975,940 |
||||||
|
|
|
|
|||||||||||
|
Carlyle Global Market Strategies CLO 2013-2, Ltd. |
|
|
|
||||||||||
|
CLO subordinated notes, estimated yield 9.09% due January 18, 2029(9)(11)(12)(18)(24) |
March 19, 2013 |
|
6,250,000 |
|
3,411,887 |
|
1,814,517 |
||||||
|
|
|
|
|||||||||||
|
Cedar Funding II CLO, Ltd. |
|
|
|
||||||||||
|
CLO subordinated notes, estimated yield 3.75% due June 09, 2030(9)(11)(12)(18) |
October 23, 2013 |
|
18,000,000 |
|
11,586,521 |
|
7,200,000 |
||||||
|
|
|
|
|||||||||||
|
Cedar Funding VI CLO, Ltd. |
|
|
|
||||||||||
|
CLO subordinated notes, estimated yield 0.00% due October 20, 2028(9)(11)(12)(18) |
May 15, 2017 |
|
7,700,000 |
|
6,994,901 |
|
4,620,000 |
||||||
|
|
|
|
|||||||||||
|
CIFC Funding 2014-3, Ltd. |
|
|
|
||||||||||
|
CLO subordinated notes, estimated yield 10.12% due October 22, 2031(9)(11)(12)(18)(25) |
January 24, 2017 |
|
10,000,000 |
|
5,705,502 |
|
4,100,000 |
||||||
|
|
|
|
|||||||||||
|
Madison Park Funding XVIII, Ltd. |
|
|
|
||||||||||
|
CLO subordinated notes, estimated yield 33.06% due October 21, 2030(9)(11)(12)(18)(24) |
May 22, 2020 |
|
12,500,000 |
|
5,486,110 |
|
7,125,000 |
||||||
|
|
|
|
|||||||||||
|
Madison Park Funding XIX, Ltd. |
|
|
|
||||||||||
|
CLO subordinated notes, estimated yield 13.24% due January 22, 2028(9)(11)(12)(18)(24) |
May 11, 2016 |
|
5,422,500 |
|
4,402,485 |
|
3,741,525 |
||||||
|
|
|
|
|||||||||||
|
Nassau 2019-I Ltd. |
|
|
|
||||||||||
|
CLO subordinated notes, estimated yield 13.53% due April 15, 2031(9)(11)(12)(14)(18)(24) |
April 11, 2019 |
|
23,500,000 |
|
17,716,348 |
|
11,750,000 |
||||||
|
|
|
|
|||||||||||
|
Octagon Investment Partners 37, Ltd. |
|
|
|
||||||||||
|
CLO subordinated notes, estimated yield 46.94% due July 25, 2030(9)(11)(12)(18)(24) |
May 12, 2020 |
|
3,598,540 |
|
1,639,258 |
|
2,770,876 |
||||||
|
|
|
|
|||||||||||
|
Octagon Investment Partners 45, Ltd. |
|
|
|
||||||||||
|
CLO subordinated notes, estimated yield 32.04% due October 15, 2032(9)(11)(12)(18) |
May 13, 2020 |
|
3,750,000 |
|
2,202,802 |
|
3,127,571 |
||||||
(continued on next page)
See Accompanying Notes.
F-7
OXFORD SQUARE CAPITAL CORP.
CONSOLIDATED SCHEDULE OF INVESTMENTS — (continued)
December 31, 2020
|
COMPANY/INVESTMENT(1)(20) |
ACQUISITION DATE |
PRINCIPAL AMOUNT |
COST |
FAIR |
% of |
||||||||
|
Collateralized Loan Obligation – Equity Investments – (continued) |
|
|
|
||||||||||
|
Structured Finance – (continued) |
|
|
|
||||||||||
|
Octagon Investment Partners 49, Ltd. |
|
|
|
||||||||||
|
CLO subordinated notes, estimated yield 20.25% due January 15, 2033(9)(11)(12)(14)(18) |
December 11, 2020 |
$ |
28,875,000 |
$ |
22,162,586 |
$ |
21,907,317 |
||||||
|
|
|
|
|||||||||||
|
Sound Point CLO XVI, Ltd. |
|
|
|
||||||||||
|
CLO subordinated notes, estimated yield 0.00% due July 25, 2030(9)(11)(12)(14)(18) |
August 1, 2018 |
|
45,500,000 |
|
36,012,913 |
|
18,200,000 |
||||||
|
|
|
|
|||||||||||
|
Telos CLO 2013-3, Ltd. |
|
|
|
||||||||||
|
CLO subordinated notes, estimated yield 0.00% due July 17, 2026(9)(11)(12)(18)(24) |
January 25, 2013 |
|
14,447,790 |
|
6,237,524 |
|
144,478 |
||||||
|
|
|
|
|||||||||||
|
Telos CLO 2013-4, Ltd. |
|
|
|
||||||||||
|
CLO subordinated notes, estimated yield 0.00% due January 17, 2030(9)(11)(12)(18)(24) |
May 20, 2015 |
|
11,350,000 |
|
6,775,608 |
|
1,994,913 |
||||||
|
|
|
|
|||||||||||
|
Telos CLO 2014-5, Ltd. |
|
|
|
||||||||||
|
CLO subordinated notes, estimated yield 0.00% due April 17, 2028(9)(11)(12)(18) |
April 11, 2014 |
|
28,500,000 |
|
18,179,226 |
|
285,000 |
||||||
|
|
|
|
|||||||||||
|
Venture XVII, Ltd. |
|
|
|
||||||||||
|
CLO subordinated notes, estimated yield 0.00% due April 15, 2027(9)(11)(12)(18)(24) |
January 27, 2017 |
|
6,200,000 |
|
3,511,052 |
|
568,265 |
||||||
|
|
|
|
|||||||||||
|
Venture XX, Ltd. |
|
|
|
||||||||||
|
CLO subordinated notes, estimated yield 0.00% due April 15, 2027(9)(11)(12)(18)(24) |
July 27, 2018 |
|
3,000,000 |
|
1,216,869 |
|
150,000 |
||||||
|
|
|
|
|||||||||||
|
Venture 35 CLO, Limited |
|
|
|
||||||||||
|
CLO subordinated notes, estimated yield 23.16% due October 22, 2031(9)(11)(12)(18) |
December 7, 2020 |
|
3,000,000 |
|
1,452,178 |
|
1,410,000 |
||||||
|
|
|
|
|||||||||||
|
Venture 39 CLO, Limited |
|
|
|
||||||||||
|
CLO subordinated notes, estimated yield 35.57% due April 15, 2033(9)(11)(12)(18) |
May 8, 2020 |
|
5,150,000 |
|
2,916,223 |
|
4,068,500 |
||||||
|
|
|
|
|||||||||||
|
Vibrant CLO V, Ltd. |
|
|
|
||||||||||
|
CLO subordinated notes, estimated yield 0.00% due January 20, 2029(9)(11)(12)(18) |
April 27, 2017 |
|
13,475,000 |
|
10,535,500 |
|
4,716,250 |
||||||
|
|
|
|
|||||||||||
|
West CLO 2014-1, Ltd. |
|
|
|
||||||||||
|
CLO subordinated notes, estimated yield 0.00% due July 18, 2026(9)(11)(12)(18)(24) |
May 12, 2017 |
|
9,250,000 |
|
4,870,097 |
|
1,942,500 |
||||||
|
|
|
|
|||||||||||
|
Westcott Park CLO, Ltd. |
|
|
|
||||||||||
|
CLO subordinated notes, estimated yield 27.60% due July 20, 2028(9)(11)(12)(18) |
September 16, 2020 |
|
19,000,000 |
|
8,742,550 |
|
10,070,000 |
||||||
|
|
|
|
|||||||||||
|
THL Credit Wind River 2012-1 CLO, Ltd. |
|
|
|
||||||||||
|
CLO subordinated notes, estimated yield 0.00% due January 15, 2026(9)(11)(12)(18) |
June 11, 2015 |
|
7,500,000 |
|
3,157,112 |
|
— |
||||||
(continued on next page)
See Accompanying Notes.
F-8
OXFORD SQUARE CAPITAL CORP.
CONSOLIDATED SCHEDULE OF INVESTMENTS — (continued)
December 31, 2020
|
COMPANY/INVESTMENT(1)(20) |
ACQUISITION DATE |
PRINCIPAL AMOUNT/ |
COST |
FAIR |
% of |
|||||||||
|
Collateralized Loan Obligation – Equity Investments – (continued) |
|
|
|
|
||||||||||
|
Structured Finance – (continued) |
|
|
|
|
||||||||||
|
Zais CLO 6, Ltd. |
|
|
|
|
||||||||||
|
CLO subordinated notes, estimated yield 0.00% due July 15, 2029(9)(11)(12)(18) |
May 3, 2017 |
$ |
10,500,000 |
$ |
7,381,532 |
$ |
1,890,000 |
|
||||||
|
|
|
|
|
|||||||||||
|
CLO Equity Side Letter Related Investments(11)(12)(13)(25)(26) |
|
|
1,600,801 |
|
1,373,959 |
|
||||||||
|
Total Structured Finance |
|
$ |
205,065,546 |
$ |
122,514,111 |
54.3 |
% |
|||||||
|
Total Collateralized Loan Obligation – Equity Investments |
|
$ |
205,065,546 |
$ |
122,514,111 |
54.3 |
% |
|||||||
|
|
|
|
|
|||||||||||
|
Common Stock |
|
|
|
|
||||||||||
|
IT Consulting |
|
|
|
|
||||||||||
|
Unitek Global Services, Inc. |
|
|
|
|
||||||||||
|
common equity(7)(27) |
January 13, 2015 |
|
1,244,188 |
$ |
684,960 |
$ |
— |
|
||||||
|
Total IT Consulting |
|
$ |
684,960 |
$ |
— |
0.0 |
% |
|||||||
|
Total Common Stock |
|
$ |
684,960 |
$ |
— |
0.0 |
% |
|||||||
|
|
|
|
|
|||||||||||
|
Preferred Stock |
|
|
|
|
||||||||||
|
IT Consulting |
|
|
|
|
||||||||||
|
Unitek Global Services, Inc. |
|
|
|
|
||||||||||
|
Series B Preferred Stock(3)(17)(21)(27) |
June 26, 2019 |
|
12,598,456 |
$ |
9,002,159 |
$ |
— |
|
||||||
|
Series B Senior Preferred Stock(3)(17)(22)(27) |
June 26, 2019 |
|
5,749,537 |
|
4,535,443 |
|
— |
|
||||||
|
Series B Super Senior Preferred |
June 26, 2019 |
|
3,177,649 |
|
2,614,260 |
|
— |
|
||||||
|
Total IT Consulting |
|
$ |
16,151,862 |
$ |
— |
0.0 |
% |
|||||||
|
Total Preferred Equity |
|
$ |
16,151,862 |
$ |
— |
0.0 |
% |
|||||||
|
|
|
|
|
|||||||||||
|
Total Investments in Securities(8) |
|
$ |
424,384,173 |
$ |
294,674,000 |
130.7 |
% |
|||||||
|
|
|
|
|
|||||||||||
|
Cash Equivalents |
|
|
|
|
||||||||||
|
First American Government Obligations Fund(19) |
|
$ |
59,137,284 |
$ |
59,137,284 |
|
||||||||
|
Total Cash Equivalents |
|
$ |
59,137,284 |
$ |
59,137,284 |
26.2 |
% |
|||||||
|
Total Investments in Securities and |
|
$ |
483,521,457 |
$ |
353,811,284 |
156.9 |
% |
|||||||
____________
(1) The Company generally acquires its investments in private transactions exempt from registration under the Securities Act of 1933, as amended (the “Securities Act”). These investments are generally subject to certain limitations on resale, and may be deemed to be “restricted securities” under the Securities Act.
(2) Fair value is determined in good faith by the Board of Directors of the Company.
(3) As of December 31, 2020, the portfolio includes $11,383,000 principal amount of debt investments and 21,525,642 shares of preferred stock investments which contain a PIK provision.
(4) Notes bear interest at variable rates and are subject to an interest rate floor where disclosed. The rate disclosed is as of December 31, 2020.
(5) Cost value reflects accretion of original issue discount or market discount, or amortization of premium.
(6) Cost value reflects repayment of principal.
(7) Non-income producing at the relevant period end.
(8) Aggregate gross unrealized appreciation for U.S. federal income tax purposes is $7,604,740; aggregate gross unrealized depreciation for U.S. federal income tax purposes is $146,059,439. Net unrealized depreciation is $138,454,699 based upon an estimated tax cost basis of $433,128,699 as of December 31, 2020.
(9) Cost reflects accretion of effective yield less any cash distributions received or entitled to be received from CLO equity investments.
(continued on next page)
See Accompanying Notes.
F-9
OXFORD SQUARE CAPITAL CORP.
CONSOLIDATED SCHEDULE OF INVESTMENTS — (continued)
December 31, 2020
(10) The principal balance outstanding for this debt investment, in whole or in part, is indexed to 180-day LIBOR.
(11) Indicates assets that the Company believes do not represent “qualifying assets” under Section 55(a) of the 1940 Act. Qualifying assets must represent at least 70% of the Company’s total assets at the time of acquisition of any additional non-qualifying assets. As of December 31, 2020, the Company held qualifying assets that represented 63.3% of its total assets.
(12) Investment not domiciled in the United States.
(13) Fair value represents discounted cash flows associated with fees earned from CLO equity investments.
(14) Aggregate investments represent greater than 5% of net assets.
(15) The principal balance outstanding for this debt investment, in whole or in part, is indexed to 30-day LIBOR.
(16) The principal balance outstanding for this debt investment, in whole or in part, is indexed to 90-day LIBOR.
(17) As of December 31, 2020, this debt or preferred equity investment was on non-accrual status. The aggregate fair value of these investments was approximately $4.2 million.
(18) The CLO subordinated notes and income notes are considered equity positions in CLO vehicles. Equity investments are entitled to recurring distributions which are generally equal to the remaining cash flow of the payments made by the underlying fund’s securities less contractual payments to debt holders and fund expenses. The estimated yield indicated is based on the prior quarters ending investment cost (for previously existing portfolio investments) or the original cost for those investments made during the current quarter, as well as, a current projection of the future cash flows. Such projections are periodically reviewed and adjusted, and the estimated yield may not ultimately be realized.
(19) Represents cash equivalents held in money market accounts as of December 31, 2020.
(20) The fair value of the investment was determined using significant unobservable inputs. See “Note 3. Fair Value.”
(21) The Company holds preferred stock in UniTek Global Services, Inc. that is entitled to receive cumulative preferential dividends at a rate of 13.5% per annum payable in additional shares.
(22) The Company holds preferred stock in UniTek Global Services, Inc. that is entitled to receive cumulative preferential dividends at a rate of 19.0% per annum payable in additional shares.
(23) The Company holds preferred stock in UniTek Global Services, Inc. that is entitled to receive cumulative preferential dividends at a rate of 20.0% per annum payable in additional shares.
(24) The investment is co-invested with the Company’s affiliates. See “Note 7. Related Party Transactions.”
(25) The CLO equity side letter related investments have acquisition dates from October 2013 to December 2020.
(26) Cost value reflects amortization.
(continued on next page)
See Accompanying Notes.
F-10
OXFORD SQUARE CAPITAL CORP.
CONSOLIDATED SCHEDULE OF INVESTMENTS — (continued)
December 31, 2020
(27) These investments are deemed to be an “affiliate,” as defined in the Investment Company Act of 1940 (the “1940 Act”). In general, under the 1940 Act, we would be presumed to “control” a portfolio company if we owned 25% or more of its voting securities and would be an “affiliate” of a portfolio company if we owned between 5% and 25% of its voting securities. We do not “control” any of our portfolio companies. Fair value as of December 31, 2019 and December 31, 2020 along with transactions during the year ended December 31, 2020 in these affiliated investments are as follows:
|
Name of Issuer |
Title of Issue |
Amount of |
Fair Value |
Gross |
Gross |
Net |
Fair Value |
||||||||||||||||
|
AFFILIATED INVESTMENT: |
|
|
|
|
|
|
|
||||||||||||||||
|
Unitek Global Systems, Inc. |
Common Stock |
$ |
— |
$ |
— |
$ |
— |
$ |
— |
$ |
— |
|
$ |
— |
|||||||||
|
Series B Preferred Stock |
|
— |
|
— |
|
— |
|
— |
|
— |
|
|
— |
||||||||||
|
Series B Senior Preferred Stock |
|
— |
|
620,812 |
|
— |
|
— |
|
(620,812 |
) |
|
— |
||||||||||
|
Series B Super Senior Preferred Stock |
|
— |
|
2,195,978 |
|
— |
|
— |
|
(2,195,978 |
) |
|
— |
||||||||||
|
Total Affiliated Investment |
|
— |
|
2,816,790 |
|
— |
|
— |
|
(2,816,790 |
) |
|
— |
||||||||||
|
Total Control Investment |
|
— |
|
— |
|
— |
|
— |
|
— |
|
|
— |
||||||||||
|
TOTAL CONTROL AND AFFILIATED INVESTMENTS |
$ |
— |
$ |
2,816,790 |
$ |
— |
$ |
— |
$ |
(2,816,790 |
) |
$ |
— |
||||||||||
|
____________ (a) Represents the total amount of interest or distributions credited to income for the portion of the year an investment was an affiliate investment. During the year ended December 31, 2020, these securities were on non-accrual status, due to declining performance. (b) Gross additions include increases in investments resulting from new portfolio investments, paid-in-kind interest or dividends, the amortization of discounts and fees. For the year ended December 31, 2020, a total of approximately $3.1 million of paid-in-kind dividends were entitled to be received yet deemed uncollectible. (c) Gross reductions include decreases in investments resulting from principal collections related to investment repayments or sales, the amortization of premiums and acquisition costs. |
See Accompanying Notes.
F-11
OXFORD SQUARE CAPITAL CORP.
CONSOLIDATED SCHEDULE OF INVESTMENTS
December 31, 2019
|
COMPANY/INVESTMENT(1)(20) |
ACQUISITION DATE |
PRINCIPAL AMOUNT |
COST |
FAIR VALUE(2) |
% OF |
|||||||||
|
Senior Secured Notes |
|
|
|
|
||||||||||
|
Aerospace and Defense |
|
|
|
|
||||||||||
|
Novetta, LLC |
|
|
|
|
||||||||||
|
first lien senior secured notes, 6.80% (LIBOR + 5.00%), (1.00% floor) due October 16, 2022(4)(5)(6)(15)(21) |
November 20, 2014 |
$ |
5,471,630 |
$ |
5,425,506 |
$ |
5,366,301 |
|
||||||
|
Total Aerospace and Defense |
|
$ |
5,425,506 |
$ |
5,366,301 |
2.2 |
% |
|||||||
|
|
|
|
|
|||||||||||
|
Business Services |
|
|
|
|
||||||||||
|
Access CIG, LLC |
|
|
|
|
||||||||||
|
first lien senior secured notes, 5.44% (LIBOR + 3.75%), (0.00% floor) due February 27, 2025(4)(5)(6)(14)(15)(21) |
June 12, 2018 |
$ |
491,254 |
$ |
491,254 |
$ |
490,232 |
|
||||||
|
second lien senior secured notes, 9.44% (LIBOR + 7.75%), (0.00% floor) due February 27, 2026(4)(5)(14)(15)(21) |
February 14, 2018 |
|
16,754,000 |
|
16,845,453 |
|
16,628,345 |
|
||||||
|
|
|
|
|
|||||||||||
|
Convergint Technologies, LLC |
|
|
|
|
||||||||||
|
second lien senior secured notes, 8.55% (LIBOR + 6.75%), (0.75% floor) due February 2, 2026(4)(5)(15)(21) |
January 29, 2018 |
|
1,500,000 |
|
1,493,025 |
|
1,440,000 |
|
||||||
|
|
|
|
|
|||||||||||
|
Imagine! Print Solutions |
|
|
|
|
||||||||||
|
second lien senior secured notes, 10.55% (LIBOR + 8.75%), (1.00% floor) due June 21, 2023(4)(5)(15)(17)(21) |
June 14, 2017 |
|
15,000,000 |
|
14,861,877 |
|
2,250,000 |
|
||||||
|
|
|
|
|
|||||||||||
|
OMNIA Partners |
|
|
|
|
||||||||||
|
first lien senior secured notes, 5.69% (LIBOR + 3.75%), (0.00% floor) due May 23, 2025(4)(5)(6)(14)(16)(21) |
May 17, 2018 |
|
5,910,081 |
|
5,910,627 |
|
5,910,081 |
|
||||||
|
second lien senior secured notes, 9.44% (LIBOR + 7.50%), (0.00% floor) due May 22, 2026(4)(5)(14)(16)(21) |
May 17, 2018 |
|
14,000,000 |
|
13,940,539 |
|
13,720,000 |
|
||||||
|
|
|
|
|
|||||||||||
|
Premiere Global Services, Inc. |
|
|
|
|
||||||||||
|
first lien senior secured notes, 8.40% (LIBOR + 6.50%), (1.00% floor) due June 8, 2023(4)(5)(6)(16) |
October 1, 2019 |
|
14,306,068 |
|
13,664,567 |
|
8,490,651 |
|
||||||
|
second lien senior secured notes, 0.50% Cash, 10.98% PIK (LIBOR + 9.00%) (1.00% floor) due June 6, 2024(3)(4)(5)(16)(17) |
October 1, 2019 |
|
10,232,132 |
|
9,817,795 |
|
3,581,246 |
|
||||||
|
|
|
|
|
|||||||||||
|
Verifone Systems, Inc. |
|
|
|
|
||||||||||
|
first lien senior secured notes, 5.90% (LIBOR + 4.00%), (0.00% floor) due August 20, 2025(4)(5)(6)(16)(21) |
August 9, 2018 |
|
6,930,000 |
|
6,900,223 |
|
6,826,050 |
|
||||||
|
Total Business Services |
|
$ |
83,925,360 |
$ |
59,336,605 |
23.9 |
% |
|||||||
|
|
|
|
|
|||||||||||
|
Diversified Insurance |
|
|
|
|
||||||||||
|
AmeriLife Group LLC |
|
|
|
|
||||||||||
|
second lien senior secured notes, 10.80% (LIBOR + 9.00%), (0.00% floor) due June 11, 2027(4)(5)(6)(15) |
March 18, 2020 |
$ |
10,000,000 |
$ |
9,900,692 |
$ |
9,925,000 |
|
||||||
|
Total Diversified Insurance |
|
$ |
9,900,692 |
$ |
9,925,000 |
4.0 |
% |
|||||||
(continued on next page)
See Accompanying Notes.
F-12
OXFORD SQUARE CAPITAL CORP.
CONSOLIDATED SCHEDULE OF INVESTMENTS — (continued)
December 31, 2019
|
COMPANY/INVESTMENT(1)(20) |
ACQUISITION DATE |
PRINCIPAL AMOUNT |
COST |
FAIR VALUE(2) |
% OF |
|||||||||
|
Senior Secured Notes – (continued) |
|
|
|
|
||||||||||
|
Education |
|
|
|
|
||||||||||
|
Edmentum, Inc. (f/k/a Plato, Inc.) |
|
|
|
|
||||||||||
|
first lien senior secured notes, 6.43% (LIBOR + 4.50%), (1.00% floor) Cash, 4.00% PIK due June 9, 2021(3)(4)(5)(6)(16) |
April 25, 2013 |
$ |
6,080,350 |
$ |
6,054,371 |
$ |
5,593,922 |
|
||||||
|
Total Education |
|
$ |
6,054,371 |
$ |
5,593,922 |
2.3 |
% |
|||||||
|
|
|
|
|
|||||||||||
|
Financial Intermediaries |
|
|
|
|
||||||||||
|
First American Payment Systems |
|
|
|
|
||||||||||
|
second lien senior secured notes, 12.56% (LIBOR + 10.50%), (1.00% floor) due July 5, 2024(4)(5)(16)(21) |
January 3, 2017 |
$ |
1,500,000 |
$ |
1,468,914 |
$ |
1,470,000 |
|
||||||
|
|
|
|
|
|||||||||||
|
Shift4 Payments, LLC (f/k/a Lighthouse Network, LLC) |
|
|
|
|
||||||||||
|
first lien senior secured notes, 6.43% (LIBOR + 4.50%), (1.00% floor) due November 30, 2024(4)(5)(6)(14)(16)(21) |
November 20, 2017 |
|
3,430,000 |
|
3,417,872 |
|
3,438,575 |
|
||||||
|
second lien senior secured notes, 10.43% (LIBOR + 8.50%), (1.00% floor) due November 30, 2025(4)(5)(14)(16)(21) |
November 20, 2017 |
|
16,490,000 |
|
16,353,183 |
|
16,242,650 |
|
||||||
|
Total Financial Intermediaries |
|
$ |
21,239,969 |
$ |
21,151,225 |
8.5 |
% |
|||||||
|
|
|
|
|
|||||||||||
|
Healthcare |
|
|
|
|
||||||||||
|
Keystone Acquisition Corp. |
|
|
|
|
||||||||||
|
first lien senior secured notes, 7.19% (LIBOR + 5.25%), (1.00% floor) due May 1, 2024(4)(5)(6)(14)(16)(21) |
May 10, 2017 |
$ |
7,457,869 |
$ |
7,430,191 |
$ |
7,271,422 |
|
||||||
|
second lien senior secured notes, 11.19% (LIBOR + 9.25%), (1.00% floor) due May 1, 2025(4)(5)(14)(16)(21) |
May 10, 2017 |
|
13,000,000 |
|
12,868,879 |
|
12,610,000 |
|
||||||
|
Viant Medical Holdings, Inc. |
|
|
|
|
||||||||||
|
first lien senior secured notes, 5.69% (LIBOR + 3.75%), (0.00% floor) due July 2, 2025(4)(5)(6)(14)(16)(21) |
June 26, 2018 |
|
9,875,000 |
|
9,873,395 |
|
9,677,500 |
|
||||||
|
second lien senior secured notes, 9.69% (LIBOR + 7.75%), (0.00% floor) due July 2, 2026(4)(5)(14)(16)(21) |
June 26, 2018 |
|
5,000,000 |
|
4,955,602 |
|
4,725,000 |
|
||||||
|
|
|
|
|
|||||||||||
|
Healthport Technologies, LLC |
|
|
|
|
||||||||||
|
first lien senior secured notes, 6.05% (LIBOR + 4.25%), (1.00% floor) due December 1, 2021(4)(5)(6)(14)(15) |
April 12, 2019 |
|
16,597,888 |
|
14,964,163 |
|
15,618,613 |
|
||||||
|
|
|
|
|
|||||||||||
|
HealthChannels, Inc. (f/k/a ScribeAmerica, LLC) |
|
|
|
|
||||||||||
|
first lien senior secured notes, 6.24% (LIBOR + 4.50%), (0.00% floor) due April 3, 2025(4)(5)(6)(15) |
October 31, 2018 |
|
9,861,904 |
|
9,800,587 |
|
9,664,666 |
|
||||||
|
Total Healthcare |
|
$ |
59,892,817 |
$ |
59,567,201 |
24.0 |
% |
|||||||
(continued on next page)
See Accompanying Notes.
F-13
OXFORD SQUARE CAPITAL CORP.
CONSOLIDATED SCHEDULE OF INVESTMENTS — (continued)
December 31, 2019
|
COMPANY/INVESTMENT(1)(20) |
ACQUISITION DATE |
PRINCIPAL AMOUNT |
COST |
FAIR VALUE(2) |
% OF |
|||||||||
|
Senior Secured Notes – (continued) |
|
|
|
|
||||||||||
|
Logistics |
|
|
|
|
||||||||||
|
Capstone Logistics Acquisition, Inc. |
|
|
|
|
||||||||||
|
first lien senior secured notes, 6.30% (LIBOR + 4.50%), (1.00% floor) due October 7, 2021(4)(5)(6)(14)(15)(21) |
October 3, 2014 |
$ |
12,917,066 |
$ |
12,902,501 |
$ |
12,650,716 |
|
||||||
|
Total Logistics |
|
$ |
12,902,501 |
$ |
12,650,716 |
5.1 |
% |
|||||||
|
|
|
|
|
|||||||||||
|
Software |
|
|
|
|
||||||||||
|
ECI Software Solutions, Inc. |
|
|
|
|
||||||||||
|
first lien senior secured notes, 6.19% (LIBOR + 4.25%), (1.00% floor) due September 27, 2024(4)(5)(6)(14)(16)(21) |
June 28, 2018 |
$ |
4,912,060 |
$ |
4,923,674 |
$ |
4,903,464 |
|
||||||
|
second lien senior secured notes, 9.94% (LIBOR + 8.00%), (1.00% floor) due September 29, 2025(4)(5)(14)(16)(21) |
September 19, 2017 |
|
15,000,000 |
|
14,916,392 |
|
14,762,550 |
|
||||||
|
|
|
|
|
|||||||||||
|
Quest Software, Inc. |
|
|
|
|
||||||||||
|
first lien senior secured notes, 6.18% (LIBOR + 4.25%), (0.00% floor) due May 16, 2025(4)(5)(6)(14)(16)(21) |
May 17, 2018 |
|
5,940,000 |
|
5,914,552 |
|
5,917,725 |
|
||||||
|
second lien senior secured notes, 10.18% (LIBOR + 8.25%), (0.00% floor) due May 18, 2026(4)(5)(14)(16)(21) |
May 17, 2018 |
|
15,000,000 |
|
14,865,400 |
|
14,647,500 |
|
||||||
|
Total Software |
|
$ |
40,620,018 |
$ |
40,231,239 |
16.2 |
% |
|||||||
|
|
|
|
|
|||||||||||
|
Telecommunications Services |
|
|
|
|
||||||||||
|
Global Tel Link Corp. |
|
|
|
|
||||||||||
|
second lien senior secured notes, 10.05% (LIBOR + 8.25%), (0.00% floor) due November 29, 2026(4)(5)(14)(15) |
November 20, 2018 |
$ |
17,000,000 |
$ |
16,722,360 |
$ |
14,486,380 |
|
||||||
|
Total Telecommunication Services |
|
$ |
16,722,360 |
$ |
14,486,380 |
5.8 |
% |
|||||||
|
|
|
|
|
|||||||||||
|
Utilities |
|
|
|
|
||||||||||
|
CLEAResult Consulting, Inc. |
|
|
|
|
||||||||||
|
first lien senior secured notes, 5.19% (LIBOR + 3.50%), (0.00% floor) due August 8, 2025(4)(5)(6)(15)(21) |
August 2, 2018 |
$ |
4,937,500 |
$ |
4,916,396 |
$ |
4,875,781 |
|
||||||
|
second lien senior secured notes, 8.99% (LIBOR + 7.25%), (0.00% floor) due August 10, 2026(4)(5)(15)(21) |
August 3, 2018 |
|
7,650,000 |
|
7,673,313 |
|
7,363,125 |
|
||||||
|
Total Utilities |
|
$ |
12,589,709 |
$ |
12,238,906 |
4.9 |
% |
|||||||
|
Total Senior Secured Notes |
|
$ |
269,273,303 |
$ |
240,547,495 |
97.0 |
% |
|||||||
|
|
|
|
|
|||||||||||
|
Collateralized Loan Obligation – Debt Investments |
|
|
|
|
||||||||||
|
Structured Finance |
|
|
|
|
||||||||||
|
Galaxy XXVIII CLO, Ltd. |
|
|
|
|
||||||||||
|
CLO secured class F notes, 10.48% (LIBOR + 8.48%), due July 15, 2031(4)(5)(11)(12)(16) |
June 29, 2018 |
$ |
1,000,000 |
$ |
933,437 |
$ |
840,600 |
|
||||||
|
Total Structured Finance |
|
$ |
933,437 |
$ |
840,600 |
0.3 |
% |
|||||||
|
Total Collateralized Loan Obligation – Debt Investments |
|
$ |
933,437 |
$ |
840,600 |
0.3 |
% |
|||||||
(continued on next page)
See Accompanying Notes.
F-14
OXFORD SQUARE CAPITAL CORP.
CONSOLIDATED SCHEDULE OF INVESTMENTS — (continued)
December 31, 2019
|
COMPANY/INVESTMENT(1)(20) |
ACQUISITION DATE |
PRINCIPAL AMOUNT |
COST |
FAIR VALUE(2) |
% OF |
||||||||
|
Collateralized Loan Obligation – Equity Investments |
|
|
|
||||||||||
|
Structured Finance |
|
|
|
||||||||||
|
AMMC CLO XI, Ltd. |
|
|
|
||||||||||
|
CLO subordinated notes, estimated yield 12.29% due April 30, 2031(9)(11)(12)(18)(26) |
March 12, 2015 |
$ |
6,000,000 |
$ |
3,796,477 |
$ |
2,760,000 |
||||||
|
|
|
|
|||||||||||
|
AMMC CLO XII, Ltd. |
|
|
|
||||||||||
|
CLO subordinated notes, estimated yield 9.24% due November 10, 2030(9)(11)(12)(18)(26) |
March 13, 2013 |
|
12,921,429 |
|
7,175,569 |
|
4,393,286 |
||||||
|
|
|
|
|||||||||||
|
Atlas Senior Loan Fund XI, Ltd. |
|
|
|
||||||||||
|
CLO subordinated notes, estimated yield 17.73% due July 26, 2031(9)(11)(12)(18)(26) |
April 5, 2019 |
|
5,725,000 |
|
4,319,023 |
|
3,449,313 |
||||||
|
|
|
|
|||||||||||
|
Babson CLO Ltd. 2015-I |
|
|
|
||||||||||
|
CLO subordinated notes, estimated yield 4.93% due January 20, 2031(9)(11)(12)(18) |
July 26, 2018 |
|
2,840,000 |
|
1,766,500 |
|
1,050,800 |
||||||
|
|
|
|
|||||||||||
|
BlueMountain CLO 2014-2 Ltd. |
|
|
|
||||||||||
|
CLO subordinated notes, estimated yield 23.58% due October 20, 2030(9)(11)(12)(18) |
April 3, 2019 |
|
6,374,000 |
|
2,612,626 |
|
2,294,640 |
||||||
|
|
|
|
|||||||||||
|
Carlyle Global Market Strategies CLO 2013-2, Ltd. |
|
|
|
||||||||||
|
CLO subordinated notes, estimated yield 13.61% due January 18, 2029(9)(11)(12)(18)(26) |
March 19, 2013 |
|
6,250,000 |
|
3,748,818 |
|
2,728,621 |
||||||
|
|
|
|
|||||||||||
|
Cedar Funding II CLO, Ltd. |
|
|
|
||||||||||
|
CLO subordinated notes, estimated yield 11.39% due June 9, 2030(9)(11)(12)(18) |
October 23, 2013 |
|
18,000,000 |
|
12,940,261 |
|
9,360,000 |
||||||
|
|
|
|
|||||||||||
|
Cedar Funding VI CLO, Ltd. |
|
|
|
||||||||||
|
CLO subordinated notes, estimated yield 14.47% due October 20, 2028(9)(11)(12)(18) |
May 15, 2017 |
|
7,700,000 |
|
7,363,155 |
|
5,698,000 |
||||||
|
|
|
|
|||||||||||
|
CIFC Funding 2014-3, Ltd. |
|
|
|
||||||||||
|
CLO subordinated notes, estimated yield 14.53% due October 22, 2031(9)(11)(12)(18)(26) |
January 24, 2017 |
|
10,000,000 |
|
6,182,026 |
|
4,400,000 |
||||||
|
|
|
|
|||||||||||
|
Galaxy XXVIII CLO, Ltd. |
|
|
|
||||||||||
|
CLO subordinated notes, estimated yield 11.28% due July 15, 2031(9)(11)(12)(18) |
July 25, 2017 |
|
2,000,000 |
|
962,017 |
|
648,665 |
||||||
|
|
|
|
|||||||||||
|
Hull Street CLO Ltd. |
|
|
|
||||||||||
|
CLO subordinated notes, estimated yield -21.46% due October 18, 2026(9)(11)(12)(18)(26) |
October 17, 2014 |
|
5,000,000 |
|
1,049,476 |
|
100,000 |
||||||
|
|
|
|
|||||||||||
|
Ivy Hill Middle Market Credit Fund VII, Ltd. |
|
|
|
||||||||||
|
CLO subordinated notes, estimated yield 7.34% due October 20, 2029(9)(11)(12)(18)(26) |
October 3, 2013 |
|
10,800,000 |
|
8,659,115 |
|
5,936,641 |
||||||
|
|
|
|
|||||||||||
|
Madison Park Funding XIX, Ltd. |
|
|
|
||||||||||
|
CLO subordinated notes, estimated yield 9.67% due January 22, 2028(9)(11)(12)(18)(26) |
May 11, 2016 |
|
5,422,500 |
|
4,999,739 |
|
3,904,200 |
||||||
|
|
|
|
|||||||||||
|
Nassau 2019-I Ltd. |
|
|
|
||||||||||
|
CLO subordinated notes, estimated yield 24.71% due April 15, 2031(9)(11)(12)(14)(18)(26) |
April 11, 2019 |
|
23,500,000 |
|
19,265,413 |
|
16,450,000 |
||||||
(continued on next page)
See Accompanying Notes.
F-15
OXFORD SQUARE CAPITAL CORP.
CONSOLIDATED SCHEDULE OF INVESTMENTS — (continued)
December 31, 2019
|
COMPANY/INVESTMENT(1)(20) |
ACQUISITION DATE |
PRINCIPAL AMOUNT |
COST |
FAIR |
% OF |
|||||||||
|
Collateralized Loan Obligation – Equity Investments – (continued) |
|
|
|
|
||||||||||
|
Structured Finance – (continued) |
|
|
|
|
||||||||||
|
Octagon Investment Partners 38, Ltd. |
|
|
|
|
||||||||||
|
CLO subordinated notes, estimated yield 14.27% due July 20, 2030(9)(11)(12)(18)(26) |
July 12, 2018 |
$ |
5,000,000 |
$ |
4,174,948 |
$ |
3,500,000 |
|
||||||
|
|
|
|
|
|||||||||||
|
Regatta XV Funding, Ltd. |
|
|
|
|
||||||||||
|
CLO subordinated notes, estimated yield 0.00% due October 25, 2026(9)(10)(11)(12)(18) |
October 19, 2016 |
|
3,000,000 |
|
— |
|
75,000 |
|
||||||
|
|
|
|
|
|||||||||||
|
Sound Point CLO XVI, Ltd. |
|
|
|
|
||||||||||
|
CLO subordinated notes, estimated yield 8.86% due July 25, 2030(9)(11)(12)(14)(18) |
August 1, 2018 |
|
45,500,000 |
|
41,750,653 |
|
23,660,000 |
|
||||||
|
|
|
|
|
|||||||||||
|
Telos CLO 2013-3, Ltd. |
|
|
|
|
||||||||||
|
CLO subordinated notes, estimated yield -4.23% due July 17, 2026(9)(11)(12)(18)(26) |
January 25, 2013 |
|
14,447,790 |
|
6,575,881 |
|
2,022,691 |
|
||||||
|
|
|
|
|
|||||||||||
|
Telos CLO 2013-4, Ltd. |
|
|
|
|
||||||||||
|
CLO subordinated notes, estimated yield 17.00% due January 17, 2030(9)(11)(12)(18)(26) |
May 20, 2015 |
|
11,350,000 |
|
7,018,355 |
|
3,110,420 |
|
||||||
|
|
|
|
|
|||||||||||
|
Telos CLO 2014-5, Ltd. |
|
|
|
|
||||||||||
|
CLO subordinated notes, estimated yield 17.92% due April 17, 2028(9)(11)(12)(18) |
April 11, 2014 |
|
28,500,000 |
|
17,600,832 |
|
6,575,476 |
|
||||||
|
|
|
|
|
|||||||||||
|
Venture XIV, Ltd. |
|
|
|
|
||||||||||
|
CLO subordinated notes, estimated yield 4.94% due August 28, 2029(9)(11)(12)(18)(26) |
January 12, 2017 |
|
2,500,000 |
|
1,452,738 |
|
450,000 |
|
||||||
|
|
|
|
|
|||||||||||
|
Venture XVII, Ltd. |
|
|
|
|
||||||||||
|
CLO subordinated notes, estimated yield 11.53% due April 15, 2027(9)(11)(12)(18)(26) |
January 27, 2017 |
|
6,200,000 |
|
3,614,197 |
|
1,514,369 |
|
||||||
|
|
|
|
|
|||||||||||
|
Venture XX, Ltd. |
|
|
|
|
||||||||||
|
CLO subordinated notes, estimated yield -53.93% due April 15, 2027(9)(11)(12)(18)(26) |
July 27, 2018 |
|
3,000,000 |
|
1,347,763 |
|
930,000 |
|
||||||
|
|
|
|
|
|||||||||||
|
Vibrant CLO V, Ltd. |
|
|
|
|
||||||||||
|
CLO subordinated notes, estimated yield 3.90% due January 20, 2029(9)(11)(12)(18) |
April 27, 2017 |
|
13,475,000 |
|
11,197,902 |
|
6,198,500 |
|
||||||
|
|
|
|
|
|||||||||||
|
West CLO 2014-1, Ltd. |
|
|
|
|
||||||||||
|
CLO subordinated notes, estimated yield -0.01% due July 18, 2026(9)(11)(12)(18)(26) |
May 12, 2017 |
|
9,250,000 |
|
5,435,293 |
|
3,330,000 |
|
||||||
|
|
|
|
|
|||||||||||
|
Windriver 2012-1 CLO, Ltd. |
|
|
|
|
||||||||||
|
CLO subordinated notes, estimated yield 6.73% due January 15, 2026(9)(11)(12)(18) |
June 11, 2015 |
|
7,500,000 |
|
3,571,607 |
|
959,980 |
|
||||||
|
|
|
|
|
|||||||||||
|
Zais CLO 6, Ltd. |
|
|
|
|
||||||||||
|
CLO subordinated notes, estimated yield 13.15% due July 15, 2029(9)(11)(12)(18) |
May 3, 2017 |
|
10,500,000 |
|
7,663,559 |
|
3,780,001 |
|
||||||
|
|
|
|
|
|||||||||||
|
CLO Equity Side Letter Related Investments(11)(12)(13) |
|
|
1,378,224 |
|
1,316,505 |
|
||||||||
|
Total Structured Finance |
|
$ |
197,622,167 |
$ |
120,597,108 |
48.6 |
% |
|||||||
|
Total Collateralized Loan Obligation – Equity Investments |
|
$ |
197,622,167 |
$ |
120,597,108 |
48.6 |
% |
|||||||
(continued on next page)
See Accompanying Notes.
F-16
OXFORD SQUARE CAPITAL CORP.
CONSOLIDATED SCHEDULE OF INVESTMENTS — (continued)
December 31, 2019
|
COMPANY/INVESTMENT(1)(20) |
ACQUISITION DATE |
PRINCIPAL AMOUNT/ |
COST |
FAIR |
% OF |
||||||||
|
Common Stock |
|
|
|
||||||||||
|
IT Consulting |
|
|
|
||||||||||
|
Unitek Global Services, Inc. |
|
|
|
||||||||||
|
common equity(7) |
January 13, 2015 |
1,244,188 |
$ |
684,960 |
$ |
— |
|
||||||
|
Total IT Consulting |
$ |
684,960 |
$ |
— |
0.0 |
% |
|||||||
|
Total Common Stock |
$ |
684,960 |
$ |
— |
0.0 |
% |
|||||||
|
|
|
|
|||||||||||
|
Preferred Stock |
|
|
|
||||||||||
|
IT Consulting |
|
|
|
||||||||||
|
Unitek Global Services, Inc. |
|
|
|
||||||||||
|
Series B Preferred Stock(3)(22)(25) |
June 26, 2019 |
11,032,025 |
$ |
9,002,159 |
$ |
— |
|
||||||
|
Series B Senior Preferred Stock(3)(23)(25) |
June 26, 2019 |
4,775,477 |
|
4,535,443 |
|
620,812 |
|
||||||
|
Series B Super Senior Preferred Stock(3)(24)(25) |
June 26, 2019 |
2,614,260 |
|
2,614,260 |
|
2,195,978 |
|
||||||
|
Total IT Consulting |
$ |
16,151,862 |
$ |
2,816,790 |
1.1 |
% |
|||||||
|
Total Preferred Equity |
$ |
16,151,862 |
$ |
2,816,790 |
1.1 |
% |
|||||||
|
Total Investments in Securities(8) |
$ |
484,665,729 |
$ |
364,801,993 |
147.0 |
% |
|||||||
|
|
|
|
|||||||||||
|
Cash Equivalents |
|
|
|
||||||||||
|
First American Government Obligations Fund(19) |
$ |
14,410,486 |
$ |
14,410,486 |
|
||||||||
|
Total Cash Equivalents |
$ |
14,410,486 |
$ |
14,410,486 |
5.8 |
% |
|||||||
|
Total Investments in Securities and Cash Equivalents |
$ |
499,076,215 |
$ |
379,212,479 |
152.8 |
% |
|||||||
____________
(1) The Company generally acquires its investments in private transactions exempt from registration under the Securities Act of 1933, as amended (the “Securities Act”). Unless otherwise noted, all of the Company’s investments are deemed to be “restricted securities” under the Securities Act.
(2) Fair value is determined in good faith by the Board of Directors of the Company.
(3) As of December 31, 2019, the portfolio includes $16,312,482 principal amount of debt investments and 18,421,762 shares of preferred stock investments which contain a PIK provision.
(4) Notes bear interest at variable rates and are subject to an interest rate floor where disclosed. The rate disclosed is as of December 31, 2019.
(5) Cost value reflects accretion of original issue discount or market discount, or amortization of premium.
(6) Cost value reflects repayment of principal.
(7) Non-income producing at the relevant period end.
(8) Aggregate gross unrealized appreciation for U.S. federal income tax purposes is $754,844; aggregate gross unrealized depreciation for U.S. federal income tax purposes is $135,892,337. Net unrealized depreciation is $135,137,493 based upon a tax cost basis of $499,939,486.
(9) Cost reflects accretion of effective yield less any cash distributions received or entitled to be received from CLO equity investments.
(10) This investment represents our percent ownership in certain equity securities transferred to OXSQ upon the redemption of this investment on October 25, 2018.
(11) Indicates assets that the Company believes do not represent “qualifying assets” under Section 55(a) of the 1940 Act. Qualifying assets must represent at least 70% of the Company’s total assets at the time of acquisition of any additional non-qualifying assets. As of December 31, 2019, the Company held qualifying assets that represented 68.4% of its total assets.
(12) Investment not domiciled in the United States.
(13) Fair value represents discounted cash flows associated with fees earned from CLO equity investments.
(14) Aggregate investments represent greater than 5% of net assets.
(15) The principal balance outstanding for this debt investment, in whole or in part, is indexed to 30-day LIBOR.
(16) The principal balance outstanding for this debt investment, in whole or in part, is indexed to 90-day LIBOR.
(17) As of December 31, 2019, this debt investment was on non-accrual status. The aggregate fair value of these investments was approximately $5.8 million.
(continued on next page)
See Accompanying Notes.
F-17
OXFORD SQUARE CAPITAL CORP.
CONSOLIDATED SCHEDULE OF INVESTMENTS — (continued)
December 31, 2019
(18) The CLO subordinated notes and income notes are considered equity positions in CLO vehicles. Equity investments are entitled to recurring distributions which are generally equal to the remaining cash flow of the payments made by the underlying fund’s securities less contractual payments to debt holders and fund expenses. The estimated yield indicated is based on the prior quarter’s ending investment cost (for previously existing portfolio investments) or the original cost for those investments made during the current quarter, as well as a current projection of the future cash flows. Such projections are periodically reviewed and adjusted, and the estimated yield may not ultimately be realized.
(19) Represents cash equivalents held in money market accounts as of December 31, 2019.
(20) The fair value of the investment was determined using significant unobservable inputs. See “Note 3. Fair Value.”
(21) All or a portion of this investment represents collateral under the Credit Facility.
(22) The Company holds preferred stock in UniTek Global Services, Inc. that is entitled to receive cumulative preferential dividends at a rate of 13.5% per annum payable in additional shares.
(23) The Company holds preferred stock in UniTek Global Services, Inc. that is entitled to receive cumulative preferential dividends at a rate of 19.0% per annum payable in additional shares.
(24) The Company holds preferred stock in UniTek Global Services, Inc. that is entitled to receive cumulative preferential dividends at a rate of 20.0% per annum payable in additional shares.
(25) Effective June 26, 2019, the Company entered into an Exchange Agreement with UniTek Global Services, Inc. (the “Exchange Agreement”), to receive 2,371,211 shares of Series B Super Senior Preferred Stock, 4,352,199 shares of Series B Senior Preferred Stock and 10,323,434 shares of Series B Preferred Stock (collectively, “Preferred Stock”) in exchange for all Series A shares of each respective Preferred Stock tranche that was held by OXSQ. This exchange resulted in the capitalization of approximately $6.3 million of cumulative PIK dividends which are added to the cost basis of each respective Preferred Stock tranche. This amount is recognized as dividend income — non-cash in the consolidated statement of operations.
(26) The investment is co-invested with the Company’s affiliates. See “Note 7. Related Party Transactions.”
(27) These investments are deemed to be an “affiliate,” as defined in the Investment Company Act of 1940 (the “1940 Act”). In general, under the 1940 Act, we would be presumed to “control” a portfolio company if we owned more than 25% of its voting securities and would be an “affiliate” of a portfolio company if we owned between 5% and 25% of its voting securities. We do not “control” any of our portfolio companies. Fair value as of December 31, 2019 and December 31, 2018 along with transactions during the year ended December 31, 2019 in these affiliated investments are as follows:
|
Name of Issuer |
Title of Issue |
Amount of |
Fair Value |
Gross |
Gross |
Net |
Fair Value |
||||||||||||||||
|
AFFILIATED INVESTMENTS: |
|
|
|
|
|
|
|
||||||||||||||||
|
Unitek Global Systems, Inc. |
Common Stock |
$ |
— |
$ |
149,303 |
$ |
— |
$ |
— |
$ |
(149,303 |
) |
$ |
— |
|||||||||
|
Series B Preferred Stock |
|
5,325,159 |
|
8,217,887 |
|
5,325,159 |
|
— |
|
(13,543,046 |
) |
|
— |
||||||||||
|
Series B Senior Preferred Stock |
|
1,773,022 |
|
3,963,240 |
|
1,773,022 |
|
— |
|
(5,115,450 |
) |
|
620,812 |
||||||||||
|
Series B Super Senior Preferred Stock |
|
612,624 |
|
2,161,767 |
|
612,624 |
|
— |
|
(578,413 |
) |
|
2,195,978 |
||||||||||
|
Total Affiliated Investments |
|
7,710,805 |
|
14,492,197 |
|
7,710,805 |
|
— |
|
(19,386,212 |
) |
|
2,816,790 |
||||||||||
|
Total Control Investments |
|
— |
|
— |
|
— |
|
— |
|
— |
|
|
— |
||||||||||
|
TOTAL CONTROL AND AFFILIATED INVESTMENTS |
$ |
7,710,805 |
$ |
14,492,197 |
$ |
7,710,805 |
$ |
— |
$ |
(19,386,212 |
) |
$ |
2,816,790 |
||||||||||
|
____________ (a) Represents the total amount of interest or distributions credited to income for the portion of the year an investment was an affiliate investment. (b) Gross additions include increases in investments resulting from new portfolio investments, paid-in-kind interest or dividends, the amortization of discounts and fees. (c) Gross reductions include decreases in investments resulting from principal collections related to investment repayments or sales, the amortization of premiums and acquisition costs. |
See Accompanying Notes.
F-18
OXFORD SQUARE CAPITAL CORP.
CONSOLIDATED STATEMENTS OF OPERATIONS
|
Year Ended |
Year Ended |
Year Ended |
||||||||||
|
INVESTMENT INCOME |
|
|
|
|
|
|
||||||
|
From non-affiliated/non-control investments: |
|
|
|
|
|
|
||||||
|
Interest income – debt investments |
$ |
20,252,055 |
|
$ |
28,000,283 |
|
$ |
25,183,547 |
|
|||
|
Income from securitization vehicles and investments |
|
15,014,000 |
|
|
25,244,866 |
|
|
27,837,032 |
|
|||
|
Other income |
|
676,450 |
|
|
1,694,434 |
|
|
2,984,773 |
|
|||
|
Total investment income from non-affiliated/non-control investments |
|
35,942,505 |
|
|
54,939,583 |
|
|
56,005,352 |
|
|||
|
From affiliated investments: |
|
|
|
|
|
|
||||||
|
Dividend income – non-cash |
|
— |
|
|
7,710,805 |
|
|
— |
|
|||
|
Interest income – debt investments |
|
— |
|
|
— |
|
|
271,916 |
|
|||
|
Total investment income from affiliated investments |
|
— |
|
|
7,710,805 |
|
|
271,916 |
|
|||
|
Total investment income |
|
35,942,505 |
|
|
62,650,388 |
|
|
56,277,268 |
|
|||
|
EXPENSES |
|
|
|
|
|
|
||||||
|
Interest expense |
|
7,878,906 |
|
|
9,901,426 |
|
|
7,181,009 |
|
|||
|
Base Fee |
|
4,525,034 |
|
|
6,704,467 |
|
|
7,309,435 |
|
|||
|
Professional fees |
|
1,545,279 |
|
|
1,454,942 |
|
|
1,227,296 |
|
|||
|
Compensation expense |
|
708,350 |
|
|
832,256 |
|
|
907,995 |
|
|||
|
Director’s fees |
|
441,500 |
|
|
417,500 |
|
|
441,501 |
|
|||
|
Insurance |
|
330,746 |
|
|
281,146 |
|
|
247,178 |
|
|||
|
Transfer agent and custodian fees |
|
206,686 |
|
|
239,323 |
|
|
227,381 |
|
|||
|
General and administrative |
|
591,512 |
|
|
829,476 |
|
|
644,104 |
|
|||
|
Total expenses before incentive fees |
|
16,228,013 |
|
|
20,660,536 |
|
|
18,185,899 |
|
|||
|
Net investment income incentive fees |
|
— |
|
|
3,511,493 |
|
|
4,585,151 |
|
|||
|
Capital gains incentive fees |
|
— |
|
|
— |
|
|
— |
|
|||
|
Total incentive fees |
|
— |
|
|
3,511,493 |
|
|
4,585,151 |
|
|||
|
Total expenses |
|
16,228,013 |
|
|
24,172,029 |
|
|
22,771,050 |
|
|||
|
Net investment income |
|
19,714,492 |
|
|
38,478,359 |
|
|
33,506,218 |
|
|||
|
Net change in unrealized appreciation/depreciation on investments |
|
|
|
|
|
|
||||||
|
Non-Affiliate/non-control investments |
|
(7,029,647 |
) |
|
(50,107,582 |
) |
|
(36,969,481 |
) |
|||
|
Affiliated investments |
|
(2,816,790 |
) |
|
(19,386,212 |
) |
|
(2,323,867 |
) |
|||
|
Total net change in unrealized appreciation/depreciation on investments |
|
(9,846,437 |
) |
|
(69,493,794 |
) |
|
(39,293,348 |
) |
|||
|
Net realized (losses)/gains |
|
|
|
|
|
|
||||||
|
Non-Affiliated/non-control investments |
|
(8,151,553 |
) |
|
(1,709,816 |
) |
|
(3,370,732 |
) |
|||
|
Affiliated investments |
|
— |
|
|
— |
|
|
5,241 |
|
|||
|
Extinguishment of debt |
|
(5,211 |
) |
|
(72,666 |
) |
|
(60,752 |
) |
|||
|
Total net realized losses |
|
(8,156,764 |
) |
|
(1,782,482 |
) |
|
(3,426,243 |
) |
|||
|
Net increase/(decrease) in net assets resulting from operations |
$ |
1,711,291 |
|
$ |
(32,797,917 |
) |
$ |
(9,213,373 |
) |
|||
(continued on next page)
See Accompanying Notes.
F-19
OXFORD SQUARE CAPITAL CORP.
CONSOLIDATED STATEMENTS OF OPERATIONS — (continued)
|
Year Ended |
Year Ended |
Year Ended |
|||||||||
|
Net increase in net assets resulting from net investment income per common share: |
|
|
|
|
|
||||||
|
Basic and Diluted |
$ |
0.40 |
$ |
0.81 |
|
$ |
0.67 |
|
|||
|
Net increase/(decrease) in net assets resulting from operations per common share: |
|
|
|
|
|
||||||
|
Basic and Diluted |
$ |
0.03 |
$ |
(0.69 |
) |
$ |
(0.19 |
) |
|||
|
Weighted average shares of common stock outstanding: |
|
|
|
|
|
||||||
|
Basic and Diluted |
|
49,477,215 |
|
47,756,596 |
|
|
49,662,157 |
|
|||
See Accompanying Notes.
F-20
OXFORD SQUARE CAPITAL CORP.
CONSOLIDATED STATEMENTS OF CHANGES IN NET ASSETS
|
Year Ended |
Year Ended |
Year Ended |
||||||||||
|
Increase/(decrease) in net assets from operations: |
|
|
|
|
|
|
||||||
|
Net investment income |
$ |
19,714,492 |
|
$ |
38,478,359 |
|
$ |
33,506,218 |
|
|||
|
Net realized losses |
|
(8,156,764 |
) |
|
(1,782,482 |
) |
|
(3,426,243 |
) |
|||
|
Net change in unrealized appreciation/depreciation on investments |
|
(9,846,437 |
) |
|
(69,493,794 |
) |
|
(39,293,348 |
) |
|||
|
Net increase/(decrease) in net assets resulting from operations |
|
1,711,291 |
|
|
(32,797,917 |
) |
|
(9,213,373 |
) |
|||
|
Distributions to stockholders |
|
|
|
|
|
|
||||||
|
Distributions from net investment income |
|
(30,265,733 |
) |
|
(38,364,085 |
) |
|
(36,151,218 |
) |
|||
|
Tax return of capital distributions |
|
— |
|
|
— |
|
|
(3,329,807 |
) |
|||
|
Total distributions to stockholders |
|
(30,265,733 |
) |
|
(38,364,085 |
) |
|
(39,481,025 |
) |
|||
|
|
|
|
|
|
|
|||||||
|
Capital share transactions: |
|
|
|
|
|
|
||||||
|
Issuance of common stock (net of underwriting fees and offering costs of $51,779, $131,944, and, $0, respectively) |
|
5,821,240 |
|
|
4,288,470 |
|
|
— |
|
|||
|
Reinvestment of distributions |
|
161,186 |
|
|
147,827 |
|
|
— |
|
|||
|
Repurchase of common stock |
|
— |
|
|
— |
|
|
(24,999,997 |
) |
|||
|
Net increase/(decrease) in net assets from capital share transactions |
|
5,982,426 |
|
|
4,436,297 |
|
|
(24,999,997 |
) |
|||
|
Total decrease in net assets |
|
(22,572,016 |
) |
|
(66,725,705 |
) |
|
(73,694,395 |
) |
|||
|
Net assets at beginning of year |
|
247,998,542 |
|
|
314,724,247 |
|
|
388,418,642 |
|
|||
|
Net assets at end of year |
$ |
225,426,526 |
|
$ |
247,998,542 |
|
$ |
314,724,247 |
|
|||
|
Capital share activity: |
|
|
|
|
|
|
||||||
|
Shares issued |
|
1,098,277 |
|
|
774,803 |
|
|
— |
|
|||
|
Shares issued from reinvestment of distributions |
|
42,343 |
|
|
23,225 |
|
|
— |
|
|||
|
Shares repurchased |
|
— |
|
|
— |
|
|
(3,828,450 |
) |
|||
|
Net increase/(decrease) in capital share activity |
|
1,140,620 |
|
|
798,028 |
|
|
(3,828,450 |
) |
|||
See Accompanying Notes.
F-21
OXFORD SQUARE CAPITAL CORP.
CONSOLIDATED STATEMENTS OF CASH FLOWS
|
Year Ended |
Year Ended |
Year Ended |
||||||||||
|
CASH FLOWS FROM OPERATING ACTIVITIES |
|
|
|
|
|
|
||||||
|
Net increase/(decrease) in net assets resulting from operations |
$ |
1,711,291 |
|
$ |
(32,797,917 |
) |
$ |
(9,213,373 |
) |
|||
|
Adjustments to reconcile net increase/(decrease) in net assets resulting from operations to net cash provided by (used in) operating activities: |
|
|
|
|
|
|
||||||
|
Accretion of discounts on investments |
|
(1,397,699 |
) |
|
(819,595 |
) |
|
(613,073 |
) |
|||
|
Accretion of discount on notes payable and deferred debt issuance costs |
|
569,436 |
|
|
645,006 |
|
|
439,457 |
|
|||
|
Non-cash interest and dividend income due to PIK |
|
(271,034 |
) |
|
(7,982,447 |
) |
|
(290,600 |
) |
|||
|
Purchases of investments |
|
(70,657,776 |
) |
|
(54,767,714 |
) |
|
(244,555,956 |
) |
|||
|
Repayments of principal |
|
80,361,495 |
|
|
43,879,379 |
|
|
131,542,140 |
|
|||
|
Proceeds from the sale of investments |
|
53,336,817 |
|
|
15,919,269 |
|
|
25,918,205 |
|
|||
|
Net realized losses on investments |
|
8,151,553 |
|
|
1,709,816 |
|
|
3,365,491 |
|
|||
|
Reductions to CLO equity cost value |
|
12,964,760 |
|
|
12,754,336 |
|
|
18,789,550 |
|
|||
|
Net change in unrealized appreciation/depreciation on investments |
|
9,846,437 |
|
|
69,493,794 |
|
|
39,293,348 |
|
|||
|
Decrease in interest and distributions receivable |
|
1,180,777 |
|
|
1,202,699 |
|
|
402,759 |
|
|||
|
(Increase)/decrease in other assets |
|
(73,612 |
) |
|
(130,842 |
) |
|
191,201 |
|
|||
|
(Decrease)/increase in accrued interest payable |
|
(154,044 |
) |
|
143,627 |
|
|
476,987 |
|
|||
|
(Decrease)/increase in Base Fee and Net Investment Income Incentive Fee payable |
|
(320,950 |
) |
|
(1,746,803 |
) |
|
521,357 |
|
|||
|
(Decrease)/increase in accrued expenses |
|
(197,197 |
) |
|
253,704 |
|
|
(127,265 |
) |
|||
|
Net cash provided by/(used in) operating activities |
|
95,050,254 |
|
|
47,756,312 |
|
|
(33,859,772 |
) |
|||
|
|
|
|
|
|
|
|||||||
|
CASH FLOWS FROM FINANCING ACTIVITIES |
|
|
|
|
|
|
||||||
|
Distributions paid (net of stock issued under distribution reinvestment plan of $161,186, $147,827, and $0, respectively) |
|
(30,104,547 |
) |
|
(38,216,258 |
) |
|
(39,481,025 |
) |
|||
|
Repayment of credit facility |
|
(28,090,601 |
) |
|
(57,588,802 |
) |
|
(46,810,472 |
) |
|||
|
Proceeds from the issuance of notes payable – 6.25% Unsecured Notes |
|
— |
|
|
44,790,750 |
|
|
— |
|
|||
|
Proceeds from the issuance of notes payable – Credit Facility |
|
— |
|
|
— |
|
|
132,489,875 |
|
|||
|
Debt issuance costs |
|
— |
|
|
(1,650,398 |
) |
|
(271,587 |
) |
|||
|
Proceeds from issuance of common stock |
|
5,873,019 |
|
|
4,420,414 |
|
|
— |
|
|||
|
Underwriting fees and offering costs for the issuance of common stock |
|
(51,779 |
) |
|
(131,944 |
) |
|
— |
|
|||
|
Repurchase of common stock |
|
— |
|
|
— |
|
|
(24,999,997 |
) |
|||
|
Net cash (used in)/provided by financing activities |
|
(52,373,908 |
) |
|
(48,376,238 |
) |
|
20,926,794 |
|
|||
|
Net increase/(decrease) in cash equivalents and restricted cash |
|
42,676,346 |
|
|
(619,926 |
) |
|
(12,932,978 |
) |
|||
|
Cash equivalents and restricted cash, beginning of year |
|
16,460,938 |
|
|
17,080,864 |
|
|
30,013,842 |
|
|||
|
Cash equivalents and restricted cash, end of year |
$ |
59,137,284 |
|
$ |
16,460,938 |
|
$ |
17,080,864 |
|
|||
|
|
|
|
|
|
|
|||||||
|
NON-CASH FINANCING ACTIVITIES |
|
|
|
|
|
|
||||||
|
Value of shares issued in connection with distribution reinvestment plan |
$ |
161,186 |
|
$ |
147,827 |
|
$ |
— |
|
|||
|
|
|
|
|
|
|
|||||||
|
SUPPLEMENTAL DISCLOSURES |
|
|
|
|
|
|
||||||
|
Cash paid for interest |
$ |
7,468,666 |
|
$ |
9,185,458 |
|
$ |
6,325,318 |
|
|||
|
Impairment of other assets |
$ |
— |
|
$ |
— |
|
$ |
4,291 |
|
|||
|
Securities sold not settled |
$ |
950,000 |
|
$ |
— |
|
$ |
— |
|
|||
|
Securities purchased not settled |
$ |
23,156,556 |
|
$ |
— |
|
$ |
— |
|
|||
See Accompanying Notes.
F-22
OXFORD SQUARE CAPITAL CORP.
NOTES TO CONSOLIDATED FINANCIAL STATEMENTS
DECEMBER 31, 2020
NOTE 1. ORGANIZATION
Oxford Square Capital Corp. (“OXSQ” or the “Company”), was incorporated under the General Corporation Laws of the State of Maryland on July 21, 2003 and is a non-diversified, closed-end investment company. OXSQ has elected to be regulated as a business development company (“BDC”) under the Investment Company Act of 1940, as amended (the “1940 Act”). In addition, OXSQ has elected to be treated for tax purposes as a regulated investment company (“RIC”), under Subchapter M of the Internal Revenue Code of 1986, as amended (the “Code”) beginning with its 2003 taxable year. The Company’s investment objective is to maximize its total return, by investing primarily in corporate debt securities and collateralized loan obligation (“CLO”) structured finance investments that own corporate debt securities.
OXSQ’s investment activities are managed by Oxford Square Management, LLC (“Oxford Square Management”), formerly TICC Management, LLC. Oxford Square Management is an investment adviser registered under the Investment Advisers Act of 1940, as amended (the “Advisers Act”). Oxford Square Management is owned by Oxford Funds, LLC (“Oxford Funds”), formerly BDC Partners, LLC, its managing member, and Charles M. Royce, a member of our Board who holds a minority, non-controlling interest in Oxford Square Management. Under the investment advisory agreement, OXSQ has agreed to pay Oxford Square Management an annual base investment advisory fee (the “Base Fee”) based on its gross assets as well as an incentive fee based on its performance.
The Company’s consolidated operations include the activities of its wholly-owned subsidiary, Oxford Square Funding 2018, LLC (“OXSQ Funding”) for the periods during which it was held. OXSQ Funding, a special purpose vehicle, was formed for the purpose of entering into a credit facility (the “Credit Facility”) with Citibank, N.A. Refer to “Note 5. Borrowings” for additional information on the Company’s borrowings.
NOTE 2. SUMMARY OF SIGNIFICANT ACCOUNTING POLICIES
BASIS OF PRESENTATION
The accompanying consolidated financial statements include the accounts of the Company and its wholly-owned subsidiary, OXSQ Funding for the periods during which it was held. All inter-company accounts and transactions have been eliminated upon consolidation.
The Company follows the accounting and reporting guidance in Financial Accounting Standards Board (“FASB”) Accounting Standards Codification (“ASC”) Topic 946, Financial Services — Investment Companies. Certain prior period figures have been reclassified from those originally published in quarterly and annual reports to conform to the current period presentation for comparative purposes.
In the normal course of business, the Company may enter into contracts that contain a variety of representations and provide indemnifications. The Company’s maximum exposure under these arrangements is unknown as this would involve future claims that may be made against the Company that have not yet occurred. However, based upon experience, the Company expects the risk of loss related to such representations and indemnifications to be remote.
USE OF ESTIMATES
The consolidated financial statements have been prepared in accordance with GAAP, which requires management to make estimates and assumptions that affect the amounts reported in the consolidated financial statements and accompanying notes. Actual results may differ from those estimates, and these differences could be material.
F-23
OXFORD SQUARE CAPITAL CORP.
NOTES TO CONSOLIDATED FINANCIAL STATEMENTS
DECEMBER 31, 2020
NOTE 2. SUMMARY OF SIGNIFICANT ACCOUNTING POLICIES (cont.)
CONSOLIDATION
As provided under Regulation S-X and ASC Topic 946-810, Consolidation, the Company will generally not consolidate its investment in a company other than a wholly-owned investment company or a controlled operating company whose business consists of providing services to the Company for the periods during which it was held. The Company consolidates OXSQ Funding in its financial statements for the periods which it is held, in accordance with ASC 946-810.
CASH, CASH EQUIVALENTS AND RESTRICTED CASH
Cash equivalents consist of demand deposits and highly liquid investments with original maturities of three months or less. The Company places its cash equivalents with financial institutions and, at times, cash held in bank accounts may exceed the Federal Deposit Insurance Corporation (“FDIC”) insured limit. Cash equivalents are classified as Level 1 assets and are included on the Company’s consolidated schedule of investments. Cash equivalents are carried at cost or amortized cost which approximates fair value.
Restricted cash as of December 31, 2020 represents the cash held by the trustee of OXSQ Funding. The amount held by the trustee is for payment of interest expense and operating expenses of the entity, principal repayments on borrowings, or new investments, based upon the terms of the indenture, and are not available for general corporate purposes. As of December 31, 2020, there was no restricted cash due to the full repayment of the Credit Facility on March 24, 2020.
INVESTMENT VALUATION
The Company fair values its investment portfolio in accordance with the provisions of ASC 820, Fair Value Measurement and Disclosure. Estimates made in the preparation of OXSQ’s consolidated financial statements include the valuation of investments and the related amounts of unrealized appreciation and depreciation of investments recorded. OXSQ believes that there is no single definitive method for determining fair value in good faith. As a result, determining fair value requires that judgment be applied to the specific facts and circumstances of each portfolio investment while employing a consistently applied valuation process for the types of investments the Company makes.
ASC 820-10 clarified the definition of fair value and requires companies to expand their disclosure about the use of fair value to measure assets and liabilities in interim and annual periods subsequent to initial recognition. ASC 820-10 defines fair value as the price that would be received to sell an asset or paid to transfer a liability in an orderly transaction between market participants at the measurement date. ASC 820-10 also establishes a three-tier fair value hierarchy, which prioritizes the inputs used in measuring fair value. These tiers include: Level 1, defined as observable inputs such as quoted prices in active markets; Level 2, which includes inputs such as quoted prices for similar securities in active markets and quoted prices for identical securities in markets that are not active; and Level 3, defined as unobservable inputs for which little or no market data exists, therefore requiring an entity to develop its own assumptions. OXSQ considers the attributes of current market conditions on an on-going basis and has determined that due to the general illiquidity of the market for its investment portfolio, whereby little or no market data exists, all of OXSQ’s investments are based upon “Level 3” inputs as of December 31, 2020.
The Board determines the value of its investment portfolio each quarter. In connection with that determination, members of Oxford Square Management’s portfolio management team prepare a quarterly analysis of each portfolio investment using the most recent portfolio company financial statements, forecasts and other relevant financial and operational information. The Company may engage third-party valuation firms to provide assistance in valuing certain of its syndicated loans and bilateral investments, including related equity investments, although the Board ultimately determines the appropriate valuation of each investment. Changes in fair value, as described above, are recorded in the consolidated statement of operations as net change in unrealized appreciation/depreciation on investments.
F-24
OXFORD SQUARE CAPITAL CORP.
NOTES TO CONSOLIDATED FINANCIAL STATEMENTS
DECEMBER 31, 2020
NOTE 2. SUMMARY OF SIGNIFICANT ACCOUNTING POLICIES (cont.)
Syndicated Loans (Including Senior Secured Notes)
In accordance with ASC 820-10, the Company’s valuation procedures specifically provide for the review of indicative quotes supplied by the large agent banks that make a market for each security. However, the marketplace from which the Company obtains indicative bid quotes for purposes of determining the fair value of its syndicated loan investments has shown attributes of illiquidity as described by ASC 820-10. During such periods of illiquidity, when the Company believes that the non-binding indicative bids received from agent banks for certain syndicated loan investments that it owns may not be determinative of their fair value, or when no market indicative quote is available, the Company may engage third-party valuation firms to provide assistance in valuing certain syndicated investments that the Company owns. The third-party valuation firms may use the income or market approach in arriving at a valuation. Unobservable inputs utilized could include discount rates derived from estimated credit spreads and EBITDA multiples. In addition, Oxford Square Management analyzes each syndicated loan by reviewing the portfolio company’s financial statements, covenant compliance and recent trading activity in the security, if known, and other business developments related to the portfolio company. All available information, including non-binding indicative bids which may not be determinative of fair value, is presented to the Valuation Committee to consider in its determination of fair value. In some instances, there may be limited trading activity in a security even though the market for the security is considered not active. In such cases the Valuation Committee will consider the number of trades, the size and timing of each trade, and other circumstances around such trades, to the extent such information is available, in its determination of fair value. The Valuation Committee will evaluate the impact of such additional information, and factor it into its consideration of the fair value that is indicated by the analysis provided by third-party valuation firms, if any. All information is presented to the Board for its determination of fair value of these investments.
Collateralized Loan Obligations — Debt and Equity
The Company holds a number of debt and equity positions in CLO investment vehicles and CLO warehouse investments. These investments are special purpose financing vehicles. In valuing such investments, the Company considers the indicative prices provided by a recognized industry pricing service as a primary source, and the implied yield of such prices, supplemented by actual trades executed in the market at or around period-end, as well as the indicative prices provided by the broker who arranges transactions in such investment vehicles. The Company also considers those instances in which the record date for an equity distribution payment falls on or before the last day of the period, and the likelihood that a prospective purchaser would require a downward adjustment to the indicative price representing substantially all of the pending distribution. Additional factors include any available information on other relevant transactions including firm bids and offers in the market and information resulting from bids-wanted-in-competition. In addition, the Company considers the operating metrics of the specific investment vehicle, including compliance with collateralization tests, defaulted and restructured securities, and payment defaults, if any. In periods of illiquidity and volatility, the Company may rely more heavily on other metrics, including but not limited to, the collateral manager, time left in the reinvestment period, expected cash flows and overcollateralization ratios, instead of the Company’s generated valuation yields. Oxford Square Management or the Valuation Committee may request an additional analysis by a third-party firm to assist in the valuation process of CLO investment vehicles. All information is presented to the Board for its determination of fair value of these investments.
Bilateral Investments (Including Equity)
Bilateral investments for which market quotations are readily available are valued by an independent pricing agent or market maker. If such market quotations are not readily available, under the valuation procedures approved by the Board, upon the recommendation of the Valuation Committee, a third-party valuation firm will prepare valuations for each of OXSQ’s bilateral investments that, when combined with all other investments in the same portfolio company, (i) have a value as of the previous quarter of greater than or equal to 2.5% of its total assets as of
F-25
OXFORD SQUARE CAPITAL CORP.
NOTES TO CONSOLIDATED FINANCIAL STATEMENTS
DECEMBER 31, 2020
NOTE 2. SUMMARY OF SIGNIFICANT ACCOUNTING POLICIES (cont.)
the previous quarter, and (ii) have a value as of the current quarter of greater than or equal to 2.5% of its total assets as of the current quarter, after taking into account any repayment of principal during the current quarter. In addition, in those instances where a third-party valuation is prepared for a portfolio investment which meets the parameters noted in (i) and (ii) above, the frequency of those third-party valuations is based upon the grade assigned to each such security under its credit grading system as follows: Grade 1, at least annually; Grade 2, at least semi-annually; Grades 3, 4, and 5, at least quarterly. Bilateral investments which do not meet the parameters in (i) and (ii) above are not required to have a third-party valuation and, in those instances, a valuation analysis will be prepared by Oxford Square Management. All information is presented to the Board for its determination of fair value of these investments.
The term “Bilateral investments” means debt and equity investments directly negotiated between the Company and a portfolio company, but excludes syndicated loans (i.e., corporate loans arranged by an agent on behalf of a company, portions of which are held by multiple investors in addition to OXSQ).
Refer to “Note 3. Fair Value” in the notes to the Company’s consolidated financial statements for more information on investment valuation and the Company’s portfolio of investments.
INVESTMENT INCOME
Interest Income
Interest income is recorded on an accrual basis using the contractual rate applicable to each debt investment and includes the accretion of market discounts and/or original issue discount (“OID”) and amortization of market premiums. Discounts from and premiums to par value on securities purchased are accreted/amortized into interest income over the life of the respective security using the effective yield method. The amortized cost of investments represents the original cost adjusted for the accretion of discounts and amortization of premiums, if any.
Generally, when interest and/or principal payments on a loan become past due, or if the Company otherwise does not expect the borrower to be able to service its debt and other obligations, the Company will place the loan on non-accrual status and will generally cease recognizing interest income on that loan for financial reporting purposes until all principal and interest have been brought current through payment or due to restructuring such that the interest income is deemed to be collectible. The Company generally restores non-accrual loans to accrual status when past due principal and interest is paid and, in the Company’s judgment, is likely to remain current. As of December 31, 2020 and 2019, the Company had two debt investments that were on non-accrual status. As of December 31, 2018, the Company had no investments that were on non-accrual status.
Interest income also includes a payment-in-kind (“PIK”) component on certain investments in the Company’s portfolio. Refer to the section below, “Payment-In-Kind,” for a description of PIK income and its impact on interest income.
Payment-In-Kind
The Company has debt and preferred stock investments in its portfolio that contain contractual payment-in-kind (“PIK”) provisions. PIK interest and preferred stock dividends are computed at their contractual rates and are accrued into income and recorded as interest and dividend income, respectively. The PIK amounts are added to the principal balances on the capitalization dates. Upon capitalization, the PIK portions of the investments are valued at their respective fair values. If the Company believes that a PIK is not fully expected to be realized, the PIK investment would be placed on non-accrual status. When a PIK investment is placed on non-accrual status, the accrued, uncapitalized interest or dividends would be reversed from the related receivable through interest or dividend income, respectively. PIK investments on non-accrual status are restored to accrual status once it becomes probable that such PIK will be ultimately collectible in cash. For year ended December 31, 2020, no PIK preferred stock dividends were recognized as dividend income.
F-26
OXFORD SQUARE CAPITAL CORP.
NOTES TO CONSOLIDATED FINANCIAL STATEMENTS
DECEMBER 31, 2020
NOTE 2. SUMMARY OF SIGNIFICANT ACCOUNTING POLICIES (cont.)
Income from Securitization Vehicles and Equity Investments
Income from investments in the equity class securities of CLO vehicles (typically income notes or subordinated notes) is recorded using the effective interest method in accordance with the provisions of ASC 325-40, based upon estimated cash flows, amounts and timing, including those CLO equity investments that have not made their inaugural distribution for the relevant period end. We monitor the expected residual payments, and effective yield is determined and updated periodically, as needed. Accordingly, investment income recognized on CLO equity securities in the consolidated statement of operations differs from both the tax-basis investment income and from the cash distributions actually received by the Company during the period.
Other Income
Other income includes prepayment, amendment, and other fees earned by the Company’s loan investments, distributions from fee letters and success fees associated with portfolio investments. Distributions from fee letters are an enhancement to the return on a CLO equity investment and are based upon a percentage of the collateral manager’s fees above the amortized cost, and are recorded as other income when earned. The Company may also earn success fees associated with its investments in certain securitization vehicles or CLO warehouse facilities, which are contingent upon a repayment of the warehouse by a permanent CLO securitization structure; such fees are earned and recognized when the repayment is completed.
Preferred Stock Dividends
The Company holds preferred stock investments in its portfolio that contain cumulative preferred dividends that accumulate quarterly. The Company will record cumulative preferred dividends as investment income when they are declared by the portfolio company’s board of directors or upon any voluntary or involuntary liquidation, dissolution or winding up of the portfolio company. There were no cumulative preferred dividends earned and recorded as dividend income during the year ended December 31, 2020. During the year ended December 31, 2019, approximately $7.7 million of cumulative preferred dividends were earned and recorded as dividend income - non-cash on the Company’s consolidated statement of operations. These dividends are considered in the estimation of fair value of these preferred stock investments.
DEFERRED DEBT ISSUANCE COSTS
Deferred debt issuance costs consist of fees and expenses incurred in connection with the closing or amending of credit facilities and debt offerings, and are capitalized at the time of payment. These costs are amortized using the straight line method over the terms of the respective credit facilities and debt securities. The amortized expenses are included in interest expense in the Company’s consolidated financial statements. The unamortized deferred debt issuance costs are included on the Company’s statement of assets and liabilities as a direct deduction from the related debt liability. Upon early termination or partial principal pay down of debt, or a credit facility, the unamortized costs related to such debt are accelerated into realized losses on extinguishment of debt on the Company’s consolidated statement of operations.
EQUITY OFFERING COSTS
Equity offering costs consist of fees and expenses incurred in connection with the registration and public offer and sale of the Company’s common stock, including legal, accounting and printing fees. These costs are deferred at the time of incurrence and are subsequently charged to capital when the offering takes place or as shares are issued. Deferred costs are periodically reviewed and expensed if the related registration is no longer active.
F-27
OXFORD SQUARE CAPITAL CORP.
NOTES TO CONSOLIDATED FINANCIAL STATEMENTS
DECEMBER 31, 2020
NOTE 2. SUMMARY OF SIGNIFICANT ACCOUNTING POLICIES (cont.)
SHARE REPURCHASES
From time to time, the Board may authorize a share repurchase program under which shares are purchased in open market transactions. Since the Company is incorporated in the State of Maryland, state law requires share repurchases to be accounted for as a share retirement. The cost of repurchased shares is charged against capital on the settlement date.
SECURITIES TRANSACTIONS
Securities transactions are recorded on trade date. Realized gains and losses on investments sold are recorded on the basis of specific identification. Distributions received on CLO equity investments which were optionally redeemed are first applied to the remaining cost basis until it is reduced to zero, after which distributions are recorded as realized gains. An optional redemption feature of a CLO allows a majority of the holders of the equity securities issued by the CLO issuer, after the end of a specified non-call period, to cause the redemption of the secured notes issued by the CLO with proceeds of either the liquidation of the CLO’s assets or through a refinancing with new debt. The optional redemption is effectively a voluntary prepayment of the secured debt issued by the CLO prior to the stated maturity of such debt.
SECURITIES SOLD UNDER AGREEMENT TO REPURCHASE
The Company has entered into an agreement whereby it may sell securities to be repurchased at an agreed-upon price and date. Under this agreement, the Company will account for these transactions as collateralized financing transactions which are recorded at the contracted repurchase amount plus interest. The Company’s securities sold under the agreement to repurchase are carried at cost. As of December 31, 2020, there was no outstanding principal, or securities sold under the repurchase facility. Refer to “Note 5. Borrowings” for further details.
U.S. FEDERAL INCOME TAXES
The Company intends to operate so as to qualify to be taxed as a RIC under Subchapter M of the Code and, as such, to not be subject to U.S. federal income tax on the portion of its taxable income and gains timely distributed to stockholders. To qualify for RIC tax treatment, OXSQ is required to distribute at least 90% of its investment company taxable income annually, meet diversification requirements quarterly and file Form 1120-RIC, as defined by the Code.
Because U.S. federal income tax regulations differ from accounting principles generally accepted in the United States, distributions in accordance with tax regulations may differ from net investment income and realized gains recognized for financial reporting purposes. Differences may be permanent or temporary. Permanent differences are reclassified among capital accounts in the financial statements to reflect their tax character. Temporary differences arise when certain items of income, expense, gain or loss are recognized at some time in the future. Differences in classification may also result from the treatment of short-term gains as ordinary income for tax purposes.
The Company recognizes the tax benefits of uncertain tax positions only when the position is more likely than not to be sustained, assuming examination by tax authorities. Management has analyzed the Company’s tax positions and concluded that no liability for unrecognized tax benefits should be recorded related to uncertain tax positions expected to be taken in the Company’s 2020 tax returns. The Company identifies its major tax jurisdictions as U.S Federal and Connecticut State; however, the Company is not aware of any tax position for which it is reasonably possible that the total amounts of unrecognized tax benefits will change materially in the next 12 months.
For tax purposes, the cost basis of the portfolio investments as of December 31, 2020 and December 31, 2019, was approximately $433,128,699 and $499,939,486 respectively.
F-28
OXFORD SQUARE CAPITAL CORP.
NOTES TO CONSOLIDATED FINANCIAL STATEMENTS
DECEMBER 31, 2020
NOTE 3. FAIR VALUE
The Company’s assets measured at fair value on a recurring basis as of December 31, 2020 were as follows:
|
Fair Value Measurements at Reporting Date Using |
||||||||||||
|
Assets ($ in millions) |
Quoted Prices |
Significant |
Significant |
Total |
||||||||
|
Senior Secured Notes |
$ |
— |
$ |
— |
$ |
172.2 |
$ |
172.2 |
||||
|
CLO Equity |
|
— |
|
— |
|
122.5 |
|
122.5 |
||||
|
Equity and Other Investments |
|
— |
|
— |
|
— |
|
— |
||||
|
Total Investments at fair value |
|
— |
|
— |
|
294.7 |
|
294.7 |
||||
|
Cash equivalents |
|
59.1 |
|
— |
|
— |
|
59.1 |
||||
|
Total |
$ |
59.1 |
$ |
— |
$ |
294.7 |
$ |
353.8 |
||||
The Company’s assets measured at fair value on a recurring basis as of December 31, 2019 were as follows:
|
Fair Value Measurements at Reporting Date Using |
||||||||||||
|
Assets ($ in millions) |
Quoted Prices |
Significant |
Significant |
Total |
||||||||
|
Senior Secured Notes |
$ |
— |
$ |
— |
$ |
240.5 |
$ |
240.5 |
||||
|
CLO Debt |
|
— |
|
— |
|
0.8 |
|
0.8 |
||||
|
CLO Equity |
|
— |
|
— |
|
120.6 |
|
120.6 |
||||
|
Equity and Other Investments |
|
— |
|
— |
|
2.8 |
|
2.8 |
||||
|
Total Investments at fair value(1) |
|
— |
|
— |
|
364.8 |
|
364.8 |
||||
|
Cash equivalents |
|
14.4 |
|
— |
|
— |
|
14.4 |
||||
|
Total |
$ |
14.4 |
$ |
— |
$ |
364.8 |
$ |
379.2 |
||||
____________
(1) Totals may not sum due to rounding.
Significant Unobservable Inputs for Level 3 Investments
The following tables provide quantitative information about the Company’s Level 3 fair value measurements as of December 31, 2020 and 2019, respectively. The Company’s valuation policy, as described above, establishes parameters for the sources and types of valuation analysis, as well as the methodologies and inputs that the Company uses in determining fair value. If the Valuation Committee or Oxford Square Management determines that additional techniques, sources or inputs are appropriate or necessary in a given situation, such additional work will be undertaken. The tables, therefore, are not all-inclusive, but provide information on the significant Level 3
F-29
OXFORD SQUARE CAPITAL CORP.
NOTES TO CONSOLIDATED FINANCIAL STATEMENTS
DECEMBER 31, 2020
NOTE 3. FAIR VALUE (cont.)
inputs that are pertinent to the Company’s fair value measurements. The weighted average calculations in the table below are based on principal balances for all debt related calculations and CLO equity.
|
Quantitative Information about Level 3 Fair Value Measurements |
||||||||||||
|
Assets ($ in millions) |
Fair Value |
Valuation Techniques/ |
Unobservable Input |
Range/Weighted |
Impact to |
|||||||
|
Senior Secured |
$ |
95.4 |
Market quotes |
NBIB(3) |
|
69.4% – 99.3%/90.8% |
NA |
|||||
|
|
60.9 |
Recent transactions |
Actual trade/payoff(4) |
|
1.2% – 99.5%/78.3% |
NA |
||||||
|
|
11.8 |
Discounted cash flow(6) |
Discount rate(6) |
|
16.8% – 18.1%/ncm(5) |
Decrease |
||||||
|
|
4.1 |
Enterprise value |
EBITDA(9) |
$ |
92.0 million/ncm(5) |
Increase |
||||||
|
|
Market multiples(9) |
|
6.0x – 7.0x/ncm(5) |
Increase |
||||||||
|
CLO |
|
96.1 |
Market quotes |
NBIB(3) |
|
0.0% – 79.0%/34.0% |
NA |
|||||
|
|
25.0 |
Recent transactions |
Actual trade/payoff(4) |
|
75.9% – 83.4%/76.7% |
NA |
||||||
|
|
1.4 |
Discounted cash flow(6) |
Discount rate(7) |
|
11.7% – 21.1%/14.9% |
Decrease |
||||||
|
Equity/Other |
|
— |
Enterprise value(8) |
EBITDA(9) |
$ |
19.8 million/ncm(5) |
Increase |
|||||
|
|
|
Market multiples(9) |
|
5.6x-6.5x/ncm(5) |
Increase |
|||||||
|
Total Fair Value for Level 3 Investments |
$ |
294.7 |
|
|||||||||
____________
(1) Weighted averages are calculated based on fair value of investments.
(2) The impact on the fair value measurement of an increase in each unobservable input is in isolation. The discount rate is the rate used to discount future cash flows in a discounted cash flow calculation. An increase in the discount rate, in isolation, would result in a decrease in a fair value measurement. Market/EBITDA multiples refer to the input (often derived from the value of a comparable company) that is multiplied by the historic and/or expected EBITDA of a company in order to estimate the company’s value. An increase in the Market/EBITDA multiple, in isolation, net of adjustments, would result in an increase in a fair value measurement.
(3) The Company generally uses prices provided by an independent pricing service, or broker or agent bank non-binding indicative bid prices (“NBIB”), on or near the valuation date as the primary basis for the fair value determinations for syndicated notes, and CLO debt and equity investments, which may be adjusted for pending equity distributions as of valuation date. These bid prices are non-binding, and may not be determinative of fair value. Each bid price is evaluated by the Valuation Committee in conjunction with additional information compiled by Oxford Square Management, including financial performance, recent business developments, and, in the case of CLO debt and equity investments, performance and covenant compliance information as provided by the independent trustee.
(4) Prices provided by independent pricing services are evaluated in conjunction with actual trades and payoffs and, in certain cases, the value represented by actual trades or payoffs may be more representative of fair value as determined by the Valuation Committee.
(5) The calculation of weighted average for a range of values, for a single investment within a given asset category, is not considered to provide a meaningful representation (“ncm”).
(6) The Company will calculate the fair value of certain CLO equity investments based upon the net present value of expected contractual payment streams discounted using estimated market yields for the equity tranche of the respective CLO vehicle. The Company will also consider those investments in which the record date for an equity distribution payment falls on or before the last day of the period, and the likelihood that a prospective purchaser would require an adjustment to the transaction price representing substantially all of the pending distribution.
(7) Discount rate represents the rate at which future cash flows are discounted to calculate a present value, reflecting market assumptions for risk.
(8) For senior secured notes and equity investments, third-party valuation firms evaluate the financial and operational information of the portfolio companies that the Company provides to them, as well as independent market and industry
F-30
OXFORD SQUARE CAPITAL CORP.
NOTES TO CONSOLIDATED FINANCIAL STATEMENTS
DECEMBER 31, 2020
NOTE 3. FAIR VALUE (cont.)
information that they consider appropriate in forming an opinion as to the fair value of the Company’s securities. In those instances where the carrying value and/or internal credit rating of the investment does not require the use of a third-party valuation firm, a valuation is prepared by Oxford Square Management, which may include liquidation analysis or which may utilize a subsequent transaction to provide an indication of fair value.
(9) EBITDA, or earnings before interest expense, taxes, depreciation and amortization, is an unobservable input which is generally based on the most recently available twelve month financial statements provided by the portfolio company. Market multiples, also an unobservable input, represent an estimation of where market participants might value an enterprise based upon information available for comparable companies in the market.
|
Quantitative Information about Level 3 Fair Value Measurements |
Impact to |
||||||||||
|
Assets ($ in millions) |
Fair Value |
Valuation Techniques/ |
Unobservable Input |
Range/Weighted |
|||||||
|
Senior Secured |
$ |
201.9 |
Market quotes |
NBIB(3) |
15.0% – 100.3%/86.5% |
NA |
|||||
|
|
38.7 |
Recent transactions |
Actual trade/payoff(4) |
92.0% – 100.0%/97.3% |
NA |
||||||
|
CLO debt |
|
0.8 |
Market quotes |
NBIB(3) |
84.1%/ncm(6) |
NA |
|||||
|
CLO equity |
|
104.5 |
Market quotes |
NBIB(3) |
2.0% – 74.0%/43.7% |
NA |
|||||
|
|
11.3 |
Yield Analysis |
Yield |
17.3% – 23.9%/19.7% |
Decrease |
||||||
|
|
3.4 |
Recent transactions |
Actual trade/payoff(4) |
60.3%/ncm(6) |
NA |
||||||
|
|
1.3 |
Discounted cash flow(7) |
Discount rate(8) |
10.1% – 14.7%/11.9% |
Decrease |
||||||
|
|
0.1 |
Liquidation net asset value(5) |
NBIB(3) |
2.5%/ncm(6) |
NA |
||||||
|
Equity and Other Investments |
|
2.8 |
Enterprise value(9) |
EBITDA(10)/ |
$25.1 million/ncm(6) 5.7x – 6.6x/ncm(6) |
Increase |
|||||
|
Total Fair Value for Level 3 Investments |
$ |
364.8 |
|||||||||
____________
(1) Weighted averages are calculated based on fair value of investments.
(2) The impact on the fair value measurement of an increase in each unobservable input is in isolation. The discount rate is the rate used to discount future cash flows in a discounted cash flow calculation. An increase in the discount rate, in isolation, would result in a decrease in a fair value measurement. Market/EBITDA multiples refer to the input (often derived from the value of a comparable company) that is multiplied by the historic and/or expected EBITDA of a company in order to estimate the company’s value. An increase in the Market/EBITDA multiple, in isolation, net of adjustments, would result in an increase in a fair value measurement.
(3) The Company generally uses prices provided by an independent pricing service, or broker or agent bank non-binding indicative bid prices (“NBIB”), on or near the valuation date as the primary basis for the fair value determinations for syndicated notes, and CLO debt and equity investments, which may be adjusted for pending equity distributions as of valuation date. These bid prices are non-binding, and may not be determinative of fair value. Each bid price is evaluated by the Valuation Committee in conjunction with additional information compiled by Oxford Square Management, including financial performance, recent business developments, and, in the case of CLO debt and equity investments, performance and covenant compliance information as provided by the independent trustee.
(4) Prices provided by independent pricing services are evaluated in conjunction with actual trades and payoffs and, in certain cases, the value represented by actual trades or payoffs may be more representative of fair value as determined by the Valuation Committee.
(5) The fair value of those CLO equity positions which have been optionally redeemed are generally valued using a liquidation net asset value basis which represents the estimated expected residual value of the CLO as of the end of the period.
(6) The calculation of weighted average for a range of values, for a single investment within a given asset category, is not considered to provide a meaningful representation (“ncm”).
F-31
OXFORD SQUARE CAPITAL CORP.
NOTES TO CONSOLIDATED FINANCIAL STATEMENTS
DECEMBER 31, 2020
NOTE 3. FAIR VALUE (cont.)
(7) The Company will calculate the fair value of certain CLO equity investments based upon the net present value of expected contractual payment streams discounted using estimated market yields for the equity tranche of the respective CLO vehicle. The Company will also consider those investments in which the record date for an equity distribution payment falls on or before the last day of the period, and the likelihood that a prospective purchaser would require an adjustment to the transaction price representing substantially all of the pending distribution.
(8) Discount rate represents the rate at which future cash flows are discounted to calculate a present value, reflecting market assumptions for risk.
(9) For equity investments, third-party valuation firms evaluate the financial and operational information of the portfolio companies that the Company provides to them, as well as independent market and industry information that they consider appropriate in forming an opinion as to the fair value of the Company’s securities. In those instances where the carrying value and/or internal credit rating of the investment does not require the use of a third-party valuation firm, a valuation is prepared by Oxford Square Management, which may include liquidation analysis or which may utilize a subsequent transaction to provide an indication of fair value.
(10) EBITDA, or earnings before interest expense, taxes, depreciation and amortization, is an unobservable input which is generally based on the most recently available twelve month financial statements provided by the portfolio company. Market multiples, also an unobservable input, represent an estimation of where market participants might value an enterprise based upon information available for comparable companies in the market.
Financial Instruments Disclosed, But Not Carried, At Fair Value
The following table presents the carrying value and fair value of the Company’s financial liabilities disclosed, but not carried, at fair value as of December 31, 2020 and the level of each financial liability within the fair value hierarchy:
|
($ in millions) |
Carrying |
Fair Value |
Level 1 |
Level 2 |
Level 3 |
||||||||||
|
6.50% Unsecured Notes(2) |
$ |
63.3 |
$ |
64.3 |
$ |
— |
$ |
64.3 |
$ |
— |
|||||
|
6.25% Unsecured Notes(3) |
|
43.5 |
|
45.1 |
|
— |
|
45.1 |
|
— |
|||||
|
Total |
$ |
106.8 |
$ |
109.4 |
$ |
— |
$ |
109.4 |
$ |
— |
|||||
____________
(1) Carrying value is net of deferred debt issuance costs. Deferred debt issuance costs associated with the 6.5% Unsecured Notes totaled approximately $1.1 million as of December 31, 2020. Deferred debt issuance costs associated with the 6.25% Unsecured Notes totaled approximately $1.2 million as of December 31, 2020.
(2) For the 6.50% Unsecured Notes, fair value is based upon the closing price on the last day of the period. The 6.50% Unsecured Notes are listed on the NASDAQ Global Select Market (trading symbol “OXSQL”).
(3) For the 6.25% Unsecured Notes, fair value is based upon the closing price on the last day of the period. The 6.25% Unsecured Notes are listed on the NASDAQ Global Select Market (trading symbol “OXSQZ”).
F-32
OXFORD SQUARE CAPITAL CORP.
NOTES TO CONSOLIDATED FINANCIAL STATEMENTS
DECEMBER 31, 2020
NOTE 3. FAIR VALUE (cont.)
The following table presents the carrying value and fair value of the Company’s financial liabilities disclosed, but not carried, at fair value as of December 31, 2019 and the level of each financial liability within the fair value hierarchy:
|
($ in millions) |
Carrying |
Fair Value |
Level 1 |
Level 2 |
Level 3 |
||||||||||
|
6.50% Unsecured Notes(3) |
$ |
63.0 |
$ |
65.6 |
$ |
— |
$ |
65.6 |
$ |
— |
|||||
|
6.25% Unsecured Notes(4) |
|
43.3 |
|
45.6 |
|
— |
|
45.6 |
|
— |
|||||
|
Credit Facility(2) |
|
28.1 |
|
28.1 |
|
— |
|
— |
|
28.1 |
|||||
|
Total(5) |
$ |
134.4 |
$ |
139.3 |
$ |
— |
$ |
111.2 |
$ |
28.1 |
|||||
____________
(1) Carrying value is net of deferred debt issuance costs. Deferred debt issuance costs associated with the Credit Facility totaled approximately $10,000 as of December 31, 2019. Deferred debt issuance costs associated with the 6.50% Unsecured Notes totaled approximately $1.4 million as of December 31, 2019. Deferred debt issuance costs associated with the 6.25% Unsecured Notes totaled approximately $1.5 million as of December 31, 2019.
(2) Fair value represents the par amount of the Facility.
(3) For the 6.50% Unsecured Notes, fair value is based upon the closing price on the last day of the period. The 6.50% Unsecured Notes are listed on the NASDAQ Global Select Market (trading symbol “OXSQL”).
(4) For the 6.25% Unsecured Notes, fair value is based upon the closing price on the last day of the period. The 6.25% Unsecured Notes are listed on the NASDAQ Global Select Market (trading symbol “OXSQZ”).
(5) Totals may not sum due to rounding.
A reconciliation of the fair value of investments for the year ended December 31, 2020, utilizing significant unobservable inputs, is as follows:
|
($ in millions) |
Senior |
CLO |
CLO |
Equity and |
Total |
|||||||||||||||
|
Balance at December 31, 2019(2) |
$ |
240.5 |
|
$ |
0.8 |
|
$ |
120.6 |
|
$ |
2.8 |
|
$ |
364.8 |
|
|||||
|
Realized losses included in earnings |
|
(2.2 |
) |
|
2.3 |
|
|
(8.3 |
) |
|
— |
|
|
(8.2 |
) |
|||||
|
Unrealized depreciation included in earnings(2) |
|
(1.6 |
) |
|
0.1 |
|
|
(5.5 |
) |
|
(2.8 |
) |
|
(9.8 |
) |
|||||
|
Accretion of discount |
|
1.2 |
|
|
0.2 |
|
|
— |
|
|
— |
|
|
1.4 |
|
|||||
|
Purchases(2) |
|
39.2 |
|
|
8.2 |
|
|
46.5 |
|
|
— |
|
|
93.8 |
|
|||||
|
Repayments and Sales |
|
(105.2 |
) |
|
(11.5 |
) |
|
(17.9 |
) |
|
— |
|
|
(134.6 |
) |
|||||
|
Reductions to CLO equity cost value(1) |
|
— |
|
|
— |
|
|
(13.0 |
) |
|
— |
|
|
(13.0 |
) |
|||||
|
Non-cash interest and dividend income due to PIK |
|
0.3 |
|
|
— |
|
|
— |
|
|
— |
|
|
0.3 |
|
|||||
|
Transfers in and/or (out) of level 3 |
|
— |
|
|
— |
|
|
— |
|
|
— |
|
|
— |
|
|||||
|
Balance at December 31, 2020(2) |
$ |
172.2 |
|
$ |
— |
|
$ |
122.5 |
|
$ |
— |
|
$ |
294.7 |
|
|||||
|
Net change in unrealized depreciation on Level 3 investments still held as of December 31, 2020 |
$ |
(2.0 |
) |
$ |
— |
|
$ |
(14.2 |
) |
$ |
(2.8 |
) |
$ |
(19.0 |
) |
|||||
____________
(1) Reduction to cost value on the Company’s CLO equity investments represents the difference between distributions received, or entitled to be received, of approximately $28.4 million and the effective yield interest income recognized on our CLO equity subordinated notes and the amortized cost adjusted income on our CLO equity fee notes of approximately $15.4 million.
(2) Totals may not sum due to rounding.
F-33
OXFORD SQUARE CAPITAL CORP.
NOTES TO CONSOLIDATED FINANCIAL STATEMENTS
DECEMBER 31, 2020
NOTE 3. FAIR VALUE (cont.)
A reconciliation of the fair value of investments for the year ended December 31, 2019, utilizing significant unobservable inputs, is as follows:
|
($ in millions) |
Senior |
CLO |
CLO |
Equity and |
Total |
|||||||||||||||
|
Balance at December 31, 2018(2) |
$ |
282.7 |
|
$ |
0.9 |
|
$ |
146.8 |
|
$ |
14.5 |
|
$ |
445.0 |
|
|||||
|
Realized losses included in earnings |
|
— |
|
|
— |
|
|
(1.2 |
) |
|
(0.5 |
) |
|
(1.7 |
) |
|||||
|
Unrealized depreciation included in earnings |
|
(18.1 |
) |
|
(0.1 |
) |
|
(32.4 |
) |
|
(18.9 |
) |
|
(69.5 |
) |
|||||
|
Accretion of discount |
|
0.8 |
|
|
— |
|
|
— |
|
|
— |
|
|
0.8 |
|
|||||
|
Purchases(2) |
|
28.9 |
|
|
— |
|
|
25.8 |
|
|
— |
|
|
54.8 |
|
|||||
|
Repayments and Sales |
|
(54.2 |
) |
|
— |
|
|
(5.6 |
) |
|
— |
|
|
(59.8 |
) |
|||||
|
Reductions to CLO equity cost value(1) |
|
— |
|
|
— |
|
|
(12.8 |
) |
|
— |
|
|
(12.8 |
) |
|||||
|
Non-cash interest and dividend income due to PIK(2) |
|
0.4 |
|
|
— |
|
|
— |
|
|
7.7 |
|
|
8.0 |
|
|||||
|
Transfers in and/or (out) of level 3 |
|
— |
|
|
— |
|
|
— |
|
|
— |
|
|
— |
|
|||||
|
Balance at December 31, 2019(2) |
$ |
240.5 |
|
$ |
0.8 |
|
$ |
120.6 |
|
$ |
2.8 |
|
$ |
364.8 |
|
|||||
|
Net change in unrealized depreciation on Level 3 investments still held as of December 31, 2019(2) |
$ |
(19.1 |
) |
$ |
(0.1 |
) |
$ |
(34.0 |
) |
$ |
(19.3 |
) |
$ |
(72.5 |
) |
|||||
____________
(1) Reduction to cost value on the Company’s CLO equity investments represents the difference between distributions received, or entitled to be received, of approximately $38.0 million and the effective yield interest income of approximately $25.2 million.
(2) Totals may not sum due to rounding.
The following table shows the fair value of OXSQ’s portfolio of investments by asset class as of December 31, 2020 and 2019:
|
2020 |
2019 |
|||||||||||
|
($ in millions) |
Investments at |
Percentage of |
Investments at |
Percentage of |
||||||||
|
Senior Secured Notes |
$ |
172.2 |
58.4 |
% |
$ |
240.5 |
65.9 |
% |
||||
|
CLO Debt |
|
— |
0.0 |
% |
|
0.8 |
0.2 |
% |
||||
|
CLO Equity |
|
122.5 |
41.6 |
% |
|
120.6 |
33.1 |
% |
||||
|
Equity and Other Investments |
|
— |
0.0 |
% |
|
2.8 |
0.8 |
% |
||||
|
Total(1) |
$ |
294.7 |
100.0 |
% |
$ |
364.8 |
100.0 |
% |
||||
____________
(1) Totals may not sum due to rounding.
F-34
OXFORD SQUARE CAPITAL CORP.
NOTES TO CONSOLIDATED FINANCIAL STATEMENTS
DECEMBER 31, 2020
NOTE 4. CASH, CASH EQUIVALENTS AND RESTRICTED CASH
At December 31, 2020 and December 31, 2019, respectively, cash, cash equivalents and restricted cash were as follows:
|
December 31, |
December 31, |
|||||
|
Cash |
$ |
— |
$ |
— |
||
|
Cash Equivalents |
|
59,137,284 |
|
14,410,486 |
||
|
Total Cash and Cash Equivalents |
$ |
59,137,284 |
$ |
14,410,486 |
||
|
Restricted Cash |
$ |
— |
$ |
2,050,452 |
||
|
Total Cash, Cash Equivalents and Restricted Cash |
$ |
59,137,284 |
$ |
16,460,938 |
||
NOTE 5. BORROWINGS
In accordance with the 1940 Act, with certain limited exceptions, the Company is only allowed to borrow amounts such that its asset coverage, as defined in the 1940 Act, is at least 150% (effective April 6, 2019) immediately after such borrowing. As of December 31, 2020 and 2019, the Company’s asset coverage for borrowed amounts was approximately 304% and 279% respectively.
The following are the Company’s outstanding principal amounts, carrying values and fair values of the Company’s borrowings as of December 31, 2020 and December 31, 2019. The fair value of the 6.25% Unsecured Notes is based upon the closing price on the last day of the period. The 6.25% Unsecured Notes are listed on the NASDAQ Global Select Market (trading symbol “OXSQZ”). The fair value of the 6.50% Unsecured Notes is based upon the closing price on the last day of the period. The 6.50% Unsecured Notes are listed on the NASDAQ Global Select Market (trading symbol “OXSQL”). The Credit Facility was fully repaid on March 24, 2020. The Credit Facility fair value represents the par amount of the debt obligation as of December 31, 2019.
|
As of |
||||||||||||||||||
|
December 31, 2020 |
December 31, 2019 |
|||||||||||||||||
|
($ in millions) |
Principal |
Carrying |
Fair Value |
Principal |
Carrying |
Fair Value |
||||||||||||
|
6.50% Unsecured Notes |
$ |
64.4 |
$ |
63.3 |
$ |
64.3 |
$ |
64.4 |
$ |
63.0 |
$ |
65.6 |
||||||
|
Credit Facility |
|
— |
|
— |
|
— |
|
28.1 |
|
28.1 |
|
28.1 |
||||||
|
6.25% Unsecured Notes |
|
44.8 |
|
43.5 |
|
45.1 |
|
44.8 |
|
43.3 |
|
45.6 |
||||||
|
Total |
$ |
109.2 |
$ |
106.8 |
$ |
109.4 |
$ |
137.3 |
$ |
134.4 |
$ |
139.3 |
||||||
____________
(1) Represents the aggregate principal amount outstanding less the unamortized deferred issuance costs. As of December 31, 2020, the total unamortized deferred issuance costs for the 6.25% Unsecured Notes, and 6.50% Unsecured Notes was approximately $1.2 million, and $1.1 million, respectively. As of December 31, 2019, the total unamortized deferred issuance costs for the Credit Facility, 6.25% Unsecured Notes, and 6.50% Unsecured Notes was approximately $10,000, $1.5 million, and $1.4 million, respectively.
The weighted average stated interest rate and weighted average maturity on all our debt outstanding as of December 31, 2020 were 6.40% and 4.1 years, respectively, and as of December 31, 2019 were 5.94% and 4.2 years, respectively.
F-35
OXFORD SQUARE CAPITAL CORP.
NOTES TO CONSOLIDATED FINANCIAL STATEMENTS
DECEMBER 31, 2020
NOTE 5. BORROWINGS (cont.)
The table below summarizes the components of interest expense for the years ended December 31, 2020, 2019 and 2018:
|
Year Ended December 31, 2020 |
|||||||||
|
($ in thousands) |
Stated |
Amortization of |
Total |
||||||
|
Credit Facility |
$ |
262.2 |
$ |
4.8 |
$ |
267.0 |
|||
|
6.25% Unsecured Notes |
|
2,799.4 |
|
233.8 |
|
3,033.2 |
|||
|
6.50% Unsecured Notes |
|
4,184.1 |
|
325.6 |
|
4,509.7 |
|||
|
Repo Facility |
|
68.9 |
|
— |
|
68.9 |
|||
|
Total(1) |
$ |
7,314.6 |
$ |
564.2 |
$ |
7,878.9 |
|||
____________
(1) Totals may not sum due to rounding.
|
Year Ended December 31, 2019 |
|||||||||
|
($ in thousands) |
Stated |
Amortization of |
Total |
||||||
|
Credit Facility |
$ |
3,043.3 |
$ |
74.1 |
$ |
3,117.4 |
|||
|
6.25% Unsecured Notes |
|
2,084.0 |
|
173.5 |
|
2,257.5 |
|||
|
6.50% Unsecured Notes |
|
4,184.1 |
|
324.7 |
|
4,508.8 |
|||
|
Repo Facility |
|
17.7 |
|
— |
|
17.7 |
|||
|
Total |
$ |
9,329.1 |
$ |
572.3 |
$ |
9,901.4 |
|||
|
Year Ended December 31, 2018 |
|||||||||
|
($ in thousands) |
Stated |
Amortization of |
Total |
||||||
|
Credit Facility |
$ |
2,618.2 |
$ |
54.0 |
$ |
2,672.2 |
|||
|
6.50% Unsecured Notes |
|
4,184.1 |
|
324.7 |
|
4,508.8 |
|||
|
Total |
$ |
6,802.3 |
$ |
378.7 |
$ |
7,181.0 |
|||
Notes Payable — 6.50% Unsecured Notes Due 2024
On April 12, 2017, the Company completed an underwritten public offering of approximately $64.4 million in aggregate principal amount of the 6.50% Unsecured Notes. The 6.50% Unsecured Notes mature on March 30, 2024, and may be redeemed in whole or in part at any time or from time to time at the Company’s option on or after March 30, 2020. The 6.50% Unsecured Notes bear interest at a rate of 6.50% per year, payable quarterly on March 30, June 30, September 30, and December 30 of each year.
The aggregate accrued interest payable on the 6.50% Unsecured Notes as of December 31, 2020 and December 31, 2019 was approximately $12,000, respectively. As of December 31, 2020 and December 31, 2019, the Company had unamortized deferred debt issuance costs relating to the 6.50% Unsecured Notes of approximately $1.1 million and $1.4 million, respectively. The deferred debt issuance costs are being amortized over the term of the 6.50% Unsecured Notes and are included in interest expense in the consolidated statements of operations. The cash paid and the effective annualized interest rate for the year ended December 31, 2020 were approximately $4.2 million and 6.99%, respectively. The cash paid and the effective annualized interest rate for the year ended December 31, 2019 were approximately $4.2 million and 7.00%, respectively.
F-36
OXFORD SQUARE CAPITAL CORP.
NOTES TO CONSOLIDATED FINANCIAL STATEMENTS
DECEMBER 31, 2020
NOTE 5. BORROWINGS (cont.)
Notes Payable — Credit Facility
On June 21, 2018, OXSQ Funding entered into the Credit Facility with Citibank, N.A. Subject to certain exceptions, pricing under the Credit Facility was based on the London Interbank Offered Rate for an interest period equal to three months plus a spread of 2.25% per annum payable quarterly on March 21, June 21, September 21 and December 21. Pursuant to the terms of the credit agreement governing the Credit Facility, OXSQ Funding borrowed approximately $95.2 million. The Credit Facility had a mandatory amortization schedule such that 15.0% of the principal amount outstanding as of June 21, 2018 would have become due and payable on June 21, 2019. On each payment date occurring thereafter, an additional 6.25% of the remaining principal amount outstanding would have been due and payable. All remaining principal and accrued and unpaid interest would have been due and payable on the final maturity date, June 21, 2020.
The Credit Facility was collateralized by a pool of loans initially consisting of loans sold by OXSQ to OXSQ Funding. OXSQ was able to sell and contribute additional loans to OXSQ Funding from time to time. OXSQ acted as the collateral manager of the loans owned by OXSQ Funding, and retained a residual interest through its ownership of OXSQ Funding.
On October 12, 2018, OXSQ Funding amended the Credit Facility with Citibank, N.A. Under the amended Credit Facility, an additional borrowing amount of approximately $37.3 million was made under the same terms as the existing credit agreement. The Company posted additional collateral with a principal amount of approximately $76.4 million. All other existing terms of the Credit Facility remained unchanged.
The Company prepaid the remaining outstanding principal of approximately $28.1 million in March 2020, and unilaterally terminated the Credit Facility as of March 24, 2020 in accordance with its terms. In connection with the early repayment and termination of the OXSQ Facility, the Company was required to pay a prepayment fee equal to $21,413. The Company recognized a net extinguishment loss of approximately $5,000 for the year ended December 31, 2020, which consisted of unamortized deferred debt issuance costs. These costs are recorded within realized losses on extinguishment of debt in the consolidated statements of operations.
The cash paid and effective annualized interest rate for the year ended December 31, 2020 was approximately $0.4 million and 4.09%, respectively. The cash paid and effective annualized interest rate for the year ended December 31, 2019 was approximately $3.4 million and 4.80%, respectively.
Notes Payable — 6.25% Unsecured Notes Due 2026
On April 3, 2019, the Company completed an underwritten public offering of approximately $44.8 million in aggregate principal amount of 6.25% Unsecured Notes. The 6.25% Unsecured Notes will mature on April 30, 2026, and may be redeemed in whole or in part at any time or from time to time at the Company’s option on or after April 30, 2022. The 6.25% Unsecured Notes bear interest at a rate of 6.25% per year payable quarterly on January 31, April 30, July 31, and October 31, of each year.
The aggregate accrued interest payable on the 6.25% Unsecured Notes as of December 31, 2020 was approximately $0.5 million, which was approximately the same as of December 31, 2019. As of December 31, 2020 and 2019, the Company had unamortized deferred debt issuance costs of approximately $1.2 million and $1.5 million, respectively, relating to the 6.25% Unsecured Notes. The deferred debt issuance costs are being amortized over the term of the 6.25% Unsecured Notes and are included in interest expense in the consolidated statements of operations. The cash paid and the effective annualized interest rate for the year ended December 31, 2020 were approximately $2.8 million and 6.75%, respectively. The cash paid and the effective annualized interest rate for the year ended December 31, 2019 were approximately $1.6 million and 6.72%, respectively.
F-37
OXFORD SQUARE CAPITAL CORP.
NOTES TO CONSOLIDATED FINANCIAL STATEMENTS
DECEMBER 31, 2020
NOTE 5. BORROWINGS (cont.)
Repurchase Transaction Facility
On October 18, 2019, the Company entered into a $10 million repurchase transaction facility (the “Repo Facility”) with Nomura Securities International, Inc. (“Nomura”). Pursuant to the Master Repurchase Agreement (“MRA”) and a transaction facility confirmation, the Company may sell securities to Nomura from time to time with a corresponding repurchase obligation at an agreed-upon price 30 to 60 days after the sale date (“Reverse Repo”). The Repo Facility has a funding cost of 1-month LIBOR plus 2.05% per annum for each Reverse Repo transaction and is subject to a facility fee of 0.85% per annum on the full $10 million facility amount. The Repo Facility expired without extension by the Company on October 18, 2020. The Company accounts for these Reverse Repo transactions as secured financings for the financial reporting purposes in accordance with GAAP. The cash paid in facility fees for the year ended December 31, 2020 was approximately $72,000.
NOTE 6. EARNINGS PER SHARE
The following table sets forth the computation of basic and diluted net increase in net assets resulting from net investment income per share for the years ended December 31, 2020, 2019 and 2018:
|
Year Ended |
Year Ended |
Year Ended |
|||||||
|
Net increase in net assets resulting from net investment income per common share – basic: |
|
|
|
||||||
|
Net investment income |
$ |
19,714,492 |
$ |
38,478,359 |
$ |
33,506,218 |
|||
|
Weighted average common shares outstanding – basic |
|
49,477,215 |
|
47,756,596 |
|
49,662,157 |
|||
|
Net increase in net assets resulting from net investment income per common share – basic and diluted |
$ |
0.40 |
$ |
0.81 |
$ |
0.67 |
|||
The following table sets forth the computation of basic and diluted net increase/(decrease) in net assets resulting from operations per share for the years ended December 31, 2020, 2019 and 2018:
|
Year Ended |
Year Ended |
Year Ended |
|||||||||
|
Net increase/(decrease) in net assets resulting from operations per common share – basic: |
|
|
|
|
|
||||||
|
Net increase/(decrease) in net assets resulting from operations |
$ |
1,711,291 |
$ |
(32,797,917 |
) |
$ |
(9,213,373 |
) |
|||
|
Weighted average common shares outstanding – basic |
|
49,477,215 |
|
47,756,596 |
|
|
49,662,157 |
|
|||
|
Net increase/(decrease) in net assets resulting from operations per common share – basic and diluted |
$ |
0.03 |
$ |
(0.69 |
) |
$ |
(0.19 |
) |
|||
NOTE 7. RELATED PARTY TRANSACTIONS
The Company pays Oxford Square Management a fee for its services under the Investment Advisory Agreement consisting of — a base investment advisory fee the (“Base Fee”) based on its gross assets, as described below, and two types of incentive fees. The cost of both the Base Fee and any incentive fees earned by Oxford Square Management are ultimately borne by the Company’s common stockholders.
As described in greater detail under Item 1. Business — Investment Advisory Agreement — Advisory Fee in our Annual Report on Form 10-K for the year ended December 31, 2020, the Company first calculates the Base Fee and any incentive fee under the terms of the Investment Advisory Agreement, then calculates the Base Fee and any incentive fee under the terms of the fee waiver letter unilaterally adopted by Oxford Square Management, effective April 1, 2016 (the “2016 Fee Waiver”), and, finally, adopts the lower of two combined results as the total fees payable to Oxford Square Management.
F-38
OXFORD SQUARE CAPITAL CORP.
NOTES TO CONSOLIDATED FINANCIAL STATEMENTS
DECEMBER 31, 2020
NOTE 7. RELATED PARTY TRANSACTIONS (cont.)
Base Fee
The Base Fee is payable quarterly in arrears, calculated based on a percentage of the average value of our gross assets at the end of the two most recently completed calendar quarters, and appropriately prorated for any partial quarter. Accordingly, the Base Fee will be payable regardless of whether the value of the Company’s gross assets has decreased during the quarter.
Under the terms of the Investment Advisory Agreement, the Base Fee is calculated at an annual rate of 2.00%, and appropriately adjusted for any equity or debt capital raises, repurchases, or redemptions during the current calendar quarter.
Under the terms of the 2016 Fee Waiver, for the purpose of calculating the amount of total advisory fees (if any) to be waived during a particular calendar quarter, the Base Fee (as a portion of the total calculation) is calculated at an annual rate of 1.50%, and adjusted pro rata for any share issuances, debt issuances, repurchases or redemptions during the current calendar quarter; provided, however, that no Base Fee is payable on the cash proceeds received by the Company in connection with any share or debt issuances until such proceeds have been invested in accordance with the Company’s investment objectives.
The following table represents the portion of the total advisory fee ascribed to the Base Fee (pursuant to the 2016 Fee Waiver calculation) for the years ended December 31, 2020, 2019 and 2018, respectively:
|
($ in millions) |
Year ended December 31, 2020 |
Year ended December 31, 2019 |
Year ended December 31, 2018 |
||||||
|
Base Fee |
$ |
4.5 |
$ |
6.7 |
$ |
7.3 |
|||
The Base Fee payable to Oxford Square Management as of December 31, 2020, 2019, and 2018 was $1,159,703, $1,480,653, and $2,052,373, respectively.
Incentive Fee
The incentive fees are commonly referred to as the “income incentive fee” and the “capital gains incentive fee,” with the first fee payable quarterly in arrears and the second fee payable in arrears at the end of each calendar year.
Net Investment Income Incentive Fee
The first fee (the “Net Investment Income Incentive Fee”), is determined by reference to the Company’s “Pre-Incentive Fee Net Investment Income” (as defined below). Given that this incentive fee is payable without regard to any gain, loss or unrealized depreciation that may occur during the quarter, Oxford Square Management’s incentive fee may be payable notwithstanding a decline in net asset value that quarter.
Under the terms of the Investment Advisory Agreement, the Net Investment Income Incentive Fee is calculated based on our “Pre-Incentive Fee Net Investment Income” for the immediately preceding calendar quarter.
• For this purpose, “Pre-Incentive Fee Net Investment Income” means interest income, dividend income and any other income (including any other fees, such as commitment, origination, structuring, diligence and consulting fees or other fees that the Company receives from portfolio companies) accrued during the calendar quarter minus our operating expenses for the quarter (including the Base Fee, expenses payable under our administration agreement, and any interest expense and dividends paid on any issued and outstanding preferred stock, but excluding the incentive fee). Pre-Incentive Fee Net Investment Income includes, in the case of investments with a deferred interest feature (such as original issue discount, debt instruments with payment-in-kind (“PIK”) interest, and zero coupon securities), accrued income that we have not yet received in cash. Pre-Incentive Fee Net Investment Income does not include any realized capital gains, realized capital losses or unrealized capital appreciation or depreciation.
F-39
OXFORD SQUARE CAPITAL CORP.
NOTES TO CONSOLIDATED FINANCIAL STATEMENTS
DECEMBER 31, 2020
NOTE 7. RELATED PARTY TRANSACTIONS (cont.)
• Pre-Incentive Fee Net Investment Income, expressed as a rate of return on the value of our net assets at the end of the immediately preceding calendar quarter, is compared to one-fourth of an annual “hurdle rate.” The annual hurdle rate is determined as of the immediately preceding December 31st by adding 5.0% to the interest rate then payable on the most recently issued five-year U.S. Treasury Notes, up to a maximum annual hurdle rate of 10.0%. The annual hurdle rates for the 2020, 2019 and 2018 calendar years, calculated as of December 31, were 6.69%, 7.51%, and 7.20% respectively, under the terms of the Investment Advisory Agreement. Our net investment income (to the extent not distributed to our shareholders) used to calculate the Net Investment Income Incentive Fee was also included in the amount of our gross assets used to calculate the 2% Base Fee.
a. The operation of the incentive fee with respect to our Pre-Incentive Fee Net Investment Income for each quarter is as follows:
i. no incentive fee was payable to Oxford Square Management in any calendar quarter in which our Pre-Incentive Fee Net Investment Income did not exceed one fourth of the annual hurdle rate (6.69% for the 2020 calendar year).
ii. 20% of the amount of our Pre-Incentive Fee Net Investment Income, if any, that exceeds one-fourth of the annual hurdle rate (6.69% for the 2020 calendar year) in any calendar quarter was payable to Oxford Square Management (i.e., once the hurdle rate is reached, 20% of all Pre-Incentive Fee Net Investment Income thereafter was allocated to Oxford Square Management).
Under the terms of the 2016 Fee Waiver, for the purpose of calculating the amount of total advisory fees (if any) to be waived during a particular calendar quarter, the Income Incentive Fee (as a portion of the total calculation) is calculated based on the amount by which (x) the “Pre-Incentive Fee Net Investment Income” (as defined below) for the calendar quarter exceeds (y) the “Preferred Return Amount” (as defined below) for the calendar quarter.
a. A “Preferred Return Amount” is calculated on a quarterly basis by multiplying 1.75% by the Company’s net asset value at the end of the immediately preceding calendar quarter.
b. The Net Investment Income Incentive Fee is then calculated as follows:
(a) no Net Investment Income Incentive Fee is payable to Oxford Square Management in any calendar quarter in which the “Pre-Incentive Fee Net Investment Income” does not exceed the “Preferred Return Amount”;
(b) 100% of the “Pre-Incentive Fee Net Investment Income” for such quarter, if any, that exceeds the “Preferred Return Amount” but is less than or equal to a “Catch-Up Amount” determined on a quarterly basis by multiplying 2.1875% by OXSQ’s net asset value at the end of such calendar quarter; and
(c) for any quarter in which the “Pre-Incentive Fee Net Investment Income” exceeds the “Catch-Up Amount,” the Net Investment Income Incentive Fee will be 20% of the amount of the “Pre-Incentive Fee Net Investment Income” for such quarter.
c. There is no accumulation of amounts from quarter to quarter for the “Preferred Return Amount,” and accordingly there is no claw back of amounts previously paid to Oxford Square Management if the “Pre-Incentive Fee Net Investment Income” for subsequent quarters is below the quarterly “Preferred Return Amount,” and there is no delay of payment of incentive fees to Oxford Square Management if the “Pre-Incentive Fee Net Investment Income” for prior quarters is below the quarterly “Preferred Return Amount” for the quarter for which the calculation is being made.
F-40
OXFORD SQUARE CAPITAL CORP.
NOTES TO CONSOLIDATED FINANCIAL STATEMENTS
DECEMBER 31, 2020
NOTE 7. RELATED PARTY TRANSACTIONS (cont.)
d. The calculation of the Company’s Net Investment Income Incentive Fee is subject to a total return requirement that provides that a Net Investment Income Incentive Fee will not be payable to Oxford Square Management except to the extent 20% of the “cumulative net increase in net assets resulting from operations” (which is the amount, if positive, of the sum of the “Pre-Incentive Fee Net Investment Income,” realized gains and losses and unrealized appreciation and depreciation) during the calendar quarter for which such fees are being calculated and the eleven (11) preceding quarters exceeds the cumulative Net Investment Income Incentive Fees accrued and/or paid for such eleven (11) preceding quarters.
In the event that the advisory fee calculations under the 2016 Fee Waiver produce a higher combined Base Fee and Net Investment Income Incentive Fee for any quarterly period, the combined fees are set to the original (lower) level, calculated pursuant to the Investment Advisory Agreement. In the event that advisory fee calculations under the 2016 Fee Wavier produce a lower combined Base Fee and Net Investment Income Incentive Fee for that quarterly period, those lower combined fees are adopted for that quarterly period. In either case, the lower level of combined fees is used for that quarter, and, accordingly, the advisory fee payable to Oxford Square Management can only be reduced, and never increased, as a result of the 2016 Fee Waiver.
The following table represents the portion of the total advisory fee ascribed to Net Investment Income Incentive Fees (pursuant to the 2016 Fee Waiver calculation) for each of the years ended December 31, 2020, 2019 and 2018, respectively:
|
($ in millions) |
Year ended |
Year ended |
Year ended |
||||||
|
Net Investment Income Incentive Fee |
$ |
— |
$ |
3.5 |
$ |
4.6 |
|||
There was no Net Investment Income Incentive Fee payable to Oxford Square Management as of December 31, 2020 and 2019. The Net Investment Income Incentive Fee payable to Oxford Square Management as of December 31, 2018 was $1,175,083.
Capital Gains Incentive Fee
The Capital Gains Incentive Fee, which is calculated identically under the Investment Advisory Agreement and under the 2016 Fee Waiver, is determined and payable in arrears as of the end of each calendar year (or upon termination of the Investment Advisory Agreement, as of the termination date), and equals 20% of our “Incentive Fee Capital Gains,” which consists of our realized capital gains for each calendar year, computed net of all realized capital losses and unrealized capital depreciation for that calendar year. For accounting purposes only, in order to reflect the theoretical Capital Gains Incentive Fee that would be payable for a given period as if all unrealized gains were realized, the Company will accrue a Capital Gains Incentive Fee based upon net realized gains and unrealized depreciation for that calendar year (in accordance with the terms of the Investment Advisory Agreement), plus unrealized appreciation on investments held at the end of the period. It should be noted that a fee so calculated and accrued would not necessarily be payable under the Investment Advisory Agreement, and may never be paid based upon the computation of Capital Gains Incentive Fees in subsequent periods. Amounts paid under the Investment Advisory Agreement will be consistent with the formula reflected in the Investment Advisory Agreement.
The amount of Capital Gains Incentive Fee expense related to the hypothetical liquidation of the portfolio (and assuming no other changes in realized or unrealized gains and losses) would only become payable to Oxford Square Management in the event of a complete liquidation of the Company’s portfolio as of period end and the termination of the Investment Advisory Agreement on such date. Also, it should be noted that the Capital Gains Incentive Fee expense fluctuates with the Company’s overall investment results.
F-41
OXFORD SQUARE CAPITAL CORP.
NOTES TO CONSOLIDATED FINANCIAL STATEMENTS
DECEMBER 31, 2020
NOTE 7. RELATED PARTY TRANSACTIONS (cont.)
There were no Capital Gains Incentive Fees based on hypothetical liquidation for the years ended December 31, 2020, 2019 and 2018.
Administration Agreement
The Company has also entered into the Administration Agreement with Oxford Funds under which Oxford Funds provides administrative services for the Company. The Company pays Oxford Funds an allocable portion of overhead and other expenses incurred by Oxford Funds on our behalf under the Administration Agreement, including a portion of the rent and the compensation of the chief financial officer, accounting staff and other administrative support personnel, which creates potential conflicts of interest that the Board must monitor. The Company also reimburses Oxford Funds for the costs associated with the functions performed by OXSQ’s Chief Compliance Officer that Oxford Funds pays on the Company’s behalf pursuant to the terms of an agreement between the Company and Alaric Compliance Services, LLC.
Oxford Square Management is controlled by Oxford Funds, its managing member. Charles M. Royce holds a minority, non-controlling interest in Oxford Square Management. Oxford Funds manages the business and internal affairs of Oxford Square Management. Jonathan H. Cohen, the Company’s Chief Executive Officer, as well as a Director, is the managing member of Oxford Funds. Saul B. Rosenthal, the Company’s President and Chief Operating Officer, is also the President and Chief Operating Officer of Oxford Square Management and a member of Oxford Funds. Messrs. Cohen and Rosenthal together control the equity interests in Oxford Funds.
For the years ended December 31, 2020, 2019 and 2018, the Company incurred approximately $0.7 million, $0.8 million and $0.9 million, respectively, in compensation expenses for the services of employees allocated to the administrative activities of the Company, pursuant to the Administration Agreement with Oxford Funds. In addition, the Company incurred approximately $50,000, $56,000, and $26,000 for facility costs allocated under the Administration Agreement for the years ended December 31, 2020, 2019 and 2018, respectively. As of December 31, 2020 and December 31, 2019, there were no amounts payable under the Administration Agreement.
NOTE 8. INVESTMENT INCOME
The following table sets forth the components of investment income for the years ended December 31, 2020, 2019 and 2018, respectively:
|
December 31, |
December 31, |
December 31, |
|||||||
|
Interest Income |
|
|
|
||||||
|
Stated interest income |
$ |
17,374,998 |
$ |
26,701,382 |
$ |
24,403,191 |
|||
|
Original issue discount and market discount income |
|
1,397,699 |
|
819,595 |
|
613,073 |
|||
|
Payment-in-kind interest income |
|
271,034 |
|
271,642 |
|
290,600 |
|||
|
Discount income derived from unscheduled remittances at par |
|
1,208,324 |
|
207,664 |
|
148,599 |
|||
|
Total interest income |
|
20,252,055 |
|
28,000,283 |
|
25,455,463 |
|||
|
Income from securitization vehicles and investments |
|
15,014,000 |
|
25,244,866 |
|
27,837,032 |
|||
|
Dividend Income – non-cash |
|
— |
|
7,710,805 |
|
— |
|||
|
Other income |
|
|
|
||||||
|
Fee letters |
|
369,231 |
|
884,493 |
|
664,061 |
|||
|
Loan prepayment and bond call fees |
|
200,000 |
|
315,000 |
|
1,130,741 |
|||
|
All other fees |
|
107,219 |
|
494,941 |
|
1,189,971 |
|||
|
Total other income |
|
676,450 |
|
1,694,434 |
|
2,984,773 |
|||
|
Total investment income |
$ |
35,942,505 |
$ |
62,650,388 |
$ |
56,277,268 |
|||
F-42
OXFORD SQUARE CAPITAL CORP.
NOTES TO CONSOLIDATED FINANCIAL STATEMENTS
DECEMBER 31, 2020
NOTE 8. INVESTMENT INCOME (cont.)
The 1940 Act requires that a BDC offer significant managerial assistance to its portfolio companies. The Company may receive fee income for managerial assistance it renders to portfolio companies in connection with its investments. For the years ended December 31, 2020, 2019 and 2018, the Company received no fee income for managerial assistance.
NOTE 9. COMMITMENTS AND CONTINGENCIES
In the normal course of business, the Company enters into a variety of undertakings containing a variety of warranties and indemnifications that may expose the Company to some risk of loss. The risk of future loss arising from such undertakings, while not quantifiable, is expected to be remote.
The Company is not currently subject to any material legal proceedings. From time to time, the Company may be a party to certain legal proceedings in the ordinary course of business, including proceedings relating to the enforcement of the Company’s rights under contracts with its portfolio companies. While the outcome of these legal proceedings cannot be predicted with certainty, the Company does not expect that these proceedings will have a material effect upon its consolidated results of operations and financial condition.
NOTE 10. FINANCIAL HIGHLIGHTS
The following information sets forth OXSQ’s financial highlights for the years ending December 31, 2020, 2019, 2018, 2017, 2016, 2015, 2014, 2013, 2012 and 2011.
|
Year Ended |
Year Ended |
Year Ended |
Year Ended |
Year Ended |
Year Ended |
Year Ended |
Year Ended |
Year Ended |
Year Ended |
|||||||||||||||||||||||||||||||
|
Per Share Data |
|
|
|
|
|
|
|
|
|
|
|
|
|
|
|
|
|
|
|
|
||||||||||||||||||||
|
Net asset value at beginning of year |
$ |
5.12 |
|
$ |
6.60 |
|
$ |
7.55 |
|
$ |
7.50 |
|
$ |
6.40 |
|
$ |
8.64 |
|
$ |
9.85 |
|
$ |
9.90 |
|
$ |
9.30 |
|
$ |
9.85 |
|
||||||||||
|
Net investment income(1)(7) |
|
0.40 |
|
|
0.81 |
|
|
0.67 |
|
|
0.60 |
|
|
0.52 |
|
|
0.66 |
|
|
1.11 |
|
|
1.09 |
|
|
0.98 |
|
|
0.92 |
|
||||||||||
|
Net realized and unrealized gains (losses)(2)(7) |
|
(0.36 |
) |
|
(1.49 |
) |
|
(0.91 |
) |
|
0.25 |
|
|
1.62 |
|
|
(1.85 |
) |
|
(1.14 |
) |
|
0.06 |
|
|
0.82 |
|
|
(0.47 |
) |
||||||||||
|
Net change in net asset value from operations |
|
0.04 |
|
|
(0.68 |
) |
|
(0.24 |
) |
|
0.85 |
|
|
2.14 |
|
|
(1.19 |
) |
|
(0.03 |
) |
|
1.15 |
|
|
1.80 |
|
|
0.45 |
|
||||||||||
|
Distributions per share from net investment income |
|
(0.61 |
) |
|
(0.80 |
) |
|
(0.73 |
) |
|
(0.66 |
) |
|
(1.06 |
) |
|
(1.14 |
) |
|
(1.00 |
) |
|
(1.16 |
) |
|
(1.12 |
) |
|
(0.99 |
) |
||||||||||
|
Distributions based on weighted average share impact |
|
— |
|
|
— |
|
|
0.01 |
|
|
— |
|
|
0.01 |
|
|
0.01 |
|
|
(0.03 |
) |
|
(0.04 |
) |
|
(0.04 |
) |
|
— |
|
||||||||||
|
Tax return of capital distributions |
|
— |
|
|
— |
|
|
(0.07 |
) |
|
(0.14 |
) |
|
(0.10 |
) |
|
— |
|
|
(0.16 |
) |
|
— |
|
|
— |
|
|
— |
|
||||||||||
|
Total distributions(3) |
|
(0.61 |
) |
|
(0.80 |
) |
|
(0.79 |
) |
|
(0.80 |
) |
|
(1.15 |
) |
|
(1.13 |
) |
|
(1.19 |
) |
|
(1.20 |
) |
|
(1.16 |
) |
|
(0.99 |
) |
||||||||||
|
Effect of shares issued, net of offering expenses |
|
— |
|
|
— |
|
|
— |
|
|
— |
|
|
— |
|
|
— |
|
|
— |
|
|
— |
|
|
(0.04 |
) |
|
(0.01 |
) |
||||||||||
|
Effect of shares issued/repurchased, gross |
|
— |
|
|
— |
|
|
0.08 |
|
|
— |
|
|
0.11 |
|
|
0.08 |
|
|
0.01 |
|
|
— |
|
|
— |
|
|
— |
|
||||||||||
|
Net asset value at end of year |
$ |
4.55 |
|
$ |
5.12 |
|
$ |
6.60 |
|
$ |
7.55 |
|
$ |
7.50 |
|
$ |
6.40 |
|
$ |
8.64 |
|
$ |
9.85 |
|
$ |
9.90 |
|
$ |
9.30 |
|
||||||||||
|
Per share market value at beginning of year |
$ |
5.44 |
|
$ |
6.47 |
|
$ |
5.74 |
|
$ |
6.61 |
|
$ |
6.08 |
|
$ |
7.53 |
|
$ |
10.34 |
|
$ |
10.12 |
|
$ |
8.65 |
|
$ |
11.21 |
|
||||||||||
|
Per share market value at end of year |
$ |
3.05 |
|
$ |
5.44 |
|
$ |
6.47 |
|
$ |
5.74 |
|
$ |
6.61 |
|
$ |
6.08 |
|
$ |
7.53 |
|
$ |
10.34 |
|
$ |
10.12 |
|
$ |
8.65 |
|
||||||||||
|
Total return based on Market Value(4) |
|
(31.75 |
)% |
|
(4.14 |
)% |
|
26.95 |
% |
|
(2.01 |
)% |
|
33.29 |
% |
|
(4.35 |
)% |
|
(17.22 |
)% |
|
14.68 |
% |
|
30.49 |
% |
|
(14.19 |
)% |
||||||||||
|
Total return based on Net Asset Value(5) |
|
0.82 |
% |
|
(10.26 |
)% |
|
(1.99 |
)% |
|
11.33 |
% |
|
35.31 |
% |
|
(12.73 |
)% |
|
(0.51 |
)% |
|
11.62 |
% |
|
18.92 |
% |
|
4.47 |
% |
||||||||||
|
Shares outstanding at end of year |
|
49,589,607 |
|
|
48,448,987 |
|
|
47,650,959 |
|
|
51,479,409 |
|
|
51,479,409 |
|
|
56,396,435 |
|
|
60,303,769 |
|
|
53,400,745 |
|
|
41,371,286 |
|
|
32,818,428 |
|
||||||||||
F-43
OXFORD SQUARE CAPITAL CORP.
NOTES TO CONSOLIDATED FINANCIAL STATEMENTS
DECEMBER 31, 2020
NOTE 10. FINANCIAL HIGHLIGHTS (cont.)
|
Year Ended |
Year Ended |
Year Ended |
Year Ended |
Year Ended |
Year Ended |
Year Ended |
Year Ended |
Year Ended |
Year Ended |
|||||||||||||||||||||||||||||||
|
Ratios/Supplemental Data(8) |
|
|
|
|
|
|
|
|
|
|
|
|
|
|
|
|
|
|
|
|
||||||||||||||||||||
|
Net assets at end of period (000’s) |
$ |
225,427 |
|
$ |
247,999 |
|
$ |
314,724 |
|
$ |
388,419 |
|
$ |
385,992 |
|
$ |
360,935 |
|
$ |
520,813 |
|
$ |
526,242 |
|
$ |
409,603 |
|
$ |
305,102 |
|
||||||||||
|
Average net assets (000’s) |
$ |
192,137 |
|
$ |
289,373 |
|
$ |
369,258 |
|
$ |
385,947 |
|
$ |
343,328 |
|
$ |
487,894 |
|
$ |
560,169 |
|
$ |
506,093 |
|
$ |
363,584 |
|
$ |
318,305 |
|
||||||||||
|
Ratio of expenses to average net assets |
|
8.45 |
% |
|
8.35 |
% |
|
6.17 |
% |
|
7.95 |
% |
|
12.38 |
% |
|
9.80 |
% |
|
8.70 |
% |
|
9.74 |
% |
|
9.35 |
% |
|
4.77 |
% |
||||||||||
|
Ratio of net investment income to average net assets |
|
10.26 |
% |
|
13.30 |
% |
|
9.07 |
% |
|
7.96 |
% |
|
7.80 |
% |
|
8.12 |
% |
|
12.24 |
% |
|
11.02 |
% |
|
10.23 |
% |
|
9.42 |
% |
||||||||||
|
Portfolio turnover rate(6) |
|
23.72 |
% |
|
12.75 |
% |
|
35.18 |
% |
|
43.02 |
% |
|
25.73 |
% |
|
24.96 |
% |
|
45.91 |
% |
|
38.22 |
% |
|
55.42 |
% |
|
38.47 |
% |
||||||||||
____________
(1) Represents per share net investment income for the period, based upon weighted average shares outstanding.
(2) Net realized and unrealized gains include rounding adjustments to reconcile change in net asset value per share.
(3) Management monitors available taxable earnings, including net investment income and realized capital gains, to determine if a tax return of capital may occur for the year. To the extent the Company’s taxable earnings fall below the total amount of the Company’s distributions for that fiscal year, a portion of those distributions may be deemed a tax return of capital to the Company’s stockholders. The ultimate tax character of the Company’s earnings cannot be determined until tax returns are prepared after the end of the fiscal year.
(4) Total return based on market value equals the increase or decrease of ending market value over beginning market value, plus distributions, assuming distribution reinvestment prices obtained under the Company’s distribution reinvestment plan, excluding any discounts divided by the beginning market value per share.
(5) Total return based on net asset value equals the increase or decrease of ending net asset value over beginning net asset value, plus distributions, divided by the beginning net asset value.
(6) Portfolio turnover rate is calculated using the lesser of the annual cash investment sales and debt repayments or annual cash investment purchases over the average of the total investments at fair value.
(7) During the first quarter of 2015, the Company identified a non-material error in its accounting for income from CLO equity investments. Prospectively as of January 1, 2015, the Company records income from its CLO equity investments using the effective yield method in accordance with the accounting guidance in ASC 325-40, Beneficial Interests in Securitized Financial Assets, based upon an estimation of an effective yield to maturity utilizing assumed cash flows. An out-of-period adjustment to Net Investment Income Incentive Fees, in the amount of $2.4 million, or $0.04 per share, is reflected in the year ended December 31, 2015. Prior period amounts are not materially affected. During the quarter ended September 30, 2015, the Company recorded an out of period adjustment related to a miscalculation of discount accretion which increased interest income and increased investment cost, by approximately $1.4 million. For the year ended December 31, 2015, approximately $1.1 million, or $0.02 per share, of the adjustment related to prior years. The increase in the investment cost has a corresponding effect on the investment’s unrealized depreciation of the same amount. Management concluded the adjustment was not material to previously filed financial statements.
(8) The following table provides supplemental performance ratios measured for the years ended December 31, 2020, 2019, 2018, 2017, 2016, 2015, 2014, 2013, 2012 and 2011:
|
Year Ended |
Year Ended |
Year Ended |
Year Ended |
Year Ended |
Year Ended |
Year Ended |
Year Ended |
Year Ended |
Year Ended |
|||||||||||||||||||||
|
Ratio of expenses to average net assets: |
|
|
|
|
|
|
|
|
|
|
||||||||||||||||||||
|
Expenses before incentive fees |
8.45 |
% |
7.14 |
% |
4.92 |
% |
6.95 |
% |
11.57 |
% |
10.00 |
% |
8.39 |
% |
8.68 |
% |
6.33 |
% |
3.72 |
% |
||||||||||
|
Net Investment Income Incentive |
|
|
|
|
|
|
|
|
|
|
||||||||||||||||||||
|
Fees |
— |
% |
1.21 |
% |
1.24 |
% |
1.00 |
% |
0.81 |
% |
(0.19 |
)% |
1.00 |
% |
1.30 |
% |
1.50 |
% |
0.70 |
% |
||||||||||
|
Capital Gains Incentive Fees |
— |
% |
— |
% |
— |
% |
— |
% |
— |
% |
— |
% |
(0.69 |
)% |
(0.24 |
)% |
1.52 |
% |
0.35 |
% |
||||||||||
|
Ratio of expenses, excluding interest expense, to average net assets |
4.35 |
% |
4.93 |
% |
4.21 |
% |
4.61 |
% |
7.37 |
% |
5.73 |
% |
5.17 |
% |
6.00 |
% |
7.35 |
% |
4.38 |
% |
||||||||||
F-44
OXFORD SQUARE CAPITAL CORP.
NOTES TO CONSOLIDATED FINANCIAL STATEMENTS
DECEMBER 31, 2020
NOTE 10. FINANCIAL HIGHLIGHTS (cont.)
Information about our senior securities is shown in the following tables as of the fiscal years ended December 31, 2020, 2019, 2018, 2017, 2016, 2015, 2014, 2013, 2012, and 2011.
|
Year |
Total Amount |
Asset |
Involuntary |
Average |
|||||||
|
6.25% Unsecured Notes |
|
|
|
||||||||
|
2020 |
$ |
44,790,750 |
$ |
3,044 |
— |
$ |
23.30 |
||||
|
2019 |
$ |
44,790,750 |
$ |
2,786 |
— |
$ |
25.07 |
||||
|
OXSQ Funding Facility |
|
|
|
||||||||
|
2019 |
$ |
28,090,601 |
$ |
2,786 |
— |
|
N/A |
||||
|
2018 |
$ |
85,679,403 |
$ |
3,085 |
— |
|
N/A |
||||
|
6.50% Unsecured Notes |
|
|
|
||||||||
|
2020 |
$ |
64,370,225 |
$ |
3,044 |
— |
$ |
23.65 |
||||
|
2019 |
$ |
64,370,225 |
$ |
2,786 |
— |
$ |
25.43 |
||||
|
2018 |
$ |
64,370,225 |
$ |
3,085 |
— |
$ |
25.51 |
||||
|
2017 |
$ |
64,370,225 |
$ |
7,003 |
— |
$ |
25.90 |
||||
|
2017 Convertible Notes |
|
|
|
||||||||
|
2016 |
$ |
94,542,000 |
$ |
2,707 |
— |
|
N/A |
||||
|
2015 |
$ |
115,000,000 |
$ |
2,007 |
— |
|
N/A |
||||
|
2014 |
$ |
115,000,000 |
$ |
2,024 |
— |
|
N/A |
||||
|
2013 |
$ |
115,000,000 |
$ |
2,141 |
— |
|
N/A |
||||
|
2012 |
$ |
115,000,000 |
$ |
2,200 |
— |
|
N/A |
||||
|
Debt Securitization – TICC CLO 2012-1 LLC |
|
|
|
||||||||
|
2016 |
$ |
129,281,817 |
$ |
2,707 |
— |
|
N/A |
||||
|
2015 |
$ |
240,000,000 |
$ |
2,007 |
— |
|
N/A |
||||
|
2014 |
$ |
240,000,000 |
$ |
2,024 |
— |
|
N/A |
||||
|
2013 |
$ |
240,000,000 |
$ |
2,141 |
— |
|
N/A |
||||
|
2012 |
$ |
120,000,000 |
$ |
2,200 |
— |
|
N/A |
||||
|
TICC Funding, LLC Revolving Credit Facility |
|
|
|
||||||||
|
2014 |
$ |
150,000,000 |
$ |
2,024 |
— |
|
N/A |
||||
|
Debt Securitization – TICC CLO LLC Senior Notes |
|
|
|
||||||||
|
2013 |
$ |
101,250,000 |
$ |
2,141 |
— |
|
N/A |
||||
|
2012 |
$ |
101,250,000 |
$ |
2,200 |
— |
|
N/A |
||||
|
2011 |
$ |
101,250,000 |
$ |
3,998 |
— |
|
N/A |
||||
____________
(1) Total amount of each class of senior securities outstanding at the end of the period presented.
(2) Asset coverage per unit is the ratio of the carrying value of our total consolidated assets, less all liabilities and indebtedness not represented by senior securities, to the aggregate amount of senior securities representing indebtedness. Asset coverage per unit is expressed in terms of dollar amounts per $1,000 of indebtedness.
(3) The amount to which such class of senior security would be entitled upon the voluntary liquidation of the issuer in preference to any security junior to it. The “-” in this column indicates that the Securities and Exchange Commission expressly does not require this information to be disclosed for the types of senior securities representing indebtedness issued by OXSQ as of the stated time periods.
F-45
OXFORD SQUARE CAPITAL CORP.
NOTES TO CONSOLIDATED FINANCIAL STATEMENTS
DECEMBER 31, 2020
NOTE 10. FINANCIAL HIGHLIGHTS (cont.)
(4) Not applicable for any of the senior securities (except for the 6.50% Unsecured Notes and the 6.25% Unsecured Notes) as they are not registered for public trading. For the 6.50% Unsecured Notes, the amounts represent the average of the daily closing prices on the NASDAQ Global Select Market for the period from April 12, 2017 (date of issuance) through December 31, 2017 and for the years ended December 31, 2018, December 31, 2019, and December 31, 2020. For the 6.25% Unsecured Notes, the amounts represent the average of the daily closing prices on the NASDAQ Global Select Market for the period from April 3, 2019 (date of issuance) through December 31, 2019 and for the year ended December 31, 2020.
NOTE 11. DISTRIBUTIONS
The Company intends to continue to operate so as to qualify to be taxed as a RIC under the Code and, as such, the Company would not be subject to federal income tax on the portion of its taxable income and gains distributed to stockholders. To qualify to be taxed as a RIC, the Company is required, among other requirements, to distribute at least 90% of its annual investment company taxable income, as defined by the Code. The amount to be paid out as a distribution each quarter is determined by the Board and is based upon the annual taxable income estimated by the management of the Company. Income calculated in accordance with U.S. federal income tax regulations differs substantially from GAAP income. To the extent that the Company’s cumulative undistributed taxable earnings fall below the amount of distributions declared, however, a portion of the total amount of the Company’s distributions for the fiscal year may be deemed a return of capital for tax purposes to the Company’s stockholders.
The Company intends to comply with the applicable provisions of the Code pertaining to RICs to make distributions of taxable income sufficient to relieve it of substantially all federal income taxes. The Company, at its discretion, may carry forward taxable income in excess of calendar year distributions and pay a 4% excise tax on such income. The Company will accrue excise tax on estimated excess taxable income, if any, as required.
The tax character of distributions declared and paid in 2020 represented, on an estimated basis, $30,265,733 from ordinary income. The tax character of distributions declared and paid in 2019 represented, on an estimated basis, $38,364,085 from ordinary income. The tax character of distributions declared and paid in 2018 represented, on an estimated basis, $36,151,218 from ordinary income, and $3,329,807 from tax return of capital.
GAAP requires adjustments to certain components of net assets to reflect permanent differences between financial and tax reporting. These reclassifications have no effect on net asset value per share. For 2020, 2019 and 2018, the permanent differences between financial and tax reporting are noted below. These adjustments were the result of book/tax differences in the treatment of unscheduled prepayments, book/tax differences in the treatment of prepayment penalty fees, book/tax differences in the treatment of extinguishment fees, book/tax differences in the treatment of CLO equity investments, and adjustment to certain components of net assets from those originally published in quarterly and annual reports to conform to the current period presentation for comparative purposes.
|
December 31, |
||||||||||||
|
2020 |
2019 |
2018 |
||||||||||
|
Adjustment to accumulated net investment income |
$ |
7,506,582 |
|
$ |
5,119,302 |
|
$ |
20,054,560 |
|
|||
|
Adjustment to accumulated net realized gains/losses |
|
(2,346,470 |
) |
|
4,440,273 |
|
|
23,981,110 |
|
|||
|
Adjustment to total distributable earnings/(accumulated losses) |
$ |
5,160,112 |
|
$ |
9,559,575 |
|
$ |
44,035,670 |
|
|||
|
Adjustment to capital in excess of par value |
$ |
(5,160,112 |
) |
$ |
(9,559,575 |
) |
$ |
(44,035,670 |
) |
|||
The Company has adopted an “opt out” distribution reinvestment plan for our common stockholders. As a result, if we make a cash distribution, then stockholders’ cash distributions will be automatically reinvested in additional shares of our common stock, unless they specifically “opt out” of the distribution reinvestment plan so as to receive cash distributions. During the years ended December 31, 2020 and 2019, the Company issued 42,343 and 23,225 shares, respectively, of common stock to stockholders in connection with the distribution reinvestment
F-46
OXFORD SQUARE CAPITAL CORP.
NOTES TO CONSOLIDATED FINANCIAL STATEMENTS
DECEMBER 31, 2020
NOTE 11. DISTRIBUTIONS (cont.)
plan. During the years ended December 31, 2020 and 2019, as part of the Company’s dividend reinvestment plan for its common stockholders, the Company’s dividend administrator purchased 168,139 shares and 97,143 shares, respectively, of common stock for approximately $0.5 million and $0.6 million, respectively, in the open market to satisfy the reinvestment portion of the Company’s dividends.
The Company has available $90,816,505 of capital losses which can be used to offset future capital gains. All of these losses represent long-term capital loss carryforward. The loss carryforward amount does not have an expiration date and therefore can be carried forward indefinitely until utilized. Under the current law, capital losses related to securities realized after October 31 and prior to the Company’s fiscal year end may be deferred as occurring the first day of the following year. During the taxable year ended December 31, 2020, the fund did not utilize any of its capital loss carryforward available from prior years.
As of December 31, 2020, 2019 and 2018, the estimated components of distributable earnings/(accumulated losses) on a tax basis were as follow:
|
December 31, |
||||||||||||
|
2020 |
2019 |
2018 |
||||||||||
|
Distributable ordinary income |
$ |
1,551,625 |
|
$ |
12,112,994 |
|
$ |
— |
|
|||
|
Distributable long-term capital gains (capital loss carry forward) |
|
(90,816,505 |
) |
|
(81,296,397 |
) |
|
(83,390,350 |
) |
|||
|
Unrealized depreciation on investments |
|
(138,454,699 |
) |
|
(135,137,493 |
) |
|
(57,715,367 |
) |
|||
|
Other timing differences |
|
— |
|
|
(4,353 |
) |
|
(1,617,105 |
) |
|||
|
Total accumulated losses |
$ |
(227,719,579 |
) |
$ |
(204,325,249 |
) |
$ |
(142,722,822 |
) |
|||
The 2020 amounts will be finalized before filing the U.S. federal income tax return.
NOTE 12. NET ASSET VALUE PER SHARE
The Company’s net asset value per share as of December 31, 2020, and December 31, 2019, was $4.55 and $5.12, respectively. In determining the Company’s net asset value per share, the Board determined in good faith the fair value of the Company’s portfolio investments for which reliable market quotations are not readily available.
NOTE 13. SHARE ISSUANCE AND REPURCHASE PROGRAMS
On August 1, 2019, the Company entered into an Equity Distribution Agreement with Ladenburg Thalmann & Co. through which the Company may offer for sale, from time to time, up to $150.0 million of the Company’s common stock through an At-the-Market (“ATM”) offering. The Company sold a total of 1,098,277 and 774,803 shares of common stock pursuant to the ATM during the year ended December 31, 2020 and 2019, respectively. The total amount of capital raised under the ATM during the years ended December 31, 2020 and 2019 was approximately $5.8 million and $4.4 million, respectively.
On February 5, 2018, the Board authorized a program for the purpose of repurchasing up to $25.0 million worth of the Company’s common stock. Under that repurchase program, the Company was authorized, but not obligated, to repurchase outstanding common stock in the open market from time to time through December 31, 2018, provided that repurchases comply with the prohibitions under our Insider Trading Policies and Procedures and the guidelines specified in Rule 10b-18 of the Securities Exchange Act of 1934, as amended, including certain price, market volume and timing constraints. Further, any repurchases were to be conducted in accordance with the 1940 Act. During the year ended December 31, 2018, the Company repurchased approximately $25.0 million shares worth of outstanding common stock. During the years ended December 31, 2020, and 2019, the Company was not authorized to repurchase any shares of outstanding common stock.
F-47
OXFORD SQUARE CAPITAL CORP.
NOTES TO CONSOLIDATED FINANCIAL STATEMENTS
DECEMBER 31, 2020
NOTE 14. SELECTED QUARTERLY DATA (UNAUDITED)
|
Year Ended December 31, 2020 |
|||||||||||||
|
Quarter Ended |
Quarter Ended |
Quarter Ended |
Quarter Ended |
||||||||||
|
Total Investment Income |
$ |
8,638,057 |
$ |
8,225,139 |
$ |
8,254,621 |
$ |
10,824,688 |
|
||||
|
Net Investment Income |
|
4,741,740 |
|
4,270,279 |
|
4,329,982 |
|
6,372,491 |
|
||||
|
Net Increase/(Decrease) in Net Assets resulting from Operations |
|
39,664,967 |
|
20,848,768 |
|
20,555,569 |
|
(79,358,013 |
) |
||||
|
Net Increase in Net Assets resulting from Net Investment Income, per common share, basic and diluted |
$ |
0.10 |
$ |
0.09 |
$ |
0.09 |
$ |
0.13 |
|
||||
|
Net Increase/(Decrease) in Net Assets resulting from Operations, per common share, basic and diluted |
$ |
0.80 |
$ |
0.42 |
$ |
0.41 |
$ |
(1.62 |
) |
||||
|
Year Ended December 31, 2019 |
|||||||||||||||
|
Quarter Ended |
Quarter Ended |
Quarter Ended |
Quarter Ended |
||||||||||||
|
Total Investment Income |
$ |
13,429,323 |
|
$ |
14,083,050 |
|
$ |
20,912,901 |
|
$ |
14,225,114 |
||||
|
Net Investment Income |
|
8,397,875 |
|
|
8,937,187 |
|
|
12,779,309 |
|
|
8,363,988 |
||||
|
Net (Decrease)/Increase in Net Assets resulting from Operations |
|
(4,900,715 |
) |
|
(33,110,464 |
) |
|
(7,536,690 |
) |
|
12,749,952 |
||||
|
Net Increase in Net Assets resulting from Net Investment Income, per common share, basic and diluted |
$ |
0.18 |
|
$ |
0.19 |
|
$ |
0.27 |
|
$ |
0.18 |
||||
|
Net (Decrease)/Increase in Net Assets resulting from Operations, per common share, basic and diluted |
$ |
(0.10 |
) |
$ |
(0.69 |
) |
$ |
(0.16 |
) |
$ |
0.27 |
||||
|
Year Ended December 31, 2018 |
|||||||||||||
|
Quarter Ended |
Quarter Ended |
Quarter Ended |
Quarter Ended |
||||||||||
|
Total Investment Income |
$ |
15,193,294 |
|
$ |
15,218,452 |
$ |
12,518,722 |
$ |
13,346,800 |
||||
|
Net Investment Income |
|
8,482,607 |
|
|
8,612,504 |
|
7,688,011 |
|
8,723,096 |
||||
|
Net (Decrease)/Increase in Net Assets resulting from Operations |
|
(34,117,656 |
) |
|
6,512,309 |
|
6,901,911 |
|
11,490,063 |
||||
|
Net Increase in Net Assets resulting from Net Investment Income, per common share, basic and diluted |
$ |
0.18 |
|
$ |
0.18 |
$ |
0.15 |
$ |
0.17 |
||||
|
Net (Decrease)/Increase in Net Assets resulting from Operations, per common share, basic and diluted |
$ |
(0.71 |
) |
$ |
0.13 |
$ |
0.14 |
$ |
0.22 |
||||
F-48
OXFORD SQUARE CAPITAL CORP.
NOTES TO CONSOLIDATED FINANCIAL STATEMENTS
DECEMBER 31, 2020
NOTE 15. RECENT ACCOUNTING PRONOUNCEMENTS
In June 2016, the FASB issued ASU 2016-13, Financial Instruments-Credit Losses (Topic 326): Measurement of Credit Losses on Financial Instruments (“ASU 2016-13”), which amends the financial instruments impairment guidance so that an entity is required to measure expected credit losses for financial assets based on historical experience, current conditions and reasonable and supportable forecasts. As such, an entity will use forward-looking information to estimate credit losses. ASU 2016-13 also amends the guidance in FASB ASC Subtopic No. 325-40, Investments-Other, Beneficial Interests in Securitized Financial Assets, related to the subsequent measurement of accretable yield recognized as interest income over the life of a beneficial interest in securitized financial assets under the effective yield method. ASU 2016-13 is effective for financial statements issued for fiscal years beginning after December 15, 2019, including interim periods within those fiscal years. Early adoption is permitted as of the fiscal years beginning after December 15, 2018, including interim periods within those fiscal years. Management has adopted the amendments in ASU 2016-13 as of January 1, 2020. Had the amendments been adopted in 2019, the impact of the adoption would have resulted in an increase in total investment income of approximately $2.2 million for the year ended December 31, 2019.
NOTE 16. RISKS AND UNCERTAINTIES
Periods of market volatility have occurred and could continue to occur in response to pandemics or other events outside of our control. These types of events have adversely affected and could continue to adversely affect operating results for the Company and for its portfolio companies. For example, the COVID-19 pandemic has delivered a shock to the global economy. This outbreak has led and for an unknown period of time will continue to lead to disruptions in local, regional, national and global markets and economies affected thereby, including a recession and a steep increase in unemployment in the United States.
With respect to the U.S. credit markets (in particular for middle market loans), this outbreak has resulted in, and until fully resolved is likely to continue to result in, the following among other things: (i) government imposition of various forms of shelter-in-place orders and the closing of “non-essential” businesses, resulting in significant disruption to the businesses of many middle-market loan borrowers including supply chains, demand and practical aspects of their operations, as well as in lay-offs of employees, and, while these effects are hoped to be temporary, some effects could be persistent or even permanent; (ii) increased draws by borrowers on revolving lines of credit; (iii) increased requests by borrowers for amendments and waivers of their credit agreements to avoid default, increased defaults by such borrowers and/or increased difficulty in obtaining refinancing at the maturity dates of their loans; (iv) volatility and disruption of these markets including greater volatility in pricing and spreads and difficulty in valuing loans during periods of increased volatility, and liquidity issues; and (v) rapidly evolving proposals and/or actions by state and federal governments to address problems being experienced by the markets and by businesses and the economy in general which will not necessarily adequately address the problems facing the loan market and middle market businesses.
While several countries, as well as certain states, counties and cities in the United States, have relaxed initial public health restrictions with the view to partially or fully reopening their economies, many cities have since experienced a surge in the reported number of cases, hospitalizations and deaths related to the COVID-19 pandemic. These surges have led to the re-introduction of such restrictions and business shutdowns in certain states in the United States and globally and could continue to lead to the re-introduction of such restrictions elsewhere. Health advisors warn that recurring COVID-19 outbreaks will continue if reopening is pursued too soon or in the wrong manner, which may lead to the re-introduction or continuation of certain public health restrictions (such as instituting quarantines, prohibitions on travel and the closure of offices, businesses, schools, retail stores and other public venues). Additionally, as of late December 2020, travelers from the United States are not allowed to visit Canada, Australia or the majority of countries in Europe, Asia, Africa and South America. These continued travel restrictions may prolong the global economic downturn. In addition, although the Federal Food and Drug Administration authorized vaccines for emergency use starting in December 2020, it remains unclear how quickly the vaccines will be distributed nationwide and globally or when “herd immunity” will be achieved and the restrictions that were imposed to slow the spread of the virus will be lifted entirely. The delay in distributing the vaccines could lead
F-49
OXFORD SQUARE CAPITAL CORP.
NOTES TO CONSOLIDATED FINANCIAL STATEMENTS
DECEMBER 31, 2020
NOTE 16. RISKS AND UNCERTAINTIES (cont.)
people to continue to self-isolate and not participate in the economy at pre-pandemic levels for a prolonged period of time. Even after the COVID-19 pandemic subsides, the U.S. economy and most other major global economies may continue to experience a recession, and we anticipate our business and operations could be materially adversely affected by a prolonged recession in the United States and other major markets.
This outbreak is having, and any future outbreaks could have, an adverse impact on the markets and the economy in general, which could have a material adverse impact on, among other things, the ability of lenders to originate loans, the volume and type of loans originated, and the volume and type of amendments and waivers granted to borrowers and remedial actions taken in the event of a borrower default, each of which could negatively impact the amount and quality of loans available for investment by the Company and returns to the Company, among other things. As of the date of this annual report on Form 10-K, it is impossible to determine the scope of this outbreak, or any future outbreaks, how long any such outbreak, market disruption or uncertainties may last, the effect any governmental actions will have or the full potential impact on the Company and our portfolio companies. Any potential impact to our results of operations will depend to a large extent on future developments and new information that could emerge regarding the duration and severity of COVID-19 and the actions taken by authorities and other entities to contain COVID-19 or treat its impact, all of which are beyond our control. These potential impacts, while uncertain, could adversely affect our and our portfolio companies’ operating results.
If the economy is unable to substantially reopen, and high levels of unemployment continue for an extended period of time, loan delinquencies, loan non-accruals, problem assets, and bankruptcies may increase. In addition, collateral for our loans may decline in value, which could cause loan losses to increase and the net worth and liquidity of loan guarantors could decline, impairing their ability to honor commitments to us. An increase in loan delinquencies and non-accruals or a decrease in loan collateral and guarantor net worth could result in increased costs and reduced income which would have a material adverse effect on our business, financial condition or results of operations. Additionally, oil prices collapsed to an 18-year low on supply glut concerns, as shutdowns across the global economy sharply reduced oil demand while Saudi Arabia and Russia engaged in a price war. Central banks and governments have responded with liquidity injections to ease the strain on financial systems and stimulus measures to buffer the shock to businesses and consumers. These measures have helped stabilize certain portions of the financial markets over the short term, but volatility will likely remain elevated until the health crisis itself is under control (via fewer new cases, lower infection rates and/or verified treatments). There are still many unknowns and new information is incoming daily, compounding the difficulty of modeling outcomes for epidemiologists and economists alike.
We cannot be certain as to the duration or magnitude of the economic impact of the COVID-19 pandemic in the markets in which we and our portfolio companies operate, including with respect to travel restrictions, business closures, mitigation efforts (whether voluntary, suggested, or mandated by law) and corresponding declines in economic activity that may negatively impact the U.S. economy and the markets for the various types of goods and services provided by U.S. middle market companies. Depending on the duration, magnitude and severity of these conditions and their related economic and market impacts, certain portfolio companies may suffer declines in earnings and could experience financial distress, which could cause them to default on their financial obligations to the Company and their other lenders.
We will also be negatively affected if our operations and effectiveness or the operations and effectiveness of a portfolio company (or any of the key personnel or service providers of the foregoing) is compromised or if necessary or beneficial systems and processes are disrupted.
Any public health emergency, including the COVID-19 pandemic or any outbreak of other existing or new epidemic diseases, or the threat thereof, and the resulting financial and economic market uncertainty could have a significant adverse impact on the Company and the fair value of its investments. Our valuations, and particularly valuations of private investments and private companies, are inherently uncertain, may fluctuate over short periods of time and are often based on estimates, comparisons and qualitative evaluations of private information that may not show the complete impact of the COVID-19 pandemic and the resulting measures taken in response thereto. These potential impacts, while uncertain, could adversely affect our and our portfolio companies’ operating results.
F-50
OXFORD SQUARE CAPITAL CORP.
NOTES TO CONSOLIDATED FINANCIAL STATEMENTS
DECEMBER 31, 2020
NOTE 16. RISKS AND UNCERTAINTIES (cont.)
The COVID-19 pandemic and the resulting economic dislocations have had adverse consequences for the business operations of some of the Company’s portfolio companies and CLO investments and have adversely affected, and will likely continue to adversely affect, the Company’s operations. The operational and financial performance of the portfolio companies in which the Company makes investments depends on future developments, including the duration and spread of the outbreak, and such uncertainty may in turn impact the valuation of its investments.
Although it is difficult to predict the extent of the impact of the COVID-19 outbreak on the underlying CLO vehicles the Company invests in, the failure by a CLO vehicle to satisfy certain financial covenants, including with respect to adequate collateralization and/or interest coverage tests, could lead to a reduction in its payments to us. In the event that a CLO vehicle fails certain tests, holders of debt senior to us may be entitled to additional payments that would, in turn, reduce the payments we would otherwise be entitled to receive. Separately, the Company may incur expenses to the extent necessary to seek recovery upon default or to negotiate new terms with a defaulting CLO vehicle or any other investment we may make. If any of these occur, it could materially and adversely affect the Company’s operating results and cash flows.
The interests the Company has acquired in CLO vehicles are generally thinly traded or have only a limited trading market. CLO vehicles are typically privately offered and sold, even in the secondary market. As a result, investments in CLO vehicles may be characterized as illiquid securities. In addition to the general risks associated with investing in debt securities, CLO vehicles carry additional risks, including, but not limited to: (i) the possibility that distributions from collateral securities will not be adequate to make interest or other payments; (ii) the quality of the collateral may decline in value or default; (iii) the fact that the Company’s investments in CLO tranches will likely be subordinate to other senior classes of note tranches thereof; and (iv) the complex structure of the security may not be fully understood at the time of investment and may produce disputes with the CLO vehicle or unexpected investment results. The Company’s net asset value may also decline over time if the Company’s principal recovery with respect to CLO equity investments is less than the price that the Company paid for those investments.
The Company places its cash in an overnight money market account and, at times, cash and cash equivalents may exceed the Federal Deposit Insurance Corporation insured limit. In addition, the Company’s portfolio may be concentrated in a limited number of portfolio companies, which will subject the Company to a risk of significant loss if any of these companies defaults on its obligations under any of its debt securities that the Company holds or if those sectors experience a market downturn.
NOTE 17. SUBSEQUENT EVENTS
On February 23, 2021, the Board declared the following distributions payable to stockholders as shown below:
|
Date Declared |
Record Date |
Payable Date |
Per Share Distribution Amount Declared |
|||
|
October 22, 2020 |
January 15, 2021 |
January 29, 2021 |
$0.035 |
|||
|
October 22, 2020 |
February 12, 2021 |
February 26, 2021 |
$0.035 |
|||
|
October 22, 2020 |
March 17, 2021 |
March 31, 2021 |
$0.035 |
|||
|
February 23, 2021 |
April 16, 2021 |
April 30, 2021 |
$0.035 |
|||
|
February 23, 2021 |
May 14, 2021 |
May 28, 2021 |
$0.035 |
|||
|
February 23, 2021 |
June 16, 2021 |
June 30, 2021 |
$0.035 |
The Company’s management evaluated subsequent events through the date of issuance of these Consolidated Financial Statements and noted no other events that necessitate adjustments to or disclosure in the financial statements.
F-51
Item 9. Changes in and Disagreements with Independent Registered Public Accounting Firm on Accounting and Financial Disclosure
None.
Item 9A. Controls and Procedures
(a) Evaluation of Disclosure Controls and Procedures
As of December 31, 2020 (the end of the period covered by this report), we, including our Chief Executive Officer and Chief Financial Officer, evaluated the effectiveness of the design and operation of our disclosure controls and procedures (as defined in Rule 13a-15(e) of the 1934 Act). Based on that evaluation, our management, including our Chief Executive Officer and Chief Financial Officer, concluded that our disclosure controls and procedures were effective and provided reasonable assurance that information required to be disclosed in our periodic SEC filings is recorded, processed, summarized and reported within the time periods specified in the SEC’s rules and forms, and that such information is accumulated and communicated to our management, including our Chief Executive Officer and Chief Financial Officer, as appropriate, to allow timely decisions regarding required disclosure. However, in evaluating the disclosure controls and procedures, management recognized that any controls and procedures, no matter how well designed and operated can provide only reasonable assurance of achieving the desired control objectives, and management necessarily was required to apply its judgment in evaluating the cost-benefit relationship of possible controls and procedures.
(b) Management’s Report on Internal Control Over Financial Reporting
Management is responsible for establishing and maintaining adequate internal control over financial reporting, and for performing an assessment of the effectiveness of internal control over financial reporting as of December 31, 2020. Internal control over financial reporting is a process designed to provide reasonable assurance regarding the reliability of financial reporting and the preparation of financial statements for external purposes in accordance with generally accepted accounting principles. The Company’s internal control over financial reporting includes those policies and procedures that (i) pertain to the maintenance of records that, in reasonable detail, accurately and fairly reflect the transactions and dispositions of the assets of the company; (ii) provide reasonable assurance that transactions are recorded as necessary to permit preparation of financial statements in accordance with generally accepted accounting principles, and that receipts and expenditures of the company are being made only in accordance with authorizations of management and directors of the company; and (iii) provide reasonable assurance regarding prevention or timely detection of unauthorized acquisition, use, or disposition of the company’s assets that could have a material effect on the financial statements.
Management performed an assessment of the effectiveness of the Company’s internal control over financial reporting as of December 31, 2020 based upon criteria in Internal Control — Integrated Framework (2013) issued by the Committee of Sponsoring Organizations of the Treadway Commission (“COSO”). Based on our assessment, management determined that the Company’s internal control over financial reporting was effective as of December 31, 2020 based on the criteria in Internal Control — Integrated Framework issued by COSO.
(c) Changes in Internal Control Over Financial Reporting
Management did not identify any change in the Company’s internal control over financial reporting that occurred during the fourth quarter of 2020 that has materially affected, or is reasonably likely to materially affect, the Company’s internal control over financial reporting.
Not applicable.
85
PART III
Item 10. Directors, Executive Officers and Corporate Governance
Director and Executive Officer Information
The following table sets forth the names, ages and positions held by each of our directors and executive officers, followed by a brief biography of each individual, including the business experience of each individual during the past five years and the specific qualifications that led to the conclusion that each individual should serve as a director.
|
Name |
Age |
Position |
Director Since |
Term Expires |
||||
|
Interested Directors |
||||||||
|
Jonathan H. Cohen |
56 |
Chief Executive Officer |
2003 |
2021 |
||||
|
Charles M. Royce |
81 |
Director |
2003 |
2023 |
||||
|
Independent Directors |
||||||||
|
Steven P. Novak |
73 |
Chairman of the Board |
2003 |
2023 |
||||
|
Richard W. Neu |
65 |
Director |
2016 |
2022 |
||||
|
George Stelljes III |
59 |
Director |
2016 |
2021 |
||||
|
Executive Officers |
||||||||
|
Saul B. Rosenthal |
52 |
President and Chief Operating Officer |
||||||
|
Bruce L. Rubin |
61 |
Chief Financial Officer, Corporate Secretary and Treasurer |
||||||
|
Gerald Cummins |
66 |
Chief Compliance Officer |
Jonathan H. Cohen has served as Chief Executive Officer of both OXSQ and Oxford Square Management, and as the managing member of Oxford Funds, since 2003. Mr. Cohen has also served as Chief Executive Officer and Director of Oxford Lane Capital Corp. (NasdaqGS:OXLC), a registered closed-end fund, and as Chief Executive Officer of Oxford Lane Management, since 2010. Since 2015 and 2018, respectively, Mr. Cohen has also served as the Chief Executive Officer of each of Oxford Bridge Management, LLC, or “Oxford Bridge Management,” the investment adviser to Oxford Bridge, LLC and Oxford Bridge II, LLC (collectively, the “Oxford Bridge Funds”), and, Oxford Gate Management, LLC, or “Oxford Gate Management,” the investment adviser to Oxford Gate Master Fund, LLC, Oxford Gate, LLC, and Oxford Gate (Bermuda) LLC, (collectively the “Oxford Gate Funds”) The Oxford Bridge Funds and the Oxford Gate Funds are private investment funds. Previously, Mr. Cohen managed technology equity research groups at Wit Capital, Merrill Lynch, UBS and Smith Barney. Mr. Cohen is member of the Board of Trustees of Connecticut College. Mr. Cohen received a B.A. in Economics from Connecticut College and an M.B.A. from Columbia University. Mr. Cohen’s depth of experience in managerial positions in investment management, securities research and financial services, as well as his intimate knowledge of our business and operations, gives our Board valuable industry-specific knowledge and expertise on these and other matters.
Steven P. Novak currently serves as the Chairman of the Board of Directors of Quisk, Inc. an early stage mobile payments company, in the process of liquidating its assets. Mr. Novak also served on the Board of Directors of CyberSource Corporation, a payment processing and fraud management company, until its July 2010 acquisition by Visa, Inc. In the course of his tenure at CyberSource Corporation, he served as Chairman of the Audit and Nominating Committees and as Lead Independent Director. Mr. Novak previously served as President of Palladio Capital Management, LLC and as the Principal and Managing Member of the General Partner of Palladio Partners, LP, an equities hedge fund, from July 2002 until July 2009. Mr. Novak received a Bachelor of Science degree from Purdue University and an M.B.A. from Harvard University. A Chartered Financial Analyst, Mr. Novak’s financial expertise from his experience as a financial manager and varied roles on the boards of both publicly-traded and privately-held companies qualifies him to serve as chairman of our Board and provides our Board with particular technology-related knowledge and the perspective of a knowledgeable corporate leader.
Charles M. Royce currently serves as Chairman of the Board of Managers of Royce & Associates, LP. Prior to 2017, Mr. Royce served as Chief Executive Officer of Royce & Associates, LP since 1972. He also manages or co-manages eight of Royce & Associates, LP’s open- and closed-end registered funds. Mr. Royce serves on the
86
Board of Trustees of The Royce Funds. Mr. Royce’s history with us, familiarity with our investment platform, and extensive knowledge of the financial services industry and the investment valuation process in particular qualify him to serve as a member of our Board.
Richard W. Neu currently serves on the board of directors, including on the audit committee, the compensation committee and as a lead director, of Tempur Sealy International, Inc., a manufacturer of mattresses and bedding products. Mr. Neu also currently serves on the board of directors, as chair of the audit committee and as a member of the executive committee and nominating and corporate governance committee of Huntington Bancshares Incorporated, a bank holding company. Until the sale of the company in 2012, he was the lead director and a member of the audit committee and governance committee of Dollar Thrifty Automotive Group, Inc., a car rental business, having served as the chairman of the Dollar Thrifty board of directors from 2010 through 2011. Mr. Neu also served as a director of MCG Capital Corporation, a business development company, from 2007 until its sale in 2015, and during this period served as chairman of the board from 2009 to 2015 and as Chief Executive Officer from November 2011 to November 2012. Mr. Neu served from 1985 to 2004 as Chief Financial Officer of Charter One Financial, Inc., a major regional bank holding company, and a predecessor firm, and as a director of Charter One Financial, Inc. from 1992 to August 2004. Mr. Neu previously worked for KPMG as a senior audit manager. Mr. Neu received a B.B.A. from Eastern Michigan University with a major in accounting. Mr. Neu was selected to serve as a director on our Board due to his extensive knowledge and experience handling complex financial and operational issues through his service as both a director and executive officer of a variety of public companies.
George “Chip” Stelljes III is currently the managing partner of St. John’s Capital, LLC, a vehicle used to make private equity investments. From 2001 to 2013, Mr. Stelljes held various senior positions with the Gladstone Companies, including serving as the chief investment officer, president and a director of Gladstone Capital Corporation and Gladstone Investment Corporation, both of which are business development companies, of Gladstone Commercial Corporation, a real estate investment trust, and of their registered investment adviser, Gladstone Management Corporation. From 1999 to 2001, Mr. Stelljes was a managing member of Camden Partners, a private equity firm which finances high growth companies in communications, education, healthcare and business services sectors. From 1997 to 1999, Mr. Stelljes was a managing director and partner of Columbia Capital, a venture capital firm focused on investments in communications and information technology. From 1989 to 1997, Mr. Stelljes held various positions, including executive vice president and principal, with the Allied Capital companies. From 2001 through 2012, Mr. Stelljes served as a general partner and investment committee member of Patriot Capital and Patriot Capital II, which are private equity funds. Mr. Stelljes currently serves on the board of directors of Intrepid Capital Corporation, an asset management firm. Mr. Stelljes is also currently the chairman of the board of directors of Bluestone Community Development Fund, a closed-end investment company that operates as an interval fund. He is also a former board member and regional president of the National Association of Small Business Investment Companies. Mr. Stelljes holds an MBA from the University of Virginia and a BA in Economics from Vanderbilt University. Mr. Stelljes was selected to serve as a director on our Board due to his more than twenty-five years of experience in the investment analysis, management, and advisory industries.
Saul B. Rosenthal has served as President since 2004 of OXSQ and Oxford Square Management, and is a member of Oxford Funds. In addition, Mr. Rosenthal has served as President and a Director of Oxford Lane Capital Corp. (NasdaqGS:OXLC), a registered closed-end fund, and as President of Oxford Lane Management, since 2010. Mr. Rosenthal has also served as President of Oxford Bridge Management, the investment adviser to the Oxford Bridge, Funds and Oxford Gate Management, the investment advisor to Oxford Gate Funds, since 2015 and 2018, respectively. Mr. Rosenthal was previously an attorney at the law firm of Shearman & Sterling LLP. Mr. Rosenthal serves on the board of the National Museum of Mathematics. Mr. Rosenthal received a B.S., magna cum laude, from the Wharton School of the University of Pennsylvania, a J.D. from Columbia University Law School, where he was a Harlan Fiske Stone Scholar, and a LL.M. (Taxation) from New York University School of Law.
Bruce L. Rubin has served as the Company’s Controller since 2005, the Company’s Senior Vice President and Treasurer since 2009, the Company’s Chief Accounting Officer since August 2015 and the Company’s Chief Financial Officer and Secretary since August 2015. Mr. Rubin has also served as Oxford Lane Capital Corp.’s Chief Financial Officer and Secretary since August 2015, and as its Treasurer and Controller since its initial public offering in 2011. Mr. Rubin also currently serves as the Chief Financial Officer and Secretary of Oxford Lane Management, LLC, Oxford Square Management, Oxford Funds, Oxford Bridge Management, LLC and Oxford Gate Management, LLC. From 1995 to 2003, Mr. Rubin was the Assistant Treasurer & Director of Financial Planning of the New York Mercantile Exchange, Inc., the largest physical commodities futures exchange in the world and
87
has extensive experience with Sarbanes-Oxley, treasury operations and SEC reporting requirements. From 1989 to 1995, Mr. Rubin was a manager in financial operations for the American Stock Exchange, where he was primarily responsible for budgeting matters. Mr. Rubin began his career in commercial banking as an auditor primarily of the commercial lending and municipal bond dealer areas. Mr. Rubin received his BBA in Accounting from Hofstra University where he also obtained his M.B.A. in Finance.
Gerald Cummins has served as the Company’s Chief Compliance Officer since June 2015 pursuant to an agreement between the Company and Alaric Compliance Services, LLC, a compliance consulting firm. Mr. Cummins also currently serves as the Chief Compliance Officer of Oxford Square Management, Oxford Lane Capital Corp., Oxford Lane Management, LLC, Oxford Funds LLC, Oxford Bridge Management, LLC, and since 2018 Oxford Gate Management, LLC. Mr. Cummins has been a Director of Alaric Compliance Services, LLC since June 2014 and in that capacity he also serves as the Chief Compliance Officer to one other business development company. Prior to joining Alaric Compliance Services, LLC, Mr. Cummins was a consultant for Barclays Capital Inc. from 2012 to 2013, where he participated in numerous compliance projects on pricing and valuation, compliance assessments, and compliance policy and procedure development. Prior to his consulting work at Barclays, Mr. Cummins was from 2010 to 2011 the Chief Operating Officer and the Chief Compliance Officer for BroadArch Capital and from 2009 to 2011 the Chief Financial Officer and Chief Compliance Officer to its predecessor New Castle Funds, a long-short equity asset manager. Prior to that, Mr. Cummins spent 25 years at Bear Stearns Asset Management, where he was a Managing Director and held senior compliance, controllers and operations risk positions. Mr. Cummins graduated with a B.A. in Mathematics from Fordham University.
Code of Business Conduct and Ethics
We have adopted a code of business conduct and ethics (the “code”) which applies to, among others, our senior officers, including our Chief Executive Officer and our Chief Financial Officer, as well as every officer, director and employee of OXSQ. Our code can be accessed via our website at http://www.oxfordsquarecapital.com. We intend to disclose amendments to or waivers from a required provision of the code on Form 8-K. We intend to disclose any substantive amendments to, or waivers from, this code of ethics within four business days of the waiver or amendment through a posting on our website.
Nomination of Directors
There have been no material changes to the procedures by which stockholders may recommend nominees to our Board implemented since the filing of our Proxy Statement for our 2020 Annual Meeting of Stockholders.
Audit Committee
The Audit Committee operates pursuant to a charter approved by our Board, copy of which is available on our website at www.oxfordsquarecapital.com. The charter sets forth the responsibilities of the Audit Committee. The Audit Committee’s responsibilities include recommending the selection of our independent registered public accounting firm, reviewing with such independent registered public accounting firm the planning, scope and results of their audit of our financial statements, pre-approving the fees for services performed, reviewing with the independent registered public accounting firm the adequacy of internal control systems, reviewing our annual financial statements and periodic filings, and receiving the audit reports covering our financial statements. The Audit Committee is presently composed of five persons: Messrs. Novak, Neu and Stelljes, all of whom are considered independent under the rules promulgated by the NASDAQ Global Stock Market. Our Board has determined that Messrs. Novak and Neu are each an “audit committee financial expert” as that term is defined under Item 407 of Regulation S-K of the Exchange Act. Messrs. Novak, Neu and Stelljes each meet the current independence and experience requirements of Rule 10A-3 of the Exchange Act and, in addition, are each not an “interested person” of OXSQ as defined in Section 2(a)(19) of the 1940 Act. Mr. Neu currently serves as Chairman of the Audit Committee. The Audit Committee met on four occasions during 2020.
88
Item 11. Executive Compensation
Compensation of Chief Executive Officer and Other Executive Officers
None of our officers receive direct compensation from OXSQ. As a result, we do not engage any compensation consultants. Mr. Cohen, our Chief Executive Officer, and Mr. Rosenthal, our President and Chief Operating Officer, through their ownership interest in Oxford Funds, the managing member of Oxford Square Management, are entitled to a portion of any profits earned by Oxford Square Management, which includes any fees payable to Oxford Square Management under the terms of our Amended Investment Advisory Agreement, less expenses incurred by Oxford Square Management in performing its services under the Amended Investment Advisory Agreement. Messrs. Cohen and Rosenthal do not receive any additional compensation from Oxford Square Management in connection with the management of our portfolio.
The compensation of our Chief Financial Officer and Corporate Secretary is paid by our administrator, Oxford Funds, subject to reimbursement by us of an allocable portion of such compensation for services rendered by our Chief Financial Officer and Corporate Secretary to OXSQ. The allocable portion of such compensation that is reimbursed to Oxford Funds by us is based on an estimate of the time spent by our Chief Financial Officer and Corporate Secretary and other administrative personnel in performing their respective duties for us in accordance with the Administration Agreement. For the fiscal year ended December 31, 2020, we accrued approximately $0.7 million for the allocable portion of compensation expenses incurred by Oxford Funds on our behalf for our Chief Financial Officer, our Treasurer and Controller, and other administrative support personnel, pursuant to our Administration Agreement with Oxford Funds. Mr. Cummins is a Director of Alaric Compliance Services, LLC, and performs his functions as our Chief Compliance Officer under the terms of an agreement between us and Alaric Compliance Services, LLC. For the fiscal year ended December 31, 2020, we accrued approximately $120,000 for the fees paid to Alaric Compliance Services, LLC.
Director Compensation
Each independent director receives an annual fee of $90,000. The Chairman of the Board receives an additional annual fee of $30,000 for his service as Chairman of the Board. In addition, the independent directors receive $4,000 plus reimbursement of reasonable out-of-pocket expenses incurred in connection with attending each Board meeting, $1,500 plus reimbursement of reasonable out-of-pocket expenses incurred in connection with attending each Valuation Committee meeting, $1,500 plus reimbursement of reasonable out of-pocket expenses incurred in connection with attending each Audit Committee meeting, $1,000 plus reimbursement of reasonable out-of-pocket expenses incurred in connection with attending each Nominating and Corporate Governance Committee meeting, $1,000 plus reimbursement of reasonable out-of-pocket expenses incurred in connection with attending each Compensation Committee meeting. The Chairman of the Audit Committee also receives an additional annual fee of $10,000 for his service as chair of the Audit Committee. The Chairman of the Valuation Committee also receives an additional annual fee of $7,500 for his service as chair of the Valuation Committee. The Chairman of the Nominating and Corporate Governance Committee also receives an additional annual fee of $5,000 for his service as chair of the Nominating and Corporate Governance Committee. The Chairman of the Compensation Committee also receives an additional annual fee of $5,000 for his service as chair of the Compensation Committee. No compensation was paid to directors who are interested persons of OXSQ as defined in the 1940 Act.
The following table sets forth compensation of our directors for the year ended December 31, 2020.
|
Name |
Fees Earned or |
All Other |
Total |
|||||
|
Interested Directors |
|
|
||||||
|
Jonathan H. Cohen |
|
— |
— |
|
— |
|||
|
Charles M. Royce |
|
— |
— |
|
— |
|||
|
Independent Directors |
|
|
||||||
|
Steven P. Novak |
$ |
163,000 |
— |
$ |
163,000 |
|||
|
Richard W. Neu |
$ |
143,000 |
— |
$ |
143,000 |
|||
|
George Stelljes III |
$ |
135,500 |
— |
$ |
135,500 |
|||
____________
(1) For a discussion of the independent directors’ compensation, see above.
(2) We do not maintain a stock or option plan, non-equity incentive plan or pension plan for our directors.
89
Compensation Committee
The Compensation Committee operates pursuant to a charter approved by our Board, a copy of which is available on our website at www.oxfordsquarecapital.com. The charter sets forth the responsibilities of the Compensation Committee. The Compensation Committee is responsible for annually reviewing and recommending for approval to our Board the Investment Advisory Agreement and the Administration Agreement. The Compensation Committee is also responsible for reviewing and approving the compensation of the Independent Directors, including the Chairman of the Board. In addition, although we do not directly compensate our executive officers currently, to the extent that we do so in the future, the Compensation Committee would also be responsible for reviewing and evaluating their compensation and making recommendations to the Board regarding their compensation. Lastly, the Compensation Committee would produce a report on our executive compensation practices and policies for inclusion in our proxy statement if required by applicable proxy rules and regulations and, if applicable, make recommendations to the Board on our executive compensation practices and policies. The Compensation Committee has the authority to engage compensation consultants and to delegate their duties and responsibilities to a member or to a subcommittee of the Compensation Committee. The Compensation Committee is presently composed of three persons: Messrs. Novak, Neu and Stelljes, all of whom are considered independent under the rules of the NASDAQ Global Select Market and are not “interested persons” of Oxford Square Capital Corp. as that term is defined in Section 2(a)(19) of the 1940 Act. Mr. Novak serves as Chairman of the Compensation Committee. The Compensation Committee met one time during 2020.
Compensation Committee Interlocks and Insider Participation
During fiscal year 2020 none of the Company’s executive officers served on the Board (or a compensation committee thereof or other board committee performing equivalent functions) of any entities that had one or more executive officers serve on the Compensation Committee of the Company or on the Board of the Company. No current or past executive officers of the Company or its affiliates serve on the Company’s Compensation Committee.
Compensation Committee Report
Currently, none of our executive officers are compensated by the Company and as such the Compensation Committee is not required to produce a report on executive officer compensation for inclusion in our annual report on Form 10-K.
Item 12. Security Ownership of Certain Beneficial Owners and Management and Related Stockholder Matters
The following table sets forth, as of March 19, 2021, the beneficial ownership of each director, the Company’s executive officers, each person known to us to beneficially own 5% or more of the outstanding shares of our common stock, and the executive officers and directors as a group.
Beneficial ownership is determined in accordance with the rules of the Securities and Exchange Commission (“SEC”) and includes voting or investment power with respect to the securities. Ownership information for those persons who beneficially own 5% or more of our shares of common stock is based upon Schedule 13G filings by such persons with the SEC and other information obtained from such persons, if available.
Unless otherwise indicated, the Company believes that each beneficial owner set forth in the table has sole voting and investment power and has the same address as the Company. The Company’s current address is 8 Sound Shore Drive, Suite 255, Greenwich, Connecticut 06830.
90
|
Name of Beneficial Owner |
Number of |
Percentage of |
||||
|
Interested Directors |
|
|
||||
|
Jonathan H. Cohen(3) |
1,412,906 |
|
2.8 |
% |
||
|
Charles M. Royce(4) |
1,505,613 |
|
3.0 |
% |
||
|
Independent Directors |
|
|
||||
|
Steven P. Novak(5) |
17,410 |
|
* |
|
||
|
Richard W. Neu |
70,000 |
|
* |
|
||
|
George Stelljes III |
34,000 |
|
* |
|
||
|
Executive Officers |
|
|
||||
|
Saul B. Rosenthal(3) |
1,251,270 |
|
2.5 |
% |
||
|
Bruce L. Rubin |
8,212 |
|
* |
|
||
|
Gerald Cummins |
— |
|
— |
|
||
|
Executive Officers and Directors as a Group |
4,298,573 |
(6) |
8.7 |
% |
||
____________
* Represents less than one percent
(1) Beneficial ownership has been determined in accordance with Rule 13d-3 under the Exchange Act, as amended (the “Exchange Act”). Assumes no other purchases or sales of our common stock since the information most recently available to us. This assumption has been made under the rules and regulations of the SEC and does not reflect any knowledge that we have with regard to the present intent of the beneficial owners of our common stock listed in this table. Any fractional shares owned directly or beneficially have been rounded down for purposes of this table.
(2) Based on a total of 49,589,607 of our common stock issued and outstanding on March 19, 2021.
(3) Includes 838 held by Oxford Funds, which may be deemed to be beneficially owned by Messrs. Cohen and Rosenthal by virtue of their ownership interests therein.
(4) Mr. Royce may be deemed to beneficially own 1,211,399 held by Royce Family Investments, LLC and 294,214 held by Royce Family Fund, Inc. Mr. Royce disclaims beneficial ownership of any shares directly held by Royce Family Fund, Inc. The address for both of these entities is 745 Fifth Avenue, New York, New York 10151.
(5) These shares are held by Mr. Novak’s spouse, which Mr. Novak may be deemed to beneficially own.
(6) The 838 held by Oxford Funds, described in footnote 3 above, are included in the number of shares held by each of Mr. Cohen and Mr. Rosenthal, but are only counted once 838 in the total held by the executive officers and directors as a group.
Set forth below is the dollar range of equity securities beneficially owned by each of our directors as of March 19, 2021.
|
Name of Director |
Dollar Range of |
|
|
Interested Directors |
||
|
Jonathan H. Cohen |
Over $100,000 |
|
|
Charles M. Royce |
Over $100,000 |
|
|
Independent Directors |
||
|
Steven P. Novak |
$50,001 – $100,000 |
|
|
Richard W. Neu |
Over $100,000 |
|
|
George Stelljes III |
Over $100,000 |
____________
(1) The dollar ranges are: None, $1 – $10,000, $10,001 – $50,000, $50,001 – $100,000, or Over $100,000.
(2) The dollar range of equity securities beneficially owned in us is based on the closing price for our common stock of $4.11 on March 19, 2021 on the NASDAQ Global Select Market. Beneficial ownership has been determined in accordance with Rule 16a-1(a)(2) of the Exchange Act.
91
Item 13. Certain Relationships and Related Transactions, and Director Independence
Transactions with Related Persons
We have entered into the Investment Advisory Agreement with Oxford Square Management. Oxford Square Management is controlled by Oxford Funds, its managing member. In addition to Oxford Funds, Oxford Square Management is owned by Charles M. Royce, a member of our Board, who holds a minority, non-controlling interest in Oxford Square Management as the non-managing member. Oxford Funds, as the managing member of Oxford Square Management, manages the business and internal affairs of Oxford Square Management. In addition, Oxford Funds provides us with office facilities and administrative services pursuant to the Administration Agreement.
Messrs. Cohen and Rosenthal also currently serve as Chief Executive Officer and President, respectively, at Oxford Bridge Management, LLC, the investment adviser to the Oxford Bridge Funds, and Oxford Gate Management, LLC, the investment adviser to the Oxford Gate Funds. Oxford Funds is the managing member of each of Oxford Bridge Management, LLC and Oxford Gate Management, LLC. In addition, Bruce L. Rubin serves as the Chief Financial Officer and Secretary, and Gerald Cummins serves as the Chief Compliance Officer, respectively, of each of Oxford Bridge Management, LLC and Oxford Gate Management, LLC.
Messrs. Cohen and Rosenthal currently serve as Chief Executive Officer and President, respectively, of Oxford Lane Capital Corp., a non-diversified closed-end management investment company that invests primarily in equity and junior debt tranches of CLO vehicles, and its investment adviser, Oxford Lane Management, LLC. Oxford Funds provides Oxford Lane Capital Corp. with office facilities and administrative services pursuant to an administration agreement and also serves as the managing member of Oxford Lane Management, LLC. In addition, Bruce L. Rubin serves as the Chief Financial Officer, Treasurer and Corporate Secretary of Oxford Lane Capital Corp. and Chief Financial Officer and Treasurer of Oxford Lane Management, LLC, and Mr. Cummins serves as the Chief Compliance Officer of Oxford Lane Capital Corp. and Oxford Lane Management, LLC.
As a result, certain conflicts of interest may arise with respect to the management of our portfolio by Messrs. Cohen and Rosenthal on the one hand, and the obligations of Messrs. Cohen and Rosenthal to manage Oxford Lane Capital Corp., the Oxford Bridge Funds and the Oxford Gate Funds, respectively, on the other hand.
Oxford Square Management, Oxford Lane Management, LLC, Oxford Bridge Management, LLC and Oxford Gate Management, LLC are subject to a written policy with respect to the allocation of investment opportunities among the Company, Oxford Lane Capital Corp., the Oxford Bridge Funds and the Oxford Gate Funds. Where investments are suitable for more than one entity, the allocation policy generally provides that, depending on size and subject to current and anticipated cash availability, the absolute size of the investment as well as its relative size compared to the total assets of each entity, current and anticipated weighted average costs of capital, among other factors, an investment amount will be determined by the adviser to each entity. If the investment opportunity is sufficient for each entity to receive its investment amount, then each entity receives the investment amount; otherwise, the investment amount is reduced pro rata. On June 14, 2017, the Securities and Exchange Commission issued an order permitting the Company and certain of its affiliates to complete negotiated co-investment transactions in portfolio companies, subject to certain conditions (the “Order”). Subject to satisfaction of certain conditions to the Order, the Company and certain of its affiliates are now permitted, together with any future BDCs, registered closed-end funds and certain private funds, each of whose investment adviser is the Company’s investment adviser or an investment adviser controlling, controlled by, or under common control with the Company’s investment adviser, to co-invest in negotiated investment opportunities where doing so would otherwise be prohibited under the 1940 Act, providing the Company’s stockholders with access to a broader array of investment opportunities. Pursuant to the Order, we are permitted to co-invest in such investment opportunities with our affiliates if a “required majority” (as defined in Section 57(o) of the 1940 Act) of our independent directors make certain conclusions in connection with a co-investment transaction, including, but not limited to, that (1) the terms of the potential co-investment transaction, including the consideration to be paid, are reasonable and fair to us and our stockholders and do not involve overreaching in respect of us or our stockholders on the part of any person concerned, and (2) the potential co-investment transaction is consistent with the interests of our stockholders and is consistent with our then-current investment objective and strategies.
92
In the ordinary course of business, we may enter into transactions with portfolio companies that may be considered related party transactions. In order to ensure that we do not engage in any prohibited transactions with any persons affiliated with us, we have implemented certain policies and procedures whereby our executive officers screen each of our transactions for any possible affiliations between the proposed portfolio investment, us, companies controlled by us and our employees and directors. We will not enter into any agreements unless and until we are satisfied that doing so will not raise concerns under the 1940 Act or, if such concerns exist, we have taken appropriate actions to seek board review and approval or exemptive relief for such transaction. Our Board reviews these procedures on an annual basis.
We have also adopted a Code of Business Conduct and Ethics which applies to, among others, our senior officers, including our Chief Executive Officer and Chief Financial Officer, as well as all of our officers, directors and employees. Our Code of Business Conduct and Ethics requires that all employees and directors avoid any conflict, or the appearance of a conflict, between an individual’s personal interests and our interests. Pursuant to our Code of Business Conduct and Ethics, each employee, officer and director must disclose any conflicts of interest, or actions or relationships that might give rise to a conflict. Our Audit Committee is charged with approving any waivers under our Code of Ethics. As required by the NASDAQ Global Select Market corporate governance listing standards, the Audit Committee of our Board is also required to review and approve any transactions with related parties (as such term is defined in Item 404 of Regulation S-K).
Director Independence
In accordance with rules of the NASDAQ Stock Market, our Board annually determines each director’s independence. We do not consider a director independent unless our Board has determined that he or she has no material relationship with us. We monitor the relationships of our directors and officers through a questionnaire each director completes no less frequently than annually and updates periodically as information provided in the most recent questionnaire changes.
In order to evaluate the materiality of any such relationship, our Board uses the definition of director independence set forth in the rules promulgated by the NASDAQ Stock Market. Rule 5605(a)(2) provides that a director of a BDC, shall be considered to be independent if he or she is not an “interested person” of OXSQ, as defined in Section 2(a)(19) of the 1940 Act.
The Board has determined that each of the directors is independent and has no relationship with us, except as a director and stockholder, with the exception of Jonathan H. Cohen, as a result of his position as our Chief Executive Officer, and Charles M. Royce, as a result of his ownership of a minority, non-controlling interest in our investment adviser, Oxford Square Management.
Item 14. Principal Accountant Fees and Services
Independent Registered Public Accounting Firm
PricewaterhouseCoopers LLP served as the Company’s independent registered public accounting firm for the years ended December 31, 2020 and December 31, 2019. PricewaterhouseCoopers LLP has advised us that neither the firm nor any present member or associate of it has any material financial interest, direct or indirect, in the Company or its affiliates.
For the years ended December 31, 2020 and December 31, 2019, the Company incurred the following fees for services provided by PricewaterhouseCoopers LLP including expenses:
|
Fiscal Year Ended |
Fiscal Year Ended |
|||||
|
Audit Fees |
$ |
899,308 |
$ |
975,301 |
||
|
Audit-Related Fees |
|
— |
|
— |
||
|
Tax Fees |
|
— |
|
61,500 |
||
|
All Other Fees |
|
— |
|
— |
||
|
Total Fees: |
$ |
899,308 |
$ |
1,036,801 |
||
93
Audit Fees. Audit fees consist of fees billed for professional services rendered for the audit of our year-end financial statements, including reviews of interim financial statements, and services that are normally provided by PricewaterhouseCoopers LLP in connection with statutory and regulatory filings and services provided in connection with securities offerings.
Audit-Related Fees. Audit-related services consist of fees billed for assurance and related services that are reasonably related to the performance of the audit or review of our financial statements and are not reported under “Audit Fees.” These services include attest services that are not required by statute or regulation and consultations concerning financial accounting and reporting standards.
Tax Fees. Tax fees consist of fees billed for professional services for tax compliance. These services include assistance regarding federal, state, and local tax compliance.
All Other Fees. All other fees would include fees for products and services other than the services reported above.
Pre-Approval Policy.
The Audit Committee has established a pre-approval policy that describes the permitted audit, audit-related, tax and other services to be provided by PricewaterhouseCoopers LLP, the Company’s independent registered public accounting firm. The policy requires that the Audit Committee pre-approve the audit and non-audit services performed by the independent auditor in order to assure that the provision of such service does not impair the auditor’s independence.
Any requests for audit, audit-related, tax and other services that have not received general pre-approval must be submitted to the Audit Committee for specific pre-approval, irrespective of the amount, and cannot commence until such approval has been granted. Normally, pre-approval is provided at regularly scheduled meetings of the Audit Committee. However, the Audit Committee may delegate pre-approval authority to one or more of its members. The member or members to whom such authority is delegated shall report any pre-approval decisions to the Audit Committee at its next scheduled meeting. The Audit Committee does not delegate its responsibilities to pre-approve services performed by the independent registered public accounting firm to management.
During the year ended December 31, 2020, the Audit Committee pre-approved 100% of non-audit services in accordance with the pre-approval policy described above.
94
PART IV
Item 15. Exhibits, Financial Statement Schedules
a. Documents Filed as Part of this Report
The following consolidated financial statements are set forth in Item 8:
95
b. Exhibits
The following exhibits are filed as part of this report or hereby incorporated by reference to exhibits previously filed with the SEC:
|
3.1 |
||
|
3.2 |
||
|
3.3 |
||
|
3.4 |
||
|
3.5 |
||
|
4.1 |
||
|
4.2 |
||
|
4.3 |
||
|
4.4 |
||
|
4.5 |
||
|
4.6 |
||
|
4.8 |
||
|
10.1 |
||
|
10.2 |
||
|
10.3 |
||
|
10.4 |
||
|
10.5 |
96
|
14.1 |
||
|
21.1 |
Subsidiaries of Registrant and jurisdiction of incorporation/organization: Oxford Square Funding 2018, LLC — Delaware. |
|
|
23.1 |
||
|
31.1 |
||
|
31.2 |
||
|
32.1 |
Certification of Chief Executive Officer pursuant to Section 906 of The Sarbanes-Oxley Act of 2002.* |
|
|
32.2 |
Certification of Chief Financial Officer pursuant to Section 906 of The Sarbanes-Oxley Act of 2002.* |
____________
* Filed herewith.
c. Financial statement schedule
None.
97
Pursuant to the requirements of Section 13 or 15(d) of the Securities Exchange Act of 1934, the registrant has duly caused this report to be signed on its behalf by the undersigned, thereunto duly authorized.
|
OXFORD Square CAPITAL CORP. |
||
|
Date: March 22, 2021 |
/s/ Jonathan H. Cohen |
|
|
Jonathan H. Cohen |
||
|
Date: March 22, 2021 |
/s/ Bruce L. Rubin |
|
|
Bruce L. Rubin |
Pursuant to the requirements of the Securities Exchange Act of 1934, this report has been signed below by the following persons on behalf of the registrant and in the capacity and on the dates indicated.
|
Date: March 22, 2021 |
/s/ Steven P. Novak |
|
|
Steven P. Novak |
||
|
Date: March 22, 2021 |
/s/ Jonathan H. Cohen |
|
|
Jonathan H. Cohen |
||
|
Date: March 22, 2021 |
/s/ Richard W. Neu |
|
|
Richard W. Neu |
||
|
Date: March 22, 2021 |
/s/ Charles M. Royce |
|
|
Charles M. Royce |
||
|
Date: March 22, 2021 |
/s/ George Stelljes III |
|
|
George Stelljes III |
98