Attached files
| file | filename |
|---|---|
| 8-K - FORM 8-K - Virtu Financial, Inc. | tm216147d1_8k.htm |
Exhibit 99.1
| 1 Virtual FIA Boca March 18, 2021 |

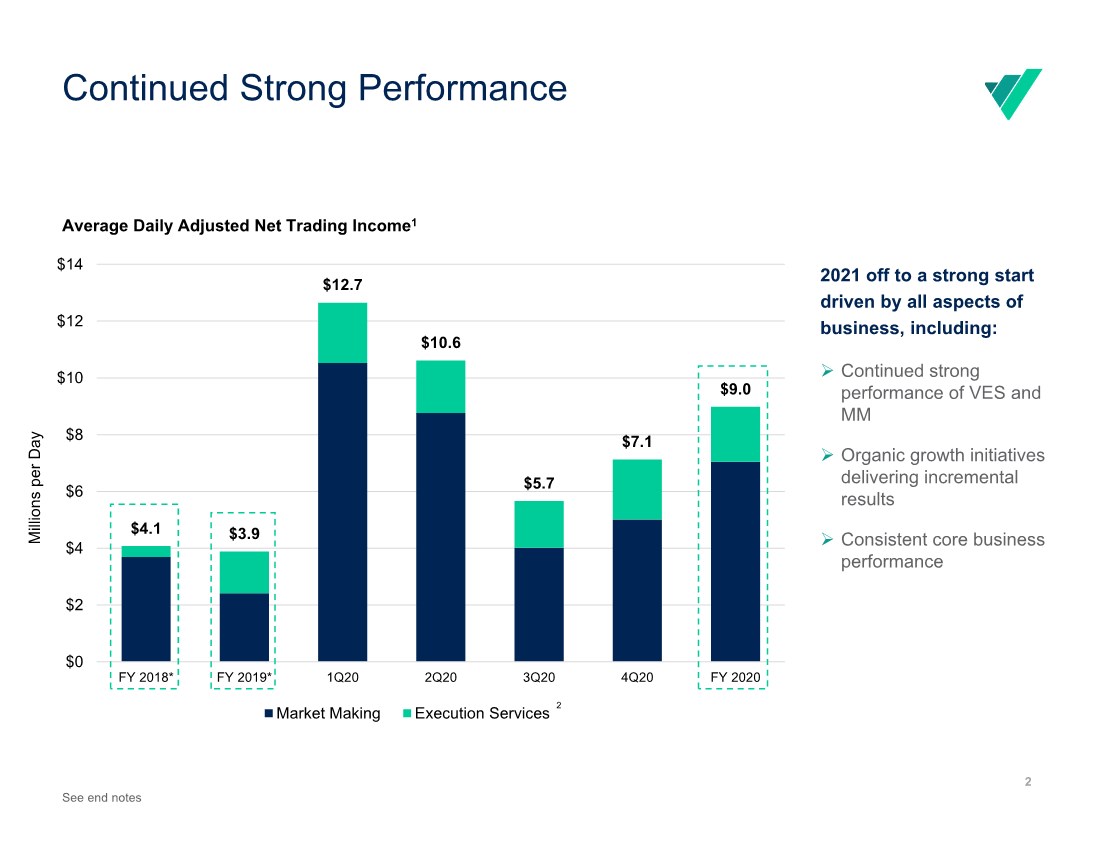
| $4.1 $3.9 $12.7 $10.6 $5.7 $7.1 $9.0 $0 $2 $4 $6 $8 $10 $12 $14 FY 2018* FY 2019* 1Q20 2Q20 3Q20 4Q20 FY 2020 Millions per Day Market Making Execution Services Continued Strong Performance Average Daily Adjusted Net Trading Income1 2 2 2021 off to a strong start driven by all aspects of business, including: Continued strong performance of VES and MM Organic growth initiatives delivering incremental results Consistent core business performance See end notes |
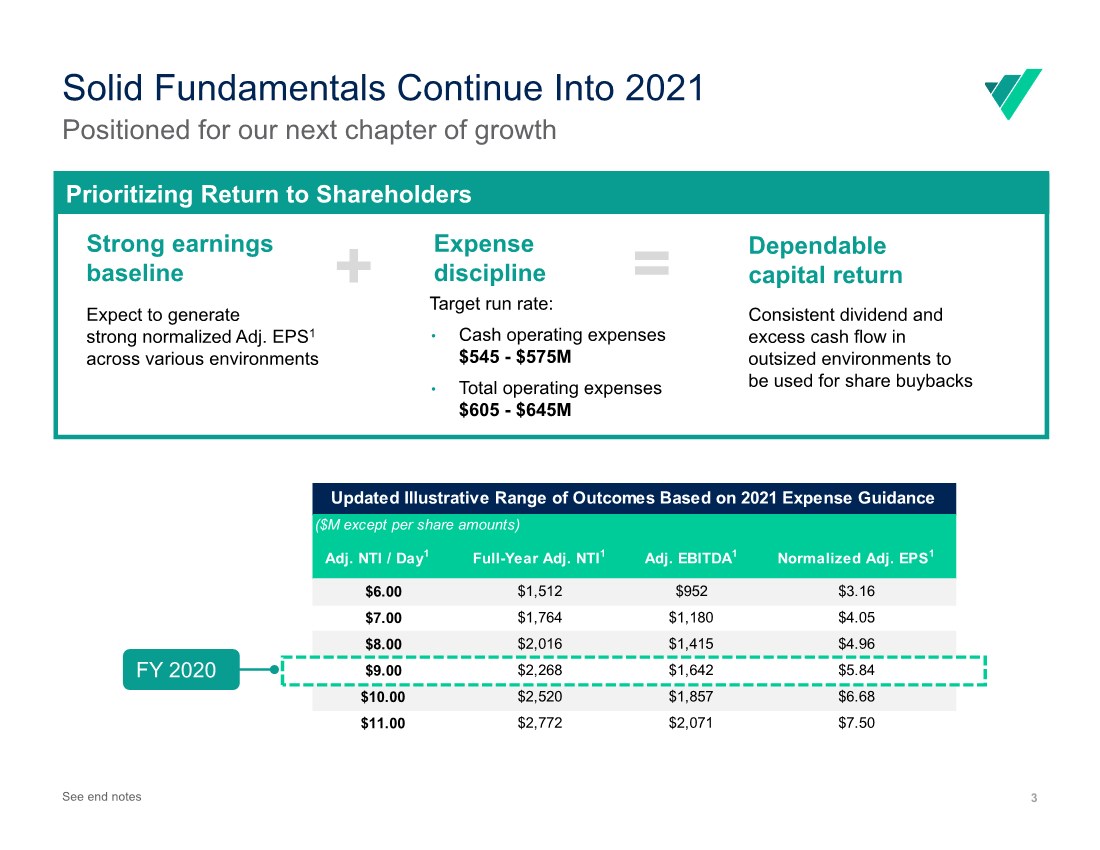
| 3 Adj. NTI / Day1 Full-Year Adj. NTI1 Adj. EBITDA1 Normalized Adj. EPS1 $6.00 $1,512 $952 $3.16 $7.00 $1,764 $1,180 $4.05 $8.00 $2,016 $1,415 $4.96 $9.00 $2,268 $1,642 $5.84 $10.00 $2,520 $1,857 $6.68 $11.00 $2,772 $2,071 $7.50 ($M except per share amounts) Updated Illustrative Range of Outcomes Based on 2021 Expense Guidance Solid Fundamentals Continue Into 2021 Positioned for our next chapter of growth Strong earnings baseline Expect to generate strong normalized Adj. EPS1 across various environments Expense discipline Target run rate: • Cash operating expenses $545 - $575M • Total operating expenses $605 - $645M Dependable capital return Consistent dividend and excess cash flow in outsized environments to be used for share buybacks Prioritizing Return to Shareholders = + FY 2020 See end notes |
| Virtu Investment Highlights Scale Advantage Powers Organic Growth and Innovation Integration drives revenues and margins Leverage scale for product and geographic expansion in Market Making and Execution Services Sizable addressable opportunities Benefiting From Strong Secular Market Shifts Paradigm shift expands addressable market Systemic change in global market activity and retail engagement Leverage Deep Client and Liquidity Network Global market center with vast network of principal, retail, and institutional liquidity Growing, integrated footprint with broad client base Significant growth opportunities across Market Making and Execution Services businesses Strong Financial Profile Increasing revenue diversification: Growing Execution Services business including recurring and subscription-based revenues Scalable model: Significant operating leverage; low fixed costs base and strong margins Highly cash generative business with stable dividend and growing buyback program Exceptional ROIC 4 |
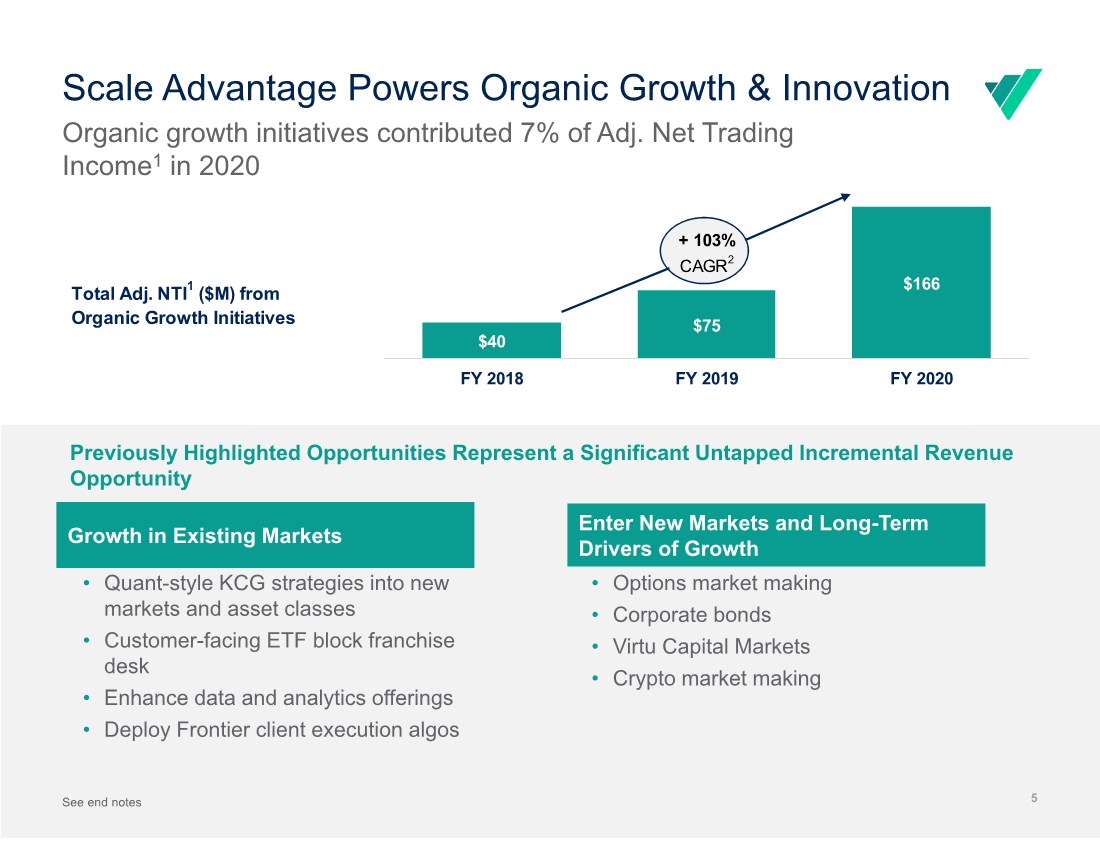
| + 103% CAGR2 Total Adj. NTI1 ($M) from Organic Growth Initiatives % of Adj. NTI: 3% 7% 7% $40 $75 $166 FY 2018 FY 2019 FY 2020 Scale Advantage Powers Organic Growth & Innovation 5 See end notes Previously Highlighted Opportunities Represent a Significant Untapped Incremental Revenue Opportunity % of Adj. NTI1 • Quant-style KCG strategies into new markets and asset classes • Customer-facing ETF block franchise desk • Enhance data and analytics offerings • Deploy Frontier client execution algos Growth in Existing Markets Enter New Markets and Long-Term Drivers of Growth • Options market making • Corporate bonds • Virtu Capital Markets • Crypto market making Organic growth initiatives contributed 7% of Adj. Net Trading Income1 in 2020 |
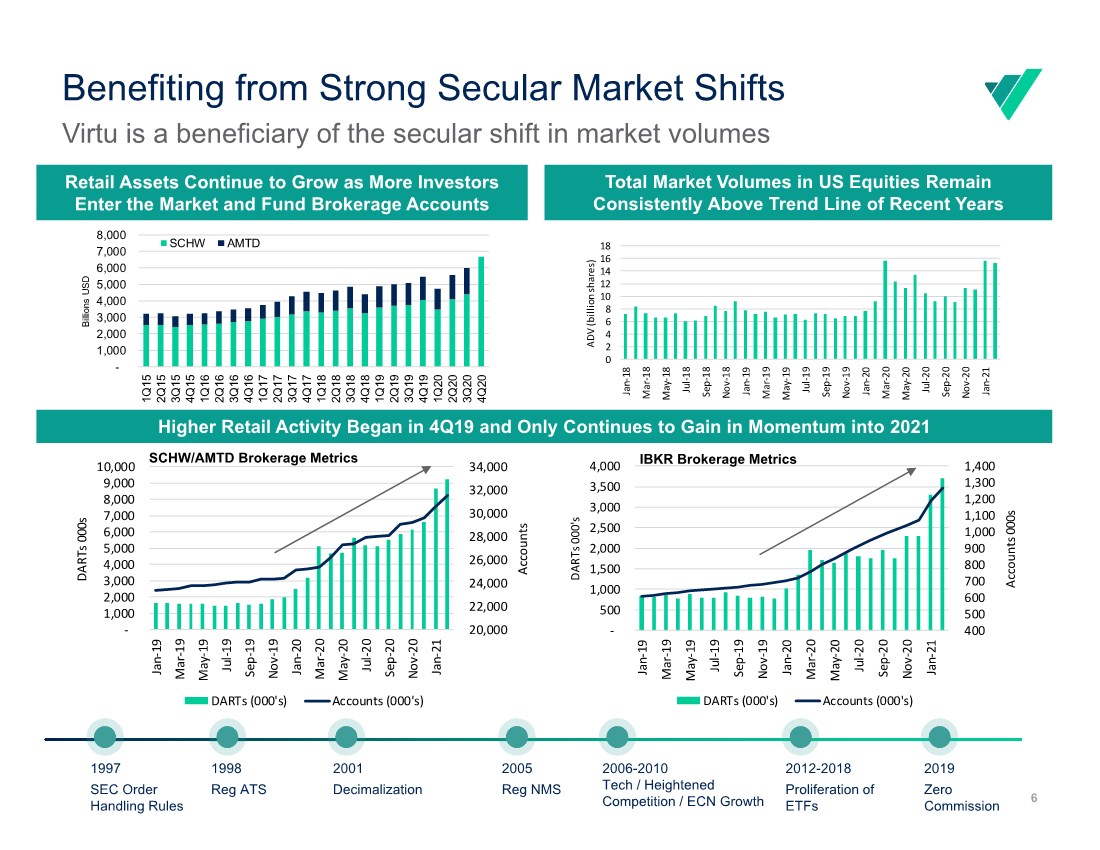
| 6 Benefiting from Strong Secular Market Shifts Virtu is a beneficiary of the secular shift in market volumes 400 500 600 700 800 900 1,000 1,100 1,200 1,300 1,400 ‐ 500 1,000 1,500 2,000 2,500 3,000 3,500 4,000 Jan ‐ 19 Mar ‐ 19 May ‐ 19 Jul ‐ 19 Sep ‐ 19 Nov ‐ 19 Jan ‐ 20 Mar ‐ 20 May ‐ 20 Jul ‐ 20 Sep ‐ 20 Nov ‐ 20 Jan ‐ 21 Accounts 000s DARTs 000's DARTs (000's) Accounts (000's) Retail Assets Continue to Grow as More Investors Enter the Market and Fund Brokerage Accounts Total Market Volumes in US Equities Remain Consistently Above Trend Line of Recent Years 20,000 22,000 24,000 26,000 28,000 30,000 32,000 34,000 ‐ 1,000 2,000 3,000 4,000 5,000 6,000 7,000 8,000 9,000 10,000 Jan ‐ 19 Mar ‐ 19 May ‐ 19 Jul ‐ 19 Sep ‐ 19 Nov ‐ 19 Jan ‐ 20 Mar ‐ 20 May ‐ 20 Jul ‐ 20 Sep ‐ 20 Nov ‐ 20 Jan ‐ 21 Accounts DARTs 000s DARTs (000's) Accounts (000's) 0 2 4 6 8 10 12 14 16 18 Jan ‐ 18 Mar ‐ 18 May ‐ 18 Jul ‐ 18 Sep ‐ 18 Nov ‐ 18 Jan ‐ 19 Mar ‐ 19 May ‐ 19 Jul ‐ 19 Sep ‐ 19 Nov ‐ 19 Jan ‐ 20 Mar ‐ 20 May ‐ 20 Jul ‐ 20 Sep ‐ 20 Nov ‐ 20 Jan ‐ 21 ADV (billion shares) 1997 SEC Order Handling Rules 1998 Reg ATS 2001 Decimalization 2005 Reg NMS 2019 Zero Commission 2006-2010 Tech / Heightened Competition / ECN Growth 2012-2018 Proliferation of ETFs Higher Retail Activity Began in 4Q19 and Only Continues to Gain in Momentum into 2021 IBKR Brokerage Metrics SCHW/AMTD Brokerage Metrics - 1,000 2,000 3,000 4,000 5,000 6,000 7,000 8,000 1Q15 2Q15 3Q15 4Q15 1Q16 2Q16 3Q16 4Q16 1Q17 2Q17 3Q17 4Q17 1Q18 2Q18 3Q18 4Q18 1Q19 2Q19 3Q19 4Q19 1Q20 2Q20 3Q20 4Q20 Billions USD SCHW AMTD |
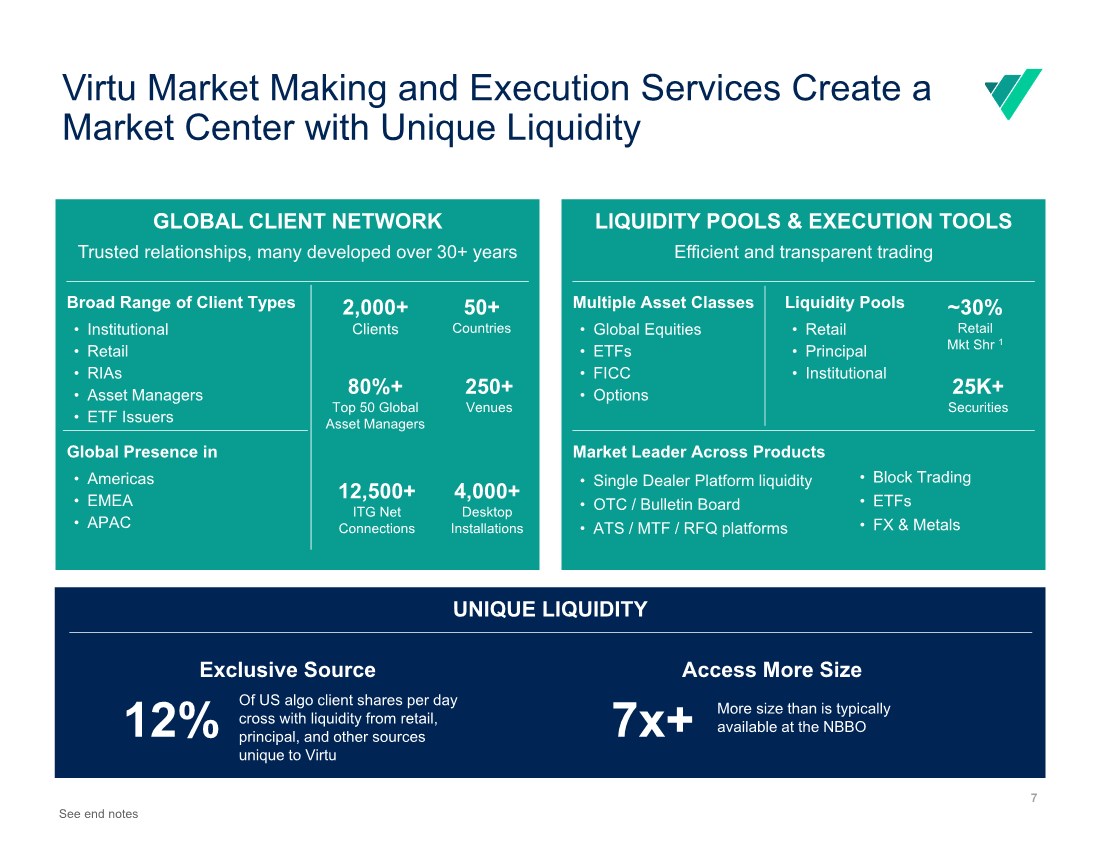
| 7 Virtu Market Making and Execution Services Create a Market Center with Unique Liquidity GLOBAL CLIENT NETWORK Trusted relationships, many developed over 30+ years LIQUIDITY POOLS & EXECUTION TOOLS Efficient and transparent trading See end notes Broad Range of Client Types • Institutional • Retail •RIAs • Asset Managers • ETF Issuers Global Presence in •Americas •EMEA • APAC 2,000+ Clients 50+ Countries 12,500+ ITG Net Connections 4,000+ Desktop Installations 250+ Venues 80%+ Top 50 Global Asset Managers Market Leader Across Products • Single Dealer Platform liquidity • OTC / Bulletin Board • ATS / MTF / RFQ platforms Multiple Asset Classes • Global Equities • ETFs •FICC •Options ~30% Retail Mkt Shr 1 25K+ Securities UNIQUE LIQUIDITY More size than is typically available at the NBBO Access More Size 7x+ Of US algo client shares per day cross with liquidity from retail, principal, and other sources unique to Virtu Exclusive Source 12% Liquidity Pools • Retail • Principal • Institutional • Block Trading • ETFs •FX & Metals |
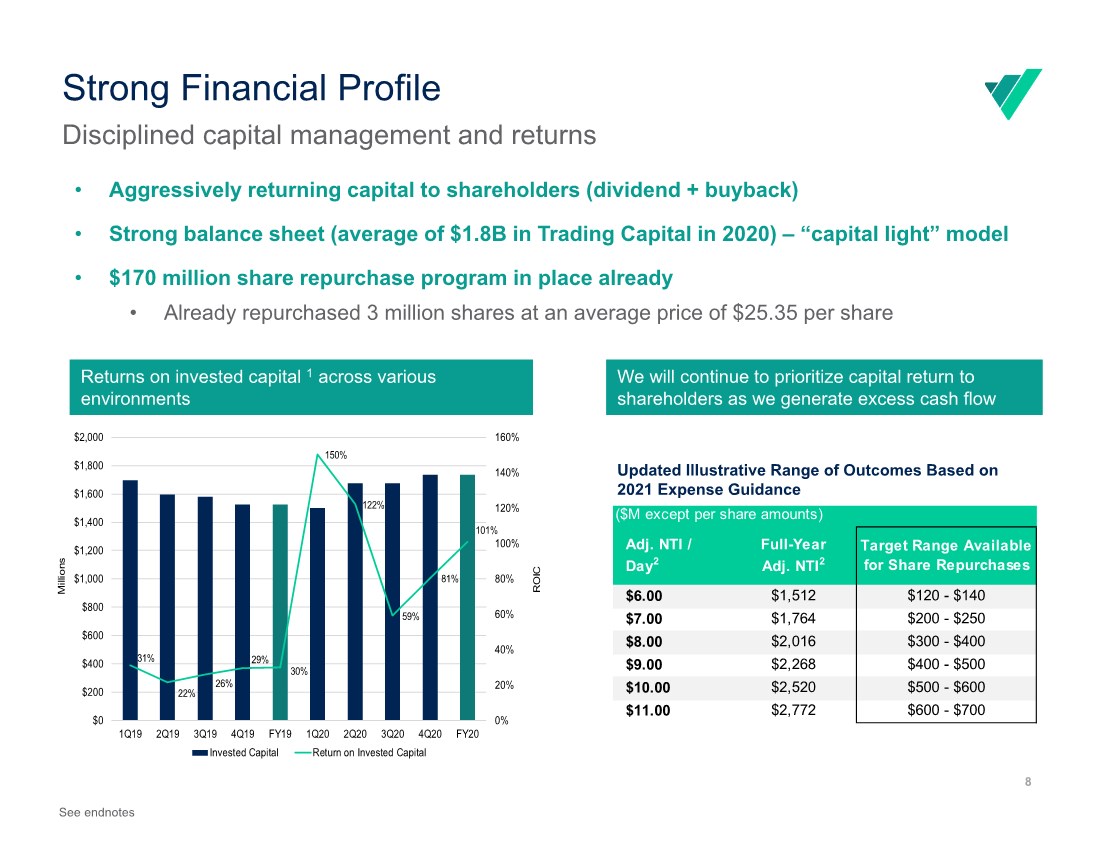
| Strong Financial Profile • Aggressively returning capital to shareholders (dividend + buyback) • Strong balance sheet (average of $1.8B in Trading Capital in 2020) – “capital light” model • $170 million share repurchase program in place already • Already repurchased 3 million shares at an average price of $25.35 per share 8 Returns on invested capital 1 across various environments We will continue to prioritize capital return to shareholders as we generate excess cash flow 31% 22% 26% 29% 30% 150% 122% 59% 81% 101% 0% 20% 40% 60% 80% 100% 120% 140% 160% $0 $200 $400 $600 $800 $1,000 $1,200 $1,400 $1,600 $1,800 $2,000 1Q19 2Q19 3Q19 4Q19 FY19 1Q20 2Q20 3Q20 4Q20 FY20 ROIC Millions Invested Capital Return on Invested Capital Disciplined capital management and returns Updated Illustrative Range of Outcomes Based on 2021 Expense Guidance See endnotes Adj. NTI / Day2 Full-Year Adj. NTI2 Target Range Available for Share Repurchases $6.00 $1,512 $120 - $140 $7.00 $1,764 $200 - $250 $8.00 $2,016 $300 - $400 $9.00 $2,268 $400 - $500 $10.00 $2,520 $500 - $600 $11.00 $2,772 $600 - $700 ($M except per share amounts) |
| Appendices |

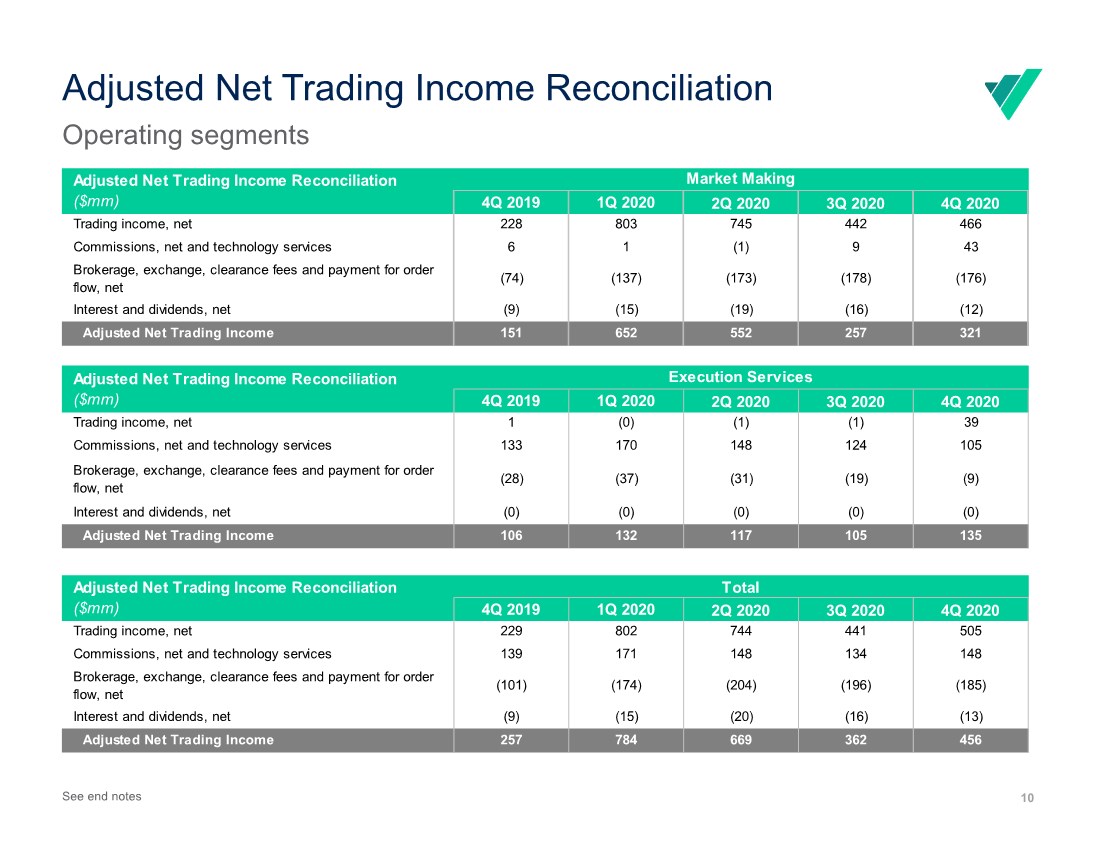
| 10 Adjusted Net Trading Income Reconciliation Operating segments 4Q 2019 1Q 2020 2Q 2020 3Q 2020 4Q 2020 Trading income, net 228 803 745 442 466 Commissions, net and technology services 6 1 (1) 9 43 Brokerage, exchange, clearance fees and payment for order flow, net (74) (137) (173) (178) (176) Interest and dividends, net (9) (15) (19) (16) (12) Adjusted Net Trading Income 151 652 552 257 321 4Q 2019 1Q 2020 2Q 2020 3Q 2020 4Q 2020 Trading income, net 1 (0) (1) (1) 39 Commissions, net and technology services 133 170 148 124 105 Brokerage, exchange, clearance fees and payment for order flow, net (28) (37) (31) (19) (9) Interest and dividends, net (0) (0) (0) (0) (0) Adjusted Net Trading Income 106 132 117 105 135 Adjusted Net Trading Income Reconciliation ($mm) Adjusted Net Trading Income Reconciliation ($mm) Market Making Execution Services 4Q 2019 1Q 2020 2Q 2020 3Q 2020 4Q 2020 Trading income, net 229 802 744 441 505 Commissions, net and technology services 139 171 148 134 148 Brokerage, exchange, clearance fees and payment for order flow, net (101) (174) (204) (196) (185) Interest and dividends, net (9) (15) (20) (16) (13) Adjusted Net Trading Income 257 784 669 362 456 Adjusted Net Trading Income Reconciliation ($mm) Total See end notes |
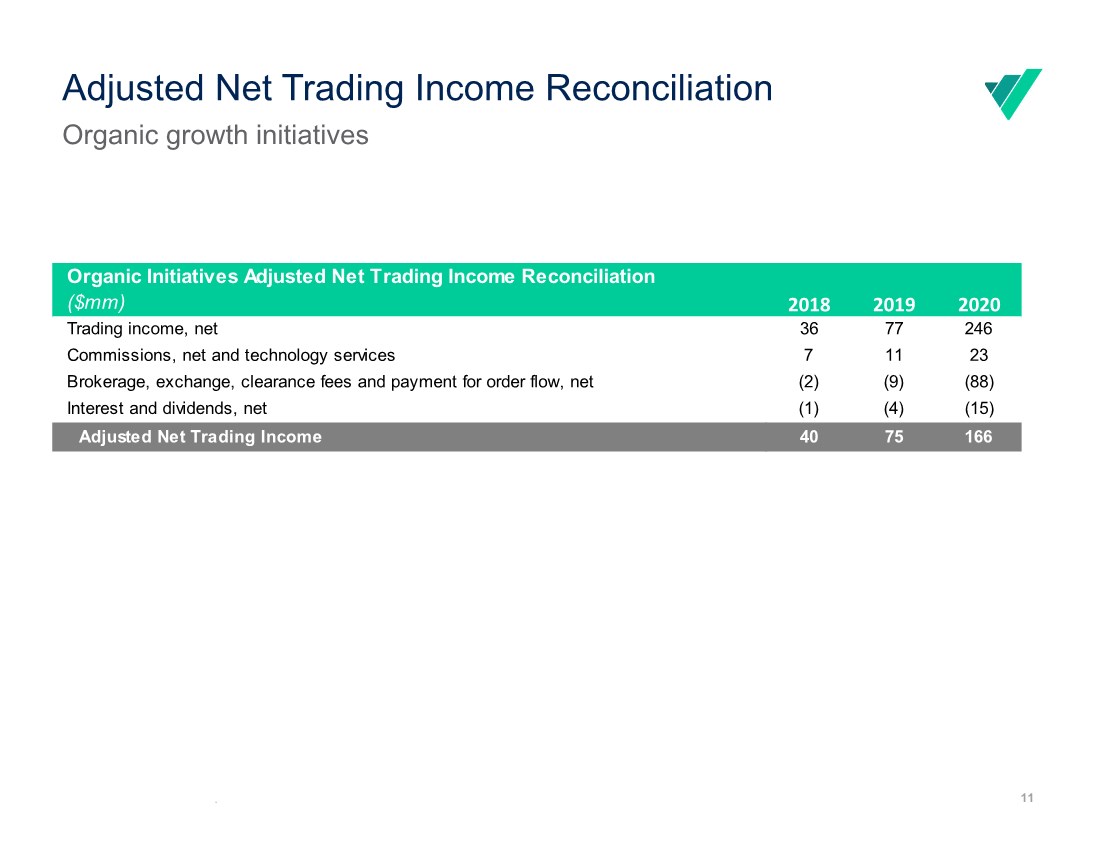
| . 11 Adjusted Net Trading Income Reconciliation Organic growth initiatives 2018 2019 2020 Trading income, net 36 77 246 Commissions, net and technology services 7 11 23 Brokerage, exchange, clearance fees and payment for order flow, net (2) (9) (88) Interest and dividends, net (1) (4) (15) Adjusted Net Trading Income 40 75 166 Organic Initiatives Adjusted Net Trading Income Reconciliation ($mm) |
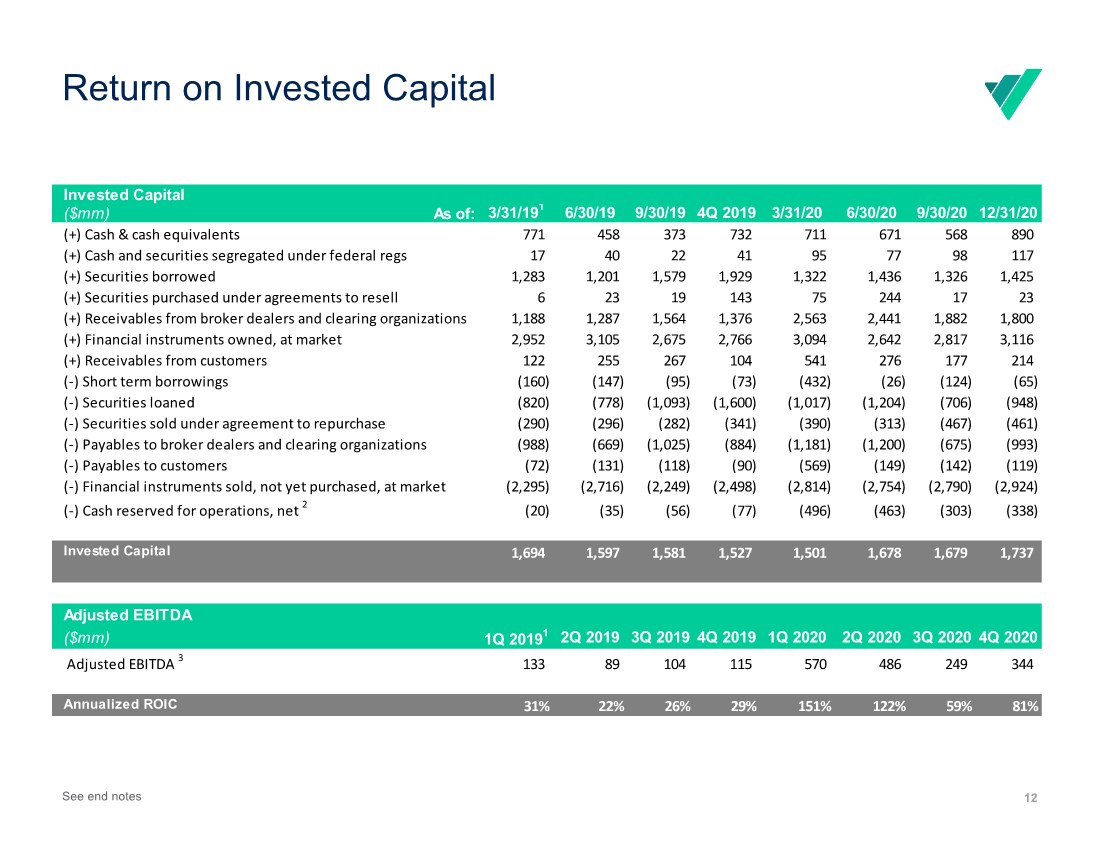
| 12 Return on Invested Capital See end notes Invested Capital ($mm) As of: 3/31/191 6/30/19 9/30/19 4Q 2019 3/31/20 6/30/20 9/30/20 12/31/20 (+) Cash & cash equivalents 771 458 373 732 711 671 568 890 (+) Cash and securities segregated under federal regs 17 40 22 41 95 77 98 117 (+) Securities borrowed 1,283 1,201 1,579 1,929 1,322 1,436 1,326 1,425 (+) Securities purchased under agreements to resell 6 23 19 143 75 244 17 23 (+) Receivables from broker dealers and clearing organizations 1,188 1,287 1,564 1,376 2,563 2,441 1,882 1,800 (+) Financial instruments owned, at market 2,952 3,105 2,675 2,766 3,094 2,642 2,817 3,116 (+) Receivables from customers 122 255 267 104 541 276 177 214 (‐) Short term borrowings (160) (147) (95) (73) (432) (26) (124) (65) (‐) Securities loaned (820) (778) (1,093) (1,600) (1,017) (1,204) (706) (948) (‐) Securities sold under agreement to repurchase (290) (296) (282) (341) (390) (313) (467) (461) (‐) Payables to broker dealers and clearing organizations (988) (669) (1,025) (884) (1,181) (1,200) (675) (993) (‐) Payables to customers (72) (131) (118) (90) (569) (149) (142) (119) (‐) Financial instruments sold, not yet purchased, at market (2,295) (2,716) (2,249) (2,498) (2,814) (2,754) (2,790) (2,924) (‐) Cash reserved for operations, net 2 (20) (35) (56) (77) (496) (463) (303) (338) Invested Capital 1,694 1,597 1,581 1,527 1,501 1,678 1,679 1,737 Adjusted EBITDA ($mm) 1Q 20191 2Q 2019 3Q 2019 4Q 2019 1Q 2020 2Q 2020 3Q 2020 4Q 2020 Adjusted EBITDA 3 133 89 104 115 570 486 249 344 Annualized ROIC 31% 22% 26% 29% 151% 122% 59% 81% |
| Disclaimer 13 Cautionary Statement Regarding Forward Looking Statements This presentation may contain “forward-looking statements” made pursuant to the safe harbor provisions of the Private Securities Litigation Reform Act of 1995. Statements regarding Virtu Financial, Inc.’s (“Virtu’s”, the “Company’s” or “our”) business that are not historical facts are forward-looking statements. Forward-looking statements should not be read as a guarantee of future performance or results, and will not necessarily be accurate indications of the times at, or by which, such performance or results will be achieved. The Company assumes no obligation to update forward-looking statements to reflect actual results, changes in assumptions or changes in other factors affecting forward-looking information, and if the Company does update one or more forward-looking statements, no inference should be drawn that the Company will make additional updates with respect thereto or with respect to other forward-looking statements. Forward-looking statements are based on information available at the time and/or management’s good faith belief with respect to future events, and is subject to risks and uncertainties, some or all of which are not predictable or within Virtu’s control, that could cause actual performance or results to differ materially from those expressed in the statements. Those risks and uncertainties include, without limitation: risks relating to the COVID-19 pandemic, including the possible effects of the economic conditions worldwide resulting from the COVID-19 pandemic and governmental and other responses thereto; fluctuations in trading volume and volatilities in the markets in which we operate; the ability of our trading counterparties and various clearing houses to perform their obligations to us; the performance and reliability of our customized trading platform; the risk of material trading losses from our market making activities; swings in valuations in securities or other instruments in which we hold positions; increasing competition and consolidation in our industry; the effect of the acquisition of Investment Technology Group, Inc. (“ITG”) on existing business relationships, operating results, and ongoing business operations generally; the significant costs and significant indebtedness that we have incurred and expect to incur in connection with the acquisition of ITG; the risk that we may encounter significant difficulties or delays in integrating the two businesses and the anticipated benefits, cost savings and synergies or capital release may not be achieved; the assumption of potential liabilities relating to ITG's business; the risk that cash flow from our operations and other available sources of liquidity will not be sufficient to fund our various ongoing obligations, including operating expenses, short term funding requirements, margin requirements, capital expenditures, debt service and dividend payments; regulatory and legal uncertainties and potential changes associated with our industry, particularly in light of increased attention from media, regulators and lawmakers to market structure and related issues; potential adverse results from legal or regulatory proceedings; our ability to remain technologically competitive and to ensure that the technology we utilize is not vulnerable to security risks, hacking and cyber-attacks; risks associated with third party software and technology infrastructure. For a discussion of the risks and uncertainties which could cause actual results to differ from those contained in forward-looking statements, see Virtu’s Securities and Exchange Commission filings, including but not limited to Virtu’s Annual Report on Form 10-K, Quarterly Reports on Form 10-Q and Current Reports on Form 8-K filed with the SEC. GAAP and Non-GAAP Results This presentation includes certain non-GAAP financial measures, including Adjusted EPS, Normalized Adjusted EPS, Adjusted Net Trading Income, Normalized Adjusted Net Income, Normalized Adjusted Pre-Tax Income, EBITDA, Adjusted EBITDA, EBITDA Margin, Adjusted EBITDA Margin, Trading Capital, Adjusted Operating Expense and Adjusted Compensation Expense. Non-GAAP financial measures should be considered only as supplemental to, and not as superior to, financial measures prepared in accordance with GAAP. Other companies may use similarly titled non-GAAP financial measures that are calculated differently from the way we calculate such measures. Accordingly, our non-GAAP financial measures may not be comparable to similar measures used by other companies. We caution investors not to place undue reliance on such non-GAAP measures, but instead to consider them with the most directly comparable GAAP measure. Non-GAAP financial measures have limitations as analytical tools, and should not be considered in isolation, or as a substitute for our results as reported under GAAP. A reconciliation of non-GAAP measures to the most directly comparable financial measure prepared in accordance with GAAP is included at the end of this presentation. Preliminary Estimates Select preliminary financial and other data set forth above with respect to partial reporting periods has been prepared by, and is the responsibility of our management. The foregoing information and estimates have not been compiled or examined by our independent registered public accounting firm nor have our independent registered public accounting firm performed any procedures with respect to this information or expressed any opinion or any form of assurance of such information. In addition, the foregoing information and estimates are subject to revision as we prepare our consolidated financial statements and other disclosures as of and for the three months ended March 31, 2021, including all disclosures required by U.S. GAAP. Because we have not completed our normal quarterly closing and review procedures for any partial period during the quarter ended March 31, 2021, and subsequent events may occur that require material adjustments to these results, the final results and other disclosures for this period may differ materially from these estimates. These estimates should not be viewed as a substitute for full financial statements prepared in accordance with U.S. GAAP or as a measure of performance. In addition, these estimated results of operations are not necessarily indicative of the results to be achieved for any future period. See "Cautionary Note Regarding Forward-looking Statements." These estimated results of operations should be read together with subsequent filings and announcements. : : |
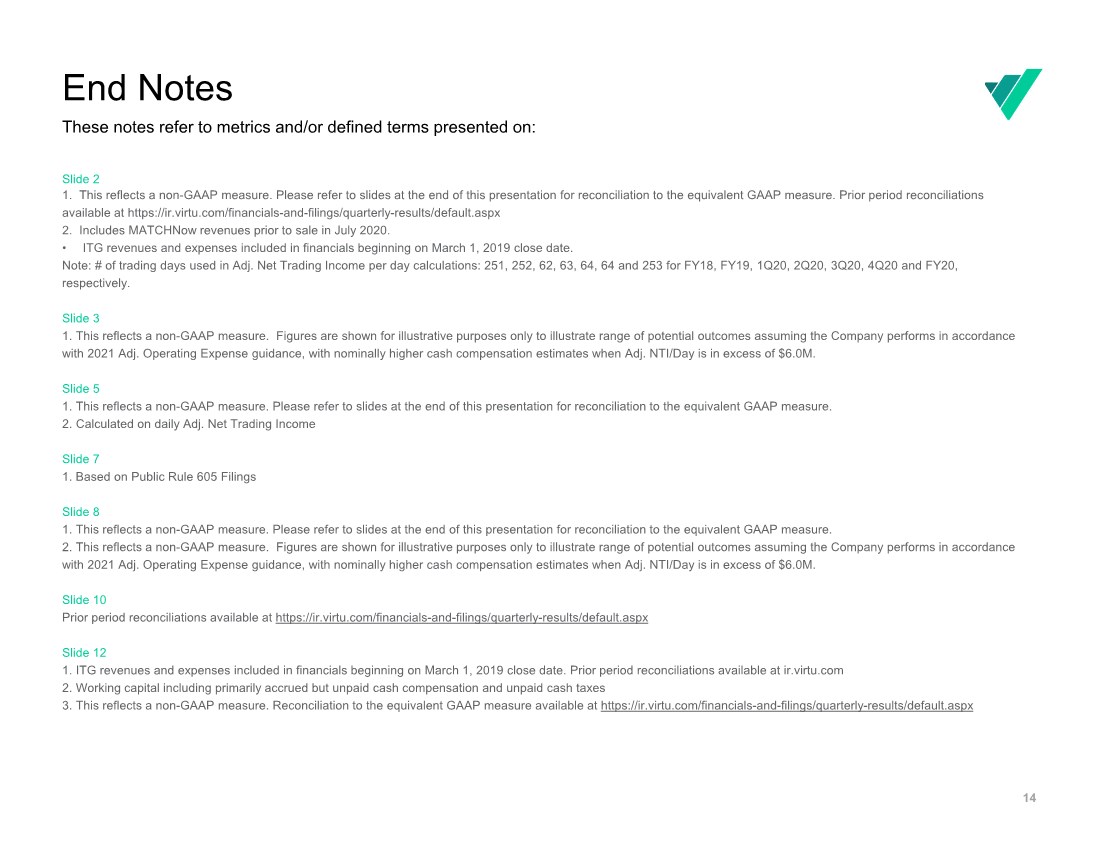
| End Notes 14 These notes refer to metrics and/or defined terms presented on: Slide 2 1. This reflects a non-GAAP measure. Please refer to slides at the end of this presentation for reconciliation to the equivalent GAAP measure. Prior period reconciliations available at https://ir.virtu.com/financials-and-filings/quarterly-results/default.aspx 2. Includes MATCHNow revenues prior to sale in July 2020. • ITG revenues and expenses included in financials beginning on March 1, 2019 close date. Note: # of trading days used in Adj. Net Trading Income per day calculations: 251, 252, 62, 63, 64, 64 and 253 for FY18, FY19, 1Q20, 2Q20, 3Q20, 4Q20 and FY20, respectively. Slide 3 1. This reflects a non-GAAP measure. Figures are shown for illustrative purposes only to illustrate range of potential outcomes assuming the Company performs in accordance with 2021 Adj. Operating Expense guidance, with nominally higher cash compensation estimates when Adj. NTI/Day is in excess of $6.0M. Slide 5 1. This reflects a non-GAAP measure. Please refer to slides at the end of this presentation for reconciliation to the equivalent GAAP measure. 2. Calculated on daily Adj. Net Trading Income Slide 7 1. Based on Public Rule 605 Filings Slide 8 1. This reflects a non-GAAP measure. Please refer to slides at the end of this presentation for reconciliation to the equivalent GAAP measure. 2. This reflects a non-GAAP measure. Figures are shown for illustrative purposes only to illustrate range of potential outcomes assuming the Company performs in accordance with 2021 Adj. Operating Expense guidance, with nominally higher cash compensation estimates when Adj. NTI/Day is in excess of $6.0M. Slide 10 Prior period reconciliations available at https://ir.virtu.com/financials-and-filings/quarterly-results/default.aspx Slide 12 1. ITG revenues and expenses included in financials beginning on March 1, 2019 close date. Prior period reconciliations available at ir.virtu.com 2. Working capital including primarily accrued but unpaid cash compensation and unpaid cash taxes 3. This reflects a non-GAAP measure. Reconciliation to the equivalent GAAP measure available at https://ir.virtu.com/financials-and-filings/quarterly-results/default.aspx |