Attached files
| file | filename |
|---|---|
| EX-99.6 - EX-99.6 - Magyar Bancorp, Inc. | d132199dex996.htm |
| EX-99.2 - EX-99.2 - Magyar Bancorp, Inc. | d132199dex992.htm |
| EX-99.1 - EX-99.1 - Magyar Bancorp, Inc. | d132199dex991.htm |
| EX-23.6 - EX-23.6 - Magyar Bancorp, Inc. | d132199dex236.htm |
| EX-23.2 - EX-23.2 - Magyar Bancorp, Inc. | d132199dex232.htm |
| EX-10.14 - EX-10.14 - Magyar Bancorp, Inc. | d132199dex1014.htm |
| EX-10.11 - EX-10.11 - Magyar Bancorp, Inc. | d132199dex1011.htm |
| EX-10.10 - EX-10.10 - Magyar Bancorp, Inc. | d132199dex1010.htm |
| EX-8.2 - EX-8.2 - Magyar Bancorp, Inc. | d132199dex82.htm |
| EX-8.1 - EX-8.1 - Magyar Bancorp, Inc. | d132199dex81.htm |
| EX-5 - EX-5 - Magyar Bancorp, Inc. | d132199dex5.htm |
| EX-3.3 - EX-3.3 - Magyar Bancorp, Inc. | d132199dex33.htm |
| EX-2 - EX-2 - Magyar Bancorp, Inc. | d132199dex2.htm |
| EX-1.2 - EX-1.2 - Magyar Bancorp, Inc. | d132199dex12.htm |
| EX-1.1 - EX-1.1 - Magyar Bancorp, Inc. | d132199dex11.htm |
| S-1 - S-1 - Magyar Bancorp, Inc. | d132199ds1.htm |
Exhibit 99.3
| PRO FORMA VALUATION REPORT SECOND-STEP CONVERSION |
| Magyar Bancorp, Inc. | New Brunswick, New Jersey
HOLDING COMPANY FOR: Magyar Bank | New Brunswick, New Jersey |
Dated as of February 5, 2021

1311-A Dolley Madison Boulevard
Suite 2A
McLean, Virginia 22101
703.528.1700
rpfinancial.com

February 5, 2021
Boards of Directors
Magyar Bancorp, MHC
Magyar Bancorp, Inc.
Magyar Bank
400 Somerset Street
New Brunswick, New Jersey 08901
Members of the Boards of Directors:
At your request, we have completed and hereby provide an independent appraisal (“Appraisal”) of the estimated pro forma market value of the common stock which is to be issued in connection with the mutual-to-stock conversion transaction described below.
This Appraisal is furnished pursuant to the requirements stipulated in the Code of Federal Regulations and has been prepared in accordance with the “Guidelines for Appraisal Reports for the Valuation of Savings and Loan Associations Converting from Mutual to Stock Form of Organization” of the Office of Thrift Supervision (“OTS”) and accepted by the Federal Reserve Board (“FRB”), the Office of the Comptroller of the Currency (“OCC”), the Federal Deposit Insurance Corporation (“FDIC”) and the New Jersey Department of Banking and Insurance (the “Department”), and applicable regulatory interpretations thereof.
Description of Plan of Conversion
On February 26, 2021, the Board of Directors of Magyar Bancorp MHC (the “MHC”) and the Board of Directors of Magyar Bancorp, Inc. (“MGYR”) and Magyar Bank adopted a plan of conversion. As a result of the conversion, the MHC will be merged into MGYR and as a result the MHC will cease to exist. As part of the conversion, the 55.08% ownership interest of the MHC in MGYR will be offered for sale in the offering. When the conversion is completed, MGYR will continue to own all of the outstanding common stock of Magyar Bank and public stockholders will own all of the outstanding common stock of Magyar Bancorp. For purposes of this document, the existing consolidated entity will hereinafter also be referred to as Magyar Bancorp or the Company, unless otherwise identified as MGYR. As of December 31, 2020, the MHC had a majority ownership interest in, and its principal asset consisted of, 55.08% of the common stock (the “MHC Shares”) of MGYR. The remaining 44.92% of MGYR’s common stock is owned by public stockholders.
It is our understanding that Magyar Bancorp will offer its stock, representing the majority ownership interest held by the MHC, in a subscription offering to Eligible Account Holders, Tax-Qualified Plans including the Bank’s employee stock ownership plan (the “ESOP”) and Supplemental Eligible Account Holders and Other Depositors, as such terms are defined for purposes of applicable federal regulatory requirements governing mutual-to-stock conversions.
| 1311-A Dolley Madison Boulevard, Suite 2A | Telephone: (703) 528-1700 | |
| McLean, VA 22101 | Fax No.: (703) 528-1788 | |
| www.rpfinancial.com | Toll-Free No.: (866) 723-0594 | |
| E-mail: mail@rpfinancial.com |
Boards of Directors
February 5, 2021
Page 2
To the extent that shares remain available for purchase after satisfaction of all subscriptions received in the subscription offering, the shares may be offered for sale to the public at large in a community offering and a syndicated offering or firm commitment underwritten offering. Upon completing the mutual-to-stock conversion and stock offering (the “second-step conversion”), the Company will be 100% owned by public shareholders, the publicly-held shares of MGYR will be exchanged for shares in the Company at a ratio that retains their ownership interest at the time the conversion is completed and the MHC assets will be consolidated with the Company.
RP® Financial, LC.
RP® Financial, LC. (“RP Financial”) is a financial consulting firm serving the financial services industry nationwide that, among other things, specializes in financial valuations and analyses of business enterprises and securities, including the pro forma valuation for savings institutions converting from mutual-to-stock form. The background and experience of RP Financial is detailed in Exhibit V-1. We believe that, except for the fee we will receive for the Appraisal, we are independent of the Company, the Bank, the MHC and the other parties engaged by the Bank or the Company to assist in the stock conversion process.
Valuation Methodology
In preparing our Appraisal, we have reviewed the regulatory applications of the Company, the Bank and the MHC, including the prospectus as filed with the FRB, the FDIC, the Department and the Securities and Exchange Commission (“SEC”). We have conducted a financial analysis of the Company, the Bank and the MHC that has included a review of audited financial information for the years ended September 30, 2016 through September 30, 2020 and for the three month period ended December 31, 2020, a review of various unaudited information and internal financial reports through December 31, 2020, and due diligence related discussions with the Company’s management; RSM US LLP, the Company’s independent auditor; Luse Gorman, PC, the Company’s conversion counsel and Keefe Bruyette & Woods, Inc., the Company’s marketing advisor in connection with the stock offering. All assumptions and conclusions set forth in the Appraisal were reached independently from such discussions. In addition, where appropriate, we have considered information based on other available published sources that we believe are reliable. While we believe the information and data gathered from all these sources are reliable, we cannot guarantee the accuracy and completeness of such information.
We have investigated the competitive environment within which Magyar Bancorp operates and have assessed Magyar Bancorp’s relative strengths and weaknesses. We have kept abreast of the changing regulatory and legislative environment for financial institutions and analyzed the potential impact on Magyar Bancorp and the industry as a whole. We have analyzed the potential effects of the stock conversion on Magyar Bancorp’s operating characteristics and financial performance as they relate to the pro forma market value of Magyar Bancorp. We have analyzed the assets held by the MHC, which will be consolidated with Magyar Bancorp’s assets and equity pursuant to the completion of the second-step conversion. We have reviewed the economic and demographic characteristics of the Company’s primary market area. We have compared Magyar Bancorp’s financial performance and condition with selected publicly-traded thrifts in accordance with the Valuation Guidelines, as well as all publicly-traded thrifts and thrift holding companies. We have reviewed the current conditions in the securities markets in general and the market for thrift stocks in particular, including the market for existing thrift issues, initial public offerings by thrifts and thrift holding companies, and second-step conversion offerings. We have excluded from such analyses thrifts subject to announced or rumored acquisition, and/or institutions that exhibit other unusual characteristics.
Boards of Directors
February 5, 2021
Page 3
The Appraisal is based on Magyar Bancorp’s representation that the information contained in the regulatory applications and additional information furnished to us by Magyar Bancorp and its independent auditor, legal counsel and other authorized agents are truthful, accurate and complete. We did not independently verify the financial statements and other information provided by Magyar Bancorp, or its independent auditor, legal counsel and other authorized agents nor did we independently value the assets or liabilities of Magyar Bancorp. The valuation considers Magyar Bancorp only as a going concern and should not be considered as an indication of Magyar Bancorp’s liquidation value.
Our appraised value is predicated on a continuation of the current operating environment for Magyar Bancorp and for all thrifts and their holding companies. Changes in the local, state and national economy, the legislative and regulatory environment for financial institutions and mutual holding companies, the stock market, interest rates, and other external forces (such as natural disasters or significant world events) may occur from time to time, often with great unpredictability and may materially impact the value of thrift stocks as a whole or the value of Magyar Bancorp’s stock alone. It is our understanding that there are no current plans for selling control of Magyar Bancorp following completion of the second-step conversion. To the extent that such factors can be foreseen, they have been factored into our analysis.
The estimated pro forma market value is defined as the price at which Magyar Bancorp’s common stock, immediately upon completion of the second-step stock offering, would change hands between a willing buyer and a willing seller, neither being under any compulsion to buy or sell and both having reasonable knowledge of relevant facts.
In preparing the pro forma pricing analysis we have taken into account the pro forma impact of the MHC’s net assets (i.e., unconsolidated equity) that will be consolidated with the Company and thus will slightly increase equity. After accounting for the impact of the MHC’s net assets, the public shareholders’ ownership interest was reduced by 0.0073%. Accordingly, for purposes of the Company’s pro forma valuation, the public shareholders’ pro forma ownership interest was reduced from 44.9219% to 44.9146% and the MHC’s ownership interest was increased from 55.0781 to 55.0854%.
Valuation Conclusion
It is our opinion that, as of February 5, 2021, the estimated aggregate pro forma valuation of the shares of the Company to be issued and outstanding at the end of the conversion offering – including (1) newly-issued shares representing the MHC’s current ownership interest in the Company and (2) exchange shares issued to existing public shareholders of MGYR – was $61,722,340 at the midpoint, equal to 6,172,234 shares at $10.00 per share. The resulting range of value and pro forma shares, all based on $10.00 per share, are as follows: $52,463,990 or 5,246,399 shares at the minimum and $70,980,700 or 7,098,070 shares at the maximum.
Based on this valuation and taking into account the ownership interest represented by the shares owned by the MHC, the midpoint of the offering range is $34,000,000 equal to 3,400,000 shares at $10.00 per share. The resulting offering range and offering shares, all based on $10.00 per share, are as follows: $28,900,000 or 2,890,000 shares at the minimum and $39,100,000 or 3,910,000 shares at the maximum.
Boards of Directors
February 5, 2021
Page 4
Establishment of the Exchange Ratio
The conversion regulations provide that in a conversion of a mutual holding company, the minority stockholders are entitled to exchange the public shares for newly issued shares in the fully converted company. The Board of Directors of the MHC and the Board of Directors of MGYR and the Bank have independently determined the exchange ratio, which has been designed to preserve the current aggregate percentage ownership in the Company (adjusted for the dilution resulting from the consolidation of the MHC’s unconsolidated net assets into the Company). The exchange ratio to be received by the existing minority shareholders of the Company will be determined at the end of the offering, based on the total number of shares sold in the offering and the final appraisal. Based on the valuation conclusion herein, the resulting offering value and the $10.00 per share offering price, the indicated exchange ratio at the midpoint is 1.0620 shares of the Company’s stock for every one share held by public shareholders. Furthermore, based on the offering range of value, the indicated exchange ratio is 0.9027 at the minimum and 1.2213 at the maximum. RP Financial expresses no opinion on the proposed exchange of newly issued Company shares for the shares held by the public stockholders or on the proposed exchange ratio.
Limiting Factors and Considerations
The valuation is not intended, and must not be construed, as a recommendation of any kind as to the advisability of purchasing shares of the common stock. Moreover, because such valuation is determined in accordance with applicable regulatory guidelines and is necessarily based upon estimates and projections of a number of matters, all of which are subject to change from time to time, no assurance can be given that persons who purchase shares of common stock in the conversion offering, or prior to that time, will thereafter be able to buy or sell such shares at prices related to the foregoing valuation of the estimated pro forma market value thereof. The appraisal reflects only a valuation range as of this date for the pro forma market value of Magyar Bancorp immediately upon issuance of the stock and does not take into account any trading activity with respect to the purchase and sale of common stock in the secondary market on the date of issuance of such securities or at anytime thereafter following the completion of the second-step conversion.
RP Financial’s valuation was based on the financial condition, operations and shares outstanding of Magyar Bancorp as of December 31, 2020, the date of the financial data included in the prospectus. The proposed exchange ratio to be received by the current public stockholders of MGYR and the exchange of the public shares for newly issued shares of Magyar Bancorp’s common stock as a full public company was determined independently by the Board of Directors of the MHC and the Board of Directors of MGYR and the Bank. RP Financial expresses no opinion on the proposed exchange ratio to public stockholders or the exchange of public shares for newly issued shares.
RP Financial is not a seller of securities within the meaning of any federal and state securities laws and any report prepared by RP Financial shall not be used as an offer or solicitation with respect to the purchase or sale of any securities. RP Financial maintains a policy which prohibits RP Financial, its principals or employees from purchasing stock of its client institutions.
Boards of Directors
February 5, 2021
Page 5
This valuation will be updated as provided for in the conversion regulations and guidelines. These updates will consider, among other things, any developments or changes in the financial performance and condition of Magyar Bancorp, management policies, and current conditions in the equity markets for thrift shares, both existing issues and new issues. These updates may also consider changes in other external factors which impact value including, but not limited to: various changes in the legislative and regulatory environment for financial institutions, the stock market and the market for thrift stocks, and interest rates. Should any such new developments or changes be material, in our opinion, to the valuation of the shares, appropriate adjustments to the estimated pro forma market value will be made. The reasons for any such adjustments will be explained in the update at the date of the release of the update. The valuation will also be updated at the completion of Magyar Bancorp’s stock offering.
| Respectfully submitted, |
| RP® FINANCIAL, LC. |

|
| William E. Pommerening |
| CEO and Managing Director |

|
| James J. Oren |
| Director |
| RP® Financial, LC. | TABLE OF CONTENTS | |
| i |
TABLE OF CONTENTS
Magyar Bancorp, Inc.
New Brunswick, New Jersey
| DESCRIPTION |
PAGE NUMBER |
|||||
| CHAPTER ONE |
OVERVIEW AND FINANCIAL ANALYSIS | |||||
| Introduction |
I.1 | |||||
| Plan of Reorganization |
I.1 | |||||
| Strategic Overview |
I.2 | |||||
| Balance Sheet Trends |
I.4 | |||||
| Income and Expense Trends |
I.7 | |||||
| Interest Rate Risk Management |
I.10 | |||||
| Lending Activities and Strategy |
I.11 | |||||
| Loan Originations, Purchases and Sales |
I.15 | |||||
| Asset Quality |
I.15 | |||||
| Funding Composition and Strategy |
I.16 | |||||
| Subsidiary Operations |
I.16 | |||||
| Legal Proceedings |
I.17 | |||||
| CHAPTER TWO |
MARKET AREA | |||||
| Introduction |
II.1 | |||||
| National Economic Factors |
II.1 | |||||
| Interest Rate Environment |
II.5 | |||||
| Primary Market Area |
II.6 | |||||
| Demographic and Economic Trends |
II.7 | |||||
| Economic Sectors |
II.9 | |||||
| Market Area Largest Employers |
II.10 | |||||
| Market Area Unemployment Data |
II.10 | |||||
| Deposit Trends |
II.12 | |||||
| Competition |
II.13 | |||||
| CHAPTER THREE |
PEER GROUP ANALYSIS |
|||||
| Peer Group Selection |
III.1 | |||||
| Financial Condition |
III.5 | |||||
| Income and Expense Components |
III.8 | |||||
| Loan Composition |
III.10 | |||||
| Credit Risk |
III.12 | |||||
| Interest Rate Risk |
III.14 | |||||
| Summary |
III.14 | |||||
| RP® Financial, LC. | TABLE OF CONTENTS | |
| ii |
TABLE OF CONTENTS
Magyar Bancorp, Inc.
New Brunswick, New Jersey
(continued)
| DESCRIPTION |
PAGE NUMBER |
|||||
| CHAPTER FOUR |
VALUATION ANALYSIS | |||||
| Introduction |
IV.1 | |||||
| Appraisal Guidelines |
IV.1 | |||||
| RP Financial Approach to the Valuation |
IV.1 | |||||
| Valuation Analysis |
IV.2 | |||||
| 1. Financial Condition |
IV.2 | |||||
| 2. Profitability, Growth and Viability of Earnings |
IV.4 | |||||
| 3. Asset Growth |
IV.6 | |||||
| 4. Primary Market Area |
IV.6 | |||||
| 5. Dividends |
IV.7 | |||||
| 6. Liquidity of the Shares |
IV.8 | |||||
| 7. Marketing of the Issue |
IV.8 | |||||
| A. The Public Market |
IV.9 | |||||
| B. The New Issue Market |
IV.14 | |||||
| C. The Acquisition Market |
IV.16 | |||||
| D. Trading in MGYR’s Stock |
IV.16 | |||||
| 8. Management |
IV.17 | |||||
| 9. Effect of Government Regulation and Regulatory Reform |
IV.17 | |||||
| Summary of Adjustments |
IV.17 | |||||
| Valuation Approaches: |
IV.18 | |||||
| 1. Price-to-Earnings (“P/E”) |
IV.20 | |||||
| 2. Price-to-Book (“P/B”) |
IV.20 | |||||
| 3. Price-to-Assets (“P/A”) |
IV.22 | |||||
| Comparison to Recent Offerings |
IV.22 | |||||
| Valuation Conclusion |
IV.22 | |||||
| Establishment of the Exchange Ratio |
IV.23 | |||||
| RP® Financial, LC. | TABLE OF CONTENTS | |
| iii |
LIST OF TABLES
Magyar Bancorp, Inc.
New Brunswick, New Jersey
| TABLE |
DESCRIPTION |
PAGE | ||||
| 1.1 | Historical Balance Sheets |
I.5 | ||||
| 1.2 | Historical Income Statements |
I.8 | ||||
| 2.1 | Summary Demographic/Economic Data |
II.8 | ||||
| 2.2 | Primary Market Area Employment Sectors |
II.10 | ||||
| 2.3 | Market Area Largest Employers |
II.11 | ||||
| 2.4 | Unemployment Trends |
II.12 | ||||
| 2.5 | Deposit Summary |
II.13 | ||||
| 2.6 | Market Area Deposit Competitors – As of June 30, 2020 |
II.15 | ||||
| 3.1 | Peer Group of Publicly-Traded Thrifts |
III.3 | ||||
| 3.2 | Balance Sheet Composition and Growth Rates |
III.6 | ||||
| 3.3 | Income as a Pct. of Avg. Assets and Yields, Costs, Spreads |
III.9 | ||||
| 3.4 | Loan Portfolio Composition and Related Information |
III.11 | ||||
| 3.5 | Interest Rate Risk Measures and Net Interest Income Volatility |
III.13 | ||||
| 3.6 | Credit Risk Measures and Related Information |
III.15 | ||||
| 4.1 | Peer Group Market Area Unemployment Rates |
IV.7 | ||||
| 4.2 | Pricing Characteristics and After-Market Trends |
IV.15 | ||||
| 4.3 | Public Market Pricing Versus Peer Group |
IV.21 | ||||
| RP® Financial, LC. | OVERVIEW AND FINANCIAL ANALYSIS | |
| I.1 |
I. OVERVIEW AND FINANCIAL ANALYSIS
Introduction
Magyar Bank is a New Jersey-chartered stock savings bank originally organized in 1922. Magyar Bank is headquartered in the city of New Brunswick, Middlesex County, New Jersey, in east central New Jersey. The Bank operates a community banking business through its headquarters office, five branch offices in Middlesex County, and two branch offices in Somerset County, New Jersey, located northwest of Middlesex County. While the market area for deposit gathering is concentrated in the local communities in which a branch office is maintained, the Bank also conducts lending operations over a somewhat wider area, defined as Central and Northern portions of New Jersey. A map of the Bank’s office locations is included as Exhibit I-1. The Bank is a member of the Federal Home Loan Bank (“FHLB”) system, and its deposits are insured up to the regulatory maximums by the Deposit Insurance Fund of the Federal Deposit Insurance Corporation (“FDIC”). Magyar Bank is subject to regulatory oversight and examination by the New Jersey Department of Banking and Insurance (the NJDOBI”) as its chartering agency and by the FDIC for deposit insurance purposes.
Magyar Bancorp, Inc. (“MGYR”) is the federally chartered mid-tier holding company of the Bank. MGYR owns 100% of the outstanding common stock of the Bank. Since its formation in 2006, MGYR has been engaged primarily in the business of holding the common stock of the Bank. MGYR completed its initial public offering on January 24, 2006, pursuant to which it sold 2,618,820 shares or 44.2% of its outstanding common stock to the public and issued 3,200,450 shares or 55.8% of its common stock outstanding to Magyar Bancorp, MHC (the “MHC”), the mutual holding company parent of MGYR. The MHC and MGYR are subject to supervision and regulation by the Board of Governors of the Federal Reserve System (the “Federal Reserve Board” or the “FRB”). At December 31, 2020, MGYR had total consolidated assets of $741.8 million, deposits of $612.1 million and equity of $58.2 million or 7.85% of total assets. MGYR’s tangible equity was equal to reported equity given there are no intangibles. MGYR’s audited financial statements for the most recent period are included by reference as Exhibit I-2.
Plan of Reorganization
The boards of directors of Magyar Bancorp, MHC and Magyar Bancorp have approved the plan of conversion. Pursuant to the plan of conversion, the organization will convert from the mutual holding company form of organization to the fully stock form. Magyar Bancorp, MHC will
| RP® Financial, LC. | OVERVIEW AND FINANCIAL ANALYSIS | |
| I.2 |
be merged into Magyar Bancorp and as a result Magyar Bancorp, MHC will cease to exist. As part of the conversion, the 55.1% ownership interest of Magyar Bancorp, MHC in Magyar Bancorp will be offered for sale in the offering. When the conversion is completed, Magyar Bancorp will continue to own all of the outstanding common stock of Magyar Bank and public stockholders will own all of the outstanding common stock of Magyar Bancorp. For purposes of this document, the existing consolidated entity will also hereinafter be also referred to as Magyar Bancorp or the Company, unless otherwise identified as MGYR.
Magyar Bancorp will offer its common stock in a subscription offering to Eligible Account Holders, Tax-Qualified Plans, Supplemental Eligible Account Holders and Other Depositors as such terms are defined for purposes of applicable regulatory guidelines governing stock offerings by mutual institutions. To the extent that shares remain available for purchase after satisfaction of all subscriptions received in the subscription offering, the shares may be offered for sale to members of the general public in a community offering and a syndicated or firm commitment offering. Upon completing the mutual-to-stock conversion and stock offering (the “second-step conversion”), the Company will be 100% owned by public shareholders, the publicly-held shares of MGYR will be exchanged for shares in the Company at a ratio that retains their ownership interest at the time the conversion is completed and the MHC assets will be consolidated with the Company.
Strategic Overview
Magyar Bank has been serving Middlesex County and the related central New Jersey marketplace as a locally-owned and operated financial institution since its founding in 1922. For many years Magyar Bank operated as a traditional thrift institution, originating for portfolio long-term fixed rate residential loans funded with certificates of deposit. In recent years, the Bank has strived to diversify the loan portfolio into multifamily and commercial real estate mortgage loans, home equity loans and lines of credit, commercial business loans and construction loans. An additional benefit of this strategy has been an increase in lower cost core deposit accounts, related to the commercial lending activities. The Bank’s products and services are focused on the lending and investment needs of the local retail and commercial customer base as well as households in the market area. Based on the operating history and growth of the Bank since its founding, the Bank has established, to certain degree, its name recognition and overall reputation in the central New Jersey area. In addition, the Bank views itself as an integral part of the local communities served, and thus has historically strongly supported the retail customer base through providing residential loan products.
| RP® Financial, LC. | OVERVIEW AND FINANCIAL ANALYSIS | |
| I.3 |
The equity from the stock offering will increase the Bank’s liquidity, lending capacity, leverage and growth capacity and the overall financial strength. Magyar Bank’s higher equity position resulting from the infusion of stock proceeds is anticipated to reduce interest rate risk through enhancing the interest-earning assets to interest-bearing liabilities (“IEA/IBL”) ratio. The increased equity is expected to reduce overall funding costs for the asset base. The Bank will be better positioned to pursue growth and revenue diversification. The projected use of proceeds is highlighted below.
| • | The Company. The Company is expected to retain up to 50% of the net offering proceeds. At present, funds at the Company level, net of the loan to the ESOP, are expected to be primarily invested initially into liquid funds, in which some or all may be held as a deposit at the Bank. Over time, the funds may be utilized for various corporate purposes, possibly including acquisitions, infusing additional equity into the Bank, repurchases of common stock and the payment of cash dividends. |
| • | The Bank. A minimum of 50% of the net conversion proceeds will be infused into the Bank as cash and equity. Cash proceeds (i.e., net proceeds less deposits withdrawn to fund stock purchases) infused into the Bank are expected to be deposited as an interest-earning deposit, providing additional funds for reinvestment in earning assets. |
With the Bank’s enhanced equity position, following the completion of the offering, Magyar Bank intends to continue to pursue the following strategies in order to operate as a well-capitalized and profitable community bank focused on meeting the needs of individuals, small businesses, and community organizations in Middlesex County and the related regional market area:
| • | Continue to grow the loan portfolio, with a focus primarily on commercial real estate and to a lesser extent, commercial business lending, with a continued emphasis on 1-4 family residential mortgage loans originated and held in portfolio. |
| • | Operate as a community oriented financial institution, focusing on service and a local customer base; |
| • | Focus on secure technological innovation to increase convenience to customers while at the same time improve efficiencies; |
| • | Increase core deposits, with an emphasis on low cost demand deposits in order to provide a source of funds for lending activities while improving the interest rate spread and net interest margin; |
| • | Manage credit risk to maintain a low level of nonperforming assets through a strict and disciplined credit culture. |
| RP® Financial, LC. | OVERVIEW AND FINANCIAL ANALYSIS | |
| I.4 |
Balance Sheet Trends
Table 1.1 presents the Company’s historical balance sheet data for the most recent five fiscal years and as of December 31, 2020. Over this period, Magyar Bancorp’s total assets have increased at a 5.8% annual rate, with loans receivable, representing the majority of the asset base, increasing at an 6.7% annual rate, a higher rate than assets over the same time period.
Assets have mostly steadily increased since fiscal 2016 as a result of efforts and strategies put into place by directors and management. Funding for such growth consisted of both deposits and borrowings, as the Company has made use of available low-cost borrowings. Newly added funds were directed to various categories within the asset base, including the loan portfolio, which has increased from 78% of assets in FY2016 to 81% of assets as of December 31, 2020. Cash and investments have been maintained at sufficient levels for liquidity purposes, while some funds have been placed into bank owned life insurance (“BOLI”). Equity reached $58.2 million at December 31, 2020 or 7.85% of assets. A summary of Magyar Bancorp’s key operating ratios for the past five years is presented in Exhibit I-3.
A key long-term business strategy of Magyar Bancorp is to increase the investment in whole loans receivable. As such, the Company’s loan portfolio totaled $598.5 million, or 80.7% of assets at December 31, 2020, an increase from $455.0 million, or 77.9% of assets as of September 30, 2016. The combination of the increase in loans receivable as a percent of assets and the additional use of deposits to fund assets resulted in the loan/deposit ratio increasing from 92.4% at September 30, 2016 to 97.8% at December 31, 2020.
Magyar Bancorp‘s investment in loans reflects the Company’s historical level of diversified lending activities which include traditional long-term fixed rate 1-4 family residential loans, along with commercial lending. The 1-4 family residential loan portfolio comprised approximately 34% of total loans as of December 31, 2020, down slightly from 38% of loans in FY2016. The Company has continued to pursue additional lending in the areas of commercial real estate, construction/land and commercial and industrial loans, with commercial and industrial loans recording the largest increase in proportion of loans. The commercial real estate/multifamily lending activities represent a primary part of the Company’s business strategy to maximize revenue (in terms of yield on portfolio loans) and provide benefits in areas such as interest rate risk. Second position home equity lines of credit and consumer loans have historically been limited to small amounts of the overall loan portfolio.
| RP® Financial, LC. | OVERVIEW AND FINANCIAL ANALYSIS | |
| I.5 |
Table 1.1
Magyar Bancorp, Inc.
Historical Balance Sheet Data
| As of September 30, | As of: December 31, 2020 |
9/30/2016- 12/31/2020 Annual Growth Rate |
||||||||||||||||||||||||||||||||||||||||||||||||||
| 2016 | 2017 | 2018 | 2019 | 2020 | ||||||||||||||||||||||||||||||||||||||||||||||||
| Amount | Pct(1) | Amount | Pct(1) | Amount | Pct(1) | Amount | Pct(1) | Amount | Pct(1) | Amount | Pct(1) | Pct | ||||||||||||||||||||||||||||||||||||||||
| ($000) | (%) | ($000) | (%) | ($000) | (%) | ($000) | (%) | ($000) | (%) | ($000) | (%) | (%) | ||||||||||||||||||||||||||||||||||||||||
| Total Amount of: |
||||||||||||||||||||||||||||||||||||||||||||||||||||
| Assets |
$ | 584,377 | 100.00 | % | $ | 603,044 | 100.00 | % | $ | 623,968 | 100.00 | % | $ | 630,328 | 100.00 | % | $ | 753,997 | 100.00 | % | $ | 741,784 | 100.00 | % | 5.77 | % | ||||||||||||||||||||||||||
| Loans Receivable (net) |
455,031 | 77.87 | % | 470,693 | 78.05 | % | 508,430 | 81.48 | % | 518,217 | 82.21 | % | 603,110 | 79.99 | % | 598,530 | 80.69 | % | 6.66 | % | ||||||||||||||||||||||||||||||||
| Cash and Equivalents |
21,806 | 3.73 | % | 22,334 | 3.70 | % | 15,368 | 2.46 | % | 21,469 | 3.41 | % | 61,726 | 8.19 | % | 52,070 | 7.02 | % | 22.73 | % | ||||||||||||||||||||||||||||||||
| Investment Securities |
60,407 | 10.34 | % | 65,185 | 10.81 | % | 58,278 | 9.34 | % | 48,406 | 7.68 | % | 46,985 | 6.23 | % | 49,272 | 6.64 | % | -4.68 | % | ||||||||||||||||||||||||||||||||
| Fixed Assets |
18,084 | 3.09 | % | 17,567 | 2.91 | % | 16,990 | 2.72 | % | 16,172 | 2.57 | % | 14,746 | 1.96 | % | 14,607 | 1.97 | % | -4.90 | % | ||||||||||||||||||||||||||||||||
| BOLI |
11,257 | 1.93 | % | 11,550 | 1.92 | % | 11,843 | 1.90 | % | 13,647 | 2.17 | % | 13,971 | 1.85 | % | 14,049 | 1.89 | % | 5.35 | % | ||||||||||||||||||||||||||||||||
| Other Real Estate Owned |
12,082 | 2.07 | % | 11,056 | 1.83 | % | 8,586 | 1.38 | % | 7,528 | 1.19 | % | 2,594 | 0.34 | % | 2,072 | 0.28 | % | -33.96 | % | ||||||||||||||||||||||||||||||||
| Other Assets |
5,710 | 0.98 | % | 4,659 | 0.77 | % | 4,473 | 0.72 | % | 4,889 | 0.78 | % | 10,865 | 1.44 | % | 11,184 | 1.51 | % | 17.14 | % | ||||||||||||||||||||||||||||||||
| Depos its |
$ | 492,650 | 84.30 | % | $ | 515,201 | 85.43 | % | $ | 530,137 | 84.96 | % | $ | 530,075 | 84.10 | % | $ | 618,330 | 82.01 | % | $ | 612,064 | 82.51 | % | 5.24 | % | ||||||||||||||||||||||||||
| FHLB Advances |
36,040 | 6.17 | % | 31,905 | 5.29 | % | 35,524 | 5.69 | % | 36,189 | 5.74 | % | 67,410 | 8.94 | % | 60,260 | 8.12 | % | 12.86 | % | ||||||||||||||||||||||||||||||||
| Other Liabilities |
7,962 | 1.36 | % | 6,481 | 1.07 | % | 6,945 | 1.11 | % | 9,413 | 1.49 | % | 11,407 | 1.51 | % | 11,259 | 1.52 | % | 8.49 | % | ||||||||||||||||||||||||||||||||
| Stockholders’ Equity |
$ | 47,725 | 8.17 | % | $ | 49,457 | 8.20 | % | $ | 51,362 | 8.23 | % | $ | 54,651 | 8.67 | % | $ | 56,850 | 7.54 | % | $ | 58,201 | 7.85 | % | 4.78 | % | ||||||||||||||||||||||||||
| Tangible Stockholders’ Equity |
$ | 47,725 | 8.17 | % | $ | 49,457 | 8.20 | % | $ | 51,362 | 8.23 | % | $ | 54,651 | 8.67 | % | $ | 56,850 | 7.54 | % | $ | 58,201 | 7.85 | % | 4.78 | % | ||||||||||||||||||||||||||
| Net Unrealized Gain/(Loss) on Investment/MBS Available for Sale |
($ | 1,159 | ) | -0.20 | % | ($ | 1,004 | ) | -0.17 | % | ($ | 1,474 | ) | -0.24 | % | ($ | 1,330 | ) | -0.21 | % | ($ | 1,357 | ) | -0.18 | % | ($ | 1,393 | ) | -0.19 | % | — | |||||||||||||||||||||
| Public Shares Outstanding |
2,620,296 | 45.02 | % | 2,620,296 | 45.02 | % | 2,620,296 | 45.02 | % | 2,620,296 | 45.02 | % | 2,610,296 | 44.92 | % | 2,610,296 | 44.92 | % | — | |||||||||||||||||||||||||||||||||
| MHC Shares Outstanding |
3,200,450 | 54.98 | % | 3,200,450 | 54.98 | % | 3,200,450 | 54.98 | % | 3,200,450 | 54.98 | % | 3,200,450 | 55.08 | % | 3,200,450 | 55.08 | % | — | |||||||||||||||||||||||||||||||||
|
|
|
|
|
|
|
|
|
|
|
|
|
|
|
|
|
|
|
|
|
|
|
|
|
|||||||||||||||||||||||||||||
| Total Shares Outstanding |
5,820,746 | 100.00 | % | 5,820,746 | 100.00 | % | 5,820,746 | 100.00 | % | 5,820,746 | 100.00 | % | 5,810,746 | 100.00 | % | 5,810,746 | 100.00 | % | — | |||||||||||||||||||||||||||||||||
| Tangible Book Value per Share |
$ | 8.20 | — | $ | 8.50 | — | $ | 8.82 | — | $ | 9.39 | $ | 9.78 | $ | 10.02 | — | ||||||||||||||||||||||||||||||||||||
| Loans/Deposits |
92.36 | % | 91.36 | % | 95.91 | % | 97.76 | % | 97.54 | % | 97.79 | % | ||||||||||||||||||||||||||||||||||||||||
| Offices Open |
6 | 7 | 7 | 7 | 7 | 7 | ||||||||||||||||||||||||||||||||||||||||||||||
| (1) | Ratios are as a percent of ending assets. |
Source: Preliminary Prospectus; RP Financial calculations.
| RP® Financial, LC. | OVERVIEW AND FINANCIAL ANALYSIS | |
| I.6 |
The intent of the Company’s cash and investment policy is to provide adequate liquidity and to generate a favorable return within the context of supporting Magyar Bancorp’s cash operating needs and credit and interest rate risk objectives. Historically, the level of cash and equivalents has fluctuated in the range of 2.5% to 8.2% based on the operating environment and cash needs. The ratio equaled 7.0% as of December 31, 2020.
Regarding the investment securities portfolio, as of December 31, 2020 the Company held investments both as available for sale (“AFS”) and as held to maturity (“HTM”), and the portfolio is managed in concert with the overall asset/liability management policy guidance and to maximize revenue. As of December 31, 2020, securities classified as HTM and AFS equaled 69% and 31% of total investments, respectively. The investment portfolio consisted of several investment types, including mortgage backed securities, US government agency debt bonds and corporate bonds, with mortgage-backed securities comprising 68% of total securities. The only other investment security consisted of the required equity investment of FHLB of New York of $2.0 million. The level of cash and investments is anticipated to increase initially following the stock offering, pending gradual redeployment into higher yielding loans. Details of the Company’s investment securities portfolio are presented in Exhibit I-4.
Magyar Bancorp owns the headquarters office in New Brunswick, New Jersey and one other office and lease the remaining five branch offices. Details of the investment in fixed assets by branch are presented in Exhibit II-2. The investment in fixed assets has decreased in recent periods as depreciation expense has exceeded an additional investment in fixed assets.
Reflecting in improvement in asset quality, Magyar Bancorp has recorded a substantial decline in the balances of other real estate owned (“OREO”) over the period from 2016 to 2020. The OREO in 2016 consisted of a variety of property types, including construction/land, 1-4 family properties and commercial real estate/multifamily. The Company has successfully reduced the OREO balance through efforts to resolve the problem assets through workouts and sales and more stringent lending activities that have reduced new OREO properties.
Magyar Bancorp maintains an investment in bank-owned life insurance (“BOLI”) policies, as a source of funding for employee benefit expenses and to provide tax-advantaged income. As of December 31, 2020, the cash surrender value of the Company’s BOLI equaled $14.0 million or 1.89% of assets.
As shown in Table 1.1, since September 30, 2016 Magyar Bancorp’s funding needs have been provided by retail deposits, borrowings and retained earnings. The balance of the
| RP® Financial, LC. | OVERVIEW AND FINANCIAL ANALYSIS | |
| I.7 |
Company’s deposits has increased at a slightly slower pace than assets since 2016, recording an annualized growth rate of 5.24%. Borrowings have increased at a higher rate, in particular in more recent periods, mostly due to the participation in the Paycheck Protection Program (“PPP”), as non-PPP loans have declined. Borrowings use is generally based on the indicated cost of these funds in comparison to deposits, and the respective term for interest rate risk management purposes, along with the ability to obtain such funds in a timely manner to support the lending and overall growth objectives. As a result of the relative growth in assets, the proportion of assets funded with deposits has decreased slightly from 84% to 83% since fiscal 2016. The Company maintains a notable level of core deposit accounts in checking and savings accounts, which comprised 51% of deposits at December 31, 2020, with this ratio increasing from 44% as of September 30, 2016.
The balance of equity increased between fiscal 2016 and December 31, 2020 as Magyar Bancorp recorded consistent profitable operations. Reflecting the combination of this increase in equity and the increase in assets over that time period, the equity-to-assets ratio has remained in the range of 7.50% to 8.75% of assets over that time period, and equaled 7.85% at December 31, 2020. All of the Company’s equity is tangible, and the Company maintained surpluses relative to all of its regulatory capital requirements at December 31, 2020. The pro forma return on equity (“ROE”) is expected to initially decline given the increased equity position.
Income and Expense Trends
Table 1.2 presents the Company’s income and expense trends over the past five fiscal years and for the 12 months ended December 31, 2020. The table reveals the Company has recorded consistently profitable operations over the time period, and profitability has averaged 0.33% of average assets since fiscal 2016. Non-operating items have been substantially limited and consisted of gains on the sale of investment securities.
Magyar Bancorp’s net interest income to average assets ratio has reflected the impact of market interest rate trends and internal asset investment and funding strategies over the time period shown in Table 1.2. Net interest income as a percent of average assets increased through FY2019, reflecting the higher interest rate environment at that time, with the asset yields supported by the increasing investment in commercial, construction and other loans. The noted rise and then fall of funding costs in Table 1.2 reflects the interest rate environment and also has been impacted by the increase in lower cost core deposit from the lending diversification, along
| RP® Financial, LC. | OVERVIEW AND FINANCIAL ANALYSIS | |
| I.8 |
Table 1.2
Magyar Bancorp, Inc.
Historical Income Statements
| For the Year Ended September 30, | 12 Mths ended, December 31, 2020 |
|||||||||||||||||||||||||||||||||||||||||||||||
| 2016 | 2017 | 2018 | 2019 | 2020 | ||||||||||||||||||||||||||||||||||||||||||||
| Amount | Pct(1) | Amount | Pct(1) | Amount | Pct(1) | Amount | Pct(1) | Amount | Pct(1) | Amount | Pct(1) | |||||||||||||||||||||||||||||||||||||
| ($000) | (%) | ($000) | (%) | ($000) | (%) | ($000) | (%) | ($000) | (%) | ($000) | (%) | |||||||||||||||||||||||||||||||||||||
| Interest Income |
$ | 20,451 | 3.56 | % | $ | 21,978 | 3.71 | % | $ | 24,350 | 3.96 | % | $ | 27,103 | 4.25 | % | $ | 26,927 | 3.93 | % | $ | 27,156 | 3.82 | % | ||||||||||||||||||||||||
| Interest Expense |
(3,532 | ) | -0.62 | % | (3,773 | ) | -0.64 | % | (4,649 | ) | -0.76 | % | (6,710 | ) | -1.05 | % | (5,513 | ) | -0.81 | % | (4,827 | ) | -0.68 | % | ||||||||||||||||||||||||
|
|
|
|
|
|
|
|
|
|
|
|
|
|
|
|
|
|
|
|
|
|
|
|
|
|||||||||||||||||||||||||
| Net Interest Income |
$ | 16,919 | 2.95 | % | $ | 18,205 | 3.07 | % | $ | 19,701 | 3.20 | % | $ | 20,393 | 3.20 | % | $ | 21,414 | 3.13 | % | $ | 22,329 | 3.14 | % | ||||||||||||||||||||||||
| Provision for Loan Losses |
(1,366 | ) | -0.24 | % | (1,343 | ) | -0.23 | % | (997 | ) | -0.16 | % | (668 | ) | -0.10 | % | (1,666 | ) | -0.24 | % | (2,096 | ) | -0.29 | % | ||||||||||||||||||||||||
|
|
|
|
|
|
|
|
|
|
|
|
|
|
|
|
|
|
|
|
|
|
|
|
|
|||||||||||||||||||||||||
| Net Interest Income after Provisions |
$ | 15,553 | 2.71 | % | $ | 16,862 | 2.84 | % | $ | 18,704 | 3.04 | % | $ | 19,725 | 3.09 | % | $ | 19,748 | 2.89 | % | $ | 20,233 | 2.85 | % | ||||||||||||||||||||||||
| Gain(Loss) on Sale of Loans |
$ | 625 | 0.11 | % | $ | 324 | 0.05 | % | $ | 493 | 0.08 | % | $ | 193 | 0.03 | % | $ | 317 | 0.05 | % | $ | 554 | 0.08 | % | ||||||||||||||||||||||||
| Other Income |
1,448 | 0.25 | % | 1,675 | 0.28 | % | 1,521 | 0.25 | % | 1,826 | 0.29 | % | 1,331 | 0.19 | % | 1,915 | 0.27 | % | ||||||||||||||||||||||||||||||
| Operating Expense |
(15,943 | ) | -2.78 | % | (16,444 | ) | -2.77 | % | (17,323 | ) | -2.82 | % | (17,600 | ) | -2.76 | % | (18,353 | ) | -2.68 | % | (18,544 | ) | -2.61 | % | ||||||||||||||||||||||||
|
|
|
|
|
|
|
|
|
|
|
|
|
|
|
|
|
|
|
|
|
|
|
|
|
|||||||||||||||||||||||||
| Net Operating Income |
$ | 1,683 | 0.29 | % | $ | 2,417 | 0.41 | % | $ | 3,394 | 0.55 | % | $ | 4,144 | 0.65 | % | $ | 3,043 | 0.44 | % | $ | 4,158 | 0.59 | % | ||||||||||||||||||||||||
| Non-Operating Income/Expense |
||||||||||||||||||||||||||||||||||||||||||||||||
| Gain(Loss) on Sale/Impair of Investments |
$ | 72 | 0.01 | % | $ | 0 | 0.00 | % | $ | 107 | 0.02 | % | $ | 117 | 0.02 | % | $ | 68 | 0.01 | % | $ | 68 | 0.01 | % | ||||||||||||||||||||||||
| Income/(Loss) Before Tax |
$ | 1,755 | 0.31 | % | $ | 2,417 | 0.41 | % | $ | 3,501 | 0.57 | % | $ | 4,261 | 0.67 | % | $ | 3,111 | 0.45 | % | $ | 4,226 | 0.59 | % | ||||||||||||||||||||||||
| Income Tax Provision (Benefit) |
(664 | ) | -0.12 | % | (994 | ) | -0.17 | % | (1,471 | ) | -0.24 | % | (1,265 | ) | -0.20 | % | (921 | ) | -0.13 | % | (1,252 | ) | -0.18 | % | ||||||||||||||||||||||||
|
|
|
|
|
|
|
|
|
|
|
|
|
|
|
|
|
|
|
|
|
|
|
|
|
|||||||||||||||||||||||||
| Net Income (Loss) |
$ | 1,091 | 0.19 | % | $ | 1,423 | 0.24 | % | $ | 2,030 | 0.33 | % | $ | 2,996 | 0.47 | % | $ | 2,190 | 0.32 | % | $ | 2,974 | 0.42 | % | ||||||||||||||||||||||||
| Adjusted Earnings |
||||||||||||||||||||||||||||||||||||||||||||||||
| Net Income |
$ | 1,091 | 0.19 | % | $ | 1,423 | 0.24 | % | $ | 2,030 | 0.33 | % | $ | 2,996 | 0.47 | % | $ | 2,190 | 0.32 | % | $ | 2,974 | 0.42 | % | ||||||||||||||||||||||||
| Deduct: Net Gain on Sale/Impair of Invests |
(72 | ) | -0.01 | % | 0 | 0.00 | % | (107 | ) | -0.02 | % | ($ | 117 | ) | -0.02 | % | ($ | 68 | ) | -0.01 | % | ($ | 68 | ) | -0.01 | % | ||||||||||||||||||||||
| Addback: Federal Tax Law Impact |
0 | 0.00 | % | 0 | 0.00 | % | 0 | 0.00 | % | — | 0.00 | % | — | 0.00 | % | — | 0.00 | % | ||||||||||||||||||||||||||||||
| Tax Effect (2) |
24 | 0.00 | % | 0 | 0.00 | % | 36 | 0.01 | % | 25 | 0.00 | % | 14 | 0.00 | % | 14 | 0.00 | % | ||||||||||||||||||||||||||||||
|
|
|
|
|
|
|
|
|
|
|
|
|
|
|
|
|
|
|
|
|
|
|
|
|
|||||||||||||||||||||||||
| Adjusted Earnings |
$ | 1,043 | 0.18 | % | $ | 1,423 | 0.24 | % | $ | 1,959 | 0.32 | % | $ | 2,904 | 0.46 | % | $ | 2,136 | 0.31 | % | $ | 2,920 | 0.41 | % | ||||||||||||||||||||||||
| Diluted Weighted Avg. Shares Outst. |
5,820,563 | 5,820,746 | 5,820,746 | 5,820,746 | 5,817,480 | 5,814,980 | ||||||||||||||||||||||||||||||||||||||||||
| Diluted Earnings Per Share |
$ | 0.19 | $ | 0.24 | $ | 0.35 | $ | 0.51 | $ | 0.38 | $ | 0.51 | ||||||||||||||||||||||||||||||||||||
| Diluted Adjusted Earnings Per Share |
$ | 0.18 | $ | 0.24 | $ | 0.34 | $ | 0.50 | $ | 0.37 | $ | 0.50 | ||||||||||||||||||||||||||||||||||||
| Expense Coverage Ratio (3) |
106.1 | % | 110.7 | % | 113.7 | % | 115.9 | % | 116.7 | % | 120.4 | % | ||||||||||||||||||||||||||||||||||||
| Efficiency Ratio (4) |
83.9 | % | 81.4 | % | 79.8 | % | 78.5 | % | 79.6 | % | 74.8 | % | ||||||||||||||||||||||||||||||||||||
| Effective Tax Rate Cost (Benefit) |
-37.8 | % | -41.1 | % | -42.0 | % | -29.7 | % | -29.6 | % | -29.6 | % | ||||||||||||||||||||||||||||||||||||
| Return on Equity |
2.28 | % | 2.90 | % | 3.95 | % | 5.47 | % | 3.85 | % | 5.28 | % | ||||||||||||||||||||||||||||||||||||
| (1) | Ratios are as a percent of average assets. |
| (2) | Assumes a 34% effective tax rate, federal tax law change is not tax-affected through 2017 and 21% federal rate thereafter. |
| (3) | Expense coverage ratio calculated as net interest income before provisions for loan losses divided by operating expenses. |
| (4) | Efficiency ratio calculated as op. exp. divided by the sum of net int. inc. before prov. for loan losses plus other income (excluding net gains). |
Source: Audited financial statements, internal financial statements; RP Financial calculations.
| RP® Financial, LC. | OVERVIEW AND FINANCIAL ANALYSIS | |
| I.9 |
with the increased borrowings used in recent periods. Both the interest income and interest expense ratios have followed the same trend, with such rates rising through FY2019 and then declining thereafter. This is indicative of the Company’s continued focus on interest rate risk management and the benefits of the diversified lending away from long-term fixed rate residential loans. The Company’s interest rate spreads and yields and costs for the past three and one-quarter years are set forth in Exhibits I-3 and I-5.
Non-interest operating income has historically been a modest contributor to the Company’s income statement and averaged 0.26% of average assets for the most recent five and one quarter fiscal years and equaled 0.27% of average assets for the most recent 12-month period. Most of this income is gained from deposit account fees and the BOLI investment income.
Magyar Bancorp sells loans to third parties as a strategy to assist in interest rate risk and realize gains on the sale of such loans. The Company sells the guaranteed portion of a portion of Small Business Administration (“SBA”) loans that are originated and also has occasionally sold long-term fixed rate residential loans into the secondary market, mostly on a servicing retained basis. Thus, the Company has recorded some income on gains on sale of loans sold. Such gains on sale totaled $554,000, or 0.08% of average assets for the 12 months ended December 31, 2020. As of December 31, 2020, the Company was servicing $23.4 million of SBA loans and $4.1 million of residential loans serviced for others portfolio and maintained a corresponding capitalized mortgage servicing rights of $8,000.
Operating expenses represent the other major component of the Company’s income statement, and as shown in Table 1.2, such expenses have declined somewhat as a percent of average assets and have increased in dollar amount since 2016. Total operating expenses equaled $18.5 million, or 2.61% of average assets during the 12 months ended December 31, 2020. The increase in the dollar amount of operating expenses since 2016 reflects the overall growth of the Company’s operations, continued focus on lending diversification, general inflation costs and the overall costs of operations and increases in compensation/benefits for employees to staff the various operating departments of the Company. Upward pressure will be placed on the Company’s expense ratio following the stock offering, due to expenses associated with operating as a publicly-traded company, including expenses related to the stock benefit plans, auditing and legal costs.
The trends in the net interest income (including the gains on sale of loans) and operating expense ratios since fiscal 2016 have caused the expense coverage ratio (net interest
| RP® Financial, LC. | OVERVIEW AND FINANCIAL ANALYSIS | |
| I.10 |
income/gains on sale divided by operating expenses) to trend upward within the range of 106% to 120% since FY2016. Also reflecting a similar trend, Magyar Bancorp’s efficiency ratio (operating expenses as a percent of the sum of net interest income and other operating income, including mortgage banking income) has trended lower from 84% for fiscal 2016 to 75% for the 12 months ended December 31, 2020.
As noted earlier, loan loss provisions have had a modest impact on the income statement as Magyar Bancorp has recorded improved asset quality ratios and recorded a declining level of asset charge offs since 2016, while growth in the loan portfolio has required some additional reserves. Loan loss provisions have averaged $1.4 million, or 0.21% of average assets from FY2016 to the most recent 12-month period. As of December 31, 2020, the ALLL equaled $7.1million, or 71.0% of non-performing loans and 1.17% of total loans receivable. Exhibit I-6 sets forth the Company’s allowance for loan loss activity during the past two years and three months.
As noted earlier, non-operating items have had a minimal impact on the Company’s income statement since fiscal 2016 and have consisted of small amounts of gains on the sale of securities.
Magyar Bancorp has recorded income tax rates of approximately 30% since fiscal 2019, and tax rates of approximately 40% in prior years, based on the prevailing federal and state corporate tax rates.
Interest Rate Risk Management
Magyar Bancorp’s balance sheet is asset-sensitive in the shorter-term and, thus, the net interest margin will typically be favorably affected during periods of rising and higher interest rates. Magyar Bancorp measures its interest rate risk exposure by examining the change in net interest income under the assumed instantaneous changes in the U.S. treasury yield curve. Utilizing figures as of December 31, 2020, based on a 2.0% instantaneous and sustained increase in interest rates, the net interest income model indicates that the Bank’s net interest income would increase by 0.49% in year 1 and by 0.85% in year two (see Exhibit I-7).
The Company pursues strategies to manage interest rate risk, particularly with respect to seeking to limit the repricing mismatch between interest rate sensitive assets and liabilities. The Company manages interest rate risk from the asset side of the balance sheet by retaining in portfolio fewer fixed rate residential loans and by originating and retaining adjustable rate loans
| RP® Financial, LC. | OVERVIEW AND FINANCIAL ANALYSIS | |
| I.11 |
in the residential, construction and commercial portfolios, all of which have shorter terms to repricing or maturity, and generally carry higher interest rates. On the liability side of the balance sheet, management of interest rate risk has been pursued through attempting to retain the balance of deposits in lower cost and less interest rate sensitive transaction and savings accounts, along with increasing the balance of money market accounts, which offer a variable rate based on market indications. The Company has also utilized advances from the FHLB of New York to “match-fund” certain longer-term loans. Core deposits, which consist of transaction and savings accounts, comprised 80.6% of the Bank’s deposits at December 31, 2020. As of September 30, 2020, of the Bank’s total loans due after September 30, 2021, ARM loans comprised 61.3% of those loans (see Exhibit I-8). In addition, the Bank maintains a notable balance of cash and cash equivalents, which provide for short-term to maturity funds on the balance sheet. Finally, the Bank maintains an equity position of almost 8% of assets, representing interest-free funds that can be used to fund earning assets. The infusion of stock proceeds will serve to further limit the Bank’s interest rate risk exposure, as most of the net proceeds will be redeployed into interest-earning assets and the increase in the Bank’s equity will lessen the proportion of interest rate sensitive liabilities funding assets.
There are numerous limitations inherent in interest rate risk analyses such as the credit risk of the Company’s loans pursuant to changing interest rates. Additionally, such analyses do not measure the impact of changing spread relationships, as interest rates among various asset and liability accounts rarely move in tandem, as the shape of the yield curve for various types of assets and liabilities is constantly changing in response to investor perceptions and economic events and circumstances.
Lending Activities and Strategy
Magyar Bancorp operates a diversified lending strategy, with active lending operations in 1-4 family residential, commercial real estate, commercial business and construction/land lending. The overall lending strategy is to diversify its overall loan portfolio, shorten the term-to-maturity or repricing, and increase the overall yield earned on loans. Details of the Bank’s loan portfolio composition are shown in Exhibit I-9, while Exhibit I-10 provides details of the Bank’s loan portfolio by contractual maturity date.
| RP® Financial, LC. | OVERVIEW AND FINANCIAL ANALYSIS | |
| I.12 |
Residential Real Estate Lending
Magyar Bancorp’s historical lending focus has included the origination of first position 1-4 family residential real estate loans. As of December 31, 2020, residential first and second position mortgage loans equaled $228.2 million, or 37.6% of total loans, with adjustable rate loans totaling approximately 39% of total residential mortgage loans. As shown in Exhibit I-9, the balance of residential mortgage loans (first and second position) has increased since September 30, 2016, while the proportion of such loans has declined from 42.6% to 37.6%. The Company generally retains most originations of conforming fixed-rate one- to four-family residential real estate loans.
Magyar Bancorp’s first mortgage loans are generally underwritten to Freddie Mac origination guidelines and thus are deemed to be “conforming” loans with terms of 10 to 30 years. Most of the 1-4 family mortgage loans are secured by residences in the central and northern New Jersey market. Loan-to-value ratios (“LTV”) of mortgage loans are generally limited to an 80% LTV, or up to 95% if the loans carry private mortgage insurance. Adjustable rate loans have an initial fixed interest rate period of one to ten years, followed by annual adjustments to the interest rate, with a 2% period cap on changes in interest rates and a 5% lifetime interest adjustment rate cap. Magyar Bancorp does not offer “interest only”, “negative amortization”, subprime or Alt-A loans, which have higher risk underwriting characteristics. The Company also offers low- to moderate income residential mortgage loans originated using Freddie Mac guidelines.
Commercial Real Estate/Multi-Family Lending
As of December 31, 2020, commercial real estate/multi-family loans totaled $260.3 million, or 42.9% of the total loan portfolio, versus $199.5 million, or 43.6% of loans as of September 30, 2016. The balances of these loans have been trending upward in recent years due to the Company’s focus to diversify its loan portfolio and increase yield. These types of loans are attractive credits given the higher yields, larger balances, shorter duration and prospective relationship potential.
Commercial real estate loans are generally secured by five-or-more-unit apartment buildings, industrial properties and properties used for business purposes such as small office buildings and retail facilities. Adjustable-rate commercial real estate loans are originated with a maximum term of 25 years with adjustable rate periods every five years. The maximum LTV for commercial real estate loans is 75%, based on the appraised value of the property.
| RP® Financial, LC. | OVERVIEW AND FINANCIAL ANALYSIS | |
| I.13 |
These loans are generally priced at a higher rate of interest, have larger balances and involve a greater risk profile than 1-4 residential mortgage loans. Often the payments on commercial real estate loans are dependent on successful operations and management of the property. When originating commercial real estate loans, the Company evaluates the qualifications and financial condition of the borrower, as well as the value and condition of the property securing the loan. The Company will also generally require and obtain personal guarantees from the principals and generally requires a debt service coverage ratio of at least 120%. At December 31, 2020, the Company’s largest commercial real estate loan was $6.1 million to refinance a 21,000 square foot building consisting of office, retail, and storage units in Summit, New Jersey. The loan was performing in accordance with its repayment terms at December 31, 2020.
Construction Loans
Construction loans represent an area of lending diversification for Magyar Bancorp, and such loans totaled $23.4 million, or 3.9% of loans as of December 31, 2020. Construction loans are generally offered to experienced local developers operating in the primary market area and to individuals for the construction of their personal residences. Construction loans for both residential and commercial properties usually have a maximum term of 24 months. At the end of the construction phase, the loan generally converts to a permanent real estate mortgage loan, but in some cases it may be payable in full. Loans can be made with a maximum loan-to-value ratio of 75% of the appraised market value upon completion of the project. The Company provides financing for land acquisition and site improvement. Land acquisition loans are limited to an LTV of 50% to 75% of the sale price of the land. At December 31, 2020, the largest outstanding construction loan was a $2.8 million loan to finance the construction of single-family home in Colts Neck, New Jersey.
Construction loans generally involve greater credit risk than improved owner-occupied real estate lending. Magyar Bancorp reviews and inspects each property before disbursement of loan funds, and also requires detailed cost estimates to complete the construction project and an appraisal of the property.
Commercial Business Loans
As part of the strategy of diversifying the loan portfolio, Magyar Bancorp originates commercial business loans and lines of credit on non-real estate commercial business assets.
| RP® Financial, LC. | OVERVIEW AND FINANCIAL ANALYSIS | |
| I.14 |
The Company originates commercial business loans to small businesses and professionals located in its market area. As of December 31, 2020, the Company had $91.2 million of commercial business loans in portfolio, equal to 15.0% of total loans. Magyar Bancorp encourages the borrowers to maintain their primary deposit accounts with the Bank. The Company also originates Small Business Administration (“SBA”) 7(a) loans, on which the SBA provides guarantees of up to 90% of the principal balance. The Company generally sells the guaranteed portions of the SBA loan into the secondary market. Included in the December 31, 2020 balance was $46.0 million of loans originated through the SBA’s Paycheck Protection Program (“PPP”). The PPP loans are part of the Company’s actions to support its customers and the local communities. The PPP loans have terms of either two or five years and a 1.0% interest rate. The Company also received approximately $2.0 million in fees during 2020.
Commercial business loans are generally lines of credit with terms of up to 25 years and are generally used for longer-term working capital purposes. Commercial business loans are originated with either fixed for adjustable rates of interest. Lines of credit typically carry variable interest rates tied to the prime rate of interest that adjust annually or are tied to an index. Commercial business loans have greater credit risk compared to 1-4 family residential real estate loans, because the availability of funds for the repayment of commercial business loans are dependent on the success of the business and the general economic environment of the Company’s market area. The Company generally considers the financial statements, debt service capabilities, cash flows and the Company’s history of the borrower, and generally required a loan-to-value ratio of no more than 75%.
Consumer Lending (including HELOCs)
Magyar Bancorp originates personal consumer loans to individuals who reside or work in the Company’s market area, including loans secured by home equity lines of credit and personal consumer loans. Consumer loans have greater risk compared to mortgage loans, due to their dependence on the borrower’s continuing financial stability.
At December 31, 2020, home equity lines of credit totaled $19.8 million in outstanding balances. The underwriting standards utilized for home equity lines of credit include a determination of the applicant’s credit history, an assessment of the applicant’s ability to meet existing obligations and payments on the proposed loan and the value of the collateral securing the loan. Home equity lines of credit are offered with a loan-to-value ratio up to 80%. Our home equity lines of credit are generally 10-year balloon loans. Our home equity lines of credit have adjustable rates of interest which are indexed to the prime rate of interest and terms of up to 25 years.
| RP® Financial, LC. | OVERVIEW AND FINANCIAL ANALYSIS | |
| I.15 |
The Company also originates stock-secured loans, secured by the common stock of publicly-traded companies, provided the company is listed on the New York Stock Exchange or the NASDAQ Stock Market. These loans are interest only with terms of up to 12 months and for adjustable rates of interest indexed to the prime rate. The LTV is limited to 70% of the value of the stock securing the loan at any time. These loans totaled $3.8 million as of December 31, 2020, with a limit of 15% of the Bank’s capital, with the exception of Johnson & Johnson, a larger local employer, for which the limit is 150% of the Bank’s capital.
Loan Originations, Purchases and Sales
All lending activities are conducted by bank personnel located at the office locations, underwritten pursuant to bank policies and procedures. Loan sources typically include loan officers, marketing efforts, the existing customer base, walk-in customers and referrals from real estate brokers, builders and attorneys.
Generally, the Company retains in portfolio substantially all loans that are originated, as historically the Company has not originated a significant number of loans for the purpose of resale into the secondary market. Any loans that are sold are sold on a servicing retained basis. These sales provide benefits in terms of interest rate risk management and also provide for current period income in the form of gains on the sale of loans.
Magyar Bancorp has also periodically purchased or sold participation loans from or with other financial institutions in the market area. Such loans are underwritten according to the Bank’s underwriting criteria and procedures. At December 31, 2020 the outstanding balances of purchased loan participations totaled $19.8 million, while the balance of sold participations equaled $16.9 million. All such loans were performing as of December 31, 2020. Magyar Bancorp has not historically purchased residential mortgage loans, except for loans to low-income borrowers as part of the Community Reinvestment Act program.
Asset Quality
Magyar Bancorp’s lending operations include originations of commercial real estate/multi-family, commercial business, construction/land and consumer loans for portfolio, all of which carry a higher risk profile than traditional 1-4 family mortgage lending. In recent years the Company
| RP® Financial, LC. | OVERVIEW AND FINANCIAL ANALYSIS | |
| I.16 |
has maintained a moderate level of non-performing assets (“NPAs”), consisting of non-accruing loans, real estate owned and performing troubled debt restructured loans (“TDRs”). Exhibit I-11 presents a history of NPAs for the Company since 2016. NPAs reached a high of $16.3 million as of September 30, 2016, and since then have been reduced to $12.3 million as of December 31, 2020, consisting of non-accruing loans of $10.0 million, real estate owned of $2.1 million and accruing troubled debt restructured loans of $218,000. The non-accruing loans and real estate owned were comprised of 1-4 family residential, commercial real estate, construction and commercial business loans.
To track the Company’s asset quality and the adequacy of valuation allowances, Magyar Bancorp has established detailed asset classification policies and procedures which are consistent with regulatory guidelines. Detailed asset classifications are reviewed quarterly by senior management and the Board. Pursuant to these procedures, when needed, the Company establishes additional valuation allowances to cover anticipated losses in classified or non-classified assets. As of December 31, 2020, the Company maintained an allowance for loan losses of $7.13 million, equal to 1.17% of total loans receivable and 71.0% of non-performing loans.
Funding Composition and Strategy
Magyar Bank has traditionally utilized both deposits and borrowings as funding sources. At December 31, 2020, deposits equaled $612.1 million. Exhibit I-12 sets forth the Bank’s deposit composition since September 30, 2018 and Exhibit I-13 provides the maturity composition of the certificate of deposit (“CD”) portfolio at December 31, 2020 for all uninsured CDs in excess of $100,000 in balance. Money Market Accounts constitute the largest portion of the deposit base, totaling 29.4% of deposits at December 31, 2020 versus 31.6% of deposits as of September 30, 2018. Checking and savings accounts equaled $313.1 million, or 51.2% of total deposits as of December 31, 2020, versus $232.5 million, or 43.9% of total deposits at September 30, 2018. A portion of the checking account balances include certain funds from the PPP lending program instituted in 2020.
Magyar Bank has historically utilized borrowed funds as a funding source, and such borrowings totaled $60.3 million as of December 31, 2020 with the funds used to support lending activities and liquidity. Of the borrowed funds, $29.8 million were borrowed under the recent Paycheck Protection Program Liquidity Facility. Additional detail of the borrowings portfolio is presented in Exhibit I-14, indicating a weighted average rate of 1.23% as of December 31, 2020. The remaining borrowings consisted of FHLB of New York advances.
| RP® Financial, LC. | OVERVIEW AND FINANCIAL ANALYSIS | |
| I.17 |
Subsidiary Operations
The Bank is the only subsidiary of Magyar Bancorp. Magyar Bank has three subsidiaries as follows: Magyar Investment Company, which holds investment securities for certain state income tax benefits; Hungaria Urban Renewal, LLC which holds the Company’s main office facility (land and building); and Magyar Service Corp., which offers bank customers a range of non-deposit investment products and financial planning services, including insurance products, fixed and variable annuities, and retirement planning for individual and commercial customers.
Legal Proceedings
Magyar Bancorp is not involved in any pending legal proceedings other than routine legal proceedings occurring in the ordinary course of business which, in the aggregate, are believed by management to be immaterial to the financial condition of the Company.
| RP® Financial, LC. | OPERATING ENVIRONMENT AND MARKET AREA | |
| Page II.1 |
II. OPERATING ENVIRONMENT AND MARKET AREA
Introduction
Magyar Bank is headquartered in the city of New Brunswick, Middlesex County, New Jersey, in east central New Jersey. The Bank operates a community banking business through its headquarters office five branch offices in Middlesex County, and two branch offices in Somerset County, New Jersey, located northwest of Middlesex County. While the market area for deposit gathering is concentrated in the local communities in which a branch office is maintained, the Bank also conducts lending operations over a somewhat wider area, defined as Central and Northern portions of New Jersey. A map of the Bank’s office locations is included as Exhibit I-1.
The Bank focuses on providing personal service while meeting the needs of its business and retail customer base, emphasizing personalized banking services to retail customers and full service activities for business customers. Deposit services offered include demand deposits, business accounts, regular savings accounts, money market deposits, certificates of deposit and individual retirement accounts. Recent strategic actions have focused on continuing the historical growth trends, and maintaining a diversified lending program in the areas of residential, commercial and construction lending.
Future business and growth opportunities for the Bank depend on the future growth trends of the local and regional economy, demographic growth trends and the nature and intensity of the competitive environment. These factors have been briefly examined to help determine the growth potential that exists for the Bank, the relative economic health of the Bank’s market area, and the resultant impact on value.
National Economic Factors
After expanding for over 10 years, the longest on record, the national economic expansion came to an end in the second quarter of 2020 as a result of the COVID-19 pandemic and related shutdown of businesses and economic activity on both a personal and business basis. Through December 2020, the worldwide impact of COVID-19 has caused a substantial change in current and go-forward expectations in many economic performance factors, including the United States GDP growth. Following annual GDP growth in the range of 1.0% to 3.0% during the most recent economic expansion, the United States GDP declined by 3.5% for calendar year 2021, with a
| RP® Financial, LC. | OPERATING ENVIRONMENT AND MARKET AREA | |
| Page II.2 |
sharp decline in the second quarter (31.4%) and strong growth in the third quarter (33.4%) as a result of the implementation of federal assistance payments. Based on the most recent Wall Street Journal (“WSJ”) economists’ forecast, GDP is projected to increase by 4.2% for all of 2021, indicating a welcome return to economic growth. This growth, however, would be achieved through substantial public spending and related increase in the federal debt, as the fiscal 2020 budget deficit totaled $3.1 trillion, and expectations are that substantial deficits will continue based on pre-COVID deficit levels and that additional COVID-related spending will be required.
The economy has recorded job growth in recent years, with an average of 2.4 million jobs added annually over the 2015-2019 time period, indicating a steady and notable growth period. As was the case with GDP performance noted above, United States job growth turned negative in March 2020, with the labor force contracting by 1.4 million in March and 20.8 million in April 2020, reflecting an unprecedented deterioration in the employment sector of the economy. During the May-November 2020 time period, a total of 12.5 million jobs were added to the workforce, reflecting a recovery of a portion of the prior losses. However, the December 2020 jobs report indicated a net loss of 140,000 jobs, indicating a continued weakness to the economy. Near-term expectations for employment gains are for a gradual improvement, particularly as the daily impacts of COVID-19 diminish, with quarterly average job growth of 419,000 as estimated by the WSJ economists forecast.
For 2020, the annualized national inflation rate was 1.33%, compared to 2.11% for CY19 and 2.44% for CY18, indicating inflation has been kept under control, which is a focus of the Federal Reserve policy. The 2020 inflation rate was impacted substantially by the COVID-19 crisis, reflecting the reduced demand for products and services nationwide and therefore lower inflation. The Federal Reserve has recently indicated that it intends to manage inflation and interest rates differently, effectively allowing prices to run higher in order to accelerate growth and bring down unemployment. For example, instead of targeting a two percent inflation level and raising rates to head off price pressure, the Federal Reserve would aim for an average of two percent over time, which would let inflation briefly run higher.
Economists have been focused in recent periods on the national unemployment rate, which prior to 2020 had been at levels considered to be “full employment” for the last year and a half. From highs reached during the national recession of 2008-2009 in the range of 10%, the unemployment rate steadily declined and equaled 3.5% as of December 2019, the lowest rate in 2019. In calendar year 2020, the unemployment rate remained below 4.0% through February
| RP® Financial, LC. | OPERATING ENVIRONMENT AND MARKET AREA | |
| Page II.3 |
2020, and then began to increase as a result of the economic disruption caused by the COVID-19 crisis, with such rate reaching 14.7% for April 2020, a level not seen since the Great Depression. The national unemployment rate trended downward to reach 6.7% as of December 2020, indicating some improvement and reflecting the job increases noted earlier. It is expected that the unemployment rate will likely take a number of years to fully recover. Such unemployment rates will be contingent upon the impact of COVID-19, with certain industries, such as restaurants and in-person entertainment, expected to be impacted over an extended time period. Further, the labor force may permanently lose certain jobs, such as certain office service industries as “working remotely” becomes a permanent situation for a portion of the national employee base. Other longer term impacts on job growth are expected to include the aging of the employment base, further loss of the working age population base as baby boomers retire, increased use of technology to reduce or replace workers in the workplace, and the overall slower rate of population growth compared to prior generations.
After recording a strong performance in calendar year 2019, the major stock market indices reached all-time highs in early 2020, and then fell quickly and dramatically through March 2020 as a result of worldwide fears of economic slowdowns or recession, based on the emergence of the COVID-19 pandemic. Subsequent to March 2020, these indices have recovered substantially all of the losses incurred or reached new highs as government spending actions to support the economy have provided some positive sentiment and the successful development of COVID-19 vaccines has also supported the economic outlook. From an all-time high of 29,551.42 on February 12, 2020, the DJIA fell by 37.1% to 18,591.93 as of March 23, 2020. Since that date, the DJIA has recorded a recovery to 31,148.24 as of February 5, 2021, reaching an all-time high. Similarly, these trends have also occurred in the other major market indexes such as the S&P 500, which settled at 3,886.83 on February 5, 2021, well above the February 2020 all-time high of 3,386.15, while the NASDAQ has exceeded the February 2020 high of 9,817.18 to reach 13,856.30 as of February 5, 2021.
Similar to the major market indices noted above, the major banking market indexes also increased substantially in calendar year 2019 and then fell quickly and dramatically as a result of worldwide fears of economic slowdowns or recession in early 2020. From an all-time high of 668.69 on January 2, 2020, the SNL Bank Index fell by 49.4% through March 23, 2020 to 338.10 based primarily in expected lower income and eventual loan losses due to the economic decline. Since that low, the SNL Bank index has recovered somewhat to 604.77, representing an increase of 78.9%. This index remains below the January 2020 all-time high, reflecting the continued
| RP® Financial, LC. | OPERATING ENVIRONMENT AND MARKET AREA | |
| Page II.4 |
uncertainty of the eventual impact of COVID-19 and the economic fallout to financial institutions. Similarly, from an all-time high of 928.86 on December 17, 2019, the SNL Thrift Index fell by 38.8% to 568.84 through March 23, 2020 based primarily on expected lower income and eventual loan losses due to the economic decline. Since that low, the SNL Thrift index has recovered somewhat to 851.79, representing an increase of 49.7%. However, this index remains below the December 2019 all-time high, reflecting the continued uncertainty of the eventual impact of COVID-19 and the economic fallout to financial institutions. The greater decline in the banking industry indexes in comparison to the broader market indexes indicated that market expectations for the financial institution sector include a notable reduction in income and losses related to loans held by such institutions.
Regarding factors that most directly impact the banking and financial services industries, through early 2020, the residential real estate industry was relatively healthy, as new and previously-owned home sales have increased, and residential housing prices have continued to trend upward in most metropolitan areas of the country. Homebuilders were expecting a more stable trend in new home construction with residential housing starts projected to increase somewhat from 2020 to 2021 and total 1.49 million for 2021. As a result of COVID-19 and the corresponding lower interest rates, residential loan volumes dramatically increased for all of 2020, with many mortgage banking operations recording substantial increases in volumes and profits. There are indications that demand for single family residential housing will be enhanced due to the implied benefits of such properties in relation to isolation from COVID-19 and that additional “working remotely” will increase demand for larger homes. As a result of the above, national home price indices have recorded notable increases in 2020. The national median home price for sales of existing homes reached $309,800 in December 2020 versus $266,200 in January 2020, representing an increase of 16.4%. These figures compare favorably to the generational low of $169,000 recorded in March 2009.
Based on the consensus outlook of economists surveyed by The Wall Street Journal in January 2021, GDP was projected to increase by 4.2% overall for 2021 and equal annualized growth of 3.2% in the first half of 2022. The unemployment rate was estimated to decline to 5.3% by the end of 2021 and 4.3% by the end of 2023. On average, the economists forecasted a rising federal funds rate from 0.13% in June 2021, increasing to 0.25% in December 2022 and a subsequent increase to 0.52% in December 2023. On average, the economists forecasted that the 10-year Treasury yield would equal 1.24% in June 2021 and increase to 1.77% in December 2022 and 2.10% in December 2023.
| RP® Financial, LC. | OPERATING ENVIRONMENT AND MARKET AREA | |
| Page II.5 |
The January 2021 mortgage finance forecast from the Mortgage Bankers Association (the “MBA”) reflected notable trends in units and dollars of residential housing. The forecast indicated that 2020 existing home sales are expected to increase by 6.0% from 2019 sales and new home sales were forecasted to increase by 19.4% in 2020 compared to 2019 sales. For 2021, existing home sales are projected to increase by 10.2%, while new home sales are to increase by 18.1%. The 2020 median sale price for existing homes was forecasted to increase by 12.1% while the new homes price was forecasted to increase by 3.7%. For 2021, the median sale price of existing homes is projected to increase by 3.2%, while the median price of new homes is to increase by 0.4%. Total mortgage production was forecasted to increase in 2020 to $3.573 trillion, compared to $2.253 trillion in 2019 and equal $2.719 trillion in 2021. The forecasted increase in 2020 originations was based on a 16.2% increase in purchase volume and a 109.0 increase in refinancing volume. Purchase mortgage originations were forecasted to total $1.424 trillion in 2020, versus refinancing volume totaling $2.149 billion. Housing starts for 2020 were projected to increase by 6.7% to total 1.382 million.
Interest Rate Environment
Following a series of three interest rate cuts totaling 0.75% in the last half of CY19 (ending on October 30, 2019), the Federal Reserve elected to hold interest rates steady and stated that the national economic outlook would continue to be monitored and that the Federal Reserve would act as appropriate to sustain the then economic expansion. At that time, the prime rate of interest was 4.75% and the fed funds target was 1.50% to 1.75%. This interest rate position and overall outlook was held by the Federal Reserve through the end of CY2019 and into February 2020.
The COVID-19 outbreak and implied impact to the national economy, which became more and more evident throughout February 2020, led the Federal Reserve to reduce interest rates on March 3, 2020 by 0.50%, and by an additional 1.00% on March 13, 2020 (a rare Sunday action). That latest action resulted in a prime rate target of 3.25%, and a targeted fed funds rate of 0.00% to 0.25%, indicating that the Federal Reserve’s direct interest rate levers had been implemented to support the national economy.
The above noted rate reductions by the Federal Reserve brought the US Treasury yields and yield curve down to extremely low levels. Short term interest rates approached zero, and intermediate and longer-term Treasury rates also fell to low levels. From March 2020 through early August 2020, the 10-year Treasury Bond rate ranged between 0.50% and 0.75%, while the
| RP® Financial, LC. | OPERATING ENVIRONMENT AND MARKET AREA | |
| Page II.6 |
30-year Treasury Bond rate ranged from 1.25% to 1.50% over the same time period. After reaching a low of 0.52% on August 4, 2020, the 10-year Treasury Bond rate has trended upward and was 1.19% on February 5, 2021. Similarly, after reaching a low of 1.19% on August 4; 2020, the 30-year Treasury Bond rate has trended upward to 1.97% as of February 5, 2021. The latest Wall Street Journal survey of leading economists indicates a modestly rising rate scenario through mid-2023 with longer term rates rising more than short term rates. The Federal Reserve has indicated in certain information releases that it expects to keep interest rates at historical low levels for approximately the next five years. Historical interest rate trends are presented in Exhibit II-1.
While the low interest rate environment has stimulated loan demand, particularly in the residential sector, such rates have also adversely impacted yields earned on loans by financial institutions. Institutions also are benefiting from the corresponding reduction in rates paid on deposit and borrowed funds.
Given the unprecedented nature and scope of COVID-19, the ultimate and cumulative impact of the pandemic on interest rates remains uncertain, with asset quality issues being another potential financial impact.
Primary Market Area
Middlesex County is known as the “Heart” of New Jersey, as it is located in the center of the state and also is located on the eastern side of New Jersey closer to New York City. While there are extensive industrial, office and residential areas in the county, being close to New York City provides attractions such as a lower cost of living while being able to commute into New York City for employment. Having a population of 825,000, the county has its own diversified population and employment base, and also has a total of 25 municipalities which operate to offer attractive places to live and work. Well-developed transportation facilities such as airports and public transit lines provide additional abilities to travel within and outside the county. Because of its proximity to New York located along the eastern seaboard, Middlesex County has seen large waves of development over the past half-century due to suburbanization.
Somerset County, located further west and in the center of the state, has developed into its own economic area, sufficiently separate from New York City to the east and Philadelphia to the southeast. Located in the center of the nation’s largest metropolitan area, Somerset County contains a balance between urban and suburban neighborhoods and rural countrysides. There
| RP® Financial, LC. | OPERATING ENVIRONMENT AND MARKET AREA | |
| Page II.7 |
are numerous residential communities, parks, shopping areas, farmlands and a wide variety of business and industry that makes Somerset County a desirable place to live and work. The county has developed its own employment concentrations in technology, pharmaceuticals and insurance, among others, that has resulted in a highly educated workforce.
Demographic and Economic Trends
Table 2.1 presents information regarding the demographic and economic trends for the Bank’s market area from 2016 to 2021 and projected through 2026, with additional detail shown in Exhibit II-2. Data for the nation and the State of New Jersey is included for comparative purposes. The size and scope of the market area is evidenced by the demographic data, which shows as of 2021 the Middlesex and Somerset Counties combined population was 1.154 million, reflecting a notable population base, with Middlesex County containing 71% of the total population. New Brunswick, the county seat of Middlesex County, is situated in the west center section of the county with a population of approximately 56,000. Estimated as of 2021, Somerset County recorded a smaller population base of approximately 330,000. Middlesex and Somerset Counties are both part of the Edison NJ Metropolitan Division of the New York-Newark-Jersey City , NY-NJ-PA Metropolitan Statistical Area. The Edison NJ Metropolitan Division consists of four central New Jersey counties, including Monmouth and Ocean Counties.
The data in Table 2.1 also indicates somewhat unfavorable population trends of the two-county market area, as both counties recorded annual population losses, at 0.5% for Middlesex County and 0.4% for Somerset County over the last five years, unfavorable compared to state and national trends. While the population base in the two county market area serves to provide support for growth potential for financial institutions, the overall market appears to be limited given the reduction of the potential customer base and resulting lower demand for housing and other related products and services. Over the next projected five years, the state and the market area counties are expected to improve the trends, with slight population growth over that time period, which would indicate a favorable operating environment for financial institutions.
Changes in the number of households in the market area have generally paralleled trends with respect to population, although at slightly higher rates of change. This reflects a national trend towards smaller average household sizes. These trends in households also would imply a lower level of business opportunities for community financial institutions such as Magyar Bank.
| RP® Financial, LC. | OPERATING ENVIRONMENT AND MARKET AREA | |
| Page II.8 |
Table 2.1
Magyar Bancorp, Inc.
Summary Demographic/Economic Data
| Year | Growth Rate (Annualized) |
|||||||||||||||||||
| 2016 | 2021 | 2026 | 2016-2021 | 2021-2026 | ||||||||||||||||
| (%) | (%) | |||||||||||||||||||
| Population (000) |
||||||||||||||||||||
| USA |
322,431 | 330,946 | 340,574 | 0.5 | % | 0.6 | % | |||||||||||||
| New Jersey |
8,985 | 8,884 | 8,911 | -0.2 | % | 0.1 | % | |||||||||||||
| Middlesex, NJ |
845 | 825 | 828 | -0.5 | % | 0.1 | % | |||||||||||||
| Somerset, NJ |
335 | 329 | 329 | -0.4 | % | 0.0 | % | |||||||||||||
| Households (000) |
||||||||||||||||||||
| USA |
122,265 | 125,733 | 129,596 | 0.6 | % | 0.6 | % | |||||||||||||
| New Jersey |
3,289 | 3,255 | 3,267 | -0.2 | % | 0.1 | % | |||||||||||||
| Middlesex, NJ |
292 | 283 | 283 | -0.6 | % | 0.0 | % | |||||||||||||
| Somerset, NJ |
122 | 118 | 118 | -0.6 | % | 0.0 | % | |||||||||||||
| Median Household Income ($) |
||||||||||||||||||||
| USA |
55,551 | 67,761 | 73,868 | 4.1 | % | 1.7 | % | |||||||||||||
| New Jersey |
72,173 | 89,080 | 97,516 | 4.3 | % | 1.8 | % | |||||||||||||
| Middlesex, NJ |
79,140 | 95,004 | 103,555 | 3.7 | % | 1.7 | % | |||||||||||||
| Somerset, NJ |
102,212 | 129,885 | 145,302 | 4.9 | % | 2.3 | % | |||||||||||||
| Per Capita Income ($) |
||||||||||||||||||||
| USA |
30,002 | 37,689 | 41,788 | 4.7 | % | 2.1 | % | |||||||||||||
| New Jersey |
37,494 | 47,674 | 52,411 | 4.9 | % | 1.9 | % | |||||||||||||
| Middlesex, NJ |
35,874 | 44,549 | 48,788 | 4.4 | % | 1.8 | % | |||||||||||||
| Somerset, NJ |
52,111 | 65,173 | 72,134 | 4.6 | % | 2.1 | % | |||||||||||||
| 2021 Age Distribution (%) |
0-14 Yrs. | 15-34 Yrs. | 35-54 Yrs. | 55-69 Yrs. | 70+ Yrs. | |||||||||||||||
| USA |
18.3 | 26.8 | 25.1 | 18.4 | 11.4 | |||||||||||||||
| New Jersey |
17.8 | 25.3 | 25.9 | 19.4 | 11.6 | |||||||||||||||
| Middlesex, NJ |
17.6 | 26.2 | 27.1 | 18.4 | 10.8 | |||||||||||||||
| Somerset, NJ |
16.7 | 24.2 | 26.9 | 20.8 | 11.4 | |||||||||||||||
| 2021 HH Income Dist. (%) |
Less Than 25,000 |
$25,000 to 50,000 |
$50,000 to 100,000 |
$100,000+ | ||||||||||||||||
| USA |
18.0 | 20.3 | 29.0 | 32.7 | ||||||||||||||||
| New Jersey |
14.1 | 15.5 | 25.6 | 44.8 | ||||||||||||||||
| Middlesex, NJ |
11.5 | 14.5 | 26.5 | 47.5 | ||||||||||||||||
| Somerset, NJ |
8.1 | 10.4 | 20.4 | 61.2 | ||||||||||||||||
Source: S&P Global Market Intelligence.
| RP® Financial, LC. | OPERATING ENVIRONMENT AND MARKET AREA | |
| Page II.9 |
Table 2.1 provides certain median age distribution figures for the market area and other comparative areas. The data reveals that Middlesex County’s age distribution generally mirrors the statewide averages, with a slightly younger population base, Somerset County reported a population base overall in line with the state data. Table 2.1 also contains data concerning household and per capita income levels, which are important indicators of a market area’s health and attractiveness in terms of housing and economic activity. Both counties reported income levels above the state and national averages, with Somerset County reporting by far the highest income levels of all comparative areas, with median household income of almost $130,000 as of 2021. The 2021 median household income for Middlesex County was much lower at $95,000, which remained above the state and national averages. Somerset County’s higher income levels reflected the location as an outer suburban county to the central New York City whereby residents have moved for additional living space and new infrastructure. The county’s population and related economy is large enough to support the operations of a number of larger companies in various economic sectors. Middlesex Country remains an overall more developed county with more densely populated urban areas. Projected annual income growth over the next five years is highest for Somerset County relative to the comparative areas shown in Table 2.1. Per capita incomes generally tracked the household income data, with Somerset County recording the highest per capita income of all comparative areas. Household income distribution patterns shown in Table 2.1 also provide support for earlier statements regarding the nature of Magyar Bank’s market as approximately 61% of Somerset County households had income levels in excess of $100,000 annually in 2021 while the ratio was 45% for Pennsylvania and 33% for the national average.
Economic Sectors
As shown in Table 2.2, the Bank’s primary market area has an employment base diversified among education/healthcare/social services, services, manufacturing and wholesale/retail trade. The distribution of employment exhibited in the primary market area is indicative of a relatively diverse economic environment, which is expected given the size of the population base, while the related income levels discussed above indicate a well-educated workforce. Somerset County reported a slightly higher employment base in manufacturing, while Middlesex County reported a higher employment in transportation/public utilities, resulting from its location along the I-95 corridor.
| RP® Financial, LC. | OPERATING ENVIRONMENT AND MARKET AREA | |
| Page II.10 |
Table 2.2
Magyar Bancorp, Inc.
Primary Market Area Employment Sectors
(Percent of Labor Force)
| Employment Sector |
New Jersey | Middlesex County |
Somerset County |
|||||||||
| (%) | (%) | (%) | ||||||||||
| Services |
26.0 | % | 27.2 | % | 26.4 | % | ||||||
| Education,Healthcare, Soc. Serv. |
23.8 | % | 22.2 | % | 22.8 | % | ||||||
| Government |
4.2 | % | 3.3 | % | 2.6 | % | ||||||
| Wholesale/Retail Trade |
14.3 | % | 14.1 | % | 14.3 | % | ||||||
| Finance/Insurance/Real Estate |
8.5 | % | 8.4 | % | 10.3 | % | ||||||
| Manufacturing |
8.3 | % | 9.3 | % | 11.3 | % | ||||||
| Construction |
5.7 | % | 4.7 | % | 4.1 | % | ||||||
| Information |
2.8 | % | 3.1 | % | 3.6 | % | ||||||
| Transportation/Utility |
6.1 | % | 7.6 | % | 4.4 | % | ||||||
| Agriculture |
0.3 | % | 0.1 | % | 0.3 | % | ||||||
|
|
|
|
|
|
|
|||||||
| 100.0 | % | 100.0 | % | 100.0 | % | |||||||
Source: S&P Global Market Intelligence.
Market Area Largest Employers
As indicated above, the economic and employment base of the market area is diverse and not dependent on any one industry, and the related income levels indicate a well-educated, white-collar workforce. Table 2.3 presents a listing of the largest employers in the market area, detailing these characteristics. Middlesex County’s largest employers reflect a cross-section of most economic sectors, with education, health care, pharmaceuticals and telecommunications employment. Similarly, Somerset County revealed a variety of white-collar employment, including insurance and higher tech manufacturing employment.
Market Area Unemployment Data
Comparative unemployment rates for the primary market area counties, as well as for the U.S. and New Jersey, are shown in Table 2.4, with the December 2020 unemployment rates for the two-county market area both somewhat above 6%. Over the past 12 months, unemployment rates have increased substantially and then deceased in the market area and the state and nation as a result of the COVID-19 pandemic, causing a notable amount of disruption to the economic and the employee base. At present, the Bank’s market area counties have fared better than the
| RP® Financial, LC. | OPERATING ENVIRONMENT AND MARKET AREA | |
| Page II.11 |
Table 2.3
Magyar Bancorp, Inc.
Market Area Largest Employers
| Company/Institution | Industry | |
| Middlesex County | ||
| Rutgers University | Education | |
| Robert Wood Johnson University Hospital | Healthcare Services | |
| Bristol-Myers Squibb | Pharmaceutical Company | |
| Wakefern Food Corp. | Supermarket Retailers Cooperative | |
| Merrill Lynch & Company, | Investing /Wealth Management | |
| Novo Nordisk | Pharmaceutical Company | |
| Johnson & Johnson | Medical Devices, Pharmaceuticals | |
| Prudential Insurance Company | Insurance | |
| Silverline Building Products | Behavioral Health Organization | |
| St. Peter’s University Hospital | Healthcare Services | |
| Telcordia Technologies | Telecommunications Networks | |
| JFK Medical Center | Healthcare Services | |
| Maritan Bay Medical Center | Healthcare Services | |
| Somerset County | ||
| Bausch & Lomb, Inc. | Opthalmic Goods Manufacturing | |
| Bloomberg LP | News Syndicates | |
| Brother International Corp. | Office Equipment Wholesalers | |
| Conva Tec Inc. | Medical Instrument Manufacturing | |
| Daiichi Sankyo, Inc. | Pharmaceutical Company | |
| Ethicon US LLC | Biological Projduct Manufacturing | |
| Everst Re Group KTD | Insurance Agencies | |
| Federal Insurance Company | Direct Property Insurance Carriers | |
| Ferreira Construction Company | Highway Construction | |
| Iconectiv | Communications | |
| www.ChooseNJ.com | ||
rest of New Jersey, as the market area unemployment rates are well below the state and national averages. The lower unemployment rates also take into account the slightly declining population base, although the immediate projections for the future indicate that the population is expected to begin increasing.
| RP® Financial, LC. | OPERATING ENVIRONMENT AND MARKET AREA | |
| Page II.12 |
Table 2.4
Magyar Bancorp, Inc.
Unemployment Trends
| Unemployment Rate(1) | Net Change |
|||||||||||
| Region |
Dec. 2019 | Dec. 2020 | ||||||||||
| USA |
3.4 | % | 6.5 | % | 3.1 | % | ||||||
| New Jersey |
3.6 | % | 7.4 | % | 3.8 | % | ||||||
| Counties |
||||||||||||
| Middlesex, NJ |
3.0 | % | 6.6 | % | 3.6 | % | ||||||
| Somerset, NJ |
3.0 | % | 6.1 | % | 3.1 | % | ||||||
| (1) | Not seasonally adjusted. |
Source: S&P Global Market Intelligence.
Deposit Trends
The competitive environment for financial institution products and services on a national, regional and local level can be expected to become even more competitive going into the future. Consolidation among the bank and thrift industries provides economies of scale to larger institutions, while the heightened availability of investment options provides consumers with attractive alternatives to the deposit products offered by financial institutions. The Bank’s market area for deposits includes primarily other local and regional commercial banks and credit unions.
Table 2.5 displays deposit market trends and deposit market share, respectively, for commercial banks and savings institutions for the state of New Jersey and for Middlesex and Somerset Counties from June 30, 2016 to June 30, 2020. Deposit growth trends serve as indicators of a market area’s current and future prospects for growth and attractiveness for financial institutions. New Jersey state deposits grew at an annual rate of 6.5% over the four-year time period shown in Table 2.5. Commercial banks increased deposits at an annual rate of 8.9% in New Jersey, while savings institutions saw their deposits decline at a rate of 7.9%, due in part to acquisitions of savings institutions by commercial banks or charter conversions to commercial banks. Commercial banks continue to dominate the deposit market in New Jersey, with an aggregate market share equal to 90.1 of total bank and thrift deposits in market.
| RP® Financial, LC. | OPERATING ENVIRONMENT AND MARKET AREA | |
| Page II.13 |
Table 2.5
Magyar Bancorp, Inc.
Deposit Summary
| As of June 30, | ||||||||||||||||||||||||||||
| 2016 | 2020 | Deposit | ||||||||||||||||||||||||||
| Market | No. of | Market | No. of | Growth Rate | ||||||||||||||||||||||||
| Deposits | Share | Branches | Deposits | Share | Branches | 2016-2020 | ||||||||||||||||||||||
| (Dollars in Thousands) | (%) | |||||||||||||||||||||||||||
| New Jersey |
$ | 313,790,000 | 100.0 | % | 3,047 | $ | 403,731,000 | 100.0 | % | 2,713 | 6.5 | % | ||||||||||||||||
| Commercial Banks |
258,179,000 | 82.3 | % | 2,383 | 363,767,000 | 90.1 | % | 2,277 | 8.9 | % | ||||||||||||||||||
| Savings Institutions |
55,611,000 | 17.7 | % | 664 | 39,964,000 | 9.9 | % | 436 | -7.9 | % | ||||||||||||||||||
| MIddlesex County |
$ | 32,939,809 | 100.0 | % | 274 | $ | 45,365,112 | 100.0 | % | 249 | 8.3 | % | ||||||||||||||||
| Commercial Banks |
27,958,180 | 84.9 | % | 204 | 39,882,847 | 87.9 | % | 195 | 9.3 | % | ||||||||||||||||||
| Savings Institutions |
4,981,629 | 15.1 | % | 70 | 5,482,265 | 12.1 | % | 54 | 2.4 | % | ||||||||||||||||||
| Magyar Bank |
396,141 | 1.2 | % | 4 | 554,524 | 1.2 | % | 5 | 8.8 | % | ||||||||||||||||||
| Somerset County |
$ | 13,156,603 | 100.0 | % | 127 | $ | 15,995,499 | 100.0 | % | 115 | 5.0 | % | ||||||||||||||||
| Commercial Banks |
11,375,596 | 86.5 | % | 107 | 15,085,846 | 94.3 | % | 100 | 7.3 | % | ||||||||||||||||||
| Savings Institutions |
1,781,007 | 13.5 | % | 20 | 909,653 | 5.7 | % | 15 | -15.5 | % | ||||||||||||||||||
| Magyar Bank |
80,123 | 0.6 | % | 2 | 73,243 | 0.5 | % | 2 | -2.2 | % | ||||||||||||||||||
Source: FDIC.
Deposits within Middlesex County grew over the four-year period at an annual rate of 8.3%, somewhat more than the statewide rate. In contrast to statewide trends, savings institutions experienced increasing deposits in Middlesex County. Savings institutions held a somewhat higher market share position in Middlesex County of 12.1% as of June 30, 2020. In Somerset County, deposits grew by a lower 5.0%, with commercial banks expanding the deposit base and savings institutions losing deposits. The total deposit base in Somerset County is about one-third of the amount in Middlesex County, similar to the relative population size of each county.
As of June 30, 2020, the Bank maintained a deposit market share of 1.2% in Middlesex County, indicative of the five branch offices and the larger overall deposit base within the county. The Bank reported a smaller market share in Somerset County, consistent with the two office facilities. Future deposit gains and market share gains may be likely given the Bank’s low market penetration. In Middlesex County, since June 30, 2016, the Bank has experienced a strong annualized increase in deposits, while deposits decreased at a modest rate in Somerset County.
Competition
Competition among financial institutions in the market area is significant. Among the Bank’s competitors are much larger and more diversified institutions, which have greater
| RP® Financial, LC. | OPERATING ENVIRONMENT AND MARKET AREA | |
| Page II.14 |
resources and offer more products and services than maintained by the Bank. Financial institution competitors in the Bank’s market area include primarily commercial banks, including banks with a national and regional presence. There are also a number of smaller community-based banks and credit unions that pursue similar operating strategies as the Bank. From a competitive standpoint, the Bank benefits from its status of a locally-owned financial institution, longstanding customer relationships, and continued efforts to offer competitive products and services. However, competitive pressures will also likely continue to build as the financial services industry continues to consolidate and as additional non-bank investment options for consumers become available. A total of 40 banking institutions operate in Middlesex County and 24 operate in Somerset County.
Table 2.6 lists the Bank’s largest competitors in the market area counties, based on deposit market share as noted. Going forward, the Bank intends to continue to expand its’ total deposits and market share through continuing the strong ties to the community and operational planning to continue deposit and loan growth. Additionally, there is room to expand regionally in the market area based on the relatively positive economic and demographic environment and the current deposit market share maintained.
| RP® Financial, LC. | OPERATING ENVIRONMENT AND MARKET AREA | |
| Page II.15 |
Table 2.6
Magyar Bancorp, Inc.
Market Area Deposit Competitors - As of June 30, 2020
| Location |
Name |
Market Share |
Rank | |||||
| (%) | ||||||||
| MIddlesex, NJ |
PNC Bank, NA | 32.49 | ||||||
| Bank of America, NA | 10.95 | |||||||
| Wells Fargo Bank, NA | 9.24 | |||||||
| TD Bank, NA | 7.01 | |||||||
| JPMorgan Chase Bank, NA | 6.08 | |||||||
| Provident Bank | 5.48 | |||||||
| Capital One, NA | 4.35 | |||||||
| Amboy Bank | 3.82 | |||||||
| Santander Bank, NA | 3.01 | |||||||
| Investors Bank | 2.31 | |||||||
| Magyar Bank | 1.22 | 14 out of 40 | ||||||
| Somerset, NJ |
Bank of America, NA | 18.60 | ||||||
| Peapack-Gladstone Bank | 17.85 | |||||||
| TD Bank, NA | 14.55 | |||||||
| PNC Bank, NA | 11.59 | |||||||
| Wells Fargo Bank, NA | 9.93 | |||||||
| JPMorgan Chase Bank, NA | 8.49 | |||||||
| Fulton Bank, NA | 2.86 | |||||||
| Provident Bank | 2.29 | |||||||
| Investors Bank | 1.97 | |||||||
| Somerset Savings Bank, SLA | 1.87 | |||||||
| Magyar Bank | 0.46 | 19 out of 24 | ||||||
Source: S&P Global Market Intelligence.
| RP® Financial, LC. | PEER GROUP ANALYSIS | |
| III.1 |
III. PEER GROUP ANALYSIS
This chapter presents an analysis of Magyar Bancorp’s operations versus a group of comparable institutions (the “Peer Group”) selected from the universe of all publicly-traded savings institutions in a manner consistent with the regulatory valuation guidelines. The basis of the pro forma market valuation of Magyar Bancorp is derived from the pricing ratios of the Peer Group institutions, incorporating valuation adjustments for key differences in relation to the Peer Group. Since no Peer Group can be exactly comparable to Magyar Bancorp, key areas examined for differences are: financial condition; profitability, growth and viability of earnings; asset growth; primary market area; dividends; liquidity of the shares; marketing of the issue; management; and effect of government regulations and regulatory reform.
Peer Group Selection
The Peer Group selection process is governed by the general parameters set forth in the regulatory valuation guidelines. Accordingly, the Peer Group is comprised of only those publicly-traded savings institutions whose common stock is either listed on the NYSE or NASDAQ, since their stock trading activity is regularly reported and generally more frequent than non-publicly traded and closely-held institutions. Institutions that are not listed on the NYSE or NASDAQ are inappropriate, since the trading activity for thinly-traded or closely-held stocks are typically highly irregular in terms of frequency and price and thus may not be a reliable indicator of market value. We have also excluded from the Peer Group those companies under acquisition or subject to rumored acquisition and recent conversions (less than one year), since their pricing ratios are subject to unusual distortion and/or have limited trading history. A recent listing of the universe of all publicly-traded savings institutions is included as Exhibit III-1.
Ideally, the Peer Group, which must have at least 10 members to comply with the regulatory valuation guidelines, should be comprised of locally- or regionally-based institutions with comparable resources, strategies and financial characteristics. There are approximately 45 publicly-traded savings institutions nationally and, thus, it is typically the case that the Peer Group will be comprised of institutions with relatively comparable characteristics. To the extent that differences exist between the converting institution and the Peer Group, valuation adjustments will be applied to account for the differences. Since Magyar Bancorp will be a full public company upon completion of the offering, we considered only full public companies to be
| RP® Financial, LC. | PEER GROUP ANALYSIS | |
| III.2 |
viable candidates for inclusion in the Peer Group. From the universe of publicly-traded thrifts, we selected ten institutions with characteristics similar to those of Magyar Bancorp. In the selection process, we applied the following “screen” to the universe of all public companies that were eligible for consideration:
| • | Screen #1 Mid-Atlantic and New England institutions with assets between $500 million and $2.0 billion, tangible equity/tangible assets ratios of greater than 7.0% and positive core earnings. Eight companies met the criteria for Screen #1 and all eight were included in the Peer Group: Elmira Savings Bank of New York, ESSA Bancorp, Inc. of Pennsylvania, HV Bancorp, Inc. of Pennsylvania, PCSB Financial Corporation of New York, Provident Bancorp, Inc. of Massachusetts, Prudential Bancorp, Inc. of Pennsylvania, Randolph Bancorp, Inc. of Massachusetts and Severn Bancorp, Inc. of Maryland. Exhibit III-2 provides financial and public market pricing characteristics of all publicly-traded Mid-Atlantic and New England thrifts. |
| • | Screen #2 Midwest institutions with assets between $500 million and $2.0 billion, tangible equity/tangible assets ratios of greater than 7.0% and positive core earnings. Two companies met the criteria for Screen #2 and both were included in the Peer Group: IF Bancorp, Inc. of Illinois and HMN Financial, Inc. of Minnesota. Exhibit III-3 provides financial and public market pricing characteristics of all publicly-traded Midwest thrifts. |
Table 3.1 shows the general characteristics of each of the ten Peer Group companies and Exhibit III-4 provides summary demographic and deposit market share data for the primary market areas served by each of the Peer Group companies. While there are expectedly some differences between the Peer Group companies and Magyar Bancorp, we believe that the Peer Group companies, on average, provide a good basis for valuation subject to valuation adjustments. The following sections present a comparison of Magyar Bancorp’s financial condition, income and expense trends, loan composition, interest rate risk and credit risk versus the Peer Group as of the most recent publicly available date. Comparative data for all publicly-traded thrifts, and publicly-traded New Jersey thrifts have been included in the Chapter III tables as well.
In addition to the selection criteria used to identify the Peer Group companies, a summary description of the key comparable characteristics of each of the Peer Group companies relative to Magyar Bancorp’s characteristics is detailed below.
| • | Elmira Savings Bank of New York. Comparable due to similar tangible equity ratio-similar level of operating expenses as a percent of average assets, similar level of assets per employee, similar level of risk-weighted assets to assts, and similar levels of construction loans and multifamily loans as a percent of assets. |
| RP® Financial, LC. | PEER GROUP ANALYSIS | |
| III.3 |
Table 3.1
Peer Group of Publicly-Traded Thrifts
As of September 30, 2020 or the Most Recent Date Available
| As of | ||||||||||||||||||||||||||||||||||||||||||
| February 5, 2021 | ||||||||||||||||||||||||||||||||||||||||||
| Total | Fiscal | Conv. | Stock | Market | ||||||||||||||||||||||||||||||||||||||
| Ticker |
Financial Institution | Exchange | Region | City | State | Assets | Offices | Mth End | Date | Price | Value | |||||||||||||||||||||||||||||||
| ($Mil) | ($) | ($Mil) | ||||||||||||||||||||||||||||||||||||||||
| ESBK | Elmira Savings Bank | NASDAQCM | MA | Elmira | NY | $ | 674 | 12 | Dec | 3/1/1985 | $ | 12.24 | $ | 43 | ||||||||||||||||||||||||||||
| ESSA | ESSA Bancorp, Inc. | NASDAQGS | MA | Stroudsburg | PA | $ | 1,894 | 23 | Sep | 4/3/2007 | $ | 15.59 | $ | 157 | ||||||||||||||||||||||||||||
| HMNF | HMN Financial, Inc. | NASDAQGM | MW | Rochester | MN | $ | 898 | 14 | Dec | 6/30/1994 | $ | 19.00 | $ | 91 | ||||||||||||||||||||||||||||
| HVBC | HV Bancorp, Inc. | NASDAQCM | MA | Doylestown | PA | $ | 508 | 5 | Dec | 1/11/2017 | $ | 16.81 | $ | 34 | ||||||||||||||||||||||||||||
| IROQ | IF Bancorp, Inc. | NASDAQCM | MW | Watseka | IL | $ | 726 | 8 | Jun | 7/7/2011 | $ | 20.50 | $ | 66 | ||||||||||||||||||||||||||||
| PCSB | PCSB Financial Corporation |
NASDAQCM | MA | |
Yorktown Heights |
|
NY | $ | 1,791 | 16 | Jun | 4/20/2017 | $ | 15.75 | $ | 241 | ||||||||||||||||||||||||||
| PVBC | Provident Bancorp, Inc. | NASDAQCM | NE | Amesbury | MA | $ | 1,498 | 7 | Dec | 7/15/2015 | $ | 12.10 | $ | 219 | ||||||||||||||||||||||||||||
| PBIP | Prudential Bancorp, Inc. | NASDAQGM | MA | Philadelphia | PA | $ | 1,223 | 10 | Sep | 3/29/2005 | $ | 12.69 | $ | 101 | ||||||||||||||||||||||||||||
| RNDB | Randolph Bancorp, Inc. | NASDAQGM | NE | Stoughton | MA | $ | 723 | 5 | Dec | 7/1/2016 | $ | 20.00 | $ | 103 | ||||||||||||||||||||||||||||
| SVBI | Severn Bancorp, Inc. | NASDAQCM | MA | Annapolis | MD | $ | 939 | 7 | Dec | NA | $ | 7.80 | $ | 100 | ||||||||||||||||||||||||||||
Source: S&P Global Market Intelligence.
| RP® Financial, LC. | PEER GROUP ANALYSIS | |
| III.4 |
| • | ESSA Bancorp, Inc. of Pennsylvania. Comparable due to similar level of interest expense as a percent of average assets, comparable level of 1-4 family loans and MBS as a percent of assets, similar level of reserves as a percent of loans and as a percent of NPLs. |
| • | HMN Financial, Inc. of Minnesota. Comparable due to similar risk-based capital levels, similar level of interest income as a percent of average assets, recent asset growth, similar levels of interest income and loan loss provisions as a percent of average assets, and yield/cost spread. |
| • | HV Bancorp, Inc. of Pennsylvania. Comparable due to similar size of branch office network, interest earning asset composition, similar leverage ratio, similar level of reserves as a percent of NPAs, similar level of commercial loans as a percent of assets. |
| • | IF Bancorp, Inc. of Illinois. Comparable due to similar size of branch office network, similar deposit concentration as a percent of assets, comparable ratio of operating expenses as a percent of average assets, similar tax rate, similar ratio of construction loans and commercial business loans as a percent of asses, comparable reserves as a percent of loans. |
| • | PCSB Financial Corporation of New York. Comparable due to similar asset size and size of branch office network, similar level of interest income as a percent of average assets. |
| • | Provident Bancorp, Inc. of Massachusetts. Comparable due to similar level of loans as a percent of assets, level of non-interest income as a percent of average assets, similar level of operating expenses, similar proportion of NPAs and reserves as a percnet of NPAs. |
| • | Prudential Bancorp, Inc. of Pennsylvania. Comparable due to similar level of loan loss provisions, similar level of residential loans and MBS as a percent of assets, similar level of reserves to NPAs. |
| • | Randolph Bancorp, Inc. of Massachusetts. Comparable due to similar asset composition, similar loan loss provisions and similar levels of construction/land and multifamily loans as a percent of assets, similar ratio of non-performing loans to loans and reserve coverage ratios. |
| • | Severn Bancorp, Inc. of Maryland. Comparable due to similar interest bearing liabilities composition, similar net interest income ratio, similar yield on interest earning assets, ratio of residential assets in portfolio as a percent of assets, similar non-performing loans as a percent of loans, and similar reserve coverage ratios. |
In aggregate, the Peer Group companies maintained a somewhat lower level of tangible equity as the industry average (11.22% of assets versus 11.78% for all public companies), generated similar earnings as a percent of average assets (0.90% core ROAA versus 0.87% for all public companies), and earned a higher ROE. The Peer Group’s average P/TB ratio and average core P/E multiple were lower compared to the respective averages for all publicly-traded fully converted thrifts.
| RP® Financial, LC. | PEER GROUP ANALYSIS | |
| III.5 |
| All Fully Converted Publicly-Traded |
Peer Group | |||||||
| Financial Characteristics (Averages) |
||||||||
| Assets ($Mil) |
$ | 5,167 | $ | 1,087 | ||||
| Market capitalization ($Mil) |
601 | 116 | ||||||
| Tangible equity/assets (%) |
11.78 | % | 11.22 | % | ||||
| Core return on average assets (%) |
0.87 | 0.90 | ||||||
| Core return on average equity (%) |
7.23 | 7.67 | ||||||
| Pricing Ratios (Averages)(1) |
||||||||
| Core price/earnings (x) |
13.98x | 13.13x | ||||||
| Price/tangible book (%) |
114.74 | % | 93.40 | % | ||||
| Price/assets (%) |
12.92 | % | 10.61 | % | ||||
(1) Based on market prices as of February 5, 2021.
The following sections present a comparison of Magyar Bancorp’s financial condition, income and expense trends, loan composition, interest rate risk and credit risk versus the figures reported by the Peer Group. Figures referenced for the Peer Group are on a median basis unless otherwise noted. The conclusions drawn from the comparative analysis are then factored into the valuation analysis discussed in the final chapter.
Financial Condition
Table 3.2 shows comparative balance sheet measures for Magyar Bancorp and the Peer Group, reflecting the expected similarities and some differences given the selection procedures outlined above. The Company’s and the Peer Group’s ratios reflect balances as of December 31, 2020 and September 30, 2020, respectively. Magyar Bancorp’s equity-to-assets ratio of 7.85% was below the Peer Group’s average net worth ratio of 11.56%. The Company’s pro forma capital position will increase with the addition of stock proceeds, which will provide the Company with an equity-to-assets ratio that will be in the range of the Peer Group’s ratio. Tangible equity-to-assets ratios for the Company and the Peer Group equaled 7.85% and 11.19%, respectively. The increase in Magyar Bancorp’s pro forma capital position will be favorable from a risk perspective and in terms of future earnings potential that could be realized through leverage and lower funding costs. At the same time, the Company’s higher pro forma capitalization will initially depress return on equity. Both Magyar Bancorp’s and the Peer Group’s capital ratios reflected capital surpluses with respect to the regulatory capital requirements.
| RP® Financial, LC. | PEER GROUP ANALYSIS | |
| III.6 |
Table 3.2
Balance Sheet Composition and Growth Rates
Comparable Institution Analysis
As of September 30, 2020
| Balance Sheet as a Percent of Assets | Balance Sheet Annual Growth Rates | Regulatory Capital | ||||||||||||||||||||||||||||||||||||||||||||||||||||||||||||||||||||||||||||||||||||
| Cash & Equival. |
MBS & Invest |
BOLI | Net Loans (1) |
Deposits | Borrowed Funds |
Sub. Debt |
Total Equity |
Goodwill & Intang |
Tangible Equity |
Assets | MBS, Cash Invests |
Loans | Deposits | Borrows. &Subdebt |
Total Equity |
Tangible Equity |
Tier 1 Leverage |
Tier 1 Risk-Based |
Risk7-Based Capital |
|||||||||||||||||||||||||||||||||||||||||||||||||||||||||||||||||||
| Magyar Bancorp, Inc. |
NJ | |||||||||||||||||||||||||||||||||||||||||||||||||||||||||||||||||||||||||||||||||||||
| December 31, 2020 |
7.02 | % | 6.64 | % | 1.89 | % | 80.69 | % | 82.51 | % | 8.12 | % | 0.00 | % | 7.85 | % | 0.00 | % | 7.85 | % | 13.91 | % | 34.64 | % | 12.22 | % | 12.19 | % | 50.37 | % | 5.16 | % | 5.16 | % | 7.91 | % | 11.85 | % | 13.10 | % | ||||||||||||||||||||||||||||||||||||||||||||||
| All Non-MHC Public Thrifts |
||||||||||||||||||||||||||||||||||||||||||||||||||||||||||||||||||||||||||||||||||||||
| Averages |
8.62 | % | 12.96 | % | 1.54 | % | 73.21 | % | 74.64 | % | 10.75 | % | 0.42 | % | 12.62 | % | 0.92 | % | 11.69 | % | 18.75 | % | 0.00 | % | 14.86 | % | 19.30 | % | 14.55 | % | 9.52 | % | 0.00 | % | 10.75 | % | 15.35 | % | 16.79 | % | ||||||||||||||||||||||||||||||||||||||||||||||
| Medians |
7.76 | % | 9.10 | % | 1.60 | % | 74.90 | % | 76.41 | % | 8.50 | % | 0.00 | % | 11.51 | % | 0.25 | % | 10.31 | % | 12.71 | % | 0.00 | % | 9.90 | % | 15.09 | % | 1.54 | % | 3.55 | % | 0.00 | % | 10.35 | % | 13.47 | % | 14.67 | % | ||||||||||||||||||||||||||||||||||||||||||||||
| Comparable Group |
||||||||||||||||||||||||||||||||||||||||||||||||||||||||||||||||||||||||||||||||||||||
| Averages |
8.57 | % | 12.91 | % | 1.52 | % | 73.72 | % | 78.04 | % | 8.69 | % | 0.22 | % | 11.56 | % | 0.37 | % | 11.19 | % | 15.01 | % | 36.91 | % | 12.66 | % | 14.97 | % | 27.79 | % | 12.32 | % | 11.79 | % | 10.45 | % | 14.76 | % | 15.83 | % | ||||||||||||||||||||||||||||||||||||||||||||||
| Medians |
8.77 | % | 9.91 | % | 1.35 | % | 75.15 | % | 79.76 | % | 6.77 | % | 0.00 | % | 11.38 | % | 0.11 | % | 11.29 | % | 11.10 | % | 23.55 | % | 5.56 | % | 13.28 | % | -8.10 | % | 5.80 | % | 4.57 | % | 10.10 | % | 13.83 | % | 15.02 | % | ||||||||||||||||||||||||||||||||||||||||||||||
| Comparable Group |
||||||||||||||||||||||||||||||||||||||||||||||||||||||||||||||||||||||||||||||||||||||
| ESBK |
Elmira Savings Bank | NY | 12.68 | % | 3.35 | % | 2.27 | % | 76.47 | % | 81.80 | % | 8.40 | % | 0.00 | % | 8.90 | % | 1.83 | % | 7.07 | % | 9.49 | % | 115.16 | % | 0.07 | % | 6.02 | % | 82.05 | % | 2.63 | % | 3.34 | % | 7.87 | % | 12.80 | % | 14.05 | % | ||||||||||||||||||||||||||||||||||||||||||||
| ESSA |
ESSA Bancorp, Inc. | PA | 8.23 | % | 11.61 | % | 2.14 | % | 74.90 | % | 81.53 | % | 7.03 | % | 0.00 | % | 10.11 | % | 0.77 | % | 9.34 | % | 5.23 | % | -0.39 | % | 6.74 | % | 14.96 | % | -46.42 | % | 1.00 | % | 1.24 | % | 9.08 | % | 12.64 | % | 13.74 | % | ||||||||||||||||||||||||||||||||||||||||||||
| HMNF |
HMN Financial, Inc. | MN | 8.46 | % | 13.31 | % | 0.00 | % | 75.41 | % | 87.60 | % | 0.38 | % | 0.00 | % | 11.26 | % | 0.10 | % | 11.16 | % | 17.72 | % | 31.86 | % | 14.66 | % | 19.32 | % | -20.42 | % | 10.91 | % | 11.14 | % | 9.73 | % | 13.16 | % | 14.41 | % | ||||||||||||||||||||||||||||||||||||||||||||
| HVBC |
HV Bancorp, Inc. | PA | 9.28 | % | 3.97 | % | 1.25 | % | 81.92 | % | 73.09 | % | 18.13 | % | 0.00 | % | 7.33 | % | 0.00 | % | 7.33 | % | 42.40 | % | 32.25 | % | 44.62 | % | 30.41 | % | 164.08 | % | 11.87 | % | 5.61 | % | 8.36 | % | 12.22 | % | 12.91 | % | ||||||||||||||||||||||||||||||||||||||||||||
| IROQ |
IF Bancorp, Inc. | IL | 2.58 | % | 22.79 | % | 1.30 | % | 71.38 | % | 82.88 | % | 4.32 | % | 0.00 | % | 11.51 | % | 0.00 | % | 11.51 | % | 7.05 | % | 14.00 | % | 5.56 | % | 8.13 | % | -10.59 | % | 8.10 | % | 8.10 | % | 11.08 | % | NA | NA | ||||||||||||||||||||||||||||||||||||||||||||||
| PCSB |
PCSB Financial Corporation | NY | 9.09 | % | 18.14 | % | 1.40 | % | 68.56 | % | 76.88 | % | 6.52 | % | 0.00 | % | 15.28 | % | 0.35 | % | 14.93 | % | 7.99 | % | 15.25 | % | 5.56 | % | 11.60 | % | -5.60 | % | -2.79 | % | -2.82 | % | 12.41 | % | 17.56 | % | 18.24 | % | ||||||||||||||||||||||||||||||||||||||||||||
| PVBC |
Provident Bancorp, Inc. | MA | 3.17 | % | 2.36 | % | 2.43 | % | 89.54 | % | 77.99 | % | 5.21 | % | 0.00 | % | 15.98 | % | 0.00 | % | 15.98 | % | 38.91 | % | -3.69 | % | 44.81 | % | 30.20 | % | 130.37 | % | 76.25 | % | 76.25 | % | 9.78 | % | 18.30 | % | 19.56 | % | ||||||||||||||||||||||||||||||||||||||||||||
| PBIP |
Prudential Bancorp, Inc. | PA | 9.74 | % | 37.26 | % | 2.66 | % | 48.09 | % | 63.02 | % | 23.43 | % | 0.00 | % | 10.55 | % | 0.53 | % | 10.03 | % | -5.12 | % | -11.30 | % | 0.49 | % | 3.42 | % | -23.94 | % | -7.52 | % | -7.81 | % | 10.42 | % | 16.87 | % | 18.07 | % | ||||||||||||||||||||||||||||||||||||||||||||
| RNDB |
Randolph Bancorp, Inc. | MA | 6.79 | % | 8.21 | % | 1.19 | % | 79.17 | % | 72.24 | % | 11.37 | % | 0.00 | % | 13.13 | % | 0.00 | % | 13.13 | % | 12.71 | % | 81.07 | % | 3.76 | % | 6.41 | % | 42.58 | % | 19.28 | % | 19.28 | % | 12.17 | % | 14.49 | % | 15.62 | % | ||||||||||||||||||||||||||||||||||||||||||||
| SVBI |
Severn Bancorp, Inc. | MD | 15.73 | % | 8.05 | % | 0.58 | % | 71.72 | % | 83.42 | % | 2.13 | % | 2.20 | % | 11.53 | % | 0.12 | % | 11.41 | % | 13.68 | % | 94.86 | % | 0.35 | % | 19.19 | % | -34.16 | % | 3.50 | % | 3.53 | % | 13.59 | % | NA | NA | ||||||||||||||||||||||||||||||||||||||||||||||
| (1) | Includes loans held for sale. |
Source: S&P Global Market Intelligence and RP® Financial, LC. calculations. The information provided in this table has been obtained from sources we believe are reliable, but we cannot guarantee the accuracy or completeness of such information.
Copyright (c) 2021 by RP® Financial, LC.
| RP® Financial, LC. | PEER GROUP ANALYSIS | |
| III.7 |
The interest-earning asset compositions for the Company and the Peer Group were somewhat similar, with loans constituting the largest concentration of interest-earning assets for both Magyar Bancorp and the Peer Group. The Company’s loans-to-assets ratio of 80.69% was higher than the comparable Peer Group ratio of 73.72%. Comparatively, the Company’s cash and investments-to-assets ratio of 13.66% was lower than the comparable Peer Group ratio of 21.48%. Overall, Magyar Bancorp’s interest-earning assets amounted to 96.24% of assets, which was slightly more than the comparable Peer Group ratio of 95.20%. The Peer Group’s non-interest earning assets included bank-owned life insurance (“BOLI”) equal to 1.52% of assets and goodwill/intangibles equal to 0.37% of assets, while the Company maintained BOLI equal to 1.89% of assets and no goodwill/intangibles.
Magyar Bancorp’s funding liabilities reflected a funding composition that was somewhat similar to that of the Peer Group’s funding composition. The Company’s deposits equaled 82.51% of assets, which was above the Peer Group’s ratio of 78.04%. Comparatively, the Company maintained a lower level of borrowings than the Peer Group, as indicated by borrowings-to-assets ratios of 8.12% and 8.91% for Magyar Bancorp and the Peer Group, respectively. Total interest-bearing liabilities maintained by the Company and the Peer Group, as a percent of assets, equaled 90.63% and 86.95%, respectively.
A key measure of balance sheet strength for a thrift institution is its interest-earning assets/interest-bearing liabilities (“IEA/IBL”) ratio. Presently, the Company’s IEA/IBL ratio is lower than the Peer Group’s ratio, based on IEA/IBL ratios of 106.19% and 109.49%, respectively. The additional capital realized from stock proceeds should serve to provide Magyar Bancorp with an IEA/IBL ratio that is within the range of the Peer Group’s ratio, as the increase in capital provided by the infusion of stock proceeds will serve to lower the level of interest-bearing liabilities funding assets and will be primarily deployed into interest-earning assets.
The growth rate section of Table 3.2 shows annual growth rates for key balance sheet items. Magyar Bancorp’s and the Peer Group’s growth rates are based on annual growth for the 15 months ended December 31, 2020 and September 30, 2020, respectively. Magyar Bancorp recorded a 13.91% increase in assets, versus asset growth of 15.01% recorded by the Peer Group. Asset growth for Magyar Bancorp included a 12.22% increase in loans, which was complemented by a 34.64% increase in cash and investments. Asset growth for the Peer Group included a 12.66% increase in loans and a 36.91% increase in cash and investments.
| RP® Financial, LC. | PEER GROUP ANALYSIS | |
| III.8 |
A 50.37% increase in borrowings funded the Company’s asset growth, as well as a 12.19% increase in deposits. Comparatively, asset growth for the Peer Group was funded through deposit growth of 14.97% and a 27.79% increase in borrowings. The Company’s tangible capital increased by 5.16%, which was less the Peer Group’s tangible capital growth rate of 11.79%. The Peer Group’s comparatively stronger capital growth rate was largely attributable to the 76.25% increase in tangible capital recorded by Provident Bancorp, Inc., which completed a second-step offering during the twelve-month period. The Company’s post-conversion capital growth rate will initially be constrained by maintenance of a higher pro forma capital position. Additional implementation of any stock repurchases and dividend payments, pursuant to regulatory limitations and guidelines, could also slow the Company’s capital growth rate in the longer term following the stock offering.
Income and Expense Components
Table 3.3 displays statements of operations for the Company and the Peer Group. The Company’s and the Peer Group’s ratios are based on earnings for the 12 months ended December 31, 2020 and September 30, 2020, respectively. Magyar Bancorp and the Peer Group reported net income to average assets ratios of 0.42% and 0.91%, respectively. A higher ratio of net interest income and lower operating expenses represented earnings advantages for the Company, while a higher ratio of gains on sale of loans, non-interest operating income and lower provisions for loan losses were earnings advantages for the Peer Group.
The Company’s higher net interest income to average assets ratio was realized through a higher interest income ratio, which was facilitated by a higher yield earned on interest-earning assets (4.15% versus 3.90% for the Peer Group). Likewise, the Company’s lower interest expense ratio was facilitated by a lower cost of funds (0.97% versus 1.18% for the Peer Group). Overall, Magyar Bancorp and the Peer Group reported net interest income to average assets ratios of 3.14% and 2.81%, respectively.
In another key area of core earnings strength, the Company maintained a lower level of operating expenses than the Peer Group. For the period covered in Table 3.3, the Company and the Peer Group reported operating expense to average assets ratios of 2.61% and 3.06%, respectively. Both the Peer Group and the Company maintained a comparative number of employees relative to its asset size. Assets per full time equivalent employee equaled $7.252 million for the Company, versus $7.255 million for the Peer Group.
| RP® Financial, LC. | PEER GROUP ANALYSIS | |
| III.9 |
Table 3.3
Income as Percent of Average Assets and Yields, Costs, Spreads
Comparable Institution Analysis
For the 12 Months Ended September 30, 2020 or the Most Recent 12 Months Available
| Net Interest Income | Non-Interest Income | NonOp Items | Yields, Costs, and Spreads | |||||||||||||||||||||||||||||||||||||||||||||||||||||||||||||||||||||||
| Net Income |
Income | Expense | NII | Loss Provis. on IEA |
NII After Provis. |
Gain on Sale of Loans |
Other Non-Int Income |
Total Non-Int Expense |
Net Gains/ Losses (1) |
Extrao. Items |
Provision for Taxes |
Yield On IEA |
Cost Of IBL |
Yld-Cost Spread |
MEMO: Assets/ FTE Emp. |
MEMO: Effective Tax Rate |
||||||||||||||||||||||||||||||||||||||||||||||||||||||||||
| (%) | (%) | (%) | (%) | (%) | (%) | (%) | (%) | (%) | (%) | (%) | (%) | (%) | (%) | (%) | ($000) | (%) | ||||||||||||||||||||||||||||||||||||||||||||||||||||||||||
| Magyar Bancorp, Inc. |
NJ | |||||||||||||||||||||||||||||||||||||||||||||||||||||||||||||||||||||||||
| December 31, 2020 |
0.42 | % | 3.82 | % | 0.68 | % | 3.14 | % | 0.29 | % | 2.85 | % | 0.08 | % | 0.27 | % | 2.61 | % | 0.01 | % | 0.00 | % | 0.18 | % | 4.15 | % | 0.97 | % | 3.18 | % | $ | 7,252 | 29.63 | % | ||||||||||||||||||||||||||||||||||||||||
| All Non-MHC Public Thrifts |
||||||||||||||||||||||||||||||||||||||||||||||||||||||||||||||||||||||||||
| Averages |
0.84 | % | 3.80 | % | 0.85 | % | 2.95 | % | 0.30 | % | 2.67 | % | 0.84 | % | 0.44 | % | 2.78 | % | 0.01 | % | 0.00 | % | 0.26 | % | 4.03 | % | 1.12 | % | 2.91 | % | $ | 8,680 | 22.93 | % | ||||||||||||||||||||||||||||||||||||||||
| Medians |
0.76 | % | 3.63 | % | 0.85 | % | 2.82 | % | 0.24 | % | 2.58 | % | 0.07 | % | 0.30 | % | 2.63 | % | 0.00 | % | 0.00 | % | 0.22 | % | 3.89 | % | 1.13 | % | 2.86 | % | $ | 7,309 | 23.10 | % | ||||||||||||||||||||||||||||||||||||||||
| Comparable Group |
||||||||||||||||||||||||||||||||||||||||||||||||||||||||||||||||||||||||||
| Averages |
0.91 | % | 3.70 | % | 0.89 | % | 2.81 | % | 0.23 | % | 2.58 | % | 1.17 | % | 0.47 | % | 3.06 | % | 0.02 | % | 0.00 | % | 0.27 | % | 3.90 | % | 1.18 | % | 2.72 | % | $ | 7,255 | 23.34 | % | ||||||||||||||||||||||||||||||||||||||||
| Medians |
0.76 | % | 3.59 | % | 0.87 | % | 2.67 | % | 0.21 | % | 2.45 | % | 0.38 | % | 0.42 | % | 2.57 | % | 0.00 | % | 0.00 | % | 0.26 | % | 3.81 | % | 1.14 | % | 2.59 | % | $ | 6,262 | 24.49 | % | ||||||||||||||||||||||||||||||||||||||||
| Comparable Group |
||||||||||||||||||||||||||||||||||||||||||||||||||||||||||||||||||||||||||
| ESBK |
Elmira Savings Bank | NY | 0.60 | % | 3.61 | % | 1.03 | % | 2.58 | % | 0.20 | % | 2.38 | % | 0.59 | % | 0.37 | % | 2.59 | % | 0.00 | % | 0.00 | % | 0.14 | % | 4.19 | % | 1.37 | % | 2.82 | % | $ | 5,863 | 19.27 | % | ||||||||||||||||||||||||||||||||||||||
| ESSA |
ESSA Bancorp, Inc. | PA | 0.76 | % | 3.38 | % | 0.84 | % | 2.54 | % | 0.17 | % | 2.37 | % | 0.08 | % | 0.47 | % | 2.01 | % | 0.02 | % | 0.00 | % | 0.17 | % | 3.57 | % | 1.10 | % | 2.47 | % | $ | 7,788 | 18.09 | % | ||||||||||||||||||||||||||||||||||||||
| HMNF |
HMN Financial, Inc. | MN | 1.03 | % | 3.85 | % | 0.39 | % | 3.46 | % | 0.22 | % | 3.24 | % | 0.93 | % | 0.66 | % | 3.37 | % | 0.00 | % | 0.00 | % | 0.43 | % | 3.98 | % | 0.62 | % | 3.36 | % | $ | 5,249 | 29.47 | % | ||||||||||||||||||||||||||||||||||||||
| HVBC |
HV Bancorp, Inc. | PA | 1.02 | % | 3.38 | % | 0.90 | % | 2.48 | % | 0.27 | % | 2.22 | % | 2.32 | % | 1.24 | % | 4.40 | % | 0.04 | % | 0.00 | % | 0.39 | % | 3.55 | % | 1.14 | % | 2.41 | % | $ | 4,287 | 27.77 | % | ||||||||||||||||||||||||||||||||||||||
| IROQ |
IF Bancorp, Inc. | IL | 0.64 | % | 3.74 | % | 1.09 | % | 2.65 | % | 0.07 | % | 2.58 | % | 0.17 | % | 0.54 | % | 2.48 | % | 0.07 | % | 0.00 | % | 0.25 | % | 3.85 | % | 1.35 | % | 2.50 | % | $ | 6,661 | 27.95 | % | ||||||||||||||||||||||||||||||||||||||
| PCSB |
PCSB Financial Corporation | NY | 0.54 | % | 3.51 | % | 0.82 | % | 2.69 | % | 0.17 | % | 2.53 | % | 0.00 | % | 0.16 | % | 2.00 | % | 0.00 | % | 0.00 | % | 0.15 | % | 3.66 | % | 1.13 | % | 2.53 | % | $ | 10,655 | 21.85 | % | ||||||||||||||||||||||||||||||||||||||
| PVBC |
Provident Bancorp, Inc. | MA | 0.81 | % | 4.56 | % | 0.53 | % | 4.03 | % | 0.51 | % | 3.52 | % | 0.00 | % | 0.29 | % | 2.55 | % | -0.14 | % | 0.00 | % | 0.30 | % | 4.79 | % | 0.96 | % | 3.83 | % | $ | 9,786 | 27.12 | % | ||||||||||||||||||||||||||||||||||||||
| PBIP |
Prudential Bancorp, Inc. | PA | 0.76 | % | 3.36 | % | 1.54 | % | 1.81 | % | 0.24 | % | 1.57 | % | 0.04 | % | 0.12 | % | 1.32 | % | 0.47 | % | 0.00 | % | 0.13 | % | 3.53 | % | 1.83 | % | 1.70 | % | $ | 13,297 | 14.34 | % | ||||||||||||||||||||||||||||||||||||||
| RNDB |
Randolph Bancorp, Inc. | MA | 2.30 | % | 3.57 | % | 0.86 | % | 2.71 | % | 0.37 | % | 2.34 | % | 6.71 | % | 0.12 | % | 6.14 | % | -0.24 | % | 0.00 | % | 0.49 | % | 3.77 | % | 1.13 | % | 2.64 | % | $ | 3,644 | 17.51 | % | ||||||||||||||||||||||||||||||||||||||
| SVBI |
Severn Bancorp, Inc. | MD | 0.63 | % | 4.02 | % | 0.88 | % | 3.14 | % | 0.10 | % | 3.04 | % | 0.86 | % | 0.72 | % | 3.71 | % | -0.01 | % | 0.00 | % | 0.27 | % | 4.10 | % | 1.19 | % | 2.91 | % | $ | 5,321 | 30.04 | % | ||||||||||||||||||||||||||||||||||||||
(1) Net gains/losses includes gain/loss on sale of securities and nonrecurring income and expense.
Source: S&P Global Market Intelligence and RP® Financial, LC. calculations. The information provided in this table has been obtained from sources we believe are reliable, but we cannot guarantee the accuracy
or completeness of such information.
Copyright (c) 2021 by RP® Financial, LC.
| RP® Financial, LC. | PEER GROUP ANALYSIS | |
| III.10 |
When viewed together, net interest income and operating expenses provide considerable insight into a thrift’s earnings strength, since those sources of income and expenses are typically the most prominent components of earnings and are generally more predictable than losses and gains realized from the sale of assets or other non-recurring activities. In this regard, as measured by their expense coverage ratios (net interest income divided by operating expenses), the Company’s earnings were more favorable than the Peer Group’s earnings. Expense coverage ratios for Magyar Bancorp and the Peer Group equaled 1.20x and 0.92x, respectively.
Sources of non-interest operating income provided a larger contribution to the Peer Group’s earnings, with such income amounting to 0.35% and 1.64% of Magyar Bancorp’s and the Peer Group’s average assets, respectively. Taking non-interest operating income into account in comparing the Company’s and the Peer Group’s earnings, Magyar Bancorp’s efficiency ratio (operating expenses, as a percent of the sum of non-interest operating income and net interest income) of 74.79% was less favorable than the Peer Group’s efficiency ratio of 68.76%.
Loan loss provisions had a greater impact on the Company’s earnings, as loan loss provisions established by the Company and the Peer Group equaled 0.29% and 0.23% of average assets, respectively
The Company and the Peer Group recorded minimal net non-operating gains equal to 0.01% and 0.02% of average assets, respectively. Typically, gains and losses generated from the sale of assets and other non-operating activities are viewed as earnings with a relatively high degree of volatility, and, thus, are not considered to be part of an institution’s core earnings. Extraordinary items were not a factor in either the Company’s or the Peer Group’s earnings.
The Company recorded an effective tax rate of 29.63%, which was higher than the Peer Group’s effective tax rate of 23.34%. As indicated in the prospectus, the Company’s effective marginal tax rate is equal to 29.5%.
Loan Composition
Table 3.4 presents data related to the Company’s and the Peer Group’s loan portfolio compositions (including the investment in mortgage-backed securities). In comparison to the
| RP® Financial, LC. | PEER GROUP ANALYSIS | |
| III.11 |
Table 3.4
Loan Portfolio Composition and Related Information
Comparable Institution Analysis
As of September 30, 2020
| Portfolio Composition as a Percent of Assets | ||||||||||||||||||||||||||||||||||||||||||
| MBS | 1-4 Family |
Constr. & Land |
Multi- Family |
Comm RE | Commerc. Business |
Consumer | RWA/ Assets |
Servicing Assets |
||||||||||||||||||||||||||||||||||
| (%) | (%) | (%) | (%) | (%) | (%) | (%) | (%) | ($000) | ||||||||||||||||||||||||||||||||||
| Magyar Bancorp, Inc. |
NJ | |||||||||||||||||||||||||||||||||||||||||
| December 31, 2020 |
4.32 | % | 30.76 | % | 3.16 | % | 4.00 | % | 31.06 | % | 12.14 | % | 0.52 | % | 67.68 | % | $ | 8 | ||||||||||||||||||||||||
| All Non-MHC Public Thrifts |
||||||||||||||||||||||||||||||||||||||||||
| Averages |
7.79 | % | 28.12 | % | 4.32 | % | 11.13 | % | 17.58 | % | 11.17 | % | 1.73 | % | 67.07 | % | $ | 9,686 | ||||||||||||||||||||||||
| Medians |
6.76 | % | 24.76 | % | 4.15 | % | 4.17 | % | 15.52 | % | 7.81 | % | 0.21 | % | 67.50 | % | $ | 295 | ||||||||||||||||||||||||
| Comparable Group |
||||||||||||||||||||||||||||||||||||||||||
| Averages |
8.04 | % | 29.81 | % | 4.82 | % | 5.12 | % | 19.18 | % | 14.08 | % | 1.42 | % | 66.47 | % | $ | 1,836 | ||||||||||||||||||||||||
| Medians |
6.52 | % | 23.57 | % | 3.55 | % | 3.52 | % | 18.20 | % | 9.78 | % | 1.08 | % | 66.70 | % | $ | 856 | ||||||||||||||||||||||||
| Comparable Group |
||||||||||||||||||||||||||||||||||||||||||
| ESBK |
Elmira Savings Bank | NY | 0.91 | % | 46.49 | % | 2.06 | % | 6.31 | % | 9.50 | % | 7.79 | % | 5.16 | % | 62.34 | % | $ | 1,306 | ||||||||||||||||||||||
| ESSA |
ESSA Bancorp, Inc. | PA | 4.83 | % | 36.73 | % | 4.60 | % | 5.38 | % | 15.52 | % | 11.29 | % | 2.19 | % | 74.00 | % | $ | 393 | ||||||||||||||||||||||
| HMNF |
HMN Financial, Inc. | MN | 7.95 | % | 19.33 | % | 5.32 | % | 3.90 | % | 33.80 | % | 11.77 | % | 2.34 | % | 72.99 | % | $ | 2,880 | ||||||||||||||||||||||
| HVBC |
HV Bancorp, Inc. | PA | 1.41 | % | 56.23 | % | 1.07 | % | 0.67 | % | 4.31 | % | 19.31 | % | 1.04 | % | 54.53 | % | $ | 1,127 | ||||||||||||||||||||||
| IROQ |
IF Bancorp, Inc. | IL | 20.38 | % | 18.45 | % | 2.14 | % | 14.72 | % | 20.87 | % | 14.98 | % | 1.12 | % | NA | $ | 731 | |||||||||||||||||||||||
| PCSB |
PCSB Financial Corporation | NY | 10.70 | % | 15.42 | % | 1.00 | % | 10.89 | % | 34.86 | % | 5.70 | % | 0.02 | % | 71.05 | % | $ | 0 | ||||||||||||||||||||||
| PVBC |
Provident Bancorp, Inc. | MA | 1.24 | % | 3.89 | % | 2.66 | % | 3.15 | % | 23.25 | % | 57.32 | % | 0.47 | % | 56.82 | % | $ | 0 | ||||||||||||||||||||||
| PBIP |
Prudential Bancorp, Inc. | PA | 19.91 | % | 19.03 | % | 14.17 | % | 2.54 | % | 11.43 | % | 1.55 | % | 0.05 | % | 59.66 | % | $ | 0 | ||||||||||||||||||||||
| RNDB |
Randolph Bancorp, Inc. | MA | 6.49 | % | 54.72 | % | 4.44 | % | 1.77 | % | 14.71 | % | 2.83 | % | 1.62 | % | 80.37 | % | $ | 10,944 | ||||||||||||||||||||||
| SVBI |
Severn Bancorp, Inc. | MD | 6.56 | % | 27.80 | % | 10.78 | % | 1.89 | % | 23.59 | % | 8.27 | % | 0.20 | % | NA | $ | 980 | |||||||||||||||||||||||
| Source: | S&P Global Market Intelligence and RP® Financial, LC. calculations. The information provided in this table has been obtained from sources we believe are reliable, but we cannot guarantee the accuracy or completeness of such information. |
Copyright (c) 2021 by RP® Financial, LC.
| RP® Financial, LC. | PEER GROUP ANALYSIS | |
| III.12 |
Peer Group, the Company’s loan portfolio composition reflected a slightly lower combined concentration of 1-4 family permanent mortgage loans and mortgage-backed securities (35.08% of assets versus 37.85% for the Peer Group). Loan servicing intangibles constituted a more significant balance sheet item for the Peer Group, equal to an average of $1.8 million for the Peer Group compared to a minimal balance for the Company.
Diversification into higher risk and higher yielding types of lending was more significant for the Company. The Company’s loan portfolio composition reflected higher concentrations of commercial real estate loans (31.06% of assets versus 19.18% of assets for the Peer Group). Comparatively, the Peer Group maintained higher concentrations of construction/land loans (4.82% of assets versus 3.16% of assets for the Company), multifamily loans (5.12% of assets versus 4.00% of assets for the Company), commercial business loans (14.08% of assets versus 12.14% of assets for the Company), and consumer loans (1.42% of assets versus 0.52% of assets for the Company). In total, construction/land, commercial real estate, multi-family, commercial business and consumer loans comprised 50.88% and 44.62% of the Company’s and the Peer Group’s assets, respectively. Overall, the Company’s asset composition provided for a slightly higher risk weighted assets-to-assets ratio of 67.68% compared to 66.47% for the Peer Group.
Interest Rate Risk
Table 3.5 reflects various key ratios highlighting the relative interest rate risk exposure of the Company versus the Peer Group. In terms of balance sheet composition, Magyar Bancorp’s interest rate risk characteristics implied a higher degree of interest rate risk exposure relative to the comparable measures for the Peer Group. In particular, the Company’s tangible equity-to-assets ratio was below the Peer Group ratios. At the same time, the Company’s higher ratio of non-interest earning assets as a percent of assets implied a slightly greater degree of balance sheet interest rate risk exposure for the Company. On a pro forma basis, the infusion of stock proceeds should serve to strengthen the Company’s balance sheet interest rate risk characteristics, given the increases that will be realized in Company’s tangible equity-to-assets and IEA/IBL ratios.
To analyze interest rate risk associated with the net interest margin, we reviewed quarterly changes in net interest income as a percent of average assets for Magyar Bancorp and the Peer Group. In general, the comparative fluctuations in the Company’s and the Peer
| RP® Financial, LC. | PEER GROUP ANALYSIS | |
| III.13 |
Table 3.5
Interest Rate Risk Measures and Net Interest Income Volatility
Comparable Institution Analysis
As of September 30, 2020 or the Most Recent Date Available.
| Balance Sheet Measures | Quarterly Change in Net Interest Income | |||||||||||||||||||||||||||||||||||||||||
| Tangible Equity/ Assets |
IEA/ IBL |
Non-Earn. Assets/ Assets |
9/30/2020 | 6/30/2020 | 3/31/2020 | 12/31/2019 | 9/30/2019 | 6/30/2019 | ||||||||||||||||||||||||||||||||||
| (%) | (%) | (%) | (change in net interest income is annualized in basis points) | |||||||||||||||||||||||||||||||||||||||
| Magyar Bancorp, Inc. |
NJ | |||||||||||||||||||||||||||||||||||||||||
| December 31, 2020 |
7.9 | % | 137.0 | % | 5.4 | % | 0 | -1 | -15 | -11 | 8 | NA | ||||||||||||||||||||||||||||||
| All Non-MHC Public Thrifts |
||||||||||||||||||||||||||||||||||||||||||
| Average |
11.9 | % | 135.4 | % | 7.2 | % | -15 | -3 | -5 | -3 | -5 | -3 | ||||||||||||||||||||||||||||||
| Median |
10.5 | % | 132.9 | % | 7.2 | % | -10 | -4 | -5 | -2 | -4 | -6 | ||||||||||||||||||||||||||||||
| Comparable Group |
||||||||||||||||||||||||||||||||||||||||||
| Average |
11.2 | % | 109.6 | % | 4.8 | % | -6 | -9 | -2 | -5 | -4 | -1 | ||||||||||||||||||||||||||||||
| Median |
11.3 | % | 110.2 | % | 4.9 | % | -5 | -13 | -3 | -5 | -1 | -4 | ||||||||||||||||||||||||||||||
| Comparable Group |
||||||||||||||||||||||||||||||||||||||||||
| ESBK |
Elmira Savings Bank | NY | 7.1 | % | 102.5 | % | 7.5 | % | -30 | -30 | 15 | 8 | -7 | -10 | ||||||||||||||||||||||||||||
| ESSA |
ESSA Bancorp, Inc. | PA | 9.3 | % | 107.0 | % | 5.3 | % | 10 | -14 | -8 | 4 | 2 | 5 | ||||||||||||||||||||||||||||
| HMNF |
HMN Financial, Inc. | MN | 11.2 | % | 110.5 | % | 2.8 | % | -11 | -18 | -4 | -20 | -35 | 27 | ||||||||||||||||||||||||||||
| HVBC |
HV Bancorp, Inc. | PA | 7.3 | % | 104.3 | % | 4.8 | % | -11 | 23 | 5 | NA | NA | -2 | ||||||||||||||||||||||||||||
| IROQ |
IF Bancorp, Inc. | IL | 11.5 | % | 110.9 | % | 3.2 | % | -2 | 1 | 11 | -12 | 10 | -10 | ||||||||||||||||||||||||||||
| PCSB |
PCSB Financial Corporation | NY | 14.9 | % | 114.8 | % | 4.2 | % | -3 | -17 | -3 | -9 | 7 | 1 | ||||||||||||||||||||||||||||
| PVBC |
Provident Bancorp, Inc. | MA | 16.0 | % | 114.3 | % | 4.9 | % | 5 | -13 | -13 | 2 | -6 | 11 | ||||||||||||||||||||||||||||
| PBIP |
Prudential Bancorp, Inc. | PA | 10.0 | % | 110.0 | % | 4.9 | % | 4 | -7 | -15 | -4 | -8 | -10 | ||||||||||||||||||||||||||||
| RNDB |
Randolph Bancorp, Inc. | MA | 13.1 | % | 112.6 | % | 5.8 | % | -7 | -5 | 3 | -9 | 3 | -12 | ||||||||||||||||||||||||||||
| SVBI |
Severn Bancorp, Inc. | MD | 11.4 | % | 108.8 | % | 4.5 | % | -12 | -15 | -14 | -5 | -1 | -6 | ||||||||||||||||||||||||||||
NA=Change is greater than 100 basis points during the quarter.
| Source: | S&P Global Market Intelligence and RP® Financial, LC. calculations. The information provided in this table has been obtained from sources we believe are reliable, but we cannot guarantee the accuracy or completeness of such information. |
Copyright (c) 2021 by RP® Financial, LC.
| RP® Financial, LC. | PEER GROUP ANALYSIS | |
| III.14 |
Group’s net interest income ratios implied that a similar degree of interest rate risk was associated with the Company’s net interest margin, based on the interest rate environment that prevailed during the period covered in Table 3.5. The stability of the Company’s net interest margin should be enhanced by the infusion of stock proceeds, as interest rate sensitive liabilities will be funding a lower portion of Magyar Bancorp’s assets and the proceeds will be substantially deployed into interest-earning assets.
Credit Risk
Overall, based on a comparison of credit risk measures, the Company’s implied credit risk exposure was viewed to be greater than the Peer Group’s implied credit risk exposure. As shown in Table 3.6, the Company’s ratios for non-performing/assets and non-performing loans/loans equaled 1.66% and 1.69%, respectively, versus comparable measures of 0.97% and 1.26% for the Peer Group. These ratios include accruing loans that are classified as troubled debt restructurings. The Company’s and Peer Group’s loss reserves as a percent of non-performing loans equaled 69.50% and 155.60%, respectively. Loss reserves maintained as percent of loans receivable equaled 1.18% for the Company, versus 1.14% for the Peer Group. Net loan charge-offs were a smaller factor for the Peer Group and the Company, as net loan charge-offs for the Peer Group equaled 0.05% of loans compared to 0.01% of loans for the Company.
Summary
Based on the above analysis, RP Financial concluded that the Peer Group forms a reasonable basis for determining the pro forma market value of the Company. Such general characteristics as asset size, capital position, interest-earning asset composition, funding composition, core earnings measures, loan composition, credit quality and exposure to interest rate risk all tend to support the reasonability of the Peer Group from a financial standpoint. Those areas where differences exist will be addressed in the form of valuation adjustments to the extent necessary.
| RP® Financial, LC. | PEER GROUP ANALYSIS | |
| III.15 |
Table 3.6
Credit Risk Measures and Related Information
Comparable Institution Analysis
As of September 30, 2020
| REO/ Assets |
NPAs & 90+Del/ Assets (1) |
NPLs/ Loans (2) |
Rsrves/ Loans HFI |
Rsrves/ NPLs (2) |
Rsrves/ NPAs & 90+Del (1) |
Net Loan Chargeoffs (3) |
NLCs/ Loans |
|||||||||||||||||||||||||||||||
| (%) | (%) | (%) | (%) | (%) | (%) | ($000) | (%) | |||||||||||||||||||||||||||||||
| Magyar Bancorp, Inc. |
NJ | |||||||||||||||||||||||||||||||||||||
| December 31, 2020 |
0.28 | % | 1.66 | % | 1.69 | % | 1.18 | % | 69.50 | % | 57.82 | % | $ | 65 | 0.01 | % | ||||||||||||||||||||||
| All Non-MHC Public Thrifts |
||||||||||||||||||||||||||||||||||||||
| Averages |
0.04 | % | 0.69 | % | 0.55 | % | 0.91 | % | 1.16 | % | 182.20 | % | 158.17 | % | $ | 2,583 | ||||||||||||||||||||||
| Medians |
0.01 | % | 0.55 | % | 0.38 | % | 0.72 | % | 1.20 | % | 125.41 | % | 126.86 | % | $ | 268 | ||||||||||||||||||||||
| Comparable Group |
||||||||||||||||||||||||||||||||||||||
| Averages |
0.03 | % | 0.97 | % | 1.26 | % | 1.14 | % | 155.60 | % | 131.46 | % | $ | 306 | 0.05 | % | ||||||||||||||||||||||
| Medians |
0.02 | % | 0.96 | % | 1.45 | % | 1.27 | % | 75.17 | % | 75.17 | % | $ | 342 | 0.05 | % | ||||||||||||||||||||||
| Comparable Group |
||||||||||||||||||||||||||||||||||||||
| ESBK |
Elmira Savings Bank |
NY | 0.04 | % | 0.84 | % | 1.04 | % | 1.06 | % | 99.61 | % | 95.12 | % | $ | 416 | 0.08 | % | ||||||||||||||||||||
| ESSA |
ESSA Bancorp, Inc. |
PA | 0.01 | % | 1.41 | % | 1.85 | % | 1.07 | % | 58.13 | % | 57.55 | % | $ | 505 | 0.04 | % | ||||||||||||||||||||
| HMNF |
HMN Financial, Inc. |
MN | 0.05 | % | 0.33 | % | 0.38 | % | 1.40 | % | 369.17 | % | 318.16 | % | $ | 447 | 0.07 | % | ||||||||||||||||||||
| HVBC |
HV Bancorp, Inc. |
PA | 0.00 | % | 0.45 | % | 0.54 | % | 0.60 | % | 84.54 | % | 84.54 | % | $ | 448 | 0.14 | % | ||||||||||||||||||||
| IROQ |
IF Bancorp, Inc. |
IL | 0.06 | % | 0.24 | % | 0.23 | % | 1.24 | % | 537.69 | % | 369.45 | % | $ | 268 | 0.05 | % | ||||||||||||||||||||
| PCSB |
PCSB Financial Corporation |
NY | 0.00 | % | 0.33 | % | 0.46 | % | 0.71 | % | 154.58 | % | 146.56 | % | $ | 159 | 0.01 | % | ||||||||||||||||||||
| PVBC |
Provident Bancorp, Inc. |
MA | 0.00 | % | 1.81 | % | 1.99 | % | 1.31 | % | 65.80 | % | 65.80 | % | $ | 1,057 | 0.09 | % | ||||||||||||||||||||
| PBIP |
Prudential Bancorp, Inc. |
PA | 0.00 | % | 1.07 | % | 2.19 | % | 1.39 | % | 63.69 | % | 63.69 | % | $ | 115 | 0.02 | % | ||||||||||||||||||||
| RNDB |
Randolph Bancorp, Inc. |
MA | 0.02 | % | 1.68 | % | 1.94 | % | 1.34 | % | 58.62 | % | 54.01 | % | $ | 38 | 0.01 | % | ||||||||||||||||||||
| SVBI |
Severn Bancorp, Inc. |
MD | 0.11 | % | 1.55 | % | 1.98 | % | 1.31 | % | 64.15 | % | 59.67 | % | —$ | 394 | -0.06 | % | ||||||||||||||||||||
| (1) | NPAs are defined as nonaccrual loans, accruing loans 90 days or more past due, performing TDRs, and OREO. |
| (2) | NPLs are defined as nonaccrual loans, accruing loans 90 days or more past due and performing TDRs. |
| (3) | Net loan chargeoffs are shown on a last twelve month basis. |
| Source: | S&P Global Market Intelligence and RP® Financial, LC. calculations. The information provided in this table has been obrained from sources we believe are reliable, but we cannot guarantee the accuracy or completeness of such information. |
Copyright (c) 2021 by RP® Financial, LC.
| RP® Financial, LC. | VALUATION ANALYSIS | |
| IV.1 |
IV. VALUATION ANALYSIS
Introduction
This chapter presents the valuation analysis and methodology, prepared pursuant to the regulatory valuation guidelines, and valuation adjustments and assumptions used to determine the estimated pro forma market value of the common stock to be issued in conjunction with the Company’s conversion transaction.
Appraisal Guidelines
The federal regulatory appraisal guidelines required by the FRB, the OCC, the FDIC and state banking agencies specify the pro forma market value methodology for estimating the pro forma market value of a converting thrift. Pursuant to this methodology: (1) a peer group of comparable publicly-traded institutions is selected; (2) a financial and operational comparison of the subject company to the peer group is conducted to discern key differences; and (3) a valuation analysis in which the pro forma market value of the subject company is determined based on the market pricing of the peer group as of the date of valuation, incorporating valuation adjustments for key differences. In addition, the pricing characteristics of recent conversions, both at conversion and in the aftermarket, must be considered.
RP Financial Approach to the Valuation
The valuation analysis herein complies with such regulatory approval guidelines. Accordingly, the valuation incorporates a detailed analysis based on the Peer Group, discussed in Chapter III, which constitutes “fundamental analysis” techniques. Additionally, the valuation incorporates a “technical analysis” of recently completed stock conversions, particularly second-step conversions, including closing pricing and aftermarket trading of such offerings. It should be noted that these valuation analyses cannot possibly fully account for all the market forces which impact trading activity and pricing characteristics of a particular stock on a given day.
The pro forma market value determined herein is a preliminary value for the Company’s to-be-issued stock. Throughout the conversion process, RP Financial will: (1) review changes in Magyar Bancorp’s operations and financial condition; (2) monitor Magyar Bancorp’s operations and financial condition relative to the Peer Group to identify any fundamental changes; (3) monitor the external factors affecting value including, but not limited to, local and national economic conditions, interest rates, and the stock market environment, including the market for thrift stocks
| RP® Financial, LC. | VALUATION ANALYSIS | |
| IV.2 |
and MGYR’s stock specifically; and (4) monitor pending conversion offerings, particularly second-step conversions, (including those in the offering phase), both regionally and nationally. If during the second-conversion process material changes occur, RP Financial will determine if updated valuation reports should be prepared to reflect such changes and their related impact on value, if any. RP Financial will also prepare a final valuation update at the closing of the offering to determine if the prepared valuation analysis and resulting range of value continues to be appropriate.
The appraised value determined herein is based on the current market and operating environment for the Company and for all thrifts. Subsequent changes in the local and national economy, the legislative and regulatory environment, the stock market, interest rates, and other external forces (such as natural disasters or major world events), which may occur from time to time (often with great unpredictability) may materially impact the market value of all thrift stocks, including Magyar Bancorp’s value or Magyar Bancorp’s value alone. To the extent a change in factors impacting the Company’s value can be reasonably anticipated and/or quantified, RP Financial has incorporated the estimated impact into the analysis.
Valuation Analysis
A fundamental analysis discussing similarities and differences relative to the Peer Group was presented in Chapter III. The following sections summarize the key differences between the Company and the Peer Group and how those differences affect the pro forma valuation. Emphasis is placed on the specific strengths and weaknesses of the Company relative to the Peer Group in such key areas as financial condition, profitability, growth and viability of earnings, asset growth, primary market area, dividends, liquidity of the shares, marketing of the issue, management and the effect of government regulations and/or regulatory reform. We have also considered the market for thrift stocks, in particular new issues, to assess the impact on value of the Company coming to market at this time.
| RP® Financial, LC. | VALUATION ANALYSIS | |
| IV.3 |
| 1. | Financial Condition |
The financial condition of an institution is an important determinant in pro forma market value because investors typically look to such factors as liquidity, capital, asset composition and quality and funding sources in assessing investment attractiveness. The similarities and differences in the Company’s and the Peer Group’s financial strengths are noted as follows:
| • | Overall A/L Composition. In comparison to the Peer Group, the Company’s interest-earning asset composition showed a higher concentration of loans and a lower concentration of cash and investments. Diversification into higher risk and higher yielding types of loans was more significant for the Company, while the Peer Group maintained a slightly higher concentration of 1-4 family loans. Overall, in comparison to the Peer Group, the Company’s interest-earning asset composition provided for higher yield earned on interest-earning assets with a similar risk weighted assets-to-assets ratio. Magyar Bancorp’s funding composition reflected a higher level of deposits and a similar level of borrowings relative to the comparable Peer Group measures, which translated into a lower cost of funds for the Company. Overall, as a percent of assets, the Company maintained higher levels of interest-earning assets and interest-bearing liabilities compared to the Peer Group’s ratios, which resulted in a lower IEA/IBL ratio for the Company, primarily due to the Company’s lower equity ratio. After factoring in the impact of the net stock proceeds, the Company’s IEA/IBL ratio should compare more favorably withthe Peer Group’s IEA/IBL ratio. On balance, RP Financial concluded that asset/liability composition was a neutral factor in our adjustment for financial condition. |
| • | Credit Quality. The Company’s ratios for non-performing assets as a percent of assets and non-performing loans as a percent of loans were higher than the comparable ratios for the Peer Group. In comparison to the Peer Group, the Company maintained lower loss reserves as a percent of non-performing loans and as a percent of loans. Net loan charge-offs as a percent of loans were similar for the Company and the Peer Group. The Company’s risk weighted assets-to-assets ratio was similar to the Peer Group’s ratio. Overall, RP Financial concluded that credit quality was a slight downward factor in our adjustment for financial condition. |
| • | Balance Sheet Liquidity. The Company operated with a lower level of cash and investment securities relative to the Peer Group (13.66% of assets versus 21.58% for the Peer Group). Following the infusion of stock proceeds, the Company’s cash and investments ratio is expected to increase as the net proceeds realized from the second-step offering will be initially deployed into cash and investments. The Company was viewed as having a comparable future borrowing capacity relative to the Peer Group, based on the higher level of borrowings currently funding the Peer Group’s assets. Overall, RP Financial concluded that balance sheet liquidity was a neutral factor in our adjustment for financial condition. |
| • | Funding Liabilities. The Company’s interest-bearing funding composition reflected a slightly higher concentration of deposits and a similar concentration of borrowings relative to the comparable Peer Group ratios, which translated into a lower cost of funds for the Company. Total interest-bearing liabilities as a percent of assets were higher for the Company. Following the stock offering, the increase in the Company’s capital position will reduce the level of interest-bearing liabilities funding the Company’s assets. Overall, RP Financial concluded that funding liabilities was a neutral factor in our adjustment for financial condition. |
| • | Capital. The Company currently operates with a lower tangible equity-to-assets ratio than the Peer Group. Following the stock offering, Magyar Bancorp’s pro forma tangible capital position will be similar to the Peer Group’s tangible equity-to-assets ratio. The increase in the Company’s pro forma capital position will result in greater leverage potential and reduce the level of interest-bearing liabilities utilized to fund assets. At the same time, the Company’s much lower earnings level will likely result in a materially lower ROE. On balance, RP Financial concluded that capital strength was a moderately negative factor in our adjustment for financial condition. |
| RP® Financial, LC. | VALUATION ANALYSIS | |
| IV.4 |
On balance, Magyar Bancorp’s balance sheet strength was considered to be less favorable relative to the Peer Group’s balance sheet strength and, thus, a moderate downward adjustment was applied for the Company’s financial condition.
| 2. | Profitability, Growth and Viability of Earnings |
Earnings are a key factor in determining pro forma market value, as the level and risk characteristics of an institution’s earnings stream and the prospects and ability to generate future earnings heavily influence the multiple that the investment community will pay for earnings. The major factors considered in the valuation are described below.
| • | Reported Earnings. The Company’s reported earnings were lower than the Peer Group’s on a ROAA basis (0.42% of average assets versus 0.91% for the Peer Group). The Company maintained earnings advantages with respect to a higher net interest income ratio and a lower ratio for operating expenses, while the Peer Group maintained an earnings advantage with respect to a higher non-interest operating income ratio and lower loan loss provisions. Reinvestment of stock proceeds into interest-earning assets will serve to increase the Company’s revenue, with the benefit of reinvesting proceeds expected to be offset by implementation of additional stock benefit plans in connection with the second-step offering. Overall, the Company’s pro forma reported earnings were considered to be less favorable than the Peer Group’s reported earnings and, thus, RP Financial concluded that this was a slightly negative factor in our adjustment for profitability, growth and viability of earnings. |
| • | Core Earnings. Net interest income, operating expenses, non-interest operating income and loan loss provisions were reviewed in assessing the relative strengths and weaknesses of the Company’s and the Peer Group’s core earnings. The Company maintained a higher net interest income ratio, a lower operating expense ratio and a lower level of non-interest operating income. The Company’s more favorable net interest income and operating expense ratios translated into a higher expense coverage ratio in comparison to the Peer Group’s ratio (equal to 1.20x versus 0.92x for the Peer Group). After taking into account the Company’s lower level of non-interest income, the Company’s efficiency ratio of 74.79% was less favorable than the Peer Group’s efficiency ratio of 68.76%. Loan loss provisions had a more significant impact on the Company’s earnings. After adjusting for non-operating losses and gains, the Company’s ROAA ratio remained below the comparable Peer Group ratio. Overall, these measures, as well as the expected earnings benefits the Company should realize from the redeployment of stock proceeds into interest-earning assets and leveraging of post-conversion capital, which will be negated by expenses associated with the stock benefit plans, indicate that the Company’s pro forma core earnings will remain less favorable than the Peer Group’s core earnings. Therefore, RP Financial concluded that this was a negative factor in our adjustment for profitability, growth and viability of earnings. |
| RP® Financial, LC. | VALUATION ANALYSIS | |
| IV.5 |
| • | Interest Rate Risk. Quarterly changes in the Company’s and the Peer Group’s net interest income to average assets ratios indicated a similar degree of volatility was associated with the Company’s net interest margin. Other measures of interest rate risk, such as equity and non-interest earning asset ratios were more favorable for the Peer Group, while the Company reported a higher IEA/IBL ratio. On a pro forma basis, the infusion of stock proceeds can be expected to provide the Company with higher equity-to-assets and IEA/ILB ratios and perhaps provide greater stability in the quarterly net interest margin. On balance, RP Financial concluded that interest rate risk was a neutral factor in our adjustment for profitability, growth and viability of earnings. |
| • | Credit Risk. Loan loss provisions were a more significant factor in the Company’s earnings (0.29% of average assets versus 0.23% of average assets for the Peer Group). In terms of future exposure to credit quality related losses, lending diversification into higher risk types of loans was slightly more significant for the Company. The Company’s credit quality measures generally implied a higher degree of credit risk exposure relative to the comparable credit quality measures indicated for the Peer Group. Overall, RP Financial concluded that credit risk was a slight downward factor in our adjustment for profitability, growth and viability of earnings. |
| • | Earnings Growth Potential. Several factors were considered in assessing earnings growth potential. First, the Company maintained a higher interest rate spread than the Peer Group, which would tend to facilitate continuation of a higher net interest margin for the Company going forward based on the current prevailing interest rate environment. The reinvestment of the net proceeds will add to net interest income, but the initial reinvestment yields are expected to reduce the overall spread. Second, the infusion of stock proceeds will provide the Company with similar growth potential through leverage compared to that maintained by the Peer Group. Third, the Peer Group’s higher ratio of non-interest operating income and the Company’s lower operating expense ratio were viewed as respective advantages to sustain earnings growth during periods when net interest margins come under pressure as the result of adverse changes in interest rates. Overall, earnings growth potential was considered to be a neutral factor in our adjustment for profitability, growth and viability of earnings. |
| • | Return on Equity. Currently, the Company’s core ROE is somewhat lower than the Peer Group’s core ROE. As the result of the increase in capital that will be realized from the infusion of net stock proceeds into the Company’s equity, the Company’s pro forma return equity on a core earnings basis will be further at a disadvantage compared to the Peer Group’s core ROE. Accordingly, this was a downward factor in the adjustment for profitability, growth and viability of earnings. |
On balance, Magyar Bancorp’s pro forma earnings strength was considered to be less favorable to the Peer Group’s earnings strength and, thus, a slight downward adjustment was applied for profitability, growth and viability of earnings.
| RP® Financial, LC. | VALUATION ANALYSIS | |
| IV.6 |
| 3. | Asset Growth |
Comparative most recent annual asset growth rates for the Company and the Peer Group showed respective increases of 13.91% and 15.01%. The Company’s asset growth was realized through a 12.22% increase in loans and a higher 34.64% increase in cash and investments. Comparatively, asset growth for the Peer Group consisted of a 36.91% increase in cash and investments and a 12.66% increase in loans. On a pro forma basis, the Company’s tangible equity-to-assets ratio will be in the range of the Peer Group’s tangible equity-to-assets ratio, indicating similar leverage capacity for the Company. On balance, no adjustment was applied for asset growth.
| 4. | Primary Market Area |
The general condition of an institution’s market area has an impact on value, as future success is in part dependent upon opportunities for profitable activities in the local market served. Magyar Bancorp maintains branch offices in the central New Jersey region. Operating in a densely populated market area provides the Company with growth opportunities, but such growth must be achieved in a highly competitive market environment. The Company competes against significantly larger institutions that provide a larger array of services and have significantly larger branch networks than maintained by Magyar Bancorp.
The Peer Group companies generally operate in markets with smaller populations compared to Middlesex County. Population growth for the primary market area counties served by the Peer Group companies reflected a range of growth rates, but, overall, population growth rates in the markets served by the Peer Group companies were stronger compared to Middlesex’s recent historical and projected population growth rates. Middlesex County has a similar per capita income compared to the Peer Group’s average and median per capita incomes and, on average, the Peer Group’s primary market area counties were less affluent markets within their respective states compared to Middlesex County’s per capita income as a percent of New Jersey’s per capita income (112.6% for the Peer Group versus 120.8% for Middlesex County). The average and median deposit market shares maintained by the Peer Group companies were higher than the Company’s market share of deposits in Middlesex County. Overall, the degree of competition faced by the Peer Group companies was viewed as less than the Company’s competitive environment in Middlesex County, while the growth potential in the markets served by the Peer Group companies was for the most part viewed to be comparable to the growth potential provided by the Company’s primary market area. Summary demographic and deposit market share data
| RP® Financial, LC. | VALUATION ANALYSIS | |
| IV.7 |
for the Company and the Peer Group companies is provided in Exhibit III-4. As shown in Table 4.1, the average unemployment rate for the primary market area counties served by the Peer Group companies was slightly higher than the unemployment rate reflected for Middlesex County. On balance, we concluded that no adjustment was appropriate for the Company’s market area.
Table 4.1
Market Area Unemployment Rates
Magyar Bancorp, Inc. and the Peer Group Companies(1)
| County | December 2020 Unemployment |
|||||||
| Magyar Bancorp, Inc. - NJ |
Middlesex | 6.6 | % | |||||
| Peer Group Average |
6.3 | % | ||||||
| Prudential Bancorp, Inc. – PA |
Philadelphia | 9.3 | ||||||
| Elmira Savings Bank - NY |
Chemung | 6.7 | ||||||
| HMN Financial, Inc. – MN |
Olmstead | 3.8 | ||||||
| ESSA Bancorp, Inc. – PA |
Monroe | 7.8 | ||||||
| HV Bancorp, Inc. - PA |
Bucks | 5.3 | ||||||
| IF Bancorp, Inc. – IL |
Iroquois | 4.7 | ||||||
| Randolph Bancorp, Inc. - MA |
Norfolk | 6.4 | ||||||
| Severn Bancorp, Inc. - MD |
|
Anne Arundel |
|
4.9 | ||||
| PCSB Financial Corporation - NY |
Westchester | 6.0 | ||||||
| Provident Bancorp, Inc. – MA |
Essex | 7.7 | ||||||
(1) Unemployment rates are not seasonally adjusted.
Source: S&P Global Market Intelligence.
| 5. | Dividends |
Magyar Bancorp has never paid a cash dividend to its shareholders and has indicated that no decision has been made regarding the potential to begin cash dividend payments to shareholders following completion of the conversion. Any initial dividend and future declarations of dividends by the Board of Directors will depend upon a number of factors, including investment opportunities, growth objectives, financial condition, profitability, tax considerations, minimum capital requirements, regulatory limitations, stock market characteristics and general economic conditions.
Seven out of the ten Peer Group companies pay regular cash dividends, with implied dividend yields ranging from 1.02% to 4.90%. The average dividend yield on the stocks of the Peer Group institutions was 1.55% as of February 5, 2021. Comparatively, as of February 5, 2021, the average dividend yield on the stocks of all fully-converted publicly-traded thrifts equaled 2.36%.
| RP® Financial, LC. | VALUATION ANALYSIS | |
| IV.8 |
Overall, following the second-step conversion, the Company’s capacity to pay dividends is viewed to be comparable to the Peer Group’s capacity to pay dividends based on capitalization, and somewhat less favorable based on pro forma earnings levels. On balance, we concluded that no adjustment was warranted for this factor.
| 6. | Liquidity of the Shares |
The Peer Group is by definition composed of companies that are traded in the public markets. All of the Peer Group companies trade on NASDAQ. Typically, the number of shares outstanding and market capitalization provides an indication of how much liquidity there will be in a particular stock. The market capitalization of the Peer Group companies ranged from $33.8 million to $241.4 million as of February 5, 2021, with average and median market values of $115.6 million and $100.7 million, respectively. The shares issued and outstanding of the Peer Group companies ranged from 2.0 million to 18.1 million, with average and median shares outstanding equal to 8.3 million and 6.6 million, respectively. The Company’s second-step stock offering is expected to provide for a pro forma market value that will be lower than all but two of the Peer Group companies, and approximately half of the average market capitalization of the Peer Group. The pro forma shares outstanding that will be somewhat lower than the median of the Peer Group’s shares outstanding. Following the second-step conversion, the Company’s stock will be traded on the NASDAQ Capital Market. Overall, we anticipate that the Company’s stock will have a somewhat lower level of trading as the Peer Group companies on average and, therefore, we concluded that a slight downward adjustment was necessary for this factor.
| 7. | Marketing of the Issue |
We believe that four separate markets exist for thrift stocks, including those coming to market such as Magyar Bancorp: (A) the after-market for public companies, in which trading activity is regular and investment decisions are made based upon financial condition, earnings, capital, ROE, dividends and future prospects; (B) the new issue market in which converting thrifts are evaluated on the basis of the same factors, but on a pro forma basis without the benefit of prior operations as a fully-converted company; (C) the acquisition market for thrift and bank franchises based in New Jersey; and (D) the market for the public stock of MGYR. All of these markets were considered in the valuation of the Company’s to-be-issued stock.
| RP® Financial, LC. | VALUATION ANALYSIS | |
| IV.9 |
| A. | The Public Market |
The value of publicly-traded thrift stocks is easily measurable, and is tracked by most investment houses and related organizations. Exhibit IV-1 provides pricing and financial data on all publicly-traded thrifts. In general, thrift stock values react to market stimuli such as interest rates, inflation, perceived industry health, projected rates of economic growth, regulatory issues and stock market conditions in general. Exhibit IV-2 displays historical stock market trends for various indices and includes historical stock price index values for publicly-traded thrifts and commercial banks. Exhibit IV-3 displays various stock price indices as of February 5, 2021.
In terms of assessing general stock market conditions, the performance of the overall stock market has been mixed in recent quarters. Stocks opened the second quarter of 2020 with a bruising sell-off after President Trump issued a warning on the coronavirus pandemic, which was followed by major U.S. stock indexes surging higher. News that New York recorded its first daily decline in Covid-19 deaths and the Federal Reserve’s commitment to provide an unprecedent level of support for the economy were noted factors that powered the stock market rally. The second week of April concluded with stocks posting their biggest week of gains since 1974. Stocks advanced a second consecutive week going into mid-April, as investors reacted to reports that an antiviral medicine was showing promise and the growing potential for the gradual reopening of the U.S. economy. Energy shares led stocks lower heading into the second half of April, as oil prices plunged below $0 a barrel. Promising news for a coronavirus drug and the Federal Reserve’s statement that it was in no hurry to end stimulus measures contributed to broader stock market gains through the end of April. Overall, April was the best month for stocks in decades, as the Dow Jones Industrial Average (“DJIA”) and S&P 500 posted respective gains of 11% and 13%. Comparatively, the NASDAQ was down 0.3% in April. Following a sell-off at the start of May, the broader stock market trended higher ahead of the April employment report and then rallied sharply higher with the release of the April employment report on May 8th. Stocks fell broadly the first few trading days the following week, as investors reacted to a sharp decline in the April consumer price index and the Federal Reserve’s grim assessment on how long it would take the U.S. economy to recover. Going into the second half of May, stocks surged higher on positive results reported by a drugmaker’s early study of a potential coronavirus vaccine and optimism that the U.S. economy would start to recover as all 50 states relaxed some of their coronavirus restrictions. Optimism about economies reopening and the potential development of a coronavirus vaccine continued to propel stock market gains in late-May and early-June. Stocks continued to surge higher to close out the first week of trading in June, as investors reacted to a
| RP® Financial, LC. | VALUATION ANALYSIS | |
| IV.10 |
surprisingly strong May employment report. The rebound in the broader stock market continued into the beginning of the second week of June, with the NASDAQ closing at a record high and the S&P 500 moving into positive territory for the year. Stocks closed out the second week of trading in June posting their worst weekly loss since March, as growing fears of a surge in coronavirus infections fueled a stock market route on June 11th. After Federal Reserve officials highlighted the pandemic’s potential to weaken the U.S. economy over the long-term, shares of banks and manufacturers were among the hardest hit stocks in the sell-off. A rebound in May retail sales and the Federal Reserve’s announcement that it would broaden its program to purchase bonds of U.S. companies translated into stocks rallying going into the second half of June, which was followed by a wavering stock market environment through multiple trading sessions as investors weighed a rise in coronavirus infections against signs of the U.S. economy recovering. A record number of new coronavirus cases in some large states fueled a late-June sell-off in the broader stock market, as investors reacted to reinstatement of lockdown measures by some of those states. Growing expectations for additional stimulus from the Federal Reserve contributed to stocks rallying to close out the second quarter, as U.S. stocks wrapped up their best quarter in more than 20 years. For the second quarter of 2020, the DJIA was up 18%, the S&P 500 was up 20% and the NASDAQ was up 31%.
Stocks started out the third quarter of 2020 trading mixed ahead of the release of the June employment report and then rallied higher with the release of the June employment report, which showed the U.S. economy added more jobs than expected. Volatility prevailed in the broader stock market through mid-July, as investors weighed hopes of a Covid-19 vaccine after two companies received “fast track” designations for the development of their coronavirus vaccine candidates against a resurgence in Covid-19 positive cases that was providing for an uneven reopening of the U.S. economy. Stocks retreated heading into the last week of July, as the first weekly increase in new unemployment claims since March raised concerns that mounting coronavirus infections and a renewed wave of mandated lockdowns could slow an economic recovery. The broader stock market continued to trade unevenly in the final week of July, as investors reacted to mixed second quarter earnings reports by some large companies, a record decline in second quarter GDP and the Federal Reserve’s reiteration that it would continue to support the U.S. economy. Overall, technology stocks were the strongest performing stocks during July, as the NASDAQ closed out July at a new record high. Progress in Congressional negotiations for a new coronavirus relief package and initial weekly unemployment claims falling to their lowest level since the coronavirus hit the U.S. in March fueled stock market gains during
| RP® Financial, LC. | VALUATION ANALYSIS | |
| IV.11 |
the first week of August. The DJIA extended its winning streak to seven sessions on August 10th, as investors assessed the likelihood of another round of stimulus spending and the slowing pace of new coronavirus infections. Led by advances in technology shares, the broader stock market continued to surge higher through the second half of August with the NASDAQ and S&P 500 posting a number of new record highs. Overall, the month of August was the best month for U.S. stocks since April, with stimulus from the U.S. Government, signs of economic revival and progress toward a coronavirus vaccine fueling the gains in the broader stock market. An upbeat report on August manufacturing activity helped to extend the stock market rally into early-September, as the DJIA closed above 29000 for the first time since February. A sell-off in technology stocks led the stock market lower going into the second week of September, as NASDAQ fell into correction territory amid concerns that technology shares had become overvalued. Stocks rebounded heading into mid-September, as technology stocks led the broader stock market higher on large acquisitions announced by Oracle and Nvidia. A decline in oil and gold prices pressured economically sensitive shares lower going in the second half of September, which was followed by a one-day sell-off in technology shares as hopes for additional fiscal stimulus dimmed and investors continued to question the valuation of tech stocks. Stocks regained some lost ground in the final week of the third quarter, which was led by a rebound in economically sensitive shares.
Stocks traded lower at the start of the fourth quarter of 2020, as investors reacted to the September employment report that showed job growth was less than expected. News of President Trump’s improving health propelled stocks higher at the beginning of the second week of October, which was followed by a one-day sell-off caused by a halt in negotiations for a new economic relief package. Stocks rallied higher following the one-day sell-off on revived hopes for a new stimulus deal, as Democratic and White House negotiators resumed negotiations for a coronavirus relief bill. Mixed earnings reports at the start of the third quarter earnings season pressured stocks lower going into mid-October. The sell-off in the broader stock market sharpened during the second half of October, as a surge in coronavirus cases added to worries about the economic outlook in the absence of a stimulus deal. Better-than-expected economic data for third quarter GDP growth and October manufacturing activity contributed to stocks rallying ahead of the election in early-November. The stock market rallied continued on Election Day and the following day, as Wall Street reacted to election results that indicated a Biden presidency gridlocked by a Republican-controlled Senate. News of promising results for two Covid-19 vaccines bolstered stock markets gains through the end of November, which included the DJIA
| RP® Financial, LC. | VALUATION ANALYSIS | |
| IV.12 |
closing above 30000 for the first time. Overall, for the month of November, the DJIA increased 12%, marking its best month since January 1987, while the NASDAQ and S&P 500 posted respective gains of 12% and 11%. Signs of progress on a stimulus relief package and the effectiveness rates for the forthcoming Covid-19 vaccines helped to sustain the broader stock market rally through the first week of December, with the NASDAQ and S&P 500 closing at new record highs. Stocks retreated going into mid-December, as negotiations over a coronavirus relief package stalled. As Congress neared a deal on a new coronavirus relief package, all three major U.S. stock indexes closed at record highs going into the second half of December. Stocks paused after closing at new record highs, as Covid-19 concerns overshadowed Congress’s approval of a coronavirus relief package. All three major U.S. stock indexes closed at record highs in the final week of 2020, as the rollout of the coronavirus vaccine and passage of a new stimulus package buoyed investors’ sentiment.
A wave of new Covid-19 infections prompted a sell-off in the broader stock at the at the start of 2021, which was followed by stocks rallying higher on expectations that there would be a big boost in government spending under a Democrat-controlled Senate. Stocks fell in mid-January, as initial jobless claims posted their biggest weekly increase since the Covid-19 pandemic hit in March. After all three major U.S. stock indexes closed at record highs going into the second half of January, all three major U.S. stock indexes suffered their sharpest losses in late-January amid concerns about how effectively the Covid-19 vaccine was being distributed. Robust fourth quarter earnings posted by some large-cap stocks and a decline in initial jobless claims for a third straight week contributed to stocks rallying higher in the first week of February. On February 5, 2021, the DJIA closed at 31148.24, an increase of 7.0% from one year ago and an increase of 1.8% year-to-date, and the NASDAQ closed at 13856.30, an increase of 45.5% from one year ago and an increase of 7.5% year-to-date. The S&P 500 Index closed at 3886.83 on February 5, 2021, an increase of 16.8% from one year ago and an increase of 3.5% year-to-date.
The market for thrift stocks has also experienced varied trends in recent quarters. Financial shares pulled back in early-July 2020 amid a dramatic surge in confirmed coronavirus infections in the south and west regions of the U.S., which forced several states to pause or reverse plans to reopen businesses. Growing optimism of a Covid-19 vaccine being developed in the near term contributed to financial shares trading higher along with the broader stock market heading into mid-July, which was followed by a slight pullback in financial shares as big bank second quarter earnings reports warned of a protracted downturn for the U.S. economy. Financial
| RP® Financial, LC. | VALUATION ANALYSIS | |
| IV.13 |
shares traded unevenly throughout the second half of July, in light of uncertainty over the outlook for the U.S. economy and related impact on credit quality. After trading lower the first few trading days of August, financial shares participated in the broader stock market rally going into mid-August. Financial shares diverged from the broader stock market rally in the second half of August and into early-September, as economic uncertainty revolving around the Covid-19 pandemic weighed on the shares of economically sensitive stocks. After trading higher with the release of the better-than-expected employment report for August 2020, thrift stocks retreated in the second week of September. Financial shares edged higher at the conclusion of the Federal Reserve’s mid-September policy meeting, whereby the Federal Reserve pledged to support the economic recovery by setting a higher bar to raise interest rates and by signaling it expected to hold rates near zero for at least three more years. The sell-off in economically sensitive shares going into the second half of September translated into market losses for bank and thrift stocks, which was followed by an uptick in financial shares at the close of the third quarter.
The positive trend in thrift stocks continued through the first two weeks of October 2020, as economically sensitive stocks climbed on hopes for passage of a new coronavirus stimulus bill. Despite better-than-expected third quarter earnings results posted by some big banks at the start of the third quarter earnings season, financial shares traded lower in mid-October. Financial shares rallied going into late-October, as news that weekly initial jobless claims fell by 55,000 pushed the 10-year Treasury yield up to 0.85%. Financial shares sold-off along with the broader stock market during the last week of October, as rising coronavirus cases shook investors’ confidence in the economic recovery. Financial shares also participated in the broader stock market rally during the first two trading days of November and on Election Day, but then diverged from the broader stock market rally the day following the election as investors bet that the election results and a potentially long period of vote counting would delay and potentially reduce another round of stimulus. Amid building hopes that drug-makers were on the brink of pushing out vaccines effective enough to fight the coronavirus, economically sensitive stocks, such as bank stocks, were among the strongest performing sectors for the balance of November. After trading lower on last day of November, the positive trend in thrift stocks resumed through the first half of December on signs of a progress in negotiations over a coronavirus relief package. Amid a surge in coronavirus infections and the Federal Reserve leaving its benchmark interest rate near zero, thrift shares edged lower going into final week of 2020 and then rebounded in the last week of 2020 after President Trump signed a Covid-19 relief bill.
| RP® Financial, LC. | VALUATION ANALYSIS | |
| IV.14 |
Thrift shares traded flat at the start of 2021 and then rallied higher in the second week of January on expectations of additional stimulus after Democrats took control of the Senate. Thrift shares reversed course and trended lower in the second half of January on concerns over the lingering economic impact of the coronavirus and related impact on loan demand and credit quality. A decline in coronavirus cases across the U.S. helped thrift shares to rebound in the first week of February. On February 5, 2021, the SNL Thrift Index for all publicly-traded thrifts closed at 851.8, a decrease of 5.2% from one year ago and an increase of 4.3% year-to-date.
| B. | The New Issue Market |
In addition to thrift stock market conditions in general, the new issue market for converting thrifts is also an important consideration in determining the Company’s pro forma market value. The new issue market is separate and distinct from the market for seasoned thrift stocks in that the pricing ratios for converting issues are computed on a pro forma basis, specifically: (1) the numerator and denominator are both impacted by the conversion offering amount, unlike existing stock issues in which price change affects only the numerator; and (2) the pro forma pricing ratio incorporates assumptions regarding source and use of proceeds, effective tax rates, stock plan purchases, etc. which impact pro forma financials, whereas pricing for existing issues are based on reported financials. The distinction between pricing of converting and existing issues is perhaps no clearer than in the case of the price/book (“P/B”) ratio in that the P/B ratio of a converting thrift will typically result in a discount to book value whereas in the current market for existing thrifts the P/B ratio may reflect a premium to book value. Therefore, it is appropriate to also consider the market for new issues, both at the time of the conversion and in the aftermarket.
As shown in Table 4.2, two second-step conversion offerings have been completed during the past twelve months. Both of the second-step conversion offerings were completed in January 2021. The average closing pro forma price/tangible book ratio of the two second-step conversion offerings equaled 68.5%. On average, the two second-step conversion offerings reflected price appreciation of 1.6% after the first week of trading. As of February 5, 2021, the two second-step conversion offerings reflected a 2.5% increase in price on average from their IPO prices.
| RP® Financial, LC. | VALUATION ANALYSIS | |
| IV.15 |
Table 4.2
Pricing Characteristics and After-Market Trends
Conversions Completed in Trailing 12 Months
| Institutional Information |
Pre-Conversion Data | Offering Information | Contribution to | Insider Purchases | Pro Forma Data | Post-IPO Pricing Trends | ||||||||||||||||||||||||||||||||||||||||||||||||||||||||||||||||||||||||||||||||||||||||||||||||||||||||||||||||||||||||||
| Financial Info. | Asset Quality | Char. Found. | % Off Incl. Fdn.+Merger Shares |
Pricing Ratios(2)(5) |
Financial Charac. |
Closing Price: | ||||||||||||||||||||||||||||||||||||||||||||||||||||||||||||||||||||||||||||||||||||||||||||||||||||||||||||||||||||||||||
| Excluding Foundation | % of Public Off. Inc. Fdn. |
Benefit Plans | Initial Div. Yield |
First Trading Day |
% Chg |
After First Week(3) |
% Chg |
After First Month(4) |
% Chg |
Thru 2/5/2021 |
% Chg |
|||||||||||||||||||||||||||||||||||||||||||||||||||||||||||||||||||||||||||||||||||||||||||||||||||||||||||||||||||||
| Institution |
Conversion Date |
Ticker | Assets | Equity/ Assets |
NPAs/ Assets |
Res. Cov. |
Gross Proc. |
% Offer |
% of Mid. |
Exp./ Proc. |
Form | ESOP | Recog. Plans |
Stk Option |
Mgmt.& Dirs. |
P/ TB |
Core P/E |
P/A | Core ROA |
TE/ A |
Core ROE |
IPO Price |
||||||||||||||||||||||||||||||||||||||||||||||||||||||||||||||||||||||||||||||||||||||||||||||||||||||||||
| ($Mil) | (%) | (%) | (%) | ($Mil.) | (%) | (%) | (%) | (%) | (%) | (%) | (%) | (%)(1) | (%) | (%) | (x) | (%) | (%) | (%) | (%) | ($) | ($) | (%) | ($) | (%) | ($) | (%) | ($) | (%) | ||||||||||||||||||||||||||||||||||||||||||||||||||||||||||||||||||||||||||||||||||||||||||||||||||||
| Standard Conversions |
|
|||||||||||||||||||||||||||||||||||||||||||||||||||||||||||||||||||||||||||||||||||||||||||||||||||||||||||||||||||||||||||||||
| Eastern Bankshares, Inc., MA* |
10/15/20 | EBC-NASDAQ | $ | 13,997 | 12.10 | % | 0.04 | % | 211 | % | $ | 1,797.1 | 100 | % | 118 | % | 1.6 | % | S | 4.0 | % | 8.0 | % | 4.0 | % | 10.0 | % | 0.1 | % | 0.00 | % | 65.0 | % | 22.8x | 12.0 | % | 0.5 | % | 19.0 | % | 2.5 | % | $ | 10.00 | $ | 12.15 | 21.5 | % | $ | 12.48 | 24.8 | % | $ | 13.62 | 36.2 | % | $ | 16.18 | 61.8 | % | ||||||||||||||||||||||||||||||||||||||||||||||||||||||||||||||||||||
| Systematic Savings Bank, MO |
10/14/20 | SSSB-OTCPink | $ | 40 | 12.64 | % | 8.00 | % | NM | $ | 6.0 | 100 | % | 132 | % | 14.3 | % | N.A. | N.A. | 0.0 | % | 0.0 | % | 0.0 | % | 18.0 | % | 0.00 | % | 58.6 | % | 46.5x | 13.2 | % | 0.3 | % | 22.5 | % | 1.3 | % | $ | 10.00 | $ | 10.00 | 0.0 | % | $ | 10.00 | 0.0 | % | $ | 10.00 | 0.0 | % | $ | 10.00 | 0.0 | % | ||||||||||||||||||||||||||||||||||||||||||||||||||||||||||||||||||||||
|
|
|
|
|
|
|
|
|
|
|
|
|
|
|
|
|
|
|
|
|
|
|
|
|
|
|
|
|
|
|
|
|
|
|
|
|
|
|
|
|
|
|
|
|
|
|
|
|
|
|
|
|
|
|
|
|
|
|
|
|
|
|
|
|
|
||||||||||||||||||||||||||||||||||||||||||||||||||||||||||||||||
| Averages - Standard Conversions: |
|
$ | 7,018 | 12.37 | % | 4.02 | % | 211 | % | $ | 901.5 | 100 | % | 125 | % | 7.9 | % | N.A. | N.A. | 4.0 | % | 2.0 | % | 5.0 | % | 9.1 | % | 0.00 | % | 61.8 | % | 34.7x | 12.6 | % | 0.4 | % | 20.8 | % | 1.9 | % | $ | 10.00 | $ | 11.08 | 10.8 | % | $ | 11.24 | 12.4 | % | $ | 11.81 | 18.1 | % | $ | 13.09 | 30.9 | % | ||||||||||||||||||||||||||||||||||||||||||||||||||||||||||||||||||||||
| Medians - Standard Conversions: |
|
$ | 7,018 | 12.37 | % | 4.02 | % | 211 | % | $ | 901.5 | 100 | % | 125 | % | 7.9 | % | N.A. | N.A. | 4.0 | % | 2.0 | % | 5.0 | % | 9.1 | % | 0.00 | % | 61.8 | % | 34.7x | 12.6 | % | 0.4 | % | 20.8 | % | 1.9 | % | $ | 10.00 | $ | 11.08 | 10.8 | % | $ | 11.24 | 12.4 | % | $ | 11.81 | 18.1 | % | $ | 13.09 | 30.9 | % | ||||||||||||||||||||||||||||||||||||||||||||||||||||||||||||||||||||||
| Second Step Conversions |
|
|||||||||||||||||||||||||||||||||||||||||||||||||||||||||||||||||||||||||||||||||||||||||||||||||||||||||||||||||||||||||||||||
| Affinity Bancshares, Inc., GA |
1/21/21 | |
AFBI- NASDAQ |
$ | 888 | 8.93 | % | 0.56 | % | 154 | % | $ | 37.0 | 54 | % | 132 | % | 4.1 | % | N.A. | N.A. | 8.0 | % | 4.0 | % | 10.0 | % | 3.5 | % | 0.00 | % | 75.3 | % | 17.6x | 7.5 | % | 0.4 | % | 10.2 | % | 3.6 | % | $ | 10.00 | $ | 10.85 | 8.5 | % | $ | 10.75 | 7.5 | % | $ | 10.75 | 7.5 | % | $ | 10.75 | 7.5 | % | ||||||||||||||||||||||||||||||||||||||||||||||||||||||||||||||||||||
| Generations Bancorp NY, Inc. |
1/13/21 | |
GBNY- NASDAQ |
$ | 368 | 8.10 | % | 1.08 | % | 54 | % | $ | 14.8 | 60 | % | 98 | % | 8.8 | % | N.A. | N.A. | 8.0 | % | 4.0 | % | 10.0 | % | 3.1 | % | 0.00 | % | 61.7 | % | 15.0x | 6.5 | % | 0.4 | % | 10.5 | % | 4.0 | % | $ | 10.00 | $ | 10.05 | 0.5 | % | $ | 9.56 | -4.4 | % | $ | 9.74 | -2.6 | % | $ | 9.74 | -2.6 | % | ||||||||||||||||||||||||||||||||||||||||||||||||||||||||||||||||||||
|
|
|
|
|
|
|
|
|
|
|
|
|
|
|
|
|
|
|
|
|
|
|
|
|
|
|
|
|
|
|
|
|
|
|
|
|
|
|
|
|
|
|
|
|
|
|
|
|
|
|
|
|
|
|
|
|
|
|
|
|
|
|
|
|
|
||||||||||||||||||||||||||||||||||||||||||||||||||||||||||||||||
| Averages - Second Step Conversions: |
|
$ | 628 | 8.52 | % | 0.82 | % | 104 | % | $ | 25.9 | 57 | % | 115 | % | 6.5 | % | N.A. | N.A. | 8.0 | % | 4.0 | % | 10.0 | % | 3.3 | % | 0.00 | % | 68.5 | % | 16.3x | 7.0 | % | 0.4 | % | 10.3 | % | 3.8 | % | $ | 10.00 | $ | 10.45 | 4.5 | % | $ | 10.16 | 1.6 | % | $ | 10.25 | 2.5 | % | $ | 10.25 | 2.5 | % | ||||||||||||||||||||||||||||||||||||||||||||||||||||||||||||||||||||||
| Medians - Second Step Conversions: |
|
$ | 628 | 8.52 | % | 0.82 | % | 104 | % | $ | 25.9 | 57 | % | 115 | % | 6.5 | % | N.A. | N.A. | 8.0 | % | 4.0 | % | 10.0 | % | 3.3 | % | 0.00 | % | 68.5 | % | 16.3x | 7.0 | % | 0.4 | % | 10.3 | % | 3.8 | % | $ | 10.00 | $ | 10.45 | 4.5 | % | $ | 10.16 | 1.6 | % | $ | 10.25 | 2.5 | % | $ | 10.25 | 2.5 | % | ||||||||||||||||||||||||||||||||||||||||||||||||||||||||||||||||||||||
| Mutual Holding Companies |
|
|||||||||||||||||||||||||||||||||||||||||||||||||||||||||||||||||||||||||||||||||||||||||||||||||||||||||||||||||||||||||||||||
| Averages - All Conversions: |
|
$ | 3,823 | 10.44 | % | 2.42 | % | 139 | % | $ | 463.7 | 78 | % | 120 | % | 7.2 | % | N.A. | N.A. | 6.0 | % | 3.0 | % | 7.5 | % | 6.2 | % | 0.00 | % | 65.1 | % | 23.6x | 9.8 | % | 0.4 | % | 15.5 | % | 2.8 | % | $ | 10.00 | $ | 10.76 | 7.6 | % | $ | 10.70 | 7.0 | % | $ | 11.03 | 10.3 | % | $ | 11.67 | 16.7 | % | ||||||||||||||||||||||||||||||||||||||||||||||||||||||||||||||||||||||
| Medians - All Conversions: |
|
$ | 628 | 10.52 | % | 4.02 | % | 154 | % | $ | 25.9 | 80 | % | 125 | % | 6.5 | % | N.A. | N.A. | 8.0 | % | 4.0 | % | 10.0 | % | 3.3 | % | 0.00 | % | 63.4 | % | 20.2x | 9.8 | % | 0.4 | % | 14.8 | % | 3.0 | % | $ | 10.00 | $ | 10.45 | 4.5 | % | $ | 10.38 | 3.8 | % | $ | 10.38 | 3.8 | % | $ | 10.38 | 3.8 | % | ||||||||||||||||||||||||||||||||||||||||||||||||||||||||||||||||||||||
|
|
|
|
|
|
|
|
|
|
|
|
|
|
|
|
|
|
|
|
|
|
|
|
|
|
|
|
|
|
|
|
|
|
|
|
|
|
|
|
|
|
|
|
|
|
|
|
|
|
|
|
|
|
|
|
|
|
|
|
|
|
|
|
|
|
||||||||||||||||||||||||||||||||||||||||||||||||||||||||||||||||
| Note: * - Appraisal performed by RP Financial; BOLD = RP Financial assisted in the business plan preparation, “NT” - Not Traded; “NA” - Not Applicable, Not Available; C/S-Cash/Stock. | ||||
| (1) As a percent of MHC offering for MHC transactions. | (5) Mutual holding company pro forma data on full conversion basis. | |||
| (2) Does not take into account the adoption of SOP 93-6. | (6) Simultaneously completed acquisition of another financial institution. | |||
| (3) Latest price if offering is less than one week old. | (7) Simultaneously converted to a commercial bank charter. | |||
| (4) Latest price if offering is more than one week but less than one month old. | (8) Former credit union. | 2/5/2021 | ||
| RP® Financial, LC. | VALUATION ANALYSIS | |
| IV.16 |
| C. | The Acquisition Market |
Also considered in the valuation was the potential impact on Magyar Bancorp’s stock price of recently completed and pending acquisitions of other thrift and bank institutions operating in New Jersey. As shown in Exhibit IV-4, there were 22 acquisitions of New Jersey based bank and savings institutions completed from the beginning of 2017 through February 5, 2021 and there is currently one acquisition pending for a New Jersey based bank or savings institution. The recent acquisition activity involving New Jersey bank and savings institutions may imply a certain degree of acquisition speculation for the Company’s stock. To the extent that acquisition speculation may impact the Company’s offering, we have largely taken this into account in selecting companies for the Peer Group that could be subject to the same type of acquisition speculation that may influence Magyar Bancorp’s stock. However, since converting thrifts are subject to a three-year regulatory moratorium from being acquired, acquisition speculation in Magyar Bancorp’s stock would tend to be less compared to the stocks of the Peer Group companies.
| D. | Trading in MGYR’s Stock |
Since MGYR’s minority stock currently trades under the symbol “MGYR” on the NASDAQ Global Market, RP Financial also considered the recent trading activity in the valuation analysis. MGYR had a total of 5,810,746 shares issued and outstanding at December 31, 2020, of which 2,610,296 shares were held by public shareholders and traded as public securities. The Company’s stock has had a 52 week trading range of $7.60 to $12.60 per share and its closing price on February 5, 2020 was $10.61 per share. There are significant differences between the Company’s minority stock (currently being traded) and the conversion stock that will be issued by the Company. Such differences include different liquidity characteristics, a different return on equity for the conversion stock and the stock is currently traded based on its MHC ownership structure. Since the pro forma impact has not been publicly disseminated to date, it is appropriate to discount the current trading level. As the pro forma impact is made known publicly, the trading level will become more informative.
* * * * * * * * * * *
In determining our valuation adjustment for marketing of the issue, we considered trends in both the overall thrift market, the new issue market including the new issue market for second-step conversions, the acquisition market and recent trading activity in the Company’s minority stock. Taking these factors and trends into account, RP Financial concluded that no adjustment was appropriate in the valuation analysis for purposes of marketing of the issue.
| RP® Financial, LC. | VALUATION ANALYSIS | |
| IV.17 |
| 8. | Management |
The Company’s management team appears to have experience and expertise in all of the key areas of the Company’s operations. Exhibit IV-5 provides summary resumes of the Company’s Board of Directors and senior management. The financial characteristics of the Company suggest that the Board and senior management have been effective in implementing an operating strategy that can be well managed by the Company’s present organizational structure. The Company currently does not have any senior management positions that are vacant.
Similarly, the returns, equity positions and other operating measures of the Peer Group companies are indicative of well-managed financial institutions, which have Boards and management teams that have been effective in implementing competitive operating strategies. Therefore, on balance, we concluded no valuation adjustment relative to the Peer Group was appropriate for this factor.
| 9. | Effect of Government Regulation and Regulatory Reform |
As a fully-converted regulated institution, Magyar Bancorp will operate in substantially the same regulatory environment as the Peer Group members — all of whom are adequately capitalized institutions and are operating with no apparent restrictions. Exhibit IV-6 reflects the Bank’s pro forma regulatory capital ratios. On balance, no adjustment has been applied for the effect of government regulation and regulatory reform.
Summary of Adjustments
Overall, based on the factors discussed above, we concluded that the Company’s pro forma market value should reflect the following valuation adjustments relative to the Peer Group:
| RP® Financial, LC. | VALUATION ANALYSIS | |
| IV.18 |
| Key Valuation Parameters: |
Valuation Adjustment | |
| Financial Condition | Moderate Downward | |
| Profitability, Growth and Viability of Earnings | Slight Downward | |
| Asset Growth | No Adjustment | |
| Primary Market Area | No Adjustment | |
| Dividends | No Adjustment | |
| Liquidity of the Shares | Slight Downward | |
| Marketing of the Issue | No Adjustment | |
| Management | No Adjustment | |
| Effect of Govt. Regulations and Regulatory Reform | No Adjustment | |
Valuation Approaches
In applying the accepted valuation methodology promulgated by the FRB, i.e., the pro forma market value approach, we considered the three key pricing ratios in valuing the Company’s to-be-issued stock — price/earnings (“P/E”), price/book (“P/B”), and price/assets (“P/A”) approaches — all performed on a pro forma basis including the effects of the stock proceeds. In computing the pro forma impact of the conversion and the related pricing ratios, we have incorporated the valuation parameters disclosed in the Company’s prospectus for reinvestment rate, effective tax rate, stock benefit plan assumptions and expenses (summarized in Exhibits IV-7 and IV-8). In our estimate of value, we assessed the relationship of the pro forma pricing ratios relative to the Peer Group and recent conversion offerings.
RP Financial’s valuation placed an emphasis on the following:
| • | P/E Approach. The P/E approach is generally the best indicator of long-term value for a stock and we have given it significant weight among the valuation approaches. Given certain similarities between the Company’s and the Peer Group’s earnings composition and overall financial condition, the P/E approach was carefully considered in this valuation. At the same time, recognizing that (1) the earnings multiples will be evaluated on a pro forma basis for the Company; and (2) the Peer Group companies have had the opportunity to realize the benefit of reinvesting and leveraging their offering proceeds, we also gave weight to the other valuation approaches. |
| • | P/B Approach. P/B ratios have generally served as a useful benchmark in the valuation of thrift stocks, particularly in the context of a public offering, as the earnings approach involves assumptions regarding the use of proceeds. RP Financial considered the P/B approach to be a valuable indicator of pro forma value, taking into account the pricing ratios under the P/E and P/A approaches. We have also modified the P/B approach to exclude the impact of intangible assets (i.e., price/tangible book value or “P/TB”), in that the investment community frequently makes this adjustment in its evaluation of this pricing approach. |
| • | P/A Approach. P/A ratios are generally a less reliable indicator of market value, as investors typically assign less weight to assets and attribute greater weight to book value and earnings. Furthermore, this approach as set forth in the regulatory valuation |
| RP® Financial, LC. | VALUATION ANALYSIS | |
| IV.19 |
| guidelines does not take into account the amount of stock purchases funded by deposit withdrawals, thus understating the pro forma P/A ratio. At the same time, the P/A ratio is an indicator of franchise value, and, in the case of highly capitalized institutions, high P/A ratios may limit the investment community’s willingness to pay market multiples for earnings or book value when ROE is expected to be low. |
| • | Trading of MGYR stock. Converting institutions generally do not have stock outstanding. MGYR, however, has public shares outstanding due to the mutual holding company form of ownership and first-step minority stock offering. Since MGYR’s stock is currently quoted on the NASDAQ Global Market, it is an indicator of the Company’s current market value and therefore received some weight in our valuation. Based on the February 5, 2021 closing stock price of $10.61 per share and the 5,810,746 shares of MGYR common stock outstanding, the Company’s implied market value of $61.7 million was considered in the valuation process. However, since the Company’s stock is not actively traded, the conversion stock will have different characteristics than the minority shares, and the pro forma information has not been publicly disseminated to date, the current trading price of MGYR’s stock was somewhat discounted herein but will become more important towards the closing of the offering. |
The Company has adopted “Employers’ Accounting for Employee Stock Ownership Plans” (“ASC 718-40”), which causes earnings per share computations to be based on shares issued and outstanding excluding unreleased ESOP shares. For purposes of preparing the pro forma pricing analyses, we have reflected all shares issued in the offering, including all ESOP shares, to capture the full dilutive impact, particularly since the ESOP shares are economically dilutive, receive dividends and can be voted. However, we did consider the impact of ASC 718-40 in the valuation.
In preparing the pro forma pricing analysis we have taken into account the pro forma impact of the MHC’s net assets (i.e., unconsolidated equity) that will be consolidated with the Company and, thus, will increase equity. At December 31, 2020, the MHC had net assets of $10,000, which has been added to the Company’s December 31, 2020 pro forma equity to reflect the consolidation of the MHC into the Company’s operations. Exhibit IV-9 shows that after accounting for the impact of the MHC’s net assets, the public shareholders’ ownership interest was reduced by approximately 0.08%. Accordingly, for purposes of the Company’s pro forma valuation, the public shareholders’ ownership interest was reduced from 44.9219% to 44.9146% and the MHC’s ownership interest was increased from 55.0781% to 55.0854%.
Based on the application of the three valuation approaches, taking into consideration the valuation adjustments discussed above, RP Financial concluded that as of February 5, 2021, the aggregate pro forma market value of Magyar Bancorp’s conversion stock equaled $61,722,340
| RP® Financial, LC. | VALUATION ANALYSIS | |
| IV.20 |
at the midpoint, equal to 6,172,234 shares at $10.00 per share. The $10.00 per share price was determined by the Boards of Directors of MGYR and the MHC. The midpoint and resulting valuation range is based on the sale of an 55.09% ownership interest to the public, which provides for a $34,000,000 public offering at the midpoint value.
1. Price-to-Earnings (“P/E”). The application of the P/E valuation method requires calculating the Company’s pro forma market value by applying a valuation P/E multiple to the pro forma earnings base. In applying this technique, we considered both reported earnings and a recurring earnings base, that is, earnings adjusted to exclude any one-time non-operating items, plus the estimated after-tax earnings benefit of the reinvestment of the net proceeds. The Company’s reported earnings equaled $2.974 million for the 12 months ended December 31, 2020. In deriving Magyar Bancorp’s core earnings, the adjustments we made to reported earnings included eliminating gain on equity securities. On a tax effected basis, assuming an effective marginal tax rate of 29.5% for the earnings adjustments, the Company’s core earnings were determined to equal $2.875 million for the 12 months ended December 31, 2020.
Based on the Company’s reported earnings and incorporating the impact of the pro forma assumptions discussed previously, the Company’s pro forma reported and core P/E multiples at the $61.7 million midpoint value equaled 23.83x and 24.77x, respectively, indicating premiums of 86.46% and 88.65% relative to the Peer Group’s average reported and core earnings multiples of 12.78x and 13.13x, respectively (see Table 4.3). In comparison to the Peer Group’s median reported and core earnings multiples of 11.32x and 10.71x, respectively, the Company’s pro forma reported and core P/E multiples at the midpoint value indicated premiums of 110.51% and 131.28%, respectively. The Company’s pro forma P/E ratios based on reported earnings at the minimum and the maximum equaled 19.82x and 28.02x, respectively, and based on core earnings at the minimum and the maximum equaled 20.59x and 29.16x, respectively.
2. Price-to-Book (“P/B”). The application of the P/B valuation method requires calculating the Company’s pro forma market value by applying a valuation P/B ratio, as derived from the Peer Group’s P/B ratio, to the Company’s pro forma book value. Based on the $61.7 million midpoint valuation, the Company’s pro forma P/B and P/TB ratios equaled 71.23%. In comparison to the average P/B and P/TB ratios for the Peer Group of 90.10% and 93.40%, respectively, the Company’s ratios reflected discounts of 20.94% on a P/B basis and 23.74% on a P/TB basis. In comparison to the Peer Group’s median P/B and P/TB ratios of 89.45% and
| RP® Financial, LC. | VALUATION ANALYSIS | |
| IV.21 |
Table 4.3
Market Pricing Versus Peer Group
Magyar Bancorp, Inc.
As of February 5, 2021
| Market | Per Share Data | |||||||||||||||||||||||||||||||||||||||||||||||||||||||||||||||||||||||||||||||||||||||||||
| Capitalization | Core 12 Month EPS(1) |
Book Value/ Share |
Dividends(3) | Financial Characteristics(5) | Exchange Ratio |
Offering Size |
||||||||||||||||||||||||||||||||||||||||||||||||||||||||||||||||||||||||||||||||||||||
| Price/ Share |
Market Value |
Pricing Ratios(2) | Amount/ Share |
Yield | Payout Ratio(4) |
Total Assets |
Equity/ Assets |
Tang. Eq./ T. Assets |
NPAs/ Assets |
Reported | Core | |||||||||||||||||||||||||||||||||||||||||||||||||||||||||||||||||||||||||||||||||
| P/E | P/B | P/A | P/TB | P/Core | ROAA | ROAE | ROAA | ROAE | (x) | ($Mil) | ||||||||||||||||||||||||||||||||||||||||||||||||||||||||||||||||||||||||||||||||||
| ($) | ($Mil) | ($) | ($) | (x) | (%) | (%) | (%) | ($) | (%) | (%) | ($Mil) | (%) | (%) | (%) | (%) | (%) | (%) | (%) | ||||||||||||||||||||||||||||||||||||||||||||||||||||||||||||||||||||||||||
| Magyar Bancorp, Inc. |
||||||||||||||||||||||||||||||||||||||||||||||||||||||||||||||||||||||||||||||||||||||||||||
| Maximum |
$ | 10.00 | $ | 70.99 | $ | 0.34 | $ | 12.83 | 28.02x | 77.94 | % | 9.16 | % | 77.94 | % | 29.16x | $ | 0.00 | 0.00 | % | 0.00 | % | $ | 775 | 11.76 | % | 11.76 | % | 1.56 | % | 0.33 | % | 2.78 | % | 0.31 | % | 2.67 | % | 1.2213x | $ | 39.10 | |||||||||||||||||||||||||||||||||||||||||||||||||||
| Midpoint |
$ | 10.00 | $ | 61.73 | $ | 0.40 | $ | 14.04 | 23.83x | 71.23 | % | 8.01 | % | 71.23 | % | 24.77x | $ | 0.00 | 0.00 | % | 0.00 | % | $ | 770 | 11.25 | % | 11.25 | % | 1.57 | % | 0.34 | % | 2.99 | % | 0.32 | % | 2.88 | % | 1.0620x | $ | 34.00 | |||||||||||||||||||||||||||||||||||||||||||||||||||
| Minimum |
$ | 10.00 | $ | 52.47 | $ | 0.49 | $ | 15.66 | 19.82x | 63.86 | % | 6.85 | % | 63.86 | % | 20.59x | $ | 0.00 | 0.00 | % | 0.00 | % | $ | 766 | 10.73 | % | 10.73 | % | 1.58 | % | 0.35 | % | 3.22 | % | 0.33 | % | 3.10 | % | 0.9027x | $ | 28.90 | |||||||||||||||||||||||||||||||||||||||||||||||||||
| All Non-MHC Public Thrifts(6) |
||||||||||||||||||||||||||||||||||||||||||||||||||||||||||||||||||||||||||||||||||||||||||||
| Averages |
$ | 23.33 | $ | 601.07 | $ | 1.85 | $ | 19.90 | 13.96 | 103.63 | % | 12.92 | % | 114.74 | % | 13.98 | $ | 0.43 | 2.36 | % | 47.00 | % | $ | 5,167 | 12.62 | % | 11.78 | % | 0.69 | % | 0.84 | % | 6.91 | % | 0.87 | % | 7.23 | % | ||||||||||||||||||||||||||||||||||||||||||||||||||||||
| Median |
$ | 15.28 | $ | 192.19 | $ | 0.87 | $ | 15.86 | 12.66 | 94.14 | % | 11.60 | % | 100.75 | % | 13.14 | $ | 0.32 | 2.21 | % | 35.59 | % | $ | 1,791 | 11.51 | % | 10.33 | % | 0.55 | % | 0.76 | % | 5.88 | % | 0.78 | % | 6.15 | % | ||||||||||||||||||||||||||||||||||||||||||||||||||||||
| All Non-MHC State of NJ(6) |
||||||||||||||||||||||||||||||||||||||||||||||||||||||||||||||||||||||||||||||||||||||||||||
| Averages |
$ | 14.29 | $ | 1,019.56 | $ | 0.89 | $ | 15.74 | 16.17 | 88.45 | % | 12.09 | % | 109.88 | % | 15.04 | $ | 0.56 | 3.73 | % | 58.85 | % | $ | 8,590 | 13.79 | % | 11.66 | % | 0.61 | % | 0.70 | % | 4.86 | % | 0.76 | % | 5.27 | % | ||||||||||||||||||||||||||||||||||||||||||||||||||||||
| Medians |
$ | 13.22 | $ | 922.29 | $ | 0.78 | $ | 14.26 | 17.39 | 90.99 | % | 12.33 | % | 104.93 | % | 15.30 | $ | 0.44 | 3.33 | % | 57.89 | % | $ | 7,310 | 13.55 | % | 12.81 | % | 0.71 | % | 0.67 | % | 4.78 | % | 0.73 | % | 5.26 | % | ||||||||||||||||||||||||||||||||||||||||||||||||||||||
| Comparable Group |
||||||||||||||||||||||||||||||||||||||||||||||||||||||||||||||||||||||||||||||||||||||||||||
| Averages |
$ | 15.25 | $ | 115.59 | $ | 1.30 | $ | 16.83 | 12.78x | 90.10 | % | 10.61 | % | 93.40 | % | 13.13x | $ | 0.21 | 1.55 | % | 24.70 | % | $ | 1,087 | 11.56 | % | 11.22 | % | 0.94 | % | 0.91 | % | 7.85 | % | 0.90 | % | 7.67 | % | ||||||||||||||||||||||||||||||||||||||||||||||||||||||
| Medians |
$ | 15.67 | $ | 100.73 | $ | 1.21 | $ | 16.88 | 11.32x | 89.45 | % | 9.64 | % | 92.99 | % | 10.71x | $ | 0.16 | 1.24 | % | 21.90 | % | $ | 919 | 11.38 | % | 11.30 | % | 0.96 | % | 0.76 | % | 6.65 | % | 0.70 | % | 5.82 | % | ||||||||||||||||||||||||||||||||||||||||||||||||||||||
| Comparable Group |
||||||||||||||||||||||||||||||||||||||||||||||||||||||||||||||||||||||||||||||||||||||||||||
| ESBK |
Elmira Savings Bank | NY | $ | 12.24 | $ | 43.12 | $ | 1.09 | $ | 17.01 | 10.29x | 71.03 | % | 6.69 | % | 89.11 | % | 10.30x | $ | 0.60 | 4.90 | % | 57.14 | % | $ | 674 | 8.90 | % | 7.20 | % | 0.84 | % | 0.60 | % | 6.42 | % | 0.60 | % | 6.44 | % | ||||||||||||||||||||||||||||||||||||||||||||||||||||
| ESSA |
ESSA Bancorp, Inc. | PA | $ | 15.59 | $ | 157.22 | $ | 1.38 | $ | 17.60 | 10.68x | 86.89 | % | 9.03 | % | 93.91 | % | 10.71x | $ | 0.44 | 2.82 | % | 30.14 | % | $ | 1,894 | 10.11 | % | 9.41 | % | 1.09 | % | 0.76 | % | 7.43 | % | 0.75 | % | 7.37 | % | ||||||||||||||||||||||||||||||||||||||||||||||||||||
| HMNF |
HMN Financial, Inc. | MN | $ | 19.00 | $ | 90.61 | $ | 1.84 | $ | 20.91 | 8.56x | 87.76 | % | 9.96 | % | 88.50 | % | NM | $ | 0.00 | 0.00 | % | 0.00 | % | $ | 898 | 11.26 | % | 11.17 | % | 0.38 | % | 1.03 | % | 8.83 | % | 1.04 | % | 8.95 | % | ||||||||||||||||||||||||||||||||||||||||||||||||||||
| HVBC |
HV Bancorp, Inc. | PA | $ | 16.81 | $ | 33.81 | $ | 1.87 | $ | 16.75 | 8.76x | 100.35 | % | 7.36 | % | 100.35 | % | 9.01x | $ | 0.00 | 0.00 | % | 0.00 | % | $ | 508 | 7.33 | % | 7.33 | % | 0.49 | % | 1.02 | % | 11.87 | % | 0.99 | % | 11.54 | % | ||||||||||||||||||||||||||||||||||||||||||||||||||||
| IROQ |
IF Bancorp, Inc. | IL | $ | 20.50 | $ | 66.43 | $ | 1.34 | $ | 25.78 | 12.58x | 78.23 | % | 9.31 | % | 78.23 | % | NM | $ | 0.30 | 1.46 | % | 18.40 | % | $ | 726 | 11.51 | % | 11.51 | % | 0.24 | % | 0.64 | % | 5.57 | % | 0.59 | % | 5.10 | % | ||||||||||||||||||||||||||||||||||||||||||||||||||||
| PCSB |
PCSB Financial Corporation | NY | $ | 15.75 | $ | 241.41 | $ | 0.59 | $ | 16.45 | 25.00x | 94.14 | % | 14.17 | % | 96.39 | % | 24.90x | $ | 0.16 | 1.02 | % | 25.40 | % | $ | 1,791 | 15.28 | % | 14.98 | % | 0.33 | % | 0.54 | % | 3.34 | % | 0.54 | % | 3.36 | % | ||||||||||||||||||||||||||||||||||||||||||||||||||||
| PVBC |
Provident Bancorp, Inc. | MA | $ | 12.10 | $ | 219.00 | $ | 0.66 | $ | 12.30 | 18.33x | 97.72 | % | 15.31 | % | 97.72 | % | 16.00x | $ | 0.12 | 0.99 | % | 18.18 | % | $ | 1,498 | 15.98 | % | 15.98 | % | 1.81 | % | 0.81 | % | 4.57 | % | 0.93 | % | 5.21 | % | ||||||||||||||||||||||||||||||||||||||||||||||||||||
| PBIP |
Prudential Bancorp, Inc. | PA | $ | 12.69 | $ | 101.48 | $ | 0.58 | $ | 15.86 | 11.97x | 77.32 | % | 8.50 | % | 81.30 | % | NM | $ | 0.28 | 2.21 | % | 66.98 | % | $ | 1,223 | 10.55 | % | 10.08 | % | 1.10 | % | 0.76 | % | 6.88 | % | 0.39 | % | 3.56 | % | ||||||||||||||||||||||||||||||||||||||||||||||||||||
| RNDB |
Randolph Bancorp, Inc. | MA | $ | 20.00 | $ | 102.86 | $ | 3.28 | $ | 17.19 | 6.60x | 116.38 | % | 15.28 | % | 116.38 | % | 6.11x | $ | 0.00 | 0.00 | % | 0.00 | % | $ | 723 | 13.13 | % | 13.13 | % | 1.57 | % | 2.30 | % | 18.55 | % | 2.49 | % | 20.05 | % | ||||||||||||||||||||||||||||||||||||||||||||||||||||
| SVBI |
Severn Bancorp, Inc. | MD | $ | 7.80 | $ | 99.98 | $ | 0.42 | $ | 8.45 | 15.00x | 91.15 | % | 10.49 | % | 92.08 | % | 14.87x | $ | 0.16 | 2.05 | % | 30.77 | % | $ | 939 | 11.53 | % | 11.43 | % | 1.57 | % | 0.63 | % | 5.06 | % | 0.64 | % | 5.11 | % | ||||||||||||||||||||||||||||||||||||||||||||||||||||
| (1) | Core income, on a diluted per-share basis. Core income is net income after taxes and before extraordinary items, less net income attributable to noncontrolling interest, gain on the sale of securities, amortization of intangibles, goodwill and nonrecurring items. Assumed tax rate is 35%. |
| (2) | P/E = Price to earnings; P/B = Price to book; P/A = Price to assets; P/TB = Price to tangible book value; and P/Core = Price to core earnings. P/E and P/Core =NM if the ratio is negative or above 35x. |
| (3) | Indicated 12 month dividend, based on last quarterly dividend declared. |
| (4) | Indicated 12 month dividend as a percent of trailing 12 month earnings. |
| (5) | Equity and tangible equity equal common equity and tangible common equity, respectively. ROAA (return on average assets) and ROAE (return on average equity) are indicated ratios based on trailing 12 month earnings and average equity and assets balances. |
| (6) | Excludes from averages and medians those companies the subject of actual or rumored acquisition activities or unusual operating characteristics. |
Source: S&P Global Market Intelligence and RP Financial, LC. calculations. The information provided in this report has been obtained from sources we believe are reliable, but we cannot guarantee the accuracy or completeness of such information.
Copyright (c) 2021 by RP® Financial, LC.
| RP® Financial, LC. | VALUATION ANALYSIS | |
| IV.22 |
92.99%, respectively, the Company’s pro forma P/B and P/TB ratios at the midpoint value reflected discounts of 20.37% on a P/B basis and 23.40% on a P/TB basis. At the maximum of the range, the Company’s P/B and P/TB ratios equaled 77.94%. In comparison to the Peer Group’s average P/B and P/TB ratios, the Company’s P/B and P/TB ratios at the maximum of the range reflected discounts of 14.45% and 16.55%, respectively. In comparison to the Peer Group’s median P/B and P/TB ratios, the Company’s P/B and P/TB ratio at the maximum of the range reflected discounts of 12.87% and 16.18%, respectively.
3. Price-to-Assets (“P/A”). The P/A valuation methodology determines market value by applying a valuation P/A ratio to the Company’s pro forma asset base, conservatively assuming no deposit withdrawals are made to fund stock purchases. In all likelihood there will be deposit withdrawals, which results in understating the pro forma P/A ratio which is computed herein. At the $61.7 million midpoint of the valuation range, the Company’s value equaled 8.01% of pro forma assets. Comparatively, the Peer Group companies exhibited an average P/A ratio of 10.61%, which implies a discount of 24.51% has been applied to the Company’s pro forma P/A ratio. In comparison to the Peer Group’s median P/A ratio of 9.64%, the Company’s pro forma P/A ratio at the midpoint value reflects a discount of 16.91%.
Comparison to Recent Offerings
As indicated at the beginning of this chapter, RP Financial’s analysis of recent conversion offering pricing characteristics at closing and in the aftermarket has been limited to a “technical” analysis and, thus, the pricing characteristics of recent conversion offerings cannot be a primary determinate of value. Particular focus was placed on the P/TB approach in this analysis, since the P/E multiples do not reflect the actual impact of reinvestment and the source of the stock proceeds (i.e., external funds vs. deposit withdrawals). As discussed previously, two second-step offerings were completed in January 2021. In comparison, to the 68.50% average closing pro P/TB ratio of the two second-step offerings, the Company’s pro forma P/TB ratio of 71.23% at the midpoint value reflects an implied premium of 3.99%. At the maximum of the offering range, the Company’s P/TB ratio of 77.94% reflects an implied premium of 13.78% relative to the two second-step offerings average P/TB ratio at closing.
Valuation Conclusion
Based on the foregoing, it is our opinion that, as of February 5, 2021, the estimated aggregate pro forma valuation of the shares of the Company to be issued and outstanding at the
| RP® Financial, LC. | VALUATION ANALYSIS | |
| IV.23 |
end of the conversion offering – including (1) newly-issued shares representing the MHC’s current ownership interest in the Company and (2) exchange shares issued to existing public shareholders of the Company - was $61,722,340 at the midpoint, equal to 6,172,234 shares at a per share value of $10.00. The resulting range of value and pro forma shares, all based on $10.00 per share, are shown below.
| Total Shares | Offering Shares | Exchange Shares Issued to Public Shareholders |
Exchange Ratio |
|||||||||||||
| Shares |
||||||||||||||||
| Maximum |
7,098,068 | 3,910,000 | 3,188,068 | 1.2213 | ||||||||||||
| Midpoint |
6,172,234 | 3,400,000 | 2,772,234 | 1.0620 | ||||||||||||
| Minimum |
5,246,399 | 2,890,000 | 2,356,399 | 0.9027 | ||||||||||||
| Distribution of Shares |
||||||||||||||||
| Maximum |
100.000 | % | 55.085 | % | 44.915 | % | ||||||||||
| Midpoint |
100.000 | % | 55.085 | % | 44.915 | % | ||||||||||
| Minimum |
100.000 | % | 55.085 | % | 44.915 | % | ||||||||||
| Aggregate Market Value at $10 per share |
|
|||||||||||||||
| Maximum |
$ | 70,980,680 | $ | 39,100,000 | $ | 31,880,680 | ||||||||||
| Midpoint |
$ | 61,722,340 | $ | 34,000,000 | $ | 27,722,340 | ||||||||||
| Minimum |
$ | 52,463,990 | $ | 28,900,000 | $ | 23,563,990 | ||||||||||
The pro forma valuation calculations relative to the Peer Group are shown in Table 4.3 and are detailed in Exhibit IV-7 and Exhibit IV-8.
Establishment of the Exchange Ratio
Conversion regulations provide that in a conversion of a mutual holding company, the minority shareholders are entitled to exchange the public shares for newly issued shares in the fully converted company. The Boards of Directors of the MHC and MGYR have independently determined the exchange ratio, which has been designed to preserve the current aggregate percentage ownership in the Company (adjusted for the dilution resulting from the consolidation of the MHC’s unconsolidated equity into the Company). The exchange ratio to be received by the existing minority shareholders of the Company will be determined at the end of the offering, based on the total number of shares sold in the second-step conversion offering and the final appraisal. Based on the valuation conclusion herein, the resulting offering value and the $10.00 per share offering price, the indicated exchange ratio at the midpoint is 1.0620 shares of the Company for every one public share held by public shareholders. Furthermore, based on the offering range of value, the indicated exchange ratio is 0.9027 at the minimum and 1.2213 at the
| RP® Financial, LC. | VALUATION ANALYSIS | |
| IV.24 |
maximum. RP Financial expresses no opinion on the proposed exchange of newly issued Company shares for the shares held by the public shareholders or on the proposed exchange ratio.
EXHIBITS
RP® Financial, LC.
LIST OF EXHIBITS
| Exhibit Number |
Description | |
| I-1 | Map of Branch Office Network | |
| I-2 | Audited Financial Statements | |
| I-3 | Key Operating Ratios | |
| I-4 | Investment Securities | |
| I-5 | Yields and Costs | |
| I-6 | Loan Loss Allowance Activity | |
| I-7 | Interest Rate Risk Analysis | |
| I-8 | Fixed Rate and Adjustable Rate Loans | |
| I-9 | Loan Portfolio Composition | |
| I-10 | Contractual Maturity By Loan Type | |
| I-11 | Non-Performing Assets | |
| I-12 | Deposit Composition | |
| I-13 | CDs >$100,000 in balance by Maturity | |
| I-14 | Borrowings Details | |
| II-1 | Historical Interest Rates | |
| II-2 | Market Area Demographic/Economic Information | |
| III-1 | General Characteristics of Publicly-Traded Savings Institutions | |
| III-2 | Publicly Traded MidAtlantic and New England Thrifts | |
| III-3 | Publicly Traded Midwest Thrifts | |
| III-4 | Peer Group Summary Demographic and Deposit Market Share Data | |
LIST OF EXHIBITS (continued)
| Exhibit Number |
Description | |
| IV-1 | Thrift Stock Prices: As of February 5, 2021 | |
| IV-2 | Historical Stock Price Indices | |
| IV-3 | Historical Thrift Stock Indices | |
| IV-4 | Market Area Acquisition Activity | |
| IV-5 | Director and Senior Management Summary Resumes | |
| IV-6 | Pro Forma Regulatory Capital Ratios | |
| IV-7 | Pro Forma Analysis Sheet | |
| IV-8 | Pro Forma Effect of Conversion Proceeds | |
| V-1 | Firm Qualifications Statement | |
EXHIBIT I-1
Magyar Bank
Map of Branch Office Network
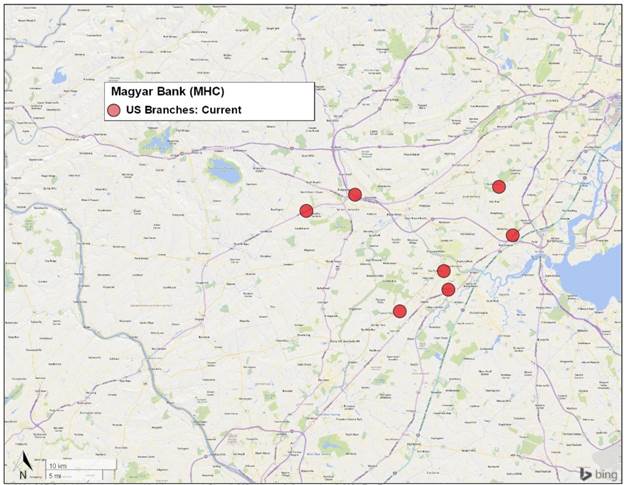
EXHIBIT I-2
Magyar Bancorp, Inc.
Audited Financial Statements
(Incorporated by Reference)
EXHIBIT I-3
Magyar Bancorp, Inc.
Key Operating Ratios
| At or For the Three Months Ended December 31, |
At or For the Years Ended September 30, | |||||||||||||||||||||||||||
| 2020 | 2019 | 2020 | 2019 | 2018 | 2017 | 2016 | ||||||||||||||||||||||
| Selected Financial Ratios and Other Data: |
||||||||||||||||||||||||||||
| Performance Ratios: (1) |
||||||||||||||||||||||||||||
| Return on average assets |
0.71 | % | 0.35 | % | 0.32 | % | 0.47 | % | 0.33 | % | 0.24 | % | 0.19 | % | ||||||||||||||
| Return on average equity |
9.19 | % | 4.01 | % | 3.85 | % | 5.47 | % | 3.95 | % | 2.90 | % | 2.28 | % | ||||||||||||||
| Interest rate spread (2) |
3.18 | % | 3.14 | % | 3.03 | % | 3.09 | % | 3.27 | % | 3.20 | % | 3.11 | % | ||||||||||||||
| Net interest margin (3) |
3.38 | % | 3.44 | % | 3.31 | % | 3.41 | % | 3.49 | % | 3.36 | % | 3.27 | % | ||||||||||||||
| Efficiency ratio (4) |
71.25 | % | 85.14 | % | 85.51 | % | 80.51 | % | 83.19 | % | 87.19 | % | 90.08 | % | ||||||||||||||
| Non-interest expense to average total assets |
2.51 | % | 2.84 | % | 2.46 | % | 2.81 | % | 2.80 | % | 2.81 | % | 2.77 | % | ||||||||||||||
| Average interest-earning assets to average interest-bearing liabilities |
136.93 | % | 127.93 | % | 132.47 | % | 128.21 | % | 126.51 | % | 123.92 | % | 122.60 | % | ||||||||||||||
| Average equity to average total assets |
7.72 | % | 8.65 | % | 8.22 | % | 8.55 | % | 8.43 | % | 8.32 | % | 8.40 | % | ||||||||||||||
| Asset Quality Ratios: |
||||||||||||||||||||||||||||
| Non-performing assets to total assets |
1.63 | % | 2.01 | % | 1.63 | % | 2.29 | % | 1.52 | % | 2.22 | % | 2.79 | % | ||||||||||||||
| Non-performing loans to total loans |
1.65 | % | 1.03 | % | 1.59 | % | 1.32 | % | 0.18 | % | 0.50 | % | 0.92 | % | ||||||||||||||
| Allowance for loan losses to non-performing loans |
71.01 | % | 93.60 | % | 65.76 | % | 70.90 | % | 463.58 | % | 147.37 | % | 72.64 | % | ||||||||||||||
| Allowance for loan losses to total loans |
1.17 | % | 0.96 | % | 1.05 | % | 0.93 | % | 0.82 | % | 0.73 | % | 0.67 | % | ||||||||||||||
| Capital Ratios: |
||||||||||||||||||||||||||||
| Common equity Tier 1 capital to risk-weighted assets |
11.85 | % | 11.79 | % | 11.84 | % | 11.84 | % | 11.44 | % | 11.80 | % | 11.82 | % | ||||||||||||||
| Total capital (to risk-weighted assets) |
13.10 | % | 12.85 | % | 13.09 | % | 12.88 | % | 12.35 | % | 12.62 | % | 12.55 | % | ||||||||||||||
| Tier 1 capital (to risk-weighted assets) |
11.85 | % | 11.79 | % | 11.84 | % | 11.84 | % | 11.44 | % | 11.80 | % | 11.82 | % | ||||||||||||||
| Tier 1 capital (to total assets) |
7.91 | % | 8.87 | % | 7.84 | % | 8.94 | % | 8.55 | % | 8.45 | % | 8.53 | % | ||||||||||||||
| Other Data: |
||||||||||||||||||||||||||||
| Number of full-service offices |
7 | 7 | 7 | 7 | 7 | 7 | 6 | |||||||||||||||||||||
| Number of full-time equivalent employees |
95.5 | 103.5 | 101.0 | 105.5 | 102.0 | 102.0 | 97.5 | |||||||||||||||||||||
| (1) | Annualized for the three-month periods ended December 31, 2020 and 2019. |
| (2) | Represents the difference between the weighted-average yield on interest-earning assets and the weighted-average cost of interest-bearing liabilities for the year. |
| (3) | The net interest margin represents net interest income as a percent of average interest-earning assets for the year. |
| (4) | The efficiency ratio represents non-interest expense divided by the sum of net interest income and non-interest income. |
Source: Magyar Bancorp’s Preliminary Offering Prospectus.
EXHIBIT I-4
Magyar Bancorp, Inc.
Investment Securities
| December 31, 2020 | ||||||||||||||||||||||||||||||||||||||||
| One Year or Less | Less Than Five Years |
More Than Five Years Through Ten Years |
More Than Ten Years |
Total Securities | ||||||||||||||||||||||||||||||||||||
| Amortized Cost |
Yield | Amortized Cost |
Yield | Amortized Cost |
Yield | Amortized Cost |
Yield | Amortized Cost |
Yield | |||||||||||||||||||||||||||||||
| (Dollars in thousands) | ||||||||||||||||||||||||||||||||||||||||
| Securities held to maturity: |
||||||||||||||||||||||||||||||||||||||||
| Obligations of U.S. government agencies: |
||||||||||||||||||||||||||||||||||||||||
| Mortgage backed securities – residential |
$ | — | — | % | $ | — | — | % | $ | — | — | % | $ | 1,172 | 3.15 | % | 1,172 | 3.15 | % | |||||||||||||||||||||
| Mortgage-backed securities – commercial |
— | — | % | — | — | % | 757 | 0.66 | % | — | — | % | 757 | 0.66 | % | |||||||||||||||||||||||||
| Obligations of U.S. government-sponsored enterprises: |
||||||||||||||||||||||||||||||||||||||||
| Mortgage-backed securities-residential |
2,840 | 1.79 | % | 4,141 | 2.35 | % | 4,040 | 2.48 | % | 9,788 | 2.51 | % | 20,809 | 2.37 | % | |||||||||||||||||||||||||
| Debt securities |
— | — | % | 6,500 | 0.52 | % | — | — | % | — | — | % | 6,500 | 0.52 | % | |||||||||||||||||||||||||
| Private label mortgage-backed securities – residential |
— | — | % | — | — | % | — | — | % | 255 | 3.85 | % | 255 | 3.85 | % | |||||||||||||||||||||||||
| Corporate securities |
— | — | % | — | % | 3,000 | 0.70 | % | — | — | % | 3,000 | 0.70 | % | ||||||||||||||||||||||||||
|
|
|
|
|
|
|
|
|
|
|
|||||||||||||||||||||||||||||||
| Total securities available for sale |
$ | 2,840 | 1.79 | % | $ | 10,641 | 1.23 | % | $ | 7,797 | 1.62 | % | $ | 11,215 | 2.60 | % | $ | 32,493 | 1.85 | % | ||||||||||||||||||||
|
|
|
|
|
|
|
|
|
|
|
|||||||||||||||||||||||||||||||
Source: Magyar Bancorp’s Preliminary Offering Prospectus.
EXHIBIT I-5
Magyar Bancorp, Inc.
Yields and Costs
| For the Three Months Ended December 31, | ||||||||||||||||||||||||
| 2020 | 2019 | |||||||||||||||||||||||
| Average Balance |
Interest Income/ Expense |
Yield/Cost (Annualized) |
Average Balance |
Interest Income/ Expense |
Yield/Cost (Annualized) |
|||||||||||||||||||
| (Dollars In Thousands) | ||||||||||||||||||||||||
| Interest-earning assets: |
||||||||||||||||||||||||
| Interest-earning deposits |
$ | 54,463 | $ | 20 | 0.14 | % | $ | 18,882 | $ | 71 | 1.50 | % | ||||||||||||
| Loans receivable, net |
606,109 | 6,751 | 4.42 | 522,545 | 6,398 | 4.86 | ||||||||||||||||||
| Securities |
||||||||||||||||||||||||
| Taxable |
47,624 | 205 | 1.71 | 47,361 | 266 | 2.23 | ||||||||||||||||||
| FHLB of NY stock |
1,981 | 25 | 5.05 | 2,143 | 37 | 6.86 | ||||||||||||||||||
|
|
|
|
|
|
|
|
|
|||||||||||||||||
| Total interest-earning assets |
710,177 | 7,001 | 3.91 | 590,931 | 6,772 | 4.55 | ||||||||||||||||||
| Noninterest-earning assets |
43,502 | 47,096 | ||||||||||||||||||||||
|
|
|
|
|
|||||||||||||||||||||
| Total assets |
$ | 753,679 | $ | 638,027 | ||||||||||||||||||||
|
|
|
|
|
|||||||||||||||||||||
| Interest-bearing liabilities: |
||||||||||||||||||||||||
| Savings accounts (1) |
$ | 75,464 | $ | 47 | 0.24 | % | $ | 70,193 | $ | 114 | 0.64 | % | ||||||||||||
| NOW accounts (2) |
256,876 | 262 | 0.40 | 234,722 | 734 | 1.24 | ||||||||||||||||||
| Time deposit (3) |
120,898 | 456 | 1.50 | 122,560 | 598 | 1.93 | ||||||||||||||||||
|
|
|
|
|
|
|
|
|
|||||||||||||||||
| Total interest-bearing deposits |
453,238 | 765 | 0.67 | 427,475 | 1,446 | 1.34 | ||||||||||||||||||
| Borrowings |
65,387 | 191 | 1.16 | 34,447 | 196 | 2.26 | ||||||||||||||||||
|
|
|
|
|
|
|
|
|
|||||||||||||||||
| Total interest-bearing liabilities |
518,625 | 956 | 0.73 | 461,922 | 1,642 | 1.41 | ||||||||||||||||||
| Noninterest-bearing liabilities |
176,867 | 120,885 | ||||||||||||||||||||||
|
|
|
|
|
|||||||||||||||||||||
| Total liabilities |
695,492 | 582,807 | ||||||||||||||||||||||
| Retained earnings |
58,187 | 55,220 | ||||||||||||||||||||||
|
|
|
|
|
|||||||||||||||||||||
| Total liabilities and retained earnings |
$ | 753,679 | $ | 638,027 | ||||||||||||||||||||
|
|
|
|
|
|||||||||||||||||||||
| Net interest and dividend income |
$ | 6,045 | $ | 5,130 | ||||||||||||||||||||
|
|
|
|
|
|||||||||||||||||||||
| Interest rate spread |
3.18 | % | 3.14 | % | ||||||||||||||||||||
|
|
|
|
|
|||||||||||||||||||||
| Net interest-earning assets |
$ | 191,552 | $ | 129,009 | ||||||||||||||||||||
|
|
|
|
|
|||||||||||||||||||||
| Net interest margin (4) |
3.38 | % | 3.44 | % | ||||||||||||||||||||
|
|
|
|
|
|||||||||||||||||||||
| Average interest-earning assets to average interest-bearing liabilities |
136.93 | % | 127.93 | % | ||||||||||||||||||||
|
|
|
|
|
|||||||||||||||||||||
| (1) | Includes passbook savings, money market passbook and club accounts. |
| (2) | Includes interest-bearing checking and money market accounts. |
| (3) | Includes certificates of deposits and individual retirement accounts. |
| (4) | Calculated as annualized net interest income divided by average total interest-earning assets. |
EXHIBIT I-5 (Continued)
Magyar Bancorp, Inc.
Yields and Costs
| For the Year Ended September 30, | ||||||||||||||||||||||||||||||||||||
| 2020 | 2019 | 2018 | ||||||||||||||||||||||||||||||||||
| Average Balance |
Interest Income/ Expense |
Yield/Cost (Annualized) |
Average Balance |
Interest Income/ Expense |
Yield/Cost (Annualized) |
Average Balance |
Interest Income/ Expense |
Yield/Cost (Annualized) |
||||||||||||||||||||||||||||
| (Dollars In Thousands) | ||||||||||||||||||||||||||||||||||||
| Interest-earning assets: |
||||||||||||||||||||||||||||||||||||
| Interest-earning deposits |
$ | 35,612 | $ | 208 | 0.58 | % | $ | 24,525 | $ | 510 | 2.08 | % | $ | 15,606 | $ | 228 | 1.46 | % | ||||||||||||||||||
| Loans receivable, net |
562,209 | 25,626 | 4.55 | 516,076 | 25,154 | 4.87 | 487,133 | 22,604 | 4.64 | |||||||||||||||||||||||||||
| Securities |
||||||||||||||||||||||||||||||||||||
| Taxable |
45,308 | 965 | 2.13 | 55,133 | 1,290 | 2.34 | 59,579 | 1,384 | 2.32 | |||||||||||||||||||||||||||
| FHLB of NY stock |
2,018 | 128 | 6.33 | 2,162 | 149 | 6.88 | 2,218 | 134 | 6.02 | |||||||||||||||||||||||||||
|
|
|
|
|
|
|
|
|
|
|
|
|
|||||||||||||||||||||||||
| Total interest-earning assets |
645,147 | 26,927 | 4.16 | 597,896 | 27,103 | 4.53 | 564,536 | 24,350 | 4.31 | |||||||||||||||||||||||||||
| Noninterest-earning assets |
46,839 | 42,566 | 45,288 | |||||||||||||||||||||||||||||||||
|
|
|
|
|
|
|
|||||||||||||||||||||||||||||||
| Total assets |
$ | 691,986 | $ | 640,462 | $ | 609,824 | ||||||||||||||||||||||||||||||
|
|
|
|
|
|
|
|||||||||||||||||||||||||||||||
| Interest-bearing liabilities: |
||||||||||||||||||||||||||||||||||||
| Savings accounts (1) |
$ | 72,290 | $ | 347 | 0.48 | % | $ | 74,497 | $ | 493 | 0.66 | % | $ | 95,892 | $ | 658 | 0.69 | % | ||||||||||||||||||
| NOW accounts (2) |
241,508 | 2,105 | 0.87 | 234,953 | 3,231 | 1.38 | 190,618 | 1,518 | 0.80 | |||||||||||||||||||||||||||
| Time deposit (3) |
127,576 | 2,318 | 1.81 | 121,706 | 2,197 | 1.81 | 123,010 | 1,720 | 1.40 | |||||||||||||||||||||||||||
|
|
|
|
|
|
|
|
|
|
|
|
|
|||||||||||||||||||||||||
| Total interest-bearing deposits |
441,374 | 4,770 | 1.08 | 431,156 | 5,921 | 1.37 | 409,520 | 3,896 | 0.95 | |||||||||||||||||||||||||||
| Borrowings |
45,647 | 743 | 1.62 | 35,175 | 789 | 2.24 | 36,710 | 753 | 2.05 | |||||||||||||||||||||||||||
|
|
|
|
|
|
|
|
|
|
|
|
|
|||||||||||||||||||||||||
| Total interest-bearing liabilities |
487,021 | 5,513 | 1.13 | 466,331 | 6,710 | 1.44 | 446,230 | 4,649 | 1.04 | |||||||||||||||||||||||||||
| Noninterest-bearing liabilities |
148,080 | 119,384 | 112,191 | |||||||||||||||||||||||||||||||||
|
|
|
|
|
|
|
|||||||||||||||||||||||||||||||
| Total liabilities |
635,101 | 585,715 | 558,421 | |||||||||||||||||||||||||||||||||
| Retained earnings |
56,885 | 54,747 | 51,403 | |||||||||||||||||||||||||||||||||
|
|
|
|
|
|
|
|||||||||||||||||||||||||||||||
| Total liabilities and retained earnings |
$ | 691,986 | $ | 640,46 | $ | 609,824 | ||||||||||||||||||||||||||||||
|
|
|
|
|
|
|
|||||||||||||||||||||||||||||||
| Net interest and dividend income |
$ | 21,414 | $ | 20,393 | $ | 19,701 | ||||||||||||||||||||||||||||||
|
|
|
|
|
|
|
|||||||||||||||||||||||||||||||
| Interest rate spread |
3.03 | % | 3.09 | % | 3.27 | % | ||||||||||||||||||||||||||||||
|
|
|
|
|
|
|
|||||||||||||||||||||||||||||||
| Net interest-earning assets |
$ | 158,126 | $ | 131,565 | $ | 118,306 | ||||||||||||||||||||||||||||||
|
|
|
|
|
|
|
|||||||||||||||||||||||||||||||
| Net interest margin (4) |
3.31 | % | 3.41 | % | 3.49 | % | ||||||||||||||||||||||||||||||
|
|
|
|
|
|
|
|||||||||||||||||||||||||||||||
| Average interest-earning assets to average interest-bearing liabilities |
132.47 | % | 128.21 | % | 126.51 | % | ||||||||||||||||||||||||||||||
|
|
|
|
|
|
|
|||||||||||||||||||||||||||||||
| (1) | Includes passbook savings, money market passbook and club accounts. |
| (2) | Includes interest-bearing checking and money market accounts. |
| (3) | Includes certificates of deposits and individual retirement accounts. |
| (4) | Calculated as annualized net interest income divided by average total interest-earning assets. |
Source: Magyar Bancorp’s Preliminary Offering Prospectus
EXHIBIT I-6
Magyar Bancorp, Inc.
Loan Loss Allowance Activity
| At or for the Quarter Ended December 31, |
At or for the Fiscal Year Ended September 30, | |||||||||||||||||||||||
| 2020 | 2020 | 2019 | 2018 | 2017 | 2016 | |||||||||||||||||||
| (Dollars in thousands) | ||||||||||||||||||||||||
| Balance at beginning of period |
$ | 6,400 | $ | 4,888 | $ | 4,200 | $ | 3,475 | $ | 3,056 | $ | 2,886 | ||||||||||||
|
|
|
|
|
|
|
|
|
|
|
|
|
|||||||||||||
| Charge-offs: |
||||||||||||||||||||||||
| One-to four-family residential |
— | — | — | 213 | 295 | 134 | ||||||||||||||||||
| Commercial real estate |
— | — | 1 | — | 23 | 61 | ||||||||||||||||||
| Construction |
— | 65 | — | — | — | — | ||||||||||||||||||
| Home equity lines of credit |
— | — | — | — | — | 98 | ||||||||||||||||||
| Commercial business |
— | 204 | 100 | 170 | 672 | 1,118 | ||||||||||||||||||
| Other |
— | — | — | 3 | — | — | ||||||||||||||||||
|
|
|
|
|
|
|
|
|
|
|
|
|
|||||||||||||
| Total charge-offs |
— | 269 | 101 | 386 | 990 | 1,411 | ||||||||||||||||||
|
|
|
|
|
|
|
|
|
|
|
|
|
|||||||||||||
| Recoveries: |
||||||||||||||||||||||||
| One-to four-family residential |
— | 9 | 120 | 87 | 35 | — | ||||||||||||||||||
| Commercial real estate |
— | 5 | — | 23 | — | 100 | ||||||||||||||||||
| Construction |
— | — | — | 3 | 12 | 7 | ||||||||||||||||||
| Home equity lines of credit |
— | 1 | 1 | 1 | 15 | 82 | ||||||||||||||||||
| Commercial business |
90 | 100 | — | — | 4 | 26 | ||||||||||||||||||
|
|
|
|
|
|
|
|
|
|
|
|
|
|||||||||||||
| Total recoveries |
90 | 115 | 121 | 114 | 66 | 215 | ||||||||||||||||||
|
|
|
|
|
|
|
|
|
|
|
|
|
|||||||||||||
| Net charge-offs |
(90 | ) | 154 | (20 | ) | 272 | 924 | 1,196 | ||||||||||||||||
| Provision for loan losses |
640 | 1,666 | 668 | 997 | 1,343 | 1,366 | ||||||||||||||||||
|
|
|
|
|
|
|
|
|
|
|
|
|
|||||||||||||
| Balance at end of period |
$ | 7,130 | $ | 6,400 | $ | 4,888 | $ | 4,200 | $ | 3,475 | $ | 3,056 | ||||||||||||
|
|
|
|
|
|
|
|
|
|
|
|
|
|||||||||||||
| Ratios: |
||||||||||||||||||||||||
| Net charge-offs to average loans outstanding |
(0.01 | )% | 0.03 | % | 0.00 | % | 0.06 | % | 0.20 | % | 0.28 | % | ||||||||||||
| Allowance for loan losses to total non-performing loans at end of period |
71.01 | % | 65.76 | % | 70.90 | % | 463.57 | % | 147.37 | % | 72.64 | % | ||||||||||||
| Allowance for loan losses to total loans at end of period |
1.17 | % | 1.05 | % | 0.93 | % | 0.82 | % | 0.73 | % | 0.67 | % | ||||||||||||
Source: Magyar Bancorp’s Preliminary Offering Prospectus.
EXHIBIT I-7
Magyar Bancorp, Inc.
Interest Rate Risk Analysis
| Change in Interest Rates (Basis Points) (1) |
Estimated NII Year 1 |
Estimated Decrease in NII Year 1 |
Estimated NII Year 2 |
Estimated Increased (Decrease) in NII Year 2 |
||||||||||||||||||||
| Amount | Percent | Amount | Percent | |||||||||||||||||||||
| (Dollars in thousands) | ||||||||||||||||||||||||
| +200 |
$ | 24,816 | $ | 120 | 0.49 | % | $ | 24,734 | $ | 208 | 0.85 | % | ||||||||||||
| Unchanged |
24,696 | — | — | 24,526 | — | — | ||||||||||||||||||
| -100 |
24,060 | (636 | ) | (2.58 | )% | 23,414 | (1,112 | ) | (4.53 | )% | ||||||||||||||
| (1) | Assumes an instantaneous uniform change in interest rates at all maturities. |
Source: Magyar Bancorp’s Preliminary Offering Prospectus.
EXHIBIT I-8
Magyar Bancorp, Inc.
Fixed Rate and Adjustable Rate Loans
| Due After September 30, 2021 | ||||||||||||
| Fixed | Adjustable | Total | ||||||||||
| (In thousands) | ||||||||||||
| Residential mortgage |
$ | 127,657 | $ | 82,469 | $ | 210,126 | ||||||
| Commercial real estate |
13,555 | 218,500 | 232,055 | |||||||||
| Construction |
162 | 1,917 | 2,079 | |||||||||
| Home equity lines of credit |
1,747 | 10,731 | 12,478 | |||||||||
| Commercial business |
63,959 | 9,785 | 73,744 | |||||||||
| Other |
70 | 4,084 | 4,154 | |||||||||
|
|
|
|
|
|
|
|||||||
| Total loans receivable |
$ | 207,150 | $ | 327,486 | $ | 534,636 | ||||||
|
|
|
|
|
|
|
|||||||
Source: Magyar Bancorp’s Preliminary Offering Prospectus.
EXHIBIT I-9
Magyar Bancorp, Inc.
Loan Portfolio Composition
| At December 31, | At September 30, | |||||||||||||||||||||||
| 2020 | 2020 | 2019 | ||||||||||||||||||||||
| Amount | Percent | Amount | Percent | Amount | Percent | |||||||||||||||||||
| (Dollars in thousands) | ||||||||||||||||||||||||
| Residential mortgage |
$ | 208,404 | 34.3 | % | $ | 210,360 | 34.4 | % | $ | 190,415 | 36.4 | % | ||||||||||||
| Commercial real estate |
260,296 | 42.9 | % | 248,134 | 40.6 | % | 232,544 | 44.5 | % | |||||||||||||||
| Construction |
23,441 | 3.9 | % | 28,242 | 4.6 | % | 28,451 | 5.4 | % | |||||||||||||||
| Home equity lines of credit |
19,837 | 3.3 | % | 19,373 | 3.2 | % | 17,832 | 3.4 | % | |||||||||||||||
| Commercial business |
91,215 | 15.0 | % | 100,993 | 16.5 | % | 48,769 | 9.3 | % | |||||||||||||||
| Other consumer |
3,837 | 0.6 | % | 4,157 | 0.7 | % | 4,990 | 1.0 | % | |||||||||||||||
|
|
|
|
|
|
|
|
|
|
|
|
|
|||||||||||||
| Total loans receivable |
$ | 607,030 | 100.0 | % | $ | 611,259 | 100.0 | % | $ | 523,001 | 100.0 | % | ||||||||||||
| Less: |
||||||||||||||||||||||||
| Deferred loan costs (fees) |
(1,370 | ) | (1,749 | ) | 104 | |||||||||||||||||||
| Allowance for loan losses |
(7,130 | ) | (6,400 | ) | (4,888 | ) | ||||||||||||||||||
|
|
|
|
|
|
|
|||||||||||||||||||
| Total loans receivable, net |
$ | 598,530 | $ | 603,110 | $ | 518,217 | ||||||||||||||||||
|
|
|
|
|
|
|
|||||||||||||||||||
| At September 30, | ||||||||||||||||||||||||
| 2018 | 2017 | 2016 | ||||||||||||||||||||||
| Amount | Percent | Amount | Percent | Amount | Percent | |||||||||||||||||||
| (Dollars in thousands) | ||||||||||||||||||||||||
| Residential mortgage |
$ | 185,287 | 36.2 | % | $ | 178,336 | 37.6 | % | $ | 173,235 | 37.8 | % | ||||||||||||
| Commercial real estate |
219,347 | 42.8 | % | 207,118 | 43.7 | % | 199,510 | 43.6 | % | |||||||||||||||
| Construction |
30,412 | 5.9 | % | 22,622 | 4.8 | % | 14,939 | 3.3 | % | |||||||||||||||
| Home equity lines of credit |
17,982 | 3.5 | % | 18,536 | 3.9 | % | 21,967 | 4.8 | % | |||||||||||||||
| Commercial business |
53,320 | 10.4 | % | 41,113 | 8.7 | % | 38,865 | 8.5 | % | |||||||||||||||
| Other |
6,150 | 1.2 | % | 6,266 | 1.3 | % | 9,355 | 2.0 | % | |||||||||||||||
|
|
|
|
|
|
|
|
|
|
|
|
|
|||||||||||||
| Total loans receivable |
$ | 512,498 | 100.0 | % | $ | 473,991 | 100.0 | % | $ | 457,871 | 100.0 | % | ||||||||||||
| Less: |
||||||||||||||||||||||||
| Deferred loan costs (fees) |
132 | 177 | 216 | |||||||||||||||||||||
| Allowance for loan losses |
(4,200 | ) | (3,475 | ) | (3,056 | ) | ||||||||||||||||||
|
|
|
|
|
|
|
|||||||||||||||||||
| Total loans receivable, net |
$ | 508,430 | $ | 470,693 | $ | 455,031 | ||||||||||||||||||
|
|
|
|
|
|
|
|||||||||||||||||||
Source: Magyar Bancorp’s Preliminary Offering Prospectus.
EXHIBIT I-10
Magyar Bancorp, Inc.
Contractual Maturity By Loan Type
| Residential mortgage |
Commercial real estate |
Construction | Home equity lines of credit |
Commercial business |
Other | Total | ||||||||||||||||||||||
| Due During the Years Ending September 30, |
||||||||||||||||||||||||||||
| 2021 |
$ | 234 | $ | 16,079 | $ | 26,163 | $ | 6,895 | $ | 27,249 | $ | 3 | $ | 76,623 | ||||||||||||||
| 2022 |
2,639 | 3,098 | 1,406 | 1,749 | 56,953 | 7 | 65,852 | |||||||||||||||||||||
| 2023 |
1,462 | 1,901 | — | — | 551 | 6 | 3,920 | |||||||||||||||||||||
| 2024 to 2025 |
2,786 | 13,973 | 162 | — | 6,639 | 27 | 23,587 | |||||||||||||||||||||
| 2026 to 2030 |
9,598 | 25,616 | — | 198 | 4,278 | 20 | 39,710 | |||||||||||||||||||||
| 2031 to 2035 |
22,620 | 27,720 | — | 1,593 | 1,242 | 14 | 53,189 | |||||||||||||||||||||
| 2036 and beyond |
171,021 | 159,747 | 511 | 8,938 | 4,081 | 4,080 | 348,378 | |||||||||||||||||||||
|
|
|
|
|
|
|
|
|
|
|
|
|
|
|
|||||||||||||||
| Total |
$ | 210,360 | $ | 248,134 | $ | 28,242 | $ | 19,373 | $ | 100,993 | $ | 4,157 | $ | 611,259 | ||||||||||||||
|
|
|
|
|
|
|
|
|
|
|
|
|
|
|
|||||||||||||||
Source: Magyar Bancorp’s Preliminary Offering Prospectus
EXHIBIT I-11
Magyar Bancorp, Inc.
Non-Performing Assets
| At December 31, 2020 |
September 30, | |||||||||||||||||||||||
| 2020 | 2019 | 2018 | 2017 | 2016 | ||||||||||||||||||||
| (Dollars in thousands) | ||||||||||||||||||||||||
| Non-accrual loans: |
||||||||||||||||||||||||
| One-to four-family residential |
$ | 944 | $ | 905 | $ | 114 | $ | 138 | $ | 1,663 | $ | 2,486 | ||||||||||||
| Commercial real estate |
3,122 | 2,219 | 2,652 | 455 | 482 | 443 | ||||||||||||||||||
| Construction |
4,580 | 5,141 | 2,900 | — | — | — | ||||||||||||||||||
| Home equity lines of credit |
— | — | — | 90 | — | 281 | ||||||||||||||||||
| Commercial business |
1,395 | 1,467 | 1,228 | 223 | 213 | 997 | ||||||||||||||||||
|
|
|
|
|
|
|
|
|
|
|
|
|
|||||||||||||
| Total non-accrual loans |
10,041 | 9,732 | 6,894 | 906 | 2,358 | 4,207 | ||||||||||||||||||
|
|
|
|
|
|
|
|
|
|
|
|
|
|||||||||||||
| Accruing loans 90 days or more past due: |
||||||||||||||||||||||||
| One-to four-family residential |
— | — | — | — | — | — | ||||||||||||||||||
| Commercial real estate |
— | — | — | — | — | — | ||||||||||||||||||
| Construction |
— | — | — | — | — | — | ||||||||||||||||||
| Home equity lines of credit |
— | — | — | — | — | — | ||||||||||||||||||
| Commercial business |
— | — | — | — | — | — | ||||||||||||||||||
|
|
|
|
|
|
|
|
|
|
|
|
|
|||||||||||||
| Other |
— | — | — | — | — | — | ||||||||||||||||||
|
|
|
|
|
|
|
|
|
|
|
|
|
|||||||||||||
| Total loans 90 days or more past due |
— | — | — | — | — | — | ||||||||||||||||||
|
|
|
|
|
|
|
|
|
|
|
|
|
|||||||||||||
| Total non-performing loans |
10,041 | 9,732 | 6,894 | 906 | 2,358 | 4,207 | ||||||||||||||||||
| Other real estate owned |
2,072 | 2,594 | 7,528 | 8,586 | 11,056 | 12,082 | ||||||||||||||||||
|
|
|
|
|
|
|
|
|
|
|
|
|
|||||||||||||
| Total non-performing assets |
12,113 | 12,326 | 14,422 | 9,492 | 13,414 | 16,289 | ||||||||||||||||||
| Performing troubled debt restructurings |
218 | 220 | 363 | — | 182 | — | ||||||||||||||||||
|
|
|
|
|
|
|
|
|
|
|
|
|
|||||||||||||
| Performing troubled debt restructurings and total non-performing assets |
$ | 12,331 | $ | 12,546 | $ | 14,785 | $ | 9,492 | $ | 13,596 | $ | 16,289 | ||||||||||||
|
|
|
|
|
|
|
|
|
|
|
|
|
|||||||||||||
| Ratios: |
||||||||||||||||||||||||
| Total non-performing loans to total loans |
1.65 | % | 1.59 | % | 1.32 | % | 0.18 | % | 0.50 | % | 0.92 | % | ||||||||||||
| Total non-performing loans and performing troubled debt restructurings to total loans |
1.69 | % | 1.63 | % | 1.39 | % | 0.18 | % | 0.54 | % | 0.92 | % | ||||||||||||
| Total non-performing assets to total assets |
1.63 | % | 1.63 | % | 2.29 | % | 1.52 | % | 2.22 | % | 2.79 | % | ||||||||||||
| Total non-performing assets and performing troubled debt restructurings to total assets |
1.66 | % | 1.66 | % | 2.35 | % | 1.52 | % | 2.25 | % | 2.79 | % | ||||||||||||
Source: Magyar Bancorp’s Preliminary Offering Prospectus
EXHIBIT I-12
Magyar Bancorp, Inc.
Deposit Composition
| December 31, | September 30, | |||||||||||||||||||||||
| 2020 | 2020 | |||||||||||||||||||||||
| Deposit Type |
Balance | Percent | Weighted Average Rate |
Balance | Percent | Weighted Average Rate |
||||||||||||||||||
| (Dollars in thousands) | ||||||||||||||||||||||||
| Demand accounts |
$ | 160,190 | 26.2 | % | 0.00 | % | $ | 163,562 | 26.5 | % | 0.00 | % | ||||||||||||
| Savings accounts |
75,923 | 12.4 | % | 0.21 | % | 74,923 | 12.1 | % | 0.26 | % | ||||||||||||||
| NOW accounts |
76,986 | 12.6 | % | 0.30 | % | 65,447 | 10.6 | % | 0.32 | % | ||||||||||||||
| Money market accounts |
180,182 | 29.4 | % | 0.35 | % | 188,023 | 30.4 | % | 0.47 | % | ||||||||||||||
| Certificates of deposit |
103,443 | 16.9 | % | 1.28 | % | 110,650 | 17.9 | % | 1.49 | % | ||||||||||||||
| Retirement accounts |
15,340 | 2.5 | % | 1.44 | % | 15,725 | 2.5 | % | 1.51 | % | ||||||||||||||
|
|
|
|
|
|
|
|
|
|
|
|
|
|||||||||||||
| Total deposits |
$ | 612,064 | 100.0 | % | 0.42 | % | $ | 618,330 | 100.00 | % | 0.51 | % | ||||||||||||
|
|
|
|
|
|
|
|
|
|
|
|
|
|||||||||||||
| September 30, | ||||||||||||||||||||||||
| 2019 | 2018 | |||||||||||||||||||||||
| Deposit Type |
Balance | Percent | Weighted Average Rate |
Balance | Percent | Weighted Average Rate |
||||||||||||||||||
| (Dollars in thousands) | ||||||||||||||||||||||||
| Demand accounts |
$ | 106,422 | 20.1 | % | 0.00 | % | $ | 104,745 | 19.8 | % | 0.00 | % | ||||||||||||
| Savings accounts |
70,598 | 13.3 | % | 0.67 | % | 81,373 | 15.4 | % | 0.65 | % | ||||||||||||||
| NOW accounts |
48,164 | 9.1 | % | 0.59 | % | 46,336 | 8.7 | % | 0.32 | % | ||||||||||||||
| Money market accounts |
188,115 | 35.5 | % | 1.35 | % | 167,340 | 31.6 | % | 1.27 | % | ||||||||||||||
| Certificates of deposit |
100,016 | 18.9 | % | 1.97 | % | 112,014 | 21.1 | % | 1.66 | % | ||||||||||||||
| Retirement accounts |
16,760 | 3.2 | % | 1.62 | % | 18,329 | 3.5 | % | 1.41 | % | ||||||||||||||
|
|
|
|
|
|
|
|
|
|
|
|
|
|||||||||||||
| Total deposits |
$ | 530,075 | 100.00 | % | 1.04 | % | $ | 530,137 | 100.00 | % | 0.93 | % | ||||||||||||
|
|
|
|
|
|
|
|
|
|
|
|
|
|||||||||||||
Source: Magyar Bancorp’s Preliminary Offering Prospectus
EXHIBIT I-13
Magyar Bancorp, Inc.
CDs >$100,000 in Balance by Maturity
As of December 31, 2020
| Three months or less |
$ | 7,144 | ||
| Over three months through six months |
19,067 | |||
| Over six months through one year |
30,255 | |||
| Over one year to three years |
25,545 | |||
| Over three years |
1,323 | |||
|
|
|
|||
| Total |
$ | 83,334 | ||
|
|
|
|||
Source: Magyar Bancorp’s Preliminary Offering Prospectus
EXHIBIT I-14
Magyar Bancorp, Inc.
Borrowings Detail
Borrowings were $60.3 million at December 31, 2020. Borrowings increased $31.2 million, or 86.3%, to $67.4 million at September 30, 2020 from $36.2 million at September 30, 2019. Magyar Bank borrowed $36.9 million in PPPLF advances from the Federal Reserve Bank during the year ended September 30, 2020 to offset the liquidity and capital impacts of the PPP loans. FHLBNY advances decreased $5.7 million to $30.5 million at September 30, 2020 from $36.2 million at September 30, 2019 as deposit inflows were used to repay maturing long-term advances. During the quarter ended December 31, 2020, PPPLF advances decreased $7.1 million to $29.8 million and FHLBNY advances were unchanged at $30.5 million.
These aggregate borrowings represent 8.8% of total liabilities and had a weighted average rate of 1.23% at December 31, 2020. Based on eligible collateral pledged to the FHLBNY at December 30, 2021, we had an aggregate borrowing capacity of $142.0 million with the FHLBNY.
Source: Magyar Bancorp’s Preliminary Offering Prospectus
EXHIBIT II-1
Magyar Bancorp, Inc.
Historical Interest Rates
Exhibit II-1
Historical Interest Rates(1)
| Year/Qtr. Ended |
Prime Rate |
90 Day T-Note |
One Year T-Note |
10 Year T-Note |
||||||||||||||
| 2013: |
Quarter 1 | 3.25 | % | 0.07 | % | 0.14 | % | 1.87 | % | |||||||||
| Quarter 2 | 3.25 | % | 0.04 | % | 0.15 | % | 2.52 | % | ||||||||||
| Quarter 3 | 3.25 | % | 0.02 | % | 0.10 | % | 2.64 | % | ||||||||||
| Quarter 4 | 3.25 | % | 0.07 | % | 0.13 | % | 3.04 | % | ||||||||||
| 2014: |
Quarter 1 | 3.25 | % | 0.05 | % | 0.13 | % | 2.73 | % | |||||||||
| Quarter 2 | 3.25 | % | 0.04 | % | 0.11 | % | 2.53 | % | ||||||||||
| Quarter 3 | 3.25 | % | 0.02 | % | 0.13 | % | 2.52 | % | ||||||||||
| Quarter 4 | 3.25 | % | 0.04 | % | 0.25 | % | 2.17 | % | ||||||||||
| 2015: |
Quarter 1 | 3.25 | % | 0.03 | % | 0.26 | % | 1.94 | % | |||||||||
| Quarter 2 | 3.25 | % | 0.01 | % | 0.28 | % | 2.35 | % | ||||||||||
| Quarter 3 | 3.25 | % | 0.00 | % | 0.33 | % | 2.06 | % | ||||||||||
| Quarter 4 | 3.50 | % | 0.16 | % | 0.65 | % | 2.27 | % | ||||||||||
| 2016: |
Quarter 1 | 3.50 | % | 0.21 | % | 0.59 | % | 1.78 | % | |||||||||
| Quarter 2 | 3.50 | % | 0.26 | % | 0.45 | % | 1.49 | % | ||||||||||
| Quarter 3 | 3.50 | % | 0.29 | % | 0.59 | % | 1.60 | % | ||||||||||
| Quarter 4 | 3.75 | % | 0.51 | % | 0.85 | % | 2.45 | % | ||||||||||
| 2017: |
Quarter 1 | 4.00 | % | 0.76 | % | 1.03 | % | 2.40 | % | |||||||||
| Quarter 2 | 4.25 | % | 1.03 | % | 1.24 | % | 2.31 | % | ||||||||||
| Quarter 3 | 4.25 | % | 1.06 | % | 1.31 | % | 2.33 | % | ||||||||||
| Quarter 4 | 4.50 | % | 1.39 | % | 1.76 | % | 2.40 | % | ||||||||||
| 2018: |
Quarter 1 | 4.75 | % | 1.73 | % | 2.09 | % | 2.74 | % | |||||||||
| Quarter 2 | 5.00 | % | 1.93 | % | 2.33 | % | 2.85 | % | ||||||||||
| Quarter 3 | 5.25 | % | 2.19 | % | 2.59 | % | 3.05 | % | ||||||||||
| Quarter 4 | 5.50 | % | 2.45 | % | 2.63 | % | 2.69 | % | ||||||||||
| 2019: |
Quarter 1 | 5.50 | % | 2.40 | % | 2.40 | % | 2.41 | % | |||||||||
| Quarter 2 | 5.00 | % | 2.12 | % | 1.92 | % | 2.00 | % | ||||||||||
| Quarter 3 | 4.75 | % | 1.88 | % | 1.75 | % | 1.68 | % | ||||||||||
| Quarter 4 | 4.75 | % | 1.55 | % | 1.59 | % | 1.92 | % | ||||||||||
| 2020: |
Quarter 1 | 3.25 | % | 0.11 | % | 0.17 | % | 0.70 | % | |||||||||
| Quarter 2 | 3.25 | % | 0.16 | % | 0.16 | % | 0.66 | % | ||||||||||
| Quarter 3 | 3.25 | % | 0.10 | % | 0.12 | % | 0.69 | % | ||||||||||
| Quarter 4 | 3.25 | % | 0.09 | % | 0.10 | % | 0.93 | % | ||||||||||
| As of February 5, 2021 |
3.25 | % | 0.03 | % | 0.06 | % | 1.19 | % | ||||||||||
| (1) | End of period data. |
Sources: S&P Global Market Intelligence.
EXHIBIT II-2
Magyar Bancorp, Inc.
Market Area Demographic/Economic Information
Demographic Detail: US
| Base 2010 | Current 2021 | Projected 2026 | % Change 2010-2021 |
% Change 2021-2026 |
||||||||||||||||
| Total Population (actual) |
308,745,538 | 330,946,040 | 340,574,349 | 7.19 | 2.91 | |||||||||||||||
| 0-14 Age Group (%) |
19.83 | 18.32 | 17.79 | (0.96 | ) | (0.09 | ) | |||||||||||||
| 15-34 Age Group (%) |
27.43 | 26.75 | 25.94 | 4.55 | (0.21 | ) | ||||||||||||||
| 35-54 Age Group (%) |
27.88 | 25.08 | 24.83 | (3.56 | ) | 1.87 | ||||||||||||||
| 55-69 Age Group (%) |
15.84 | 18.44 | 18.83 | 24.78 | 5.06 | |||||||||||||||
| 70+ Age Group (%) |
9.01 | 11.40 | 12.61 | 35.51 | 13.86 | |||||||||||||||
| Median Age (actual) |
37.1 | 38.9 | 39.9 | 4.85 | 2.57 | |||||||||||||||
| Female Population (actual) |
156,964,212 | 167,951,895 | 172,785,657 | 7.00 | 2.88 | |||||||||||||||
| Male Population (actual) |
151,781,326 | 162,994,145 | 167,788,692 | 7.39 | 2.94 | |||||||||||||||
| Population Density (#/ sq miles) |
87.50 | 93.80 | 96.52 | 7.19 | 2.91 | |||||||||||||||
| Diversity Index (actual) |
NA | NA | NA | NA | NA | |||||||||||||||
| Black (%) |
12.61 | 12.89 | 13.05 | 9.57 | 4.16 | |||||||||||||||
| Asian (%) |
4.75 | 5.95 | 6.50 | 34.17 | 12.35 | |||||||||||||||
| White (%) |
72.41 | 69.19 | 67.69 | 2.43 | 0.67 | |||||||||||||||
| Hispanic (%) |
16.35 | 19.24 | 20.58 | 26.13 | 10.08 | |||||||||||||||
| Pacific Islander (%) |
0.17 | 0.20 | 0.21 | 23.01 | 8.92 | |||||||||||||||
| American Indian/Alaska Native (%) |
0.95 | 1.00 | 1.02 | 12.43 | 5.27 | |||||||||||||||
| Multiple races (%) |
2.92 | 3.59 | 3.90 | 32.01 | 11.79 | |||||||||||||||
| Other (%) |
6.19 | 7.18 | 7.64 | 24.37 | 9.43 | |||||||||||||||
| Total Households (actual) |
116,716,292 | 125,732,798 | 129,596,282 | 7.73 | 3.07 | |||||||||||||||
| < $25K Households (%) |
NA | 17.97 | 16.19 | NA | (7.12 | ) | ||||||||||||||
| $25-49K Households (%) |
NA | 20.27 | 18.72 | NA | (4.77 | ) | ||||||||||||||
| $50-99K Households (%) |
NA | 29.03 | 28.05 | NA | (0.39 | ) | ||||||||||||||
| $100-$199K Households (%) |
NA | 23.23 | 24.96 | NA | 10.75 | |||||||||||||||
| $200K+ Households (%) |
NA | 9.51 | 12.07 | NA | 30.86 | |||||||||||||||
| Average Household Income ($) |
NA | 96,765 | 107,191 | NA | 10.77 | |||||||||||||||
| Median Household Income ($) |
NA | 67,761 | 73,868 | NA | 9.01 | |||||||||||||||
| Per Capita Income ($) |
NA | 37,689 | 41,788 | NA | 10.88 | |||||||||||||||
| Total Owner Occupied Housing Units (actual) |
75,986,074 | 81,944,178 | 84,477,023 | 7.84 | 3.09 | |||||||||||||||
| Renter Occupied Housing Units (actual) |
40,730,218 | 43,788,620 | 45,119,259 | 7.51 | 3.04 | |||||||||||||||
| Vacant Occupied Housing Units (actual) |
14,988,438 | 16,137,322 | 16,492,842 | 7.67 | 2.20 | |||||||||||||||
Source: Claritas
Demographic data is provided by Claritas based primarily on US Census data. For non-census year data, Claritas uses samples and projections to estimate the demographic data. SNL performs calculations on the underlying data provided by Claritas for some of the data presented on this page.
% Change values are calculated using the underlying actual data.
Demographic Detail: New Jersey
| Base 2010 | Current 2021 | Projected 2026 | % Change 2010-2021 |
% Change 2021-2026 |
||||||||||||||||
| Total Population (actual) |
8,791,894 | 8,883,587 | 8,910,855 | 1.04 | 0.31 | |||||||||||||||
| 0-14 Age Group (%) |
19.26 | 17.75 | 17.17 | (6.85 | ) | (2.96 | ) | |||||||||||||
| 15-34 Age Group (%) |
25.58 | 25.30 | 24.95 | (0.07 | ) | (1.08 | ) | |||||||||||||
| 35-54 Age Group (%) |
29.77 | 25.91 | 24.74 | (12.08 | ) | (4.22 | ) | |||||||||||||
| 55-69 Age Group (%) |
15.89 | 19.41 | 20.34 | 23.41 | 5.14 | |||||||||||||||
| 70+ Age Group (%) |
9.50 | 11.63 | 12.80 | 23.78 | 10.33 | |||||||||||||||
| Median Age (actual) |
38.7 | 40.5 | 41.4 | 4.65 | 2.22 | |||||||||||||||
| Female Population (actual) |
4,512,294 | 4,542,467 | 4,551,877 | 0.67 | 0.21 | |||||||||||||||
| Male Population (actual) |
4,279,600 | 4,341,120 | 4,358,978 | 1.44 | 0.41 | |||||||||||||||
| Population Density (#/ sq miles) |
1,197.01 | 1,209.50 | 1,213.21 | 1.04 | 0.31 | |||||||||||||||
| Diversity Index (actual) |
NA | NA | NA | NA | NA | |||||||||||||||
| Black (%) |
13.70 | 13.83 | 13.88 | 1.94 | 0.70 | |||||||||||||||
| Asian (%) |
8.25 | 10.04 | 10.86 | 22.91 | 8.47 | |||||||||||||||
| White (%) |
68.58 | 64.57 | 62.73 | (4.86 | ) | (2.54 | ) | |||||||||||||
| Hispanic (%) |
17.69 | 21.93 | 23.87 | 25.26 | 9.17 | |||||||||||||||
| Pacific Islander (%) |
0.03 | 0.05 | 0.05 | 36.02 | 12.08 | |||||||||||||||
| American Indian/Alaska Native (%) |
0.33 | 0.37 | 0.39 | 13.35 | 5.30 | |||||||||||||||
| Multiple races (%) |
2.73 | 3.37 | 3.67 | 24.71 | 9.09 | |||||||||||||||
| Other (%) |
6.37 | 7.77 | 8.42 | 23.39 | 8.62 | |||||||||||||||
| Total Households (actual) |
3,214,360 | 3,254,900 | 3,267,337 | 1.26 | 0.38 | |||||||||||||||
| < $25K Households (%) |
NA | 14.08 | 12.63 | NA | (9.94 | ) | ||||||||||||||
| $25-49K Households (%) |
NA | 15.46 | 14.40 | NA | (6.52 | ) | ||||||||||||||
| $50-99K Households (%) |
NA | 25.63 | 24.10 | NA | (5.63 | ) | ||||||||||||||
| $100-$199K Households (%) |
NA | 28.16 | 28.66 | NA | 2.19 | |||||||||||||||
| $200K+ Households (%) |
NA | 16.68 | 20.22 | NA | 21.68 | |||||||||||||||
| Average Household Income ($) |
NA | 127,475 | 140,076 | NA | 9.89 | |||||||||||||||
| Median Household Income ($) |
NA | 89,080 | 97,516 | NA | 9.47 | |||||||||||||||
| Per Capita Income ($) |
NA | 47,674 | 52,411 | NA | 9.94 | |||||||||||||||
| Total Owner Occupied Housing Units (actual) |
2,102,465 | 2,114,875 | 2,118,297 | 0.59 | 0.16 | |||||||||||||||
| Renter Occupied Housing Units (actual) |
1,111,895 | 1,140,025 | 1,149,040 | 2.53 | 0.79 | |||||||||||||||
| Vacant Occupied Housing Units (actual) |
339,202 | 387,826 | 403,907 | 14.33 | 4.15 | |||||||||||||||
Source: Claritas
Demographic data is provided by Claritas based primarily on US Census data. For non-census year data, Claritas uses samples and projections to estimate the demographic data. SNL performs calculations on the underlying data provided by Claritas for some of the data presented on this page.
% Change values are calculated using the underlying actual data.
Demographic Detail: Middlesex, NJ
| Base 2010 | Current 2021 | Projected 2026 | % Change 2010-2021 |
% Change 2021-2026 |
||||||||||||||||
| Total Population (actual) |
809,858 | 824,980 | 828,442 | 1.87 | 0.42 | |||||||||||||||
| 0-14 Age Group (%) |
18.84 | 17.58 | 16.91 | (4.97 | ) | (3.37 | ) | |||||||||||||
| 15-34 Age Group (%) |
28.07 | 26.16 | 25.32 | (5.05 | ) | (2.81 | ) | |||||||||||||
| 35-54 Age Group (%) |
29.57 | 27.08 | 26.52 | (6.68 | ) | (1.67 | ) | |||||||||||||
| 55-69 Age Group (%) |
14.83 | 18.42 | 19.26 | 26.48 | 5.01 | |||||||||||||||
| 70+ Age Group (%) |
8.69 | 10.76 | 11.98 | 26.13 | 11.85 | |||||||||||||||
| Median Age (actual) |
37.1 | 39.6 | 40.8 | 6.74 | 3.03 | |||||||||||||||
| Female Population (actual) |
412,373 | 418,279 | 419,921 | 1.43 | 0.39 | |||||||||||||||
| Male Population (actual) |
397,485 | 406,701 | 408,521 | 2.32 | 0.45 | |||||||||||||||
| Population Density (#/ sq miles) |
2,623.43 | 2,672.42 | 2,683.63 | 1.87 | 0.42 | |||||||||||||||
| Diversity Index (actual) |
NA | NA | NA | NA | NA | |||||||||||||||
| Black (%) |
9.69 | 10.77 | 11.28 | 13.27 | 5.12 | |||||||||||||||
| Asian (%) |
21.40 | 25.21 | 26.98 | 19.99 | 7.48 | |||||||||||||||
| White (%) |
58.60 | 51.33 | 47.95 | (10.77 | ) | (6.19 | ) | |||||||||||||
| Hispanic (%) |
18.40 | 23.01 | 25.16 | 27.44 | 9.79 | |||||||||||||||
| Pacific Islander (%) |
0.03 | 0.04 | 0.05 | 33.86 | 11.31 | |||||||||||||||
| American Indian/Alaska Native (%) |
0.34 | 0.40 | 0.42 | 18.08 | 6.83 | |||||||||||||||
| Multiple races (%) |
2.95 | 3.61 | 3.92 | 24.69 | 8.97 | |||||||||||||||
| Other (%) |
6.99 | 8.63 | 9.40 | 25.93 | 9.34 | |||||||||||||||
| Total Households (actual) |
281,186 | 282,978 | 283,390 | 0.64 | 0.15 | |||||||||||||||
| < $25K Households (%) |
NA | 11.46 | 10.38 | NA | (9.32 | ) | ||||||||||||||
| $25-49K Households (%) |
NA | 14.47 | 13.34 | NA | (7.68 | ) | ||||||||||||||
| $50-99K Households (%) |
NA | 26.53 | 24.80 | NA | (6.41 | ) | ||||||||||||||
| $100-$199K Households (%) |
NA | 31.80 | 31.89 | NA | 0.45 | |||||||||||||||
| $200K+ Households (%) |
NA | 15.74 | 19.59 | NA | 24.67 | |||||||||||||||
| Average Household Income ($) |
NA | 126,182 | 138,615 | NA | 9.85 | |||||||||||||||
| Median Household Income ($) |
NA | 95,004 | 103,555 | NA | 9.00 | |||||||||||||||
| Per Capita Income ($) |
NA | 44,549 | 48,788 | NA | 9.52 | |||||||||||||||
| Total Owner Occupied Housing Units (actual) |
187,147 | 187,864 | 187,805 | 0.38 | (0.03 | ) | ||||||||||||||
| Renter Occupied Housing Units (actual) |
94,039 | 95,114 | 95,585 | 1.14 | 0.50 | |||||||||||||||
| Vacant Occupied Housing Units (actual) |
13,614 | 18,958 | 20,728 | 39.25 | 9.34 | |||||||||||||||
Source: Claritas
Demographic data is provided by Claritas based primarily on US Census data. For non-census year data, Claritas uses samples and projections to estimate the demographic data. SNL performs calculations on the underlying data provided by Claritas for some of the data presented on this page.
% Change values are calculated using the underlying actual data.
Demographic Detail: Somerset, NJ
| Base 2010 | Current 2021 | Projected 2026 | % Change 2010-2021 |
% Change 2021-2026 |
||||||||||||||||
| Total Population (actual) |
323,444 | 328,529 | 329,283 | 1.57 | 0.23 | |||||||||||||||
| 0-14 Age Group (%) |
20.37 | 16.70 | 15.44 | (16.75 | ) | (7.30 | ) | |||||||||||||
| 15-34 Age Group (%) |
22.39 | 24.24 | 24.82 | 9.94 | 2.66 | |||||||||||||||
| 35-54 Age Group (%) |
32.89 | 26.87 | 24.46 | (17.01 | ) | (8.76 | ) | |||||||||||||
| 55-69 Age Group (%) |
15.73 | 20.75 | 22.57 | 34.00 | 9.02 | |||||||||||||||
| 70+ Age Group (%) |
8.62 | 11.44 | 12.70 | 34.84 | 11.23 | |||||||||||||||
| Median Age (actual) |
39.8 | 42.4 | 43.6 | 6.53 | 2.83 | |||||||||||||||
| Female Population (actual) |
165,820 | 167,916 | 168,234 | 1.26 | 0.19 | |||||||||||||||
| Male Population (actual) |
157,624 | 160,613 | 161,049 | 1.90 | 0.27 | |||||||||||||||
| Population Density (#/ sq miles) |
1,072.00 | 1,088.85 | 1,091.35 | 1.57 | 0.23 | |||||||||||||||
| Diversity Index (actual) |
NA | NA | NA | NA | NA | |||||||||||||||
| Black (%) |
8.95 | 10.08 | 10.61 | 14.45 | 5.47 | |||||||||||||||
| Asian (%) |
14.11 | 19.35 | 21.78 | 39.25 | 12.84 | |||||||||||||||
| White (%) |
70.06 | 62.27 | 58.64 | (9.73 | ) | (5.60 | ) | |||||||||||||
| Hispanic (%) |
13.01 | 15.93 | 17.29 | 24.37 | 8.77 | |||||||||||||||
| Pacific Islander (%) |
0.03 | 0.04 | 0.05 | 43.62 | 14.07 | |||||||||||||||
| American Indian/Alaska Native (%) |
0.17 | 0.23 | 0.25 | 34.17 | 11.66 | |||||||||||||||
| Multiple races (%) |
2.55 | 3.04 | 3.26 | 21.13 | 7.77 | |||||||||||||||
| Other (%) |
4.13 | 4.99 | 5.40 | 22.83 | 8.29 | |||||||||||||||
| Total Households (actual) |
117,759 | 118,310 | 118,461 | 0.47 | 0.13 | |||||||||||||||
| < $25K Households (%) |
NA | 8.09 | 7.05 | NA | (12.74 | ) | ||||||||||||||
| $25-49K Households (%) |
NA | 10.36 | 9.27 | NA | (10.40 | ) | ||||||||||||||
| $50-99K Households (%) |
NA | 20.40 | 18.35 | NA | (9.91 | ) | ||||||||||||||
| $100-$199K Households (%) |
NA | 32.25 | 30.58 | NA | (5.06 | ) | ||||||||||||||
| $200K+ Households (%) |
NA | 28.91 | 34.75 | NA | 20.38 | |||||||||||||||
| Average Household Income ($) |
NA | 177,970 | 197,185 | NA | 10.80 | |||||||||||||||
| Median Household Income ($) |
NA | 129,885 | 145,302 | NA | 11.87 | |||||||||||||||
| Per Capita Income ($) |
NA | 65,173 | 72,134 | NA | 10.68 | |||||||||||||||
| Total Owner Occupied Housing Units (actual) |
90,430 | 91,039 | 91,195 | 0.67 | 0.17 | |||||||||||||||
| Renter Occupied Housing Units (actual) |
27,329 | 27,271 | 27,266 | (0.21 | ) | (0.02 | ) | |||||||||||||
| Vacant Occupied Housing Units (actual) |
5,368 | 7,658 | 8,414 | 42.66 | 9.87 | |||||||||||||||
Source: Claritas
Demographic data is provided by Claritas based primarily on US Census data. For non-census year data, Claritas uses samples and projections to estimate the demographic data. SNL performs calculations on the underlying data provided by Claritas for some of the data presented on this page.
% Change values are calculated using the underlying actual data.
EXHIBIT III-1
Magyar Bancorp, Inc.
General Characteristics of Publicly-Traded Institutions
Exhibit III-1
Characteristics of Publicly-Traded Thrifts
February 5, 2021
| Ticker |
Financial Institution |
Exchange |
Region |
City |
State |
Total Assets |
Offices | Fiscal |
Conv. Date |
As of February 5, 2021 |
||||||||||||||||||||||
| Stock Price |
Market Value |
|||||||||||||||||||||||||||||||
| ($Mil) | ($) | ($Mil) | ||||||||||||||||||||||||||||||
| AFBI |
Affinity Bancshares, Inc. |
NASDAQCM |
SE |
Covington |
GA |
$ | 888 | 3 | Dec | 4/27/17 | $ | 10.75 | $ | 74 | ||||||||||||||||||
| AX |
Axos Financial, Inc. |
NYSE |
WE |
Las Vegas |
NV |
$ | 13,382 | 1 | Jun | 3/14/05 | $ | 43.95 | $ | 2,595 | ||||||||||||||||||
| BYFC |
Broadway Financial Corporation |
NASDAQCM |
WE |
Los Angeles |
CA |
$ | 499 | 3 | Dec | 1/8/96 | $ | 2.21 | $ | 41 | ||||||||||||||||||
| CFFN |
Capitol Federal Financial, Inc. |
NASDAQGS |
MW |
Topeka |
KS |
$ | 9,487 | 54 | Sep | 3/31/99 | $ | 12.65 | $ | 1,711 | ||||||||||||||||||
| CARV |
Carver Bancorp, Inc. |
NASDAQCM |
MA |
New York |
NY |
$ | 673 | 7 | Mar | 10/24/94 | $ | 8.90 | $ | 27 | ||||||||||||||||||
| CBMB |
CBM Bancorp, Inc. |
NASDAQCM |
MA |
Baltimore |
MD |
$ | 232 | 4 | Dec | 9/27/18 | $ | 13.95 | $ | 48 | ||||||||||||||||||
| CNNB |
Cincinnati Bancorp, Inc. |
NASDAQCM |
MW |
Cincinnati |
OH |
$ | 232 | 6 | Dec | 10/14/15 | $ | 11.96 | $ | 36 | ||||||||||||||||||
| ESBK |
Elmira Savings Bank |
NASDAQCM |
MA |
Elmira |
NY |
$ | 674 | 12 | Dec | 3/1/85 | $ | 12.24 | $ | 43 | ||||||||||||||||||
| ESSA |
ESSA Bancorp, Inc. |
NASDAQGS |
MA |
Stroudsburg |
PA |
$ | 1,894 | 23 | Sep | 4/3/07 | $ | 15.59 | $ | 157 | ||||||||||||||||||
| FFBW |
FFBW, Inc. |
NASDAQCM |
MW |
Brookfield |
WI |
$ | 286 | 7 | Dec | 10/10/17 | $ | 10.42 | $ | 74 | ||||||||||||||||||
| FNWB |
First Northwest Bancorp |
NASDAQGM |
WE |
Port Angeles |
WA |
$ | 1,565 | 12 | Dec | 1/29/15 | $ | 15.71 | $ | 149 | ||||||||||||||||||
| FBC |
Flagstar Bancorp, Inc. |
NYSE |
MW |
Troy |
MI |
$ | 29,476 | 159 | Dec | 4/30/97 | $ | 45.06 | $ | 2,373 | ||||||||||||||||||
| FSBW |
FS Bancorp, Inc. |
NASDAQCM |
WE |
Mountlake Terrace |
WA |
$ | 2,055 | 23 | Dec | 7/9/12 | $ | 58.85 | $ | 253 | ||||||||||||||||||
| GBNY |
Generations Bancorp NY, Inc. |
NASDAQCM |
MA |
Seneca Falls |
NY |
#VALUE! | 11 | Dec | 7/10/06 | $ | 9.74 | $ | 24 | |||||||||||||||||||
| HONE |
HarborOne Bancorp, Inc. |
NASDAQGS |
NE |
Brockton |
MA |
$ | 4,428 | 29 | Dec | 6/29/16 | $ | 11.32 | $ | 616 | ||||||||||||||||||
| HIFS |
Hingham Institution for Savings |
NASDAQGM |
NE |
Hingham |
MA |
$ | 2,719 | 10 | Dec | 12/13/88 | $ | 236.30 | $ | 505 | ||||||||||||||||||
| HMNF |
HMN Financial, Inc. |
NASDAQGM |
MW |
Rochester |
MN |
$ | 898 | 14 | Dec | 6/30/94 | $ | 19.00 | $ | 91 | ||||||||||||||||||
| HFBL |
Home Federal Bancorp, Inc. of Louisiana |
NASDAQCM |
SW |
Shreveport |
LA |
$ | 542 | 8 | Jun | 1/18/05 | $ | 29.09 | $ | 45 | ||||||||||||||||||
| HVBC |
HV Bancorp, Inc. |
NASDAQCM |
MA |
Doylestown |
PA |
$ | 508 | 5 | Dec | 1/11/17 | $ | 16.81 | $ | 34 | ||||||||||||||||||
| IROQ |
IF Bancorp, Inc. |
NASDAQCM |
MW |
Watseka |
IL |
$ | 726 | 8 | Jun | 7/7/11 | $ | 20.50 | $ | 66 | ||||||||||||||||||
| KRNY |
Kearny Financial Corp. |
NASDAQGS |
MA |
Fairfield |
NJ |
$ | 7,310 | 49 | Jun | 2/23/05 | $ | 10.65 | $ | 922 | ||||||||||||||||||
| EBSB |
Meridian Bancorp, Inc. |
NASDAQGS |
NE |
Peabody |
MA |
$ | 6,567 | 43 | Dec | 1/22/08 | $ | 15.91 | $ | 799 | ||||||||||||||||||
| MSVB |
Mid-Southern Bancorp, Inc. |
NASDAQCM |
MW |
Salem |
IN |
$ | 218 | 3 | Dec | 4/8/98 | $ | 16.24 | $ | 48 | ||||||||||||||||||
| NYCB |
New York Community Bancorp, Inc. |
NYSE |
MA |
Westbury |
NY |
$ | 54,932 | 239 | Dec | 11/23/93 | $ | 10.41 | $ | 4,829 | ||||||||||||||||||
| NFBK |
Northfield Bancorp, Inc. |
NASDAQGS |
MA |
Woodbridge |
NJ |
$ | 5,589 | 38 | Dec | 11/7/07 | $ | 13.22 | $ | 690 | ||||||||||||||||||
| NWBI |
Northwest Bancshares, Inc. |
NASDAQGS |
MA |
Warren |
PA |
$ | 13,789 | 171 | Dec | 11/4/94 | $ | 13.17 | $ | 1,673 | ||||||||||||||||||
| PCSB |
PCSB Financial Corporation |
NASDAQCM |
MA |
Yorktown Heights |
NY |
$ | 1,791 | 16 | Jun | 4/20/17 | $ | 15.75 | $ | 241 | ||||||||||||||||||
| PVBC |
Provident Bancorp, Inc. |
NASDAQCM |
NE |
Amesbury |
MA |
$ | 1,498 | 7 | Dec | 7/15/15 | $ | 12.10 | $ | 219 | ||||||||||||||||||
| PROV |
Provident Financial Holdings, Inc. |
NASDAQGS |
WE |
Riverside |
CA |
$ | 1,184 | 14 | Jun | 6/27/96 | $ | 15.40 | $ | 115 | ||||||||||||||||||
| PFS |
Provident Financial Services, Inc. |
NYSE |
MA |
Jersey City |
NJ |
$ | 12,871 | 101 | Dec | 1/15/03 | $ | 18.99 | $ | 1,446 | ||||||||||||||||||
| PBIP |
Prudential Bancorp, Inc. |
NASDAQGM |
MA |
Philadelphia |
PA |
$ | 1,223 | 10 | Sep | 3/29/05 | $ | 12.69 | $ | 101 | ||||||||||||||||||
| RNDB |
Randolph Bancorp, Inc. |
NASDAQGM |
NE |
Stoughton |
MA |
$ | 723 | 5 | Dec | 7/1/16 | $ | 20.00 | $ | 103 | ||||||||||||||||||
| RVSB |
Riverview Bancorp, Inc. |
NASDAQGS |
WE |
Vancouver |
WA |
$ | 1,425 | 17 | Mar | 10/26/93 | $ | 5.62 | $ | 126 | ||||||||||||||||||
| SVBI |
Severn Bancorp, Inc. |
NASDAQCM |
MA |
Annapolis |
MD |
$ | 939 | 7 | Dec | $ | 7.80 | $ | 100 | |||||||||||||||||||
| STXB |
Spirit of Texas Bancshares, Inc. |
NASDAQGS |
SW |
Conroe |
TX |
$ | 2,925 | 37 | Dec | 5/3/18 | $ | 19.37 | $ | 331 | ||||||||||||||||||
| SBT |
Sterling Bancorp, Inc. |
NASDAQCM |
MW |
Southfield |
MI |
$ | 3,937 | 30 | Dec | 11/16/17 | $ | 5.11 | $ | 255 | ||||||||||||||||||
| TBNK |
Territorial Bancorp Inc. |
NASDAQGS |
WE |
Honolulu |
HI |
$ | 2,106 | 30 | Dec | 7/13/09 | $ | 24.77 | $ | 226 | ||||||||||||||||||
| TSBK |
Timberland Bancorp, Inc. |
NASDAQGM |
WE |
Hoquiam |
WA |
$ | 1,566 | 24 | Sep | 1/12/98 | $ | 27.10 | $ | 225 | ||||||||||||||||||
| TBK |
Triumph Bancorp, Inc. |
NASDAQGS |
SW |
Dallas |
TX |
$ | 5,837 | 64 | Dec | 11/6/14 | $ | 64.06 | $ | 1,580 | ||||||||||||||||||
| TRST |
TrustCo Bank Corp NY |
NASDAQGS |
MA |
Glenville |
NY |
$ | 5,736 | 148 | Dec | $ | 6.51 | $ | 628 | |||||||||||||||||||
| WSBF |
Waterstone Financial, Inc. |
NASDAQGS |
MW |
Wauwatosa |
WI |
$ | 2,221 | 16 | Dec | 10/4/05 | $ | 19.19 | $ | 455 | ||||||||||||||||||
| WNEB |
Western New England Bancorp, Inc. |
NASDAQGS |
NE |
Westfield |
MA |
$ | 2,487 | 27 | Dec | 12/27/01 | $ | 7.23 | $ | 165 | ||||||||||||||||||
| WSFS |
WSFS Financial Corporation |
NASDAQGS |
MA |
Wilmington |
DE |
$ | 13,830 | 93 | Dec | 11/26/86 | $ | 45.26 | $ | 2,161 | ||||||||||||||||||
| WVFC |
WVS Financial Corp. |
NASDAQGM |
MA |
Pittsburgh |
PA |
$ | 332 | 6 | Jun | 11/29/93 | $ | 15.15 | $ | 26 | ||||||||||||||||||
| BCOW |
1895 Bancorp Of Wisconsin, Inc. (MHC) |
NASDAQCM |
MW |
Greenfield |
WI |
$ | 505 | 6 | Dec | 1/8/19 | $ | 9.85 | $ | 45 | ||||||||||||||||||
| BSBK |
Bogota Financial Corp. (MHC) |
NASDAQCM |
MA |
Teaneck |
NJ |
$ | 754 | 4 | Dec | 1/15/20 | $ | 9.12 | $ | 120 | ||||||||||||||||||
| CLBK |
Columbia Financial, Inc. (MHC) |
NASDAQGS |
MA |
Fair Lawn |
NJ |
$ | 8,865 | 61 | Dec | 4/19/18 | $ | 15.80 | $ | 1,753 | ||||||||||||||||||
| FSEA |
First Seacoast Bancorp (MHC) |
NASDAQCM |
NE |
Dover |
NH |
$ | 477 | 5 | Dec | 7/16/19 | $ | 8.73 | $ | 51 | ||||||||||||||||||
| GCBC |
Greene County Bancorp, Inc. (MHC) |
NASDAQCM |
MA |
Catskill |
NY |
$ | 1,799 | 19 | Jun | 12/30/98 | $ | 24.70 | $ | 210 | ||||||||||||||||||
| KFFB |
Kentucky First Federal Bancorp (MHC) |
NASDAQGM |
MW |
Frankfort |
KY |
$ | 328 | 7 | Jun | 3/2/05 | $ | 6.46 | $ | 53 | ||||||||||||||||||
| LSBK |
Lake Shore Bancorp, Inc. (MHC) |
NASDAQGM |
MA |
Dunkirk |
NY |
$ | 683 | 12 | Dec | 4/3/06 | $ | 13.44 | $ | 77 | ||||||||||||||||||
| MGYR |
Magyar Bancorp, Inc. (MHC) |
NASDAQGM |
MA |
New Brunswick |
NJ |
$ | 754 | 7 | Sep | 1/23/06 | $ | 10.61 | $ | 62 | ||||||||||||||||||
| OFED |
Oconee Federal Financial Corp. (MHC) |
NASDAQCM |
SE |
Seneca |
SC |
$ | 520 | 8 | Jun | 1/13/11 | $ | 24.00 | $ | 135 | ||||||||||||||||||
| PDLB |
PDL Community Bancorp (MHC) |
NASDAQGM |
MA |
Bronx |
NY |
$ | 1,277 | 14 | Dec | 9/29/17 | $ | 9.72 | $ | 161 | ||||||||||||||||||
| PBFS |
Pioneer Bancorp, Inc. (MHC) |
NASDAQCM |
MA |
Albany |
NY |
$ | 1,629 | 23 | Jun | 7/17/19 | $ | 10.91 | $ | 273 | ||||||||||||||||||
| RBKB |
Rhinebeck Bancorp, Inc. (MHC) |
NASDAQCM |
MA |
Poughkeepsie |
NY |
$ | 1,113 | 15 | Dec | 1/16/19 | $ | 9.21 | $ | 99 | ||||||||||||||||||
| TFSL |
TFS Financial Corporation (MHC) |
NASDAQGS |
MW |
Cleveland |
OH |
$ | 14,642 | 37 | Sep | 4/20/07 | $ | 17.53 | $ | 4,848 | ||||||||||||||||||
Source: S&P Global Market Intelligence.
EXHIBIT III-2
Magyar Bancorp, Inc.
MidAtantic and New England Savings Institutions
Exhibit III-2
Public Market Pricing of Mid-Atlantic and New England Institutions
As of February 5, 2021
| Market Capitalization |
Per Share Data | Pricing Ratios(2) | Dividends(3) | Financial Characteristics(5) | ||||||||||||||||||||||||||||||||||||||||||||||||||||||||||||||||||||||||||||||||
| Core 12 Month EPS(1) |
Book Value/ Share |
|||||||||||||||||||||||||||||||||||||||||||||||||||||||||||||||||||||||||||||||||||
| Price/ Share |
Market Value |
Amount/ Share |
Yield | Payout Ratio(4) |
Total Assets |
Equity/ Assets |
Tang. Eq./ T. Assets |
NPAs/ Assets |
Reported | Core | ||||||||||||||||||||||||||||||||||||||||||||||||||||||||||||||||||||||||||
| P/E | P/B | P/A | P/TB | P/Core | ROAA | ROAE | ROAA | ROAE | ||||||||||||||||||||||||||||||||||||||||||||||||||||||||||||||||||||||||||||
| ($) | ($Mil) | ($) | ($) | (x) | (%) | (%) | (%) | (x) | ($) | (%) | (%) | ($Mil) | (%) | (%) | (%) | (%) | (%) | (%) | (%) | |||||||||||||||||||||||||||||||||||||||||||||||||||||||||||||||||
| All Non-MHC Public Companies(6) | ||||||||||||||||||||||||||||||||||||||||||||||||||||||||||||||||||||||||||||||||||||
| Averages |
$ | 23.33 | $ | 601.07 | $ | 1.85 | $ | 19.90 | 13.96 | 103.6 | % | 12.9 | % | 114.7 | % | 13.98 | $ | 0.43 | 2.36 | % | 47 | % | $ | 5,167 | 12.62 | % | 11.78 | % | 0.69 | % | 0.84 | % | 6.91 | % | 0.87 | % | 7.23 | % | ||||||||||||||||||||||||||||||||||||||||||||||
| Median |
$ | 15.28 | $ | 192.19 | $ | 0.87 | $ | 15.86 | 12.66 | 94.1 | % | 11.6 | % | 100.8 | % | 13.14 | $ | 0.32 | 2.21 | % | 36 | % | $ | 1,791 | 11.51 | % | 10.33 | % | 0.55 | % | 0.76 | % | 5.88 | % | 0.78 | % | 6.15 | % | ||||||||||||||||||||||||||||||||||||||||||||||
| Comparable Group | ||||||||||||||||||||||||||||||||||||||||||||||||||||||||||||||||||||||||||||||||||||
| Averages |
$ | 23.90 | $ | 676.53 | $ | 1.69 | $ | 20.30 | 14.31x | 96.95 | % | 11.70 | % | 108.27 | % | 14.05x | $ | 0.45 | 2.74 | % | 55.10 | % | $ | 6,397 | 12.21 | % | 11.11 | % | 0.72 | % | 0.76 | % | 6.22 | % | 0.75 | % | 6.12 | % | ||||||||||||||||||||||||||||||||||||||||||||||
| Medians |
$ | 13.17 | $ | 219.00 | $ | 0.74 | $ | 14.31 | 13.73x | 92.27 | % | 11.76 | % | 97.72 | % | 13.43x | $ | 0.32 | 2.64 | % | 44.44 | % | $ | 2,190 | 11.48 | % | 10.08 | % | 0.65 | % | 0.76 | % | 5.54 | % | 0.74 | % | 5.63 | % | ||||||||||||||||||||||||||||||||||||||||||||||
| Comparable Group | ||||||||||||||||||||||||||||||||||||||||||||||||||||||||||||||||||||||||||||||||||||
| CARV |
Carver Bancorp, Inc. | NY | $ | 8.90 | $ | 27.26 | ($ | 1.44 | ) | $ | 9.91 | NM | 89.80 | % | 3.89 | % | 89.80 | % | NM | $ | 0.00 | 0.00 | % | NA | $ | 673 | 6.90 | % | 6.90 | % | 1.25 | % | -0.79 | % | -9.90 | % | -0.90 | % | -11.29 | % | ||||||||||||||||||||||||||||||||||||||||||||
| CBMB |
CBM Bancorp, Inc. | MD | $ | 13.95 | $ | 48.02 | $ | 0.17 | $ | 14.34 | NM | 97.29 | % | 22.31 | % | 97.29 | % | NM | NA | NA | 250.00 | % | $ | 232 | 22.94 | % | 22.94 | % | 0.55 | % | 0.32 | % | 1.27 | % | 0.27 | % | 1.07 | % | ||||||||||||||||||||||||||||||||||||||||||||||
| ESBK |
Elmira Savings Bank | NY | $ | 12.24 | $ | 43.12 | $ | 1.09 | $ | 17.01 | 10.29x | 71.03 | % | 6.69 | % | 89.11 | % | 10.30x | $ | 0.60 | 4.90 | % | 57.14 | % | $ | 674 | 8.90 | % | 7.20 | % | NA | 0.60 | % | 6.42 | % | 0.60 | % | 6.44 | % | |||||||||||||||||||||||||||||||||||||||||||||
| ESSA |
ESSA Bancorp, Inc. | PA | $ | 15.59 | $ | 157.22 | $ | 1.38 | $ | 17.60 | 10.68x | 86.89 | % | 9.03 | % | 93.91 | % | 10.71x | $ | 0.44 | 2.82 | % | 30.14 | % | $ | 1,894 | 10.11 | % | 9.41 | % | 1.09 | % | 0.76 | % | 7.43 | % | 0.75 | % | 7.37 | % | ||||||||||||||||||||||||||||||||||||||||||||
| GBNY |
Generations Bancorp NY, Inc. | NY | $ | 9.74 | $ | 23.94 | NA | NA | NM | NA | NA | NA | NM | NA | NA | NA | NA | NA | NA | NA | NA | NA | NA | NA | ||||||||||||||||||||||||||||||||||||||||||||||||||||||||||||
| HVBC |
HV Bancorp, Inc. | PA | $ | 16.81 | $ | 33.81 | $ | 1.87 | $ | 16.75 | 8.76x | 100.35 | % | 7.36 | % | 100.35 | % | 9.01x | NA | NA | NA | $ | 508 | 7.33 | % | 7.33 | % | 0.49 | % | 1.02 | % | 11.87 | % | 0.99 | % | 11.54 | % | |||||||||||||||||||||||||||||||||||||||||||||||
| KRNY |
Kearny Financial Corp. | NJ | $ | 10.65 | $ | 922.29 | $ | 0.58 | $ | 12.56 | 17.46x | 82.81 | % | 12.33 | % | 104.93 | % | 16.59x | $ | 0.32 | 3.00 | % | 52.46 | % | $ | 7,310 | 15.38 | % | 12.81 | % | 0.72 | % | 0.66 | % | 4.11 | % | 0.70 | % | 4.40 | % | ||||||||||||||||||||||||||||||||||||||||||||
| NYCB |
New York Community Bancorp, Inc. | NY | $ | 10.41 | $ | 4,829.22 | $ | 0.83 | $ | 13.43 | 10.21x | 76.18 | % | 8.65 | % | 123.43 | % | 10.30x | $ | 0.68 | 6.53 | % | 66.67 | % | $ | 54,932 | 12.26 | % | 8.21 | % | 0.13 | % | 0.79 | % | 6.32 | % | 0.78 | % | 6.25 | % | ||||||||||||||||||||||||||||||||||||||||||||
| NFBK |
Northfield Bancorp, Inc. | NJ | $ | 13.22 | $ | 690.21 | $ | 0.78 | $ | 14.26 | 17.39x | 91.54 | % | 12.52 | % | 96.94 | % | 15.30x | $ | 0.44 | 3.33 | % | 57.89 | % | $ | 5,589 | 13.55 | % | 12.89 | % | 0.39 | % | 0.67 | % | 4.78 | % | 0.73 | % | 5.26 | % | ||||||||||||||||||||||||||||||||||||||||||||
| NWBI |
Northwest Bancshares, Inc. | PA | $ | 13.17 | $ | 1,672.85 | $ | 0.70 | $ | 12.11 | 21.24x | 108.72 | % | 12.12 | % | 147.19 | % | 16.48x | $ | 0.76 | 5.77 | % | 122.58 | % | $ | 13,789 | 11.22 | % | 8.52 | % | 0.92 | % | 0.54 | % | 4.53 | % | 0.68 | % | 5.70 | % | ||||||||||||||||||||||||||||||||||||||||||||
| PCSB |
PCSB Financial Corporation | NY | $ | 15.75 | $ | 241.41 | $ | 0.59 | $ | 16.45 | 25.00x | 94.14 | % | 14.17 | % | 96.39 | % | 24.90x | $ | 0.16 | 1.02 | % | 25.40 | % | $ | 1,791 | 15.28 | % | 14.98 | % | NA | 0.54 | % | 3.34 | % | 0.54 | % | 3.36 | % | |||||||||||||||||||||||||||||||||||||||||||||
| PFS |
Provident Financial Services, Inc. | NJ | $ | 18.99 | $ | 1,446.18 | $ | 1.32 | $ | 20.41 | 13.66x | 90.99 | % | 11.41 | % | 127.76 | % | 13.22x | $ | 0.92 | 4.84 | % | 66.19 | % | $ | 12,871 | 12.44 | % | 9.30 | % | 0.71 | % | 0.78 | % | 5.70 | % | 0.84 | % | 6.15 | % | ||||||||||||||||||||||||||||||||||||||||||||
| PBIP |
Prudential Bancorp, Inc. | PA | $ | 12.69 | $ | 101.48 | $ | 0.58 | $ | 15.86 | 11.97x | 77.32 | % | 8.50 | % | 81.30 | % | NM | $ | 0.28 | 2.21 | % | 66.98 | % | $ | 1,223 | 10.55 | % | 10.08 | % | 1.10 | % | 0.76 | % | 6.88 | % | 0.39 | % | 3.56 | % | ||||||||||||||||||||||||||||||||||||||||||||
| SVBI |
Severn Bancorp, Inc. | MD | $ | 7.80 | $ | 99.98 | $ | 0.42 | $ | 8.45 | 15.00x | 91.15 | % | 10.49 | % | 92.08 | % | 14.87x | $ | 0.16 | 2.05 | % | 30.77 | % | $ | 939 | 11.53 | % | 11.43 | % | 1.57 | % | 0.63 | % | 5.06 | % | 0.64 | % | 5.11 | % | ||||||||||||||||||||||||||||||||||||||||||||
| TRST |
TrustCo Bank Corp NY | NY | $ | 6.51 | $ | 627.78 | $ | 0.53 | $ | 5.81 | 11.99x | 110.49 | % | 10.64 | % | 110.60 | % | 12.20x | $ | 0.27 | 4.19 | % | 50.19 | % | $ | 5,736 | 9.77 | % | 9.76 | % | 0.59 | % | 0.97 | % | 9.64 | % | 0.95 | % | 9.47 | % | ||||||||||||||||||||||||||||||||||||||||||||
| WSFS |
WSFS Financial Corporation | DE | $ | 45.26 | $ | 2,161.44 | $ | 2.02 | $ | 36.77 | 19.94x | 120.63 | % | 15.08 | % | 175.11 | % | 22.48x | $ | 0.48 | 1.06 | % | 21.15 | % | $ | 13,830 | 13.46 | % | 9.83 | % | 0.33 | % | 0.78 | % | 5.38 | % | 0.80 | % | 5.55 | % | ||||||||||||||||||||||||||||||||||||||||||||
| WVFC |
WVS Financial Corp. | PA | $ | 15.15 | $ | 26.33 | $ | 1.22 | $ | 19.94 | 15.30x | 75.00 | % | 9.08 | % | 75.00 | % | 15.10x | $ | 0.40 | 2.64 | % | 40.40 | % | $ | 332 | 11.42 | % | 11.42 | % | 0.00 | % | 0.59 | % | 5.88 | % | 0.60 | % | 5.96 | % | ||||||||||||||||||||||||||||||||||||||||||||
| HONE |
HarborOne Bancorp, Inc. | MA | $ | 11.32 | $ | 616.39 | $ | 0.61 | $ | 11.90 | 13.80x | 93.00 | % | 14.44 | % | 104.09 | % | 13.43x | $ | 0.12 | 1.06 | % | 10.98 | % | $ | 4,428 | 15.67 | % | 14.23 | % | 1.22 | % | 0.76 | % | 4.66 | % | 0.80 | % | 4.91 | % | ||||||||||||||||||||||||||||||||||||||||||||
| HIFS |
Hingham Institution for Savings | MA | $ | 236.30 | $ | 504.95 | $ | 18.50 | $ | 130.24 | 10.16x | 172.45 | % | 17.68 | % | 172.45 | % | 11.64x | $ | 1.88 | 0.80 | % | 10.62 | % | $ | 2,719 | 10.24 | % | 10.24 | % | 0.27 | % | 1.71 | % | 17.54 | % | 1.53 | % | 15.71 | % | ||||||||||||||||||||||||||||||||||||||||||||
| EBSB |
Meridian Bancorp, Inc. | MA | $ | 15.91 | $ | 799.05 | $ | 1.21 | $ | 14.28 | 12.33x | 108.46 | % | 12.60 | % | 111.66 | % | 13.05x | $ | 0.32 | 2.01 | % | 24.81 | % | $ | 6,567 | 11.39 | % | 11.09 | % | 0.08 | % | 1.00 | % | 8.73 | % | 0.97 | % | 8.46 | % | ||||||||||||||||||||||||||||||||||||||||||||
| PVBC |
Provident Bancorp, Inc. | MA | $ | 12.10 | $ | 219.00 | $ | 0.66 | $ | 12.30 | 18.33x | 97.72 | % | 15.31 | % | 97.72 | % | 16.00x | $ | 0.12 | 0.99 | % | 18.18 | % | $ | 1,498 | 15.98 | % | 15.98 | % | NA | 0.81 | % | 4.57 | % | 0.93 | % | 5.21 | % | |||||||||||||||||||||||||||||||||||||||||||||
| RNDB |
Randolph Bancorp, Inc. | MA | $ | 20.00 | $ | 102.86 | $ | 3.28 | $ | 17.19 | 6.60x | 116.38 | % | 15.28 | % | NA | 6.11x | NA | NA | NA | $ | 723 | 13.13 | % | NA | 1.57 | % | 2.30 | % | 18.55 | % | 2.49 | % | 20.05 | % | |||||||||||||||||||||||||||||||||||||||||||||||||
| WNEB |
Western New England Bancorp, Inc. | MA | $ | 7.23 | $ | 165.39 | $ | 0.40 | $ | 8.99 | 16.07x | 80.63 | % | 7.72 | % | 86.52 | % | 15.23x | $ | 0.20 | 2.77 | % | 44.44 | % | $ | 2,487 | 9.26 | % | 8.69 | % | NA | 0.42 | % | 4.16 | % | 0.45 | % | 4.45 | % | |||||||||||||||||||||||||||||||||||||||||||||
| MHCs |
||||||||||||||||||||||||||||||||||||||||||||||||||||||||||||||||||||||||||||||||||||
| BSBK |
Bogota Financial Corp. (MHC) | NJ | $ | 9.12 | $ | 120.00 | NA | $ | 9.68 | NM | 93.41 | % | 16.20 | % | 93.41 | % | 27.98x | NA | NA | NA | $ | 754 | 16.91 | % | 16.91 | % | NA | 0.25 | % | 1.63 | % | 0.50 | % | 3.27 | % | |||||||||||||||||||||||||||||||||||||||||||||||||
| CLBK |
Columbia Financial, Inc. (MHC) | NJ | $ | 15.80 | $ | 1,752.85 | $ | 0.51 | $ | 8.89 | 30.38x | 173.33 | % | 19.92 | % | 189.54 | % | 27.57x | NA | NA | NA | $ | 8,865 | 11.48 | % | 10.55 | % | NA | 0.60 | % | 4.98 | % | 0.66 | % | 5.55 | % | ||||||||||||||||||||||||||||||||||||||||||||||||
| GCBC |
Greene County Bancorp, Inc. (MHC) | NY | $ | 24.70 | $ | 210.28 | $ | 2.19 | $ | 15.62 | 10.65x | 151.57 | % | 11.28 | % | 151.57 | % | NM | $ | 0.48 | 1.94 | % | 20.26 | % | $ | 1,799 | 7.39 | % | 7.39 | % | 0.29 | % | 1.19 | % | 15.05 | % | 1.19 | % | 15.05 | % | ||||||||||||||||||||||||||||||||||||||||||||
| LSBK |
Lake Shore Bancorp, Inc. (MHC) | NY | $ | 13.44 | $ | 76.62 | $ | 0.76 | $ | 14.55 | 17.45x | 91.09 | % | 11.41 | % | 91.09 | % | 17.62x | $ | 0.52 | 3.87 | % | 48.05 | % | $ | 683 | 12.43 | % | 12.43 | % | 0.56 | % | 0.70 | % | 5.34 | % | 0.70 | % | 5.31 | % | ||||||||||||||||||||||||||||||||||||||||||||
| MGYR |
Magyar Bancorp, Inc. (MHC) | NJ | $ | 10.61 | $ | 61.62 | $ | 0.37 | $ | 9.78 | 20.79x | 105.88 | % | 8.31 | % | 105.88 | % | 21.16x | NA | NA | NA | $ | 754 | 7.54 | % | 7.54 | % | 2.03 | % | 0.32 | % | 3.85 | % | 0.31 | % | 3.75 | % | |||||||||||||||||||||||||||||||||||||||||||||||
| PDLB |
PDL Community Bancorp (MHC) | NY | $ | 9.72 | $ | 161.09 | ($ | 0.01 | ) | $ | 9.25 | NM | 105.05 | % | 13.02 | % | 105.05 | % | NM | NA | NA | NA | $ | 1,277 | 12.40 | % | 12.40 | % | 1.38 | % | -0.46 | % | -3.28 | % | -0.02 | % | -0.15 | % | ||||||||||||||||||||||||||||||||||||||||||||||
| PBFS |
Pioneer Bancorp, Inc. (MHC) | NY | $ | 10.91 | $ | 273.28 | $ | 0.27 | $ | 8.68 | NM | 125.74 | % | 17.40 | % | 131.19 | % | NM | NA | NA | NA | $ | 1,629 | 13.84 | % | 13.34 | % | 1.01 | % | 0.51 | % | 3.35 | % | 0.48 | % | 3.11 | % | |||||||||||||||||||||||||||||||||||||||||||||||
| RBKB |
Rhinebeck Bancorp, Inc. (MHC) | NY | $ | 9.21 | $ | 98.87 | $ | 0.50 | $ | 10.35 | 16.75x | 88.02 | % | 9.08 | % | 89.25 | % | 16.62x | NA | NA | NA | $ | 1,113 | 10.35 | % | 10.22 | % | 0.63 | % | 0.51 | % | 4.72 | % | 0.51 | % | 4.78 | % | |||||||||||||||||||||||||||||||||||||||||||||||
| FSEA |
First Seacoast Bancorp (MHC) | NH | $ | 8.73 | $ | 51.21 | $ | 0.18 | $ | 9.66 | NM | 90.40 | % | 11.13 | % | 90.40 | % | NM | NA | NA | NA | $ | 477 | 12.31 | % | 12.31 | % | 0.19 | % | 0.30 | % | 2.29 | % | 0.25 | % | 1.88 | % | |||||||||||||||||||||||||||||||||||||||||||||||
| (1) | Core income, on a diluted per-share basis. Core income is net income after taxes and before extraordinary items, less net income attributable to noncontrolling interest, gain on the sale of securities, amortization of intangibles, goodwill and nonrecurring items. Assumed tax rate is 35%. |
| (2) | P/E = Price to earnings; P/B = Price to book; P/A = Price to assets; P/TB = Price to tangible book value; and P/Core = Price to core earnings. P/E and P/Core =NM if the ratio is negative or above 35x. |
| (3) | Indicated 12 month dividend, based on last quarterly dividend declared. |
| (4) | Indicated 12 month dividend as a percent of trailing 12 month earnings. |
| (5) | Equity and tangible equity equal common equity and tangible common equity, respectively. ROAA (return on average assets) and ROAE (return on average equity) are indicated ratios based on trailing 12 month earnings and average equity and assets balances. |
| (6) | Excludes from averages and medians those companies the subject of actual or rumored acquisition activities or unusual operating characteristics. |
Source: SNL Financial, LC. and RP Financial, LC. calculations. The information provided in this report has been obtained from sources we believe are reliable, but we cannot guarantee the accuracy or completeness of such information.
Copyright (c) 2021 by RP® Financial, LC.
EXHIBIT III-3
Magyar Bancorp, Inc.
Midwest Savings Institutions
Exhibit III-3
Public Market Pricing of Midwest Institutions
As of February 5, 2021
| Market Capitalization |
Per Share Data | Pricing Ratios(2) | Dividends(3) | Financial Characteristics(5) | ||||||||||||||||||||||||||||||||||||||||||||||||||||||||||||||||||||||||||||||||
| Core 12 Month EPS(1) |
Book Value/ Share |
|||||||||||||||||||||||||||||||||||||||||||||||||||||||||||||||||||||||||||||||||||
| Price/ Share |
Market Value |
Amount/ Share |
Yield | Payout Ratio(4) |
Total Assets |
Equity/ Assets |
Tang. Eq./ T. Assets |
NPAs/ Assets |
Reported | Core | ||||||||||||||||||||||||||||||||||||||||||||||||||||||||||||||||||||||||||
| P/E | P/B | P/A | P/TB | P/Core | ROAA | ROAE | ROAA | ROAE | ||||||||||||||||||||||||||||||||||||||||||||||||||||||||||||||||||||||||||||
| ($) | ($Mil) | ($) | ($) | (x) | (%) | (%) | (%) | (x) | ($) | (%) | (%) | ($Mil) | (%) | (%) | (%) | (%) | (%) | (%) | (%) | |||||||||||||||||||||||||||||||||||||||||||||||||||||||||||||||||
| All Non-MHC Public Companies(6) | ||||||||||||||||||||||||||||||||||||||||||||||||||||||||||||||||||||||||||||||||||||
| Averages |
$ | 23.33 | $ | 601.07 | $ | 1.85 | $ | 19.90 | 13.96 | 103.6 | % | 12.9 | % | 114.7 | % | 13.98 | $ | 0.43 | 2.36 | % | 47 | % | $ | 5,167 | 12.62 | % | 11.78 | % | 0.69 | % | 0.84 | % | 6.91 | % | 0.87 | % | 7.23 | % | ||||||||||||||||||||||||||||||||||||||||||||||
| Median |
$ | 15.28 | $ | 192.19 | $ | 0.87 | $ | 15.86 | 12.66 | 94.1 | % | 11.6 | % | 100.8 | % | 13.14 | $ | 0.32 | 2.21 | % | 36 | % | $ | 1,791 | 11.51 | % | 10.33 | % | 0.55 | % | 0.76 | % | 5.88 | % | 0.78 | % | 6.15 | % | ||||||||||||||||||||||||||||||||||||||||||||||
| Comparable Group | ||||||||||||||||||||||||||||||||||||||||||||||||||||||||||||||||||||||||||||||||||||
| Averages |
$ | 17.79 | $ | 567.60 | $ | 1.85 | $ | 17.63 | 13.39x | 99.11 | % | 16.68 | % | 100.90 | % | 14.56x | $ | 0.25 | 1.36 | % | 38.47 | % | $ | 5,276 | 16.18 | % | 16.08 | % | 0.75 | % | 0.96 | % | 7.17 | % | 1.01 | % | 7.94 | % | ||||||||||||||||||||||||||||||||||||||||||||||
| Medians |
$ | 16.24 | $ | 90.61 | $ | 0.97 | $ | 15.20 | 10.57x | 89.56 | % | 16.81 | % | 89.97 | % | 12.68x | $ | 0.20 | 0.74 | % | 24.32 | % | $ | 898 | 13.54 | % | 13.41 | % | 0.54 | % | 0.69 | % | 5.57 | % | 0.74 | % | 5.64 | % | ||||||||||||||||||||||||||||||||||||||||||||||
| Comparable Group | ||||||||||||||||||||||||||||||||||||||||||||||||||||||||||||||||||||||||||||||||||||
| CFFN |
Capitol Federal Financial, Inc. | KS | $ | 12.65 | $ | 1,710.52 | $ | 0.48 | $ | 9.25 | 28.75x | 137.54 | % | 18.28 | % | 138.41 | % | 28.22x | $ | 0.34 | 2.69 | % | 106.82 | % | $ | 9,487 | 13.54 | % | 13.41 | % | 0.27 | % | 0.69 | % | 4.92 | % | 0.70 | % | 5.04 | % | ||||||||||||||||||||||||||||||||||||||||||||
| CNNB |
Cincinnati Bancorp, Inc. | OH | $ | 11.96 | $ | 35.59 | $ | 0.61 | $ | 13.35 | 19.93x | 89.56 | % | 15.34 | % | 89.97 | % | 19.71x | NA | NA | NA | $ | 232 | 17.13 | % | 17.07 | % | 0.54 | % | 0.77 | % | 6.10 | % | 0.78 | % | 6.17 | % | |||||||||||||||||||||||||||||||||||||||||||||||
| FFBW |
FFBW, Inc. | WI | $ | 10.42 | $ | 74.11 | NA | $ | 13.32 | NM | 78.24 | % | 28.10 | % | 78.28 | % | NM | NA | NA | NA | $ | 286 | 35.92 | % | 35.90 | % | 0.63 | % | 0.63 | % | 2.41 | % | NA | NA | ||||||||||||||||||||||||||||||||||||||||||||||||||
| FBC |
Flagstar Bancorp, Inc. | MI | $ | 45.06 | $ | 2,372.68 | $ | 7.90 | $ | 38.41 | 4.73x | 117.33 | % | NA | 126.55 | % | 4.64x | $ | 0.20 | 0.44 | % | 1.58 | % | $ | 29,476 | 7.45 | % | 6.94 | % | 0.33 | % | 1.75 | % | 22.74 | % | 1.79 | % | 23.96 | % | |||||||||||||||||||||||||||||||||||||||||||||
| HMNF |
HMN Financial, Inc. | MN | $ | 19.00 | $ | 90.61 | $ | 1.84 | $ | 20.91 | 8.56x | 87.76 | % | 9.96 | % | 88.50 | % | NM | $ | 0.00 | 0.00 | % | NA | $ | 898 | 11.26 | % | 11.17 | % | 0.38 | % | 1.03 | % | 8.83 | % | 1.04 | % | 8.95 | % | |||||||||||||||||||||||||||||||||||||||||||||
| IROQ |
IF Bancorp, Inc. | IL | $ | 20.50 | $ | 66.43 | $ | 1.34 | $ | 25.78 | 12.58x | 78.23 | % | 9.31 | % | 78.23 | % | NM | $ | 0.30 | 1.46 | % | 18.40 | % | $ | 726 | 11.51 | % | 11.51 | % | 0.24 | % | 0.64 | % | 5.57 | % | 0.59 | % | 5.10 | % | ||||||||||||||||||||||||||||||||||||||||||||
| MSVB |
Mid-Southern Bancorp, Inc. | IN | $ | 16.24 | $ | 48.50 | $ | 0.35 | $ | 15.20 | NM | 106.86 | % | 23.91 | % | 106.86 | % | NM | $ | 0.12 | 0.74 | % | 24.32 | % | $ | 218 | 22.38 | % | 22.38 | % | 1.19 | % | 0.56 | % | 2.36 | % | 0.52 | % | 2.20 | % | ||||||||||||||||||||||||||||||||||||||||||||
| SBT |
Sterling Bancorp, Inc. | MI | $ | 5.11 | $ | 255.41 | ($ | 0.30 | ) | $ | 6.63 | NM | 79.92 | % | 6.53 | % | 79.92 | % | NM | $ | 0.00 | 0.00 | % | NA | $ | 3,937 | 8.41 | % | 8.41 | % | 2.50 | % | -0.43 | % | -4.39 | % | -0.43 | % | -4.43 | % | ||||||||||||||||||||||||||||||||||||||||||||
| WSBF |
Waterstone Financial, Inc. | WI | $ | 19.19 | $ | 454.54 | $ | 2.60 | $ | 15.84 | 5.82x | 116.54 | % | 22.04 | % | 121.36 | % | 5.66x | $ | 0.80 | 4.17 | % | 41.21 | % | $ | 2,221 | 17.99 | % | 17.96 | % | 0.70 | % | 2.97 | % | 15.96 | % | 3.07 | % | 16.53 | % | ||||||||||||||||||||||||||||||||||||||||||||
| MHCs |
||||||||||||||||||||||||||||||||||||||||||||||||||||||||||||||||||||||||||||||||||||
| BCOW |
1895 Bancorp Of Wisconsin, Inc. (MHC) | WI | $ | 9.85 | $ | 45.20 | $ | 0.12 | $ | 12.50 | 32.83x | 78.78 | % | 9.31 | % | 78.78 | % | NM | NA | NA | NA | $ | 505 | 11.81 | % | 11.81 | % | 0.37 | % | 0.30 | % | 2.52 | % | 0.13 | % | 1.05 | % | |||||||||||||||||||||||||||||||||||||||||||||||
| KFFB |
Kentucky First Federal Bancorp (MHC) | KY | $ | 6.46 | $ | 53.05 | ($ | 0.21 | ) | $ | 6.29 | NM | 102.66 | % | 16.09 | % | 104.57 | % | NM | $ | 0.40 | 6.19 | % | NA | $ | 328 | 15.82 | % | 15.57 | % | NA | -3.81 | % | -20.62 | % | -0.54 | % | -2.94 | % | |||||||||||||||||||||||||||||||||||||||||||||
| TFSL |
TFS Financial Corporation (MHC) | OH | $ | 17.53 | $ | 4,848.02 | NA | $ | 5.97 | NM | 296.67 | % | 33.75 | % | 298.42 | % | NM | $ | 1.12 | 6.39 | % | 373.33 | % | $ | 14,642 | 11.42 | % | 11.36 | % | 1.04 | % | 0.56 | % | 4.88 | % | NA | NA | |||||||||||||||||||||||||||||||||||||||||||||||
| (1) | Core income, on a diluted per-share basis. Core income is net income after taxes and before extraordinary items, less net income attributable to noncontrolling interest, gain on the sale of securities, amortization of intangibles, goodwill and nonrecurring items. Assumed tax rate is 35%. |
| (2) | P/E = Price to earnings; P/B = Price to book; P/A = Price to assets; P/TB = Price to tangible book value; and P/Core = Price to core earnings. P/E and P/Core =NM if the ratio is negative or above 35x. |
| (3) | Indicated 12 month dividend, based on last quarterly dividend declared. |
| (4) | Indicated 12 month dividend as a percent of trailing 12 month earnings. |
| (5) | Equity and tangible equity equal common equity and tangible common equity, respectively. ROAA (return on average assets) and ROAE (return on average equity) are indicated ratios based on trailing 12 month earnings and average equity and assets balances. |
| (6) | Excludes from averages and medians those companies the subject of actual or rumored acquisition activities or unusual operating characteristics. |
Source: SNL Financial, LC. and RP Financial, LC. calculations. The information provided in this report has been obtained from sources we believe are reliable, but we cannot guarantee the accuracy or completeness of such information.
Copyright (c) 2021 by RP® Financial, LC.
EXHIBIT III-4
Magyar Bancorp, Inc.
Peer Group Summary Demographic and Deposit Market Share Data
Exhibit III-4
Peer Group Market Area Comparative Analysis
| Institution |
County |
Population | Proj. Pop. |
2016-2021 % Change |
2021-2026 % Change |
Per Capita Income | Deposit Market Share(1) |
|||||||||||||||||||||||||||
| 2016 | 2021 | 2026 | 2021 Amount |
% State Average |
||||||||||||||||||||||||||||||
| Prudential Bancorp, Inc. |
Philadelphia, PA | 1,569,473 | 1,588,749 | 1,606,225 | 0.2 | % | 0.2 | % | 30,040 | 81.4 | % | 1.02 | % | |||||||||||||||||||||
| Elmira Savings Bank |
Chemung, NY | 86,984 | 82,370 | 80,032 | -1.1 | % | -0.6 | % | 31,386 | 74.5 | % | 24.23 | % | |||||||||||||||||||||
| HMN Financial, Inc. |
Olmsted, MN | 152,655 | 160,589 | 167,296 | 1.0 | % | 0.8 | % | 43,936 | 107.2 | % | 6.04 | % | |||||||||||||||||||||
| ESSA Bancorp, Inc. |
Monroe, PA | 164,857 | 171,166 | 172,658 | 0.8 | % | 0.2 | % | 32,216 | 112.8 | % | 28.72 | % | |||||||||||||||||||||
| HV Bancorp, Inc. |
Bucks, PA | 627,070 | 628,796 | 630,606 | 0.1 | % | 0.1 | % | 51,097 | 138.5 | % | 0.41 | % | |||||||||||||||||||||
| IF Bancorp, Inc. |
Iroquois, IL | 28,599 | 26,613 | 25,608 | -1.4 | % | -0.8 | % | 28,928 | 76.6 | % | 22.22 | % | |||||||||||||||||||||
| Randolph Bancorp, Inc. |
Norfolk, MA | 699,079 | 711,405 | 729,065 | 0.4 | % | 0.5 | % | 60,544 | 123.6 | % | 1.65 | % | |||||||||||||||||||||
| Severn Bancorp, Inc. |
Anne Arundel, MD | 567,226 | 585,055 | 603,525 | 0.6 | % | 0.6 | % | 53,217 | 116.8 | % | 4.87 | % | |||||||||||||||||||||
| PCSB Financial Corporation |
Westchester, NY | 979,959 | 967,400 | 970,003 | -0.3 | % | 0.1 | % | 60,382 | 163.7 | % | 0.41 | % | |||||||||||||||||||||
| Provident Bancorp, Inc. |
Essex, MA | 777,791 | 793,814 | 813,863 | 0.4 | % | 0.5 | % | 48,443 | 131.3 | % | 2.29 | % | |||||||||||||||||||||
| Averages: |
565,369 | 571,596 | 579,888 | 0.1 | % | 0.2 | % | 44,019 | 112.6 | % | 9.19 | % | ||||||||||||||||||||||
| Medians: |
597,148 | 606,926 | 617,066 | 0.3 | % | 0.2 | % | 46,190 | 114.8 | % | 3.58 | % | ||||||||||||||||||||||
| Magyar Bancorp, Inc. |
MIddlesex, NJ | 845,310 | 824,980 | 828,442 | -0.5 | % | 0.1 | % | 44,549 | 120.8 | % | 1.20 | % | |||||||||||||||||||||
(1) Total institution deposits in headquarters county as percent of total county deposits as of June 30, 2020.
Sources: S&P Global Market Intelligence and FDIC.
EXHIBIT IV-1
Magyar Bancorp, Inc.
Thrift Stock Prices: As of February 5, 2021
Exhibit IV-1A
Weekly Thrift Market Line - Part One
Prices As of February 5, 2021
| Market Capitalization | Price Change Data | Current Per Share Financials | ||||||||||||||||||||||||||||||||||||||||||||||||||||||||
| Price/ Share(1) |
Shares Outstanding |
Market Capitalization |
52 Week (1) | Last Wk | % Change From | LTM EPS (3) |
LTM Core EPS (3) |
BV/ Share |
TBV/ Share (4) |
Assets/ Share |
||||||||||||||||||||||||||||||||||||||||||||||||
| High | Low | Last Wk | 52 Wks (2) | MRY (2) | ||||||||||||||||||||||||||||||||||||||||||||||||||||||
| ($) | (000) | ($Mil) | ($) | ($) | ($) | (%) | (%) | (%) | ($) | ($) | ($) | ($) | ($) | |||||||||||||||||||||||||||||||||||||||||||||
| All Fully-Converted Savings Institutions |
|
|||||||||||||||||||||||||||||||||||||||||||||||||||||||||
| Average | 23.33 | 37,445 | 600.6 | 25.99 | 12.55 | 23.33 | 4.99 | 2.60 | 5.63 | 2.06 | 2.17 | 19.95 | 19.07 | 189.07 | ||||||||||||||||||||||||||||||||||||||||||||
| Median | 23.63 | 38,156 | 612.9 | 26.32 | 12.72 | 23.63 | 5.09 | 2.86 | 5.56 | 2.10 | 2.22 | 20.19 | 19.37 | 190.46 | ||||||||||||||||||||||||||||||||||||||||||||
| Fully Converted Savings Institutions |
|
|||||||||||||||||||||||||||||||||||||||||||||||||||||||||
| AFBI |
Affinity Bancshares, Inc. | 10.75 | 6,876 | 73.9 | 11.80 | 5.36 | 10.75 | 0.75 | -8.46 | 8.60 | 0.26 | 0.56 | 10.46 | 7.95 | 129.18 | |||||||||||||||||||||||||||||||||||||||||||
| BYFC |
Broadway Financial Corporation | 2.21 | 27,466 | 41.3 | 7.23 | 1.04 | 2.21 | 8.87 | 47.33 | 19.46 | 0.00 | NA | 1.76 | 1.76 | 18.18 | |||||||||||||||||||||||||||||||||||||||||||
| CFFN |
Capitol Federal Financial, Inc. | 12.65 | 135,324 | 1,710.5 | 13.50 | 8.75 | 12.65 | 1.85 | -5.10 | 1.20 | 0.44 | 0.45 | 9.20 | NA | 70.99 | |||||||||||||||||||||||||||||||||||||||||||
| CARV |
Carver Bancorp, Inc. | 8.90 | 3,063 | 27.3 | 22.97 | 1.25 | 8.90 | 8.67 | 256.00 | 37.13 | -1.31 | -1.44 | 9.91 | 9.91 | 219.62 | |||||||||||||||||||||||||||||||||||||||||||
| CBMB |
CBM Bancorp, Inc. | 13.95 | 3,442 | 48.0 | 15.05 | 10.61 | 13.95 | 0.00 | -2.52 | 5.05 | 0.20 | 0.17 | 14.34 | 14.34 | 67.45 | |||||||||||||||||||||||||||||||||||||||||||
| CNNB |
Cincinnati Bancorp, Inc. | 11.96 | 2,976 | 35.6 | 12.00 | 6.33 | 11.96 | 1.79 | 11.88 | 0.08 | 0.60 | 0.61 | 13.35 | 13.29 | 77.95 | |||||||||||||||||||||||||||||||||||||||||||
| ESBK |
Elmira Savings Bank | 12.24 | 3,523 | 43.1 | 16.57 | 10.30 | 12.24 | 0.25 | -26.27 | 6.43 | 1.19 | 1.19 | 17.23 | 13.74 | 182.97 | |||||||||||||||||||||||||||||||||||||||||||
| ESSA |
ESSA Bancorp, Inc. | 15.59 | 10,085 | 157.2 | 17.58 | 9.70 | 15.59 | 9.17 | -10.20 | 3.93 | 1.46 | 1.46 | 17.94 | 16.60 | 185.31 | |||||||||||||||||||||||||||||||||||||||||||
| FFBW |
FFBW, Inc. | 10.42 | 7,112 | 74.1 | 10.76 | 6.74 | 10.42 | 1.36 | -3.07 | 3.99 | 0.26 | NA | 13.32 | 13.31 | 40.18 | |||||||||||||||||||||||||||||||||||||||||||
| FNWB |
First Northwest Bancorp | 15.71 | 9,480 | 148.9 | 17.85 | 8.77 | 15.71 | 14.67 | -6.77 | 0.71 | 1.10 | 0.84 | 18.19 | 18.19 | 174.51 | |||||||||||||||||||||||||||||||||||||||||||
| FSBW |
FS Bancorp, Inc. | 58.85 | 4,157 | 252.6 | 60.65 | 27.50 | 58.85 | 9.75 | 8.56 | 7.39 | 8.97 | 8.77 | 54.27 | 52.61 | 508.36 | |||||||||||||||||||||||||||||||||||||||||||
| GBNY |
Generations Bancorp NY, Inc. | 9.74 | 2,458 | 23.9 | 11.75 | 5.85 | 9.74 | -0.91 | -5.98 | -6.53 | NA | NA | NA | NA | 151.23 | |||||||||||||||||||||||||||||||||||||||||||
| HONE |
HarborOne Bancorp, Inc. | 11.32 | 54,451 | 616.4 | 11.65 | 6.45 | 11.32 | 4.24 | 2.44 | 4.24 | 0.82 | 0.84 | 12.17 | 10.88 | 82.34 | |||||||||||||||||||||||||||||||||||||||||||
| HIFS |
Hingham Institution for Savings | 236.30 | 2,137 | 504.9 | 238.99 | 125.55 | 236.30 | 7.77 | 15.29 | 9.40 | 23.25 | 20.31 | 137.02 | 137.02 | 1337.03 | |||||||||||||||||||||||||||||||||||||||||||
| HMNF |
HMN Financial, Inc. | 19.00 | 4,769 | 90.6 | 21.50 | 13.06 | 19.00 | 6.98 | -9.97 | 10.46 | 2.22 | NA | 21.65 | 21.47 | 190.72 | |||||||||||||||||||||||||||||||||||||||||||
| HFBL |
Home Federal Bancorp, Inc. of Louisiana | 29.09 | 1,563 | 45.5 | 35.93 | 20.00 | 29.09 | -5.89 | -15.02 | 0.73 | 2.71 | NA | 30.46 | 30.46 | 342.59 | |||||||||||||||||||||||||||||||||||||||||||
| HVBC |
HV Bancorp, Inc. | 16.81 | 2,012 | 33.8 | 17.48 | 9.75 | 16.81 | 2.50 | -1.98 | -2.10 | 1.92 | 1.87 | 16.75 | 16.75 | 252.41 | |||||||||||||||||||||||||||||||||||||||||||
| IROQ |
IF Bancorp, Inc. | 20.50 | 3,240 | 66.4 | 23.00 | 15.03 | 20.50 | 3.41 | -10.87 | -6.95 | 1.63 | NA | 26.21 | 26.21 | 220.16 | |||||||||||||||||||||||||||||||||||||||||||
| KRNY |
Kearny Financial Corp. | 10.65 | 86,600 | 922.3 | 12.26 | 6.91 | 10.65 | 2.90 | -12.27 | 0.85 | 0.61 | 0.64 | 12.86 | NA | 84.70 | |||||||||||||||||||||||||||||||||||||||||||
| EBSB |
Meridian Bancorp, Inc. | 15.91 | 50,223 | 799.1 | 18.36 | 8.88 | 15.91 | 5.02 | -11.98 | 6.71 | 1.29 | 1.22 | 14.67 | 14.25 | 131.81 | |||||||||||||||||||||||||||||||||||||||||||
| MSVB |
Mid-Southern Bancorp, Inc. | 16.24 | 2,986 | 48.5 | 16.59 | 9.71 | 16.24 | 7.34 | 20.30 | 12.70 | 0.37 | 0.35 | 15.20 | 15.20 | 73.09 | |||||||||||||||||||||||||||||||||||||||||||
| NFBK |
Northfield Bancorp, Inc. | 13.22 | 52,210 | 690.2 | 16.33 | 8.72 | 13.22 | 6.96 | -18.55 | 7.22 | 0.76 | 0.86 | 14.44 | 13.64 | 105.62 | |||||||||||||||||||||||||||||||||||||||||||
| NWBI |
Northwest Bancshares, Inc. | 13.17 | 127,019 | 1,672.8 | 15.99 | 8.52 | 13.17 | 3.29 | -16.27 | 3.38 | 0.62 | 0.80 | 12.11 | 8.95 | 108.69 | |||||||||||||||||||||||||||||||||||||||||||
| PCSB |
PCSB Financial Corporation | 15.75 | 15,328 | 241.4 | 20.35 | 11.01 | 15.75 | 6.89 | -22.38 | -1.19 | 0.63 | 0.63 | 16.73 | 16.34 | 116.77 | |||||||||||||||||||||||||||||||||||||||||||
| PVBC |
Provident Bancorp, Inc. | 12.10 | 18,099 | 219.0 | 12.50 | 7.21 | 12.10 | 4.94 | 1.00 | 0.83 | 0.66 | 0.76 | 12.38 | 12.38 | 83.20 | |||||||||||||||||||||||||||||||||||||||||||
| PROV |
Provident Financial Holdings, Inc. | 15.40 | 7,442 | 114.6 | 22.46 | 11.40 | 15.40 | -4.05 | -30.88 | -1.97 | 0.72 | 0.72 | 16.79 | 16.79 | 157.31 | |||||||||||||||||||||||||||||||||||||||||||
| PBIP |
Prudential Bancorp, Inc. | 12.69 | 7,997 | 101.5 | 18.36 | 9.53 | 12.69 | 7.45 | -28.91 | -8.38 | 1.06 | NA | 16.41 | 15.61 | 149.22 | |||||||||||||||||||||||||||||||||||||||||||
| RNDB |
Randolph Bancorp, Inc. | 20.00 | 5,143 | 102.9 | 24.70 | 7.92 | 20.00 | 5.26 | 23.08 | -9.34 | 3.03 | 3.28 | 17.19 | NA | 140.57 | |||||||||||||||||||||||||||||||||||||||||||
| RVSB |
Riverview Bancorp, Inc. | 5.62 | 22,345 | 125.6 | 7.35 | 3.77 | 5.62 | 7.87 | -22.38 | 6.84 | 0.44 | 0.45 | 6.80 | 5.56 | 64.27 | |||||||||||||||||||||||||||||||||||||||||||
| SVBI |
Severn Bancorp, Inc. | 7.80 | 12,817 | 100.0 | 8.80 | 4.26 | 7.80 | 0.65 | -4.67 | 9.24 | 0.52 | 0.52 | 8.56 | 8.47 | 74.32 | |||||||||||||||||||||||||||||||||||||||||||
| STXB |
Spirit of Texas Bancshares, Inc. | 19.37 | 17,082 | 330.9 | 21.59 | 8.96 | 19.37 | 7.97 | -7.05 | 15.30 | 1.78 | 1.99 | 21.12 | 15.94 | 180.63 | |||||||||||||||||||||||||||||||||||||||||||
| SBT |
Sterling Bancorp, Inc. | 5.11 | 49,982 | 255.4 | 7.58 | 2.53 | 5.11 | 9.19 | -30.85 | 12.56 | -0.26 | NA | 6.39 | 6.39 | 78.31 | |||||||||||||||||||||||||||||||||||||||||||
| TBNK |
Territorial Bancorp Inc. | 24.77 | 9,110 | 225.7 | 30.41 | 19.23 | 24.77 | 3.81 | -16.82 | 3.08 | 2.01 | 1.90 | 26.14 | 26.14 | 231.70 | |||||||||||||||||||||||||||||||||||||||||||
| TSBK |
Timberland Bancorp, Inc. | 27.10 | 8,318 | 225.4 | 28.28 | 13.60 | 27.10 | 7.33 | -3.25 | 11.71 | 2.97 | 3.01 | 23.24 | 21.24 | 190.96 | |||||||||||||||||||||||||||||||||||||||||||
| TBK |
Triumph Bancorp, Inc. | 64.06 | 24,660 | 1,579.7 | 65.63 | 19.03 | 64.06 | 11.72 | 49.25 | 31.95 | 2.53 | NA | 27.42 | 19.78 | 240.70 | |||||||||||||||||||||||||||||||||||||||||||
| TRST |
TrustCo Bank Corp NY | 6.51 | 96,433 | 627.8 | 8.19 | 4.30 | 6.51 | 4.66 | -19.83 | -2.40 | 0.54 | 0.53 | 5.89 | 5.89 | 61.20 | |||||||||||||||||||||||||||||||||||||||||||
| WSBF |
Waterstone Financial, Inc. | 19.19 | 23,686 | 454.5 | 19.98 | 12.10 | 19.19 | 3.90 | 7.03 | 1.97 | 3.30 | 3.39 | 16.47 | NA | 92.23 | |||||||||||||||||||||||||||||||||||||||||||
| WNEB |
Western New England Bancorp, Inc. | 7.23 | 24,664 | 165.4 | 9.53 | 4.45 | 7.23 | 12.79 | -22.92 | 4.93 | 0.45 | 0.47 | 8.97 | 8.36 | 95.92 | |||||||||||||||||||||||||||||||||||||||||||
| WSFS |
WSFS Financial Corporation | 45.26 | 47,756 | 2,161.4 | 47.78 | 17.84 | 45.26 | 5.33 | 8.54 | 0.85 | 2.27 | 2.01 | 37.52 | 25.85 | 300.15 | |||||||||||||||||||||||||||||||||||||||||||
| WVFC |
WVS Financial Corp. | 15.15 | 1,742 | 26.3 | 16.89 | 13.00 | 15.15 | 3.06 | -9.85 | 5.75 | 0.99 | 1.00 | 20.20 | 20.20 | 182.25 | |||||||||||||||||||||||||||||||||||||||||||
| AX |
Axos Financial, Inc. | 43.95 | 59,077 | 2,595.0 | 44.05 | 13.69 | 43.95 | 12.84 | 53.40 | 17.11 | 3.45 | 3.71 | 21.79 | 19.75 | 243.64 | |||||||||||||||||||||||||||||||||||||||||||
| FBC |
Flagstar Bancorp, Inc. | 45.06 | 52,656 | 2,372.7 | 47.92 | 16.76 | 45.06 | 5.16 | 23.28 | 10.55 | 9.52 | 9.70 | NA | NA | 589.45 | |||||||||||||||||||||||||||||||||||||||||||
| NYCB |
New York Community Bancorp, Inc. | 10.41 | 463,902 | 4,829.2 | 11.88 | 7.72 | 10.41 | -0.48 | -8.76 | -1.33 | 1.02 | 1.01 | 13.66 | 8.43 | 121.38 | |||||||||||||||||||||||||||||||||||||||||||
| PFS |
Provident Financial Services, Inc. | 18.99 | 76,155 | 1,446.2 | 23.56 | 9.05 | 18.99 | 2.54 | -19.09 | 5.73 | 1.39 | 1.44 | 20.87 | 14.86 | 169.65 | |||||||||||||||||||||||||||||||||||||||||||
| Mutual Holding Companies |
||||||||||||||||||||||||||||||||||||||||||||||||||||||||||
| BCOW |
1895 Bancorp Of Wisconsin, Inc. (MHC) | 9.85 | 4,589 | 45.2 | 12.01 | 7.43 | 9.85 | 4.12 | -17.02 | -1.10 | 0.30 | 0.12 | 12.50 | 12.50 | 110.01 | |||||||||||||||||||||||||||||||||||||||||||
| BSBK |
Bogota Financial Corp. (MHC) | 9.12 | 13,158 | 120.0 | 11.50 | 6.07 | 9.12 | 0.55 | -20.70 | 2.36 | 0.17 | 0.33 | 9.76 | 9.76 | 56.31 | |||||||||||||||||||||||||||||||||||||||||||
| CLBK |
Columbia Financial, Inc. (MHC) | 15.80 | 110,940 | 1,752.8 | 17.34 | 10.27 | 15.80 | 2.46 | -8.09 | 1.54 | 0.52 | 0.57 | 9.12 | 8.34 | 79.31 | |||||||||||||||||||||||||||||||||||||||||||
| FSEA |
First Seacoast Bancorp (MHC) | 8.73 | 5,866 | 51.2 | 9.80 | 5.07 | 8.73 | 0.69 | -9.06 | -1.68 | 0.22 | 0.18 | 9.66 | 9.66 | 81.37 | |||||||||||||||||||||||||||||||||||||||||||
| GCBC |
Greene County Bancorp, Inc. (MHC) | 24.70 | 8,513 | 210.3 | 30.25 | 15.01 | 24.70 | 4.13 | -16.13 | -3.10 | 2.32 | NA | 16.30 | 16.30 | 219.06 | |||||||||||||||||||||||||||||||||||||||||||
| KFFB |
Kentucky First Federal Bancorp (MHC) | 6.46 | 8,212 | 53.1 | 8.16 | 4.40 | 6.46 | 2.38 | -17.22 | 2.22 | -1.50 | NA | 6.29 | 6.18 | 40.27 | |||||||||||||||||||||||||||||||||||||||||||
| LSBK |
Lake Shore Bancorp, Inc. (MHC) | 13.44 | 5,701 | 76.6 | 15.90 | 8.95 | 13.44 | 3.31 | -13.35 | 3.38 | 0.77 | 0.76 | 14.75 | 14.75 | 120.36 | |||||||||||||||||||||||||||||||||||||||||||
| MGYR |
Magyar Bancorp, Inc. (MHC) | 10.61 | 5,811 | 61.6 | 14.30 | 7.50 | 10.61 | -3.59 | -14.20 | 10.01 | 0.51 | 0.50 | 10.02 | 10.02 | 127.66 | |||||||||||||||||||||||||||||||||||||||||||
| OFED |
Oconee Federal Financial Corp. (MHC) | 24.00 | 5,604 | 134.5 | 28.00 | 15.25 | 24.00 | -1.60 | -8.01 | -5.14 | 0.73 | 0.73 | 15.87 | 15.37 | 92.74 | |||||||||||||||||||||||||||||||||||||||||||
| PDLB |
PDL Community Bancorp (MHC) | 9.72 | 16,574 | 161.1 | 14.64 | 7.31 | 9.72 | 3.18 | -32.97 | -7.52 | -0.29 | -0.01 | 9.25 | 9.25 | 77.07 | |||||||||||||||||||||||||||||||||||||||||||
| PBFS |
Pioneer Bancorp, Inc. (MHC) | 10.91 | 25,048 | 273.3 | 15.28 | 8.02 | 10.91 | 4.40 | -28.22 | 3.22 | 0.30 | 0.27 | 8.68 | 8.32 | 65.03 | |||||||||||||||||||||||||||||||||||||||||||
| RBKB |
Rhinebeck Bancorp, Inc. (MHC) | 9.21 | 10,735 | 98.9 | 11.25 | 5.90 | 9.21 | 2.05 | -15.74 | 7.72 | 0.55 | 0.55 | 10.46 | 10.32 | 105.15 | |||||||||||||||||||||||||||||||||||||||||||
| TFSL |
TFS Financial Corporation (MHC) | 17.53 | 276,556 | 4,848.0 | 22.47 | 12.65 | 17.53 | -0.79 | -18.08 | -0.57 | 0.30 | NA | 5.91 | 5.87 | 52.69 | |||||||||||||||||||||||||||||||||||||||||||
| Merger Target |
||||||||||||||||||||||||||||||||||||||||||||||||||||||||||
| STND |
Standard AVB Financial Corp. | 32.80 | 4,629 | 151.8 | 33.94 | 17.01 | 32.80 | -0.03 | 7.58 | 0.64 | 1.41 | NA | 30.49 | 24.78 | 227.06 | |||||||||||||||||||||||||||||||||||||||||||
| (1) | Average of High/Low or Bid/Ask price per share. |
| (2) | Or since offering price if converted of first listed in the past 52 weeks. Percent change figures are actual year-to-date and are not annualized. |
| (3) | EPS (earnings per share) is based on actual trailing 12 month data and is not shown on a pro forma basis. |
| (4) | Excludes intangibles (such as goodwill, value of core deposits, etc.). |
| (5) | ROA (return on assets) and ROE (return on equity) are indicated ratios based on trailing 12 month common earnings and average common equity and total assets balances. |
| (6) | Annualized based on last regular quarterly cash dividend announcement. |
| (7) | Indicated dividend as a percent of trailing 12 month earnings. |
| (8) | Excluded from averages due to actual or rumored acquisition activities or unusual operating characteristics. |
| (9) | For MHC institutions, market value reflects share price multiplied by public (non-MHC) shares. |
Source: S&P Market Intelligence, LC. and RP® Financial, LC. calculations. The information provided in this table has been obtained from sources we believe are reliable, but we cannot guarantee the accuracy or completeness of such information.
Copyright (c) 2021 by RP® Financial, LC.
RP® Financial, LC.
Exhibit IV-1B
Weekly Thrift Market Line - Part Two
Prices As of February 5, 2021
| Key Financial Ratios | Asset Quality Ratios | Pricing Ratios | Dividend Data (6) | |||||||||||||||||||||||||||||||||||||||||||||||||||||||||||||||
| Equity/ Assets(1) |
Tang Equity/ Assets(1) |
Reported Earnings | Core Earnings | NPAs/ Assets |
Rsvs/ NPLs |
Price/ Earnings |
Price/ Book |
Price/ Assets |
Price/ Tang Book |
Price/ Core Earnings |
Div/ Share |
Dividend Yield |
Payout Ratio (7) |
|||||||||||||||||||||||||||||||||||||||||||||||||||||
| ROA(5) | ROE(5) | ROA(5) | ROE(5) | |||||||||||||||||||||||||||||||||||||||||||||||||||||||||||||||
| (%) | (%) | (%) | (%) | (%) | (%) | (%) | (%) | (x) | (%) | (%) | (%) | (x) | ($) | (%) | (%) | |||||||||||||||||||||||||||||||||||||||||||||||||||
| All Fully-Converted Savings Institutions |
||||||||||||||||||||||||||||||||||||||||||||||||||||||||||||||||||
| Average | 12.53 | 11.59 | 0.91 | 7.56 | 1.00 | 7.70 | 0.84 | 147.38 | 17.44 | 103.63 | 12.92 | 114.74 | 17.01 | 0.43 | 2.36 | 47.00 | ||||||||||||||||||||||||||||||||||||||||||||||||||
| Median | 12.62 | 11.71 | 0.93 | 7.68 | 1.01 | 7.76 | 0.84 | 149.79 | 16.83 | 103.66 | 13.01 | 114.25 | 16.95 | 0.43 | 2.36 | 47.00 | ||||||||||||||||||||||||||||||||||||||||||||||||||
| Fully Converted Savings Institutions |
||||||||||||||||||||||||||||||||||||||||||||||||||||||||||||||||||
| AFBI |
Affinity Bancshares, Inc. | 8.92 | 6.93 | 0.32 | 2.55 | 0.69 | 5.55 | 0.76 | 103.99 | 41.35 | 102.74 | 9.16 | 135.14 | 19.09 | NA | NA | NM | |||||||||||||||||||||||||||||||||||||||||||||||||
| BYFC |
Broadway Financial Corporation | 9.89 | 9.89 | -0.03 | -0.26 | NA | NA | 0.96 | 66.99 | NM | 125.52 | 12.41 | 125.52 | NA | 0.00 | 0.00 | NM | |||||||||||||||||||||||||||||||||||||||||||||||||
| CFFN |
Capitol Federal Financial, Inc. | 13.29 | NA | 0.64 | 4.69 | 0.64 | 4.69 | NA | NA | 28.75 | 137.54 | 18.28 | 138.41 | 28.22 | 0.34 | 2.69 | 106.82 | |||||||||||||||||||||||||||||||||||||||||||||||||
| CARV |
Carver Bancorp, Inc. | 6.90 | 6.90 | -0.79 | -9.90 | -0.90 | -11.29 | 1.25 | 58.83 | NM | 89.80 | 3.89 | 89.80 | NM | 0.00 | 0.00 | NM | |||||||||||||||||||||||||||||||||||||||||||||||||
| CBMB |
CBM Bancorp, Inc. | 22.94 | 22.94 | 0.32 | 1.27 | 0.27 | 1.07 | 0.55 | 337.30 | 69.75 | 97.29 | 22.31 | 97.29 | 84.11 | NA | NA | 250.00 | |||||||||||||||||||||||||||||||||||||||||||||||||
| CNNB |
Cincinnati Bancorp, Inc. | 17.13 | 17.07 | 0.77 | 6.10 | 0.78 | 6.17 | 0.54 | 118.50 | 19.93 | 89.56 | 15.34 | 89.97 | 19.71 | NA | NA | NM | |||||||||||||||||||||||||||||||||||||||||||||||||
| ESBK |
Elmira Savings Bank | 9.43 | 7.66 | 0.64 | 6.95 | 0.64 | 6.97 | NA | 103.71 | 10.29 | 71.03 | 6.69 | 89.11 | 10.30 | 0.60 | 4.90 | 57.14 | |||||||||||||||||||||||||||||||||||||||||||||||||
| ESSA |
ESSA Bancorp, Inc. | 10.39 | 9.69 | 0.79 | 7.77 | 0.78 | 7.75 | NA | NA | 10.68 | 86.89 | 9.03 | 93.91 | 10.71 | 0.44 | 2.82 | 30.14 | |||||||||||||||||||||||||||||||||||||||||||||||||
| FFBW |
FFBW, Inc. | 35.92 | 35.90 | 0.63 | 2.41 | NA | NA | 0.63 | 143.79 | 40.08 | 78.24 | 28.10 | 78.28 | NA | NA | NA | NM | |||||||||||||||||||||||||||||||||||||||||||||||||
| FNWB |
First Northwest Bancorp | 11.27 | 11.27 | 0.72 | 5.79 | 0.55 | 4.40 | NA | NA | 14.28 | 86.37 | 9.73 | 86.37 | 18.80 | 0.24 | 1.53 | 20.00 | |||||||||||||||||||||||||||||||||||||||||||||||||
| FSBW |
FS Bancorp, Inc. | 10.88 | 10.59 | 2.02 | 18.74 | 1.98 | 18.32 | NA | NA | 6.56 | 108.43 | 11.80 | 111.87 | 6.71 | 0.84 | 1.43 | 7.02 | |||||||||||||||||||||||||||||||||||||||||||||||||
| GBNY |
Generations Bancorp NY, Inc. | 7.75 | NA | NA | NA | NA | NA | NA | NA | NA | NA | NA | NA | NA | NA | NA | NA | |||||||||||||||||||||||||||||||||||||||||||||||||
| HONE |
HarborOne Bancorp, Inc. | 15.53 | 14.11 | 1.05 | 6.55 | 1.08 | 6.73 | NA | NA | 13.80 | 93.00 | 14.44 | 104.09 | 13.43 | 0.12 | 1.06 | 10.98 | |||||||||||||||||||||||||||||||||||||||||||||||||
| HIFS |
Hingham Institution for Savings | 10.25 | 10.25 | 1.88 | 18.96 | 1.65 | 16.56 | NA | NA | 10.16 | 172.45 | 17.68 | 172.45 | 11.64 | 1.88 | 0.80 | 10.62 | |||||||||||||||||||||||||||||||||||||||||||||||||
| HMNF |
HMN Financial, Inc. | 11.35 | 11.27 | 1.21 | 10.56 | NA | NA | NA | NA | 8.56 | 87.76 | 9.96 | 88.50 | NA | 0.00 | 0.00 | NM | |||||||||||||||||||||||||||||||||||||||||||||||||
| HFBL |
Home Federal Bancorp, Inc. of Louisiana | 9.61 | 9.61 | 0.93 | 9.31 | NA | NA | NA | NA | 10.73 | 95.50 | 9.18 | 95.50 | NA | 0.66 | 2.27 | 24.17 | |||||||||||||||||||||||||||||||||||||||||||||||||
| HVBC |
HV Bancorp, Inc. | 7.33 | 7.33 | 1.02 | 11.87 | 0.99 | 11.54 | 0.49 | 76.54 | 8.76 | 100.35 | 7.36 | 100.35 | 9.01 | NA | NA | NM | |||||||||||||||||||||||||||||||||||||||||||||||||
| IROQ |
IF Bancorp, Inc. | 11.90 | 11.90 | 0.70 | 6.06 | NA | NA | NA | NA | 12.58 | 78.23 | 9.31 | 78.23 | NA | 0.30 | 1.46 | 18.40 | |||||||||||||||||||||||||||||||||||||||||||||||||
| KRNY |
Kearny Financial Corp. | 14.89 | NA | 0.73 | 4.66 | 0.76 | 4.85 | NA | NA | 17.46 | 82.81 | 12.33 | 104.93 | 16.59 | 0.32 | 3.00 | 52.46 | |||||||||||||||||||||||||||||||||||||||||||||||||
| EBSB |
Meridian Bancorp, Inc. | 11.61 | 11.32 | 1.01 | 8.76 | 0.95 | 8.28 | NA | NA | 12.33 | 108.46 | 12.60 | 111.66 | 13.05 | 0.32 | 2.01 | 24.81 | |||||||||||||||||||||||||||||||||||||||||||||||||
| MSVB |
Mid-Southern Bancorp, Inc. | 22.38 | 22.38 | 0.56 | 2.36 | 0.52 | 2.20 | 1.19 | 63.20 | 43.89 | 106.86 | 23.91 | 106.86 | 46.93 | 0.12 | 0.74 | 24.32 | |||||||||||||||||||||||||||||||||||||||||||||||||
| NFBK |
Northfield Bancorp, Inc. | 13.67 | 13.01 | 0.70 | 5.07 | 0.80 | 5.76 | NA | 231.96 | 17.39 | 91.54 | 12.52 | 96.94 | 15.30 | 0.44 | 3.33 | 57.89 | |||||||||||||||||||||||||||||||||||||||||||||||||
| NWBI |
Northwest Bancshares, Inc. | 11.14 | 8.48 | 0.58 | 4.72 | 0.75 | 6.09 | 0.92 | 108.18 | 21.24 | 108.72 | 12.12 | 147.19 | 16.48 | 0.76 | 5.77 | 122.58 | |||||||||||||||||||||||||||||||||||||||||||||||||
| PCSB |
PCSB Financial Corporation | 15.05 | 14.75 | 0.55 | 3.50 | 0.55 | 3.51 | NA | 194.03 | 25.00 | 94.14 | 14.17 | 96.39 | 24.90 | 0.16 | 1.02 | 25.40 | |||||||||||||||||||||||||||||||||||||||||||||||||
| PVBC |
Provident Bancorp, Inc. | 15.66 | 15.66 | 0.89 | 5.05 | 1.02 | 5.79 | NA | NA | 18.33 | 97.72 | 15.31 | 97.72 | 16.00 | 0.12 | 0.99 | 18.18 | |||||||||||||||||||||||||||||||||||||||||||||||||
| PROV |
Provident Financial Holdings, Inc. | 10.68 | 10.68 | 0.47 | 4.34 | 0.47 | 4.34 | 0.88 | 83.14 | 21.39 | 91.70 | 9.79 | 91.70 | 21.39 | 0.56 | 3.64 | 77.78 | |||||||||||||||||||||||||||||||||||||||||||||||||
| PBIP |
Prudential Bancorp, Inc. | 11.00 | 10.52 | 0.73 | 6.77 | NA | NA | NA | NA | 11.97 | 77.32 | 8.50 | 81.30 | NA | 0.28 | 2.21 | 66.98 | |||||||||||||||||||||||||||||||||||||||||||||||||
| RNDB |
Randolph Bancorp, Inc. | 13.13 | NA | 2.30 | 18.55 | 2.49 | 20.05 | 1.57 | 58.62 | 6.60 | 116.38 | 15.28 | NA | 6.11 | NA | NA | NM | |||||||||||||||||||||||||||||||||||||||||||||||||
| RVSB |
Riverview Bancorp, Inc. | 10.57 | 8.81 | 0.74 | 6.61 | 0.75 | 6.68 | NA | NA | 12.77 | 82.69 | 8.74 | 101.16 | 12.63 | 0.20 | 3.56 | 45.45 | |||||||||||||||||||||||||||||||||||||||||||||||||
| SVBI |
Severn Bancorp, Inc. | 11.51 | 11.41 | 0.76 | 6.21 | 0.76 | 6.27 | 1.26 | 79.04 | 15.00 | 91.15 | 10.49 | 92.08 | 14.87 | 0.16 | 2.05 | 30.77 | |||||||||||||||||||||||||||||||||||||||||||||||||
| STXB |
Spirit of Texas Bancshares, Inc. | 11.69 | 9.09 | 1.12 | 8.97 | 1.25 | 10.03 | NA | NA | 10.88 | 91.71 | 10.72 | 121.50 | 9.73 | 0.36 | 1.86 | 8.99 | |||||||||||||||||||||||||||||||||||||||||||||||||
| SBT |
Sterling Bancorp, Inc. | 8.17 | 8.17 | -0.35 | -3.85 | NA | NA | NA | NA | NM | 79.92 | 6.53 | 79.92 | NA | 0.00 | 0.00 | NM | |||||||||||||||||||||||||||||||||||||||||||||||||
| TBNK |
Territorial Bancorp Inc. | 11.78 | 11.78 | 0.89 | 7.55 | 0.84 | 7.12 | NA | NA | 12.32 | 94.75 | 11.16 | 94.75 | 13.06 | 0.92 | 3.71 | 50.75 | |||||||||||||||||||||||||||||||||||||||||||||||||
| TSBK |
Timberland Bancorp, Inc. | 12.17 | 11.24 | 1.69 | 13.63 | 1.71 | 13.79 | 0.37 | 246.50 | 9.12 | 116.60 | 14.19 | 127.60 | 9.02 | 0.84 | 3.10 | 30.64 | |||||||||||||||||||||||||||||||||||||||||||||||||
| TBK |
Triumph Bancorp, Inc. | 12.24 | 9.34 | 1.18 | 9.67 | NA | NA | NA | NA | 25.32 | 233.66 | 27.04 | 323.89 | NA | NA | NA | NM | |||||||||||||||||||||||||||||||||||||||||||||||||
| TRST |
TrustCo Bank Corp NY | 9.63 | 9.62 | 0.94 | 9.47 | 0.93 | 9.31 | NA | NA | 11.99 | 110.49 | 10.64 | 110.60 | 12.20 | 0.27 | 4.19 | 50.19 | |||||||||||||||||||||||||||||||||||||||||||||||||
| WSBF |
Waterstone Financial, Inc. | 18.91 | NA | 3.77 | 20.62 | 3.87 | 21.19 | NA | NA | 5.82 | 116.54 | 22.04 | 121.36 | 5.66 | 0.80 | 4.17 | 41.21 | |||||||||||||||||||||||||||||||||||||||||||||||||
| WNEB |
Western New England Bancorp, Inc. | 9.58 | 8.99 | 0.48 | 4.86 | 0.51 | 5.13 | NA | NA | 16.07 | 80.63 | 7.72 | 86.52 | 15.23 | 0.20 | 2.77 | 44.44 | |||||||||||||||||||||||||||||||||||||||||||||||||
| WSFS |
WSFS Financial Corporation | 12.48 | 8.94 | 0.86 | 6.18 | 0.76 | 5.46 | 0.42 | 398.30 | 19.94 | 120.63 | 15.08 | 175.11 | 22.48 | 0.48 | 1.06 | 21.15 | |||||||||||||||||||||||||||||||||||||||||||||||||
| WVFC |
WVS Financial Corp. | 12.11 | 12.11 | 0.50 | 4.81 | 0.51 | 4.87 | NA | NA | 15.30 | 75.00 | 9.08 | 75.00 | 15.10 | 0.40 | 2.64 | 40.40 | |||||||||||||||||||||||||||||||||||||||||||||||||
| AX |
Axos Financial, Inc. | 8.95 | 8.18 | 1.59 | 16.93 | 1.71 | 18.20 | 1.22 | 80.58 | 12.74 | 201.65 | 18.04 | 222.50 | 11.85 | NA | NA | NM | |||||||||||||||||||||||||||||||||||||||||||||||||
| FBC |
Flagstar Bancorp, Inc. | 7.09 | 6.62 | 2.00 | 26.22 | 2.04 | NA | 0.35 | 247.06 | 4.73 | 117.33 | NA | 126.55 | 4.64 | 0.20 | 0.44 | 1.58 | |||||||||||||||||||||||||||||||||||||||||||||||||
| NYCB |
New York Community Bancorp, Inc. | 12.15 | 8.19 | 0.94 | 7.62 | 0.94 | 7.55 | NA | NA | 10.21 | 76.18 | 8.65 | 123.43 | 10.30 | 0.68 | 6.53 | 66.67 | |||||||||||||||||||||||||||||||||||||||||||||||||
| PFS |
Provident Financial Services, Inc. | 12.54 | 9.26 | 0.86 | 6.49 | 0.88 | 6.70 | NA | NA | 13.66 | 90.99 | 11.41 | 127.76 | 13.22 | 0.92 | 4.84 | 66.19 | |||||||||||||||||||||||||||||||||||||||||||||||||
| Mutual Holding Companies |
||||||||||||||||||||||||||||||||||||||||||||||||||||||||||||||||||
| BCOW |
1895 Bancorp Of Wisconsin, Inc. (MHC) | 11.81 | 11.81 | 0.30 | 2.52 | 0.13 | 1.05 | 0.37 | 143.09 | 32.83 | 78.78 | 9.31 | 78.78 | 79.58 | NA | NA | NM | |||||||||||||||||||||||||||||||||||||||||||||||||
| BSBK |
Bogota Financial Corp. (MHC) | 17.34 | 17.34 | 0.28 | 1.66 | 0.54 | 3.19 | NA | NA | 53.65 | 93.41 | 16.20 | 93.41 | 27.98 | NA | NA | NM | |||||||||||||||||||||||||||||||||||||||||||||||||
| CLBK |
Columbia Financial, Inc. (MHC) | 11.49 | 10.62 | 0.66 | 5.67 | 0.73 | 6.25 | NA | NA | 30.38 | 173.33 | 19.92 | 189.54 | 27.57 | NA | NA | NM | |||||||||||||||||||||||||||||||||||||||||||||||||
| FSEA |
First Seacoast Bancorp (MHC) | 12.31 | 12.31 | 0.30 | 2.29 | 0.25 | 1.88 | 0.19 | 349.03 | 39.68 | 90.40 | 11.13 | 90.40 | 48.17 | NA | NA | NM | |||||||||||||||||||||||||||||||||||||||||||||||||
| GCBC |
Greene County Bancorp, Inc. (MHC) | 7.44 | 7.44 | 1.18 | 15.37 | NA | NA | NA | NA | 10.65 | 151.57 | 11.28 | 151.57 | NA | 0.48 | 1.94 | 20.26 | |||||||||||||||||||||||||||||||||||||||||||||||||
| KFFB |
Kentucky First Federal Bancorp (MHC) | 15.67 | 15.43 | -3.78 | -21.67 | NA | NA | NA | NA | NM | 102.66 | 16.09 | 104.57 | NA | 0.40 | 6.19 | NM | |||||||||||||||||||||||||||||||||||||||||||||||||
| LSBK |
Lake Shore Bancorp, Inc. (MHC) | 12.52 | 12.52 | 0.69 | 5.38 | 0.68 | 5.33 | NA | NA | 17.45 | 91.09 | 11.41 | 91.09 | 17.62 | 0.52 | 3.87 | 48.05 | |||||||||||||||||||||||||||||||||||||||||||||||||
| MGYR |
Magyar Bancorp, Inc. (MHC) | 7.85 | 7.85 | 0.41 | 5.31 | 0.40 | 5.21 | NA | NA | 20.79 | 105.88 | 8.31 | 105.88 | 21.16 | NA | NA | NM | |||||||||||||||||||||||||||||||||||||||||||||||||
| OFED |
Oconee Federal Financial Corp. (MHC) | 17.11 | 16.66 | 0.82 | 4.72 | 0.82 | 4.71 | 0.49 | 57.09 | 32.88 | 151.25 | 25.88 | 156.14 | 32.86 | 0.40 | 1.67 | 54.79 | |||||||||||||||||||||||||||||||||||||||||||||||||
| PDLB |
PDL Community Bancorp (MHC) | 12.40 | 12.40 | -0.46 | -3.28 | -0.02 | -0.15 | 1.38 | 81.43 | NM | 105.05 | 13.02 | 105.05 | NM | NA | NA | NM | |||||||||||||||||||||||||||||||||||||||||||||||||
| PBFS |
Pioneer Bancorp, Inc. (MHC) | 13.84 | 13.34 | 0.51 | 3.35 | 0.48 | 3.11 | 1.01 | 145.52 | 36.37 | 125.74 | 17.40 | 131.19 | 39.86 | NA | NA | NM | |||||||||||||||||||||||||||||||||||||||||||||||||
| RBKB |
Rhinebeck Bancorp, Inc. (MHC) | 10.32 | 10.19 | 0.55 | 5.18 | 0.55 | 5.22 | NA | NA | 16.75 | 88.02 | 9.08 | 89.25 | 16.62 | NA | NA | NM | |||||||||||||||||||||||||||||||||||||||||||||||||
| TFSL |
TFS Financial Corporation (MHC) | 11.38 | 11.32 | 0.56 | 4.89 | NA | NA | NA | NA | 58.43 | 296.67 | 33.75 | 298.42 | NA | 1.12 | 6.39 | 373.33 | |||||||||||||||||||||||||||||||||||||||||||||||||
| Under Acquisition |
||||||||||||||||||||||||||||||||||||||||||||||||||||||||||||||||||
| STND |
Standard AVB Financial Corp. | 13.85 | 11.55 | 0.63 | 4.56 | NA | NA | NA | NA | 23.26 | 107.59 | 14.90 | 132.38 | NA | 0.88 | 2.70 | 62.70 | |||||||||||||||||||||||||||||||||||||||||||||||||
| (1) | Average of High/Low or Bid/Ask price per share. |
| (2) | Or since offering price if converted of first listed in the past 52 weeks. Percent change figures are actual year-to-date and are not annualized. |
| (3) | EPS (earnings per share) is based on actual trailing 12 month data and is not shown on a pro forma basis. |
| (4) | Exludes intangibles (such as goodwill, value of core deposits, etc.). |
| (5) | ROA (return on assets) and ROE (return on equity) are indicated ratios based on trailing 12 month common earnings and average common equity and total assets balances. |
| (6) | Annualized based on last regular quarterly cash dividend announcement. |
| (7) | Indicated dividend as a percent of trailing 12 month earnings. |
| (8) | Excluded from averages due to actual or rumored acquisition activities or unusual operating characteristics. |
| (9) | For MHC institutions, market value reflects share price multiplied by public (non-MHC) shares. |
Source: S&P Market Intelligence, LC. and RP® Financial, LC. calculations. The information provided in this table has been obtained from sources we believe are reliable, but we cannot guarantee the accuracy or completeness of such information.
Copyright (c) 2021 by RP® Financial, LC.
EXHIBIT IV-2
Magyar Bancorp, Inc.
Historical Stock Price Indices
Exhibit IV-2
Historical Stock Price Indices(1)
| Year/Qtr. Ended |
DJIA | S&P 500 | NASDAQ Composite |
SNL Thrift Index |
SNL Bank Index | |||||||
| 2013: |
Quarter 1 | 14578.5 | 1569.2 | 3267.5 | 602.3 | 318.9 | ||||||
| Quarter 2 | 14909.6 | 1606.3 | 3404.3 | 625.3 | 346.7 | |||||||
| Quarter 3 | 15129.7 | 1681.6 | 3771.5 | 650.8 | 354.4 | |||||||
| Quarter 4 | 16576.7 | 1848.4 | 4176.6 | 706.5 | 394.4 | |||||||
| 2014: |
Quarter 1 | 16457.7 | 1872.3 | 4199.0 | 718.9 | 410.8 | ||||||
| Quarter 2 | 16826.6 | 1960.2 | 4408.2 | 723.9 | 405.2 | |||||||
| Quarter 3 | 17042.9 | 1972.3 | 4493.4 | 697.7 | 411.0 | |||||||
| Quarter 4 | 17823.1 | 2058.9 | 4736.1 | 738.7 | 432.8 | |||||||
| 2015: |
Quarter 1 | 17776.1 | 2067.9 | 4900.9 | 749.3 | 418.8 | ||||||
| Quarter 2 | 17619.5 | 2063.1 | 4986.9 | 795.7 | 448.4 | |||||||
| Quarter 3 | 16284.7 | 1920.0 | 4620.2 | 811.7 | 409.4 | |||||||
| Quarter 4 | 17425.0 | 2043.9 | 5007.4 | 809.1 | 431.5 | |||||||
| 2016: |
Quarter 1 | 17685.1 | 2059.7 | 4869.9 | 788.1 | 381.4 | ||||||
| Quarter 2 | 17930.0 | 2098.9 | 4842.7 | 780.9 | 385.6 | |||||||
| Quarter 3 | 18308.2 | 2168.3 | 5312.0 | 827.2 | 413.7 | |||||||
| Quarter 4 | 19762.6 | 2238.8 | 5383.1 | 966.7 | 532.7 | |||||||
| 2017: |
Quarter 1 | 20663.2 | 2362.7 | 5911.7 | 918.9 | 535.8 | ||||||
| Quarter 2 | 21349.6 | 2423.4 | 6140.4 | 897.1 | 552.4 | |||||||
| Quarter 3 | 22405.1 | 2519.4 | 6496.0 | 939.3 | 573.2 | |||||||
| Quarter 4 | 24719.2 | 2673.6 | 6903.4 | 937.6 | 617.7 | |||||||
| 2018: |
Quarter 1 | 24103.1 | 2640.9 | 7063.5 | 941.5 | 606.8 | ||||||
| Quarter 2 | 24271.4 | 2718.4 | 7510.3 | 961.2 | 597.8 | |||||||
| Quarter 3 | 26458.3 | 2914.0 | 8046.4 | 905.6 | 597.8 | |||||||
| Quarter 4 | 23327.5 | 2506.9 | 6635.3 | 772.0 | 502.9 | |||||||
| 2019: |
Quarter 1 | 25928.7 | 2834.4 | 7729.3 | 837.8 | 543.8 | ||||||
| Quarter 2 | 26600.0 | 2941.8 | 8006.2 | 845.3 | 573.0 | |||||||
| Quarter 3 | 26916.8 | 2976.7 | 7999.3 | 890.5 | 584.5 | |||||||
| Quarter 4 | 28538.4 | 3230.8 | 8972.6 | 920.7 | 663.9 | |||||||
| 2020: |
Quarter 1 | 21917.2 | 2584.6 | 7700.1 | 632.8 | 392.9 | ||||||
| Quarter 2 | 25812.9 | 3100.3 | 10058.8 | 658.5 | 430.8 | |||||||
| Quarter 3 | 27781.7 | 3363.0 | 11167.5 | 605.8 | 417.8 | |||||||
| Quarter 4 | 30606.5 | 3756.1 | 12888.3 | 816.7 | 558.8 | |||||||
| As of February 5, 2021 |
31148.2 | 3886.8 | 13856.3 | 851.8 | 604.8 | |||||||
(1) End of period data.
Sources: S&P Global Market Intelligence.
EXHIBIT IV-3
Magyar Bancorp, Inc.
Historical Thrift Stock Indices

Index Summary (Current Data)
Industry Banking
Geography All
| Index Name |
Current Value | As Of | Day’s Change | Day’s Change (%) |
||||||||||
| SNL Banking Indexes |
||||||||||||||
| SNL U.S. Bank and Thrift |
576.20 | 2/5/2021 | (0.66 | ) | (0.11 | ) | ||||||||
| SNL U.S. Bank |
604.77 | 2/5/2021 | (0.66 | ) | (0.11 | ) | ||||||||
| SNL U.S. Thrift |
851.79 | 2/5/2021 | (2.74 | ) | (0.32 | ) | ||||||||
| SNL TARP Participants |
143.21 | 2/5/2021 | 1.23 | 0.87 | ||||||||||
| KBW Nasdaq Bank Index |
106.28 | 2/5/2021 | (0.08 | ) | (0.07 | ) | ||||||||
| KBW Nasdaq Regional Bank Index |
106.62 | 2/5/2021 | (0.10 | ) | (0.10 | ) | ||||||||
| S&P 500 Bank |
339.96 | 2/5/2021 | (0.82 | ) | (0.24 | ) | ||||||||
| NASDAQ Bank |
3,972.37 | 2/5/2021 | (2.57 | ) | (0.06 | ) | ||||||||
| S&P 500 Commercial Banks |
485.69 | 2/5/2021 | (1.17 | ) | (0.24 | ) | ||||||||
| S&P 500 Diversified Banks |
569.50 | 2/5/2021 | (1.04 | ) | (0.18 | ) | ||||||||
| S&P 500 Regional Banks |
126.76 | 2/5/2021 | (0.54 | ) | (0.42 | ) | ||||||||
| SNL Asset Size Indexes |
||||||||||||||
| SNL U.S. Bank < $250M |
34.52 | 2/5/2021 | (1.49 | ) | (4.13 | ) | ||||||||
| SNL U.S. Bank $250M-$500M |
534.79 | 2/5/2021 | 16.23 | 3.13 | ||||||||||
| SNL U.S. Thrift < $250M |
1,612.75 | 2/5/2021 | (2.19 | ) | (0.14 | ) | ||||||||
| SNL U.S. Thrift $250M-$500M |
5,753.50 | 2/5/2021 | 52.37 | 0.92 | ||||||||||
| SNL U.S. Bank < $500M |
1,054.55 | 2/5/2021 | 13.01 | 1.25 | ||||||||||
| SNL U.S. Thrift < $500M |
2,025.68 | 2/5/2021 | 11.48 | 0.57 | ||||||||||
| SNL U.S. Bank $500M-$1B |
1,159.06 | 2/5/2021 | 12.41 | 1.08 | ||||||||||
| SNL U.S. Thrift $500M-$1B |
3,623.95 | 2/5/2021 | 9.87 | 0.27 | ||||||||||
| SNL U.S. Bank $1B-$5B |
1,102.99 | 2/5/2021 | 2.55 | 0.23 | ||||||||||
| SNL U.S. Thrift $1B-$5B |
2,416.16 | 2/5/2021 | 6.03 | 0.25 | ||||||||||
| SNL U.S. Bank $5B-$10B |
1,473.68 | 2/5/2021 | 2.06 | 0.14 | ||||||||||
| SNL U.S. Thrift $5B-$10B |
1,029.23 | 2/5/2021 | 0.79 | 0.08 | ||||||||||
| SNL U.S. Bank > $10B |
487.22 | 2/5/2021 | (0.61 | ) | (0.13 | ) | ||||||||
| SNL U.S. Thrift > $10B |
149.61 | 2/5/2021 | (1.01 | ) | (0.67 | ) | ||||||||
| SNL Market Cap Indexes |
||||||||||||||
| SNL Micro Cap U.S. Bank |
556.34 | 2/5/2021 | 2.27 | 0.41 | ||||||||||
| SNL Micro Cap U.S. Thrift |
1,078.57 | 2/5/2021 | 4.11 | 0.38 | ||||||||||
| SNL Micro Cap U.S. Bank & Thrift |
654.43 | 2/5/2021 | 2.64 | 0.41 | ||||||||||
| SNL Small Cap U.S. Bank |
659.74 | 2/5/2021 | 0.92 | 0.14 | ||||||||||
| SNL Small Cap U.S. Thrift |
654.55 | 2/5/2021 | 0.08 | 0.01 | ||||||||||
| SNL Small Cap U.S. Bank & Thrift |
677.04 | 2/5/2021 | 0.86 | 0.13 | ||||||||||
| SNL Mid Cap U.S. Bank |
401.78 | 2/5/2021 | 0.11 | 0.03 | ||||||||||
| SNL Mid Cap U.S. Thrift |
286.55 | 2/5/2021 | (1.40 | ) | (0.49 | ) | ||||||||
| SNL Mid Cap U.S. Bank & Thrift |
395.31 | 2/5/2021 | (0.12 | ) | (0.03 | ) | ||||||||
| SNL Large Cap U.S. Bank |
384.45 | 2/5/2021 | (0.54 | ) | (0.14 | ) | ||||||||
| SNL Large Cap U.S. Thrift |
97.84 | 1/29/2021 | (4.65 | ) | ||||||||||
| SNL Large Cap U.S. Bank & Thrift |
387.76 | 2/5/2021 | (0.54 | ) | (0.14 | ) | ||||||||
| SNL Geographic Indexes |
||||||||||||||
| SNL Mid-Atlantic U.S. Bank |
631.73 | 2/5/2021 | (0.44 | ) | (0.07 | ) | ||||||||
| SNL Mid-Atlantic U.S. Thrift |
2,883.60 | 2/5/2021 | (20.56 | ) | (0.71 | ) | ||||||||
| SNL Midwest U.S. Bank |
630.72 | 2/5/2021 | (0.26 | ) | (0.04 | ) | ||||||||
| SNL Midwest U.S. Thrift |
3,188.59 | 2/5/2021 | (23.51 | ) | (0.73 | ) | ||||||||
| SNL New England U.S. Bank |
558.98 | 2/5/2021 | 2.12 | 0.38 | ||||||||||
| SNL New England U.S. Thrift |
3,150.15 | 2/5/2021 | (8.49 | ) | (0.27 | ) | ||||||||
| SNL Southeast U.S. Bank |
420.99 | 2/5/2021 | (1.01 | ) | (0.24 | ) | ||||||||
| SNL Southeast U.S. Thrift |
447.93 | 2/5/2021 | 3.16 | 0.71 | ||||||||||
| SNL Southwest U.S. Bank |
1,153.01 | 2/5/2021 | (4.16 | ) | (0.36 | ) | ||||||||
| SNL Southwest U.S. Thrift |
1,305.60 | 2/5/2021 | 16.43 | 1.27 | ||||||||||
| SNL Western U.S. Bank |
1,137.71 | 2/5/2021 | (0.97 | ) | (0.09 | ) | ||||||||
| SNL Western U.S. Thrift |
190.79 | 2/5/2021 | 2.98 | 1.59 | ||||||||||
| SNL Stock Exchange Indexes |
||||||||||||||
| SNL U.S. Bank NYSE |
521.89 | 2/5/2021 | (0.71 | ) | (0.14 | ) | ||||||||
| SNL U.S. Thrift NYSE |
121.84 | 2/5/2021 | (0.51 | ) | (0.42 | ) | ||||||||
| SNL U.S. Bank NYSE American |
763.00 | 2/5/2021 | 2.35 | 0.31 | ||||||||||
| SNL U.S. Bank NASDAQ |
903.80 | 2/5/2021 | (0.09 | ) | (0.01 | ) | ||||||||
| SNL U.S. Thrift NASDAQ |
2,496.30 | 2/5/2021 | (6.89 | ) | (0.28 | ) | ||||||||
| SNL U.S. Bank Pink |
448.34 | 2/5/2021 | 1.17 | 0.26 | ||||||||||
| SNL U.S. Thrift Pink |
411.35 | 2/5/2021 | 1.88 | 0.46 | ||||||||||
| SNL Bank TSX |
1,184.94 | 2/5/2021 | 1.54 | 0.13 | ||||||||||
| SNL OTHER Indexes |
||||||||||||||
| SNL U.S. Thrift MHCs |
5,695.92 | 2/5/2021 | (45.06 | ) | (0.78 | ) | ||||||||
| SNL Pink Asset Size Indexes |
||||||||||||||
| SNL U.S. Bank Pink < $100M |
213.80 | 2/5/2021 | 0.00 | 0.00 | ||||||||||
| SNL U.S. Bank Pink $100M-$500M |
511.65 | 2/5/2021 | (1.07 | ) | (0.21 | ) | ||||||||
| SNL U.S. Bank Pink > $500M |
387.59 | 2/5/2021 | 1.30 | 0.34 | ||||||||||
| Index Name |
Current Value | As Of | Day’s Change | Day’s Change (%) |
||||||||||||
| Broad Market Indexes |
||||||||||||||||
| DJIA |
31,148.24 | 2/5/2021 | 92.38 | 0.30 | ||||||||||||
| S&P 500 |
3,886.83 | 2/5/2021 | 15.09 | 0.39 | ||||||||||||
| S&P 400 Mid Cap |
2,476.67 | 2/5/2021 | 24.35 | 0.99 | ||||||||||||
| S&P 600 Small Cap |
1,252.75 | 2/5/2021 | 14.47 | 1.17 | ||||||||||||
| S&P 500 Financials |
512.69 | 2/5/2021 | 0.44 | 0.09 | ||||||||||||
| SNL U.S. Financial Institutions |
1,090.64 | 2/5/2021 | (0.82 | ) | (0.08 | ) | ||||||||||
| MSCI US IMI Financials |
1,857.09 | 2/5/2021 | 3.47 | 0.19 | ||||||||||||
| NASDAQ |
13,856.30 | 2/5/2021 | 78.56 | 0.57 | ||||||||||||
| NASDAQ Finl |
5,553.40 | 2/5/2021 | 15.51 | 0.28 | ||||||||||||
| NYSE |
15,069.60 | 2/5/2021 | 94.17 | 0.63 | ||||||||||||
| Russell 1000 |
2,204.27 | 2/5/2021 | 10.49 | 0.48 | ||||||||||||
| Russell 2000 |
2,233.33 | 2/5/2021 | 30.91 | 1.40 | ||||||||||||
| Russell 3000 |
2,350.17 | 2/5/2021 | 12.68 | 0.54 | ||||||||||||
| S&P TSX Composite |
18,135.90 | 2/5/2021 | 93.92 | 0.52 | ||||||||||||
Intraday data is available for certain exchanges. In all cases, the data is at least 15 minutes delayed.
* - Intraday data is not currently available. Data is as of the previous close.
** - Non-publicly traded institutions and institutions outside of your current subscription are not included in custom indexes. Data is as of the previous close.
All SNL indexes are market-value weighted; i.e., an institution’s effect on an index is proportional to that institution’s market capitalization.
Source: MSCI. MSCI makes no express or implied warranties or representations and shall have no liability whatsoever with respect to any MSCI data contained herein. The MSCI data may not be further redistributed or used as a basis for other
EXHIBIT IV-4
Magyar Bancorp, Inc.
Market Area Acquisition Activity
Exhibit IV-4
New Jersey Bank and Thrift Acquisitions 2017-Present
| Target Financials at Announcement | Deal Terms and Pricing at Announcement | |||||||||||||||||||||||||||||||||||||||||||||||||||||||||||||||||||||||
| Announce Date |
Complete Date |
Buyer Name |
Target Name |
Total Assets ($000) |
E/A (%) |
TE/A (%) |
ROAA (%) |
ROAE (%) |
NPAs/ Assets (%) |
Rsrvs/ NPLs (%) |
Deal Value ($M) |
Value/ Share ($) |
P/B (%) |
P/TB (%) |
P/E (x) |
P/A (%) |
Prem/ Cdeps (%) |
|||||||||||||||||||||||||||||||||||||||||||||||||||||||
| 09/03/2020 |
Pending | Bogota Financial Corp. (MHC) | NJ | Gibraltar Bank | NJ | 107,314 | 11.92 | 11.92 | 0.27 | 2.27 | 0.08 | 750.00 | NA | NA | NA | NA | NA | NA | NA | |||||||||||||||||||||||||||||||||||||||||||||||||||||
| 03/12/2020 |
07/31/2020 | Provident Financial Services | NJ | SB One Bancorp | NJ | 2,001,657 | 9.95 | 8.63 | 1.20 | 11.66 | 0.83 | 79.77 | 212.1 | 22.092 | 103.77 | 121.47 | 9.20 | 10.59 | 3.25 | |||||||||||||||||||||||||||||||||||||||||||||||||||||
| 12/18/2019 |
07/10/2020 | Kearny Financial Corp. | NJ | MSB Financial Corp. | NJ | 591,253 | 10.86 | 10.86 | 0.71 | 6.08 | 2.24 | 42.78 | 95.7 | 18.291 | 150.82 | 150.82 | 22.86 | 16.21 | 8.29 | |||||||||||||||||||||||||||||||||||||||||||||||||||||
| 12/03/2019 |
04/01/2020 | Columbia Financial Inc. (MHC) | NJ | RSB Bancorp, MHC | NJ | 442,128 | 13.68 | 13.68 | -0.80 | -5.52 | 0.47 | 60.74 | NA | NA | NA | NA | NA | NA | NA | |||||||||||||||||||||||||||||||||||||||||||||||||||||
| 08/16/2019 |
01/02/2020 | ConnectOne Bancorp Inc. | NJ | Bancorp of New Jersey, Inc. | NJ | 924,718 | 10.01 | 10.01 | 0.65 | 6.56 | 1.42 | 72.25 | 113.4 | 15.480 | 122.04 | 122.04 | 19.60 | 12.27 | 4.62 | |||||||||||||||||||||||||||||||||||||||||||||||||||||
| 08/09/2019 |
01/01/2020 | OceanFirst Financial Corp. | NJ | Two River Bancorp | NJ | 1,153,797 | 10.52 | 9.10 | 1.05 | 10.07 | 0.80 | 185.02 | 181.2 | 20.793 | 148.25 | 174.24 | 15.40 | 15.71 | 9.50 | |||||||||||||||||||||||||||||||||||||||||||||||||||||
| 06/26/2019 |
12/01/2019 | Valley National Bancorp | NJ | Oritani Financial Corp. | NJ | 4,074,702 | 13.02 | 13.02 | 1.28 | 9.62 | 0.27 | 274.01 | 734.7 | 16.288 | 138.35 | 138.35 | 13.69 | 18.03 | 9.72 | |||||||||||||||||||||||||||||||||||||||||||||||||||||
| 06/24/2019 |
11/08/2019 | 1st Constitution Bancorp | NJ | Shore Community Bank | NJ | 273,938 | 11.62 | 11.62 | 1.45 | 13.20 | 0.62 | 343.90 | 51.7 | 16.544 | 162.28 | 162.28 | 13.23 | 18.86 | 9.98 | |||||||||||||||||||||||||||||||||||||||||||||||||||||
| 06/07/2019 |
11/01/2019 | Columbia Financial Inc. (MHC) | NJ | Stewardship Financial Corporation | NJ | 961,130 | 8.56 | 8.56 | 0.83 | 10.08 | 0.77 | 108.70 | 137.2 | 15.750 | 166.74 | 166.74 | 17.31 | 14.28 | 8.19 | |||||||||||||||||||||||||||||||||||||||||||||||||||||
| 03/19/2019 |
09/30/2019 | First Bank | NJ | Grand Bank, National Association | NJ | 196,935 | 11.27 | 11.04 | 0.49 | 4.56 | 4.15 | 42.19 | 22.1 | 42326.297 | 99.33 | 101.74 | 27.83 | 11.20 | 0.27 | |||||||||||||||||||||||||||||||||||||||||||||||||||||
| 10/25/2018 |
01/31/2019 | OceanFirst Financial Corp. | NJ | Capital Bank of New Jersey | NJ | 495,306 | 9.31 | 9.31 | 1.20 | 13.23 | 0.06 | NM | 76.8 | 30.238 | 166.66 | 166.66 | 13.16 | 15.51 | 7.63 | |||||||||||||||||||||||||||||||||||||||||||||||||||||
| 08/23/2018 |
01/04/2019 | Lakeland Bancorp | NJ | Highlands Bancorp, Inc. | NJ | 487,870 | 6.21 | 5.98 | 0.55 | 8.60 | 0.74 | 136.70 | 55.2 | 19.793 | NA | NA | 22.49 | 11.32 | NA | |||||||||||||||||||||||||||||||||||||||||||||||||||||
| 06/20/2018 |
12/21/2018 | SB One Bancorp | NJ | Enterprise Bank N.J. | NJ | 243,703 | 12.45 | 12.45 | 0.81 | 6.26 | 1.07 | 201.41 | 49.8 | 13.773 | 148.25 | 148.25 | 24.36 | 20.42 | 16.77 | |||||||||||||||||||||||||||||||||||||||||||||||||||||
| 05/24/2018 |
10/31/2018 | MB MHC | NJ | Metuchen, MHC | NJ | 259,000 | 10.26 | 10.26 | 0.13 | 1.26 | 0.19 | 447.02 | NA | NA | NA | NA | NA | NA | NA | |||||||||||||||||||||||||||||||||||||||||||||||||||||
| 12/07/2017 |
07/01/2018 | William Penn Bncp Inc. (MHC) | PA | Audubon Savings Bank | NJ | 157,421 | 7.09 | 7.09 | 0.07 | 1.11 | 0.30 | 164.32 | NA | NA | NA | NA | NA | NA | NA | |||||||||||||||||||||||||||||||||||||||||||||||||||||
| 10/18/2017 |
04/30/2018 | First Bank | NJ | Delanco Bancorp, Inc. | NJ | 127,050 | 10.76 | 10.76 | 0.15 | 1.44 | 3.96 | 28.30 | 13.4 | 14.153 | 97.87 | 97.87 | 67.39 | 10.53 | -0.29 | |||||||||||||||||||||||||||||||||||||||||||||||||||||
| 06/07/2017 |
04/17/2018 | BCB Bancorp Inc. | NJ | IA Bancorp, Inc. | NJ | 235,234 | 8.07 | 8.07 | -0.40 | -4.79 | 3.06 | 31.62 | 12.4 | NA | 102.30 | 102.30 | NA | 5.29 | 0.24 | |||||||||||||||||||||||||||||||||||||||||||||||||||||
| 11/06/2017 |
04/11/2018 | 1st Constitution Bancorp | NJ | New Jersey Community Bank | NJ | 103,572 | 8.94 | 8.94 | -1.21 | -12.58 | NA | NA | 7.6 | 3.999 | 82.40 | 82.40 | NA | 7.38 | NA | |||||||||||||||||||||||||||||||||||||||||||||||||||||
| 11/01/2017 |
04/02/2018 | Kearny Financial Corp. | NJ | Clifton Bancorp Inc. | NJ | 1,554,521 | 18.39 | 18.39 | 0.43 | 2.08 | 0.36 | 133.66 | 408.3 | 17.925 | 138.31 | 138.31 | 59.75 | 26.26 | 19.86 | |||||||||||||||||||||||||||||||||||||||||||||||||||||
| 11/03/2017 |
03/26/2018 | Spencer Savings Bank SLA | NJ | Wawel Bank (MHC) | NJ | 71,802 | 9.42 | 9.42 | -0.68 | -7.05 | 0.21 | 374.03 | 3.4 | 4.000 | 126.89 | 126.89 | NA | 4.68 | -6.02 | |||||||||||||||||||||||||||||||||||||||||||||||||||||
| 07/21/2017 |
03/01/2018 | Delmar Bancorp | MD | Liberty Bell Bank | NJ | 147,837 | 6.69 | 6.69 | 0.11 | 1.71 | 2.51 | 68.23 | 16.8 | 1.910 | 169.41 | 169.41 | NM | 11.36 | 6.83 | |||||||||||||||||||||||||||||||||||||||||||||||||||||
| 06/30/2017 |
01/31/2018 | OceanFirst Financial Corp. | NJ | Sun Bancorp, Inc. | NJ | 2,255,773 | 14.31 | 12.84 | 2.82 | 22.15 | 0.28 | 246.22 | 487.1 | 25.272 | 149.19 | 169.21 | 7.75 | 21.59 | 12.70 | |||||||||||||||||||||||||||||||||||||||||||||||||||||
| 04/11/2017 |
01/04/2018 | Sussex Bancorp | NJ | Community Bank of Bergen County, NJ | NJ | 355,726 | 8.28 | 8.28 | 0.49 | 5.68 | 2.30 | 38.52 | 46.6 | NA | 158.16 | 158.16 | 28.03 | 13.10 | 6.04 | |||||||||||||||||||||||||||||||||||||||||||||||||||||
| Average: | 748,799 | 10.50 | 10.30 | 0.50 | 4.68 | 1.21 | 182.35 | 135.06 | 138.73 | 24.14 | 13.93 | 6.92 | ||||||||||||||||||||||||||||||||||||||||||||||||||||||||||||
| Median: | 355,726 | 10.26 | 10.01 | 0.49 | 5.68 | 0.75 | 133.66 | 143.30 | 143.30 | 19.60 | 13.10 | 7.63 | ||||||||||||||||||||||||||||||||||||||||||||||||||||||||||||
Source: S&P Global Market Intelligence.
EXHIBIT IV-5
Magyar Bancorp, Inc.
Director and Senior Management Resumes
EXHIBIT IV-5
Magyar Bancorp, Inc.
Director and Senior Management Resumes
John S. Fitzgerald. Mr. Fitzgerald, age 57, was appointed President and Chief Executive Officer of Magyar Bancorp and Magyar Bank on May 27, 2010. Prior to this appointment, Mr. Fitzgerald served as the Executive Vice President and Chief Operating Officer of Magyar Bank and Magyar Bancorp since October 2007. Mr. Fitzgerald joined Magyar Bank in June 2001. Mr. Fitzgerald has over 30 years’ experience in the banking industry. As Chief Executive Officer, his experience in leading Magyar Bancorp and Magyar Bank and his responsibilities for our strategic direction and management of our day-to-day operations brings broad industry and specific institutional knowledge and experience to the Board of Directors.
Thomas Lankey. Mr. Lankey, age 60, is the Senior Vice President of Long Term Care of Hackensack Meridian Health. Mr. Lankey’s first cousin is Joseph Yelencsics, who is also a director. He has been a director of Magyar Bank since 1994 and of Magyar Bancorp since its inception in 2005. Mr. Lankey is also currently the Mayor of Edison Township. Mr. Lankey’s experience in various senior management roles and expertise in compensation and healthcare management brings to the Board valuable experience and perspective and other qualities that are beneficial to Magyar Bancorp and the Magyar Bank.
Joseph A. Yelencsics. Mr. Yelencsics, age 66, is a private investor. He was a part owner of Bristol Motors, Inc., an automobile dealership. Mr. Yelencsics is the first cousin of Thomas Lankey, who is also a director. He has been a director of Magyar Bank since 2000 and of Magyar Bancorp since its inception in 2005. Mr. Yelencsics’ experience as owner and operator of his own company brings valuable leadership and business skills that meet the Board’s objective of maintaining a membership of experienced and dedicated individuals with diverse backgrounds, perspectives, skills and other qualities that are beneficial to Magyar Bancorp.
Edward C. Stokes, III. Mr. Stokes, age 72, is the managing partner of the law firm of Stokes and Throckmorton. He is also the General Counsel of Magyar Bank. He has been a director of Magyar Bank since 2001 and of Magyar Bancorp since its inception in 2005. As an experienced attorney, Mr. Stokes brings to the Board a unique and valuable perspective on legal and legal-related issues that may arise in the operations of Magyar Bank and Magyar Bancorp.
Andrew G. Hodulik, CPA. Mr. Hodulik, age 64, is a certified public accountant with the accounting firm of Hodulik & Morrison, P.A., a division of PKF O’Connor Davies. He has been a director of Magyar Bank since 1995 and of Magyar Bancorp since its inception in 2005. As a certified public accountant and partner in an accounting firm, Mr. Hodulik brings to the Board of Directors valuable experience in dealing with accounting principles, internal controls and financial reporting rules and regulations.
Martin A. Lukacs, D.M.D. Dr. Lukacs, 74, is retired. He has been a director of Magyar Bank since 2000 and of Magyar Bancorp since its inception in 2005. Dr. Lukacs’ years of experience as owner and manager of his own local practice brings valuable leadership that meets the Board’s objective of maintaining a membership of experienced and dedicated individuals with diverse backgrounds, perspectives, skills and other qualities that are beneficial to Magyar Bancorp.
Jon R. Ansari, MBA. Mr. Ansari, age 46, is the Executive Vice President and Chief Financial Officer of Magyar Bank and of Magyar Bancorp. He has been a director of Magyar Bank and of Magyar Bancorp since 2017. Mr. Ansari joined Magyar Bank in July 1999. Prior to being appointed to his current position in June 2005, Mr. Ansari held various financial positions at Magyar Bank, such as Vice President of Finance, Controller, Assistant Controller and Accountant. Mr. Ansari’s background and extensive experience in operations, finance and accounting and knowledge of local markets provides a valuable resource to the Board of Directors.
EXHIBIT IV-5 (continued)
Magyar Bancorp, Inc.
Director and Senior Management Resumes
Peter M. Brown. Mr. Brown, age 56, is the Senior Vice President and Chief Lending Officer of Magyar Bank and of Magyar Bancorp. Mr. Brown joined Magyar Bank in 2013 as Vice President, Commercial Lending Officer and was appointed to his current position in July 2019. Prior to joining Magyar Bank, Mr. Brown served as President/CEO of Manasquan Savings Bank and has over 30 years of banking experience.
Source: Magyar Bancorp’s Preliminary Offering Prospectus
EXHIBIT IV-6
Magyar Bancorp, Inc.
Pro Forma Regulatory Capital Ratios
EXHIBIT IV-6
Magyar Bank
Pro Forma Regulatory Capital Ratios
| Magyar Bank Historical at December 31, 2020 |
Magyar Bank Pro Forma at December 31, 2020 Based Upon the Sale in the Offering of: |
|||||||||||||||||||||||||||||||
| 2,890,000 Shares | 3,400,000 Shares | 3,910,000 Shares | ||||||||||||||||||||||||||||||
| Amount | Percent of Assets |
Amount | Percent of Assets |
Amount | Percent of Assets |
Amount | Percent of Assets |
|||||||||||||||||||||||||
| (Dollars in thousands) | ||||||||||||||||||||||||||||||||
| Equity |
$ | 58,763 | 7.92 | % | $ | 68,995 | 9.13 | % | $ | 70,933 | 9.36 | % | $ | 72,854 | 9.58 | % | ||||||||||||||||
|
|
|
|
|
|
|
|
|
|||||||||||||||||||||||||
| Tier 1 leverage capital (1)(2) |
$ | 60,155 | 8.37 | % | $ | 70,387 | 9.61 | % | $ | 72,325 | 9.84 | % | $ | 74,246 | 10.06 | % | ||||||||||||||||
| Tier 1 leverage requirement |
35,948 | 5.00 | 36,633 | 5.00 | 36,760 | 5.00 | 36,887 | 5.00 | ||||||||||||||||||||||||
|
|
|
|
|
|
|
|
|
|
|
|
|
|
|
|
|
|||||||||||||||||
| Excess |
$ | 24,207 | 3.37 | % | $ | 33,754 | 4.61 | % | $ | 35,565 | 4.84 | % | $ | 37,359 | 5.06 | % | ||||||||||||||||
|
|
|
|
|
|
|
|
|
|
|
|
|
|
|
|
|
|||||||||||||||||
| Tier 1 risk-based capital (1)(2) |
$ | 60,155 | 11.98 | % | $ | 70,387 | 13.94 | % | $ | 72,325 | 14.31 | % | $ | 74,246 | 14.68 | % | ||||||||||||||||
| Tier 1 risk-based requirement |
40,169 | 8.00 | 40,388 | 8.00 | 40,429 | 8.00 | 40,469 | 8.00 | ||||||||||||||||||||||||
|
|
|
|
|
|
|
|
|
|
|
|
|
|
|
|
|
|||||||||||||||||
| Excess |
$ | 19,986 | 3.98 | % | $ | 29,999 | 5.94 | % | $ | 31,896 | 6.31 | % | $ | 33,777 | 6.68 | % | ||||||||||||||||
|
|
|
|
|
|
|
|
|
|
|
|
|
|
|
|
|
|||||||||||||||||
| Total risk-based capital (1)(2) |
$ | 66,442 | 13.23 | % | $ | 76,674 | 15.19 | % | $ | 78,612 | 15.56 | % | $ | 80,533 | 15.92 | % | ||||||||||||||||
| Total risk-based requirement |
50,211 | 10.00 | 50,485 | 10.00 | 50,536 | 10.00 | 50,587 | 10.00 | ||||||||||||||||||||||||
|
|
|
|
|
|
|
|
|
|
|
|
|
|
|
|
|
|||||||||||||||||
| Excess |
$ | 16,231 | 3.23 | % | $ | 26,189 | 5.19 | % | $ | 28,076 | 5.56 | % | $ | 29,946 | 5.92 | % | ||||||||||||||||
|
|
|
|
|
|
|
|
|
|
|
|
|
|
|
|
|
|||||||||||||||||
| Common equity tier 1 risk-based capital (1)(2) |
$ | 60,155 | 11.98 | % | $ | 70,387 | 13.94 | % | $ | 72,325 | 14.31 | % | $ | 74,246 | 14.68 | % | ||||||||||||||||
| Common equity tier 1 risk-based requirement |
32,637 | 6.50 | 32,815 | 6.50 | 32,849 | 6.50 | 32,881 | 6.50 | ||||||||||||||||||||||||
|
|
|
|
|
|
|
|
|
|
|
|
|
|
|
|
|
|||||||||||||||||
| Excess |
$ | 27,518 | 5.48 | % | $ | 37,572 | 7.44 | % | $ | 39,476 | 7.81 | % | $ | 41,365 | 8.18 | % | ||||||||||||||||
|
|
|
|
|
|
|
|
|
|
|
|
|
|
|
|
|
|||||||||||||||||
| Reconciliation of capital infused into Magyar Bank: |
|
|||||||||||||||||||||||||||||||
| Net proceeds |
|
$ | 13,700 | $ | 16,250 | $ | 18,783 | |||||||||||||||||||||||||
| Less: Common stock acquired by stock-based benefit plans |
|
(1,156 | ) | (1,360 | ) | (1,564 | ) | |||||||||||||||||||||||||
| Less: Common stock acquired by employee stock ownership plan |
|
(2,312 | ) | (2,720 | ) | (3,128 | ) | |||||||||||||||||||||||||
|
|
|
|
|
|
|
|||||||||||||||||||||||||||
| Pro forma increase |
|
$ | 10,232 | $ | 12,170 | $ | 14,091 | |||||||||||||||||||||||||
|
|
|
|
|
|
|
|||||||||||||||||||||||||||
| (1) | Tier 1 leverage capital levels are shown as a percentage of total average assets. Risk-based capital levels are shown as a percentage of risk-weighted assets. |
| (2) | Pro forma amounts and percentages assume net proceeds are invested in assets that carry a 20% risk weighting. |
Source: Magyar Bancorp’s Preliminary Offering Prospectus
EXHIBIT IV-7
Magyar Bancorp, Inc.
Pro Forma Analysis Sheet
EXHIBIT IV-7
PRO FORMA ANALYSIS SHEET
Magyar Bancorp, Inc.
Prices as of February 5, 2021
| Valuation Midpoint Pricing Multiples |
Symbol |
Subject
at Midpoint |
Peer Group | New Jersey | ||||||||||||||||||||||
| Mean | Median | Mean | Median | |||||||||||||||||||||||
| Price-earnings multiple |
= | P/E | 23.82x | 12.78x | 11.32x | 14.37x | 11.14x | |||||||||||||||||||
| Price-core earnings multiple |
= | P/CE | 24.77x | 13.13x | 10.71x | 14.43x | 11.25x | |||||||||||||||||||
| Price-book ratio |
= | P/B | 71.25% | 90.10% | 89.45% | 88.33% | 89.80% | |||||||||||||||||||
| Price-tangible book ratio |
= | P/TB | 71.23% | 93.40% | 92.99% | 101.87% | 96.39% | |||||||||||||||||||
| Price-assets ratio |
= | P/A | 8.01% | 10.61% | 9.64% | 8.81% | 8.65% | |||||||||||||||||||
| Valuation Parameters |
Adjusted | |||||||||||||||||
| Pre-Conversion Earnings (Y) |
$ | 2,974,000 | (12 Mths 12/20(2) | ESOP Stock (% of Offering + Foundation) (E) | 8.00 | % | ||||||||||||
| Pre-Conversion Core Earnings (YC) |
$ | 2,875,000 | (12 Mths 12/20(2) | Cost of ESOP Borrowings (S) | 0.00 | % | ||||||||||||
| Pre-Conversion Book Value (B) |
$ | 58,211,000 | (2) | ESOP Amortization (T) | 30.00 | Years | ||||||||||||
| Pre-Conv. Tang. Book Value (B) |
$ | 58,211,000 | (2) | Stock Program (% of Offering + Foundation (M) | 4.00 | % | ||||||||||||
| Pre-Conversion Assets (A) |
$ | 741,784,000 | (2) | Stock Programs Vesting (N) | 5.00 | Years | ||||||||||||
| Reinvestment Rate (R) |
0.36% | Fixed Expenses | $ | 1,175,000 | ||||||||||||||
| Tax rate (TAX) |
29.50% | Variable Expenses (Blended Commission %) | 0.93 | % | ||||||||||||||
| After Tax Reinvest. Rate (R) |
0.25% | Percentage Sold (PCT) | 55.0854 | % | ||||||||||||||
| Est. Conversion Expenses (1)(X) |
4.41% | MHC Net Assets (Equity) | $ | 10,000 | ||||||||||||||
| Insider Purchases |
$ | 1,000,000 | Options as (% of Offering + Foundation) (O1) | 10.00 | % | |||||||||||||
| Price/Share |
$ | 10.00 | Estimated Option Value (O2) | 31.70 | % | |||||||||||||
| Foundation Cash Contribution (FC) |
$ | — | Option Vesting Period (O3) | 5.00 | Years | |||||||||||||
| Foundation Stock Contribution (FS) |
$ | — | % of Options taxable (O4) | 25.00 | % | |||||||||||||
| Foundation Tax Benefit (FT) |
$ | — | ||||||||||||||||
| Calculation of Pro Forma Value After Conversion |
||||||||||||||||||||
| 1. |
V= | P/E * (Y—FC * R) | V= | $ | 61,722,340 | |||||||||||||||
| 1 - P/E * PCT *
((1-X-E-M-FS)*R -(1-TAX)*(E/T) - (1-TAX)*(M/N)-(1-TAX*O4)*(O1*O2/O3))) |
||||||||||||||||||||
| 2. |
V= | P/Core E * (YC) | V= | $ | 61,722,340 | |||||||||||||||
| 1 -P/Core E * PCT * ((1-X-E-M-FS)*R -(1-TAX)*(E/T) -(1-TAX)*(M/N)-(1-TAX*O4)*(O1*O2/O3))) | ||||||||||||||||||||
| 3. |
V= | P/B * (B-FC+FT) | V= | $ | 61,722,340 | |||||||||||||||
| 1—P/B * PCT * (1-X-E-M) | ||||||||||||||||||||
| 4. |
V= | P/TB * (B-FC+FT) | V= | $ | 61,722,340 | |||||||||||||||
| 1—P/TB * PCT * (1-X-E-M) | ||||||||||||||||||||
| 5. |
V= | P/A * (A-FC+FT) | V= | $ | 61,722,340 | |||||||||||||||
| 1—P/A * PCT * (1-X-E-M) | ||||||||||||||||||||
| Shares |
2nd Step Offering Shares |
2nd Step Exchange Shares |
Full Conversion Shares |
Plus: Foundation Shares |
Total Market Capitalization Shares |
Exchange Ratio |
||||||||||||||||||
| Conclusion | ||||||||||||||||||||||||
| Maximum |
3,910,000 | 3,188,068 | 7,098,068 | 0 | 7,098,068 | 1.2213 | ||||||||||||||||||
| Midpoint |
3,400,000 | 2,772,234 | 6,172,234 | 0 | 6,172,234 | 1.0620 | ||||||||||||||||||
| Minimum |
2,890,000 | 2,356,399 | 5,246,399 | 0 | 5,246,399 | 0.9027 | ||||||||||||||||||
| Market Value |
||||||||||||||||||||||||
| Conclusion |
2nd Step Offering Value |
2nd Step Exchange Shares Value |
Full Conversion $ Value |
Foundation $ Value |
Total Market Capitalization $ Value |
|||||||||||||||||||
| Maximum |
$ | 39,100,000 | $ | 31,880,680 | $ | 70,980,680 | 0 | $ | 70,980,680 | |||||||||||||||
| Midpoint |
$ | 34,000,000 | $ | 27,722,340 | $ | 61,722,340 | 0 | $ | 61,722,340 | |||||||||||||||
| Minimum |
$ | 28,900,000 | $ | 23,563,990 | $ | 52,463,990 | 0 | $ | 52,463,990 | |||||||||||||||
(1) Estimated offering expenses at midpoint of the offering.
(2) Adjusted to reflect consolidation and reinvesment of $10,000 of MHC net assets.
EXHIBIT IV-8
Magyar Bancorp, Inc.
Pro Forma Effect of Conversion Proceeds
Exhibit IV-8
PRO FORMA EFFECT OF CONVERSION PROCEEDS
Magyar Bancorp, Inc.
At the Minimum of the Range
| 1. |
Fully Converted Value and Exchange Ratio |
| ||||||||||||||||
| Fully Converted Value |
|
$ | 52,463,990 | |||||||||||||||
| Exchange Ratio |
|
0.90273 | ||||||||||||||||
| 2nd Step Offering Proceeds |
|
$ | 28,900,000 | |||||||||||||||
| Less: Estimated Offering Expenses |
|
1,500,000 | ||||||||||||||||
|
|
|
|||||||||||||||||
| 2nd Step Net Conversion Proceeds |
|
$ | 27,400,000 | |||||||||||||||
| 2. |
Estimated Additional Income from Conversion Proceeds |
| ||||||||||||||||
| Net Conversion Proceeds |
|
$ | 27,400,000 | |||||||||||||||
| Less: Cash Contribution to Foundation |
|
0 | ||||||||||||||||
| Less: ESOP Stock Purchases (1) |
|
(2,312,000 | ) | |||||||||||||||
| Less: RRP Stock Purchases (2) |
|
(1,156,000 | ) | |||||||||||||||
|
|
|
|||||||||||||||||
| Net Cash Proceeds |
|
$ | 23,932,000 | |||||||||||||||
| Estimated after-tax net incremental rate of return |
|
0.25 | % | |||||||||||||||
|
|
|
|||||||||||||||||
| Earnings Increase |
|
$ | 60,739 | |||||||||||||||
| Less: Consolidated interest cost of ESOP borrowings |
|
0 | ||||||||||||||||
| Less: Amortization of ESOP borrowings(3) |
|
(54,332 | ) | |||||||||||||||
| Less: RRP Vesting (3) |
|
(162,996 | ) | |||||||||||||||
| Less: Option Plan Vesting (4) |
|
(169,713 | ) | |||||||||||||||
|
|
|
|||||||||||||||||
| Net Earnings Increase |
|
($ | 326,302 | ) | ||||||||||||||
| 3. | Pro Forma Earnings | Before Conversion(5) |
Net Earnings Increase |
After Conversion |
||||||||||||||
| 12 Months ended December 31, 2020 (reported) |
|
$ | 2,974,000 | ($ | 326,302 | ) | $ | 2,647,698 | ||||||||||
| 12 Months ended December 31, 2020 (core) |
|
$ | 2,875,000 | ($ | 326,302 | ) | $ | 2,548,698 | ||||||||||
| 4. | Pro Forma Net Worth | Before Conversion(5) |
Net Cash Proceeds |
Tax Benefit and Other |
After Conversion |
|||||||||||||
| December 31, 2020 | $ | 58,211,000 | $ | 23,932,000 | $ | 0 | $ | 82,143,000 | ||||||||||
| December 31, 2020 (Tangible) | $ | 58,211,000 | $ | 23,932,000 | $ | 0 | $ | 82,143,000 | ||||||||||
| 5. | Pro Forma Assets | Before Conversion(5) |
Net Cash Proceeds |
Tax Benefit and Other |
After Conversion |
|||||||||||||
| December 31, 2020 | $ | 741,784,000 | $ | 23,932,000 | $ | 0 | $ | 765,716,000 | ||||||||||
(1) Includes ESOP purchases of 8.0% of the second step offering.
(2) Includes RRP purchases of 4.0% of the second step offering.
(3) ESOP amortized over 30 years, RRP amortized over 5 years, tax effected at: 29.50%
(4) Option valuation based on Black-Scholes model, 5 year vesting, and assuming 25% of the options are taxable.
(5) Adjusted to reflect consolidation and reinvestment of net MHC assets.
Exhibit IV-8
PRO FORMA EFFECT OF CONVERSION PROCEEDS
Magyar Bancorp, Inc.
At the Midpoint of the Range
| 1. |
Fully Converted Value and Exchange Ratio |
| ||||||||||||||||
| Fully Converted Value |
|
$ | 61,722,340 | |||||||||||||||
| Exchange Ratio |
|
1.0620 | ||||||||||||||||
| 2nd Step Offering Proceeds |
|
$ | 34,000,000 | |||||||||||||||
| Less: Estimated Offering Expenses |
|
1,500,000 | ||||||||||||||||
|
|
|
|||||||||||||||||
| 2nd Step Net Conversion Proceeds |
|
$ | 32,500,000 | |||||||||||||||
| 2. |
Estimated Additional Income from Conversion Proceeds |
| ||||||||||||||||
| Net Conversion Proceeds |
|
$ | 32,500,000 | |||||||||||||||
| Less: Cash Contribution to Foundation |
|
0 | ||||||||||||||||
| Less: ESOP Stock Purchases (1) |
|
(2,720,000 | ) | |||||||||||||||
| Less: RRP Stock Purchases (2) |
|
(1,360,000 | ) | |||||||||||||||
|
|
|
|||||||||||||||||
| Net Cash Proceeds |
|
$ | 28,420,000 | |||||||||||||||
| Estimated after-tax net incremental rate of return |
|
0.25 | % | |||||||||||||||
|
|
|
|||||||||||||||||
| Earnings Increase |
|
$ | 72,130 | |||||||||||||||
| Less: Consolidated interest cost of ESOP borrowings |
|
0 | ||||||||||||||||
| Less: Amortization of ESOP borrowings(3) |
|
(63,920 | ) | |||||||||||||||
| Less: RRP Vesting (3) |
|
(191,760 | ) | |||||||||||||||
| Less: Option Plan Vesting (4) |
|
(199,662 | ) | |||||||||||||||
|
|
|
|||||||||||||||||
| Net Earnings Increase |
|
($ | 383,212 | ) | ||||||||||||||
| 3. | Pro Forma Earnings | Before Conversion(5) |
Net Earnings Increase |
After Conversion |
||||||||||||||
| 12 Months ended December 31, 2020 (reported) |
|
$ | 2,974,000 | ($ | 383,212 | ) | $ | 2,590,788 | ||||||||||
| 12 Months ended December 31, 2020 (core) |
|
$ | 2,875,000 | ($ | 383,212 | ) | $ | 2,491,788 | ||||||||||
| 4. | Pro Forma Net Worth | Before Conversion (5) |
Net Cash Proceeds |
Tax Benefit of Foundation |
After Conversion |
|||||||||||||
| December 31, 2020 | $ | 58,211,000 | $ | 28,420,000 | $ | 0 | $ | 86,631,000 | ||||||||||
| December 31, 2020 (Tangible) | $ | 58,211,000 | $ | 28,420,000 | $ | 0 | $ | 86,631,000 | ||||||||||
| 5. | Pro Forma Assets | Before Conversion (5) |
Net Cash Proceeds |
Tax Benefit of Foundation |
After Conversion |
|||||||||||||
| December 31, 2020 | $ | 741,784,000 | $ | 28,420,000 | $ | 0 | $ | 770,204,000 | ||||||||||
(1) Includes ESOP purchases of 8.0% of the second step offering.
(2) Includes RRP purchases of 4.0% of the second step offering.
(3) ESOP amortized over 30 years, RRP amortized over 5 years, tax effected at: 29.50%
(4) Option valuation based on Black-Scholes model, 5 year vesting, and assuming 25% of the options are taxable.
(5) Adjusted to reflect consolidation and reinvestment of net MHC assets.
Exhibit IV-8
PRO FORMA EFFECT OF CONVERSION PROCEEDS
Magyar Bancorp, Inc.
At the Maximum of the Range
| 1. |
Fully Converted Value and Exchange Ratio |
| ||||||||||||||||
| Fully Converted Value |
|
$ | 70,980,680 | |||||||||||||||
| Exchange Ratio |
|
1.22134 | ||||||||||||||||
| 2nd Step Offering Proceeds |
|
$ | 39,100,000 | |||||||||||||||
| Less: Estimated Offering Expenses |
|
1,535,000 | ||||||||||||||||
|
|
|
|||||||||||||||||
| 2nd Step Net Conversion Proceeds |
|
$ | 37,565,000 | |||||||||||||||
| 2. |
Estimated Additional Income from Conversion Proceeds |
| ||||||||||||||||
| Net Conversion Proceeds |
|
$ | 37,565,000 | |||||||||||||||
| Less: Cash Contribution to Foundation |
|
0 | ||||||||||||||||
| Less: ESOP Stock Purchases (1) |
|
(3,128,000 | ) | |||||||||||||||
| Less: RRP Stock Purchases (2) |
|
(1,564,000 | ) | |||||||||||||||
|
|
|
|||||||||||||||||
| Net Cash Proceeds |
|
$ | 32,873,000 | |||||||||||||||
| Estimated after-tax net incremental rate of return |
|
0.25 | % | |||||||||||||||
|
|
|
|||||||||||||||||
| Earnings Increase |
|
$ | 83,432 | |||||||||||||||
| Less: Consolidated interest cost of ESOP borrowings |
|
0 | ||||||||||||||||
| Less: Amortization of ESOP borrowings(3) |
|
(73,508 | ) | |||||||||||||||
| Less: RRP Vesting (3) |
|
(220,524 | ) | |||||||||||||||
| Less: Option Plan Vesting (4) |
|
(229,612 | ) | |||||||||||||||
|
|
|
|||||||||||||||||
| Net Earnings Increase |
|
($ | 440,212 | ) | ||||||||||||||
| 3. | Pro Forma Earnings | Before Conversion(5) |
Net Earnings Increase |
After Conversion |
||||||||||||||
| 12 Months ended December 31, 2020 (reported) |
|
$ | 2,974,000 | ($ | 440,212 | ) | $ | 2,533,788 | ||||||||||
| 12 Months ended December 31, 2020 (core) |
|
$ | 2,875,000 | ($ | 440,212 | ) | $ | 2,434,788 | ||||||||||
| 4. | Pro Forma Net Worth | Before Conversion (5) |
Net Cash Proceeds |
Tax Benefit of Foundation |
After Conversion |
|||||||||||||
| December 31, 2020 | $ | 58,211,000 | $ | 32,873,000 | $ | 0 | $ | 91,084,000 | ||||||||||
| December 31, 2020 (Tangible) | $ | 58,211,000 | $ | 32,873,000 | $ | 0 | $ | 91,084,000 | ||||||||||
| 5. | Pro Forma Assets | Before Conversion (5) |
Net Cash Proceeds |
Tax Benefit of Foundation |
After Conversion |
|||||||||||||
| December 31, 2020 | $ | 741,784,000 | $ | 32,873,000 | $ | 0 | $ | 774,657,000 | ||||||||||
(1) Includes ESOP purchases of 8.0% of the second step offering.
(2) Includes RRP purchases of 4.0% of the second step offering.
(3) ESOP amortized over 30 years, RRP amortized over 5 years, tax effected at: 29.50%
(4) Option valuation based on Black-Scholes model, 5 year vesting, and assuming 25% of the options are taxable.
(5) Adjusted to reflect consolidation and reinvestment of net MHC assets.
EXHIBIT IV-9
Magyar Bancorp, Inc.
Minority Ownership Percentage Dilution
Exhibit IV-9
Magyar Bancorp, Inc.
Calculation of Minority Ownership Dilution in a Second-Step Offering
Stock Ownership Data as of December 31, 2020
Financial Data as of December 31, 2020
Reflects Pro Forma Market Value as of February 5, 2021
| Key Input Assumptions |
||||||
| Mid-Tier Stockholders’ Equity |
$ | 58,201,000 | (BOOK) | |||
| Aggregate Dividends Waived by MHC |
$ | 0 | (WAIVED DIVIDENDS) | |||
| Minority Ownership Interest |
44.9219 | % | (PCT) | |||
| Pro Forma Market Value |
$ | 61,722,000 | (VALUE) | |||
| Market Value of MHC Assets (Other than Stock in Mid-Tier) |
$ | 10,000 | (MHC ASSETS) | |||
| Adjustment for MHC Assets & Waived Dividends - 2 Step Calculation (as required by FDIC & FRB) | ||||||
|
(BOOK - WAIVED DIVIDENDS) x PCT | ||||||
| Step 1: To Account for Waiver of Dividends |
= | BOOK | ||||
| = | 44.9219% | |||||
|
(VALUE -MHC ASSETS) x Step 1 | ||||||
| Step 2: To Account for MHC Assets |
= | VALUE | ||||
| = | 44.9146% | |||||
| Current Ownership |
||||||||
| MHC Shares |
3,200,450 | 55.08 | % | |||||
| Public Shares |
2,610,296 | 44.92 | % | |||||
|
|
|
|
|
|||||
| Total Shares |
5,810,746 | 100.00 | % | |||||
EXHIBIT V-1
RP® Financial, LC.
Firm Qualifications Statement

FIRM QUALIFICATION STATEMENT
RP® Financial (“RP®) provides financial and management consulting, merger advisory and valuation services to the financial services industry nationwide. We offer a broad array of services, high quality and prompt service, hands-on involvement by principals and senior staff, careful structuring of strategic initiatives and sophisticated valuation and other analyses consistent with industry practices and regulatory requirements. Our staff maintains extensive background in financial and management consulting, valuation and investment banking. Our clients include commercial banks, thrifts, credit unions, mortgage companies, insurance companies and other financial services companies.
STRATEGIC PLANNING SERVICES
RP®’s strategic planning services are designed to provide effective feasible plans with quantifiable results. We analyze strategic options to enhance shareholder value, achieve regulatory approval or realize other objectives. Such services involve conducting situation analyses; establishing mission/vision statements, developing strategic goals and objectives; and identifying strategies to enhance franchise and/or market value, capital management, earnings enhancement, operational matters and organizational issues. Strategic recommendations typically focus on: capital formation and management, asset/liability targets, profitability, return on equity and stock pricing. Our proprietary financial simulation models provide the basis for evaluating the impact of various strategies and assessing their feasibility and compatibility with regulations.
MERGER ADVISORY SERVICES
RP®’s merger advisory services include targeting potential buyers and sellers, assessing acquisition merit, conducting due diligence, negotiating and structuring merger transactions, preparing merger business plans and financial simulations, rendering fairness opinions, preparing mark-to-market analyses, valuing intangible assets and supporting the implementation of post-acquisition strategies. Our merger advisory services involve transactions of financially healthy companies and failed bank deals. RP® is also expert in de novo charters and shelf charters. Through financial simulations, comprehensive data bases, valuation proficiency and regulatory familiarity, RP®’s merger advisory services center on enhancing shareholder returns.
VALUATION SERVICES
RP®’s extensive valuation practice includes bank and thrift mergers, thrift mutual-to-stock conversions, goodwill impairment, insurance company demutualizations, ESOPs, subsidiary companies, merger accounting and other purposes. We are highly experienced in performing appraisals which conform to regulatory guidelines and appraisal standards. RP® is the nation’s leading valuation firm for thrift mutual-to-stock conversions, with appraised values ranging up to $4 billion.
OTHER CONSULTING SERVICES
RP® offers other consulting services including evaluating the impact of regulatory changes, branching and diversification strategies, feasibility studies and special research. We assist banks/thrifts in preparing CRA plans and evaluating wealth management activities on a de novo or merger basis. Our other consulting services are facilitated by proprietary valuation and financial simulation models.
KEY PERSONNEL (Years of Relevant Experience & Contact Information)
| Ronald S. Riggins, Managing Director (41) |
(703) 647-6543 | rriggins@rpfinancial.com | ||
| William E. Pommerening, Managing Director (37) |
(703) 647-6546 | wpommerening@rpfinancial.com | ||
| James J. Oren, Director (34) |
(703) 647-6549 | joren@rpfinancial.com | ||
| James P. Hennessey, Director (35) |
(703) 647-6544 | jhennessey@rpfinancial.com | ||
| Gregory E. Dunn, Director (37) |
(703) 647-6548 | gdunn@rpfinancial.com |
| 1311-A Dolley Madison Boulevard |
Telephone: (703) 528-1700 | |||
| Suite 2A |
Fax No.: (703) 528-1788 | |||
| McLean, VA 22101 |
Toll-Free No.: (866) 723-0594 | |||
| www.rpfinancial.com |
E-Mail: mail@rpfinancial.com | |||