Attached files
| file | filename |
|---|---|
| EX-99.1 - EX-99.1 - TC Bancshares, Inc. | d882215dex991.htm |
| EX-99.2 - EX-99.2 - TC Bancshares, Inc. | d882215dex992.htm |
| EX-23.3 - EX-23.3 - TC Bancshares, Inc. | d882215dex233.htm |
| EX-23.2 - EX-23.2 - TC Bancshares, Inc. | d882215dex232.htm |
| EX-21 - EX-21 - TC Bancshares, Inc. | d882215dex21.htm |
| EX-16.1 - EX-16.1 - TC Bancshares, Inc. | d882215dex161.htm |
| EX-10.1 - EX-10.1 - TC Bancshares, Inc. | d882215dex101.htm |
| EX-8 - EX-8 - TC Bancshares, Inc. | d882215dex8.htm |
| EX-5 - EX-5 - TC Bancshares, Inc. | d882215dex5.htm |
| EX-4 - EX-4 - TC Bancshares, Inc. | d882215dex4.htm |
| EX-3.2 - EX-3.2 - TC Bancshares, Inc. | d882215dex32.htm |
| EX-3.1 - EX-3.1 - TC Bancshares, Inc. | d882215dex31.htm |
| EX-2 - EX-2 - TC Bancshares, Inc. | d882215dex2.htm |
| EX-1.1 - EX-1.1 - TC Bancshares, Inc. | d882215dex11.htm |
| S-1 - FORM S-1 - TC Bancshares, Inc. | d882215ds1.htm |
Exhibit 99.3
FELDMAN FINANCIAL ADVISORS, INC.
8804 MIRADOR PLACE
MCLEAN, VA 22102
(202) 467-6862
|
TC Federal Bank
Thomasville, Georgia
Conversion Valuation Appraisal Report
Valued as of February 26, 2021
Prepared By
Feldman Financial Advisors, Inc. McLean, Virginia
|
FELDMAN FINANCIAL ADVISORS, INC.
8804 MIRADOR PLACE
MCLEAN, VA 22102
(202) 467-6862
February 26, 2021
Board of Directors
TC Federal Bank
131 South Dawson Street
Thomasville, Georgia 31792
Members of the Board of Directors:
At your request, we have completed and hereby provide an independent appraisal (the “Appraisal”) of the estimated pro forma market value of TC Federal Bank (the “Bank”) as of February 26, 2021 in conjunction with the Bank’s conversion (the “Conversion”) from the mutual to stock form of organization, issuance of all of its capital stock to a newly formed stock holding company known as TC Bancshares, Inc. (the “Company”), and offering for sale of the Company’s common stock to eligible depositors and borrowers of the Bank, the Bank’s employee stock ownership plan, and certain members of the general public in a subscription and community offering (the “Stock Offering”). The Appraisal is furnished pursuant to the filing by the Bank of applications with respect to the Conversion and the Stock Offering with the Office of the Comptroller of the Currency, the Board of Governors of the Federal Reserve System, and the Georgia Department of Banking and Finance.
Feldman Financial Advisors, Inc. (“Feldman Financial”) is a financial consulting and advisory firm that specializes in valuations and analyses of business enterprises and securities in the thrift, banking, and mortgage industries. The background of Feldman Financial is presented in Exhibit I. In preparing the Appraisal, we conducted an analysis of the Bank that included discussions with the Bank’s management, the Bank’s legal counsel, Bryan Cave Leighton Paisner LLP, and the Bank’s independent registered public accounting firm, Wipfli, LLP. In addition, where appropriate, we considered information based on other available published sources that we believe are reliable; however, we cannot guarantee the accuracy and completeness of such information.
We also reviewed, among other factors, the economy in the Bank’s primary market area and compared the Bank’s financial condition and operating performance with that of selected publicly traded thrift institutions. We reviewed conditions in the securities markets in general and in the market for thrift institution common stocks in particular.
The Appraisal is based on the Bank’s representation that the information in the Conversion applications and additional evidence furnished to us by the Bank and its independent auditor are truthful, accurate, and complete. We did not independently verify the financial statements and other information provided by the Bank and its independent accounting firm, nor did we independently value the assets or liabilities of the Bank. The Appraisal considers the Bank only as a going concern and should not be considered as an indication of the liquidation value of the Bank.
FELDMAN FINANCIAL ADVISORS, INC.
Board of Directors
TC Federal Bank
February 26, 2021
Page Two
It is our opinion that, as of February 26, 2021, the estimated pro forma market value of the Bank was within a range (the “Valuation Range”) of $39,950,000 to $54,050,000 with a midpoint of $47,000,000. The Valuation Range was based upon a 15% decrease from the midpoint to determine the minimum and a 15% increase from the midpoint to establish the maximum. Assuming an additional 15% increase above the maximum value would result in an adjusted maximum of $62,157,500. Based on an initial offering price of $10.00 per share, the shares to be sold in the Stock Offering from a minimum of 3,995,000 shares to a maximum of 5,405,000 shares with an adjusted maximum of 6,215,750 shares.
Our Appraisal is not intended, and must not be construed, to be a recommendation of any kind as to the advisability of purchasing shares of common stock in the Stock Offering. Moreover, because the Appraisal is necessarily based upon estimates and projections of a number of matters, all of which are subject to change from time to time, no assurance can be given that persons who purchase shares of stock in the Stock Offering will thereafter be able to sell such shares at prices related to the foregoing estimate of the Bank’s pro forma market value. Feldman Financial is not a seller of securities within the meaning of any federal or state securities laws, and any report prepared by Feldman Financial shall not be used as an offer or solicitation with respect to the purchase or sale of any securities.
The Valuation Range reported herein will be updated as appropriate. These updates will consider, among other factors, any developments or changes in the Bank’s operating performance, financial condition, or management policies, and current conditions in the securities markets for thrift institution common stocks. Should any such new developments or changes be material, in our opinion, to the valuation of the Bank, appropriate adjustments to the estimated pro forma market value will be made. The reasons for any such adjustments will be explained in detail at that time.
| Respectfully submitted, |
| Feldman Financial Advisors, Inc. |
| /s/ Trent R. Feldman |
| Trent R. Feldman |
| President |
| /s/ Peter W. L. Williams |
| Peter W. L. Williams |
| Principal |
FELDMAN FINANCIAL ADVISORS, INC.
TABLE OF CONTENTS
| TAB |
PAGE | |||||
| INTRODUCTION |
1 | |||||
| I. |
CHAPTER ONE – BUSINESS OF TC FEDERAL BANK | |||||
| General Overview |
3 | |||||
| Financial Condition |
12 | |||||
| Income and Expense Trends |
24 | |||||
| Interest Rate Risk Management |
32 | |||||
| Asset Quality |
37 | |||||
| Office Facilities |
40 | |||||
| Market Area |
41 | |||||
| Summary Outlook |
56 | |||||
| II. |
CHAPTER TWO – COMPARISONS WITH PUBLICLY TRADED COMPANIES | |||||
| General Overview |
58 | |||||
| Selection Criteria |
59 | |||||
| Recent Financial Comparisons |
63 | |||||
| III. |
CHAPTER THREE – MARKET VALUE ADJUSTMENTS | |||||
| General Overview |
75 | |||||
| Earnings Prospects |
76 | |||||
| Financial Condition |
77 | |||||
| Market Area |
78 | |||||
| Management |
79 | |||||
| Dividend Payments |
80 | |||||
| Liquidity of the Issue |
81 | |||||
| Subscription Interest |
81 | |||||
| Recent Acquisition Activity |
83 | |||||
| Effect of Banking Regulations and Regulatory Reform |
83 | |||||
| Stock Market Conditions |
85 | |||||
| Adjustments Conclusion |
92 | |||||
| Valuation Approach |
92 | |||||
| Valuation Conclusion |
96 | |||||
| IV. |
APPENDIX – EXHIBITS | |||||
| I |
Background of Feldman Financial Advisors, Inc. |
I-1 | ||||
| II-1 |
Balance Sheets |
II-1 | ||||
| II-2 |
Income Statements |
II-2 | ||||
| II-3 |
Loan Portfolio Composition |
II-3 | ||||
| II-4 |
Net Lending Activity |
II-4 | ||||
| II-5 |
Cash and Investments Composition |
II-5 | ||||
| II-6 |
Deposit Account Composition |
II-6 | ||||
| II-7 |
Borrowed Funds Composition |
II-7 | ||||
| II-8 |
Office Properties |
II-8 | ||||
| III |
Financial and Market Data for All Public Thrifts |
III-1 | ||||
| IV-1 |
Pro Forma Assumptions for the Stock Offering |
IV-1 | ||||
| IV-2 |
Pro Forma Conversion Valuation Range |
IV-2 | ||||
| IV-3 |
Pro Forma Conversion Analysis at the Midpoint Value |
IV-3 | ||||
| IV-4 |
Comparative Valuation Ratio Analysis |
IV-4 | ||||
i
FELDMAN FINANCIAL ADVISORS, INC.
LIST OF TABLES
| TAB |
PAGE | |||||
| I. | CHAPTER ONE – BUSINESS OF TC FEDERAL BANK | |||||
| Table 1 | Selected Financial Condition Data | 12 | ||||
| Table 2 | Relative Balance Sheet Concentrations | 13 | ||||
| Table 3 | Income Statement Summary | 25 | ||||
| Table 4 | Income Statement Ratios | 26 | ||||
| Table 5 | Yield and Cost Summary | 27 | ||||
| Table 6 | Net Interest Income Sensitivity | 34 | ||||
| Table 7 | Economic Value of Equity | 35 | ||||
| Table 8 | Non-performing Asset Summary | 38 | ||||
| Table 9 | Allowance for Loan Losses | 39 | ||||
| Table 10 | Largest Employers in Thomas County, Georgia | 42 | ||||
| Table 11 | Largest Employers in Leon County, Florida | 44 | ||||
| Table 12 | Selected Demographic Data | 45 | ||||
| Table 13 | Total Employment Force | 47 | ||||
| Table 14 | Map of Office Network | 48 | ||||
| Table 15 | Branch Office Deposit Data | 49 | ||||
| Table 16 | Deposit Market Share in Thomas County and Leon County | 51 | ||||
| Table 17 | Residential Lending Share in Thomas County, Florida | 53 | ||||
| Table 18 | Residential Lending Share in Leon County, Florida | 54 | ||||
| Table 19 | Residential Lending Share in Chatham County, Georgia | 55 | ||||
| II. | CHAPTER TWO – COMPARISONS WITH PUBLICLY TRADED COMPANIES | |||||
| Table 20 | Comparative Group Operating Summary | 62 | ||||
| Table 21 | Key Financial Comparisons | 64 | ||||
| Table 22 | General Operating Characteristics | 70 | ||||
| Table 23 | Summary Financial Performance Ratios | 71 | ||||
| Table 24 | Income and Expense Analysis | 72 | ||||
| Table 25 | Balance Sheet Composition | 73 | ||||
| Table 26 | Growth Rates, Credit Risk, and Loan Composition | 74 | ||||
| III. | CHAPTER THREE – MARKET VALUE ADJUSTMENTS | |||||
| Table 27 | Selected Demographic Data of Primary Market Areas | 79 | ||||
| Table 28 | Summary of Recent Georgia and Florida Acquisition Activity | 84 | ||||
| Table 29 | Comparative One-Year Stock Index Performance | 88 | ||||
| Table 30 | Comparative Three-Year Stock Index Performance | 89 | ||||
| Table 31 | Summary of Standard Conversion Stock Offerings | 90 | ||||
| Table 32 | Comparative Pro Forma Market Valuation Analysis | 97 | ||||
ii
FELDMAN FINANCIAL ADVISORS, INC.
INTRODUCTION
At your request, we have completed and hereby provide an independent appraisal (the “Appraisal”) of the estimated pro forma market value of TC Federal Bank (the “Bank”) as of February 26, 2021 in conjunction with the Bank’s conversion (the “Conversion”) from the mutual to stock form of organization, issuance of all of its capital stock to a newly formed stock holding company known as TC Bancshares, Inc. (“TC Bancshares” or the “Company”), and offering for sale of the Company’s common stock to eligible depositors and borrowers of the Bank, the Bank’s employee stock ownership plan (“ESOP”), and certain members of the general public in a subscription and community offering (the “Stock Offering”). The Appraisal is furnished pursuant to the filing by the Bank of applications with respect to the Conversion and the Stock Offering with the Office of the Comptroller of the Currency (“OCC”), the Board of Governors of the Federal Reserve System (“Federal Reserve Board”), and the Georgia Department of Banking and Finance.
Feldman Financial Advisors, Inc. (“Feldman Financial”) is a financial consulting and advisory firm that specializes in financial valuations and analyses of business enterprises and securities in the thrift, banking, and mortgage industries. The background of Feldman Financial is presented in Exhibit I. In preparing the Appraisal, we conducted an analysis of the Bank that included discussions with the Bank’s management, the Bank’s legal counsel, Bryan Cave Leighton Paisner LLP, and the Bank’s independent registered public accounting firm, Wipfli, LLP. In addition, where appropriate, we considered information based on other available published sources that we believe are reliable; however, we cannot guarantee the accuracy and completeness of such information.
We also reviewed, among other factors, the economy in the Bank’s primary market area and compared the Bank’s financial condition and operating performance with that of selected
1
FELDMAN FINANCIAL ADVISORS, INC.
publicly traded thrift institutions. We reviewed conditions in the securities markets in general and in the market for thrift institution common stocks in particular.
Our Appraisal is not intended, and must not be construed, to be a recommendation of any kind as to the advisability of purchasing shares of common stock in the Stock Offering. Moreover, because the Appraisal is necessarily based upon estimates and projections of a number of matters, all of which are subject to change from time to time, no assurance can be given that persons who purchase shares of stock in the Stock Offering will thereafter be able to sell such shares at prices related to the foregoing estimate of the Bank’s pro forma market value. Feldman Financial is not a seller of securities within the meaning of any federal or state securities laws, and any report prepared by Feldman Financial shall not be used as an offer or solicitation with respect to the purchase or sale of any securities.
The Valuation Range reported herein will be updated as appropriate. These updates will consider, among other factors, any developments or changes in the Bank’s operating performance, financial condition, or management policies, and current conditions in the securities markets for thrift institution common stocks. Should any such new developments or changes be material, in our opinion, to the valuation of the Bank, appropriate adjustments to the estimated pro forma market value will be made. The reasons for any such adjustments will be explained in detail at that time.
2
FELDMAN FINANCIAL ADVISORS, INC.
I. BUSINESS OF TC FEDERAL BANK
General Overview
TC Federal Bank is a federally chartered mutual savings bank headquartered in Thomasville, Georgia. Thomas County Federal Savings & Loan Association was organized in 1934 and chartered in 1937 by the Federal Home Loan Bank Board as a mutual savings and loan association. Effective January 1, 2018, the Bank amended its corporate name to TC Federal Bank. The Bank conducts its business from its main office in Thomasville, Georgia, a branch office and a residential mortgage center in Tallahassee, Florida, and a commercial loan production office (“LPO”) in Savannah, Georgia. The Bank’s primary market area consists of Thomas County, Georgia and Leon County, Florida, and the surrounding counties.
The Bank’s business consists primarily of taking deposits from the general public and investing those deposits, together with funds generated from operations, in one- to four-family residential real estate loans, commercial and multi-family real estate loans, commercial business loans, construction and land loans, and consumer loans. The Bank expects to continue to focus on originating commercial real estate loans, commercial business loans, and construction loans. The Bank also invests in securities, which have historically consisted primarily of mortgage-backed securities issued by U.S. government-sponsored enterprises. In recent years, the Bank has originated single-family owner-occupied loans for sale into the secondary market and for its own portfolio. The Bank intends to continue this activity in the future in order to generate fee income. The Bank offers a variety of deposit accounts, including checking accounts, savings accounts, money market accounts, and certificates of deposit.
At December 31, 2020, the Bank had total assets of $349.9 million, total deposits of $294.1 million, and total equity of $39.9 million (measuring 11.39% of assets). The Bank reported net
3
FELDMAN FINANCIAL ADVISORS, INC.
income of approximately $308,000 for the year ended December 31, 2020. The Bank’s deposits are insured up to applicable limits by the Federal Deposit Insurance Corporation (“FDIC”). The Bank is subject to regulation, examination, and supervision primarily by the OCC and secondarily by the FDIC. The Bank is also a member of the Federal Home Loan Bank (“FHLB”) of Atlanta.
Historically, the Bank operated as a residential lender with a focus on managing growth and increasing its capital while relying heavily on certificate accounts as a funding source. At December 31, 1999, the Bank had total assets of $229.3 million and total equity of $29.1 million (12.70% of total assets), with residential mortgages composing approximately 72% of total loans. In the succeeding years, the Bank began to place more emphasis on diversifying its loan portfolio and increasing levels of commercial real estate, construction and development, and commercial business loans outstanding. By December 31, 2009, the Bank’s assets had expanded to $316.5 million, and its total equity had increased to $50.2 million (15.85% of total assets).
However, similar to many banks and thrifts operating in Georgia and Florida during the financial crisis (and other regions of the country as well), the Bank suffered a series of operating losses from 2010 to 2015 as a result of deteriorating asset quality. In an effort to protect its capital ratios, the Bank constricted its asset growth and turned its operating focus intently to resolving problem assets. Subsequently, its total assets declined to $246.4 million and total equity decreased to $29.9 million (12.14% of total assets) as of December 31, 2015. Following this period, the Bank’s asset quality stabilized and its capital erosion abated. Subsequently, the Bank returned to a position of expanding its balance sheet and pursuing selective growth opportunities.
In September 2017, TC Federal Bank opened a branch office in Tallahassee (Leon County), Florida. Leon County is adjacent to Thomas County and had long been a key lending market for the Bank. For several years prior to opening the branch office in Tallahassee, the Bank had
4
FELDMAN FINANCIAL ADVISORS, INC.
operated a loan office in the area. In an effort to enhance business development activity in the Tallahassee market and add depth to the management team, the Bank appointed Matt Brown as Tallahassee Market President in 2017. Mr. Brown has over 40 years of experience in serving financial institutions, including more than 20 years of executive officer leadership service to depository institutions. Also, during 2017, the Bank opened an LPO in Savannah, Georgia, where members of the management team had prior lending experience and the Bank recruited a commercial lender to serve that market specifically.
The Bank began to undertake an intensive review and analysis of its core operations in 2017, including efforts to improve profitability, enhance operating efficiency, revamp residential mortgage lending, upgrade its overall infrastructure, strengthen managerial proficiency, and reposition the Bank to serve broader customer segments of its market area. A rebranding of the Bank was considered necessary to facilitate geographic expansion beyond Thomas County into South Georgia and North Florida, and to reinforce marketing of the Bank’s product offerings beyond the traditional savings and loan model. The rebranding and name change to TC Federal Bank occurred during the first quarter of 2018.
TC Federal Bank has devoted considerable attention to improving the breadth and depth of its managerial team. In June 2018, the then-existing President and Chief Executive Officer (“CEO”) of the Bank resigned. In July 2018, Mr. Brown was promoted from Tallahassee Market President to serve as CEO of the Bank. Subsequently, Greg Eiford was named President and Senior Lending Officer of the Bank in August 2019, having served previously as Executive Vice President and Thomasville Market President since 2017 and Senior Lender since 2010. In December 2020, Mr. Brown retired from the Bank and Mr. Eiford assumed the additional position of CEO. Mr. Eiford has been employed with TC Federal Bank since October 2008 and has been
5
FELDMAN FINANCIAL ADVISORS, INC.
instrumental in managing numerous projects related to the Bank’s transition to a community bank platform. Linda Palmer was appointed Executive Vice President and Chief Financial Officer (“CFO”) of the Bank in May 2019. She previously served in a variety of leadership positions in community banks in her nearly 30-year career in community banking. Noel Ellis was named Executive Vice President and Chief Credit Officer in August 2016 and has served in the credit function at financial institutions for over 30 years. After beginning his career at the Bank in 2012 as a commercial lender and helping to establish the Tallahassee loan office, Nat Higdon was promoted to Tallahassee Market President in 2018. In January 2021, Mr. Higdon assumed the position of Executive Vice President and Senior Lending Officer.
The Bank has progressed significantly in recovering from its asset quality challenges of the prior decade. Its ratio of non-performing assets (excluding restructured loans) declined from 6.37% at December 31, 2014 to 0.59% at December 31, 2020. The Bank returned to profitable operations in 2015; however, the Bank’s core earnings have significantly lagged the industry’s level of profitability. In 2017 and 2018, the Bank benefited from income tax adjustments and the reversal of loan loss provisions to elevate reported earnings. The Bank’s historical operating focus on certificate accounts with limited transaction deposits contributed previously to its below-average net interest margin and below-average non-interest income levels. The Bank’s high efficiency ratio is reflective of its levels of above-average non-interest expense and below-average non-interest income.
In recent years, the Board of Directors (the “Board”) and senior management of TC Federal Bank have undertaken a thorough review of the Bank’s operations to identify opportunities for meaningful profit-improvement. In conjunction with revamping the senior management team, the Bank also utilized outside consultants to conduct an in-depth assessment of the Bank and
6
FELDMAN FINANCIAL ADVISORS, INC.
recommend a plan for earnings improvement and operating efficiency. The overall process was driven by the goal of transforming the Bank from a narrowly-focused thrift institution to a community banking organization capable of serving its markets in ways that would improve earnings and build loyalty with increased attention paid to retail banking, small businesses, and professionals.
Among the major initiatives that have been implemented in connection with the profit-improvement plan are (1) introducing a checking account marketing program to increase demand deposit accounts, fee income, and customer loyalty; (2) revamping residential mortgage lending and implementing a new loan origination software; (3) freezing the Bank’s pension plan and modifying certain other employee benefit and incentive plans; (4) outsourcing certain audit functions; (5) expanding lending activity through Small Business Administration (“SBA”) and U.S. Department of Agriculture (“USDA”) programs; (6) ensuring processes, policies, and procedures are in line with best practices, and (7) implementing plans to undertake a core system conversion from an outdated thrift system to a new and proven data processing platform that supports community banks. The core system conversion was completed in October 2020 and entailed a non-recurring expense of $1.1 million that impacted earnings for the year ended December 31, 2020.
The Bank believes that its community orientation is attractive to customers and distinguishes it from the larger banks that operate in the local market area. The Bank continues to stress high quality, personal customer service through an honest, straightforward, and upfront marketing approach and has developed a loyal customer base. The Bank relies on its experienced and committed staff to meet the needs of customers and effectively deliver banking products and services.
7
FELDMAN FINANCIAL ADVISORS, INC.
Going forward, the Bank’s operating goal is to provide long-term value to its stockholders, customers, employees, and the communities it serves by executing a prudent business strategy that produces increasing profitability. The Bank believes there is a significant opportunity for a community-focused bank to compete effectively in its primary market areas and that the increased capital it will have after the completion of the Stock Offering will facilitate this objective. The core elements of the Bank’s business strategy are outlined in more detail below:
| ● | Leverage the infrastructure of the Bank to create additional value for depositors, employees, customers, and the communities in which the Bank operates. The Bank seeks to improve its operating efficiency as it optimizes a new core processing system that was implemented in 2020 in order to enhance service features for both retail and business customers, and continue the process improvements implemented over the last two years. The Bank’s efficiency ratio improved from 100.8% in 2017 to 95.2% for 2018 and 85.9% for 2019, before regressing slightly to 91.2% in 2020 due to costs associated with the new core processing system. Based on the personnel and systems now in place, the Bank believes it can continue to improve its operational efficiency, particularly as it is able to utilize the capital raised in the Stock Offering and increase revenue. The Bank foresees the potential opportunity to add both an additional branch in Tallahassee, Florida and to expand its presence in the Savannah, Georgia market. |
| ● | Grow the loan portfolio prudently. The Bank intends to continue to maintain a diversified portfolio of loans, with an emphasis on commercial and multi-family real estate loans and residential mortgage loans. The capital raised in the Stock Offering will provide additional support for continued loan growth throughout the Bank’s market areas. The Bank also intends to seek to expand its commercial lending activities through government-sponsored loan programs, such as the SBA and USDA loan programs. Through its residential mortgage office in Tallahassee, the Bank will continue to seek to originate residential loans for its portfolio as well as for sale in the secondary market, using multiple correspondent relationships for the sale of residential mortgages on a servicing-released basis. |
| ● | Continue to increase core deposits. The Bank seeks to increase the proportion of the deposit base consisting of core deposits (non-certificate accounts) in order to provide a stable source of funds to support loan growth, at costs consistent with improving its net interest rate spread and margin. Historically, the Bank relied heavily on certificates of deposit, but recently has stressed the importance of building its core deposit base. As part of its focus on commercial loan growth, the Bank’s lenders are expected to source business checking accounts from borrowers. The Bank has begun reducing deposit costs to market |
8
FELDMAN FINANCIAL ADVISORS, INC.
| rates and placing greater emphasis on core deposits. As a result of these efforts and recognizing the impact of U.S. Government stimulus programs injecting liquidity and credit flow into the economy, core deposits increased by $42.3 million or 25.6% to $207.5 million at year-end 2020 from $165.2 million at year-end 2019. The Bank recently redesigned its checking account products and the related marketing program. Management will continue to emphasize the growth of both retail and commercial core deposits. |
| ● | Maintain credit standards while growing the balance sheet. The Bank believes strong asset quality is a critical key to its long-term financial success. The Bank’s strategy for credit risk management focuses on having an experienced team of credit professionals, well-defined policies and procedures, prudent loan underwriting criteria, and active credit monitoring. The Bank’s non-performing assets to total assets ratio was 0.59% at year-end 2020, 0.92% at year-end 2019, and 0.55% at year-end 2018. In anticipation of further growth, including as a result of the deployment of the capital raised in the Stock Offering, the Bank has invested in the enhancement of its credit function with experienced credit staff, upgraded internal and external credit review processes, and implemented new technology for underwriting processing and credit analysis. The Bank intends to maintain the high value of its credit culture, both in personnel as well as ancillary support systems, in order to be able to evaluate more complex loans and better manage credit risk, which will also support its intended loan growth, especially in the commercial loan market. |
| ● | Supplement organic growth through opportunistic bank or branch acquisitions. The Bank expects to consider acquisition opportunities that it believes would enhance the value of its franchise and yield potential financial benefits for its stockholders. The additional capital from the Stock Offering will provide the Bank the opportunity to acquire other institutions and financial services businesses located within reasonable proximity of its current market areas. The Bank believes that it is well positioned to take advantage of, and execute on, opportunities given the infrastructural improvements it has undertaken, including the upgrade of its core processing system and expanded management expertise. |
| ● | Enhance the sales, marketing, and service culture of the Bank. The Bank believes that loyalty is a key component of the success of community banks and intends to continue developing loyalty within its communities and from its customers. The Bank has emphasized creating a culture of accountability for its employee staff members, eliminating outdated and inefficient processes, raising employee capacity, expediting customer responsiveness, increasing customer retention and deposits, and enhancing fee income. The Bank believes that the new core processing system will allow it to improve the customer experience significantly and facilitate greater cross-selling opportunities. During 2021 and beyond, the Bank will continue to optimize the system for greater internal efficiencies and customer interactions and expand its digital banking capabilities. |
9
FELDMAN FINANCIAL ADVISORS, INC.
| ● | Expand the employee base to support future growth. The additional capital from the Stock Offering will provide the Bank with the ability to expand its employee base opportunistically. The Bank intends to continue to build depth and expertise as needed with increases in the Bank’s asset size and complexity. The potential to offer equity awards in the future following the Stock Offering will also allow the Bank to be more competitive when hiring and retaining experienced banking personnel. |
While its equity level is solid at 11.39% of total assets as of December 31, 2020, the Bank believes it must raise additional capital in order to facilitate its growth objectives and loan generation activity, and provide a greater cushion in response to the risk profile associated with continued expansion and future economic conditions. Over the past three years, the Bank’s total equity increased from $37.6 million at year-end 2017 to $39.9 million at year-end 2020. However, the ratio of total equity to assets declined from 13.76% at year-end 2017 to 11.39% at year-end 2020 as the Bank’s asset growth outpaced its capital formation, which in the Bank’s current mutual form of ownership is reliant primarily upon earnings generation. As a stock organization upon completion of the Conversion, the Bank will be organized in the ownership form used by commercial banks, most major businesses, and a large number of thrift institutions. The ability to raise new equity capital through the issuance and sale of capital stock will allow the Bank the flexibility to increase its equity capital position more rapidly than by accumulating earnings.
The Bank also believes that the ability to attract new capital also will help address the needs of the communities it serves and enhance its ability to expand or to make acquisitions. After the Conversion, the Bank will have an increased ability to merge with or acquire other financial institutions or business enterprises; however, there are no current arrangements, understandings, or agreements regarding any such acquisition opportunities. Finally, the Bank expects to benefit from its employees and directors having stock ownership in its business, since that is viewed as an
10
FELDMAN FINANCIAL ADVISORS, INC.
effective performance incentive and a means of attracting, retaining, and compensating employees and directors.
In summary, the Bank’s primary reasons for implementing the Conversion and undertaking the Stock Offering are to:
| ● | Increase the capital base to support future growth and profitability, although the Bank currently has capital well in excess of all applicable regulatory requirements. |
| ● | Compete more effectively in the financial services marketplace. |
| ● | Offer the Bank’s depositors, employees, management, and directors an equity ownership interest in TC Bancshares, the proposed stock holding company, and thereby an economic interest in the potential future success of the Bank and TC Bancshares. |
| ● | Attract and retain qualified personnel by establishing stock-based benefit plans. |
| ● | Increase the Bank’s flexibility to structure and finance the expansion of its operations, including potential acquisitions of other financial service businesses and establishing de novo branches or new loan production offices. |
The remainder of Chapter I examines in more detail the trends addressed in this section, including the impact of changes in TC Federal Bank’s economic and competitive environment, and recent strategic initiatives. The discussion is supplemented by the exhibits in the Appendix. Exhibit II-1 summarizes the Bank’s audited balance sheets as of December 31, 2018 to 2020. Exhibit II-2 presents the Bank’s audited income statements for the years ended December 31, 2018 to 2020.
11
FELDMAN FINANCIAL ADVISORS, INC.
Financial Condition
Table 1 presents selected data concerning the Bank’s financial position as of December 31, 2017 to 2020. Table 2 displays relative balance sheet concentrations as of similar year-end dates.
Table 1
Selected Financial Condition Data
As of December 31, 2017 to 2020
(Dollars in Thousands)
| December 31, | ||||||||||||||||
| 2020 | 2019 | 2018 | 2017 | |||||||||||||
| Total assets |
$ | 349,927 | $ | 321,762 | $ | 297,181 | $ | 273,412 | ||||||||
| Cash and cash equivalents (1) |
47,528 | 33,036 | 25,127 | 32,827 | ||||||||||||
| Investment securities available-for-sale |
15,917 | 22,107 | 27,114 | 21,500 | ||||||||||||
| Federal Home Loan Bank stock |
714 | 400 | 379 | 456 | ||||||||||||
| Total loans, net (2) |
265,301 | 246,399 | 235,321 | 210,109 | ||||||||||||
| Premises and equipment, net |
3,444 | 3,339 | 3,485 | 2,621 | ||||||||||||
| Bank-owned life insurance |
10,883 | 10,583 | - | - | ||||||||||||
| Total deposits |
294,100 | 273,604 | 250,348 | 224,096 | ||||||||||||
| Federal Home Loan Bank advances |
9,515 | 2,825 | 2,992 | 5,510 | ||||||||||||
|
Total equity |
39,858 | 39,788 | 38,019 | 37,609 | ||||||||||||
| (1) | Includes federal funds sold and certificates of deposit with other banks. |
| (2) | Includes mortgage loans held for sale. |
Source: TC Federal Bank, financial statements.
Asset Composition
The Bank’s total assets amounted to $349.9 million at December 31, 2020, reflecting an 8.8% or $28.1 million increase from total assets of $321.8 million at December 31, 2019. In the prior year, the Bank’s total assets increased by 8.3% or $24.6 million from $297.2 million at December 31, 2018 to $321.8 million at December 31, 2019. The recent expansion of total assets was primarily attributable to increases in the holdings of loans, cash and cash equivalents, and bank-owned life insurance (“BOLI”).
12
FELDMAN FINANCIAL ADVISORS, INC.
Table 2
Relative Balance Sheet Concentrations
As of December 31, 2017 to 2020
(Percent of Total Assets)
| December 31, | ||||||||||||||||||||||||||
| 2020 | 2019 | 2018 | 2017 | |||||||||||||||||||||||
| Cash and cash equivalents (1) |
13.58 | % | 10.27 | % | 8.46 | % | 12.01 | % | ||||||||||||||||||
| Investment securities available-for-sale |
4.55 | 6.87 | 9.12 | 7.86 | ||||||||||||||||||||||
| Federal Home Loan Bank stock |
0.20 | 0.12 | 0.13 | 0.17 | ||||||||||||||||||||||
| Total loans, net (2) |
75.82 | 76.58 | 79.18 | 76.85 | ||||||||||||||||||||||
| Premises and equipment, net |
0.98 | 1.04 | 1.17 | 0.96 | ||||||||||||||||||||||
| Bank-owned life insurance |
3.11 | 3.29 | - | - | ||||||||||||||||||||||
| Other assets |
1.75 | 1.83 | 1.94 | 2.16 | ||||||||||||||||||||||
|
|
|
|
|
|
|
|
|
|||||||||||||||||||
| Total assets |
100.00 | % | 100.00 | % | 100.00 | % | 100.00 | % | ||||||||||||||||||
|
|
|
|
|
|
|
|
|
|||||||||||||||||||
| Total deposits |
84.05 | % | 85.03 | % | 84.24 | % | 81.96 | % | ||||||||||||||||||
| Federal Home Loan Bank advances |
2.72 | 0.88 | 1.01 | 2.02 | ||||||||||||||||||||||
| Other liabilities |
1.84 | 1.72 | 1.96 | 2.27 | ||||||||||||||||||||||
|
|
|
|
|
|
|
|
|
|||||||||||||||||||
| Total liabilities |
88.61 | 87.63 | 87.21 | 86.24 | ||||||||||||||||||||||
| Total equity |
11.39 | 12.37 | 12.79 | 13.76 | ||||||||||||||||||||||
|
|
|
|
|
|
|
|
|
|||||||||||||||||||
| Total liabilities and equity |
100.00 | % | 100.00 | % | 100.00 | % | 100.00 | % | ||||||||||||||||||
|
|
|
|
|
|
|
|
|
|||||||||||||||||||
|
|
||||||||||||||||||||||||||
| (1) | Includes federal funds sold and certificates of deposit with other banks. |
| (2) | Includes mortgage loans held for sale. |
Source: TC Federal Bank, financial statements.
Net total loans (including loans held for sale) increased by 7.7% or $18.9 million from $246.4 million at year-end 2019 to $265.3 million at year-end 2020, spurred mainly by commercial business loans increasing $20.4 million from $9.2 million at year-end 2019 to $29.6 million at year-end 2020. In March 2020, Congress passed the Coronavirus Aid, Relief, and Economic Security Act (“CARES Act”) to provide economic relief for the country, including the Small Business Administration (“SBA”) Paycheck Protection Program (“PPP”) to fund short-term loans for small businesses. The Bank experienced significant growth in commercial business loans in 2020 due to the origination of $25.1 million in PPP loans. The Bank had $17.9 million of PPP
13
FELDMAN FINANCIAL ADVISORS, INC.
loans outstanding as of December 31, 2020. PPP loans originated by the Bank in 2020 generally have a term of two years or five years and earn interest at 1.0% plus fees. PPP loans are expected to primarily be repaid via forgiveness provisions (under the CARES Act) from the SBA. These loans are fully guaranteed as to principal and interest by the SBA.
The balance sheet value of BOLI increased from zero at year-end 2018 to $10.6 million at December 31, 2019 and $10.9 million at December 31, 2020. In connection with adopting Supplemental Executive Retirement Plans (“SERPs”) for certain of its officers as a result of freezing the pension plan, the Bank purchased single-premium BOLI during 2019 to fund the benefit obligations created by the SERPs. The cash surrender value of these policies was $10.9 million as of December 31, 2020.
Largely as a result of the increase in and cash and cash equivalents and BOLI, the ratio of net total loans to total assets declined from 79.2% at December 31, 2018 to 75.8% at December 31, 2020. Cash and cash equivalents increased from $25.1 million at December 31, 2018 to $47.5 million at December 31, 2020, reflecting a buildup of liquidity from deposit inflows. Total deposits increased from $250.3 million at December 31, 2018 to $294.1 million at December 31, 2020, largely as a result of the Bank emphasizing core deposit growth. In addition, core deposits were elevated by PPP loan funds and other stimulus liquidity deposited into customer accounts. Total deposits increased by 9.3% or $23.3 million from $250.3 million at year-end 2018 to $273.6 million at year-end 2019, and then increased by 7.5% or $17.5 million to $294.1 million at year-end 2020. The Bank’s ratio of net total loans to total deposits decreased from 94.0% at December 31, 2018 to 90.2% at December 31, 2020.
Lending is the principal business activity of the Bank, and its loan portfolio constitutes the largest portion of its assets and is the predominant source of its income. The largest segment of
14
FELDMAN FINANCIAL ADVISORS, INC.
the Bank’s loan portfolio comprises real estate mortgage loans, consisting primarily of residential mortgage loans, commercial real estate and multi-family mortgage loans, and construction and land development loans. The Bank’s collateralized real estate loans are overwhelmingly secured by properties located in the Bank’s primary lending markets and other nearby areas.
The Bank’s primary lending market is Thomas County, Georgia, and the adjacent Georgia counties of Grady, Colquitt, Brooks, and Mitchell. In Florida, the Bank’s primary market area includes Leon County and the adjacent Florida counties of Gadsden, Wakulla, Jefferson, and Liberty. The Bank’s lending market also includes Chatham County, Georgia, where it operates an LPO in Savannah, and the adjacent Georgia counties of Liberty, Bryan, and Effingham along with the Hilton Head Island-Bluffton-Beaufort metropolitan area in South Carolina.
As presented in Exhibit II-3, the Bank’s current loan portfolio is composed mainly of real estate loans. At December 31, 2020, real estate loans comprised $232.6 million or 86.9% of the gross loan portfolio and consisted of residential loans (including one- to four-family mortgages and home equity lines of credit) and non-residential real estate loans (comprising loans secured by commercial and multi-family real estate and construction and land development loans). Non-real estate loans chiefly comprised commercial business loans and a limited amount of consumer loans. Along with residential lending, the Bank intends to continue to emphasize commercial real estate, commercial business, and construction lending in an effort to diversify its overall loan portfolio, increase the overall yield earned on loans, and assist in managing interest rate risk.
Exhibit II-4 details the Bank’s recent lending activity for its own portfolio. For the year ended December 31, 2020, the Bank originated $86.0 million of loans for portfolio, including $29.8 million of commercial business loans, $21.3 million of residential mortgages, and $19.7 million of commercial and multi-family real estate loans. For the year ended December 31, 2019,
15
FELDMAN FINANCIAL ADVISORS, INC.
the Bank originated $51.9 million of loans, including $17.6 million of commercial and multi-family real estate loans, $16.6 million of residential mortgages, and $11.0 million of construction and land loans. In addition to orginating loans for its own portfolio, the Bank also originates loan for sale to generate fee income. During 2020, the Bank sold $65.6 million of residential mortgage loans, all on a servicing-released basis, and generated $1.2 million in gains on sale of loans. This level of mortgage banking activity reflected an increase from $20.7 million of residential mortgage loan sales in 2019, which resulted in $380,000 in gains on sale of loans.
At December 31, 2020, the Bank had $105.8 million in residential mortgage loans, which represented 39.6% of total loans. Of the $105.8 million, $39.0 million consisted of non-owner occupied mortgage loans with the remaining $66.8 million in owner-occupied loans. Residential loans decreased by 3.4% or $3.8 million in 2020 after decreasing by 5.2% or $6.0 million in 2019. As noted above, the Bank has also originated single-family, owner-occupied residential loans for sale in the secondary market and it intends to continue this activity to generate fee income. Adjustable-rate loans comprise a majority of the residential mortgage loans in portfolio. Currently, the Bank generally only originates fixed-rate, owner-occupied residential mortgages for sale into the secondary market. The Bank’s residential real estate loans typically have terms of up to 30 years and are generally underwritten pursuant to Fannie Mae documentation guidelines.
The Bank generally limits the loan-to-value (“LTV”) ratios of its residential mortgage loans to 85% of the purchase price or appraised value, whichever is lower. In addition, the Bank occasionally makes residential mortgage loans with LTV ratios in excess of 85% of the purchase price or appraised value, whichever is less, if the borrower obtains private mortgage insurance. The Bank’s adjustable-rate residential mortgage loans typically have fixed interest rate periods for five to ten years and then adjust annually with amortization terms of up to 30 years. The Bank
16
FELDMAN FINANCIAL ADVISORS, INC.
does not offer “interest only” mortgage loans on permanent residential mortgage loans, and also does not offer residential mortgage loans that provide for negative amortization of principal or contain any other subprime loan characteristics.
At December 31, 2020, the Bank had $87.9 million in commercial real estate and multi-family real estate loans, which represented 32.8% of its total loan portfolio. Of this aggregate total, the Bank’s commercial real estate loans amounted to $72.7 million and multi-family real estate loans amounted to $15.1 million at year-end 2020. The Bank’s commercial real estate lending activity is consistent with its strategy to diversify the loan portfolio and increase the overall portfolio yield. The Bank’s commercial real estate loans are secured by a variety of properties in the Bank’s market areas, including office buildings, farms, retail and mixed-use properties, churches, warehouses, and restaurants. The Bank’s multi-family real estate loans are secured by apartment buildings, mobile home parks, and other multi-family properties. The Bank’s commercial real estate loans are generally originated as balloon loans with an initial term of five to seven years and a 20-year amortization period, although the Bank does originate loans that fully amortize over 20 years with certain financial covenants. The maximum LTV ratio of the Bank’s commercial real estate loans is generally 80%.
The Bank’s commercial real estate loans (including multi-family loans) increased from $71.0 million (33.2% of gross total loans) at year-end 2017 to $90.4 million (37.9%) at year-end 2018 and $95.2 million (38.3%) at year-end 2019, before decreasing to $87.9 million (32.8%) at year-end 2020. Four years ago, the Bank initiated a policy to manage concentration risk, whereas it would limit its total exposure to a single parcel of collateral property to $3.0 million and its aggregate debt exposure to related entities to $5.0 million. The Bank has a few legacy loans outstanding that exceed these current limits, and one loan has been originated that exceeded the
17
FELDMAN FINANCIAL ADVISORS, INC.
limit to an individual property since implementation of the current policy. This loan is an SBA loan that carries an LTV ratio of less than 55%.
At December 31, 2020, the Bank had $30.0 million in construction and land development loans, which represented 11.2% of its overall loan portfolio, and included $5.0 million in land loans. Construction and development loans increased from $18.2 million at year-end 2018 to $23.4 million at year-end 2019 and $30.0 million at year-end 2020. These loans consist primarily of loans to individuals for the construction of their primary or secondary residences or commercial structures, as well as loans to contractors and builders of single-family homes. The Bank also makes a limited amount of land loans to complement its construction lending activities, as such loans are generally secured by lots that will be used for residential development. The Bank also originates construction loans for commercial development projects, including retail buildings, churches, small industrial facilities, hotels, and office buildings. Most of the Bank’s construction loans are interest-only loans that provide for the payment of interest during the construction phase, which is usually up to 12 months. At the end of the construction phase, the loan may convert to a permanent mortgage loan or the loan may be repaid in full.
At December 31, 2020, the Bank had $29.6 million in commercial business loans, which represented 11.1% of its total loan portfolio. Commercial business loans outstanding have increased from $2.3 million, $3.7 million, $7.7 million, $7.5 million, and $9.2 million at year-end 2015, 2016, 2017, 2018, and 2019, respectively. The Bank’s commercial business loans include loans to a variety of professionals, sole proprietorships, and small businesses operating in the Bank’s market area. As noted previously, the expansion of the commercial business loan portfolio in 2020 was driven by the origination of PPP loans. The Bank originated $25.1 million of PPP loans during 2020 and had $17.9 million of PPP loans outstanding as of December 31, 2020.
18
FELDMAN FINANCIAL ADVISORS, INC.
As part of its relationship-driven focus, the Bank encourages its commercial borrowers to maintain their primary deposit accounts with the Bank, which helps to improve the Bank’s overall interest rate spread. The Bank’s commercial business loans include term loans and revolving lines of credit and are made with either adjustable or fixed rates of interest. Adjustable interest rates are based on the prime rate or the U.S Treasury constant maturity rate, plus a margin. Commercial business loans are generally secured by business assets of the respective borrowers, and the bank may support this collateral with junior liens on real property. Depending on the collateral used to secure the loans, commercial business loans are made in amounts of up to 75% of the collateral securing the loans.
The Bank had $8.9 million of home equity loans and lines of credit as of December 31, 2020, representing 3.3% of total loans. The Bank offers home equity loans and lines of credit, which are multi-purpose loans used to finance various home or personal needs, where a primary or secondary residence serves as collateral. The Bank’s home equity lines of credit either feature a 10-year term with an interest-only option or a 15-year term that requires a principal payment of 1% of the outstanding balance plus interest. These loans are limited mainly to being collateralized by borrowers’ personal primary residences and to those customers who reside within the Bank’s primary market area with acceptable credit ratings. These loans can be secured either by a first or second lien position. Home equity lines of credit are tied to the prime rate. A conversion option allows for the borrower to convert to a fixed-rate, fully amortizing loan with a 10-year term.
At December 31, 2020, the Bank’s consumer loans amounted to $5.4 million, representing 2.0% of total loans. The Bank offers a limited range of consumer loans, principally to customers residing in its primary market areas who maintain other relationships with the Bank and have
19
FELDMAN FINANCIAL ADVISORS, INC.
acceptable credit ratings. The Bank’s consumer loans generally consist of loans secured by deposit accounts, loans on new and used automobiles, and unsecured personal loans.
Exhibit II-5 presents a summary of the Bank’s portfolio of cash, liquidity, and investments as of December 31, 2018 to 2020. The Bank’s primary investment objectives include the following: (1) provide and maintain liquidity to meet deposit withdrawal and loan funding needs; (2) help mitigate interest rate and market risk; (3) diversify the Bank’s assets; (4) provide collateral for pledging requirements, and (5) generate a reasonable rate of return on funds within the context of the Bank’s interest rate and credit risk objectives.
The Bank’s Board of Directors is responsible for adopting and reviewing annually the investment policy of TC Federal Bank. The Bank’s Asset/Liability Management Committee (“ALCO”) is responsible for implementing the Bank’s investment policy. The Bank’s ALCO consists of the President/CEO, CFO, Chief Credit Officer, members of the Board, and other members of senior management. The Bank’s CFO, or designee as approved by the ALCO, acts as the Bank’s investment manager and is responsible for executing portfolio strategy as set by the ALCO. All of the Bank’s investment securities are currently classified as available-for-sale.
The Bank implemented a securities portfolio restructuring during 2019 in an effort to improve investment returns across changing interest rate cycles. The Bank had sales of investment securities for total proceeds of approximately $10.9 million, resulting in gains on sale of $67,000. Collateralized mortgage obligations were added to the investment portfolio in 2019 and amounted to $9.7 million at year-end 2019 and $9.1 million at year-end 2020.
At December 31, 2020, the Bank’s cash and investments amounted to $55.5 million or 17.3% of total assets. Cash and cash equivalents (including federal funds sold and certificates of deposit in other financial institutions) amounted to $47.5 million or 74.1% of the Bank’s total cash
20
FELDMAN FINANCIAL ADVISORS, INC.
and investments as of December 31, 2020. Cash and cash equivalents increased by $14.5 million from year-end 2019 to year-end 2020, largely resulting from the buildup of liquidity related to increased customer deposit inflows. The Bank’s available-for-sale securities portfolio totaled $15.9 million at December 31, 2020 and was composed of $15.4 million in U.S. Government-sponsored enterprises obligations (including residential mortgage-backed securities and collateralized mortgage obligations) and $501,000 in corporate debt obligations. The Bank’s available-for-sale investment securities portfolio had a weighted average yield of 1.70% at December 31, 2020. The Bank also owned $714,000 of stock in the FHLB of Atlanta as of December 31, 2020.
Liability Composition
Deposits are the Bank’s primary external source of funds for lending and other investment purposes. The Bank has also utilized borrowings to supplement deposits as a funding source. Exhibit II-6 presents a summary of the Bank’s deposit composition as of December 31, 2018 to 2020. Total deposits amounted to $294.1 million or 84.0% of total assets and 94.9% of total liabilities at December 31, 2020. Total deposits increased by 7.5% or $20.5 million from $273.6 million at December 31, 2019 to $294.1 million at December 31, 2020. Recent deposit growth has largely been concentrated in the Bank’s interest-bearing checking accounts and savings accounts. The Bank’s recent deposit expansion has been accelerated by the establishment of its Tallahassee branch office (which opened in September 2017), the emphasis on core deposit accounts, and the inflow of PPP loan proceeds and Government stimulus-related liquidity into customer accounts.
TC Federal Bank relies on personalized customer service, longstanding relationships with customers, and the favorable image of the Bank in its primary market area to attract and retain deposits. Deposit account terms vary according to the minimum balance required, the time period
21
FELDMAN FINANCIAL ADVISORS, INC.
that funds must remain on deposit, and the interest rate, among other factors. In determining the rates and terms of its deposit accounts, the Bank considers the rates offered by competitors, liquidity needs, growth objectives, current operating strategies, and customer preferences and concerns. The Bank’s deposit pricing strategy has generally been to offer competitive rates, while generally not providing the highest rates in the market.
The Bank has placed a concerted emphasis on attracting core (non-certificate) deposit accounts, which tend to represent lower cost and more stable funding sources. Core deposits composed 70.6% or $207.5 million of total deposits at December 31, 2020, which reflected an increase from 52.2% of total deposits or $106.0 million at December 31, 2015. In 2020, the Bank’s weighted average cost of interest-bearing core deposits was 0.48%, the weighted average cost of certificate accounts was 1.53%, and the overall weighted average cost of interest-bearing deposits was 0.80%, reflecting a decline from the corresponding overall cost of 1.16% in 2019.
As a member of the FHLB of Atlanta, the Bank may obtain FHLB borrowings based upon the security of FHLB capital stock owned and certain of the Bank’s real estate mortgage loans. The Bank uses FHLB advances to provide short-term or intermediate-term funding as a supplement to its deposits. As of December 31, 2020, the Bank had $9.5 million in FHLB advances outstanding, which amounted to 2.7% of total assets. The Bank had approximately $19.2 million in available borrowing capacity from the FHLB of Atlanta at December 31, 2020. The Bank could access additional advances if it purchased additional FHLB of Atlanta capital stock. The Bank also had available borrowing capacity through the Federal Reserve Bank of Atlanta and for overnight borrowing under unsecured federal funds lines of credit through correspondent banks. There were no outstanding borrowings against these credit facilities as of December 31, 2020.
22
FELDMAN FINANCIAL ADVISORS, INC.
Equity Capital
The Bank has historically maintained solid capital levels. The Bank’s total equity amounted to $39.9 million or 11.39% of total assets at December 31, 2020. The total equity to assets ratio decreased from 13.76% at December 31, 2017 to 11.39% at December 31, 2020 as the rate of asset expansion outpaced the rate of capital formation. Over the three-year period from December 31, 2017 to December 31, 2020, the Bank’s total equity increased at a compound annual growth rate of 1.3%, while its total assets increased by a compound annual growth rate of 8.5%.
The Bank’s equity capital increased by $70,000 or 0.2% from $39.8 million at year-end 2019 to $39.9 million at year-end 2020. Retained earnings of $308,000 added to the Bank’s equity for the year ended December 31, 2020. However, the Bank’s accumulated other comprehensive income (“AOCI”) declined by $238,000 during 2020. The Bank’s AOCI is affected mainly by unrealized gains or losses on available-for-sale securities and changes in post-retirement benefit obligations. The Bank’s equity increased by $331,000 due to increases in unrealized gains but was reduced by $569,000 due to changes in the funded status of post-retirement benefit obligations.
The Bank’s capital level remains strong in comparison to minimum regulatory requirements. The Bank’s regulatory capital ratios of tier 1 leverage capital, common equity tier 1 risk-based capital, tier 1 risk-based capital, and total risk-based capital were 11.73%, 16.47%, 16.47%, and 17.72%, respectively, as of December 31, 2019. In comparison, the minimum regulatory requirements under federal banking agency guidelines were 4.00%, 4.50%, 6.00%, and 8.00%, and the threshold requirements for regulatory “well capitalized” levels under prompt corrective action provisions were 5.00%, 6.50%, 8.00%, and 10.00%, respectively. Based on these regulatory capital ratios and requirements, the Bank was considered well capitalized for regulatory purposes as of December 31, 2020.
23
FELDMAN FINANCIAL ADVISORS, INC.
Income and Expense Trends
Table 3 displays the main components of the Bank’s earnings performance for the years ended December 31, 2018 to 2020. Table 4 displays the Bank’s principal income and expense ratios as a percent of average assets for the corresponding periods. Table 5 displays the Bank’s weighted average yields on interest-earning assets and weighted average costs of interest-bearing liabilities for the years ended December 31, 2018 to 2020.
General Overview
Over recent years, the Bank has exhibited a record of low to moderate profitability from core operations (excluding non-recurring items). The Bank’s net income amounted to $308,000 for 2020, $1.2 million for 2019, and $679,000 in 2018. The Bank reported a return on average assets (“ROA”) of 0.24%, 0.39%, and 0.09% for 2018, 2019, and 2020, respectively. The Bank reported a return on average equity (“ROE”) of 1.80%, 3.06%, and 0.76% for 2018, 2019, and 2020, respectively. The Bank’s profitability in 2020 was impacted by several non-recurring items, including data processing conversion costs and expenses associated with a delayed capital offering.
Compared to its asset size peer group of federally insured savings institutions, the Bank’s ROA of 0.24% in 2018 lagged the corresponding peer group average of 0.60% and its ROA of 0.39% in 2019 trailed the peer group average of 0.71%. Similarly, the Bank’s ROA of 0.09% in 2020 was below the peer group average of 0.66%. Compared to its regulatory peer group on a historical basis, the Bank’s profitability trends can be characterized by below-average non-interest income ratios and above-average non-interest expense ratios. However, the Bank’s net interest margin in 2020 at 3.38% exceeded the peer group average of 3.02%. While the peer group experienced a decline in its average net interest margin in recent years, the Bank has been able to reverse this trend by generating steady asset growth and increasing its core deposit base.
24
FELDMAN FINANCIAL ADVISORS, INC.
Table 3
Income Statement Summary
For the Years Ended December 31, 2018 to 2020
(Dollars in Thousands)
| Year Ended December 31, | |||||||||||||||
| 2020 | 2019 | 2018 | |||||||||||||
| Interest income |
$ | 13,088 | $ | 12,556 | $ | 11,374 | |||||||||
| Interest expense |
2,365 | 3,101 | 2,110 | ||||||||||||
|
|
|
|
|
|
|
||||||||||
| Net interest income |
10,723 | 9,455 | 9,264 | ||||||||||||
| Provision for (reduction in) loan losses |
780 | - | (551 | ) | |||||||||||
|
|
|
|
|
|
|
||||||||||
| Net interest income after provision |
9,943 | 9,455 | 9,815 | ||||||||||||
| Service charges on deposit account |
472 | 513 | 420 | ||||||||||||
| Gain on sale of mortgage loans |
1,236 | 380 | 187 | ||||||||||||
| Gain on sale of available-for-sale securities |
- | 67 | - | ||||||||||||
| Other income |
323 | 300 | - | ||||||||||||
|
|
|
|
|
|
|
||||||||||
| Total non-interest income |
2,031 | 1,260 | 607 | ||||||||||||
| Salaries and employee benefits |
6,444 | 5,327 | 5,499 | ||||||||||||
| Occupany equipment |
754 | 658 | 629 | ||||||||||||
| Other real estate owned expense, net |
(13 | ) | 11 | (4 | ) | ||||||||||
| Data processing conversion costs |
1,132 | - | - | ||||||||||||
| Expenses of delayed stock offering |
506 | - | - | ||||||||||||
| Other expense |
2,803 | 3,145 | 3,271 | ||||||||||||
|
|
|
|
|
|
|
||||||||||
| Total non-interest income |
11,626 | 9,141 | 9,395 | ||||||||||||
| Income before income taxes |
348 | 1,574 | 1,027 | ||||||||||||
| Income tax expense |
40 | 367 | 348 | ||||||||||||
|
|
|
|
|
|
|
||||||||||
| Net income |
$ | 308 | $ | 1,207 | $ | 679 | |||||||||
|
|
|
|
|
|
|
||||||||||
Source: TC Federal Bank, financial statements.
Years Ended December 31, 2019 and 2020
Net income declined to $308,000 in 2020 from $1.2 million in 2019, a decrease of $899,000 or 74.5%. The decrease was caused by increases of $2.5 million in non-interest expense and $780,000 in the loan loss provision, offset partially by increases of $1.3 million in net interest income and $771,000 in non-interest income. Net interest income increased from $9.5 million in 2019 to $10.7 million in 2020, due mainly to an increase in interest-earning assets in 2020 and an increase in the net interest spread from 3.07% in 2019 to 3.23% in 2020. The yield on interest-earning assets declined by 20 basis points from 4.32% in 2019 to 4.12% in 2020, while, the cost of interest-bearing liabilities declined by 36 basis points from 1.25% in 2019 to 0.89% in 2020.
25
FELDMAN FINANCIAL ADVISORS, INC.
Table 4
Income Statement Ratios
For the Years Ended December 31, 2018 to 2020
(Percent of Average Assets)
| Year Ended December 31, | ||||||||||||||||||
| 2020 | 2019 | 2018 | ||||||||||||||||
| Interest income |
3.90 | % | 4.11 | % | 4.01 | % | ||||||||||||
| Interest expense |
0.70 | 1.00 | 0.74 | |||||||||||||||
|
|
|
|
|
|
|
|||||||||||||
| Net interest income |
3.19 | 3.09 | 3.26 | |||||||||||||||
| Provision for (reduction in) loan losses |
0.23 | 0.00 | (0.19 | ) | ||||||||||||||
|
|
|
|
|
|
|
|||||||||||||
| Net interest income after provision |
2.96 | 3.09 | 3.46 | |||||||||||||||
| Service charges on deposit account |
0.14 | 0.17 | 0.15 | |||||||||||||||
| Gain on sale of mortgage loans |
0.37 | 0.12 | 0.07 | |||||||||||||||
| Gain on sale of available-for-sale securities |
- | 0.02 | - | |||||||||||||||
| Other income |
0.10 | 0.10 | 0.00 | |||||||||||||||
|
|
|
|
|
|
|
|||||||||||||
| Total non-interest income |
0.60 | 0.41 | 0.21 | |||||||||||||||
| Salaries and employee benefits |
1.92 | 1.74 | 1.94 | |||||||||||||||
| Occupany equipment |
0.22 | 0.22 | 0.22 | |||||||||||||||
| Other real estate owned expense, net |
(0.00 | ) | 0.00 | (0.00 | ) | |||||||||||||
| Data processing conversion costs |
0.34 | - | - | |||||||||||||||
| Expenses of delayed stock offering |
0.15 | - | - | |||||||||||||||
| Other expense |
0.83 | 1.03 | 1.15 | |||||||||||||||
|
|
|
|
|
|
|
|||||||||||||
| Total non-interest income |
3.46 | 2.99 | 3.31 | |||||||||||||||
| Income before income taxes |
0.10 | 0.50 | 0.36 | |||||||||||||||
| Income tax expense |
0.01 | 0.12 | 0.12 | |||||||||||||||
|
|
|
|
|
|
|
|||||||||||||
| Net income |
0.09 | 0.39 | 0.24 | |||||||||||||||
|
|
|
|
|
|
|
|||||||||||||
Source: TC Federal Bank, financial statements; Feldman Financial calculations.
The provision for loan losses was increased from zero in 2019 to $780,000 for 2020. The Bank’s ratio of non-performing assets to total assets declined from 0.92% at December 31, 2019 to 0.59% at December 31, 2020. The Bank increased the provision in 2020 to reflect the continued growth of the loan portfolio along with the uncertain economic impact of the coronavirus pandemic. The allowance for loan losses increased from $3.1 million at December 31, 2019 to $4.1 million at December 31, 2020. The ratio of the allowance for loan losses to gross total loans (including loans held for sale) increased from 1.23% at year-end 2019 to 1.51% at year-end 2020. The Bank incurred net loan charge-offs of $121,000 in 2019, and realized net recoveries of $241,000 for 2020.
26
FELDMAN FINANCIAL ADVISORS, INC.
Table 5
Yield and Cost Summary
For the Years Ended December 31, 2018 to 2020
| Year Ended December 31, |
||||||||||||
| 2020 | 2019 | 2018 | ||||||||||
| Weighted Average Yields |
||||||||||||
| Loans receivable |
4.61 | % | 4.69 | 4.57 | % | |||||||
| Investment securities |
2.09 | 2.95 | 3.07 | |||||||||
| Interest-earning deposits |
0.92 | 1.87 | 1.28 | |||||||||
| Other interest-earning assets |
4.62 | 6.33 | 6.62 | |||||||||
| Total interest-earning assets |
4.12 | 4.32 | 4.11 | |||||||||
| Weighted Average Costs |
||||||||||||
| Savings and money market accounts |
0.63 | 0.99 | 0.79 | |||||||||
| Interest-bearing checking accounts |
0.07 | 0.24 | 0.18 | |||||||||
| Certificates of deposit |
1.53 | 1.82 | 1.24 | |||||||||
| Total interest-bearing deposits |
0.88 | 1.24 | 0.90 | |||||||||
| Borrowed funds |
1.14 | 2.48 | 2.61 | |||||||||
| Total interest-bearing liabilities |
0.89 | 1.25 | 0.92 | |||||||||
| Net interest rate spread (1) |
3.23 | 3.07 | 3.19 | |||||||||
| Net interest margin (2) |
3.38 | 3.26 | 3.35 | |||||||||
| (1) | Weighted average yield on interest-earning assets less the weighted average cost of interest-bearing liabilities. |
| (2) | Net interest income divided by average total interest-earning assets. |
Source: TC Federal Bank, financial data.
The Bank’s non-interest income primarily comprises service charges on deposit accounts, gains on sale of mortgage loans, gains on sale of securities, and BOLI income. The Bank’s non-interest income increased by $771,000 or 61.2% from $1.3 million in 2019 to $2.0 million in 2020. Gains on sale of securities decreased from $67,000 in 2019 to zero in 2020. BOLI income increased moderately by 1.7% from $296,000 in 2019 to $301,000 in 2020. As a result of the increased level of non-interest income, the ratio of non-interest income to average assets increased from 0.41% in 2019 to 0.60% for 2020.
27
FELDMAN FINANCIAL ADVISORS, INC.
Non-interest expense increased by $2.5 million or 27.2% from $9.1 million in 2019 to $11.6 million in 2020. The significant increase was due primarily to the impact of non-recurring items. The Bank experienced $1.1 million in expenses related to the conversion of the Bank’s core data processor to a new system. In addition, the Bank recognized $506,000 in previously deferred expenses associated with its delayed capital offering. In February 2020, the Bank adopted plans to pursue a minority stock offering under a mutual holding company structure. Due to market conditions being impacted by the coronavirus pandemic, the Bank decided to delay implementation of its capital until later in 2020 or 2021. Ultimately, the Bank elected to restructure its capital offering as a standard mutual-to-stock transaction and is currently pursuing implementation of the Stock Offering in 2021. Because of the delay in the capital offering, the expenses incurred earlier in 2020 were required to be charged to operations (instead of being deferred and deducted from the gross proceeds of the capital offering).
Salaries and employee benefits increased by $1.1 million or 21.0% from $5.3 million in 2019 to $6.4 million in 2020, primarily reflecting expansion of the Bank’s staff personnel. The number of full-time equivalent employees increased from 45 at December 31, 2019 to 54 at December 31, 2020. The increase in salaries and employee benefits was also related to the increased variable compensation paid to mortgage lenders as a result of increased lending volume in 2020. The ratio of non-interest expense to average assets increased from 2.99% for 2019 to 3.46% for 2020. Excluding the data processing conversion costs and expenses of the delayed capital offering, the Bank’s adjusted non-interest expense ratio would have measured 2.97% of average assets in 2020.
As discussed earlier, the Bank has placed considerable emphasis on enhancing operating efficiency and improving its historically high efficiency ratio. Although the Bank’s efficiency
28
FELDMAN FINANCIAL ADVISORS, INC.
ratio remains high in comparison to peers, it improved from 100.8% in 2017 to 95.2% in 2018 and 85.9% in 2019, before increasing to 91.2% because of the non-recurring items. (The efficiency ratio represents non-interest expense divided by the sum of net interest income and non-interest income exclusive of securities gains.) Operating expenses in prior years had been elevated by the opening of new offices, severance benefits, and increased expenses for professional services related to outside consultants and for checking account marketing programs. Excluding the impact of the data processing conversions costs and expenses of the delayed stock offering, the Bank’s adjusted efficiency ratio would have measured 78.3% in 2020.
The provision for income taxes decreased from $367,000 for the year ended December 31, 2019 to $40,000 for the year ended December 31, 2020. The effective income tax rate was approximately 23.3% and 11.4% for the years ended December 31, 2019 and 2020, respectively. The decline in the effective tax rate was due in part to the recognition of tax-exempt BOLI income offsetting the much lower level of pre-tax income in 2020.
Years Ended December 31, 2018 and 2019
Net income was $1.2 million for the year ended December 31, 2019, compared to net income of $679,000 for the year ended December 31, 2018, an increase of $528,000 or 77.8%. The increase was due to a $191,000 increase in net interest income, a $653,000 increase in non-interest income, and a $254,000 decrease in non-interest expense, offset partially by a change in the credit for loan losses from $551,000 in 2018 to zero in 2019. Net interest income increased by $181,000 from $9.3 million in 2018 to $9.5 million in 2019. This increase was due to an increase in the balance of interest-earning assets in 2019 versus 2018, offset by a decrease in the net interest rate spread to 3.07% for 2019 from 3.19% in 2018 and a decrease in the net interest margin to 3.26% for 2019 from 3.35% in 2018.
29
FELDMAN FINANCIAL ADVISORS, INC.
The decrease in the net interest rate spread and the net interest margin was primarily due to the increase in the average balance of interest-bearing liabilities from $224.9 million for the year ended December 31, 2018 to $247.2 million for the year ended December 31, 2019 and an increase in the weighted average rate paid on interest-bearing liabilities from 0.92% for the year ended December 31, 2018 to 1.25% for the year ended December 31, 2019. This decrease was partially offset by an increase in the average balances and yields on interest-earning assets. The Bank’s loan portfolio yield increased by 12 basis points from 4.57% in 2018 to 4.69% in 2019, while the securities portfolio yield decreased by 12 basis points from 3.07% in 2018 to 2.95% in 2019. The Bank’s yield on interest-earning deposits increased by 49 basis points from 1.28% in 2018 to 1.87% in 2019, reflecting higher market interest rates. As a result, the overall yield on total interest-earning assets increased by 21 basis points from 4.11% in 2018 to 4.32% in 2018.
While the Bank’s weighted average yield on interest-earning assets increased by 22 basis points from 4.11% in 2018 to 4.33% in 2019, the weighted average cost of interest-bearing liabilities increased further by 33 basis points from 0.92% to 1.25%. The Bank’s cost of interest-bearing deposits increased by 34 basis points from 0.90% in 2018 to 1.24% in 2019, primarily due to increases in rates paid on certificate accounts. The Bank’s cost of borrowings decreased by 13 basis points from 2.61% in 2018 to 2.48% in 2019, mainly due to the maturity of certain high-cost FHLB advances in 2018.
Based on management’s analysis of the allowance for loan losses, the Bank did not record a provision for loan losses for the year ended December 31, 2019 and credited the provision expense in an amount of $551,000 for the year ended December 31, 2018. The Bank’s allowance for loan losses was $3.1 million at December 31, 2019 as compared to $3.2 million at December 31, 2018. The ratio of the allowance for loan losses to total loans decreased to 1.23% at December
30
FELDMAN FINANCIAL ADVISORS, INC.
31, 2019 from 1.33% at December 31, 2018, and the ratio the allowance for loan losses to non-performing loans decreased to 118.3% at December 31, 2019 from 247.7% at December 31, 2018.
The Bank’s non-interest income increased by $653,000 to $1.2 million for the year ended December 31, 2018 as compared to $607,000 for the year ended December 31, 2018. The increase was primarily due to the contribution of $296,000 in BOLI income in 2019 and net increases of $93,000, $293,000, and $67,000 in service charges, gains on sale of loans, and gains on sale of securities, respectively. As a result of the increased level of non-interest income, the Bank’s ratio of non-interest income to average assets increased from 0.21% for the year ended December 31, 2018 to 0.41% for the year ended December 31, 2019.
Non-interest expense decreased by $254,000 or 2.7% to $9.1 million for the year ended December 31, 2019 from $9.4 million for the year ended December 31, 2017. The decrease was due primarily to a $172,000 or 3.1% decrease in salaries and employee benefits and a $186,000 or 39.7% decrease in advertising expenses. Salaries and benefits decreased primarily due to the freezing of new accruals in the directors deferred fee plan and decreasing the interest rate paid on previously deferred compensation. The ratio of non-interest expense to average assets declined from 3.31% for 2018 to 2.99% for 2019. The Bank’s non-interest expense ratio had previously declined from 3.48% in 2017.
The provision for income taxes increased by $20,000 or 5.8% to $367,000 for the year ended December 31, 2019 from $347,000 for the year ended December 31, 2018. The effective tax rate was approximately 33.8% and 23.3% for the years ended December 31, 2018 and 2019, respectively. The decline in the effective tax rate was due in part to the recognition of tax-exempt BOLI income in 2019.
31
FELDMAN FINANCIAL ADVISORS, INC.
Interest Rate Risk Management
The Bank seeks to reduce its earnings vulnerability and capital risk to changes in market interest rates by managing the mismatch between asset and liability maturities and interest rates. The primary objective of the Bank’s asset/liability management program is to optimize earnings and return on capital within acceptable levels of risk. The Bank’s ALCO focuses on ensuring a stable and steadily increasing flow of net interest income through managing the size and mix of the balance sheet. The ALCO is expected to integrate the Bank’s asset/liability management process into its operational decision making, including portfolio structure, investments, business planning, funding decisions, and pricing. The ALCO is responsible for evaluating the interest rate risk inherent in the Bank’s assets and liabilities, for determining the level of risk that is appropriate given the Bank’s business strategy, operating environment, capital, liquidity and performance objectives, and for managing this risk consistent with the policy and guidelines approved by the Board of Directors.
The asset/liability and funds management policy of the Bank falls under the authority of the Board of Directors, which in turn assigns authority for its formulation, revision, and administration to the ALCO. The ultimate responsibility for effective asset/liability management rests with the Board. The responsibilities conveyed to the ALCO include:
| ● | Developing an asset/liability management process and related procedures. |
| ● | Establishing a monitoring and reporting system. |
| ● | Developing asset/liability strategies and tactics. |
| ● | Submitting a written report to the Board at least quarterly. |
| ● | Overseeing the maintenance of a management information system that supplies, on a timely basis, the information and data necessary for the ALCO to fulfill its role as asset/liability manager. |
| ● | Ensuring independent ALCO review is performed no less than annually. |
32
FELDMAN FINANCIAL ADVISORS, INC.
TC Federal Bank attempts to manage its interest rate risk to minimize the exposure of the Bank’s earnings and capital to changes in market interest rates. The Bank has implemented various strategies to manage its interest rate risk. By enacting these strategies, the Bank believes that it is better positioned to react to changes in market interest rates. These strategies include:
| ● | Originating loans with adjustable interest rates. |
| ● | Promoting core deposit products. |
| ● | Selling a portion of fixed-rate one- to four-family residential mortgage loans. |
| ● | Maintaining investments as available-for-sale securities. |
| ● | Diversifying the Bank’s loan portfolio. |
| ● | Strengthening the Bank’s capital position, so as to increase the ratio of interest-earning assets relative to interest-rate sensitivity funding sources. |
The Bank uses various tools in measuring and managing interest rate risk, including net interest income simulations and economic value of equity (“EVE”) simulations. These tools are utilized to quantify the potential impact on earnings and capital of changing interest rates over a short-term simulation horizon (two-year net interest income simulations) as well as to identify expected earnings given longer-term rate cycles (EVE simulations).
Net interest income simulation functions as the Bank’s primary tool for benchmarking near-term earnings exposure. The Bank analyzes its sensitivity to changes in interest rates through an interest rate risk model, developed by a third-party provider. The Bank estimates its net interest income for a 12-month period, and then calculates what net interest income would be for the same period under the assumptions that the U.S. Treasury yield curve increases instantly by up to 400 basis points or decreases instantly by up to 200 basis points, in 100 point increments, with changes in interest rates representing immediate and permanent, parallel shifts in the yield curve.
33
FELDMAN FINANCIAL ADVISORS, INC.
Table 6 below sets forth, as of December 31, 2020, the calculation of the estimated changes in the Bank’s net interest income resulting from the designated immediate changes in the U.S. Treasury yield curve. As shown in the table, an upward change of 100 basis points in market interest rates would reduce net interest income by $413,000 and a downward change of 100 basis points would decrease net interest income by $78,000.
Table 6
Net Interest Income Sensitivity
As of December 31, 2020
(Dollars in Thousands)
|
Basis Point Change in Interest Rates (1) |
Change in Net Interest Income Year 1 Forecast ($000s) |
Percent Year 1 Change from Level (%) | ||
| + 400 b.p. | $(1,285) | (11.75)% | ||
| + 300 b.p. | (756) | (6.92)% | ||
| + 200 b.p. | (654) | (5.98)% | ||
| + 100 b.p. | (413) | (3.78)% | ||
| Level | -- | -- | ||
| - 100 b.p. | (78) | (0.71)% | ||
| - 200 b.p. | (78) | (0.71)% | ||
| (1) | Assumes an immediate uniform change in interest rates at all maturities. |
| Source: | TC Federal Bank, financial data. |
Additionally, the need exists for more general management of the longer-term maturity/ repricing sectors of the balance sheet. Therefore, the Bank utilizes the EVE model to identify potential long-term exposures to sustained higher or lower rate environments. The EVE model is used to compute amounts by which the net present value of the Bank’s asset and liabilities would change in the event of a range of assumed changes in market interest rates. This model uses a
34
FELDMAN FINANCIAL ADVISORS, INC.
discounted cash flow analysis and an option-based pricing approach to measure the interest rate sensitivity of EVE. The model estimates the economic value of each type of asset, liability, and off-balance sheet contract under assumptions that the U.S. Treasury yield curve increases or decreases instantaneously by 100 basis point increments, with changes in interest rates representing immediate and permanent, parallel shifts in the yield curve. The Bank currently calculates EVE under assumptions that market interest rates increase by 100, 200, 300, and 400 basis points and that rates decrease by 100 and 200 basis points. Table 7 below sets forth, as of December 31, 2020, the estimated changes in the Bank’s EVE that would result from the designated instantaneous changes in market interest rates.
Table 7
Economic Value of Equity
As of December 31, 2020
(Dollars in Thousands)
|
Basis Point Change in Interest Rates (1) |
Estimated EVE (2) ($000s) |
Amount Change from Base ($000s) |
Percent Change from Base |
EVE Ratio (3) |
Basis Point Change in EVE Ratio | |||||
|
+ 400 b.p. |
$40,813 | $11,478 | 39.13% | 12.37% | 419 b.p. | |||||
|
+ 300 b.p. |
41,634 | 12,299 | 41.93% | 12.33% | 415 b.p. | |||||
|
+ 200 b.p. |
40,390 | 11,055 | 37.69% | 11.70% | 352 b.p. | |||||
|
+ 100 b.p. |
36,538 | 7,203 | 24.55% | 10.37% | 219 b.p. | |||||
|
Base |
29,335 | -- | -- | 8.18% | -- | |||||
|
- 100 b.p. |
16,388 | (12,947) | (44.13)% | 4.56% | (362) b.p. | |||||
|
- 200 b.p. |
14,110 | (15,225) | (51.90)% | 3.92% | (426) b.p. | |||||
| (1) | Assumes an instantaneous uniform change in interest rates at all maturities. |
| (2) | EVE is the discounted present value of expected cash flows from assets, liabilities, and off-balance sheet contracts. |
| (3) | EVE ratio represents EVE divided by the present value of assets, which is calculated as the discounted value of incoming cash flows on interest-earning assets. |
Source: TC Federal Bank, financial data.
35
FELDMAN FINANCIAL ADVISORS, INC.
The table above indicates that at December 31, 2020, in the event of an instantaneous parallel 100 basis point increase in interest rates, the Bank would experience a 24.6% increase in EVE. In the event of an instantaneous 100 basis point decrease in interest rates, the Bank would experience a 44.1% decrease in EVE. The EVE simulations give no effect to any steps that the Bank might take to counter the impact of such interest rate movement.
36
FELDMAN FINANCIAL ADVISORS, INC.
Asset Quality
Table 8 summarizes the Bank’s total non-performing assets as of December 31, 2018 to 2020. The Bank has a solid record of reporting satisfactory asset quality in recent years. Total non-performing assets decreased from $5.5 million at December 31, 2015 to $2.0 million, $2.1 million, and $1.6 million at December 31, 2016, 2017, and 2018, respectively. Total non-performing assets increased to $2.9 million at December 31, 2019, mainly as a result of an increase in non-performing commercial real estate loans, before declining to $2.1 million at December 31, 2020. Non-performing assets at year-end 2020 consisted of $2.0 million in non-performing loans and real estate owned of $81,000. In relation to total assets, non-performing assets decreased from 2.61% at December 31, 2015 to 0.55% at December 31, 2018, before increasing to 0.92% at December 31, 2019 and then decreasing to 0.59% at December 31, 2020.
Table 9 summarizes the Bank’s allowance for loan losses as of and for the year ended December 31, 2018 to 2020. The allowance for loan losses decreased from $4.9 million at December 31, 2016 to $3.5 million, $3.2 million, and $3.1 million at December 31, 2017, 2018, and 2019, respectively. The Bank did not record any provision to loan losses for the years ended December 31, 2017 to 2019. The Bank recorded credits or reductions to its loan loss allowance in the amount of $1.9 million in 2017 and $550,000 in 2018. For 2020, the Bank recorded a provision in the amount $780,000 to reflect the steady expansion of the loan portfolio and the uncertain economic impact of the coronavirus pandemic. As a result the allowance for loan losses increased to $4.1 million at December 31, 2020. Management’s evaluation of the adequacy of the loan loss allowance is based on various qualitative and quantitative loan portfolio risk factors and has taken into account the overall declines in non-performing assets, increased level of recoveries in prior years, and the continued decrease in non-accruing residential mortgage loans. As a result of the
37
FELDMAN FINANCIAL ADVISORS, INC.
decreased level of provisions from 2017 to 2019, the ratio of the allowance for loan losses to gross total loans declined from 1.62% at year-end 2017 to 1.33% at year-end 2018 and 1.23% at year-end 2019. However, following the $780,000 provision for loan losses in 2020, the ratio of the allowance for loan losses to gross total loans increased to 1.53% at December 31, 2020.
Table 8
Non-performing Asset Summary
As of December 31, 2018 to 2020
(Dollars in Thousands)
| December 31, | |||||||||||||||
|
2020 |
2019 |
2018 | |||||||||||||
| Non-accruing Loans |
|||||||||||||||
| Residential mortgage |
$ | 624 | $ | 905 | $ | 1,093 | |||||||||
| Home equity line of credit |
- | 4 | 20 | ||||||||||||
| Multi-family real estate |
- | - | - | ||||||||||||
| Commercial real estate |
1,339 | 1,621 | 120 | ||||||||||||
| Construction and land development |
- | 15 | 53 | ||||||||||||
| Commercial business |
- | - | - | ||||||||||||
| Consumer |
- | - | - | ||||||||||||
|
|
|
|
|
|
|
||||||||||
| Total non-accruing loans |
1,963 | 2,545 | 1,286 | ||||||||||||
|
|
|
|
|
|
|
||||||||||
| Accruing Loans 90 Days or More Past Due |
|||||||||||||||
| Residential mortgage |
16 | 46 | - | ||||||||||||
| Other |
- | - | - | ||||||||||||
|
|
|
|
|
|
|
||||||||||
| Total accruing loans 90+ days past due |
16 | 46 | - | ||||||||||||
|
|
|
|
|
|
|
||||||||||
| Total non-performing loans |
1,979 | 2,591 | 1,286 | ||||||||||||
| Real estate owned |
81 | 358 | 351 | ||||||||||||
|
|
|
|
|
|
|
||||||||||
| Total non-performing assets |
$ | 2,060 | $ | 2,949 | $ | 1,637 | |||||||||
|
|
|
|
|
|
|
||||||||||
| Accruing troubled debt restructurings |
319 | 246 | 314 | ||||||||||||
|
|
|
|
|
|
|
||||||||||
| Total non-performing assets (1) |
$ | 2,379 | $ | 3,195 | $ | 1,951 | |||||||||
|
|
|
|
|
|
|
||||||||||
| Total non-performing loans to gross total loans |
0.74% | 1.04% | 0.54% | ||||||||||||
| Total non-performing assets to total assets |
0.59% | 0.92% | 0.55% | ||||||||||||
| Total non-performing assets to total assets (1) |
0.68% | 0.99% | 0.66% | ||||||||||||
|
|
|||||||||||||||
| (1) | Including accruing troubled debt restructurings. |
Source: TC Federal Bank, financial data.
38
FELDMAN FINANCIAL ADVISORS, INC.
Table 9
Allowance for Loan Losses
As of or For the Years Ended December 31, 2018 to 2020
(Dollars in Thousands)
|
As of or For the Year Ended | |||||||||||||||
| 2020 | 2019 | 2018 | |||||||||||||
| Allowance at beginning of year |
$ | 3,065 | $ | 3,186 | $ | 3,470 | |||||||||
| Charge-offs: |
|||||||||||||||
| Residential mortgage loans |
(3 | ) | (15 | ) | (21 | ) | |||||||||
| Home equity loans |
(1 | ) | - | - | |||||||||||
| Multi-family real estate loans |
- | - | - | ||||||||||||
| Commercial real estate loans |
(63 | ) | (199 | ) | - | ||||||||||
| Construction and land development loans |
(1 | ) | - | (4 | ) | ||||||||||
| Commercial business loans |
- | - | - | ||||||||||||
| Consumer loans |
- | - | - | ||||||||||||
|
|
|
|
|
|
|
||||||||||
| Total charge-offs |
(68 | ) | (214 | ) | (25 | ) | |||||||||
| Recoveries |
|||||||||||||||
| Residential mortgage loans |
123 | 21 | 186 | ||||||||||||
| Home equity loans |
- | - | 2 | ||||||||||||
| Multi-family real estate loans |
- | - | - | ||||||||||||
| Commercial real estate loans |
- | - | 2 | ||||||||||||
| Construction and land development loans |
32 | 38 | 38 | ||||||||||||
| Commercial business loans |
146 | 34 | 63 | ||||||||||||
| Consumer loans |
8 | - | - | ||||||||||||
|
|
|
|
|
|
|
||||||||||
| Total recoveries |
309 | 93 | 291 | ||||||||||||
| Net (charge-offs) recoveries |
241 | (121 | ) | 266 | |||||||||||
| Additions (reductions) charged to operations |
780 | - | (550 | ) | |||||||||||
|
|
|
|
|
|
|
||||||||||
| Allowance at end of year |
$ | 4,086 | $ | 3,065 | $ | 3,186 | |||||||||
|
|
|
|
|
|
|
||||||||||
| Allowance to non-performing loans |
206.47% | 118.29% | 247.74% | ||||||||||||
| Allowance to gross total loans |
1.53% | 1.23% | 1.33% | ||||||||||||
| Net (charge-offs) recoveries to average loans |
0.09% | (0.05)% | 0.12% | ||||||||||||
Source: TC Federal Bank, financial data.
39
FELDMAN FINANCIAL ADVISORS, INC.
Office Facilities
The Bank currently conducts business from its main office in Thomasville, Georgia, and one branch office in Tallahassee, Florida. Thomasville is located approximately 35 miles north of Tallahassee. The Bank owns its main office building in Thomasville and the branch office in Tallahassee. The Bank leases an office in Savannah, Georgia, which serves as an LPO primarily for the origination of commercial real estate loans. The Bank also leases an office in Tallahassee that serves as a residential mortgage center. As of December 31, 2020, the net book value of the Bank’s premises and equipment was $3.4 million, measuring 1.0% of total assets. The Bank believes that its current facilities are adequate to meet its present and foreseeable needs, subject to possible future expansion.
Exhibit II-8 provides summary information about the Bank’s office properties. The main office is located at 131 South Dawson Street in Thomasville. This office is owned by the Bank and had a net book value of $2.1 million at December 31, 2020. The Tallahassee branch office is located at 2915-501 Kerry Forest Parkway and had a net book value of $1.4 million at December 31, 2020. Each banking office features a drive-up lane and a drive-up automated teller machine (“ATM”). The Tallahassee branch office was opened in 2017. The Savannah LPO was also opened in 2017.
40
FELDMAN FINANCIAL ADVISORS, INC.
Market Area
Overview of Market Area
TC Federal Bank is headquartered in Thomasville, Georgia and operates a branch office and residential mortgage center in Tallahassee, Florida. Both of the Bank’s full-service office locations feature an ATM for 24-hour banking access. The Bank also operates a commercial LPO in Savannah, Georgia. The Bank’s market area includes the counties in which its branches are located along with the adjacent counties. Specifically, the Bank’s primary market area is Thomas County, Georgia, and the adjacent counties of Gray, Colquitt Brooks, and Mitchell. In Florida, the Bank’s market area is centered on Leon County and the adjacent counties of Gadsden, Wakulla, Jefferson, and Liberty. The Savannah LPO targets Chatham County and the adjacent counties of Liberty, Bryan, and Effingham as well as the Hilton Head Island-Bluffton-Beaufort (South Carolina) Metropolitan Statistical Area (“MSA”).
Thomasville is the county seat of Thomas County, Georgia. The estimated population of Thomasville in 2021 was 17,889, making it the second largest city in Southwest Georgia after Albany. Thomas County is strategically located on the Georgia-Florida state boundary line and offers a combination of an excellent transportation system (both road and rail) and high-speed internet and telecommunication to attract a growing number of businesses. Thomasville functions as a regional hub attracting employment from residents of nearby communities. Thomasville and Thomas County both serve a five-county area with an estimated population of approximately 152,000 in 2021. Thomasville is home to Thomas University and Southern Regional Technical College. Headquartered in Thomasville, Flowers Foods, Inc. is a publicly traded company and one of the largest producers of fresh packaged bakery foods in the nation with 2020 sales of $4.4 billion. Table 10 presents the largest employers in Thomas County, excluding retail operations.
41
FELDMAN FINANCIAL ADVISORS, INC.
Table 10
Largest Employers in Thomas County, Georgia
| Company / Organization | Number of Employees | |
| Archbold Medical Center |
2,500 | |
| Thomas County School System |
814 | |
| Thomasville City School System |
450 | |
| City of Thomasville |
435 | |
| Hurst Boiler and Welding Company (1) |
353 | |
| Walmart Meat Processing |
350 | |
| Flowers Foods Corporate Office (1) |
323 | |
| Oil Dry Corporation of Georgia |
321 | |
| Thomas County Government |
304 | |
| FPL Foods |
300 | |
| Cleaver Brooks (1) |
267 | |
| Woodhaven Industries |
250 | |
| Flowers Baking Company |
250 | |
| Check Mate Industries |
230 | |
| Evoqua |
214 | |
| Thomas University |
208 | |
| Ambassador |
200 | |
| Turbine Engine Components Technologies (1) |
175 | |
| Cives Steel Company |
125 | |
| American Signature Furniture |
65 | |
| Ag Pro (1) |
60 |
| (1) | Corporate headquarters. |
Source: Thomasville-Thomas County Chamber of Commerce.
Tallahassee is the capital city of the state of Florida. It is the county seat and only incorporated municipality in Leon County. As the capital, Tallahassee is the site of the Florida State Capitol and nearly 30 state agency headquarters. The city is also known for its large number of law firms, lobbying organizations, trade associations, and professional associations. Tallahassee serves as the main center for trade and agriculture in the Florida Big Bend and Southwest Georgia regions. The city is home to Florida State University, Florida A&M
42
FELDMAN FINANCIAL ADVISORS, INC.
University, and Tallahassee Community College, which collectively have approximately 80,000 students. Leon County had an estimated 2021 population of 298,913 and the Tallahassee MSA, which includes the Florida counties of Leon, Gadsden, Jefferson, and Wakulla, had an estimated 2021 population of 394,182
Table 11 displays the major employers in Tallahassee (Leon County), exclusive of retail operations. The state of Florida is the area’s largest employer with over 19,000 employees, followed by Florida State University with over 14,000 employees. Other large employers in the area include Tallahassee Memorial Healthcare, Leon County Schools, and the city of Tallahassee.
Savannah is the oldest city in the state of Georgia and is the county seat of Chatham County. An industrial center and an important Atlantic seaport, Savannah is Georgia’s fourth largest city with a 2021 estimated population of 145,429. The Savannah MSA, which includes the Georgia counties of Chatham, Bryan, and Effingham, is Georgia’s third largest MSA with an estimated population of 399,492. Tourism has become an important draw for Savannah and each year the city attracts millions of visitors to its cobblestone streets, parks, and notable historic buildings. The principal employers in Savannah include Memorial Health Medical Center, Gulfstream Aerospace Corporation, St. Joseph’s/Candler Health Care System, Georgia-Pacific Corporation, and International Paper Company. Savannah is home to Savannah College of Art and Design, Georgia Southern University-Armstrong Campus, Savannah State University, and South University.
Table 12 provides selected demographic data for the United States, Georgia, Thomas County (Georgia), Leon County (Florida), and Chatham County (Georgia). Thomas County’s population has been relatively stagnant since 2020. Thomas County is projected to experience a low population growth rate of 1.4% over the next five years, while Chatham County and Leon County project comparatively robust population growth rates of 3.9% and 4.5%, respectively.
43
FELDMAN FINANCIAL ADVISORS, INC.
Table 11
Largest Employers in Leon County, Florida
| Employee Size | Employer | Industry | ||
| 5,000+ | State of Florida |
Government | ||
| Florida State University |
Education | |||
| 2,000 to 4,999 | Tallahassee Memorial Healthcare, Inc. |
Healthcare | ||
| Leon County Schools |
Education | |||
| City of Tallahassee |
Government | |||
| 1,000 to 1,999 | Florida A&M University |
Education | ||
| Leon County |
Government | |||
| Tallahassee Community College |
Education | |||
| Capital Regional Medical Center |
Healthcare | |||
| 300 to 999 | Capital City Bank Group |
Finance and insurance | ||
| Mainline Information Systems |
Information technology | |||
| Capital Health Plan |
Healthcare | |||
| Apalachee Center, Inc. |
Healthcare | |||
| Goodwill Industries - Big Bend |
Social Services | |||
| Westminster Oaks |
Healthcare | |||
| General Dynamics Land Systems |
Manufacturing | |||
| St. Marks Powder |
Manufacturing | |||
| Citizens Property Insurance Corporation |
Business services | |||
| FBMC Benefits Management |
Business services | |||
| The Florida Bar |
Associations & organizations | |||
| Flagler College |
Education | |||
| VA Outpatient Clinic |
Healthcare | |||
| Big Bend Hospice |
Healthcare | |||
| 200 to 299 | Florida Bar |
Associations & organizations | ||
| Tallahassee Primary Care Associates |
Healthcare | |||
| Comcast Cable |
Telecommunications | |||
| HealthSouth Rehabilitation Hospital |
Healthcare | |||
| Tri-Eagle Sales |
Transportation | |||
| Danfoss Turbocor |
Manufacturing | |||
| GT Technologies |
Manufacturing | |||
| Radiology Associates |
Healthcare | |||
| 100 to 199 | Syn-Tech Systems |
Manufacturing | ||
| BASF Catalysts |
Manufacturing | |||
| Tallahassee Orthopedic Clinic |
Healthcare | |||
| CenturyLink |
Telecommunications | |||
| Select Specialty Hospital |
Government | |||
| Miracle Hill Nursing and Rehabilitation Center |
Healthcare | |||
| Heritage Health Care Center |
Healthcare | |||
Source: Tallahassee-Leon County Office of Economic Vitality.
44
FELDMAN FINANCIAL ADVISORS, INC.
Table 12
Selected Demographic Data
| United States |
Georgia | Thomas County (Georgia) |
Leon County (Florida) |
Chatham County (Georgia) |
||||||||||||||||||||
|
Total Population |
||||||||||||||||||||||||
| 2010 - Base |
308,745,538 | 9,687,653 | 44,720 | 275,487 | 265,128 | |||||||||||||||||||
| 2021 - Current |
330,946,040 | 10,769,971 | 44,364 | 298,913 | 291,228 | |||||||||||||||||||
| 2026 - Projected |
340,574,349 | 11,272,730 | 44,983 | 312,244 | 302,657 | |||||||||||||||||||
| % Change 2010-21 |
7.19% | 11.17% | -0.80% | 8.50% | 9.84% | |||||||||||||||||||
| % Change 2021-26 |
2.91% | 4.67% | 1.40% | 4.46% | 3.92% | |||||||||||||||||||
| Age Distribution, 2021 |
||||||||||||||||||||||||
| 0 - 14 Age Group |
18.32% | 19.14% | 19.46% | 15.37% | 17.84% | |||||||||||||||||||
| 15 - 34 Age Group |
26.75% | 27.61% | 24.10% | 38.43% | 29.83% | |||||||||||||||||||
| 35 - 54 Age Group |
25.08% | 26.02% | 23.79% | 21.45% | 24.33% | |||||||||||||||||||
| 55 - 69 Age Group |
18.44% | 17.43% | 19.74% | 15.26% | 17.10% | |||||||||||||||||||
| 70+ Age Group |
11.40% | 9.81% | 12.91% | 9.50% | 10.89% | |||||||||||||||||||
| Median Age (years) |
38.9 | 37.5 | 40.5 | 32.5 | 36.8 | |||||||||||||||||||
| Total Households |
||||||||||||||||||||||||
| 2010 - Base |
116,716,292 | 3,585,584 | 17,573 | 110,945 | 103,038 | |||||||||||||||||||
| 2021 - Current |
125,732,798 | 4,002,745 | 17,777 | 120,584 | 114,362 | |||||||||||||||||||
| 2026 - Projected |
129,596,282 | 4,197,484 | 18,111 | 126,121 | 119,522 | |||||||||||||||||||
| % Change 2010-21 |
7.73% | 11.63% | 1.16% | 8.69% | 10.99% | |||||||||||||||||||
| % Change 2021-26 |
3.07% | 4.87% | 1.88% | 4.59% | 4.51% | |||||||||||||||||||
| Household Income, 2021 |
||||||||||||||||||||||||
| < $25,000 |
17.97% | 18.80% | 25.99% | 22.76% | 19.01% | |||||||||||||||||||
| $25,000 - $49,999 |
20.27% | 21.16% | 27.37% | 22.85% | 22.85% | |||||||||||||||||||
| $50,000 - $99,999 |
29.03% | 29.40% | 24.81% | 28.27% | 30.21% | |||||||||||||||||||
| $100,000 - $199,999 |
23.23% | 22.05% | 16.07% | 18.90% | 20.37% | |||||||||||||||||||
|
$200,000+ |
9.51% | 8.59% | 5.75% | 7.21% | 7.56% | |||||||||||||||||||
| Average Household Income |
||||||||||||||||||||||||
| 2021 - Current |
$96,765 | $92,281 | $72,238 | $82,789 | $87,337 | |||||||||||||||||||
| 2026 - Projected |
$107,191 | $103,841 | $80,978 | $90,827 | $97,257 | |||||||||||||||||||
| % Change 2021-26 |
10.77% | 12.53% | 12.10% | 9.71% | 11.36% | |||||||||||||||||||
| Median Household Income |
||||||||||||||||||||||||
| 2021 - Current |
$67,761 | $64,850 | $46,632 | $56,823 | $62,009 | |||||||||||||||||||
| 2026 - Projected |
$73,868 | $71,802 | $50,493 | $62,002 | $68,340 | |||||||||||||||||||
| % Change 2021-26 |
9.01% | 10.72% | 8.28% | 9.11% | 10.21% | |||||||||||||||||||
| Unemployment Rate |
||||||||||||||||||||||||
| December 2018 |
3.7% | 3.7% | 4.5% | 3.1% | 3.5% | |||||||||||||||||||
| December 2019 |
3.4% | 2.9% | 3.4% | 2.6% | 2.8% | |||||||||||||||||||
|
December 2020 |
6.5% | 5.4% | 6.1% | 5.2% | 6.1% | |||||||||||||||||||
45
FELDMAN FINANCIAL ADVISORS, INC.
Table 12 (continued)
Selected Demographic Data
| United States |
Georgia | Thomas County (Georgia) |
Leon County (Florida) |
Chatham County (Georgia) |
||||||||||||||||||||
|
Total Housing Units, 2021 |
141,870,120 | 4,534,377 | 20,648 | 134,149 | 131,206 | |||||||||||||||||||
| Owner Occupied |
81,944,178 | 2,637,592 | 11,462 | 66,258 | 66,462 | |||||||||||||||||||
| Renter Occupied |
43,788,620 | 1,365,153 | 6,315 | 54,326 | 47,900 | |||||||||||||||||||
| Vacant |
16,137,322 | 531,632 | 2,871 | 13,565 | 16,844 | |||||||||||||||||||
| Owner Occupied |
57.76% | 58.17% | 55.51% | 49.39% | 50.65% | |||||||||||||||||||
| Renter Occupied |
30.87% | 30.11% | 30.58% | 40.50% | 36.51% | |||||||||||||||||||
| Vacant |
11.37% | 11.72% | 13.90% | 10.11% | 12.84% | |||||||||||||||||||
| Owner Occupied Units |
||||||||||||||||||||||||
| 2021 - Current |
81,944,178 | 2,637,592 | 11,462 | 66,258 | 66,462 | |||||||||||||||||||
| 2026 - Projected |
84,477,023 | 2,768,025 | 11,671 | 69,463 | 69,583 | |||||||||||||||||||
| % Change 2010-21 |
7.84% | 12.03% | 1.21% | 9.71% | 11.76% | |||||||||||||||||||
| % Change 2021-26 |
3.09% | 4.95% | 1.82% | 4.84% | 4.70% | |||||||||||||||||||
| Renter Occupied Units |
||||||||||||||||||||||||
| 2021 - Current |
43,788,620 | 1,365,153 | 6,315 | 54,326 | 47,900 | |||||||||||||||||||
| 2026 - Projected |
45,119,259 | 1,429,459 | 6,440 | 56,658 | 49,939 | |||||||||||||||||||
| % Change 2010-21 |
7.51% | 10.88% | 1.07% | 7.47% | 9.93% | |||||||||||||||||||
| % Change 2021-26 |
3.04% | 4.71% | 1.98% | 4.29% | 4.26% | |||||||||||||||||||
Source: Claritas; S&P Global Market Intelligence; U.S. Bureau of Labor Statistics.
The median age of the population in Thomas County was 40.5 years, above the U.S. and Georgia medians of 38.9 and 37.5 years, respectively. Reflecting larger concentrations of college students, the median age was lower for Chatham County at 36.8 years and even lower for Leon County at 32.5 years. The estimated median household income in 2021 was $46,632 for Thomas County, $62,009 for Chatham County, and $56,823 for Leon County. Georgia’s median household income of $64,850 was lower than the national median of $67,761. The December 2020 unemployment rate for Thomas County was 6.1%, measuring above the state rate of 5.4% but below the national rate of 6.5%. Chatham County exhibited a December 2020 unemployment rate of 6.1% and Leon County’s unemployment rate was positioned somewhat lower at 5.2%.
46
FELDMAN FINANCIAL ADVISORS, INC.
Table 13 presents the total employment force in Thomas, Leon, and Chatham counties as distributed by industry sectors for June 2020. The aggregate labor force numbered 19,046 in Thomas County, 141,068 in Leon County, and 146,724 in Chatham County. As displayed in Table 13, education and health services (20.8%), trade, transportation, and utilities (16.8%), and government (15.6%) accounted for the largest employment concentrations in Thomas County. Reflecting Tallahassee’s role as the state’s capital city and home to several colleges, government (33.6%) was the largest employment sector in Leon County, followed by education and health services (15.5%). Savannah’s commercial seaport activities and tourist attractions are evidenced by the labor force concentrations in trade, transportation, and utilities (24.7%) and leisure and hospitality (13.1%), along with education and health services (15.3%) as an important sector.
Table 13
Total Employment Force
For the Month of June 2020
| Thomas County (Georgia) |
Leon County (Florida) |
Chatham County (Georgia) |
|||||||||||||||||||||||||||||||||||||||||||
| Industry | Total Employment |
% of Total |
Total Employment |
% of Total |
Total Employment |
% of Total |
|||||||||||||||||||||||||||||||||||||||
|
Agriculture and natural resources |
664 | 3.49 | 160 | 0.11 | 125 | 0.09 | |||||||||||||||||||||||||||||||||||||||
|
Construction |
508 | 2.67 | 6,235 | 4.42 | 6,746 | 4.60 | |||||||||||||||||||||||||||||||||||||||
|
Manufacturing |
2,476 | 13.00 | 1,906 | 1.35 | 14,541 | 9.91 | |||||||||||||||||||||||||||||||||||||||
| Trade, transportation, and utilities |
3,190 | 16.75 | 18,588 | 13.18 | 36,173 | 24.65 | |||||||||||||||||||||||||||||||||||||||
|
Information |
43 | 0.23 | 2,546 | 1.80 | 1,376 | 0.94 | |||||||||||||||||||||||||||||||||||||||
| Financial activities |
880 | 4.62 | 6,409 | 4.54 | 4,885 | 3.33 | |||||||||||||||||||||||||||||||||||||||
|
Professional and business services |
2,033 | 10.67 | 18,032 | 12.78 | 18,965 | 12.93 | |||||||||||||||||||||||||||||||||||||||
| Education and health services |
3,962 | 20.80 | 21,804 | 15.46 | 22,388 | 15.26 | |||||||||||||||||||||||||||||||||||||||
| Leisure and hospitality |
1,736 | 9.11 | 12,730 | 9.02 | 19,181 | 13.07 | |||||||||||||||||||||||||||||||||||||||
| Other services |
546 | 2.87 | 5,296 | 3.75 | 4,022 | 2.74 | |||||||||||||||||||||||||||||||||||||||
|
Government |
2,973 | 15.61 | 47,338 | 33.56 | 17,969 | 12.25 | |||||||||||||||||||||||||||||||||||||||
|
Unclassified |
35 | 0.18 | 24 | 0.02 | 353 | 0.24 | |||||||||||||||||||||||||||||||||||||||
|
|
|
|
|
|
|
|
|
|
|
|
|
|
|||||||||||||||||||||||||||||||||
| Total Employment |
19,046 | 100.00 | 141,068 | 100.00 | 146,724 | 100.00 | |||||||||||||||||||||||||||||||||||||||
|
|
|
|
|
|
|
|
|
|
|
|
|
|
|||||||||||||||||||||||||||||||||
Source: U.S. Bureau of Labor Statistics.
47
FELDMAN FINANCIAL ADVISORS, INC.
Overview of Office Network
The Bank’s office network consists of two full-service banking offices, including the main office in Thomasville (Georgia) and a branch office in Tallahassee (Florida), along with a residential mortgage center in Tallahassee and a commercial LPO in Savannah (Georgia). A map of the Bank’s office network is presented below in Table 14.
Table 14
Map of Office Network
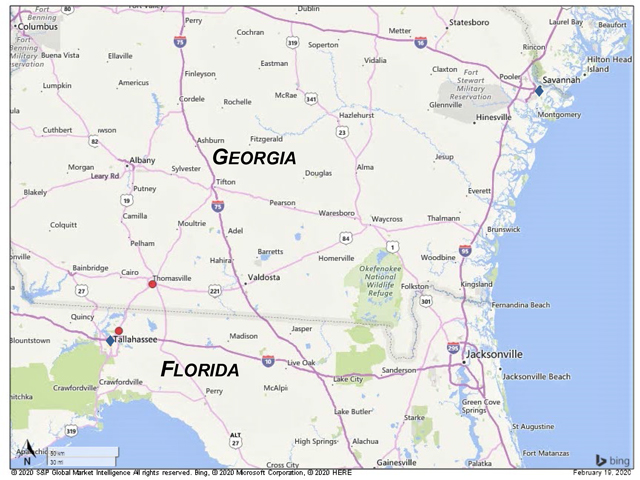
● Full-service banking offices of TC Federal Bank
Thomasville, Georgia – Main Office
Tallahassee, Florida – Branch Office
◆ Lending offices of TC Federal Bank
Tallahassee, Florida – Residential Mortgage Center
Savannah, Georgia – Commercial Loan Production Office
48
FELDMAN FINANCIAL ADVISORS, INC.
Table 15 provides deposit data for the Bank’s full-service banking offices from June 30, 2015 to June 30, 2020. The Bank’s deposits increased by 9.3% over the observed one-year period and by a compound annual growth rate (“CAGR”) of 6.5% over this five-year period. The Bank’s largest office based on deposits is the main office in Thomasville, which had total deposits of $218.6 million or 77.7% of the Bank’s total deposits at June 30, 2020. The deposits at the Tallahassee branch have increased from 12.1% of the Bank’s total deposits at June 30, 2018 to 22.3% of the Bank’s total deposits at June 30, 2020.
The Thomasville office experienced deposit growth of 3.6% from $211.0 million at June 30, 2019 to $218.6 million at June 30, 2020. The Tallahassee office exhibited deposit growth of 35.2% from $46.3 million at June 30, 2018 to $62.6 million at June 30, 2019. The Tallahassee office was opened in September 2017. As of December 31, 2020, the Tallahassee branch reported deposits of $72.4 million, while the Thomasville office had deposits of $221.7 million.
Table 15
Branch Office Deposit Data
Data as of June 30, 2015 to 2020
|
Branch Deposits at June 30, |
1-Year | 5-Year | ||||||||||||||||||||||||||||||
| Address | 2020 ($000) |
2019 ($000) |
2018 ($000) |
2017 ($000) |
2016 ($000) |
2015 ($000) |
Growth (%) |
CAGR (%) | ||||||||||||||||||||||||
|
Thomas County (GA) |
||||||||||||||||||||||||||||||||
| 131 South Dawson Street |
218,609 | 211,011 | 207,223 | 211,887 | 204,638 | 205,434 | 3.60 | % | 1.25 | % | ||||||||||||||||||||||
| Thomasville, GA 31792 |
||||||||||||||||||||||||||||||||
|
Leon County (FL) |
||||||||||||||||||||||||||||||||
|
2915-501 Kerry Forest Pkwy.(1) |
62,642 | 46,319 | 28,592 | NA | NA | NA | 35.24 | % | NA | |||||||||||||||||||||||
| Tallahassee, FL 32309 |
||||||||||||||||||||||||||||||||
|
Bank Total |
281,251 | 257,330 | 235,815 | 211,887 | 204,638 | 205,434 | 9.30 | % | 6.48 | % | ||||||||||||||||||||||
| (1) | Branch office was opened in September 2017. |
Source: S&P Global Market Intelligence.
49
FELDMAN FINANCIAL ADVISORS, INC.
Market Share Analysis
Table 16 displays branch deposit data for financial institutions (commercial banks and savings institutions) in Thomas County and Leon County as of June 30, 2020 (with deposit data adjusted for subsequently completed mergers). The Bank ranked third in Thomas County out of six financial institutions with total deposits of $218.6 million in one office as of June 30, 2020 for a market share of 14.0%. The deposit market share leaders in Thomas County were Thomasville National Bank with a market share of 51.8% and Synovus Bank with a market share of 18.8%.
Established in 1995, Thomasville National Bank is a high-performing commercial bank that is headquartered in Thomasville and had total assets of $1.2 billion at December 31, 2020. Two large regional banks with branch offices in the Thomas County market include Synovus Bank (based in Columbus, Georgia and reporting total assets of $54.3 billion at December 31, 2020) and Truist Bank (the renamed bank resulting from the merger of BB&T and SunTrust Bank and having total assets of $498.9 billion at December 31, 2020).
The Bank ranked 13th in Leon County out of 17 financial institutions with total deposits of $62.6 million in its Tallahassee branch office as of June 30, 2020 for a market share of 0.7%. The deposit market share leaders in Leon County included large out-of-state banks such as Truist Bank (North Carolina), Wells Fargo Bank (California), and Bank of America (North Carolina) with deposit market share concentrations of 23.1%, 15.0%, and 12.6%, respectively. Capital City Bank ranked third in Leon County with $1.1 billion of deposits and a market share of 13.3%. Capital City Bank and Prime Meridian Bank are the only two banks that are headquartered in Leon County. As of December 31, 2020, Capital City Bank had total assets of $3.8 billion and Prime Meridian Bank had total assets of $647.3 million. Of the 17 financial institutions operating branch offices in Leon County, the only Florida-based banks were Capital City Bank and Prime Meridian Bank.
50
FELDMAN FINANCIAL ADVISORS, INC.
Table 16
Deposit Market Share in Thomas County and Leon County
Data as of June 30, 2020
| Market Rank Financial 2020 Institution |
No. of Branch Offices 2020 |
Market Deposits 2020 |
Market Share (%) |
Market Deposits 2019 ($000) |
Market Share 2019 (%) |
1-Year Deposit Growth (%) |
5-Year Deposit CAGR (%) |
|||||||||||||||||||||||||
|
Thomas County, Georgia |
||||||||||||||||||||||||||||||||
|
1 Thomasville National Bank (GA) |
2 | 806,503 | 51.80 | 735,338 | 51.35 | 9.68 | 8.40 | |||||||||||||||||||||||||
|
2 Synovus Bank (GA) |
4 | 293,268 | 18.84 | 273,103 | 19.07 | 7.38 | (0.20 | ) | ||||||||||||||||||||||||
|
3 TC Federal Bank (GA) |
1 | 218,609 | 14.04 | 211,011 | 14.74 | 3.60 | 1.25 | |||||||||||||||||||||||||
| 4 Ameris Bank (GA) |
1 | 103,461 | 6.65 | 93,888 | 6.56 | 10.20 | 6.94 | |||||||||||||||||||||||||
| 5 The First - Nat’l. Banking Assn. (MS) |
1 | 68,789 | 4.42 | 57,828 | 4.04 | 18.95 | 9.67 | |||||||||||||||||||||||||
| 6 Truist Bank (GA) |
1 | 66,218 | 4.25 | 60,867 | 4.25 | 8.79 | 8.66 | |||||||||||||||||||||||||
|
Market Total |
10 | 1,556,848 | 100.00 | 1,432,035 | 100.00 | 8.72 | 5.32 | |||||||||||||||||||||||||
|
Leon County, Florida |
||||||||||||||||||||||||||||||||
| 1 Truist Bank (NC) |
9 | 1,993,157 | 23.14 | 2,094,297 | 26.44 | (4.83 | ) | 6.13 | ||||||||||||||||||||||||
|
2 Wells Fargo Bank NA (CA) |
6 | 1,294,270 | 15.03 | 1,148,843 | 14.50 | 12.66 | 15.13 | |||||||||||||||||||||||||
|
3 Capital City Bank (FL) |
14 | 1,148,163 | 13.33 | 1,025,384 | 12.95 | 11.97 | 8.03 | |||||||||||||||||||||||||
|
4 Bank of America NA (NC) |
7 | 1,087,894 | 12.63 | 957,815 | 12.09 | 13.58 | 9.05 | |||||||||||||||||||||||||
|
5 Regions Bank (AL) |
4 | 547,977 | 6.36 | 427,005 | 5.39 | 28.33 | 9.01 | |||||||||||||||||||||||||
|
6 Prime Meridian Bank (FL) |
2 | 449,720 | 5.22 | 343,057 | 4.33 | 31.09 | 17.45 | |||||||||||||||||||||||||
|
7 Hancock Whitney Bank (MS) |
3 | 408,667 | 4.75 | 349,819 | 4.42 | 16.82 | 13.95 | |||||||||||||||||||||||||
|
8 The First - Nat’l. Banking Assn. (MS) |
6 | 366,789 | 4.26 | 360,121 | 4.55 | 1.85 | 1.11 | |||||||||||||||||||||||||
|
9 Synovus Bank (GA) |
4 | 364,305 | 4.23 | 332,557 | 4.20 | 9.55 | 6.64 | |||||||||||||||||||||||||
|
10 Centennial Bank (AR) |
6 | 328,631 | 3.82 | 282,252 | 3.56 | 16.43 | 0.93 | |||||||||||||||||||||||||
|
11 First American Trust FSB (CA) |
1 | 317,097 | 3.68 | 327,579 | 4.14 | (3.20 | ) | (7.15 | ) | |||||||||||||||||||||||
|
12 Ameris Bank (GA) |
2 | 107,199 | 1.24 | 134,161 | 1.69 | (20.10 | ) | 34.73 | ||||||||||||||||||||||||
|
13 TC Federal Bank (GA) |
1 | 62,642 | 0.73 | 46,319 | 0.58 | 35.24 | NA | |||||||||||||||||||||||||
|
14 American Commerce Bank NA (GA) |
1 | 52,815 | 0.61 | 54,074 | 0.68 | (2.33 | ) | 7.44 | ||||||||||||||||||||||||
|
15 Thomasville National Bank (GA) |
1 | 34,740 | 0.40 | NA | NA | NA | NA | |||||||||||||||||||||||||
|
16 PeoplesSouth Bank (GA) |
2 | 28,876 | 0.34 | 27,381 | 0.35 | 5.46 | (15.22 | ) | ||||||||||||||||||||||||
|
17 JPMorgan Chase Bank NA (NY) |
2 | 19,444 | 0.23 | 9,710 | 0.12 | 100.25 | NA | |||||||||||||||||||||||||
|
Market Total |
71 | 8,612,386 | 100.00 | 7,920,374 | 100.00 | 8.74 | 7.79 | |||||||||||||||||||||||||
Source: S&P Global Market Intelligence.
51
FELDMAN FINANCIAL ADVISORS, INC.
Tables 17 to 19 provide residential mortgage market share data for the top 25 lenders in Thomas County, Leon County, and Chatham County for 2018 and 2019, the most recent periods available for comparable data. Not all companies in the respective markets report the sourced data and the data may also include loan financings for multi-family residential dwellings. The Bank ranked eighth in Thomas County with 2019 residential mortgage originations of $4.9 million, 41st in Leon County with 2019 residential mortgage originations of $7.3 million, and 44th in Chatham County with 2019 residential mortgage originations of $7.3 million. Based on the reported data, the average residential mortgage loan funded by the Bank in Thomas County, Leon County, and Chatham County was approximately $143,000, $367,000, and $521,000, respectively, in 2019.
Competition for residential mortgage lending in these market areas is high. In addition to local and regional participants, many nationwide lenders are present in the Bank’s lending market. Out-of-state mortgage banking companies were prevalent among the top ten residential lenders in Leon and Chatham counties, while local and in-state lenders held more significant market share positions in Thomas County. The most active nationwide lenders operating in these local markets included Quicken Loans, University Lending, Certainty Home Loans, LoanDepot, Truist Bank, and Wells Fargo Bank. Thomasville National Bank ranked first in Thomas County in 2019 based on reported residential mortgage originations, while Capital City Bank and BankSouth ranked first in Leon County and Chatham County, respectively.
52
FELDMAN FINANCIAL ADVISORS, INC.
Table 17
Residential Mortgage Lending Market Share
Thomas County, Georgia
Data for 2018 and 2019
| 2019 Rank |
2018 Rank |
Company (State) | Type | 2019 Funded Loans ($000) |
2019 Market Share (%) |
2018 Funded Loans ($000) |
2018 Market Share (%) |
|||||||||||||||||
| 1 | 2 | Thomasville Bancshares Inc. (GA) |
Bank |
28,090 | 17.69 | 20,455 | 11.35 | |||||||||||||||||
| 2 | 30 | Renasant Corp. (MS) |
Bank |
13,490 | 8.50 | 770 | 0.43 | |||||||||||||||||
| 3 | 3 | Synovus Financial Corp. (GA) |
Bank |
12,215 | 7.69 | 16,550 | 9.19 | |||||||||||||||||
| 4 | 6 | Quicken Loans LLC (MI) |
Mortgage Bank |
10,805 | 6.81 | 7,120 | 3.95 | |||||||||||||||||
| 5 | 4 | FB Financial Corp. (TN) |
Bank |
10,735 | 6.76 | 15,385 | 8.54 | |||||||||||||||||
| 6 | 51 | Flagstar Bank FSB (MI) |
Thrift |
7,860 | 4.95 | 350 | 0.19 | |||||||||||||||||
| 7 | NA | Arbor Realty Trust Inc. (NY) |
Investment Co. |
7,405 | 4.66 | 0 | 0.00 | |||||||||||||||||
| 8 | 5 | TC Federal Bank (GA) |
Thrift |
4,870 | 3.07 | 8,700 | 4.83 | |||||||||||||||||
| 9 | 9 | First Bancshares Inc. (MS) |
Bank |
4,065 | 2.56 | 3,830 | 2.13 | |||||||||||||||||
| 10 | NA | Berkeley Point Capital LLC (MD) |
Mortgage Bank |
3,825 | 2.41 | 0 | 0.00 | |||||||||||||||||
| 11 | 89 | Envision CU (FL) |
Credit Union |
3,295 | 2.08 | 130 | 0.07 | |||||||||||||||||
| 12 | 20 | Movement Mortgage LLC (SC) |
Mortgage Bank |
3,035 | 1.91 | 1,690 | 0.94 | |||||||||||||||||
| 13 | 21 | United Wholesale Mortgage (MI) |
Mortgage Bank |
2,235 | 1.41 | 1,115 | 0.62 | |||||||||||||||||
| 14 | 112 | GMFS LLC (LA) |
Mortgage Bank |
2,215 | 1.40 | 0 | 0.00 | |||||||||||||||||
| 15 | 11 | Mainstreet Community Bank (FL) |
Bank |
2,030 | 1.28 | 3,420 | 1.90 | |||||||||||||||||
| 16 | 10 | Ameris Bancorp (GA) |
Bank |
1,745 | 1.10 | 3,570 | 1.98 | |||||||||||||||||
| 17 | 14 | Truist Financial Corp. (NC) |
Bank |
1,675 | 1.06 | 2,355 | 1.31 | |||||||||||||||||
| 18 | 13 | Wells Fargo & Co. (CA) |
Bank |
1,590 | 1.00 | 2,420 | 1.34 | |||||||||||||||||
| 19 | 18 | LoanDepot Holdings LLC |
Mortgage Bank |
1,470 | 0.93 | 2,015 | 1.12 | |||||||||||||||||
| 20 | 19 | Navy FCU (VA) |
Credit Union |
1,355 | 0.85 | 1,765 | 0.98 | |||||||||||||||||
| 21 | 23 | Mortgage Research Center (MO) |
Mortgage Bank |
1,100 | 0.69 | 1,060 | 0.59 | |||||||||||||||||
| 22 | 41 | U.S. Bancorp (MN) |
Bank |
1,090 | 0.69 | 485 | 0.27 | |||||||||||||||||
| 23 | 14 | United Svcs. Automobile Assn. (TX) |
Insurance Co. |
975 | 0.61 | 2,355 | 1.31 | |||||||||||||||||
| 24 | 25 | First Commerce Credit Union (FL) |
Credit Union |
905 | 0.57 | 965 | 0.54 | |||||||||||||||||
| 25 | NA | TJC Mortgage Inc. (AL) |
Mortgage Bank |
880 | 0.55 | 0 | 0.00 | |||||||||||||||||
| Total for Lenders in Market | 158,750 | 180,155 | ||||||||||||||||||||||
Source: S&P Global Market Intelligence.
53
FELDMAN FINANCIAL ADVISORS, INC.
Table 18
Residential Mortgage Lending Market Share
Leon County, Florida
Data for 2018 and 2019
| 2019 Rank |
2018 Rank |
Company (State) | Type | 2019 Funded Loans ($000) |
2019 Market Share (%) |
2018 Funded Loans ($000) |
2018 Market Share (%) |
|||||||||||||||||
| 1 | 1 | Capital City Bank Group Inc. (FL) |
Bank |
147,920 | 10.08 | 117,370 | 9.93 | |||||||||||||||||
| 2 | 5 | Quicken Loans LLC (MI) |
Mortgage Bank |
97,775 | 6.66 | 54,375 | 4.60 | |||||||||||||||||
| 3 | 2 | University Bancorp Inc. (MI) |
Bank |
92,860 | 6.33 | 95,505 | 8.08 | |||||||||||||||||
| 4 | 4 | Truist Financial Corp. (NC) |
Bank |
73,585 | 5.01 | 68,330 | 5.78 | |||||||||||||||||
| 5 | 54 | GMFS LLC (LA) |
Mortgage Bank |
69,385 | 4.73 | 3,080 | 0.26 | |||||||||||||||||
| 6 | 3 | Ameris Bancorp (GA) |
Bank |
55,615 | 3.79 | 94,515 | 8.00 | |||||||||||||||||
| 7 | 6 | Walker & Dunlop Inc. (MD) |
Specialty Lender |
50,525 | 3.44 | 53,020 | 4.49 | |||||||||||||||||
| 8 | 17 | Movement Mortgage LLC (SC) |
Mortgage Bank |
44,370 | 3.02 | 17,105 | 1.45 | |||||||||||||||||
| 9 | 241 | M&T Bank Corp. (NY) |
Bank |
43,180 | 2.94 | 105 | 0.01 | |||||||||||||||||
| 10 | 8 | Hancock Whitney Corp. (MS) |
Bank |
35,040 | 2.39 | 49,225 | 4.16 | |||||||||||||||||
| 11 | 31 | Greystone Servicing Corp. LLC (VA) |
Mortgage Bank |
31,600 | 2.15 | 7,665 | 0.65 | |||||||||||||||||
| 12 | 7 | Berkshire Hathaway Inc. (NE) |
Insurance Co. |
30,040 | 2.05 | 49,960 | 4.23 | |||||||||||||||||
| 13 | 24 | LoanDepot Holdings LLC |
Mortgage Bank |
28,740 | 1.96 | 9,245 | 0.78 | |||||||||||||||||
| 14 | 13 | Synovus Financial Corp. (GA) |
Bank |
28,625 | 1.95 | 21,520 | 1.82 | |||||||||||||||||
| 15 | NA | RCC Real Estate Inc. (PA) |
Mortgage Bank |
28,065 | 1.91 | 0 | 0.00 | |||||||||||||||||
| 16 | 15 | First Commerce Credit Union (FL) |
Credit Union |
23,540 | 1.60 | 18,495 | 1.56 | |||||||||||||||||
| 17 | 14 | CrossCountry Mortgage LLC (OH) |
Mortgage Bank |
23,365 | 1.59 | 19,860 | 1.68 | |||||||||||||||||
| 18 | 10 | Wells Fargo & Co. (CA) |
Bank |
21,990 | 1.50 | 34,270 | 2.90 | |||||||||||||||||
| 19 | 89 | Envision CU (FL) |
Credit Union |
21,585 | 1.47 | 1,260 | 0.11 | |||||||||||||||||
| 20 | 12 | Bank of America Corporation (NC) |
Bank |
19,715 | 1.34 | 26,290 | 2.22 | |||||||||||||||||
| 21 | NA | Arbor Realty Trust Inc. (NY) |
Investment Co. |
19,500 | 1.33 | 0 | 0.00 | |||||||||||||||||
| 22 | 9 | Prime Meridian Holding Co. (FL) |
Bank |
19,075 | 1.30 | 35,945 | 3.04 | |||||||||||||||||
| 23 | 21 | United Svcs. Automobile Assn. (TX) |
Insurance Co. |
17,060 | 1.16 | 11,930 | 1.01 | |||||||||||||||||
| 24 | 16 | First Bancshares Inc. (MS) |
Bank |
16,955 | 1.16 | 18,220 | 1.54 | |||||||||||||||||
| 25 | 27 | United Wholesale Mortgage (MI) |
Mortgage Bank |
16,560 | 1.13 | 8,200 | 0.69 | |||||||||||||||||
| 41 | 19 | TC Federal Bank (GA) |
Thrift |
7,330 | 0.50 | 13,015 | 1.10 | |||||||||||||||||
| Total for Lenders in Market | 1,467,735 | 1,182,115 | ||||||||||||||||||||||
Source: S&P Global Market Intelligence.
54
FELDMAN FINANCIAL ADVISORS, INC.
Table 19
Residential Mortgage Lending Market Share
Chatham County, Georgia
Data for 2018 and 2019
| 2019 Rank |
2018 Rank |
Company (State) | Type | 2019 Funded Loans ($000) |
2019 Market Share (%) |
2018 Funded Loans ($000) |
2018 Market Share (%) |
|||||||||||||||||
| 1 | 2 | BankSouth Holding Co. (GA) |
Thrift |
104,220 | 5.80 | 99,580 | 6.15 | |||||||||||||||||
| 2 | 7 | Quicken Loans LLC (MI) |
Mortgage Bank |
100,900 | 5.62 | 65,740 | 4.06 | |||||||||||||||||
| 3 | 6 | South State Corporation (FL) |
Bank |
97,090 | 5.41 | 70,465 | 4.35 | |||||||||||||||||
| 4 | 3 | Ameris Bancorp (GA) |
Bank |
90,125 | 5.02 | 91,500 | 5.65 | |||||||||||||||||
| 5 | 39 | Broker Solutions Inc. (CA) |
Mortgage Bank |
79,115 | 4.41 | 9,230 | 0.57 | |||||||||||||||||
| 6 | 4 | Truist Financial Corp. (NC) |
Bank |
77,505 | 4.32 | 90,570 | 5.59 | |||||||||||||||||
| 7 | 8 | Synovus Financial Corp. (GA) |
Bank |
63,590 | 3.54 | 58,820 | 3.63 | |||||||||||||||||
| 8 | 1 | Certainty Home Loans LLC (TX) |
Mortgage Bank |
63,570 | 3.54 | 102,825 | 6.35 | |||||||||||||||||
| 9 | 5 | Wells Fargo & Co. (CA) |
Bank |
57,955 | 3.23 | 74,355 | 4.59 | |||||||||||||||||
| 10 | 11 | Mortgage Research Center (MO) |
Mortgage Bank |
49,605 | 2.76 | 41,080 | 2.54 | |||||||||||||||||
| 11 | 9 | Bank of America Corporation (NC) |
Bank |
45,080 | 2.51 | 51,975 | 3.21 | |||||||||||||||||
| 12 | 16 | Navy FCU (VA) |
Credit Union |
35,540 | 1.98 | 30,110 | 1.86 | |||||||||||||||||
| 13 | 19 | Guild Mortgage Co. (CA) |
Mortgage Bank |
34,470 | 1.92 | 22,735 | 1.40 | |||||||||||||||||
| 14 | 12 | United Community Banks Inc. (GA) |
Bank |
32,450 | 1.81 | 40,200 | 2.48 | |||||||||||||||||
| 15 | 13 | United Svcs. Automobile Assn. (TX) |
Insurance Co. |
30,500 | 1.70 | 32,525 | 2.01 | |||||||||||||||||
| 16 | 298 | Citigroup Inc. (NY) |
Bank |
30,285 | 1.69 | 85 | 0.01 | |||||||||||||||||
| 17 | 18 | SWBC Mortgage Corp. (TX) |
Mortgage Bank |
29,335 | 1.63 | 25,065 | 1.55 | |||||||||||||||||
| 18 | 17 | Walker & Dunlop Inc. (MD) |
Specialty Lender |
28,925 | 1.61 | 25,415 | 1.57 | |||||||||||||||||
| 19 | 20 | LoanDepot Holdings LLC |
Mortgage Bank |
28,430 | 1.58 | 22,675 | 1.40 | |||||||||||||||||
| 20 | 31 | Freedom Mortgage Corp. (NJ) |
Mortgage Bank |
27,645 | 1.54 | 12,290 | 0.76 | |||||||||||||||||
| 21 | 23 | Flagstar Bank FSB (MI) |
Thrift |
24,265 | 1.35 | 19,835 | 1.22 | |||||||||||||||||
| 22 | 43 | Renasant Corp. (MS) |
Bank |
22,270 | 1.24 | 7,315 | 0.45 | |||||||||||||||||
| 23 | 41 | United Wholesale Mortgage (MI) |
Mortgage Bank |
21,985 | 1.22 | 8,280 | 0.51 | |||||||||||||||||
| 24 | 22 | Movement Mortgage LLC (SC) |
Mortgage Bank |
21,470 | 1.20 | 21,030 | 1.30 | |||||||||||||||||
| 25 | 21 | Fairway Independent Mortgage (WI) |
Mortgage Bank |
20,135 | 1.12 | 21,850 | 1.35 | |||||||||||||||||
| 44 | 56 | TC Federal Bank (GA) |
Thrift |
7,290 | 0.41 | 3,940 | 0.24 | |||||||||||||||||
| Total for Lenders in Market | 1,795,970 | 1,620,350 | ||||||||||||||||||||||
Source: S&P Global Market Intelligence.
55
FELDMAN FINANCIAL ADVISORS, INC.
Summary Outlook
The Bank has reported low to moderate levels of core earnings profitability over the past five years. The Bank’s ROA in 2018, 2019, and 2020 amounted to 0.24%, 0.39%, and 0.09%, respectively. The path to improved profitability for the Bank has been impeded by low levels of non-interest income and comparatively high levels of non-interest expense. The Bank has progressed steadily in growing its balance sheet and maintaining sound asset quality. The opening of a branch office in Tallahassee and two lending offices has broadened the Bank’s geographic reach and business development activities.
The Bank’s net interest margin remains under pressure in the current interest rate environment and its efficiency ratio, while showing some signs of improvement, is still above peer group averages. In addition, the Bank’s profitability has been tasked with absorbing the infrastructure, systems, and staffing investments in current periods while TC Federal Bank positions itself to take advantage of future growth opportunities. The Bank completed a core data processing conversion in 2020 with the additional costs impacting profitability. However, the Bank believes that these capital investments are necessary to grow the Bank in a scalable fashion that will result in increased earnings and enhanced efficiency. The Bank believes that it can successfully leverage its operating expense base to generate increased levels of net interest and non-interest income by increasing its product and service penetration with existing customers and enhancing its market perception as a viable community banking organization capable of serving the full complement of retail and commercial banking needs of new customers.
TC Federal Bank plans to continue its emphasis on residential and commercial real estate lending. The residential lending operations will continue to sell a portion of fixed-rate residential mortgage loan originations, providing the Bank with a source of revenue from gains on the sale of
56
FELDMAN FINANCIAL ADVISORS, INC.
such loans. The commercial real estate lending operations will provide the Bank with higher yielding loans and banking relationships that also generate low-cost deposit balances and ancillary non-interest income.
A key element of the Bank’s operating strategy is to continue to aggressively manage credit risk, so as to continue to maintain the Bank’s favorable measures of credit quality. The Bank estimates that it can achieve higher profitability over future years in part through added efficiencies gained through growth in the earning asset base without adding additional infrastructure, which has already been put in place to facilitate and manage such growth. Furthermore, management believes that it can effectively position the Bank to capture additional loan and deposit market share as customers’ banking relationships are disrupted by the continued wave of consolidation among banking institutions in its local market areas.
57
FELDMAN FINANCIAL ADVISORS, INC.
II. COMPARISONS WITH PUBLICLY TRADED THRIFTS
General Overview
The comparative market approach provides a sound basis for determining estimates of going-concern valuations where a regular and active market exists for the stocks of peer institutions. The comparative market approach was utilized in determining the estimated pro forma market value of the Bank because: (1) reliable market and financial data are readily available for comparable institutions; (2) the comparative market method is required by the applicable regulatory guidelines; and (3) other alternative valuation methods (such as income capitalization, liquidation analysis, or discounted cash flow) are unlikely to produce a valuation relevant to the future trading patterns of the related equity interest. The generally employed valuation method in initial public offerings, where possible, is the comparative market approach, which also can be relied upon to determine pro forma market value in a thrift stock conversion.
The comparative market approach derives valuation benchmarks from the trading patterns of selected peer institutions which, due to certain factors such as financial performance and operating strategies, enable the appraiser to estimate the potential value of the subject institution in a stock conversion offering. The pricing and trading history of recent initial public offerings of thrifts are also examined to provide evidence of the “new issue discount” that must be considered. In Chapter II, our valuation analysis focuses on the selection and comparison of the Bank with a comparable group of publicly traded thrift institutions (the “Comparative Group”). Chapter III will detail any additional discounts or premiums that we believe are appropriate to the Bank’s pro forma market value.
58
FELDMAN FINANCIAL ADVISORS, INC.
Selection Criteria
Selected market price and financial performance data for all public thrifts listed on major stock exchanges are shown in Exhibit III. The list excludes companies that are subject to being acquired under a pending transaction and companies that have a majority ownership interest controlled by a mutual holding company. Several criteria, discussed below, were used to select the individual members of the Comparative Group from the overall universe of publicly traded thrifts.
| ● | Operating characteristics – An institution’s operating characteristics are the most important factors because they affect investors’ expected rates of return on a company’s stock under various business/economic scenarios, and they influence the market’s general perception of the quality and attractiveness of a given company. Operating characteristics, which may vary in importance during the business cycle, include financial variables such as profitability, balance sheet growth, capitalization, asset quality, and other factors such as lines of business and management strategies. |
| ● | Degree of marketability and liquidity – Marketability of a stock reflects the relative ease and promptness with which a security may be sold when desired, at a representative current price, without material concession in price merely because of the necessity of sale. Marketability also connotes the existence of buying interest as well as selling interest and is usually indicated by trading volumes and the spread between the bid and asked price for a security. Liquidity of the stock issue refers to the organized market exchange process whereby the security can be converted into cash. We attempted to limit our selection to companies that have access to a regular trading market or price quotations, and therefore only considered companies listed on major stock exchanges. We eliminated from the Comparative Group companies whose market prices were materially influenced by announced acquisitions or other unusual circumstances. However, the expectation of continued industry consolidation is currently embedded in thrift equity valuations. |
| ● | Geographic Location – The region of the country where a company operates is also of importance in selecting the comparative group. The operating environment for thrift institutions varies from region to region with respect to business and economic environments, real estate market conditions, speculative takeover activity, and investment climates. Economic and investor climates can also vary greatly within a region, particularly due to takeover activity. |
59
FELDMAN FINANCIAL ADVISORS, INC.
The operations of the Bank fit the general profile of a small-to-medium sized thrift institution, concentrating primarily on real estate lending in its local market and relying on retail deposits as a funding source. Residential mortgage loans remain the core product in the Bank’s loan portfolio, drawing upon its roots as a traditional home lender. However, the Bank has diversified its loan mix through the steady origination of commercial real estate, commercial business, and construction and land development loans.
In determining the Comparative Group composition, we focused on the Bank’s asset size, capitalization, asset quality, and earnings fundamentals. Attempting to concentrate on the Bank’s performance characteristics and to develop a meaningful number of comparables for valuation purposes, we expanded the criteria to include a statistically significant number of companies. In addition, because of the scarcity of candidates meeting the criteria precisely, we increased the asset size constraint to generate a meaningful number of comparables while maintaining non-size related characteristics. As with any composition of a group of comparable companies, the selection criteria were broadened sufficiently to assemble a meaningful number of members. We performed an initial screening for publicly traded thrifts headquartered in the Southeastern region of the United States with total assets less than $1.0 billion. We then expanded the selection criteria to other geographic regions and applied the following selection criteria:
| ● | Publicly traded thrift – stock-form thrift whose shares are traded on the New York Stock Exchange (“NYSE”), NYSE American, or NASDAQ Stock Market. |
| ● | Excludes mutual holding companies – company’s corporate structure is organized in fully converted stock form and excludes companies whose majority ownership interest is held by a mutual holding company. |
| ● | Seasoned trading issue – company has been publicly traded for at least one year. |
| ● | Non-acquisition target – company is not subject to a pending acquisition. |
| ● | Asset size – total assets less than $1.0 billion. |
| ● | Capital level – tangible common equity to tangible assets greater than 4.50%. |
60
FELDMAN FINANCIAL ADVISORS, INC.
| ● | Profitability – ROA greater than 0.00%. |
| ● | Credit quality – non-performing assets to total assets less than 2.0%. |
As a result of applying the stated criteria, the screening process produced a reliable representation of public thrifts. A general operating summary of the 10 companies included in the Comparative Group is presented in Table 20. All of the selected companies are traded on the NASDAQ Stock Market. The Comparative Group ranged in asset size from $232.2 million at CBM Bancorp to $909.6 million at HMN Financial. The median asset size of the Comparative Group was $437.2 million and reasonably comparable to the Bank’s total assets of $349.9 million as of December 31, 2020.
The Comparative Group includes one company based in the Southeastern region, Home Federal Bancorp of Shreveport, Louisiana. The Comparative Group’s remaining members are distributed among the Midwest (five companies) and the Mid-Atlantic (four companies) regions. Most of the public thrifts in the Southeastern region were excluded because either the company was not traded on a major stock exchange and/or it was a mutual holding company (“MHC”). Affinity Bancshares in Georgia completed its second-step conversion from an MHC to a fully-stock company in January 2021, but its new stock issue has not been trading for at least one year.
The Comparative Group companies based in the Mid-Atlantic states include CBM Bancorp (Maryland), Elmira Savings Bank (New York), HV Bancorp (Pennsylvania), and WVS Financial Corp. (Pennsylvania). The five members located in the Midwest include Cincinnati Bancorp (Ohio), FFBW (Wisconsin), HMN Financial (Minnesota), IF Bancorp (Illinois), and Mid-Southern Bancorp (Indiana). While some differences inevitably may exist between the Bank and the individual companies, we believe that the chosen Comparative Group on the whole provides a meaningful basis of financial comparison for valuation purposes.
61
FELDMAN FINANCIAL ADVISORS, INC.
Table 20
Comparative Group Operating Summary
As of December 31, 2020
| Company | City | St. | No. of Offices |
Initial Public Offering Date |
Total Assets ($Mil.) |
Tang. Equity/ Assets (%) |
||||||||||||||||||
| TC Federal Bank |
Thomasville | GA | 2 | NA | $ | 349.9 | 11.39 | |||||||||||||||||
| Comparative Group |
||||||||||||||||||||||||
| CBM Bancorp, Inc. (1) |
Baltimore | MD | 4 | 09/27/18 | 232.2 | 22.94 | ||||||||||||||||||
| Cincinnati Bancorp, Inc. |
Cincinnati | OH | 6 | 10/14/15 | 237.1 | 17.50 | ||||||||||||||||||
| Elmira Savings Bank |
Elmira | NY | 12 | 03/01/85 | 644.6 | 9.43 | ||||||||||||||||||
| FFBW, Inc. |
Brookfield | WI | 7 | 10/10/17 | 339.0 | 30.46 | ||||||||||||||||||
| HMN Financial, Inc. |
Rochester | MN | 14 | 06/30/94 | 909.6 | 11.35 | ||||||||||||||||||
| Home Federal Bancorp, Inc. |
Shreveport | LA | 8 | 01/18/05 | 535.4 | 9.61 | ||||||||||||||||||
| HV Bancorp, Inc. |
Doylestown | PA | 5 | 01/11/17 | 861.6 | 4.52 | ||||||||||||||||||
| IF Bancorp, Inc. |
Watseka | IL | 8 | 07/07/11 | 713.4 | 11.90 | ||||||||||||||||||
|
Mid-Southern Bancorp |
Salem | IN | 3 | 04/08/98 | 235.4 | 20.82 | ||||||||||||||||||
| WVS Financial Corp. |
Pittsburgh | PA | 6 | 11/29/93 | 317.4 | 12.11 | ||||||||||||||||||
(1) As of September 30, 2020.
Source: TC Federal Bank; S&P Global Market Intelligence.
62
FELDMAN FINANCIAL ADVISORS, INC.
Recent Financial Comparisons
Table 21 summarizes certain key financial comparisons between the Bank and the Comparative Group. Tables 22 through 26 contain the detailed financial comparisons of the Bank with the individual Comparative Group companies based on measures of profitability, income and expense components, capital levels, balance sheet composition, asset quality, and growth rates. Financial data for the Bank, the Comparative Group, and All Public Thrift aggregate were utilized for the latest available period as of or for the last twelve months (“LTM”) ended December 31, 2020.
The Bank’s LTM ROA was 0.09%, reflecting profitability below the Comparative Group median of 0.67% and the All Public Thrift median of 0.77%. The Bank’s lower ROA was attributable mainly to a higher efficiency ratio and a lower level of non-interest income. The Bank’s LTM ROE was 0.76% and also lagged the Comparative Group median of 6.50% and the All Public Thrift median of 6.52%. The Bank’s ROA was below the ROA results of all the members of the Comparative Group. The lowest ROA results in the Comparative Group were generated by CBM Bancorp, WVS Financial, and Mid-Southern Bancorp at 0.32%, 0.50%, and 0.55%, respectively.
Based on core earnings (as adjusted to exclude income taxes, intangibles amortization expense, and non-recurring items), the Bank’s core profitability was also lower than the Comparative Group’s levels. The Bank’s LTM core earnings ratio measured 0.48% of average assets and positioned below the corresponding Comparative Group median of 0.64% and the All Public Thrift median of 0.78%. The Bank’s core earnings exclude the impact of $1.1 million in data processing conversion costs and $506,000 in expenses of the delayed capital offering incurred in the LTM ended December 31, 2020.
63
FELDMAN FINANCIAL ADVISORS, INC.
Table 21
Key Financial Comparisons
TC Federal Bank and the Comparative Group
As of or For the Last Twelve Months Ended December 31, 2020
| TC Federal Bank |
Comparative Group Median |
All Public Thrift Median | |||||||||||||
|
Profitability Ratios |
|||||||||||||||
| LTM Return on Average Assets (ROA) |
0.09 | % | 0.67 | % | 0.77 | % | |||||||||
| LTM Return on Average Equity (ROE) |
0.76 | 6.50 | 6.52 | ||||||||||||
| Core Return on Avg. Assets (Core ROA) |
0.48 | 0.64 | 0.78 | ||||||||||||
| Core Return on Avg. Equity (Core ROE) |
3.95 | 6.28 | 6.48 | ||||||||||||
| Net Interest Margin |
3.38 | 3.10 | 3.06 | ||||||||||||
| Efficiency Ratio |
91.16 | 71.81 | 62.55 | ||||||||||||
| Income and Expense (% of avg. assets) |
|||||||||||||||
| Total Interest Income |
3.90 | 3.54 | 3.57 | ||||||||||||
| Total Interest Expense |
0.71 | 0.67 | 0.71 | ||||||||||||
| Net Interest Income |
3.19 | 2.86 | 2.84 | ||||||||||||
| Provision for Loan Losses |
0.23 | 0.18 | 0.23 | ||||||||||||
| Other Operating Income |
0.60 | 0.87 | 0.62 | ||||||||||||
| Net Securities Gains and Non-rec. Income |
0.00 | 0.02 | 0.03 | ||||||||||||
| General and Administrative Expense |
2.97 | 2.72 | 2.56 | ||||||||||||
| Intangibles Amortization Expense |
0.00 | 0.00 | 0.00 | ||||||||||||
|
Non-recurring Expense |
0.49 | 0.00 | 0.00 | ||||||||||||
|
Pre-tax Core Earnings |
0.59 | 0.86 | 1.02 | ||||||||||||
| Equity Capital Ratios |
|||||||||||||||
| Total Equity / Total Assets |
11.39 | 12.00 | 11.56 | ||||||||||||
| Tangible Equity / Tangible Assets |
11.39 | 12.00 | 10.25 | ||||||||||||
| Growth Rates |
|||||||||||||||
| Total Assets |
8.75 | 9.77 | 14.14 | ||||||||||||
| Net Total Loans |
7.67 | 5.65 | 9.19 | ||||||||||||
| Total Deposits |
7.49 | 8.98 | 19.10 | ||||||||||||
64
FELDMAN FINANCIAL ADVISORS, INC.
Table 21 (continued)
Key Financial Comparisons
TC Federal Bank and the Comparative Group
As of or For the Last Twelve Months Ended December 31, 2020
| TC Federal Bank |
Comparative Group Median |
All Public Thrift Median | |||||||||||||
| Balance Sheet Composition (% of total assets) |
|||||||||||||||
| Cash and Securities |
18.34 | % | 26.40 | % | 19.86 | % | |||||||||
| Loans Receivable, net |
75.82 | 69.17 | 72.12 | ||||||||||||
| Real Estate Owned |
0.02 | 0.04 | 0.02 | ||||||||||||
| Intangible Assets |
0.00 | 0.00 | 0.33 | ||||||||||||
| Other Assets |
5.83 | 3.48 | 4.39 | ||||||||||||
| Total Deposits |
84.05 | 78.29 | 78.90 | ||||||||||||
| Borrowed Funds |
2.72 | 4.55 | 8.19 | ||||||||||||
| Other Liabilities |
1.84 | 0.81 | 1.34 | ||||||||||||
| Total Liabilities |
88.61 | 88.00 | 88.44 | ||||||||||||
| Total Equity |
11.39 | 12.00 | 11.56 | ||||||||||||
| Loan Portfolio Composition (% of total loans) |
|||||||||||||||
| Residential Real Estate Loans (1) |
42.88 | 50.03 | 23.75 | ||||||||||||
| Other Real Estate Loans |
44.05 | 37.76 | 47.80 | ||||||||||||
|
Non-Real Estate Loans |
13.07 | 16.99 | 28.45 | ||||||||||||
| Credit Risk Ratios |
|||||||||||||||
|
Non-performing Loans (2) / Total Loans |
0.85 | 0.62 | 0.87 | ||||||||||||
|
Non-performing Assets (2) / Total Assets |
0.68 | 0.52 | 0.69 | ||||||||||||
| Reserves / Non-performing Loans (2) |
177.81 | 127.03 | 106.08 | ||||||||||||
| Reserves / Total Loans |
1.53 | 1.11 | 1.13 | ||||||||||||
(1) Includes home equity loans.
(2) Includes accruing troubled debt restructurings.
Source: TC Federal Bank; S&P Global Market Intelligence.
As shown in Table 24, the Bank’s level of net interest income at 3.19% of average assets exceeded the Comparative Group median of 2.86%, owing to the Bank’s relatively high concentration of assets invested in loans and the yields earned from its diversified loan portfolio. The Bank’s total interest income measured 3.90% of average assets for the LTM period, exceeding
65
FELDMAN FINANCIAL ADVISORS, INC.
the Comparative Group median of 3.59%. The Bank’s interest expense amounted to 0.71% of average assets and was positioned slightly above the Comparative Group median of 0.67%. Unlike most banking institutions, the Bank was able to achieve an increase in its net interest spread during 2020, increasing from 3.07% in 2019 to 3.23% in 2020. The Bank’s weighted average yield on interest-earning assets decreased by 20 basis points from 4.32% for the year ended December 31, 2019 to 4.12% for the year ended December 31, 2020, while its weighted average cost of interest-bearing liabilities decreased by 36 basis points from 1.25% to 0.89%.
The Bank’s non-interest operating income totaled 0.60% of average assets, lagging behind the Comparative Group median of 0.87%. The Bank’s primary sources of non-interest income include service charges on deposit accounts, gains on sale of mortgage loans, and BOLI income. Most of the Comparative Group companies reported higher levels of non-interest income, particularly expanded revenue streams from service charges related to higher levels of transaction deposit account activity and from mortgage banking operations producing significant loan origination and servicing fees and gains on sale of loans.
The Bank’s loan loss provision amounted to 0.23% of average assets for the recent LTM period and was higher than the Comparative Group median of 0.15%. After three consecutive years of either making no provision charge or recording a credit for loan losses from 2017 to 2019, the Bank recorded a provision in 2020 to reflect steady loan portfolio growth and the potential economic impact of the coronavirus pandemic. The Bank recorded a provision for loan losses of zero for the year ended December 31, 2019. In prior years, the Bank recorded recovery credits of $1.9 million and $551,000 for the years ended December 31, 2017 and 2018, respectively. The Bank’s total non-performing assets (including accruing restructured loans) measured 0.68% at December 31, 2020, which was higher than the Comparative Group median of 0.62% and below
66
FELDMAN FINANCIAL ADVISORS, INC.
the All Public Thrift median of 0.87%. Although the Bank’s loan loss allowance had been reduced in prior years due to the credits instead of provisions, the Bank’s 1.53% ratio of loan loss allowance to total loans was higher than the corresponding Comparative Group median of 1.11% and All Public Thrift median of 1.13%. Furthermore, the Bank’s 177.8% ratio of loan loss allowance to total non-performing loans was positioned above the Comparative Group median of 127.0% and All Public Thrift median of 106.1%.
The Bank’s operating expense ratio at 2.97% of average assets was higher than the Comparative Group median of 2.76%. (The Bank’s operating expense ratio excludes non-recurring items related to the data processing conversion costs and expenses of the delayed capital offering in 2020.) The Bank’s 91.2% efficiency ratio (defined as non-interest expense less intangibles amortization expense as a percent of net interest income before provision plus non-interest operating income) compared unfavorably to the Comparative Group median of 71.8%. Only two members of the Comparative Group exhibited efficiency ratios above 80% with Mid-Southern Bancorp at 82.8% and CBM Bancorp at 82.9%. Excluding the data processing conversion costs and the expenses of the delayed capital offering, the Bank’s adjusted efficiency ratio of 78.3% would have still exceeded the Comparative Group median of 71.8%. Improving the efficiency ratio is a strategic goal for the Bank as it seeks to leverage the operating infrastructure and staffing resources in place to grow the balance sheet and generate increased levels of market share penetration and banking activity.
As reflected in Table 25, the overall balance sheet composition of the Bank reflected a slightly higher concentration of loans to assets versus that of the overall Comparative Group. The Bank’s net total loans amounted to 75.8 of total assets as of December 31, 2020, eclipsing the median of 69.2% for the Comparative Group. The Bank’s ratio of cash and securities to total
67
FELDMAN FINANCIAL ADVISORS, INC.
assets was 18.3% and slightly lower than the median of 26.4% for the Comparative Group. The Bank had no goodwill or other intangible assets on its balance sheet as of December 31, 2020, while its ratio of real estate owned at 0.02% of total assets was slightly lower than the Comparative Group median of 0.04%. The Bank’s ratio of other assets measured 5.8% and was higher than the Comparative Group median of 3.5%. The increase in the Bank’s other assets resulted primarily from the addition of BOLI to the balance sheet commencing in 2019.
The Bank recently has utilized borrowings as a supplemental source of funds on a limited basis. The Bank’s ratio of borrowed funds to total assets amounted to 2.7% at December 31, 2020 and was lower than the Comparative Group median of 4.6%. In contrast, the Bank’s deposit level at 84.1% of total assets was above the Comparative Group median of 78.3% of total assets. The Bank experienced strong deposit growth measuring 9.8% compounded annually over the past four years, due in large part to the opening of the new branch office in Tallahassee and the emphasis on core deposit growth. The Bank’s equity level before the Stock Offering was 11.4% relative to total assets as of December 31, 2020, which was moderately below the Comparative Group median of 12.0%.
The Bank’s level of residential real estate loans (including home equity loans) measured 42.9% of total loans based on regulatory financial data as of December 31, 2020, below the Comparative Group median of 50.0%. The Comparative Group includes a number of companies that maintain a traditional thrift orientation with a heavy emphasis on residential mortgage lending, while also including other companies that have progressed toward diversifying their loan portfolio composition.
The Bank’s concentration of non-residential real estate loans (commercial real estate, multi-family real estate, and construction and land development loans) represented 44.1% of total
68
FELDMAN FINANCIAL ADVISORS, INC.
loans and was higher than the Comparative Group median of 37.8%. The Bank exhibited a lower level of non-real estate loans, which accounted for 13.1% of total loans versus the Comparative Group median of 17.0%. The Bank has a limited amount of consumer loans, while its commercial business loan portfolio has begun to gain growth momentum in recent years, especially in 2020 as a result of the Bank’s PPP lending activity.
The Bank’s recent emphasis on balance sheet growth is reflected in the comparative growth rates. The Bank’s asset growth rate measured 8.8% over the recent LTM period versus the Comparative Group median asset growth rate of 9.8%. The Bank exhibited a deposit growth rate of 7.5% versus the Comparative Group median of 9.0%. The Bank’s loan growth rate of 7.7% was higher than the Comparative Group median of 5.7%.
In summary, the Bank’s recent earnings performance was below the results exhibited by the Comparative Group, while its capital ratios (before the effect of the Stock Offering) were relatively comparable and its asset quality ratios were slightly less favorable versus the levels represented by the Comparative Group medians. The Bank’s profitability was characterized by a higher operating expense ratio and a below-average but improving level of non-interest income. Similar to most financial institutions its size, the Bank is faced with the ongoing challenge of improving its efficiency ratio either through bolstering its net interest margin, enhancing non-interest income generation, or improving the efficiency and productivity of its operating infrastructure. The Bank’s earnings growth outlook will depend largely on its ability to maintain satisfactory loan quality as it grows the portfolio, to improve the net interest margin across movements in the interest rate environment, and to control non-interest expense as it seeks to expand its operations and transition to a public company.
69
FELDMAN FINANCIAL ADVISORS, INC.
Table 22
General Operating Characteristics
As of December 31, 2020
| Tang. | ||||||||||||||||||||||||||||||||||
| Total | Total | Total | Common | |||||||||||||||||||||||||||||||
| No. of | IPO | Assets | Deposits | Equity | Equity | |||||||||||||||||||||||||||||
| City/State | Ticker | Exchange | Offices | Date | ($000s) | ($000s) | ($000s) | ($000s) | ||||||||||||||||||||||||||
| TC Federal Bank |
Thomasville, GA | NA | NA | 2 | NA | 349,927 | 294,100 | 39,858 | 39,858 | |||||||||||||||||||||||||
| Comparative Group Average |
502,568 | 401,183 | 62,478 | 61,095 | ||||||||||||||||||||||||||||||
| Comparative Group Median |
437,183 | 352,242 | 52,359 | 50,233 | ||||||||||||||||||||||||||||||
| Comparative Group |
||||||||||||||||||||||||||||||||||
| CBM Bancorp, Inc. (1) |
Baltimore, MD | CBMB | NASDAQ | 4 | 09/27/18 | 232,186 | 172,385 | 53,256 | 53,256 | |||||||||||||||||||||||||
| Cincinnati Bancorp, Inc. |
Cincinnati, OH | CNNB | NASDAQ | 6 | 10/14/15 | 237,134 | 152,207 | 41,503 | 41,330 | |||||||||||||||||||||||||
| Elmira Savings Bank |
Elmira, NY | ESBK | NASDAQ | 12 | 03/01/85 | 644,587 | 547,021 | 60,761 | 48,391 | |||||||||||||||||||||||||
| FFBW, Inc. |
Brookfield, WI | FFBW | NASDAQ | 7 | 10/10/17 | 338,972 | 226,625 | 103,265 | 102,841 | |||||||||||||||||||||||||
| HMN Financial, Inc. |
Rochester, MN | HMNF | NASDAQ | 14 | 06/30/94 | 909,580 | 795,204 | 103,252 | 102,393 | |||||||||||||||||||||||||
| Home Federal Bancorp, Inc. |
Shreveport, LA | HFBL | NASDAQ | 8 | 01/18/05 | 535,394 | 477,859 | 51,462 | 51,462 | |||||||||||||||||||||||||
| HV Bancorp, Inc. |
Doylestown, PA | HVBC | NASDAQ | 5 | 01/11/17 | 861,621 | 730,826 | 38,927 | 38,927 | |||||||||||||||||||||||||
| IF Bancorp, Inc. |
Watseka, IL | IROQ | NASDAQ | 8 | 07/07/11 | 713,399 | 587,365 | 84,918 | 84,918 | |||||||||||||||||||||||||
| Mid-Southern Bancorp, Inc. |
Salem, IN | MSVB | NASDAQ | 3 | 04/08/98 | 235,363 | 174,113 | 49,004 | 49,004 | |||||||||||||||||||||||||
| WVS Financial Corp. |
Pittsburgh, PA | WVFC | NASDAQ | 6 | 11/29/93 | 317,444 | 148,223 | 38,427 | 38,427 | |||||||||||||||||||||||||
| (1) | As of September 30, 2020 |
Source: TC Federal Bank; S&P Global Market Intelligence.
70
FELDMAN FINANCIAL ADVISORS, INC.
Table 23
General Financial Performance Ratios
As of or For the Last Twelve Months Ended December 31, 2020
| Total | Tang. | Net | ||||||||||||||||||||||||||||||||||||||
| Total | Total | Equity/ | Equity/ | Interest | Effcy. | LTM | LTM | Core | Core | |||||||||||||||||||||||||||||||
| Assets | Deposits | Assets | Assets | Margin | Ratio | ROA | ROE | ROA | ROE | |||||||||||||||||||||||||||||||
| ($000s) | ($000s) | (%) | (%) | (%) | (%) | (%) | (%) | (%) | (%) | |||||||||||||||||||||||||||||||
| TC Federal Bank |
349,927 | 294,100 | 11.39 | 11.39 | 3.38 | 91.16 | 0.09 | 0.76 | 0.48 | 3.95 | ||||||||||||||||||||||||||||||
| Comparative Group Average |
502,568 | 401,183 | 15.06 | 14.86 | 2.95 | 70.43 | 0.80 | 6.98 | 0.79 | 6.84 | ||||||||||||||||||||||||||||||
| Comparative Group Median |
437,183 | 352,242 | 12.00 | 12.00 | 3.10 | 71.81 | 0.67 | 6.50 | 0.64 | 6.28 | ||||||||||||||||||||||||||||||
| All Public Thrift Average |
5,185,779 | 3,695,042 | 12.34 | 11.47 | 3.11 | 64.62 | 0.93 | 7.77 | 0.97 | 8.05 | ||||||||||||||||||||||||||||||
| All Public Thrift Median |
1,722,094 | 1,354,317 | 11.56 | 10.39 | 3.06 | 62.55 | 0.77 | 6.52 | 0.78 | 6.48 | ||||||||||||||||||||||||||||||
| Comparative Group |
||||||||||||||||||||||||||||||||||||||||
| CBM Bancorp, Inc. (1) |
232,186 | 172,385 | 22.94 | 22.94 | 3.37 | 82.94 | 0.32 | 1.27 | 0.27 | 1.07 | ||||||||||||||||||||||||||||||
| Cincinnati Bancorp, Inc. |
237,134 | 152,207 | 17.50 | 17.44 | 2.58 | 73.49 | 1.36 | 9.46 | 1.36 | 9.46 | ||||||||||||||||||||||||||||||
| Elmira Savings Bank |
644,587 | 547,021 | 9.43 | 7.66 | 3.06 | 71.82 | 0.64 | 6.95 | 0.64 | 6.97 | ||||||||||||||||||||||||||||||
| FFBW, Inc. |
338,972 | 226,625 | 30.46 | 30.38 | 3.40 | 72.71 | 0.62 | 2.14 | 0.61 | 2.13 | ||||||||||||||||||||||||||||||
| HMN Financial, Inc. |
909,580 | 795,204 | 11.35 | 11.27 | 3.51 | 61.04 | 1.21 | 10.56 | 1.21 | 10.56 | ||||||||||||||||||||||||||||||
| Home Federal Bancorp, Inc. |
535,394 | 477,859 | 9.61 | 9.61 | 3.36 | 62.00 | 0.93 | 9.30 | 0.89 | 8.96 | ||||||||||||||||||||||||||||||
| HV Bancorp, Inc. |
861,621 | 730,826 | 4.52 | 4.52 | 2.57 | 67.04 | 1.23 | 16.90 | 1.21 | 16.57 | ||||||||||||||||||||||||||||||
| IF Bancorp, Inc. |
713,399 | 587,365 | 11.90 | 11.90 | 2.79 | 71.80 | 0.70 | 6.06 | 0.64 | 5.60 | ||||||||||||||||||||||||||||||
| Mid-Southern Bancorp, Inc. |
235,363 | 174,113 | 20.82 | 20.82 | 3.13 | 82.77 | 0.55 | 2.39 | 0.51 | 2.23 | ||||||||||||||||||||||||||||||
| WVS Financial Corp. |
317,444 | 148,223 | 12.11 | 12.11 | 1.68 | 58.73 | 0.50 | 4.81 | 0.51 | 4.90 | ||||||||||||||||||||||||||||||
| (1) | As of or for the last twelve months ended September 30, 2020 |
Source: TC Federal Bank; S&P Global Market Intelligence.
71
FELDMAN FINANCIAL ADVISORS, INC.
Table 24
Income and Expense Analysis
For the Last Twelve Months Ended December 31, 2020
| As a Percent of Average Assets | ||||||||||||||||||||||||||||||||||||||||
| Interest Income |
Interest Expense |
Net Interest Income |
Other Oper. Income |
Gains & Non-rec. Income |
Loan Loss Prov. |
Gen. & Admin. Expense |
Amort. of Intang. |
Non-rec. Expense |
Pre-tax Core Earnings |
|||||||||||||||||||||||||||||||
| TC Federal Bank |
3.90 | 0.71 | 3.19 | 0.60 | 0.00 | 0.23 | 2.97 | 0.00 | 0.49 | 0.59 | ||||||||||||||||||||||||||||||
| Comparative Group Average |
3.46 | 0.70 | 2.76 | 1.41 | 0.02 | 0.18 | 2.95 | 0.00 | 0.00 | 1.04 | ||||||||||||||||||||||||||||||
| Comparative Group Median |
3.54 | 0.67 | 2.86 | 0.87 | 0.02 | 0.18 | 2.72 | 0.00 | 0.00 | 0.86 | ||||||||||||||||||||||||||||||
| All Public Thrift Average |
3.66 | 0.73 | 2.93 | 1.36 | 0.07 | 0.29 | 2.75 | 0.02 | 0.05 | 1.21 | ||||||||||||||||||||||||||||||
| All Public Thrift Median |
3.57 | 0.71 | 2.84 | 0.62 | 0.03 | 0.23 | 2.56 | 0.00 | 0.00 | 1.02 | ||||||||||||||||||||||||||||||
| Comparative Group |
||||||||||||||||||||||||||||||||||||||||
| CBM Bancorp, Inc. (1) |
3.90 | 0.66 | 3.24 | 0.50 | 0.06 | 0.19 | 3.14 | 0.00 | 0.00 | 0.41 | ||||||||||||||||||||||||||||||
| Cincinnati Bancorp, Inc. |
3.46 | 1.12 | 2.34 | 4.59 | 0.00 | 0.11 | 5.09 | 0.01 | 0.00 | 1.72 | ||||||||||||||||||||||||||||||
| Elmira Savings Bank |
3.47 | 0.91 | 2.56 | 1.12 | 0.00 | 0.22 | 2.64 | 0.00 | 0.00 | 0.81 | ||||||||||||||||||||||||||||||
| FFBW, Inc. |
3.75 | 0.55 | 3.21 | 0.38 | 0.00 | 0.18 | 2.60 | 0.01 | 0.00 | 0.81 | ||||||||||||||||||||||||||||||
| HMN Financial, Inc. |
3.74 | 0.33 | 3.41 | 1.75 | 0.00 | 0.32 | 3.15 | 0.01 | 0.00 | 1.69 | ||||||||||||||||||||||||||||||
| Home Federal Bancorp, Inc. |
4.04 | 0.86 | 3.19 | 1.01 | 0.04 | 0.41 | 2.66 | 0.00 | 0.00 | 1.13 | ||||||||||||||||||||||||||||||
| HV Bancorp, Inc. |
2.95 | 0.67 | 2.28 | 3.58 | 0.03 | 0.24 | 3.95 | 0.00 | 0.00 | 1.68 | ||||||||||||||||||||||||||||||
| IF Bancorp, Inc. |
3.60 | 0.90 | 2.71 | 0.74 | 0.07 | 0.07 | 2.47 | 0.00 | 0.00 | 0.90 | ||||||||||||||||||||||||||||||
| Mid-Southern Bancorp, Inc. |
3.44 | 0.43 | 3.01 | 0.35 | 0.05 | 0.06 | 2.78 | 0.00 | 0.00 | 0.52 | ||||||||||||||||||||||||||||||
| WVS Financial Corp. |
2.24 | 0.60 | 1.64 | 0.11 | (0.01 | ) | 0.02 | 1.03 | 0.00 | 0.00 | 0.70 | |||||||||||||||||||||||||||||
| (1) | For the last twelve months ended September 30, 2020 |
Source: TC Federal Bank; S&P Global Market Intelligence.
72
FELDMAN FINANCIAL ADVISORS, INC.
Table 25
Balance Sheet Composition
As of December 31, 2020
| As a Percent of Total Assets | ||||||||||||||||||||||||||||||||||||||||
| Cash and Securities |
Net Loans |
Real Estate |
Intang. Assets |
Other Assets |
Total Deposits |
Borrowed Funds |
Other Liabs. |
Total Liabs. |
Total Equity |
|||||||||||||||||||||||||||||||
| TC Federal Bank |
18.34 | 75.82 | 0.02 | 0.00 | 5.83 | 84.05 | 2.72 | 1.84 | 88.61 | 11.39 | ||||||||||||||||||||||||||||||
| Comparative Group Average |
33.91 | 61.82 | 0.07 | 0.22 | 3.98 | 75.47 | 8.54 | 0.93 | 84.94 | 15.06 | ||||||||||||||||||||||||||||||
| Comparative Group Median |
26.40 | 69.17 | 0.04 | 0.00 | 3.48 | 78.29 | 4.55 | 0.81 | 88.00 | 12.00 | ||||||||||||||||||||||||||||||
| All Public Thrift Average |
21.65 | 71.24 | 0.07 | 0.87 | 4.40 | 76.44 | 9.82 | 1.41 | 87.66 | 12.34 | ||||||||||||||||||||||||||||||
| All Public Thrift Median |
19.86 | 72.12 | 0.02 | 0.33 | 4.39 | 78.90 | 8.19 | 1.34 | 88.44 | 11.56 | ||||||||||||||||||||||||||||||
| Comparative Group |
||||||||||||||||||||||||||||||||||||||||
| CBM Bancorp, Inc. (1) |
25.75 | 70.30 | 0.33 | 0.00 | 3.62 | 74.24 | 2.15 | 0.67 | 77.06 | 22.94 | ||||||||||||||||||||||||||||||
| Cincinnati Bancorp, Inc. |
17.02 | 75.91 | 0.00 | 0.07 | 6.99 | 64.19 | 16.20 | 2.11 | 82.50 | 17.50 | ||||||||||||||||||||||||||||||
| Elmira Savings Bank |
17.21 | 75.00 | 0.03 | 1.91 | 5.85 | 84.86 | 4.76 | 0.95 | 90.57 | 9.43 | ||||||||||||||||||||||||||||||
| FFBW, Inc. |
31.57 | 63.85 | 0.04 | 0.13 | 4.42 | 66.86 | 2.21 | 0.47 | 69.54 | 30.46 | ||||||||||||||||||||||||||||||
| HMN Financial, Inc. |
25.87 | 71.33 | 0.07 | 0.09 | 2.63 | 87.43 | 0.00 | 1.22 | 88.65 | 11.35 | ||||||||||||||||||||||||||||||
| Home Federal Bancorp, Inc. |
26.93 | 68.04 | 0.14 | 0.00 | 4.90 | 89.25 | 0.80 | 0.33 | 90.39 | 9.61 | ||||||||||||||||||||||||||||||
| HV Bancorp, Inc. |
50.90 | 46.12 | 0.00 | 0.00 | 2.98 | 84.82 | 9.62 | 1.04 | 95.48 | 4.52 | ||||||||||||||||||||||||||||||
| IF Bancorp, Inc. |
25.57 | 71.04 | 0.05 | 0.00 | 3.34 | 82.33 | 4.43 | 1.34 | 88.10 | 11.90 | ||||||||||||||||||||||||||||||
| Mid-Southern Bancorp, Inc. |
48.83 | 48.12 | 0.04 | 0.00 | 3.01 | 73.98 | 4.67 | 0.53 | 79.18 | 20.82 | ||||||||||||||||||||||||||||||
| WVS Financial Corp. |
69.45 | 28.45 | 0.00 | 0.00 | 2.10 | 46.69 | 40.54 | 0.67 | 87.89 | 12.11 | ||||||||||||||||||||||||||||||
| (1) | As of September 30, 2020 |
Source: TC Federal Bank; S&P Global Market Intelligence.
73
FELDMAN FINANCIAL ADVISORS, INC.
Table 26
Growth Rates, Credit Risk, and Loan Composition
As of or For the Last Twelve Months Ended December 31, 2020
| Asset Growth Rate |
Loan Growth Rate |
Deposit Growth Rate |
NPLs (1) / Total Loans |
NPAs (1) / Total Assets |
Loan Loss Allow./ NPLs(1) |
Loan Loss Allow./ Loans |
Resid. Real Est. Loans/ Loans |
Other Real Est. Loans/ Loans |
Non- Real Est. Loans/ Loans |
|||||||||||||||||||||||||||||||
| TC Federal Bank |
8.75 | 7.67 | 7.49 | 0.85 | 0.68 | 177.81 | 1.53 | 42.88 | 44.05 | 13.07 | ||||||||||||||||||||||||||||||
| Comparative Group Average |
21.19 | 6.32 | 24.90 | 0.70 | 0.52 | 212.30 | 1.09 | 48.20 | 35.95 | 15.85 | ||||||||||||||||||||||||||||||
| Comparative Group Median |
9.77 | 5.65 | 8.98 | 0.62 | 0.52 | 127.03 | 1.11 | 50.03 | 37.76 | 16.99 | ||||||||||||||||||||||||||||||
| All Public Thrift Average |
20.63 | 13.04 | 24.38 | 0.99 | 0.73 | 191.52 | 1.16 | 28.76 | 42.85 | 28.38 | ||||||||||||||||||||||||||||||
| All Public Thrift Median |
14.14 | 9.19 | 19.10 | 0.87 | 0.69 | 106.08 | 1.13 | 23.75 | 47.80 | 28.45 | ||||||||||||||||||||||||||||||
| Comparative Group |
||||||||||||||||||||||||||||||||||||||||
| CBM Bancorp, Inc. (1) |
6.63 | 10.68 | 11.04 | 0.31 | 0.55 | 337.30 | 1.05 | 42.27 | 36.67 | 21.05 | ||||||||||||||||||||||||||||||
| Cincinnati Bancorp, Inc. |
(1.93 | ) | (1.33 | ) | 6.13 | 0.72 | 0.56 | 127.03 | 0.94 | 59.96 | 39.45 | 0.59 | ||||||||||||||||||||||||||||
| Elmira Savings Bank |
6.22 | (6.25 | ) | 6.80 | 1.13 | 0.89 | 103.71 | 1.18 | 61.24 | 20.25 | 18.51 | |||||||||||||||||||||||||||||
| FFBW, Inc. |
16.00 | 14.22 | 4.31 | 0.68 | 0.48 | 188.40 | 1.28 | 30.39 | 59.24 | 10.37 | ||||||||||||||||||||||||||||||
| HMN Financial, Inc. |
16.97 | 8.14 | 18.01 | 0.40 | 0.36 | 404.65 | 1.62 | 26.37 | 58.17 | 15.46 | ||||||||||||||||||||||||||||||
| Home Federal Bancorp, Inc. |
17.59 | 7.98 | 19.06 | 1.06 | 0.87 | 97.30 | 1.03 | 30.49 | 38.84 | 30.67 | ||||||||||||||||||||||||||||||
| HV Bancorp, Inc. |
142.99 | 35.66 | 157.54 | 0.56 | 0.26 | 89.49 | 0.50 | 64.47 | 11.56 | 23.97 | ||||||||||||||||||||||||||||||
| IF Bancorp, Inc. |
5.19 | 3.32 | 6.92 | 0.26 | 0.24 | 489.30 | 1.26 | 23.75 | 50.32 | 25.92 | ||||||||||||||||||||||||||||||
| Mid-Southern Bancorp, Inc. |
12.92 | (8.12 | ) | 18.47 | 1.90 | 0.96 | 73.50 | 1.39 | 57.79 | 36.44 | 5.77 | |||||||||||||||||||||||||||||
| WVS Financial Corp. |
(10.64 | ) | (1.11 | ) | 0.74 | 0.00 | 0.00 | NM | 0.67 | 85.26 | 8.53 | 6.21 | ||||||||||||||||||||||||||||
| (1) | Includes accruing troubled debt restructurings. |
| (2) | As of or for the last twelve months ended September 30, 2020 |
Source: TC Federal Bank; S&P Global Market Intelligence.
74
FELDMAN FINANCIAL ADVISORS, INC.
III. MARKET VALUE ADJUSTMENTS
General Overview
This concluding chapter of the Appraisal identifies certain additional adjustments to the Bank’s estimated pro forma market value relative to the Comparative Group selected in Chapter II. The adjustments discussed in this chapter are made from the viewpoints of potential investors, which would include depositors holding subscription rights and unrelated parties who may purchase stock in a community offering. It is assumed that these potential investors are aware of all relevant and necessary facts as they would pertain to the value of the Bank relative to other publicly traded thrift institutions and relative to alternative investments.
Our appraised value is predicated on a continuation of the current operating environment for the Bank and thrift institutions in general. Changes in the Bank’s operating performance along with changes in the local and national economy, the stock market, interest rates, the regulatory environment, and other external factors may occur from time to time, often with great unpredictability, which could impact materially the pro forma market value of the Bank or thrift stocks in general. Therefore, the Valuation Range provided herein is subject to a more current re-evaluation prior to the actual completion of the Conversion and Stock Offering.
In addition to the comparative operating fundamentals discussed in Chapter II, it is important to address additional market value adjustments based on certain financial and other criteria, which include, among other factors:
| (1) | Earnings Prospects |
| (2) | Financial Condition |
| (3) | Market Area |
| (4) | Management |
| (5) | Dividend Payments |
| (6) | Liquidity of the Issue |
75
FELDMAN FINANCIAL ADVISORS, INC.
| (7) | Subscription Interest |
| (8) | Recent Acquisition Activity |
| (9) | Effect of Banking Regulations and Regulatory Reform |
| (10) | Stock Market Conditions |
Earnings Prospects
Earnings prospects are dependent upon the sensitivity of asset yields and liability costs to changes in market rates, the credit quality of assets, the stability of non-interest components of income and expense, and the ability to leverage the balance sheet. Each of the foregoing is an important factor for investors in assessing earnings prospects. The Bank’s core earnings profitability in recent years has been restrained due to its high efficiency ratio stemming from an above-average operating expense level and below-average non-interest income production. These disadvantages are offset somewhat by the Bank’s solidly improving net interest margin.
The Bank’s earnings compared unfavorably to the Comparative Group for the recent LTM period. The Bank’s ROA measured 0.09% versus the Comparative Group median of 0.67% and All Public Thrift median of 0.77%. On a core earnings basis which excludes non-recurring items, the Bank’s core ROA of 0.48% trailed the Comparative Group median of 0.64% and the All Public Thrift Median of 0.78%. The Bank believes that it is positioned to achieve its internal growth objectives in its targeted market areas. The Bank has invested in hiring additional personnel, upgrading its infrastructure and data processing capabilities, expanding checking account activity, revamping practices to operating more efficiently, and launching the openings of a new branch office and an LPO in 2017.
The Bank’s increased capital position after the Stock Offering will help to improve its net interest margin across changing interest rate and business cycles, provide added interest rate risk protection, and additional leverage capacity to grow the balance sheet. In the near term, the Bank’s
76
FELDMAN FINANCIAL ADVISORS, INC.
profitability will continue to be challenged by net interest margin pressure, new stock benefit plans, public company costs, and regular loan loss provisions to ensure that the Bank’s reserve level increases commensurately with the risk profile of the growing loan portfolio. Based on the Bank’s earnings fundamentals and recent subpar returns, we believe that the challenges of increasing profitability warrant a downward adjustment to the Bank’s pro forma market value relative to the Comparative Group.
Financial Condition
As discussed and summarized in Chapter I, the Bank’s balance sheet composition reflects a large concentration of real estate loans, a lesser amount of investment securities, and a liquidity portfolio comprising cash and cash equivalents. The Bank relies mainly on its deposit base as a funding source, and utilizes borrowings sparingly to supplement deposits. Historically, the Bank’s deposit base was heavily reliant upon certificate accounts. In recent years, the Bank has emphasized growing its transaction accounts and has deployed resources to generate increased levels of checking accounts.
In contrast to the Comparative Group, the Bank exhibited a slightly higher level of equity capital and a higher ratio of loans to assets, but slightly less favorable measures of credit quality. Before the infusion of net capital proceeds, the Bank’s total equity ratio at 11.39% of assets was positioned slightly below the 12.00% median of the Comparative Group. The selection criteria for the Comparative Group ensured a collection of companies with solid capital positions, emphasis on real estate lending, and satisfactory asset quality, similar to the Bank’s financial profile. Therefore, on the whole, we believe that no adjustment is warranted for the Bank’s financial condition relative to the Comparative Group.
77
FELDMAN FINANCIAL ADVISORS, INC.
Market Area
The members of the Comparative Group are located in the Southeast, Mid-Atlantic, and Midwest regions of the country. The market areas encompassing the Comparative Group companies include metropolitan areas such as Baltimore, Cincinnati, and Pittsburgh, along with smaller metropolitan and micropolitan areas. The Comparative Group companies are characterized by a cross-section of market areas that constitute smaller to larger metropolitan areas with relatively stable economies and moderate population growth prospects.
The Bank’s primary market areas consist of Thomas County (Georgia) and Leon County (Florida). Leon County exhibited a larger population base, higher population growth rate, and a lower unemployment rate as compared to Thomas County. As shown in Table 27, the weighted average household income of the Bank’s market area (as computed based on pro rata branch deposit concentrations applied to the demographic data indicator) was $48,868 and below the Comparative Group median of $65,793. However, the weighted average population growth forecast for the Bank’s market area of 2.2% over the next five years exceeded the Comparative Group median and average of 0.2% and 1.1%, respectively. Significantly, the five-year population growth projection for Leon County is 5.1%. Four of the Comparative Group companies displayed negative population growth forecasts for their primary market area. The December 2020 unemployment rates of 6.1% and 5.2% for Thomas County and Leon County, respectively, were in range of the Comparative Group median and average rates of 6.2% and 5.8%, respectively. While the Bank’s primary market area is characterized by comparatively lower household income levels, its population growth projections are slightly more favorable than those of the Comparative Group, and its unemployment rate is comparable. In recognition of these varying demographic factors altogether, we believe that no adjustment is warranted for market area.
78
FELDMAN FINANCIAL ADVISORS, INC.
Table 27
Selected Demographic Data of Primary Market Areas
TC Federal Bank and the Comparative Group
|
Company |
Headquarters Location |
Wtd. Avg. Median House- hold Income 2021 (1) ($) |
Wtd. Avg. Est. Population |
Unemployment Rate December (%) | ||||
| TC Federal Bank |
Thomasville, GA | 48,868 | 2.21 | 5.9 | ||||
| [Thomas County, GA] | 46,632 | 1.40 | 6.1 | |||||
| [Leon County, FL] | 56,823 | 5.06 | 5.2 | |||||
| Comparative Group Average |
65,082 | 0.24 | 5.8 | |||||
| Comparative Group Median |
65,793 | 1.11 | 6.2 | |||||
| Comparative Group |
||||||||
| CBM Bancorp, Inc. |
Baltimore, MD | 87,338 | 1.43 | 5.6 | ||||
| Cincinnati Bancorp, Inc. |
Cincinnati, OH | 68,988 | 1.70 | 4.7 | ||||
| Elmira Savings Bank |
Elmira, NY | 58,446 | (2.06) | 6.7 | ||||
| FFBW, Inc. |
Brookfield, WI | 66,586 | 1.26 | 6.0 | ||||
| HMN Financial, Inc. |
Rochester, MN | 72,330 | 2.28 | 3.9 | ||||
|
Home Federal Bancorp, Inc. |
Shreveport, LA | 45,915 | (0.75) | 6.6 | ||||
| HV Bancorp, Inc. |
Doylestown, PA | 75,304 | 0.95 | 6.5 | ||||
| IF Bancorp, Inc. |
Watseka, IL | 50,891 | (2.92) | 6.4 | ||||
|
Mid-Southern Bancorp, Inc. |
Salem, IN | 60,023 | 1.30 | 5.1 | ||||
| WVS Financial Corp. |
Pittsburgh, PA | 64,999 | (0.81) | 6.6 | ||||
| (1) | Weighted average based on pro rata branch deposit totals of each company in its primary MSA or county markets. |
| (2) | Based on unemployment rate in company’s primary MSA or county market as ranked by deposits. |
Source: Claritas; S&P Global Market Intelligence; U.S. Bureau of Labor Statistics.
Management
Management’s principal challenges are to generate profitable results, monitor credit risks, and control operating costs while the Bank competes in an increasingly challenging financial services environment. The normal challenges facing the Bank in attempting to deliver earnings growth and enhance its competitiveness remain paramount as it attempts to leverage the net capital proceeds from the Stock Offering. The Bank is led by its President and CEO, Greg Eiford, who was named President in August 2019 and assumed the top administrative position of CEO in January 2021. Each of the Bank’s senior executive officers has extensive years of banking experience. Nevertheless, the management team has ongoing challenges ahead in improving
79
FELDMAN FINANCIAL ADVISORS, INC.
earnings results, growing the banking franchise, and controlling operating expenses as the Bank transitions to a public company. Investors will likely rely upon actual financial results as the means of evaluating the future performance of management as the Bank pursues its asset growth and earnings improvement objectives. Based on these considerations, we believe that no adjustment is warranted relative to the Comparative Group for this factor.
Dividend Payments
Following the completion of the Conversion and Stock Offering, the Board of Directors of TC Bancshares will have the authority to declare cash dividends on the shares of common stock, subject to statutory and regulatory requirements. However, no decision has been made with respect to the payment of dividends. The payment and amount of any dividends will depend upon many factors, including the following: (1) the financial condition and operating results of TC Bancshares and the Bank; (2) regulatory capital requirements and limitations on dividends; (3) other uses of funds for the long-term value of stockholders; (4) tax considerations; and (5) general economic conditions. There is no assurance that TC Bancshares will actually pay cash dividends or that, if paid, such dividends will not be reduced or eliminated in the future.
Payment of cash dividends has become commonplace among publicly traded thrifts with solid capital levels. Of the 10 members of the Comparative Group, five currently pay regular cash dividends. The median dividend yields of the Comparative Group and All Public Thrift aggregate were 0.38% and 1.59% as of February 26, 2021, respectively. Based on the anticipated strong capital levels of the Bank and TC Bancshares after the Stock Offering, investors are likely to expect that TC Bancshares will commence paying regular dividends not too long after the Stock Offering is completed as a means of enhancing shareholder returns. Therefore, we have concluded that no adjustment is warranted for purposes of dividend policy.
80
FELDMAN FINANCIAL ADVISORS, INC.
Liquidity of the Issue
With the increased number of market makers and institutional investors following thrift stocks, the majority of initial public offerings by thrift institutions are able to develop a public market for their new stock issues. Most publicly traded thrift stocks continue to be traded on the NASDAQ Stock Market. All 10 members of the Comparative Group are listed on the NASDAQ Stock Market. TC Bancshares expects that its shares of common stock will be traded on the NASDAQ Stock Market under the symbol “TCBC” upon conclusion of the Stock Offering.
The development and maintenance of a public market, having the desirable characteristics of depth, liquidity, and orderliness, depend on the existence of willing buyers and sellers. The median market capitalization of the Comparative Group companies was $48.9 million as of February 26, 2021. The All Public Thrift median market capitalization was much higher at $204.5 million. Of the 10 companies in the Comparative Group, all are traded on NASDAQ Stock Market and indicated an overall average daily trading volume of approximately 4,000 shares over the LTM period. The Company’s comparably sized stock issue on a pro forma basis would firmly suggest that, given a proposed NASDAQ market listing, it would enjoy a depth of liquidity similar to that facilitated by the Comparative Group’s market capitalizations and trading volume histories. Therefore, we have concluded that no adjustment to the Company’s pro forma market value is warranted to address the liquidity of its common stock issue.
Subscription Interest
The Bank has retained the services of Performance Trust Capital Partners, LLC to assist in the marketing and sale of the Stock Offering. The Bank’s ESOP plans to purchase shares in the Stock Offering equal to 8.00% of the total amount of common stock to be outstanding. The Bank expects its directors, officers, employees, and their associates to purchase 147,500 shares of
81
FELDMAN FINANCIAL ADVISORS, INC.
common stock in the Stock Offering for an aggregate amount of approximately $1.5 million based on a $10.00 offering price per share. The minimum number of shares of common stock that may be purchased in the Stock Offering is 25 shares ($250). Excluding the ESOP purchase, the maximum number of shares of common stock that may be purchased in the Stock Offering by any person or persons exercising subscription rights through a single deposit account is 30,000 shares ($300,000 equivalent). No person together with an associate or group of persons acting in concert may purchase more than 40,000 shares ($400,000 equivalent).
Recent subscription interest in thrift stock conversion offerings has been varied. No standard conversion offerings have been completed thus far in 2021, two were completed in 2020, and two were completed in 2019. Of the four standard conversion transactions completed in 2019 and 2020, only one (Richmond Mutual Bancorporation) was fully subscribed by eligible record holders in the subscription phase and closed at the adjusted maximum of its offering range. Systematic Savings Bank closed its small offering at the adjusted maximum based on support from the community offering, while the sizable offering by Eastern Bankshares was closed at slightly below the maximum and Eureka Homestead Bancorp was closed at marginally above the minimum.
Investor interest in recent thrift stock issues has been supported by the overall favorable performance results of the banking industry, stable housing market conditions, after-market pricing trends, and the expectation of continued merger and acquisition activity. Included among the Bank’s eligible depositor base are several account holders who are considered professional thrift offering investors. We are not currently aware of any additional market evidence or characteristics that may help predict the level of interest in the Bank’s subscription offering. Accordingly, absent
82
FELDMAN FINANCIAL ADVISORS, INC.
actual results of the subscription offering, we believe that subscription interest is currently a neutral factor and, at the present time, requires no further adjustment.
Recent Acquisition Activity
Table 28 summarizes recent acquisition activity involving banks and thrifts based in the states of Georgia and Florida from January 1, 2019 to February 26, 2021. There were 32 such acquisition transactions with 13 transactions including sellers based in Georgia and 19 representing Florida sellers. The acquisition valuation ratios paid in these transactions generally have followed the nationwide acquisition valuation trends. Given that there will be significant regulatory restrictions on the ability to acquire control of TC Bancshares or the Bank for a period of three years following the Conversion, we do not believe that acquisition premiums are a significant factor to consider in analyzing the Bank’s pro forma market value. Moreover, the standard of value applied herein does not require an acquisition value determination.
Effect of Banking Regulations and Regulatory Reform
In response to the financial crisis of 2008 and 2009, Congress took actions intended to strengthen confidence and encourage liquidity in financial institutions. The Dodd-Frank Wall Street Reform and Consumer Protection Act (“Dodd-Frank”) was enacted in 2010, and provided for new restrictions and an expanded framework of regulatory oversight for financial institutions. The legislation also created the Consumer Financial Protection Bureau that has broad authority to issue regulations governing the services and products provided by financial institutions. Community bankers believe that the Dodd-Frank legislation has led to increased compliance costs. Legislation was enacted in 2018 that preserves the fundamental elements of the post-Dodd-Frank regulatory framework, but included modifications that was expected to result in some meaningful regulatory relief for smaller and certain larger banking organizations.
83
FELDMAN FINANCIAL ADVISORS, INC.
Table 28
Summary of Recent Georgia and Florida Acquisition Activity
Pending or Completed Transactions Announced Since January 1, 2019
| Seller’s Prior Financial Data | Offer Value to | |||||||||||||||||||||||||||||||||||||||||||||||||
| Buyer | St. | Seller | St. | Total Assets ($Mil.) |
Equity/ Assets |
LTM ROA (%) |
LTM ROE (%) |
Date Announced |
Status(1) | Offer ($Mil.) |
Book Value (%) |
Tang. Book (%) |
LTM EPS (x) |
Total Assets (%) |
||||||||||||||||||||||||||||||||||||
| Median |
269.0 | 10.11 | 0.95 | 9.77 | NA | NA | 69.3 | 173.1 | 176.2 | 14.7 | 16.61 | |||||||||||||||||||||||||||||||||||||||
|
Average |
7,659.7 | 10.64 | 0.76 | 7.32 | NA | NA | 1,826.5 | 160.2 | 169.0 | 15.3 | 16.02 | |||||||||||||||||||||||||||||||||||||||
| First Chatsworth Bkshs Inc. |
GA | Heritage First Bancshares Inc. | GA | 169.6 | 10.04 | 0.78 | 7.39 | 01/19/21 | P | NA | NA | NA | NA | NA | ||||||||||||||||||||||||||||||||||||
| Anchor Bankshares Inc. |
FL | Home Fed. Bank of Hollywood | FL | 54.6 | 12.58 | (2.33 | ) | (20.19 | ) | 11/02/20 | P | NA | NA | NA | NA | NA | ||||||||||||||||||||||||||||||||||
| Piedmont Bancorp Inc. |
GA | WestSide Bank | GA | 172.1 | 10.19 | 2.97 | 26.81 | 10/05/20 | C | NA | NA | NA | NA | NA | ||||||||||||||||||||||||||||||||||||
| Investor Group |
– | Georgia Banking Co. | GA | 704.6 | 6.27 | 0.67 | 8.36 | 09/08/20 | P | NA | NA | NA | NA | NA | ||||||||||||||||||||||||||||||||||||
| ST Hldgs Inc. |
FL | Rochelle State Bank | GA | 29.4 | 16.61 | (0.75 | ) | (4.16 | ) | 03/25/20 | P | 6.3 | 130.0 | 130.0 | NA | 21.6 | ||||||||||||||||||||||||||||||||||
| United Community Banks Inc. |
GA | Three Shores Bancorp. Inc. | FL | 1,874.1 | 9.03 | 0.79 | 9.42 | 03/09/20 | C | 218.1 | 98.3 | 101.8 | 12.5 | 11.6 | ||||||||||||||||||||||||||||||||||||
| Pvt. Invtr. - Kenneth Lehman |
– | BankFlorida | FL | 87.6 | 10.18 | (0.09 | ) | (0.93 | ) | 01/30/20 | C | 9.9 | 104.8 | 104.8 | NA | 11.3 | ||||||||||||||||||||||||||||||||||
| South State Corporation |
SC | CenterState Bank Corp. (2) | FL | 17,142.0 | 16.90 | 1.42 | 8.49 | 01/27/20 | C | 3,212.0 | 110.9 | 201.0 | 13.7 | 18.7 | ||||||||||||||||||||||||||||||||||||
| Seacoast Banking Corp. of FL |
FL | Fourth Street Banking Co. | FL | 338.9 | 8.63 | 1.47 | 16.59 | 01/23/20 | C | 63.6 | 173.3 | 173.3 | 14.4 | 18.8 | ||||||||||||||||||||||||||||||||||||
| First Bancshares Inc. |
MS | Southwest Georgia Financial | GA | 547.5 | 8.84 | 0.94 | 11.20 | 12/18/19 | C | 87.9 | 181.5 | 181.5 | 17.3 | 16.1 | ||||||||||||||||||||||||||||||||||||
| Pinnacle Financial Corp. |
GA | SBT Bancorp Inc. | GA | 224.5 | 8.88 | 1.21 | 13.42 | 12/18/19 | C | 36.0 | 176.2 | 176.2 | 16.5 | 16.0 | ||||||||||||||||||||||||||||||||||||
| Seacoast Banking Corp. of FL |
FL | First Bank of the Palm Beaches | FL | 189.1 | 8.69 | 0.60 | 6.87 | 11/19/19 | C | 31.7 | 192.6 | 192.6 | 29.2 | 16.7 | ||||||||||||||||||||||||||||||||||||
| Banco de Credito e Inversiones |
– | Executive Banking Corp. | FL | 455.3 | 11.28 | 0.87 | 8.25 | 09/25/19 | C | 75.0 | 176.2 | 180.5 | 22.2 | 16.5 | ||||||||||||||||||||||||||||||||||||
| First Citizens BancShares Inc. |
NC | Community Fin’l Holding Co. | GA | 222.6 | 4.75 | 0.70 | 20.29 | 09/24/19 | C | 2.3 | NA | NA | 2.2 | 1.0 | ||||||||||||||||||||||||||||||||||||
| Private Investors |
– | Barwick Banking Company | GA | 12.7 | 7.50 | (0.13 | ) | (1.68 | ) | 09/17/19 | C | NA | NA | NA | NA | NA | ||||||||||||||||||||||||||||||||||
| First Commerce Credit Union |
FL | Assets and liabilities | GA | 248.1 | 13.99 | 0.89 | 6.48 | 09/16/19 | C | NA | NA | NA | NA | NA | ||||||||||||||||||||||||||||||||||||
| Community First Bcshs (MHC) |
GA | ABB Financial Group Inc. | GA | 307.5 | 10.71 | 0.96 | 9.20 | 08/20/19 | C | 40.3 | 158.1 | 158.1 | 14.9 | 13.1 | ||||||||||||||||||||||||||||||||||||
| Professional Holding Corp. |
FL | Marquis Bancorp Inc. | FL | 680.3 | 9.31 | 1.19 | 12.77 | 08/12/19 | C | 83.3 | 152.6 | 152.6 | 11.9 | 12.3 | ||||||||||||||||||||||||||||||||||||
| First Bancshares Inc. |
MS | First Florida Bancorp Inc. | FL | 451.0 | 11.74 | 1.24 | 10.76 | 07/22/19 | C | 85.0 | 178.1 | 178.1 | 17.5 | 18.9 | ||||||||||||||||||||||||||||||||||||
| West Florida Banking Corp. |
FL | Flagship Community Bk | FL | 122.0 | 13.36 | 1.31 | 10.12 | 05/30/19 | C | 22.7 | 138.9 | 138.9 | 14.5 | 18.6 | ||||||||||||||||||||||||||||||||||||
| First American Bank Corp. |
IL | Continental National Bank | FL | 478.5 | 8.16 | (0.80 | ) | (9.99 | ) | 05/15/19 | C | NA | NA | NA | NA | NA | ||||||||||||||||||||||||||||||||||
| Banesco USA |
FL | Brickell Bank | FL | 439.8 | 5.25 | (0.82 | ) | (15.88 | ) | 05/14/19 | C | NA | NA | NA | NA | NA | ||||||||||||||||||||||||||||||||||
| Banco Bradesco SA |
– | BAC Florida Bank | FL | 2,274.8 | 9.37 | 1.37 | 14.95 | 05/06/19 | C | 500.0 | 258.9 | 258.9 | 16.8 | 22.0 | ||||||||||||||||||||||||||||||||||||
| MIDFLORIDA Credit Union |
FL | Community Bank & Trust | FL | 733.3 | 9.16 | 1.10 | 12.94 | 05/03/19 | C | NA | NA | NA | NA | NA | ||||||||||||||||||||||||||||||||||||
| Power Financial Credit Union |
FL | TransCapital Bank | FL | 204.1 | 18.00 | 2.44 | 14.05 | 03/27/19 | C | NA | NA | NA | NA | NA | ||||||||||||||||||||||||||||||||||||
| BancorpSouth Bank |
MS | Summit Financial Entrprs Inc. | FL | 471.9 | 11.71 | 1.58 | 13.64 | 03/05/19 | C | 100.3 | 173.1 | 173.1 | 14.3 | 21.3 | ||||||||||||||||||||||||||||||||||||
| FAIRWINDS CU |
FL | Friends Bank | FL | 95.3 | 10.83 | 1.27 | 12.80 | 02/19/19 | C | 20.0 | 193.3 | 193.3 | 16.3 | 20.9 | ||||||||||||||||||||||||||||||||||||
| BB&T Corp. |
NC | SunTrust Banks Inc. (2) | GA | 215,543.0 | 11.26 | 1.34 | 11.50 | 02/07/19 | C | 28,282.6 | 126.8 | 177.7 | 11.0 | 13.1 | ||||||||||||||||||||||||||||||||||||
| United Community Banks Inc. |
GA | First Madison Bank & Trust | GA | 258.3 | 11.74 | 1.96 | 16.23 | 02/05/19 | C | 52.0 | 171.5 | 171.5 | 11.4 | 20.1 | ||||||||||||||||||||||||||||||||||||
| Addition Financial CU |
FL | Fidelity Bank of Florida NA | FL | 174.4 | 17.04 | (0.88 | ) | (5.13 | ) | 01/24/19 | C | NA | NA | NA | NA | NA | ||||||||||||||||||||||||||||||||||
| VyStar CU |
FL | Citizens State Bank | FL | 279.7 | 9.74 | 1.30 | 13.01 | 01/14/19 | C | NA | NA | NA | NA | NA | ||||||||||||||||||||||||||||||||||||
| First Chatsworth Bkshs Inc. |
GA | Northside Bancshares Inc. | GA | 124.0 | 8.71 | (0.23 | ) | (3.19 | ) | 01/11/19 | C | NA | NA | NA | NA | NA | ||||||||||||||||||||||||||||||||||
(1) P = pending; C = completed.
(2) Merger of equals transaction.
Source: S&P Global Market Intelligence.
84
FELDMAN FINANCIAL ADVISORS, INC.
As a stock savings association insured by the FDIC and supervised by its primary regulators, the Bank will continue to operate in the same regulatory environment that is substantially similar to that faced by the Comparative Group companies. As of December 31, 2020, the Bank was considered well capitalized, similar to all the members of the Comparative Group. Therefore, given these factors, we believe that no specific adjustment is necessary for the effect of banking regulations and regulatory reform.
Stock Market Conditions
Financial stocks performed well in the economic recovery, and bank and thrift stocks participated fully in the sustained market rally from 2009 to 2018. Robust corporate earnings growth, sustained economic expansion, and generally low interest rates were major factors influencing equity market returns over this period, the second longest market rally in U.S. history. As the banking industry continued its recovery from the financial crisis, the Federal Reserve Board maintained a program of keeping rates at historic lows and implemented a series of three rate cuts in 2019. The Federal Reserve Board lowered the target range for the federal funds rate in July 2019 to 2.00-2.25%, in September 2019 to 1.75-2.00%, and in October 2019 to 1.50-1.75%. Favorable policy developments, including the further monetary easing by the Federal Reserve Board and de-escalation of the U.S.-China trade conflict, helped stocks to a strong final quarter of 2019 and lifted the S&P 500 Index to a 31.5% gain for the full year of 2019.
Headed into 2020, market observers voiced concerns that the global economy was sluggish and that the U.S. was firmly in the late-cycle phase, having hit all of the typical milestones, with the exception that credit conditions generally remained favorable. The overall market began to experience sharp volatility in February 2020 and entered official correction levels (down 10% from 52-week highs). Interest rates dropped as a flight to safety saw 10-year and 30-year U.S. Treasury
85
FELDMAN FINANCIAL ADVISORS, INC.
bonds trade at all-time lows. The market volatility was spurred by the outbreak of the novel coronavirus and concerns about its impact on the U.S. economy, supply chains, and consumer spending. During late February and early March 2020, the S&P 500 Index experienced broad daily swings of upward and downward movement by 3-4% measures. In an extraordinary attempt to contain the coronavirus’s economic fallout, the Federal Reserve Board slashed interest rates in March 2020 as it unanimously approved its largest one-time cut – and first emergency rate move – since the depths of the 2008 financial crisis. The Federal Reserve Board lowered the target range for the federal funds rate by 50 basis points to 1.00-1.25%.
As the coronavirus evolved into a global pandemic, disrupting major economies around the world and abruptly ending the longest stock market bull run in U.S. history. U.S. equities fell sharply, then rebounded off their lows from March 2020 and performed strongly for the remainder of the year. Congress, the Federal Reserve Board, and various federal and state financial regulatory agencies took actions to mitigate the adverse effects on economic activity and financial stability resulting from the pandemic and implemented programs to bolster the flow of credit and financial resources to households, businesses, and communities. After the successful development of effective coronavirus vaccines in the fourth quarter of 2020, segments of the market that had previously lagged, such as energy, financials, and industrials, gained strength as the U.S. stock market surged to an all-time high in December. As 2020 closed, the S&P 500 Index ended the year up 18.4%. A combination of depressed valuations, substantial fiscal and monetary stimulus, and a solid improvement in corporate earnings supported the U.S. equity market recovery in 2020.
Table 29 displays the one-year performance of an array of market indexes maintained on the SNL Financial platform by S&P Global Market Intelligence and highlights the recent volatility in the U.S. equity markets. The SNL Micro Cap Thrift Index (including all public thrifts with
86
FELDMAN FINANCIAL ADVISORS, INC.
market capitalizations less than $250 million) decreased by 2.6% over the one-year period ended February 26, 2021, underperforming the broader S&P 500 index which was up 29.0% during this period. The SNL Thrift NASDAQ Index (including all NASDAQ-listed thrifts) experienced a 7.4% gain over the one-year period. Table 30 presents the comparative market indexes over the three-year period ended February 26, 2021. The S&P 500 Index was up 40.4% over the three-year period, while the SNL Thrift NASDAQ Index and the SNL Micro Cap Thrift Index were down by 3.0% and 5.4%, respectively. The bank and thrift sector has lagged the overall market amid concerns that a weaker economy would lead to increases in credit losses and lower interest rates would continue to suppress net interest margins.
A “new issue” discount that reflects investor concerns and investment risks inherent in all initial public offerings is a factor to be considered for purposes of valuing converting thrifts. The magnitude of the new issue discount typically expands during periods of declining or volatile thrift stock prices as investors require larger inducements, and narrows during stronger market conditions. Table 31 presents a summary of standard thrift conversion offerings since January 1, 2017. The pricing of these offerings confirms the presence of the new issue discount in the pro forma market valuations of converting thrifts versus existing publicly traded thrifts. The distinction of the new issue discount is most apparent with the price-to-book value ratio because the pro forma equity calculation involves combining the net new capital proceeds with the historical equity of the converting company. The median pro forma price-to-book value ratio for standard conversion offerings was 59.6% for the 2019 to 2020 period and the median pro forma price-to-tangible book ratio was 63.3%. The median pro forma price-to-earnings ratio was 31.8x during the 2019 to 2020 period. As noted previously, there have not been any standard conversion offerings completed in the year-to-date 2021 period.
87
FELDMAN FINANCIAL ADVISORS, INC.
Table 29
Comparative One-Year Stock Index Performance
For the One-Year Period Ended February 26, 2021
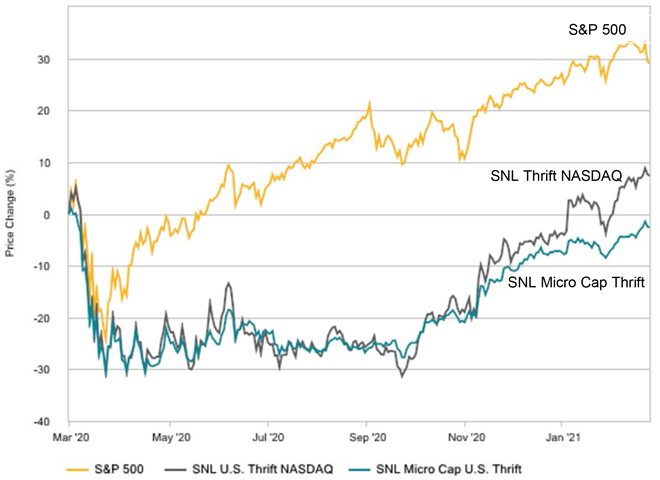
| S&P 500 Stock Index |
+29.0% |
|||||||
| SNL Thrift NASDAQ Index |
|
+7.4% |
||||||
| SNL Micro Cap Thrift Index |
–2.6% |
88
FELDMAN FINANCIAL ADVISORS, INC.
Table 30
Comparative Three-Year Stock Index Performance
For the Three-Year Period Ended February 26, 2021
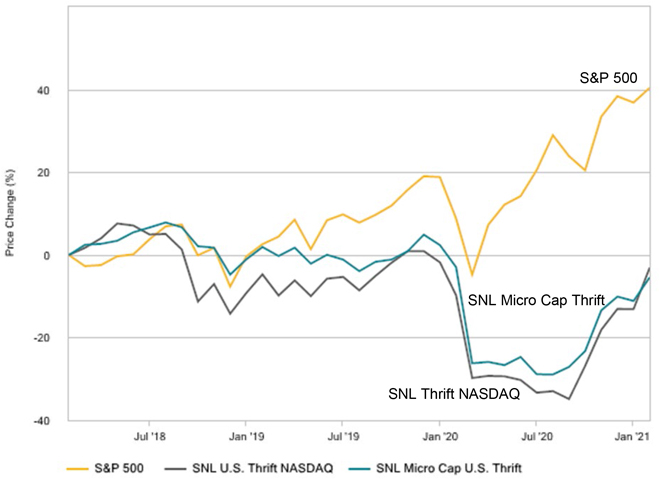
| S&P 500 Stock Index |
+40.4% |
|||||||
| SNL Thrift NASDAQ Index |
|
–3.0% |
||||||
| SNL Micro Cap Thrift Index |
–5.4% |
89
FELDMAN FINANCIAL ADVISORS, INC.
Table 31
Summary of Standard Conversion Offerings
Transactions Completed Since January 1, 2017
| Pro Forma Ratios | After-Market | |||||||||||||||||||||||||||||||||||||||||||||||||||||||||||
| Gross | Price/ | Price/ | Price/ | Tang. | 2/26/21 | Price Change | Change | |||||||||||||||||||||||||||||||||||||||||||||||||||||
| Stock | Total | Offering | Book | Tang. | LTM | Eqty./ | IPO | Closing | One | One | One | Through | ||||||||||||||||||||||||||||||||||||||||||||||||
| Stock | Offering | Assets | Proceeds | Value | Book | EPS | Assets | Price | Price | Day | Week | Month | 2/26/21 | |||||||||||||||||||||||||||||||||||||||||||||||
| Company | State | Exchange | Date | ($Mil.) | ($Mil.) | (%) | (%) | (x) | (%) | ($) | ($) | (%) | (%) | (%) | (%) | |||||||||||||||||||||||||||||||||||||||||||||
| 2019 to 2020 -- Average |
1,537.6 | 202.2 | 63.0 | 64.9 | 36.1 | 21.93 | NA | NA | 26.3 | 26.9 | 30.3 | 44.0 | ||||||||||||||||||||||||||||||||||||||||||||||||
| 2019 to 2020 -- Median |
119.3 | 16.5 | 59.6 | 63.3 | 31.8 | 22.32 | NA | NA | 28.5 | 27.4 | 25.3 | 34.1 | ||||||||||||||||||||||||||||||||||||||||||||||||
| 2017 to 2020 -- Average |
1,537.6 | 202.2 | 66.1 | 67.0 | 29.1 | 19.32 | NA | NA | 34.4 | 35.7 | 35.8 | 46.3 | ||||||||||||||||||||||||||||||||||||||||||||||||
| 2017 to 2020 -- Median |
119.3 | 16.5 | 68.6 | 70.4 | 22.7 | 20.28 | NA | NA | 30.0 | 35.0 | 32.9 | 45.8 | ||||||||||||||||||||||||||||||||||||||||||||||||
| Standard Conversion Offerings |
||||||||||||||||||||||||||||||||||||||||||||||||||||||||||||
| Eastern Bankshares, Inc. |
MA | NASDAQ | 10/14/20 | 13,996.5 | 1,792.9 | 58.2 | 65.9 | 18.4 | 23.10 | 10.00 | 17.61 | 21.5 | 24.8 | 36.2 | 76.1 | |||||||||||||||||||||||||||||||||||||||||||||
| Systematic Savings Bank |
MO | OTC | 10/13/20 | 40.0 | 6.0 | 58.7 | 58.7 | 62.5 | 24.01 | 10.00 | NA | NA | NA | NA | NA | |||||||||||||||||||||||||||||||||||||||||||||
| Eureka Homestead Bancorp, Inc. |
LA | OTC | 07/09/19 | 98.4 | 14.3 | 60.6 | 60.6 | 44.7 | 21.53 | 10.00 | 12.50 | 21.0 | 21.0 | 21.7 | 25.0 | |||||||||||||||||||||||||||||||||||||||||||||
| Richmond Mutual Bancorporation |
IN | NASDAQ | 07/01/19 | 882.8 | 130.3 | 74.5 | 74.5 | 18.9 | 19.09 | 10.00 | 13.08 | 36.5 | 35.0 | 32.9 | 30.8 | |||||||||||||||||||||||||||||||||||||||||||||
| CBM Bancorp, Inc. |
MD | NASDAQ | 09/27/18 | 184.2 | 42.3 | 73.5 | 73.5 | 41.7 | 26.69 | 10.00 | 14.65 | 28.0 | 26.2 | 21.2 | 46.5 | |||||||||||||||||||||||||||||||||||||||||||||
| Sidney Federal S&L Association |
NE | OTC | 07/26/18 | 16.7 | 1.3 | 71.0 | 71.0 | NM | 10.83 | 10.00 | 10.00 | NA | NA | NA | 0.0 | |||||||||||||||||||||||||||||||||||||||||||||
| Eagle Financial Bancorp, Inc. |
OH | OTC | 07/20/17 | 119.3 | 15.7 | 61.7 | 61.7 | 10.2 | 20.28 | 10.00 | 16.95 | 49.2 | 50.5 | 60.9 | 69.5 | |||||||||||||||||||||||||||||||||||||||||||||
| Heritage NOLA Bancorp, Inc. |
LA | OTC | 07/12/17 | 104.1 | 16.5 | 72.5 | 72.5 | NM | 20.48 | 10.00 | 12.81 | 22.2 | 19.9 | 16.0 | 28.1 | |||||||||||||||||||||||||||||||||||||||||||||
| PCSB Financial Corporation |
NY | NASDAQ | 04/20/17 | 1,240.9 | 178.3 | 68.6 | 70.4 | 36.5 | 18.42 | 10.00 | 16.16 | 64.6 | 63.1 | 63.6 | 61.6 | |||||||||||||||||||||||||||||||||||||||||||||
| HV Bancorp, Inc. |
PA | NASDAQ | 01/11/17 | 177.1 | 21.8 | 70.7 | 70.7 | 22.7 | 15.46 | 10.00 | 18.04 | 36.7 | 40.8 | 40.0 | 80.4 | |||||||||||||||||||||||||||||||||||||||||||||
| Community Savings Bancorp, Inc. |
OH | OTC | 01/10/17 | 53.6 | 4.4 | 57.3 | 57.3 | 6.1 | 12.68 | 10.00 | 14.50 | 30.0 | 40.0 | 30.0 | 45.0 | |||||||||||||||||||||||||||||||||||||||||||||
Source: S&P Global Market Intelligence.
90
FELDMAN FINANCIAL ADVISORS, INC.
Historically, newly converted thrifts have gradually traded upward to a range near existing thrift stock valuation levels, but found resistance approaching book value until a discernible trend in earnings improvement was evident. Pricing a new offering at a relatively high ratio in relation to pro forma book value, because of the mathematics of the calculation, would require very large increases in valuations resulting in unsustainable price-to-earnings ratios and very marginal returns on equity. Accordingly, thrift conversions continue to be priced at discounts to comparable publicly traded companies. This is due to the relatively high pro forma equity ratios, expected low returns on equity, and the uncertainty regarding the prospects of an institution to leverage the balance sheet prudently and effectively in the current interest rate environment and against the backdrop of an increasingly competitive banking sector and volatile equities market.
For the 5,001 FDIC-insured commercial banks and savings institutions, full-year 2020 net income totaled $147.9 billion, a decline of $84.9 billion or 36.5% from 2019. The decline was primarily attributable to higher provision expenses in the first half of 2020 tied to pandemic-related deterioration in economic activity. Provision expenses increased by $77.1 billion or 140% and net interest income declined by $20.0 billion or 3.7%. The banking industry’s average net interest margin declined 54 basis points from 3.36% in 2019 to 2.82% in 2020. The average ROA declined from 1.29% in 2019 to 0.72% in 2020. The asset growth rate of the banking industry increased from 3.9% in 2019 to 17.4% in 2020, while the deposit growth increased from 4.8% to 22.6% in 2020. The injection of stimulus-related funds into the economic system increased the industry’s holdings of liquid assets and deposit liabilities. The ratio of non-performing assets to total assets increased from 0.55% at year-end 2019 to 0.61% at year-end 2020. Largely due to the banking industry’s significant asset expansion in 2020, the average equity capital ratio declined from 11.32% at year-end 2019 to 10.17% at year-end 2020.
91
FELDMAN FINANCIAL ADVISORS, INC.
Bank and thrift industry earnings results have continued to be solid in comparison to historical levels, but earnings growth has been challenged recently by eroding net interest margins and increasing credit-related charges. Industry operating expenses generally continue to rise in the face of sluggish growth in non-interest operating income. While bank and thrift industry capital levels remain strong and overall asset quality has stabilized, there continue to be volatile swings in the market for bank and thrift stocks in response to the economic outlook and the anxiety in the overall market that is contributing to the current fluctuations. Therefore, we believe that with the heightened uncertainty attendant to prevailing volatile stock market conditions, the new issue discount continues to be highly relevant because of the risks and uncertainties associated with a new stock offering in the current market and warrants a downward adjustment.
Adjustments Conclusion
It is our opinion that the Bank’s pro forma market value should be discounted relative to the Comparative Group. Our conclusion is based on downward adjustments for earnings prospects related to its recent history of subpar returns and the new issue discount underlying current stock market conditions. Converting thrifts are often valued at meaningful discounts to peer trading companies relative to price-to-book value and price-to-tangible book value ratios. Due to initially low post-offering earnings from the re-investment of net offering proceeds at relatively low rates without the benefit of immediate leverage, resulting price-to-earnings ratios may reflect premiums to established trading companies. It is the judgment of the appraiser to balance the relative dynamics of price-to-book and price-to-earnings discounts or premiums.
Valuation Approach
In determining the estimated pro forma market value of the Bank, we have employed the comparative company approach and considered the following pricing ratios: price-to-book value
92
FELDMAN FINANCIAL ADVISORS, INC.
per share (“P/B”), price-to-tangible book value per share (“P/TB”), price-to-earnings per share (“P/E”), and price-to-assets (“P/A”). Table 32 presents the trading market valuation ratios of the Comparative Group and All Public Thrift averages and medians as of February 26, 2021. As shown in Table 32, the median P/B ratio for the Comparative Group was 90.2%. Four members of the Comparative Group were valued at levels under book value (P/B ratio less than 100.0%). The median P/TB ratio for the Comparative Group was 97.2%. Higher equity levels have a restraining impact on P/B and P/TB ratios because of the accompanying challenge to generate competitive ROE results on such excess capital. Among the Comparative Group members, FFBW, Inc. reported the highest equity capital ratio at 30.46% along with a P/B ratio of 85.4%. The median P/E ratio based on LTM earnings for the Comparative Group was 12.7x. On a core earnings basis, the median core P/E ratio of the Comparative Group was 13.2x. Some companies within the Comparative Group and All Public Thrift aggregate generated P/E ratios that were either negative or distortedly high due to low levels of profitability, and their corresponding P/E ratios may be expressed as “NM” or non-meaningful.
Investors continue to make decisions to purchase thrift conversion stocks and more seasoned thrift issues based upon consideration of core earnings profitability and P/B comparisons. The P/E ratio remains an important valuation ratio in the current thrift stock market. However, as noted above, the P/E ratio is not useful for companies reporting negative or low earnings. The Bank’s earnings for the LTM ended December 31, 2020 amounted to $308,000 and was impacted by non-recurring items. On a pro forma basis, after making adjustments for re-investment of net offering proceeds and expensing charges related to the implementation of various stock benefit plans, including the ESOP, restricted stock plan (“RSP”), and stock option plan, the Bank’s pro forma earnings are reduced to negative levels. Consequently, additional reliance is placed on the
93
FELDMAN FINANCIAL ADVISORS, INC.
core earnings approach to determine meaningful P/E ratios for the Bank. After adjusting for $1.1 million of data processing conversion costs and $506,000 of recognized offering expenses on a tax-effected basis, the Bank’s historical core earnings amount to $1.6 million for the LTM ended December 31, 2020.
Based on our comparative financial and valuation analyses, we concluded that the Bank should be discounted relative to the trading valuation ratios of the overall Comparative Group. In consideration of the foregoing factors along with the additional adjustments discussed in this chapter, we have determined pro forma P/B and P/TB ratios of 58.8% for the Bank, which reflects an aggregate midpoint of $47.0 million for the Valuation Range based on the assumptions summarized in Exhibit IV. Employing a range of 15% above and below the midpoint, the resulting minimum value of approximately $40.0 million reflects a 54.1% P/B ratio and the resulting maximum value of approximately $54.1 million reflects a 62.8% P/B ratio. The adjusted maximum value, computed as an additional 15% above the maximum, is positioned at approximately $62.2 million and a P/B ratio of 66.8%.
The Bank’s pro forma P/B and P/TB ratios are equivalent since the Bank had no intangible assets as of December 31, 2020. The Bank’s pro forma P/B ratio of 62.8% at the maximum is slightly higher than the median pro forma P/B ratio of 59.6% reported for the four standard thrift conversion offerings that were completed in 2019 and 2020 as shown in Table 31. The Bank’s pro forma P/TB ratio of 62.8% at the maximum is positioned just below the median pro forma P/TB ratio of 63.3% reported for the specified group of recent standard thrift conversion offerings.
The Bank’s pro forma earnings base is negative and results in non-meaningful P/E ratios. However, on a core earnings basis, the Bank’s pro forma core P/E ratios range from 33.3x at the minimum and 41.7x at the midpoint to 52.6x at the maximum and 66.7x at the adjusted maximum.
94
FELDMAN FINANCIAL ADVISORS, INC.
The Comparative Group’s median core P/E ratio was equal to 13.2x. The Bank’s pro forma core earnings levels are relatively low and significantly below the Comparative Group’s median results. As a result, the Bank’s pro forma core P/E ratios are skewed upward by the low earnings base. Similarly, several of the Comparative Group companies with low core earnings results also display core P/E ratios that are distortedly high.
The Bank’s pro forma midpoint P/B and P/TB ratios of 58.8% reflect a discount of 34.8% to the Comparative Group median P/B ratio of 90.2% and a 39.5% discount to the Comparative Group median P/TB ratio of 97.2%. The Bank’s pro forma minimum P/B and P/TB ratios of 54.1% reflect a discount of 40.0% to the Comparative Group median P/B ratio and a 44.3% discount to the Comparative Group median P/TB. The Bank’s pro forma maximum P/B and P/TB ratios of 62.8% reflect discounts of 30.4% and 35.4% to the Comparative Group median P/B and P/TB ratios, respectively. At the adjusted maximum, the Bank’s pro forma P/B and P/TB ratios of 66.8% are positioned at a 25.9% discount to the Comparative Group median P/B and a discount of 31.3% to the Comparative Group median P/TB ratio.
Based on the price-to-assets valuation metric, the Bank’s pro forma midpoint of the Valuation Range at $47.0 million reflects a corresponding P/A ratio of 12.05%, ranging from 10.41% at the minimum valuation to 13.65% and 15.42% at the maximum and adjusted maximum, respectively. The Bank’s solid capitalization level resulted in a midpoint P/A ratio of 12.05% versus the Comparative Group median of 10.11% and average of 13.56%. While the Bank’s pro forma P/B and P/TB ratios reflect material discounts to the Comparative Group and its pro forma P/E ratios display significant premiums, the Bank’s pro forma P/A ratios generally evidence both a discount and premium to the Comparative Group median and average, respectively, at the pro forma minimum and midpoint value, but increasing levels of premiums at the pro forma maximum
95
FELDMAN FINANCIAL ADVISORS, INC.
and adjusted maximum values. The Bank’s relatively strong pro forma P/A ratios reflect the substantial capital ratios evidenced by TC Bancshares on a pro forma consolidated basis, which range from equity-to-assets ratios of 19.22% at the minimum valuation and 20.49% at the midpoint valuation to 21.72% at the maximum valuation and 23.09% at the adjusted maximum valuation.
Valuation Conclusion
It is our opinion that, as of February 26, 2021, the estimated pro forma market value of the Bank was within a Valuation Range of $39,950,000 to $54,050,000 with a midpoint of $47,000,000. The Valuation Range was based upon a 15% decrease from the midpoint to determine the minimum and a 15% increase from the midpoint to establish the maximum. Based on a price per share of $10.00, this Valuation Range equates to total shares offered for sale in the Stock Offering of 3,995,000 at the minimum to 5,405,000 at the maximum with a midpoint of 4,700,000 shares. Assuming an additional 15% increase above the maximum value would result in an adjusted maximum of $62,157,500 or 6,215,750 shares. Table 32 compares the Bank’s pro forma valuation ratios to the market valuation ratios of the Comparative Group.
Exhibit IV-1 displays the assumptions utilized in calculating the pro forma financial consequences of the Stock Offering. Exhibit IV-2 displays the pro forma financial data at the minimum, midpoint, maximum, and adjusted maximum levels of the Valuation Range. Exhibit IV-3 provides more detailed data and calculations at the pro forma midpoint level of the Valuation Range. Exhibit IV-4 compares the pro forma valuation ratios with the averages and medians reported by the Comparative Group.
96
FELDMAN FINANCIAL ADVISORS, INC.
Table 32
Comparative Pro Forma Market Valuation Analysis
Computed from Market Price Data as of February 26, 2021
| Current | Total | Price/ | Price/ | Price/ | Price/ | Price/ | Total | Tang. | Current | |||||||||||||||||||||||||||||||
| Stock | Market | LTM | Core | Book | Tang. | Total | Equity/ | Equity/ | Dividend | |||||||||||||||||||||||||||||||
| Price | Value | EPS | EPS | Value | Book | Assets | Assets | Assets | Yield | |||||||||||||||||||||||||||||||
| Company | ($) | ($Mil.) | (x) | (x) | (%) | (%) | (%) | (%) | (%) | (%) | ||||||||||||||||||||||||||||||
| TC Bancshares, Inc.(1) |
||||||||||||||||||||||||||||||||||||||||
| Pro Forma Minimum |
10.00 | 40.0 | NM | 33.3 | 54.1 | 54.1 | 10.41 | 19.22 | 19.22 | 0.00 | ||||||||||||||||||||||||||||||
| Pro Forma Midpoint |
10.00 | 47.0 | NM | 41.7 | 58.8 | 58.8 | 12.05 | 20.49 | 20.49 | 0.00 | ||||||||||||||||||||||||||||||
| Pro Forma Maximum |
10.00 | 54.1 | NM | 52.6 | 62.8 | 62.8 | 13.65 | 21.72 | 21.72 | 0.00 | ||||||||||||||||||||||||||||||
| Pro Forma Adj. Maximum |
10.00 | 62.2 | NM | 66.7 | 66.8 | 66.8 | 15.42 | 23.09 | 23.09 | 0.00 | ||||||||||||||||||||||||||||||
| Comparative Group Average |
NA | 53.6 | 23.8 | 25.9 | 91.5 | 93.8 | 13.56 | 15.06 | 14.86 | 1.10 | ||||||||||||||||||||||||||||||
| Comparative Group Median |
NA | 48.9 | 12.7 | 13.2 | 90.2 | 97.2 | 10.11 | 12.00 | 12.00 | 0.38 | ||||||||||||||||||||||||||||||
| All Public Thrift Average(2) |
NA | 649.9 | 18.1 | 18.7 | 108.1 | 120.6 | 12.79 | 12.34 | 11.47 | 1.80 | ||||||||||||||||||||||||||||||
| All Public Thrift Median(2) |
NA | 204.5 | 14.6 | 14.8 | 98.2 | 106.7 | 11.24 | 11.56 | 10.39 | 1.59 | ||||||||||||||||||||||||||||||
| Comparative Group |
||||||||||||||||||||||||||||||||||||||||
| CBM Bancorp, Inc. |
14.65 | 50.4 | 73.3 | 88.3 | 102.2 | 102.2 | 23.43 | 22.94 | 22.94 | 0.00 | ||||||||||||||||||||||||||||||
| Cincinnati Bancorp, Inc. |
12.31 | 36.6 | 11.5 | 11.5 | 88.3 | 88.6 | 15.45 | 17.50 | 17.44 | 0.00 | ||||||||||||||||||||||||||||||
| Elmira Savings Bank |
14.76 | 52.0 | 12.4 | 12.4 | 85.6 | 107.5 | 8.07 | 9.43 | 7.66 | 4.07 | ||||||||||||||||||||||||||||||
| FFBW, Inc. |
11.37 | 80.9 | 43.7 | 45.5 | 85.4 | 85.4 | 23.86 | 30.46 | 30.38 | 0.00 | ||||||||||||||||||||||||||||||
| HMN Financial, Inc. |
19.95 | 95.1 | 9.0 | 9.0 | 92.1 | 92.9 | 10.46 | 11.35 | 11.27 | 0.00 | ||||||||||||||||||||||||||||||
| Home Federal Bancorp, Inc. |
30.90 | 47.4 | 11.4 | 11.8 | 101.4 | 101.4 | 9.75 | 9.61 | 9.61 | 2.14 | ||||||||||||||||||||||||||||||
| HV Bancorp, Inc. |
18.04 | 36.3 | 6.4 | 6.5 | 101.5 | 101.5 | 4.58 | 4.52 | 4.52 | 0.00 | ||||||||||||||||||||||||||||||
| IF Bancorp, Inc. |
21.05 | 64.0 | 12.9 | 14.0 | 80.3 | 80.3 | 9.56 | 11.90 | 11.90 | 1.43 | ||||||||||||||||||||||||||||||
|
Mid-Southern Bancorp, Inc. |
15.85 | 47.3 | 41.7 | 44.8 | 102.7 | 102.7 | 21.37 | 20.82 | 20.82 | 0.76 | ||||||||||||||||||||||||||||||
| WVS Financial Corp. |
15.16 | 26.3 | 15.3 | 15.0 | 75.1 | 75.1 | 9.09 | 12.11 | 12.11 | 2.64 | ||||||||||||||||||||||||||||||
| (1) | Pro forma ratios assume an estimated pro forma market value of $40.0 million at the minimum, $47.0 million at the midpoint, $54.1 million at the maximum, and $62.2 million at the adjusted maximum. |
| (2) | All public thrifts traded on a major exchange, excluding mutual holding companies and companies being acquired in announced merger transactions. |
Source: TC Federal Bank; S&P Global Market Intelligence.
97
FELDMAN FINANCIAL ADVISORS, INC.
Exhibit I
Background of Feldman Financial Advisors, Inc.
Overview of Firm
Feldman Financial Advisors provides consulting and advisory services to financial institutions and mortgage companies in the areas of corporate valuations, mergers and acquisitions, strategic planning, branch sales and purchases, developing and implementing regulatory business and capital plans, and expert witness testimony and analysis. Our senior staff members have been involved in the stock conversion process since 1982 and have valued more than 350 converting institutions.
Feldman Financial Advisors was incorporated in February 1996 by a group of consultants who were previously associated with Credit Suisse First Boston and Kaplan Associates. Each of the principals at Feldman Financial Advisors has more than 35 years of experience in consulting, and all were officers of their prior firm. Our senior staff collectively has worked with more than 1,000 commercial banks, savings institutions, credit unions, insurance companies, and mortgage companies nationwide. The firm’s office is located outside of Washington, D.C. in McLean, Virginia.
Background of Senior Professional Staff
Trent Feldman - President. Trent is a nationally recognized expert in providing strategic advice to and valuing financial service companies and advising on mergers and acquisitions. Trent was with Kaplan Associates for 14 years and was one of three founding principals at that firm. Trent also has worked at the Federal Home Loan Bank Board and with the California legislature. Trent holds Bachelor’s and Master’s Degrees from the University of California, Los Angeles.
Peter Williams - Principal. Peter specializes in merger and acquisition analysis, mutual-to-stock conversion valuations, corporate valuations, strategic business plans, and fair value accounting analysis. Peter previously was with Kaplan Associates for 13 years. Peter also worked as a Corporate Planning Analyst with the Wilmington Trust Company in Delaware. Peter holds a BA in Economics from Yale University and an MBA in Finance and Investments from The George Washington University.
I-1
FELDMAN FINANCIAL ADVISORS, INC.
Exhibit II-1
Balance Sheets
TC Federal Bank
As of December 31, 2018 to 2020
(Dollars in Thousands)
| December 31, | ||||||||||||
| 2020 | 2019 | 2018 | ||||||||||
| Assets |
||||||||||||
| Cash and due from banks |
$ | 31,876 | $ | 24,192 | $ | 12,653 | ||||||
| Federal funds sold |
10,000 | - | - | |||||||||
| Certificates of deposit with other banks |
5,652 | 8,844 | 12,474 | |||||||||
| Investment securities available-for-sale |
15,917 | 22,108 | 27,114 | |||||||||
| Federal Home Loan Bank stock |
714 | 400 | 379 | |||||||||
| Loans held for sale |
2,945 | 1,428 | 89 | |||||||||
| Loans, net |
292,356 | 244,971 | 235,233 | |||||||||
| Premises and equipment, net |
3,444 | 3,340 | 3,485 | |||||||||
| Other real estate owned |
81 | 358 | 351 | |||||||||
| Bank-owned life insurance |
10,883 | 10,583 | - | |||||||||
| Accrued interest receivable and other assets |
6,059 | 5,539 | 5,404 | |||||||||
|
|
|
|
|
|
|
|||||||
| Total Assets |
$ | 379,927 | $ | 321,762 | $ | 297,181 | ||||||
|
|
|
|
|
|
|
|||||||
| Liabilities and Equity |
||||||||||||
| Deposits: |
||||||||||||
| Demand accounts |
$ | 28,769 | $ | 18,042 | $ | 16,217 | ||||||
| Interest-bearing demand accounts |
146,480 | 125,239 | 112,482 | |||||||||
| Savings accounts |
32,275 | 21,961 | 22,780 | |||||||||
| Certificates of deposit |
86,576 | 108,363 | 98,869 | |||||||||
|
|
|
|
|
|
|
|||||||
| Total Deposits |
294,100 | 273,604 | 250,348 | |||||||||
| Federal Home Loan Bank advances |
9,515 | 2,825 | 2,992 | |||||||||
| Accrued interest payable and other liabilities |
6,454 | 5,544 | 5,823 | |||||||||
|
|
|
|
|
|
|
|||||||
| Total Liabilities |
310,069 | 281,973 | 259,162 | |||||||||
|
|
|
|
|
|
|
|||||||
| Retained earnings |
41,973 | 41,666 | 40,458 | |||||||||
| Accumulated other comprehensive loss |
(2,115 | ) | (1,877 | ) | (2,439 | ) | ||||||
|
|
|
|
|
|
|
|||||||
| Total Equity |
39,858 | 39,788 | 38,019 | |||||||||
|
|
|
|
|
|
|
|||||||
| Total Liabilities and Equity |
$ | 349,927 | $ | 321,762 | $ | 297,181 | ||||||
|
|
|
|
|
|
|
|||||||
|
|
||||||||||||
Source: TC Federal Bank, audited financial statements.
II-1
FELDMAN FINANCIAL ADVISORS, INC.
Exhibit II-2
Income Statements
TC Federal Bank
For the Years Ended December 31, 2018 to 2020
(Dollars in Thousands)
| Year Ended December 31, |
||||||||||||
| 2020 | 2019 | 2018 | ||||||||||
| Total interest income |
$ | 13,088 | $ | 12,557 | $ | 11,374 | ||||||
| Total interest expense |
2,365 | 3,101 | 2,110 | |||||||||
|
|
|
|
|
|
|
|||||||
| Net interest income |
10,723 | 9,455 | 9,264 | |||||||||
| Provision for (reduction in) loan losses |
780 | - | (551 | ) | ||||||||
|
|
|
|
|
|
|
|||||||
| Net interest income after provision |
9,943 | 9,455 | 9,815 | |||||||||
|
|
|
|
|
|
|
|||||||
| Service charges on deposit accounts |
472 | 513 | 420 | |||||||||
| Gain on sale of mortgage loans |
1,236 | 380 | 187 | |||||||||
| Gain on sale of available-for-sale securities |
- | 67 | - | |||||||||
| Bank-owned life insurance income |
301 | 296 | - | |||||||||
| Other income |
22 | 4 | - | |||||||||
|
|
|
|
|
|
|
|||||||
| Total non-interest income |
2,031 | 1,260 | 607 | |||||||||
|
|
|
|
|
|
|
|||||||
| Salaries and employee benefits |
6,444 | 5,327 | 5,499 | |||||||||
| Occupancy and equipment |
754 | 658 | 629 | |||||||||
| Advertising |
253 | 282 | 468 | |||||||||
| Checking account related expenses |
338 | 313 | 324 | |||||||||
| Data processing fees |
393 | 356 | 339 | |||||||||
| Other real estate owned expense, net |
(13 | ) | 11 | (4 | ) | |||||||
| Data processing conversion costs |
1,132 | - | - | |||||||||
| Expenses of delayed stock offering |
506 | - | - | |||||||||
| Other expenses |
1,819 | 2,194 | 2,141 | |||||||||
|
|
|
|
|
|
|
|||||||
| Total non-interest expense |
11,626 | 9,141 | 9,395 | |||||||||
|
|
|
|
|
|
|
|||||||
| Income before income taxes |
348 | 1,574 | 1,027 | |||||||||
| Income tax expense |
40 | 367 | 348 | |||||||||
|
|
|
|
|
|
|
|||||||
| Net income |
$ | 308 | $ | 1,207 | $ | 679 | ||||||
|
|
|
|
|
|
|
|||||||
Source: TC Federal Bank, audited financial statements and internal financial data.
II-2
FELDMAN FINANCIAL ADVISORS, INC.
Exhibit II-3
Loan Portfolio Composition
TC Federal Bank
As of December 31, 2018 to 2020
(Dollars in Thousands)
| December 31, | ||||||||||||||||||||||||
| 2020 | 2019 | 2018 | ||||||||||||||||||||||
| Loan Category |
Amount (000s) |
Percent (%) |
Amount (000s) |
Percent (%) |
Amount (000s) |
Percent (%) |
||||||||||||||||||
|
|
|
|
|
|
|
|||||||||||||||||||
| Residential mortgage |
$ | 105,837 | 39.56 | $ | 109,604 | 44.08 | $ | 115,601 | 48.38 | |||||||||||||||
| Home equity |
8,892 | 3.32 | 6,855 | 2.76 | 4,945 | 2.07 | ||||||||||||||||||
| Multi-family real estate |
15,140 | 5.66 | 17,074 | 6.87 | 17,056 | 7.14 | ||||||||||||||||||
| Commercial real estate |
72,718 | 27.18 | 78,151 | 31.43 | 73,385 | 30.71 | ||||||||||||||||||
| Construction and land develop. |
29,983 | 11.21 | 23,428 | 9.42 | 18,214 | 7.62 | ||||||||||||||||||
|
|
|
|
|
|
|
|
|
|
|
|
|
|||||||||||||
| Total real estate loans |
232,571 | 86.93 | 235,112 | 94.56 | 229,201 | 95.93 | ||||||||||||||||||
| Commercial business |
29,600 | 11.06 | 9,235 | 3.71 | 7,502 | 3.14 | ||||||||||||||||||
| Consumer |
5,373 | 2.01 | 4,313 | 1.73 | 2,233 | 0.93 | ||||||||||||||||||
|
|
|
|
|
|
|
|
|
|
|
|
|
|||||||||||||
| Gross total loans |
267,543 | 100.00 | 248,660 | 100.00 | 238,936 | 100.00 | ||||||||||||||||||
|
|
|
|
|
|
|
|||||||||||||||||||
| Deferred fees and discounts |
(1,101 | ) | (624 | ) | (517 | ) | ||||||||||||||||||
| Allowance for loan losses |
(4,086 | ) | (3,065 | ) | (3,186 | ) | ||||||||||||||||||
|
|
|
|
|
|
|
|||||||||||||||||||
| Net total loans (1) |
$ | 262,356 | $ | 244,971 | $ | 235,233 | ||||||||||||||||||
|
|
|
|
|
|
|
|||||||||||||||||||
(1) Excludes loans held for sale
Source: TC Federal Bank, financial data.
II-3
FELDMAN FINANCIAL ADVISORS, INC.
Exhibit II-4
Net Lending Activity
TC Federal Bank
For the Years Ended December 31, 2018 to 2020
(Dollars in Thousands)
| Year Ended December 31, | |||||||||||||||
| 2020 | 2019 | 2018 | |||||||||||||
| Loan Originations and Purchases |
|||||||||||||||
| Residential mortgage loans (1) |
$ | 21,320 | $ | 16,551 | $ | 26,322 | |||||||||
| Home equity loans |
2,496 | 1,017 | 502 | ||||||||||||
| Multi-family real estate loans |
2,177 | 4,141 | 6,962 | ||||||||||||
| Commercial real estate loans |
17,539 | 13,418 | 18,312 | ||||||||||||
| Construction and land development loans |
12,796 | 10,959 | 10,119 | ||||||||||||
| Commercial business loans |
29,845 | 5,164 | 5,592 | ||||||||||||
| Consumer loans |
7,067 | 627 | 1,376 | ||||||||||||
|
|
|
|
|
|
|
||||||||||
| Total loan originations (2) |
93,240 | 51,877 | 69,185 | ||||||||||||
| Loans purchased (3) |
1,500 | 4,735 | 3,749 | ||||||||||||
|
|
|
|
|
|
|
||||||||||
| Total loan originations and purchases |
94,740 | 56,612 | 72,934 | ||||||||||||
| Loan Sales and Repayments |
|||||||||||||||
| Loans sold (1)(4) |
(5,425 | ) | (3,483 | ) | (350 | ) | |||||||||
| Loans transferred to real estate owned |
- | (7 | ) | (27 | ) | ||||||||||
| Loan principal repayments |
(70,432 | ) | (43,078 | ) | (47,403 | ) | |||||||||
|
|
|
|
|
|
|
||||||||||
| Total loan sales and repayments |
(75,857 | ) | (46,568 | ) | (47,780 | ) | |||||||||
| Decrease due to other items, net |
- | (320 | ) | (170 | ) | ||||||||||
|
|
|
|
|
|
|
||||||||||
| Net loan activity |
$ | 18,883 | $ | 9,724 | $ | 24,984 | |||||||||
|
|
|
|
|
|
|
||||||||||
(1) Excludes mortgage loans held for sale.
(2) Includes loan participations originated by TC Federal Bank and sold to other lenders.
(3) Participation interests in loans bought by TC Federal Bank.
(4) Participation interests in loans sold by TC Federal Bank.
Source: TC Federal Bank, financial data.
II-4
FELDMAN FINANCIAL ADVISORS, INC.
Exhibit II-5
Cash and Investments Composition
TC Federal Bank
As of December 31, 2018 to 2020
(Dollars in Thousands)
| December 31, | ||||||||||||||||||||||||||||||
| 2020 | 2019 | 2018 | ||||||||||||||||||||||||||||
| Cash or Investment Category |
Amount (000s) |
Percent (%) |
Amount (000s) |
Percent (%) |
Amount (000s) |
Percent (%) | ||||||||||||||||||||||||
|
|
|
|
|
|
|
|||||||||||||||||||||||||
| Cash and due from banks |
$ | 31,876 | 49.68 | $ | 24,192 | 43.55 | $ | 12,653 | 24.05 | |||||||||||||||||||||
| Federal funds sold |
10,000 | 15.59 | - | - | - | - | ||||||||||||||||||||||||
| Interest-bearing time deposits |
5,652 | 8.81 | 8,844 | 15.92 | 12,474 | 23.71 | ||||||||||||||||||||||||
|
|
|
|
|
|
|
|
|
|
|
|
|
|||||||||||||||||||
| Total cash and cash equivalents |
47,528 | 74.08 | 33,036 | 59.48 | 25,127 | 47.75 | ||||||||||||||||||||||||
|
Available-for-sale securities: |
||||||||||||||||||||||||||||||
| Government sponsored mortgage-backed securities |
6,281 | 9.79 | 9,941 | 17.90 | 22,140 | 42.08 | ||||||||||||||||||||||||
| Collateralized mortgage obligations |
9,135 | 14.24 | 9,650 | 17.37 | - | - | ||||||||||||||||||||||||
| Corporate obligations |
501 | 0.78 | 2,517 | 4.53 | 4,974 | 9.45 | ||||||||||||||||||||||||
|
|
|
|
|
|
|
|
|
|
|
|
|
|||||||||||||||||||
| Total available-for-sale securities |
15,917 | 24.81 | 22,108 | 39.80 | 27,114 | 51.53 | ||||||||||||||||||||||||
| Other investments: |
||||||||||||||||||||||||||||||
| Federal Home Loan Bank stock |
714 | 1.11 | 400 | 0.72 | 379 | 0.72 | ||||||||||||||||||||||||
|
|
|
|
|
|
|
|
|
|
|
|
|
|||||||||||||||||||
| Total cash and investments |
$ | 64,159 | 100.00 | $ | 55,544 | 100.00 | $ | 52,620 | 100.00 | |||||||||||||||||||||
|
|
|
|
|
|
|
|
|
|
|
|
|
|||||||||||||||||||
| Percent of total assets (%) |
||||||||||||||||||||||||||||||
| Cash and cash equivalents |
13.58 | 10.27 | 8.46 | |||||||||||||||||||||||||||
|
Available-for-sale securities |
4.55 | 6.87 | 9.12 | |||||||||||||||||||||||||||
| Federal Home Loan Bank stock |
0.20 | 0.12 | 0.13 | |||||||||||||||||||||||||||
|
|
|
|
|
|
|
|||||||||||||||||||||||||
| Total cash and investments |
18.34 | 17.26 | 17.71 | |||||||||||||||||||||||||||
|
|
|
|
|
|
|
|||||||||||||||||||||||||
Source: TC Federal Bank, financial data.
II-5
FELDMAN FINANCIAL ADVISORS, INC.
Exhibit II-6
Deposit Account Composition
TC Federal Bank
As of December 31, 2018 to 2020
(Dollars in Thousands)
| December 31, | ||||||||||||||||||||||||||||||||
| 2020 | 2019 | 2018 | ||||||||||||||||||||||||||||||
| Deposit Account Category |
|
Amount (000s) |
Percent (%) |
Amount (000s) |
Percent (%) |
Amount (000s) |
Percent (%) | |||||||||||||||||||||||||
| Non-interest-bearing checking |
$ | 28,769 | 9.78 | $ | 18,042 | 6.60 | $ | 16,217 | 6.49 | |||||||||||||||||||||||
| Interest-bearing checking |
56,800 | 19.30 | 35,770 | 13.07 | 31,417 | 12.55 | ||||||||||||||||||||||||||
| Savings accounts |
32,275 | 10.97 | 21,961 | 8.03 | 22,780 | 9.10 | ||||||||||||||||||||||||||
| Money market accounts |
89,680 | 30.49 | 89,468 | 32.70 | 81,065 | 32.38 | ||||||||||||||||||||||||||
|
|
|
|
|
|
|
|
|
|
|
|
|
|||||||||||||||||||||
| Total Non-certificates |
207,524 | 70.56 | 165,241 | 60.39 | 151,479 | 60.51 | ||||||||||||||||||||||||||
|
|
|
|
|
|
|
|
|
|
|
|
|
|||||||||||||||||||||
| Certificates of deposit: |
||||||||||||||||||||||||||||||||
| 0.00% - 1.00% |
38,117 | 12.95 | 2,966 | 1.07 | 20,247 | 8.08 | ||||||||||||||||||||||||||
| 1.01% - 2.00% |
27,078 | 9.20 | 46,726 | 17.07 | 52,144 | 20.82 | ||||||||||||||||||||||||||
| 2.01% - 3.00% |
21,306 | 7.24 | 57,773 | 21.12 | 26,256 | 10.49 | ||||||||||||||||||||||||||
| 3.01% - 4.00% |
75 | 0.03 | 898 | 0.33 | 221 | 0.09 | ||||||||||||||||||||||||||
|
|
|
|
|
|
|
|
|
|
|
|
|
|||||||||||||||||||||
| Total Certificates |
86,576 | 29.44 | 108,363 | 39.61 | 98,869 | 39.49 | ||||||||||||||||||||||||||
|
|
|
|
|
|
|
|
|
|
|
|
|
|||||||||||||||||||||
| Total Deposits |
$ | 294,100 | 100.00 | $ | 273,604 | 100.00 | $ | 250,348 | 100.00 | |||||||||||||||||||||||
|
|
|
|
|
|
|
|
|
|
|
|
|
|||||||||||||||||||||
Source: TC Federal Bank, financial data.
II-6
FELDMAN FINANCIAL ADVISORS, INC.
Exhibit II-7
Borrowed Funds Composition
TC Federal Bank
As of For the Years Ended December 31, 2018 to 2020
(Dollars in Thousands)
|
As of or For the Year Ended December 31, |
||||||||||||
| 2020 | 2019 | 2018 | ||||||||||
| Federal Home Loan Bank Advances |
||||||||||||
| Average balance outstanding during the year |
$9,667 | $2,901 | $3,177 | |||||||||
| Balance outstanding at end of year |
$9,515 | $2,825 | $2,992 | |||||||||
| Maximum amount of borrowings outstanding at any month-end during the year |
$12,769 | $2,978 | $3,803 | |||||||||
| Weighted average interest rate during the year |
1.10% | 2.46% | 2.59% | |||||||||
| Weighted average interest rate at end of year |
0.86% | 2.41% | 2.47% | |||||||||
Source: TC Federal Bank, financial data.
II-7
FELDMAN FINANCIAL ADVISORS, INC.
Exhibit II-8
Office Properties
TC Federal Bank
As of December 31, 2020
(Dollars in Thousands)
| Location |
Leased |
Date of Lease Expiration |
Net Book ($000s) |
|||||||||||||||||||||
| Main Office |
||||||||||||||||||||||||
| 131 South Dawson Street |
Owned | NA | $2,067 | |||||||||||||||||||||
| Thomasville, Georgia 31799 |
||||||||||||||||||||||||
| Branch Office |
||||||||||||||||||||||||
|
2915-501 Kerry Forest Parkway |
Owned | NA | 1,355 | |||||||||||||||||||||
| Tallahassee, Florida 32309 |
||||||||||||||||||||||||
| Savannah Commercial LPO |
||||||||||||||||||||||||
| 105 West Congress Street, Unit C |
Leased | 12/31/21 | 21 | |||||||||||||||||||||
| Savannah, Georgia 31401 |
||||||||||||||||||||||||
| Residential Mortgage Center |
||||||||||||||||||||||||
| 2282 Killearn Center Blvd., Suite B |
Leased | 8/31/21 | NA | |||||||||||||||||||||
|
Tallahassee, Florida 32308
|
||||||||||||||||||||||||
Source: TC Federal Bank.
II-8
FELDMAN FINANCIAL ADVISORS, INC.
Exhibit III
Financial and Market Data for All Public Thrifts
| Company | State | Ticker | Total Assets ($Mil.) |
Total Equity/ (%) |
Tang. Equity/ |
LTM ROA (%) |
LTM ROE (%) |
Closing Price 2/26/21 ($) |
Total Market Value ($Mil.) |
Price/ LTM EPS (x) |
Price/ Core EPS (x) |
Price/ Book Value (%) |
Price/ Tang. Book (%) |
Price/ Assets (%) |
Div. Yield |
|||||||||||||||||||||||||||||||||||||||||||||
| All Public Thrifts (1) |
||||||||||||||||||||||||||||||||||||||||||||||||||||||||||||
| Affinity Bancshares, Inc. |
GA | AFBI | 888 | 8.92 | 6.93 | 0.32 | 2.55 | 11.24 | 77.3 | 43.2 | 20.0 | 107.4 | 141.3 | 9.58 | 0.00 | |||||||||||||||||||||||||||||||||||||||||||||
| Axos Financial, Inc. |
NV | AX | 14,393 | 8.95 | 8.18 | 1.59 | 16.93 | 46.27 | 2,732.0 | 13.4 | 12.5 | 212.3 | 234.2 | 18.99 | 0.00 | |||||||||||||||||||||||||||||||||||||||||||||
| Broadway Financial Corporation |
CA | BYFC | 499 | 9.89 | 9.89 | (0.03 | ) | (0.26 | ) | 1.97 | 36.9 | NM | NA | 111.9 | 111.9 | 11.06 | 0.00 | |||||||||||||||||||||||||||||||||||||||||||
| Capitol Federal Financial, Inc. |
KS | CFFN | 9,607 | 13.29 | 13.16 | 0.64 | 4.69 | 13.31 | 1,799.8 | 30.3 | 29.5 | 144.7 | 146.4 | 19.23 | 2.55 | |||||||||||||||||||||||||||||||||||||||||||||
| Carver Bancorp, Inc. |
NY | CARV | 686 | 6.76 | 6.76 | (0.74 | ) | (9.86 | ) | 10.06 | 32.4 | NM | NM | 106.7 | 106.7 | 4.52 | 0.00 | |||||||||||||||||||||||||||||||||||||||||||
| CBM Bancorp, Inc. |
MD | CBMB | 232 | 22.94 | 22.94 | 0.32 | 1.27 | 14.65 | 50.4 | 73.3 | 88.3 | 102.2 | 102.2 | 23.43 | 0.00 | |||||||||||||||||||||||||||||||||||||||||||||
| Cincinnati Bancorp, Inc. |
OH | CNNB | 237 | 17.50 | 17.44 | 1.36 | 9.46 | 12.31 | 36.6 | 11.5 | 11.5 | 88.3 | 88.6 | 15.45 | 0.00 | |||||||||||||||||||||||||||||||||||||||||||||
| Elmira Savings Bank |
NY | ESBK | 645 | 9.43 | 7.66 | 0.64 | 6.95 | 14.76 | 52.0 | 12.4 | 12.4 | 85.6 | 107.5 | 8.07 | 4.07 | |||||||||||||||||||||||||||||||||||||||||||||
| ESSA Bancorp, Inc. |
PA | ESSA | 1,869 | 10.39 | 9.69 | 0.79 | 7.77 | 15.71 | 158.4 | 10.8 | 10.8 | 87.6 | 94.6 | 9.10 | 2.80 | |||||||||||||||||||||||||||||||||||||||||||||
| FFBW, Inc. |
WI | FFBW | 339 | 30.46 | 30.38 | 0.62 | 2.14 | 11.37 | 80.9 | 43.7 | 45.5 | 85.4 | 85.4 | 23.86 | 0.00 | |||||||||||||||||||||||||||||||||||||||||||||
| First Northwest Bancorp |
WA | FNWB | 1,654 | 11.27 | 11.27 | 0.72 | 5.79 | 16.28 | 154.3 | 14.8 | 19.5 | 89.5 | 89.5 | 10.08 | 1.47 | |||||||||||||||||||||||||||||||||||||||||||||
| Flagstar Bancorp, Inc. |
MI | FBC | 31,038 | 7.09 | 6.62 | 2.00 | 26.22 | 43.39 | 2,284.7 | 4.6 | 4.5 | 103.8 | 111.8 | 7.36 | 0.55 | |||||||||||||||||||||||||||||||||||||||||||||
| FS Bancorp, Inc. |
WA | FSBW | 2,113 | 10.88 | 10.59 | 2.02 | 18.74 | 60.63 | 260.2 | 6.8 | 6.9 | 111.7 | 115.3 | 12.16 | 1.72 | |||||||||||||||||||||||||||||||||||||||||||||
| Generations Bancorp NY, Inc. |
NY | GBNY | 368 | 8.10 | 7.68 | 0.37 | 4.67 | 9.80 | 24.1 | 17.8 | 27.8 | 81.1 | 85.8 | 6.57 | 0.00 | |||||||||||||||||||||||||||||||||||||||||||||
| HarborOne Bancorp, Inc. |
MA | HONE | 4,484 | 15.53 | 14.11 | 1.05 | 6.55 | 11.95 | 650.7 | 14.6 | 14.2 | 98.2 | 109.9 | 15.25 | 1.00 | |||||||||||||||||||||||||||||||||||||||||||||
| Hingham Institution for Savings |
MA | HIFS | 2,857 | 10.25 | 10.25 | 1.88 | 18.96 | 242.38 | 518.2 | 10.4 | 11.9 | 176.9 | 176.9 | 18.14 | 0.78 | |||||||||||||||||||||||||||||||||||||||||||||
| HMN Financial, Inc. |
MN | HMNF | 910 | 11.35 | 11.27 | 1.21 | 10.56 | 19.95 | 95.1 | 9.0 | NA | 92.1 | 92.9 | 10.46 | 0.00 | |||||||||||||||||||||||||||||||||||||||||||||
| Home Federal Bancorp, Inc. |
LA | HFBL | 535 | 9.61 | 9.61 | 0.93 | 9.30 | 30.90 | 47.4 | 11.4 | 11.8 | 101.4 | 101.4 | 9.75 | 2.14 | |||||||||||||||||||||||||||||||||||||||||||||
| HV Bancorp, Inc. |
PA | HVBC | 862 | 4.52 | 4.52 | 1.23 | 16.90 | 18.04 | 36.3 | 6.4 | NA | 101.5 | 101.5 | 4.58 | 0.00 | |||||||||||||||||||||||||||||||||||||||||||||
| IF Bancorp, Inc. |
IL | IROQ | 713 | 11.90 | 11.90 | 0.70 | 6.06 | 21.05 | 64.0 | 12.9 | 14.0 | 80.3 | 80.3 | 9.56 | 1.43 | |||||||||||||||||||||||||||||||||||||||||||||
| Kearny Financial Corp. |
NJ | KRNY | 7,335 | 14.89 | NA | 0.73 | 4.66 | 11.35 | 923.2 | 18.6 | 17.6 | 88.3 | 111.8 | 13.14 | 3.17 | |||||||||||||||||||||||||||||||||||||||||||||
| Meridian Bancorp, Inc. |
MA | EBSB | 6,620 | 11.61 | 11.32 | 1.01 | 8.76 | 16.75 | 841.2 | 13.0 | 13.7 | 114.2 | 117.6 | 13.26 | 2.39 | |||||||||||||||||||||||||||||||||||||||||||||
| Mid-Southern Bancorp, Inc. |
IN | MSVB | 235 | 20.82 | 20.82 | 0.55 | 2.39 | 15.85 | 47.3 | 41.7 | 44.8 | 102.7 | 102.7 | 21.37 | 0.76 | |||||||||||||||||||||||||||||||||||||||||||||
| New York Community Bancorp, Inc. |
NY | NYCB | 56,306 | 12.15 | 8.19 | 0.94 | 7.62 | 12.21 | 5,664.2 | 12.0 | 12.1 | 89.4 | 144.8 | 10.15 | 5.57 | |||||||||||||||||||||||||||||||||||||||||||||
| Northfield Bancorp, Inc. |
NJ | NFBK | 5,515 | 13.67 | 13.01 | 0.70 | 5.07 | 13.69 | 714.8 | 18.0 | 15.8 | 94.8 | 100.4 | 12.96 | 3.21 | |||||||||||||||||||||||||||||||||||||||||||||
| Northwest Bancshares, Inc. |
PA | NWBI | 13,806 | 11.14 | 8.48 | 0.58 | 4.72 | 14.12 | 1,793.5 | 22.8 | 17.7 | 116.6 | 157.8 | 12.99 | 5.38 | |||||||||||||||||||||||||||||||||||||||||||||
| PCSB Financial Corporation |
NY | PCSB | 1,790 | 15.05 | 14.75 | 0.55 | 3.50 | 16.16 | 241.9 | 25.7 | 25.5 | 96.6 | 98.9 | 14.53 | 0.99 | |||||||||||||||||||||||||||||||||||||||||||||
| Provident Bancorp, Inc. |
MA | PVBC | 1,506 | 15.66 | 15.66 | 0.89 | 5.05 | 12.25 | 209.5 | 18.6 | 16.2 | 98.9 | 98.9 | 15.50 | 0.98 | |||||||||||||||||||||||||||||||||||||||||||||
| Provident Financial Holdings, Inc. |
CA | PROV | 1,171 | 10.68 | 10.68 | 0.47 | 4.34 | 15.75 | 117.2 | 21.9 | 21.9 | 93.8 | 93.8 | 10.01 | 3.56 | |||||||||||||||||||||||||||||||||||||||||||||
| Provident Financial Services, Inc. |
NJ | PFS | 12,920 | 12.54 | 9.26 | 0.86 | 6.49 | 20.23 | 1,540.6 | 14.6 | 14.1 | 96.9 | 136.1 | 12.15 | 4.55 | |||||||||||||||||||||||||||||||||||||||||||||
| Prudential Bancorp, Inc. |
PA | PBIP | 1,193 | 11.00 | 10.52 | 0.73 | 6.76 | 13.55 | 108.4 | 12.8 | 24.7 | 82.6 | 86.8 | 9.08 | 2.07 | |||||||||||||||||||||||||||||||||||||||||||||
III-1
FELDMAN FINANCIAL ADVISORS, INC.
Exhibit III (continued)
Financial and Market Data for All Public Thrifts
| Company | State | Ticker | Total Assets ($Mil.) |
Total Equity/ |
Tang. Equity/ (%) |
LTM ROA (%) |
LTM ROE (%) |
Closing Price 2/26/21 ($) |
Total Market Value ($Mil.) |
Price/ LTM EPS (x) |
Price/ Core EPS (x) |
Price/ Book Value (%) |
Price/ Tang. Book (%) |
Price/ Assets (%) |
Div. Yield |
|||||||||||||||||||||||||||||||||||||||||
| Randolph Bancorp, Inc. |
MA | RNDB | 721 | 13.84 | NA | 2.89 | 22.54 | 19.90 | 102.3 | 5.2 | 4.8 | 109.6 | NA | 15.17 | 0.00 | |||||||||||||||||||||||||||||||||||||||||
| Riverview Bancorp, Inc. |
WA | RVSB | 1,436 | 10.57 | 8.81 | 0.74 | 6.61 | 6.60 | 147.5 | 15.0 | 14.8 | 97.1 | 118.8 | 10.27 | 3.03 | |||||||||||||||||||||||||||||||||||||||||
| Severn Bancorp, Inc. |
MD | SVBI | 953 | 11.51 | 11.41 | 0.76 | 6.21 | 8.20 | 105.1 | 15.8 | 15.6 | 95.8 | 96.8 | 11.03 | 2.44 | |||||||||||||||||||||||||||||||||||||||||
| Spirit of Texas Bancshares, Inc. |
TX | STXB | 3,085 | 11.69 | 9.09 | 1.12 | 8.97 | 20.76 | 354.6 | 11.7 | 10.4 | 98.3 | 130.2 | 11.49 | 1.73 | |||||||||||||||||||||||||||||||||||||||||
| Sterling Bancorp, Inc. |
MI | SBT | 3,914 | 8.17 | 8.17 | (0.35 | ) | (3.85 | ) | 5.14 | 256.9 | NM | NA | 80.4 | 80.4 | 6.56 | 0.00 | |||||||||||||||||||||||||||||||||||||||
| Territorial Bancorp Inc. |
HI | TBNK | 2,111 | 11.78 | 11.78 | 0.89 | 7.55 | 24.58 | 223.9 | 12.2 | 13.0 | 94.0 | 94.0 | 11.08 | 3.74 | |||||||||||||||||||||||||||||||||||||||||
| Timberland Bancorp, Inc. |
WA | TSBK | 1,588 | 12.17 | 11.24 | 1.69 | 13.63 | 27.75 | 230.9 | 9.3 | 9.2 | 119.4 | 130.7 | 14.53 | 3.03 | |||||||||||||||||||||||||||||||||||||||||
| Triumph Bancorp, Inc. |
TX | TBK | 5,936 | 12.24 | 9.34 | 1.18 | 9.67 | 76.70 | 1,892.4 | 30.3 | 37.5 | 279.8 | 387.8 | 32.38 | 0.00 | |||||||||||||||||||||||||||||||||||||||||
| TrustCo Bank Corp NY |
NY | TRST | 5,902 | 9.63 | 9.62 | 0.94 | 9.47 | 6.88 | 663.5 | 12.7 | 12.9 | 116.8 | 116.9 | 11.24 | 3.96 | |||||||||||||||||||||||||||||||||||||||||
| Waterstone Financial, Inc. |
WI | WSBF | 2,185 | 18.91 | 18.89 | 3.77 | 20.62 | 19.43 | 460.2 | 5.9 | 5.7 | 118.0 | 118.2 | 22.31 | 4.12 | |||||||||||||||||||||||||||||||||||||||||
| Western New England Bancorp, Inc. |
MA | WNEB | 2,366 | 9.58 | 8.99 | 0.48 | 4.86 | 8.01 | 199.6 | 17.8 | 16.9 | 89.3 | 95.9 | 8.56 | 2.50 | |||||||||||||||||||||||||||||||||||||||||
| WSFS Financial Corporation |
DE | WSFS | 14,334 | 12.48 | 8.94 | 0.86 | 6.18 | 53.14 | 2,537.8 | 23.4 | 26.4 | 141.6 | 205.6 | 17.70 | 0.90 | |||||||||||||||||||||||||||||||||||||||||
| WVS Financial Corp. |
PA | WVFC | 317 | 12.11 | 12.11 | 0.50 | 4.81 | 15.16 | 26.3 | 15.3 | 15.0 | 75.1 | 75.1 | 9.09 | 2.64 | |||||||||||||||||||||||||||||||||||||||||
| Average |
5,186 | 12.34 | 11.47 | 0.93 | 7.77 | NA | 649.9 | 18.1 | 19.2 | 108.1 | 120.6 | 13.04 | 1.80 | |||||||||||||||||||||||||||||||||||||||||||
| Median |
1,722 | 11.56 | 10.39 | 0.77 | 6.52 | NA | 204.5 | 14.6 | 14.8 | 98.2 | 106.7 | 11.37 | 1.59 | |||||||||||||||||||||||||||||||||||||||||||
| (1) | Public thrifts traded on NYSE, NYSE American, and NASDAQ stock markets; excludes companies subject to pending acquisitions or mutual holding company ownership. |
Source: S&P Global Market Intelligence.
III-2
FELDMAN FINANCIAL ADVISORS, INC.
Exhibit IV-1
Pro Forma Assumptions for the Stock Offering
| 1. | The total amount of the net offering proceeds was fully invested at the beginning of the applicable period. |
| 2. | The net offering proceeds are invested to yield a return of 0.36%, which represented the yield on five-year U.S. Treasury securities at December 31, 2020. The effective combined federal and state income tax rate was assumed to be 21.6%, resulting in a net after-tax yield of 0.28%. |
| 3. | It is assumed that 8.0% of the total shares of common stock to be sold in the Stock Offering will be acquired by the Bank’s employee stock ownership plan (“ESOP”). Pro forma adjustments have been made to earnings and equity to reflect the impact of the ESOP. The annual expense is estimated based on a 20-year loan to the ESOP from the Company. No re-investment is assumed on proceeds used to fund the ESOP. |
| 4. | It is assumed that that the Bank’s restricted stock plan (“RSP”) will purchase in the open market a number of shares equal to 4.0% of the total shares sold in the Stock Offering. Also, it is assumed that these shares are acquired at the initial public offering price of $10.00 per share. Pro forma adjustments have been made to earnings and equity to reflect the impact of the RSP. The annual expense is estimated based on a five-year vesting period. No re-investment is assumed on proceeds used to fund the RSP. |
| 5. | It is assumed that an additional 10.0% of the total shares sold in the Stock Offering will be reserved for issuance by the Bank’s stock option plan. The pro forma net income has been adjusted to reflect the expense associated with the granting of options at an assumed options value of $2.69 per share. It is further assumed that options for all shares reserved under the plan were granted to plan participants at the beginning of the period and 25.0% were non-qualified options for income tax purposes, the options would vest at a rate of 20.0% per year, and compensation expense will be recognized on a straight-line basis over the five-year vesting period |
| 6. | The fair value of stock options has been estimated at $2.69 per option using the Black-Scholes option pricing model with the following assumptions: a grant-date share price and option exercise price of $10.00; dividend yield of 0.00%; an expected option life of 10 years; a risk-free interest rate of 0.93%; and a volatility rate of 18.68% based on a selected index of publicly traded thrift institutions. |
| 7. | Fixed offering expenses are estimated at $783,500. As a variable component of offering expenses, sales commission expenses paid to the marketing agent equal 1.25% of the amount of stock sold in the Stock Offering, excluding shares purchased by the ESOP and purchased by directors, officers, employees and their associates (currently estimated at 147,500 shares of $1.5 million in aggregate purchases of common stock) |
| 8. | No effect has been given to withdrawals from deposit accounts for the purpose of purchasing common stock in the Stock Offering. |
| 9. | No effect has been given in the pro forma equity calculation for the assumed earnings on the net proceeds. |
IV-1
FELDMAN FINANCIAL ADVISORS, INC.
Exhibit IV-2
TC Federal Bank
Pro Forma Conversion Valuation Range
Historical Financial Data as of December 31, 2020
(Dollars in Thousands, Except Per Share Data)
| MINIMUM | MIDPOINT | MAXIMUM | ADJ. MAX. | |||||||||||||||||
| Shares sold in the offering |
3,995,000 | 4,700,000 | 5,405,000 | 6,215,750 | ||||||||||||||||
| Offering price |
$10.00 | $10.00 | $10.00 | $10.00 | ||||||||||||||||
| Pro forma market value |
$39,950 | $47,000 | $54,050 | $62,158 | ||||||||||||||||
| Gross offering proceeds |
$39,950 | $47,000 | $54,050 | $62,158 | ||||||||||||||||
| Less: estimated offering expenses |
(1,224 | ) | (1,306 | ) | (1,387 | ) | (1,480 | ) | ||||||||||||
| Net offering proceeds |
38,726 | 45,694 | 52,663 | 60,678 | ||||||||||||||||
| Less: ESOP purchase |
(3,196 | ) | (3,760 | ) | (4,324 | ) | (4,973 | ) | ||||||||||||
| Less: RSP purchase |
(1,598 | ) | (1,880 | ) | (2,162 | ) | (2,486 | ) | ||||||||||||
| Net investable proceeds |
$33,932 | $40,054 | $46,177 | $53,219 | ||||||||||||||||
| Net income - LTM ended 12/31/20 |
$308 | $308 | $308 | $308 | ||||||||||||||||
| Pro forma income on net proceeds |
96 | 113 | 130 | 150 | ||||||||||||||||
| Pro forma ESOP adjustment |
(125 | ) | (147 | ) | (170 | ) | (195 | ) | ||||||||||||
| Pro forma RSP adjustment |
(251 | ) | (295 | ) | (339 | ) | (390 | ) | ||||||||||||
| Pro forma option adjustment |
(203 | ) | (239 | ) | (275 | ) | (316 | ) | ||||||||||||
| Pro forma net income |
($175 | ) | ($260 | ) | ($346 | ) | ($443 | ) | ||||||||||||
| Pro forma earnings per share |
($0.05 | ) | ($0.06 | ) | ($0.07 | ) | ($0.08 | ) | ||||||||||||
| Core earnings - LTM ended 12/31/20 |
$1,602 | $1,602 | $1,602 | $1,602 | ||||||||||||||||
| Pro forma income on net proceeds |
96 | 113 | 130 | 150 | ||||||||||||||||
| Pro forma ESOP adjustment |
(125 | ) | (147 | ) | (170 | ) | (195 | ) | ||||||||||||
| Pro forma RSP adjustment |
(251 | ) | (295 | ) | (339 | ) | (390 | ) | ||||||||||||
| Pro forma option adjustment |
(203 | ) | (239 | ) | (275 | ) | (316 | ) | ||||||||||||
| Pro forma core earnings |
$1,119 | $1,034 | $948 | $851 | ||||||||||||||||
| Pro forma core earnings per share |
$0.30 | $0.24 | $0.19 | $0.15 | ||||||||||||||||
| Total equity - 12/31/20 |
$39,858 | $39,858 | $39,858 | $39,858 | ||||||||||||||||
| Net offering proceeds |
38,726 | 45,694 | 52,663 | 60,678 | ||||||||||||||||
| Less: ESOP purchase |
(3,196 | ) | (3,760 | ) | (4,324 | ) | (4,973 | ) | ||||||||||||
| Less: RSP purchase |
(1,598 | ) | (1,880 | ) | (2,162 | ) | (2,486 | ) | ||||||||||||
| Pro forma total equity |
$73,790 | $79,912 | $86,035 | $93,077 | ||||||||||||||||
| Pro forma book value |
$18.47 | $17.00 | $15.92 | $14.97 | ||||||||||||||||
| Tangible equity - 12/31/20 |
$39,858 | $39,858 | $39,858 | $39,858 | ||||||||||||||||
| Net offering proceeds |
38,726 | 45,694 | 52,663 | 60,678 | ||||||||||||||||
| Less: ESOP purchase |
(3,196 | ) | (3,760 | ) | (4,324 | ) | (4,973 | ) | ||||||||||||
| Less: RSP purchase |
(1,598 | ) | (1,880 | ) | (2,162 | ) | (2,486 | ) | ||||||||||||
| Pro forma tangible equity |
$73,790 | $79,912 | $86,035 | $93,077 | ||||||||||||||||
| Pro forma tangible book value |
$18.47 | $17.00 | $15.92 | $14.97 | ||||||||||||||||
| Total assets - 12/31/20 |
$349,927 | $349,927 | $349,927 | $349,927 | ||||||||||||||||
| Net offering proceeds |
38,726 | 45,694 | 52,663 | 60,678 | ||||||||||||||||
| Less: ESOP purchase |
(3,196 | ) | (3,760 | ) | (4,324 | ) | (4,973 | ) | ||||||||||||
| Less: RSP purchase |
(1,598 | ) | (1,880 | ) | (2,162 | ) | (2,486 | ) | ||||||||||||
| Pro forma total assets |
$383,859 | $389,981 | $396,104 | $403,146 | ||||||||||||||||
| Pro Forma Ratios: |
||||||||||||||||||||
| Price / LTM EPS |
NM | NM | NM | NM | ||||||||||||||||
| Price / Core EPS |
33.33x | 41.67x | 52.63x | 66.67x | ||||||||||||||||
| Price / Book Value |
54.14% | 58.82% | 62.81% | 66.80% | ||||||||||||||||
| Price / Tangible Book Value |
54.14% | 58.82% | 62.81% | 66.80% | ||||||||||||||||
| Price / Total Assets |
10.41% | 12.05% | 13.65% | 15.42% | ||||||||||||||||
| Total Equity / Assets |
19.22% | 20.49% | 21.72% | 23.09% | ||||||||||||||||
| Tangible Equity / Assets |
19.22% | 20.49% | 21.72% | 23.09% | ||||||||||||||||
IV-2
FELDMAN FINANCIAL ADVISORS, INC.
Exhibit IV-3
Pro Forma Conversion Analysis at the Midpoint Value
TC Federal Bank
Historical Financial Data as of December 31, 2020
| Valuation Parameters |
Symbol |
Data |
||||||||
| Net income -- LTM |
Y | $ | 308,000 | |||||||
| Core earnings -- LTM |
Y | 1,602,000 | ||||||||
| Net worth |
B | 39,858,000 | ||||||||
| Tangible net worth |
B | 39,858,000 | ||||||||
| Total assets |
A | 349,927,000 | ||||||||
| Expenses in conversion |
X | 1,305,563 | ||||||||
| Other proceeds not reinvested |
O | 5,640,000 | ||||||||
| ESOP purchase |
E | 3,760,000 | ||||||||
| ESOP expense (pre-tax) |
F | 187,500 | ||||||||
| RSP purchase |
M | 1,880,000 | ||||||||
| RSP expense (pre-tax) |
N | 376,276 | ||||||||
| Stock option expense (pre-tax) |
Q | 252,860 | ||||||||
| Option expense tax-deductible |
D | 25.00% | ||||||||
| Re-investment rate (after-tax) |
R | 0.28% | ||||||||
| Tax rate |
T | 21.60% | ||||||||
| Shares for EPS |
S | 92.40% | ||||||||
| Pro Forma Valuation Ratios at Midpoint Value |
||||||||||
| Price / LTM EPS |
P/E | NM | ||||||||
| Price / Core EPS |
P/E | 41.7x | ||||||||
| Price / Book Value |
P/B | 58.8% | ||||||||
| Price / Tangible Book |
P/TB | 58.8% | ||||||||
| Price / Assets |
P/A | 12.05% | ||||||||
| Pro Forma Calculation at Midpoint Value |
Based on | |||||||||||||||
| V |
= | (P/E / S)*((Y-R*(O+X)-(F+N)*(1-T)-(Q-Q*D*T))) | = | $ | 47,000,000 | [LTM earnings] | ||||||||||
| 1 - (P/E / S) * R | ||||||||||||||||
| V |
= | (P/E / S)*((Y-R*(O+X)-(F+N)*(1-T)-(Q-Q*D*T)) | = | $ | 47,000,000 | [Core earnings] | ||||||||||
| 1 - (P/E / S) * R | ||||||||||||||||
| V |
= | P/B * (B - X - E - M) | = | $ | 47,000,000 | [Book value] | ||||||||||
| 1 - P/B | ||||||||||||||||
| V |
= | P/TB * (B - X - E - M) | = | $ | 47,000,000 | [Tangible book] | ||||||||||
| 1 - P/TB | ||||||||||||||||
| V |
= | P/A * (B - X - E - M) | = | $ | 47,000,000 | [Total assets] | ||||||||||
| 1 - P/A | ||||||||||||||||
| Pro Forma Valuation Range |
||||||||||||||
| Minimum |
= | $47,000,000 | x | 0.85 | = | $39,950,000 | ||||||||
| Midpoint |
= | $47,000,000 | x | 1.00 | = | $47,000,000 | ||||||||
| Maximum |
= | $47,000,000 | x | 1.15 | = | $54,050,000 | ||||||||
| Adj. Max. |
= | $54,050,000 | x | 1.15 | = | $62,157,500 | ||||||||
IV-3
FELDMAN FINANCIAL ADVISORS, INC.
Exhibit IV-4
Comparative Valuation Ratio Analysis
Pro Forma Conversion Valuation
Computed from Market Price Data as of February 26, 2021
| TC | Comparative | All Public | ||||||||||||||||||||||||||||||
| Valuation | Federal | Group | Thrifts (1) | |||||||||||||||||||||||||||||
| Ratio |
Symbol |
Bank | Average | Median | Average | Median | ||||||||||||||||||||||||||
| Price / LTM EPS |
P/E | 23.8 | 12.7 | 18.1 | 14.6 | |||||||||||||||||||||||||||
| Minimum |
(x) | NM | NA | NA | NA | NA | ||||||||||||||||||||||||||
| Midpoint |
NM | NA | NA | NA | NA | |||||||||||||||||||||||||||
| Maximum |
NM | NA | NA | NA | NA | |||||||||||||||||||||||||||
| Adjusted Maximum |
NM | NA | NA | NA | NA | |||||||||||||||||||||||||||
| Price / Core EPS |
P/E | 25.9 | 13.2 | 18.7 | 14.8 | |||||||||||||||||||||||||||
| Minimum |
(x) | 33.3 | 28.8 | % | 152.6 | % | 78.6 | % | 124.8 | % | ||||||||||||||||||||||
| Midpoint |
41.7 | 61.0 | % | 215.8 | % | 123.3 | % | 181.0 | % | |||||||||||||||||||||||
| Maximum |
52.6 | 103.3 | % | 298.9 | % | 182.0 | % | 254.9 | % | |||||||||||||||||||||||
| Adjusted Maximum |
66.7 | 157.6 | % | 405.3 | % | 257.2 | % | 349.6 | % | |||||||||||||||||||||||
| Price / Book Value |
P/B | 91.5 | 90.2 | 108.1 | 98.2 | |||||||||||||||||||||||||||
| Minimum |
(%) | 54.1 | -40.8 | % | -40.0 | % | -49.9 | % | -44.9 | % | ||||||||||||||||||||||
| Midpoint |
58.8 | -35.7 | % | -34.8 | % | -45.6 | % | -40.1 | % | |||||||||||||||||||||||
| Maximum |
62.8 | -31.3 | % | -30.4 | % | -41.9 | % | -36.1 | % | |||||||||||||||||||||||
| Adjusted Maximum |
66.8 | -27.0 | % | -25.9 | % | -38.2 | % | -32.0 | % | |||||||||||||||||||||||
| Price / Tangible Book |
P/TB | 93.8 | 97.2 | 120.6 | 106.7 | |||||||||||||||||||||||||||
| Minimum |
(%) | 54.1 | -42.3 | % | -44.3 | % | -55.1 | % | -49.3 | % | ||||||||||||||||||||||
| Midpoint |
58.8 | -37.3 | % | -39.5 | % | -51.2 | % | -44.9 | % | |||||||||||||||||||||||
| Maximum |
62.8 | -33.0 | % | -35.4 | % | -47.9 | % | -41.1 | % | |||||||||||||||||||||||
| Adjusted Maximum |
66.8 | -28.7 | % | -31.3 | % | -44.6 | % | -37.4 | % | |||||||||||||||||||||||
| Price / Total Assets |
P/A | 13.56 | 10.11 | 12.79 | 11.24 | |||||||||||||||||||||||||||
| Minimum |
(%) | 10.41 | -23.3 | % | 3.0 | % | -18.6 | % | -7.4 | % | ||||||||||||||||||||||
| Midpoint |
12.05 | -11.1 | % | 19.3 | % | -5.8 | % | 7.2 | % | |||||||||||||||||||||||
| Maximum |
13.65 | 0.6 | % | 35.0 | % | 6.7 | % | 21.4 | % | |||||||||||||||||||||||
| Adjusted Maximum |
15.42 | 13.7 | % | 52.6 | % | 20.6 | % | 37.2 | % | |||||||||||||||||||||||
| (1) | Excludes companies subject to mutual holding company ownership or pending acquisition. |
IV-4