Attached files
| file | filename |
|---|---|
| 8-K - 8-K - Phillips Edison & Company, Inc. | cik0001476204-20210311.htm |
| EX-99.1 - EX-99.1 - Phillips Edison & Company, Inc. | pecopressreleaseex991q42020.htm |
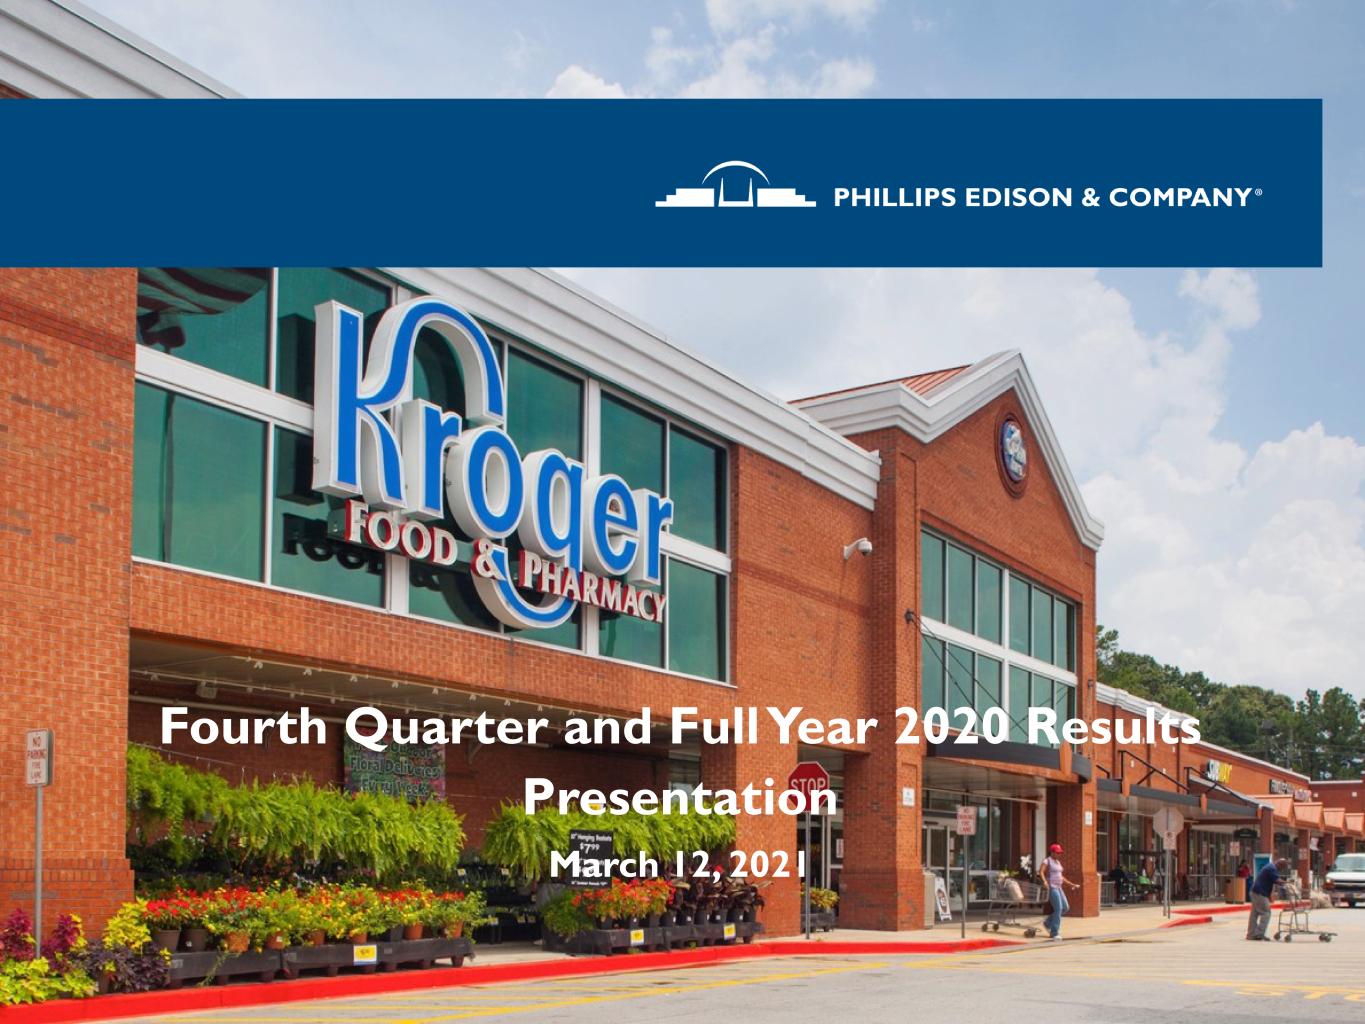
Fourth Quarter and Full Year 2020 Results Presentation March 12, 2021
PHILLIPS EDISON & COMPANY | 2WWW.PHILLIPSEDISON.COM/INVESTORS AGENDA PREPARED REMARKS JEFF EDISON - Chairman and CEO Portfolio Overview COVID-19 Update 2020 Highlights JOHN CAULFIELD - CFO Financial Results Balance Sheet JEFF EDISON - Chairman and CEO Outlook Liquidity Commentary QUESTION AND ANSWER SESSION
PHILLIPS EDISON & COMPANY | 3WWW.PHILLIPSEDISON.COM/INVESTORS FORWARD-LOOKING STATEMENT DISCLOSURE Certain statements contained in this presentation for Phillips Edison & Company, Inc. (the “Company,” or “PECO”) other than historical facts may be considered forward-looking statements within the meaning of Section 27A of the Securities Act of 1933, as amended (the “Securities Act”), Section 21E of the Securities Exchange Act of 1934, as amended (the “Exchange Act”), and the Private Securities Litigation Reform Act of 1995 (collectively with the Securities Act and the Exchange Act, the “Acts”). We intend for all such forward-looking statements to be covered by the applicable safe harbor provisions for forward-looking statements contained in the Acts. Such forward-looking statements generally can be identified by the use of forward-looking terminology such as “may,” “will,” “can,” “expect,” “intend,” “anticipate,” “estimate,” “believe,” “continue,” “possible,” “initiatives,” “focus,” “seek,” “objective,” “goal,” “strategy,” “plan,” “potential,” “potentially,” “preparing,” “projected,” “future,” “long-term,” “once,” “should,” “could,” “would,” “might,” “uncertainty,” or other similar words. Readers are cautioned not to place undue reliance on these forward-looking statements, which speak only as of the date this report is filed with the U.S. Securities and Exchange Commission (“SEC”). Such statements include, but are not limited to, (a) statements about PECO’s focus, plans, strategies, initiatives, and prospects; (b) statements about the COVID-19 pandemic, including its duration and potential or expected impact on PECO’s tenants, our business, and PECO’s estimated value per share; (c) statements about a reverse stock split, PECO’s distributions, share repurchase program, and dividend reinvestment program; and (d) statements about PECO’s future results of operations, capital expenditures, and liquidity. Such statements are subject to known and unknown risks and uncertainties, which could cause actual results to differ materially from those projected or anticipated, including, without limitation: (i) changes in national, regional, or local economic climates; (ii) local market conditions, including an oversupply of space in, or a reduction in demand for, properties similar to those in PECO’s portfolio; (iii) vacancies, changes in market rental rates, and the need to periodically repair, renovate, and re-let space; (iv) changes in interest rates and the availability of permanent mortgage financing; (v) competition from other available properties and the attractiveness of properties in PECO’s portfolio to PECO’s tenants; (vi) the financial stability of tenants, including the ability of tenants to pay rent; (vii) changes in tax, real estate, environmental, and zoning laws; (viii) the concentration of PECO’s portfolio in a limited number of industries, geographies, or investments; (ix) the effects of the COVID-19 pandemic, including on the demand for consumer goods and services and levels of consumer confidence in the safety of visiting shopping centers as a result of the COVID-19 pandemic; (x) the measures taken by federal, state, and local government agencies and tenants in response to the COVID-19 pandemic, including mandatory business shutdowns, “stay-at-home” orders and social distancing guidelines; (xi) the impact of the COVID-19 pandemic on PECO’s tenants and their ability to pay rent on time or at all, or to renew their leases and, in the case of non-renewal, PECO’s ability to re-lease the space at the same or more favorable terms or at all; (xii) the length and severity of the COVID-19 pandemic in the United States; (xiii) the pace of recovery following the COVID-19 pandemic given the current severe economic contraction and increase in unemployment rates; (xiv) PECO’s ability to implement cost containment strategies; (xv) PECO and its tenants’ ability to obtain loans under government programs; (xvi) PECO’s ability to pay down, refinance, restructure, or extend its indebtedness as it becomes due; (xvii) to the extent PECO was seeking to dispose of properties in the near term, significantly greater uncertainty regarding its ability to do so at attractive prices or at all; (xviii) the impact of the COVID-19 pandemic on PECO’s business, results of operations, financial condition, and liquidity; (xix) supply chain disruptions due to the COVID-19 pandemic; and (xx) any of the other risks included in PECO’s SEC filings. Therefore, such statements are not intended to be a guarantee of PECO’s performance in future periods. See Part I, Item 1A. Risk Factors of our 2020 Annual Report on Form 10-K, to be filed with the SEC on or before March 31, 2021, and any subsequent filings for a discussion of some of the risks and uncertainties, although not all of the risks and uncertainties, that could cause actual results to differ materially from those presented in PECO’s forward-looking statements. Except as required by law, PECO does not undertake any obligation to update or revise any forward-looking statements contained in this presentation.
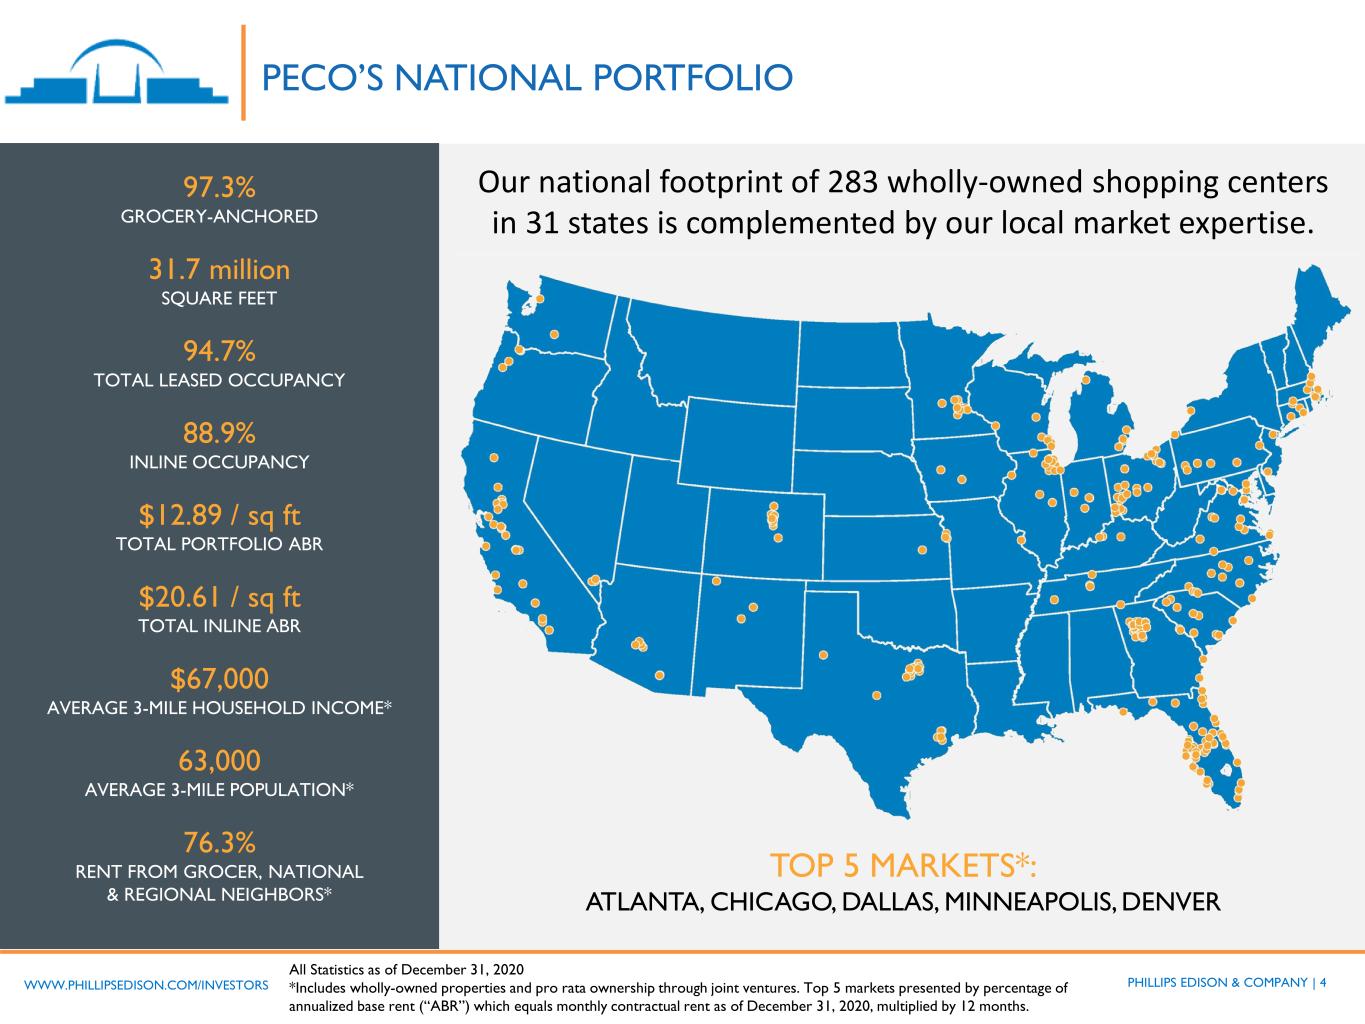
PHILLIPS EDISON & COMPANY | 4WWW.PHILLIPSEDISON.COM/INVESTORS PECO’S NATIONAL PORTFOLIO Our national footprint of 283 wholly-owned shopping centers in 31 states is complemented by our local market expertise. 97.3% GROCERY-ANCHORED 31.7 million SQUARE FEET 94.7% TOTAL LEASED OCCUPANCY 88.9% INLINE OCCUPANCY $12.89 / sq ft TOTAL PORTFOLIO ABR $20.61 / sq ft TOTAL INLINE ABR $67,000 AVERAGE 3-MILE HOUSEHOLD INCOME* 63,000 AVERAGE 3-MILE POPULATION* 76.3% RENT FROM GROCER, NATIONAL & REGIONAL NEIGHBORS* All Statistics as of December 31, 2020 *Includes wholly-owned properties and pro rata ownership through joint ventures. Top 5 markets presented by percentage of annualized base rent (“ABR”) which equals monthly contractual rent as of December 31, 2020, multiplied by 12 months. TOP 5 MARKETS*: ATLANTA, CHICAGO, DALLAS, MINNEAPOLIS, DENVER
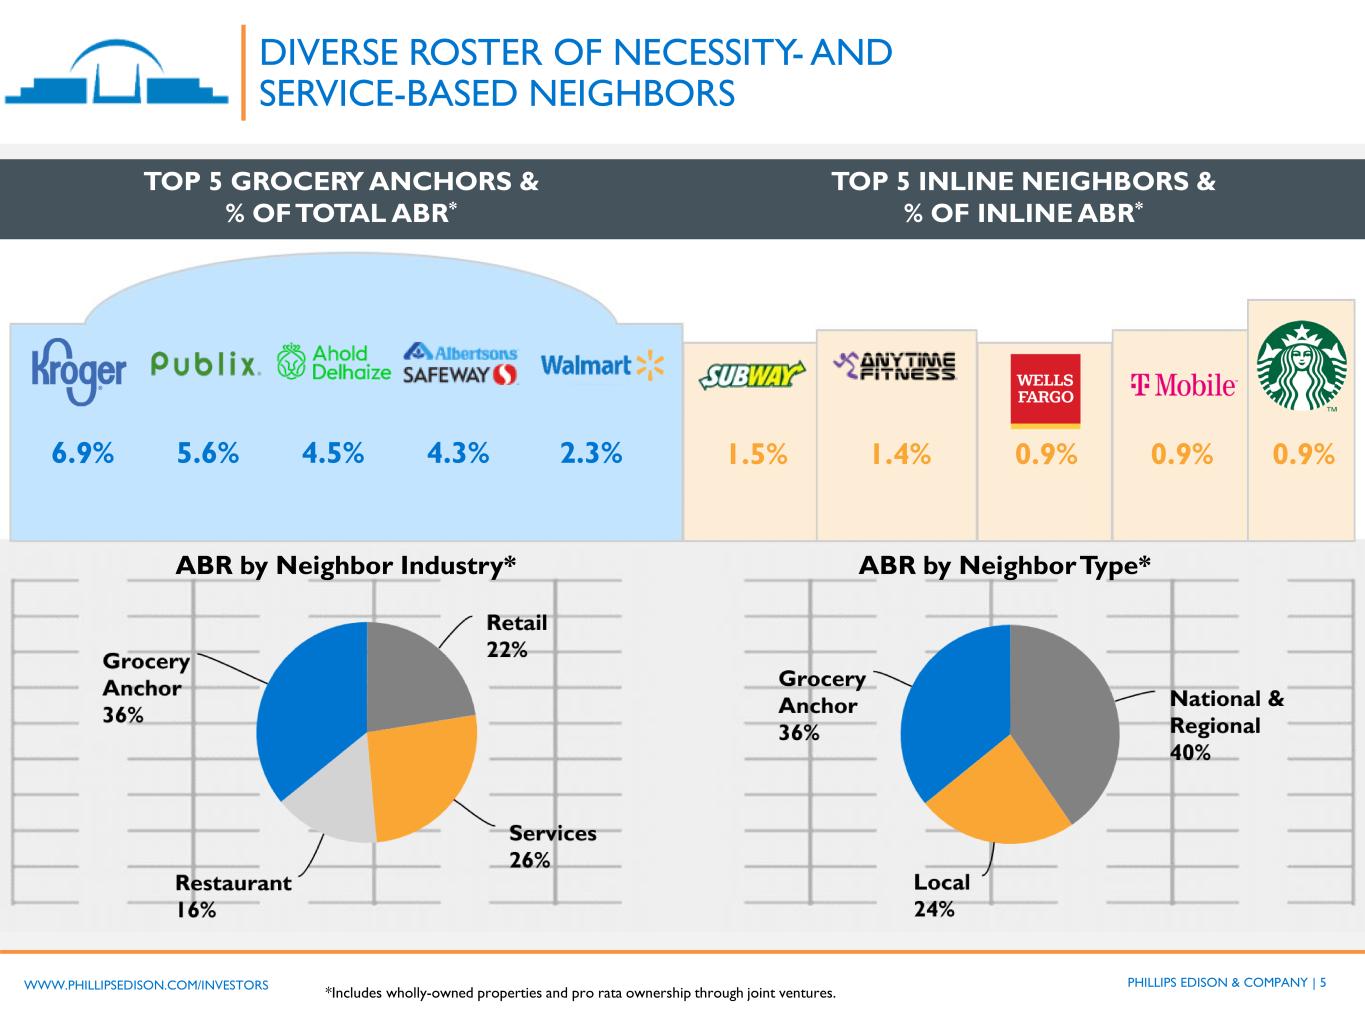
PHILLIPS EDISON & COMPANY | 5WWW.PHILLIPSEDISON.COM/INVESTORS 6.9% 5.6% 4.5% 4.3% 2.3% 1.5% 1.4% 0.9% 0.9% 0.9% ABR by Neighbor Industry* ABR by Neighbor Type* DIVERSE ROSTER OF NECESSITY- AND SERVICE-BASED NEIGHBORS *Includes wholly-owned properties and pro rata ownership through joint ventures. TOP 5 GROCERY ANCHORS & % OF TOTAL ABR* TOP 5 INLINE NEIGHBORS & % OF INLINE ABR*
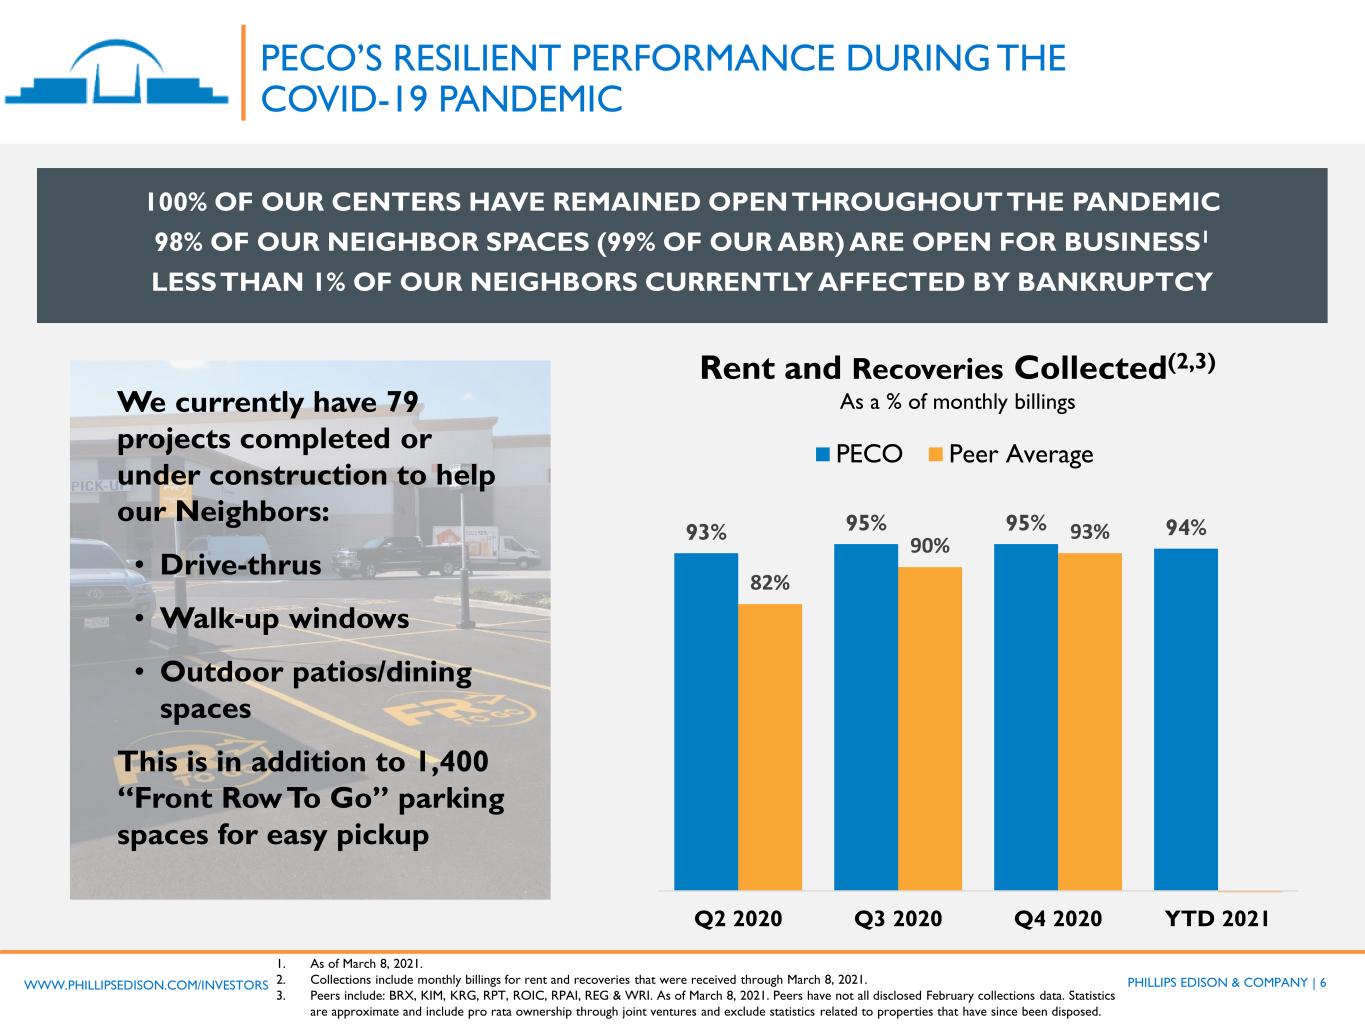
PHILLIPS EDISON & COMPANY | 6WWW.PHILLIPSEDISON.COM/INVESTORS PECO’S RESILIENT PERFORMANCE DURING THE COVID-19 PANDEMIC Rent and Recoveries Collected(2,3) As a % of monthly billings 1. As of March 8, 2021. 2. Collections include monthly billings for rent and recoveries that were received through March 8, 2021. 3. Peers include: BRX, KIM, KRG, RPT, ROIC, RPAI, REG & WRI. As of March 8, 2021. Peers have not all disclosed February collections data. Statistics are approximate and include pro rata ownership through joint ventures and exclude statistics related to properties that have since been disposed. 100% OF OUR CENTERS HAVE REMAINED OPEN THROUGHOUT THE PANDEMIC 98% OF OUR NEIGHBOR SPACES (99% OF OUR ABR) ARE OPEN FOR BUSINESS1 LESS THAN 1% OF OUR NEIGHBORS CURRENTLY AFFECTED BY BANKRUPTCY We currently have 79 projects completed or under construction to help our Neighbors: • Drive-thrus • Walk-up windows • Outdoor patios/dining spaces This is in addition to 1,400 “Front Row To Go” parking spaces for easy pickup 93% 95% 95% 94% 82% 90% 93% Q2 2020 Q3 2020 Q4 2020 YTD 2021 PECO Peer Average
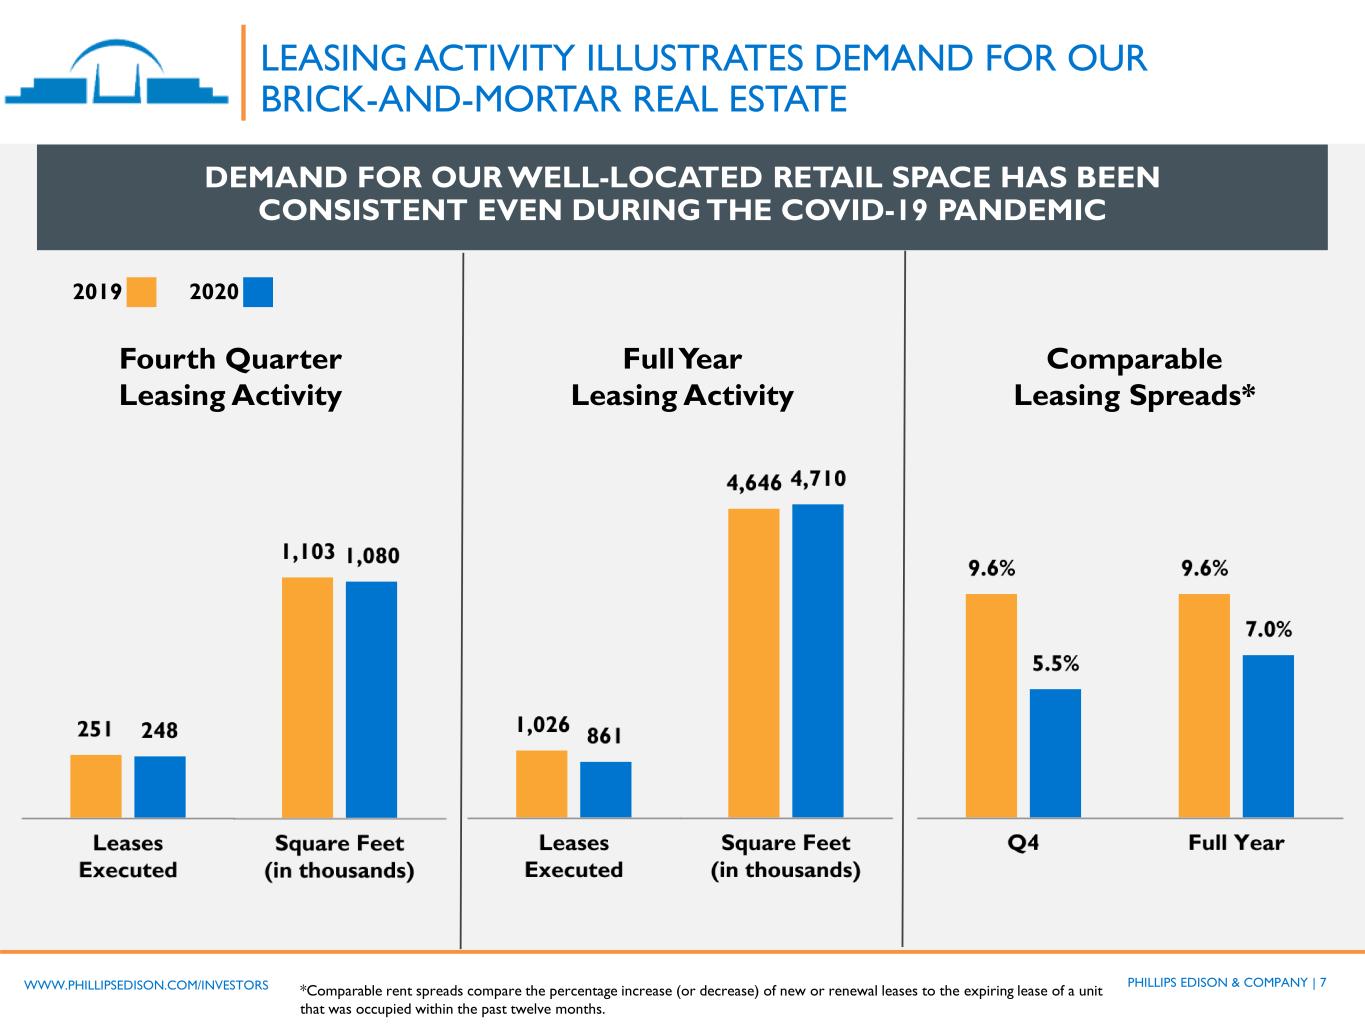
PHILLIPS EDISON & COMPANY | 7WWW.PHILLIPSEDISON.COM/INVESTORS Fourth Quarter Leasing Activity Full Year Leasing Activity Comparable Leasing Spreads* *Comparable rent spreads compare the percentage increase (or decrease) of new or renewal leases to the expiring lease of a unit that was occupied within the past twelve months. 2019 2020 LEASING ACTIVITY ILLUSTRATES DEMAND FOR OUR BRICK-AND-MORTAR REAL ESTATE DEMAND FOR OUR WELL-LOCATED RETAIL SPACE HAS BEEN CONSISTENT EVEN DURING THE COVID-19 PANDEMIC
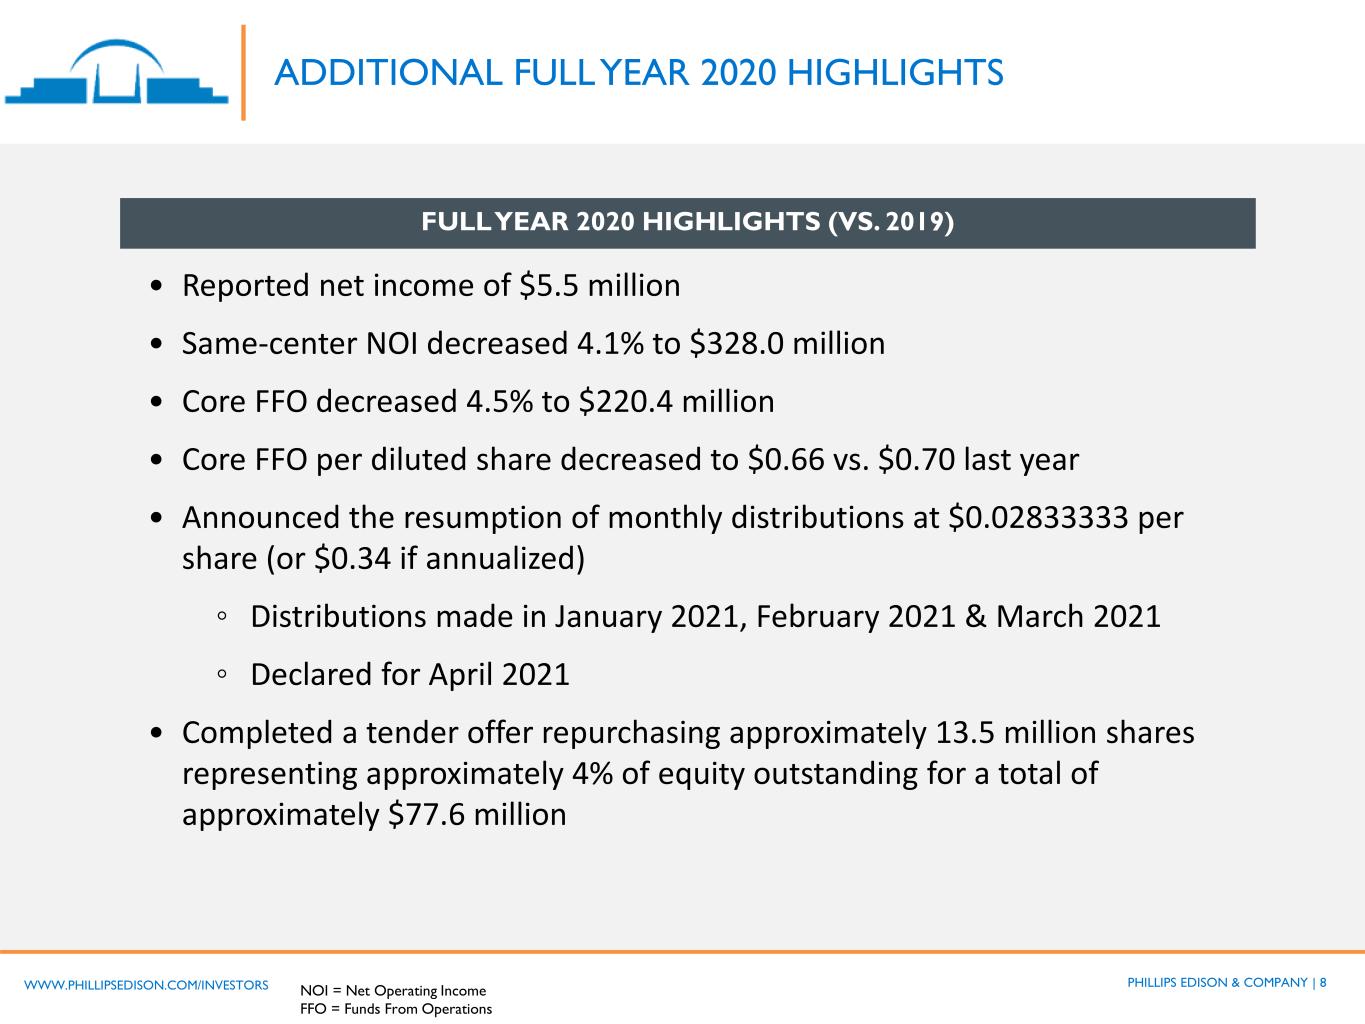
PHILLIPS EDISON & COMPANY | 8WWW.PHILLIPSEDISON.COM/INVESTORS ADDITIONAL FULL YEAR 2020 HIGHLIGHTS FULL YEAR 2020 HIGHLIGHTS (VS. 2019) • Reported net income of $5.5 million • Same-center NOI decreased 4.1% to $328.0 million • Core FFO decreased 4.5% to $220.4 million • Core FFO per diluted share decreased to $0.66 vs. $0.70 last year • Announced the resumption of monthly distributions at $0.02833333 per share (or $0.34 if annualized) ◦ Distributions made in January 2021, February 2021 & March 2021 ◦ Declared for April 2021 • Completed a tender offer repurchasing approximately 13.5 million shares representing approximately 4% of equity outstanding for a total of approximately $77.6 million NOI = Net Operating Income FFO = Funds From Operations
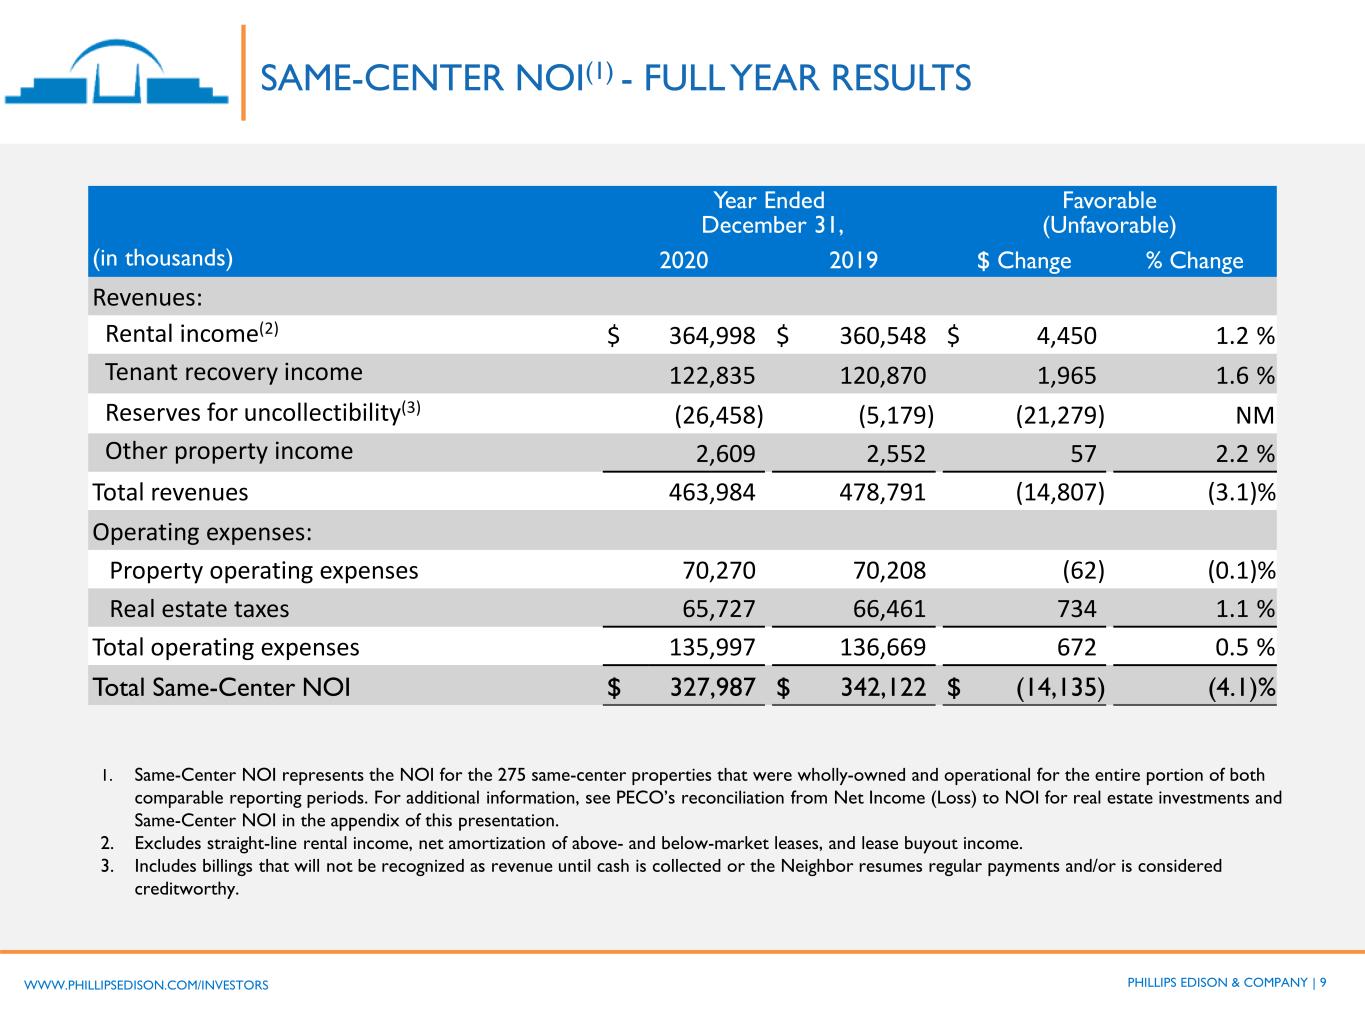
PHILLIPS EDISON & COMPANY | 9WWW.PHILLIPSEDISON.COM/INVESTORS SAME-CENTER NOI(1) - FULL YEAR RESULTS Year Ended December 31, Favorable (Unfavorable) (in thousands) 2020 2019 $ Change % Change Revenues: Rental income(2) $ 364,998 $ 360,548 $ 4,450 1.2 % Tenant recovery income 122,835 120,870 1,965 1.6 % Reserves for uncollectibility(3) (26,458) (5,179) (21,279) NM Other property income 2,609 2,552 57 2.2 % Total revenues 463,984 478,791 (14,807) (3.1)% Operating expenses: Property operating expenses 70,270 70,208 (62) (0.1)% Real estate taxes 65,727 66,461 734 1.1 % Total operating expenses 135,997 136,669 672 0.5 % Total Same-Center NOI $ 327,987 $ 342,122 $ (14,135) (4.1)% 1. Same-Center NOI represents the NOI for the 275 same-center properties that were wholly-owned and operational for the entire portion of both comparable reporting periods. For additional information, see PECO’s reconciliation from Net Income (Loss) to NOI for real estate investments and Same-Center NOI in the appendix of this presentation. 2. Excludes straight-line rental income, net amortization of above- and below-market leases, and lease buyout income. 3. Includes billings that will not be recognized as revenue until cash is collected or the Neighbor resumes regular payments and/or is considered creditworthy.
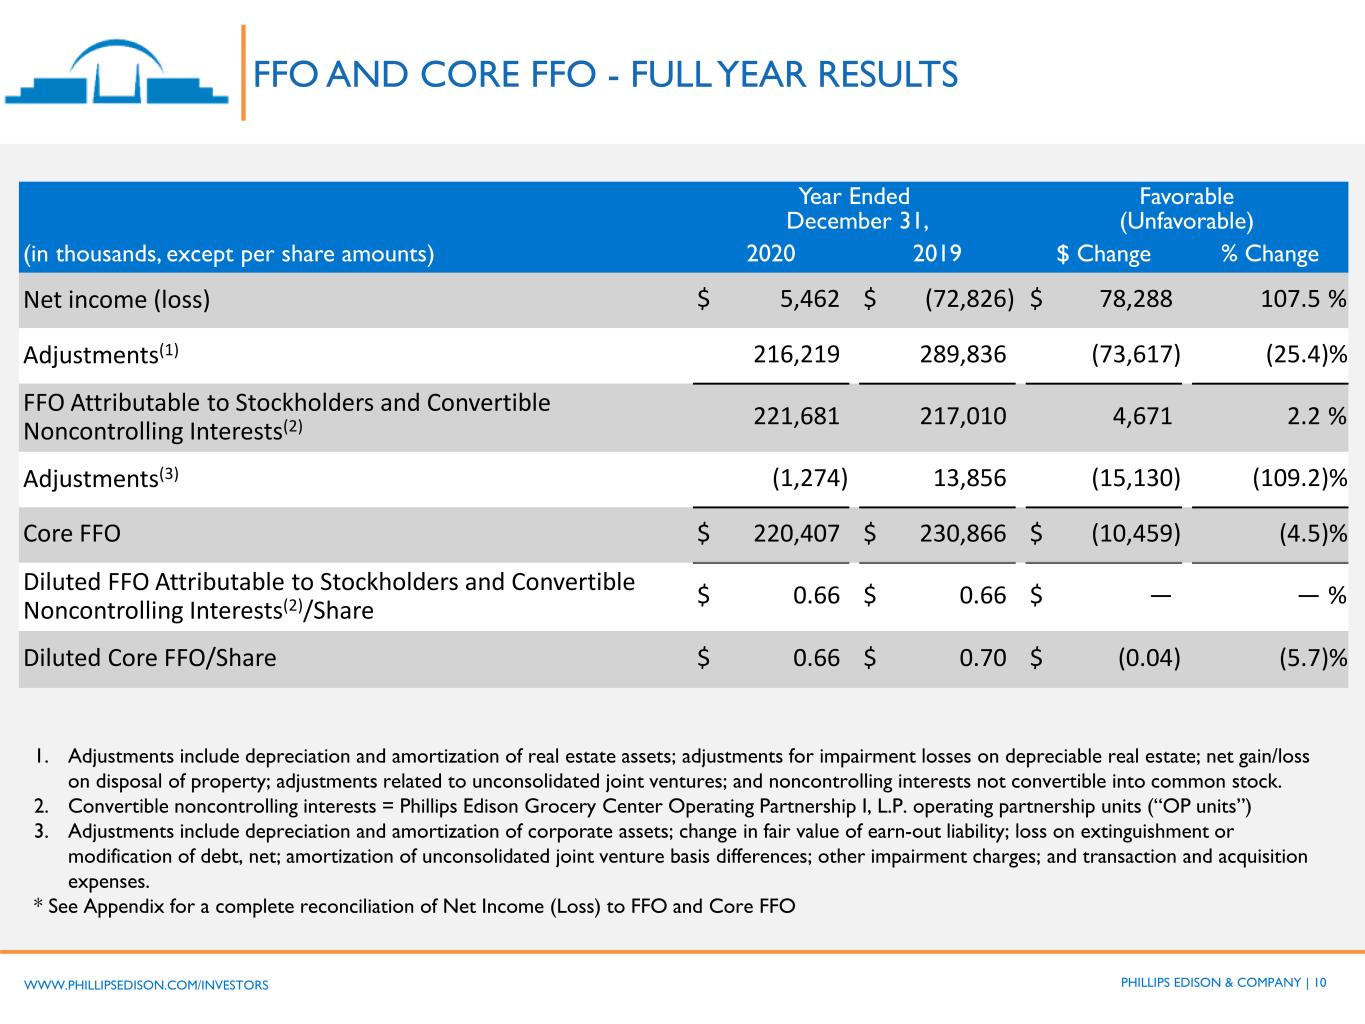
PHILLIPS EDISON & COMPANY | 10WWW.PHILLIPSEDISON.COM/INVESTORS FFO AND CORE FFO - FULL YEAR RESULTS Year Ended December 31, Favorable (Unfavorable) (in thousands, except per share amounts) 2020 2019 $ Change % Change Net income (loss) $ 5,462 $ (72,826) $ 78,288 107.5 % Adjustments(1) 216,219 289,836 (73,617) (25.4)% FFO Attributable to Stockholders and Convertible Noncontrolling Interests(2) 221,681 217,010 4,671 2.2 % Adjustments(3) (1,274) 13,856 (15,130) (109.2)% Core FFO $ 220,407 $ 230,866 $ (10,459) (4.5)% Diluted FFO Attributable to Stockholders and Convertible Noncontrolling Interests(2)/Share $ 0.66 $ 0.66 $ — — % Diluted Core FFO/Share $ 0.66 $ 0.70 $ (0.04) (5.7)% 1. Adjustments include depreciation and amortization of real estate assets; adjustments for impairment losses on depreciable real estate; net gain/loss on disposal of property; adjustments related to unconsolidated joint ventures; and noncontrolling interests not convertible into common stock. 2. Convertible noncontrolling interests = Phillips Edison Grocery Center Operating Partnership I, L.P. operating partnership units (“OP units”) 3. Adjustments include depreciation and amortization of corporate assets; change in fair value of earn-out liability; loss on extinguishment or modification of debt, net; amortization of unconsolidated joint venture basis differences; other impairment charges; and transaction and acquisition expenses. * See Appendix for a complete reconciliation of Net Income (Loss) to FFO and Core FFO
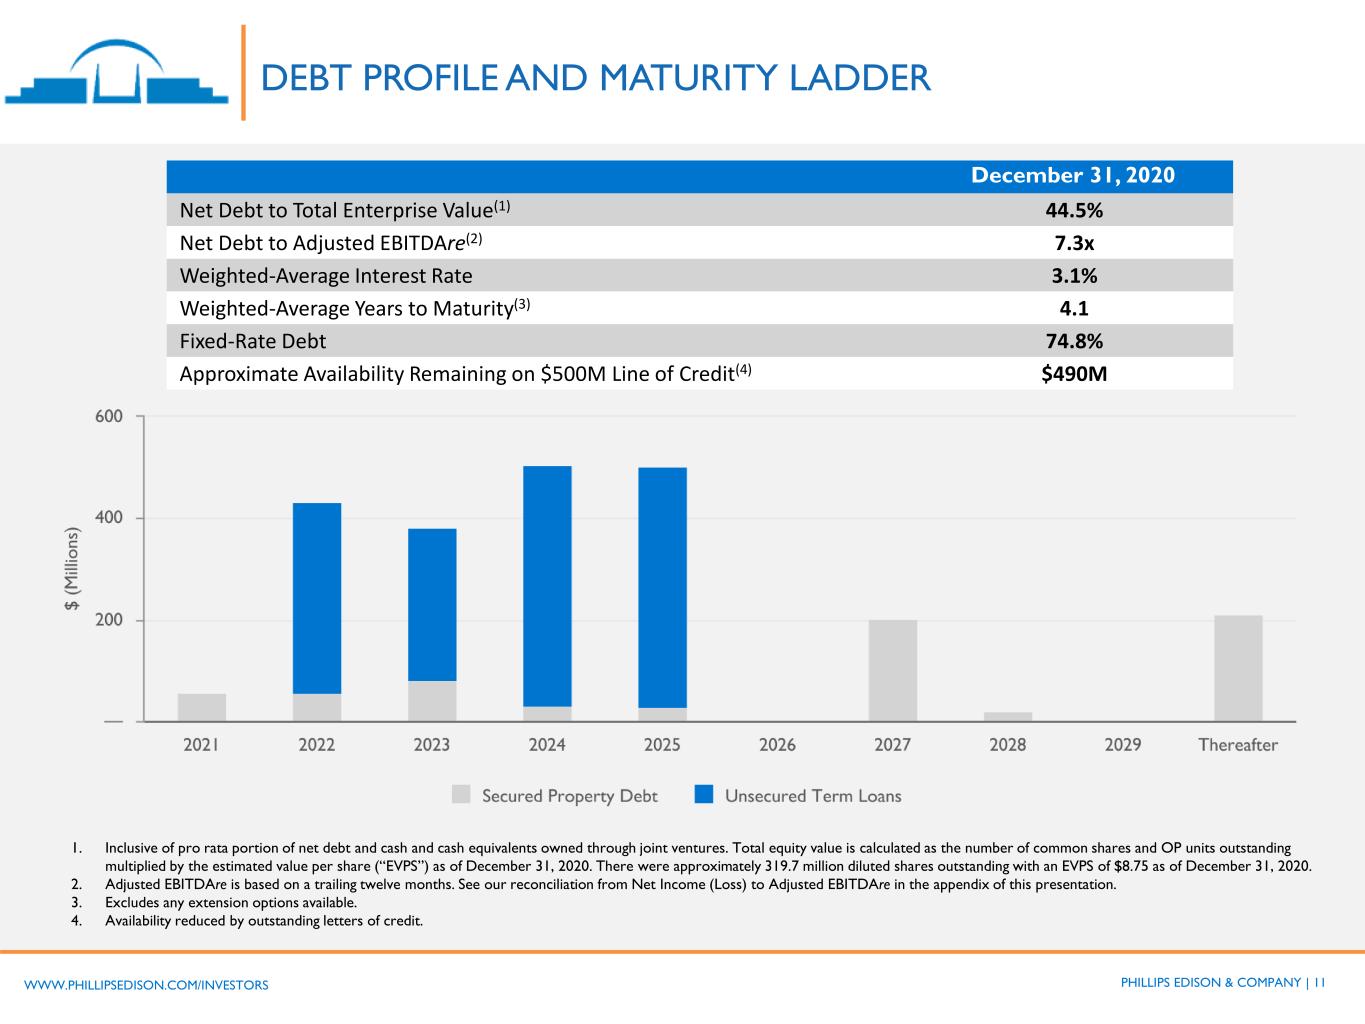
PHILLIPS EDISON & COMPANY | 11WWW.PHILLIPSEDISON.COM/INVESTORS DEBT PROFILE AND MATURITY LADDER 1. Inclusive of pro rata portion of net debt and cash and cash equivalents owned through joint ventures. Total equity value is calculated as the number of common shares and OP units outstanding multiplied by the estimated value per share (“EVPS”) as of December 31, 2020. There were approximately 319.7 million diluted shares outstanding with an EVPS of $8.75 as of December 31, 2020. 2. Adjusted EBITDAre is based on a trailing twelve months. See our reconciliation from Net Income (Loss) to Adjusted EBITDAre in the appendix of this presentation. 3. Excludes any extension options available. 4. Availability reduced by outstanding letters of credit. December 31, 2020 Net Debt to Total Enterprise Value(1) 44.5% Net Debt to Adjusted EBITDAre(2) 7.3x Weighted-Average Interest Rate 3.1% Weighted-Average Years to Maturity(3) 4.1 Fixed-Rate Debt 74.8% Approximate Availability Remaining on $500M Line of Credit(4) $490M
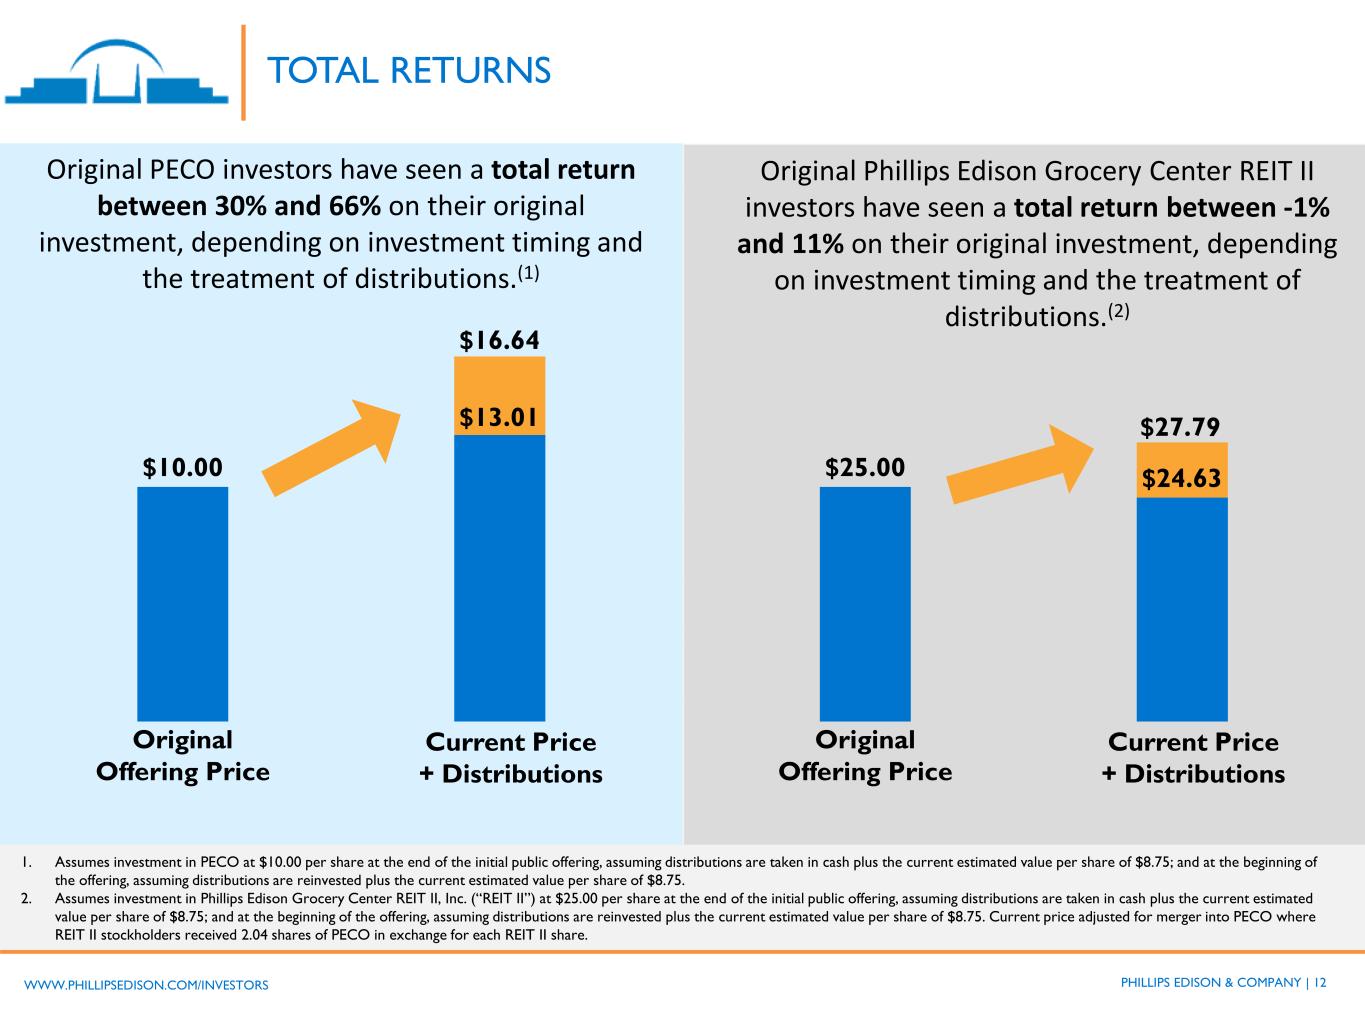
PHILLIPS EDISON & COMPANY | 12WWW.PHILLIPSEDISON.COM/INVESTORS TOTAL RETURNS 1. Assumes investment in PECO at $10.00 per share at the end of the initial public offering, assuming distributions are taken in cash plus the current estimated value per share of $8.75; and at the beginning of the offering, assuming distributions are reinvested plus the current estimated value per share of $8.75. 2. Assumes investment in Phillips Edison Grocery Center REIT II, Inc. (“REIT II”) at $25.00 per share at the end of the initial public offering, assuming distributions are taken in cash plus the current estimated value per share of $8.75; and at the beginning of the offering, assuming distributions are reinvested plus the current estimated value per share of $8.75. Current price adjusted for merger into PECO where REIT II stockholders received 2.04 shares of PECO in exchange for each REIT II share. Original Phillips Edison Grocery Center REIT II investors have seen a total return between -1% and 11% on their original investment, depending on investment timing and the treatment of distributions.(2) Original PECO investors have seen a total return between 30% and 66% on their original investment, depending on investment timing and the treatment of distributions.(1) $10.00 Original Offering Price Current Price + Distributions $13.01 $16.64 $25.00 Original Offering Price Current Price + Distributions $24.63 $27.79
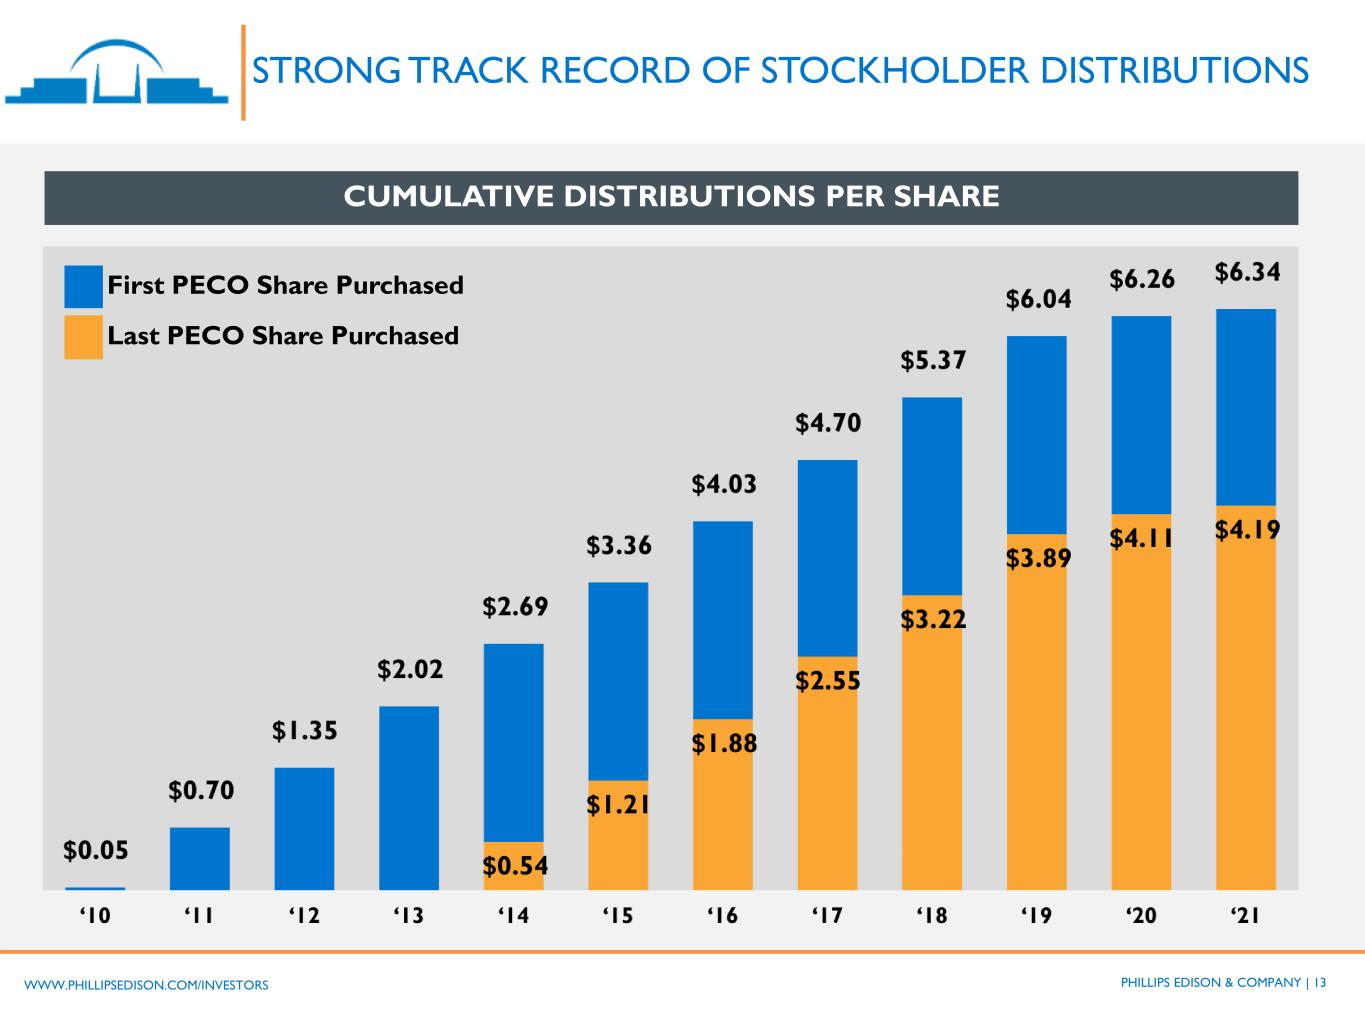
PHILLIPS EDISON & COMPANY | 13WWW.PHILLIPSEDISON.COM/INVESTORS STRONG TRACK RECORD OF STOCKHOLDER DISTRIBUTIONS First PECO Share Purchased Last PECO Share Purchased CUMULATIVE DISTRIBUTIONS PER SHARE
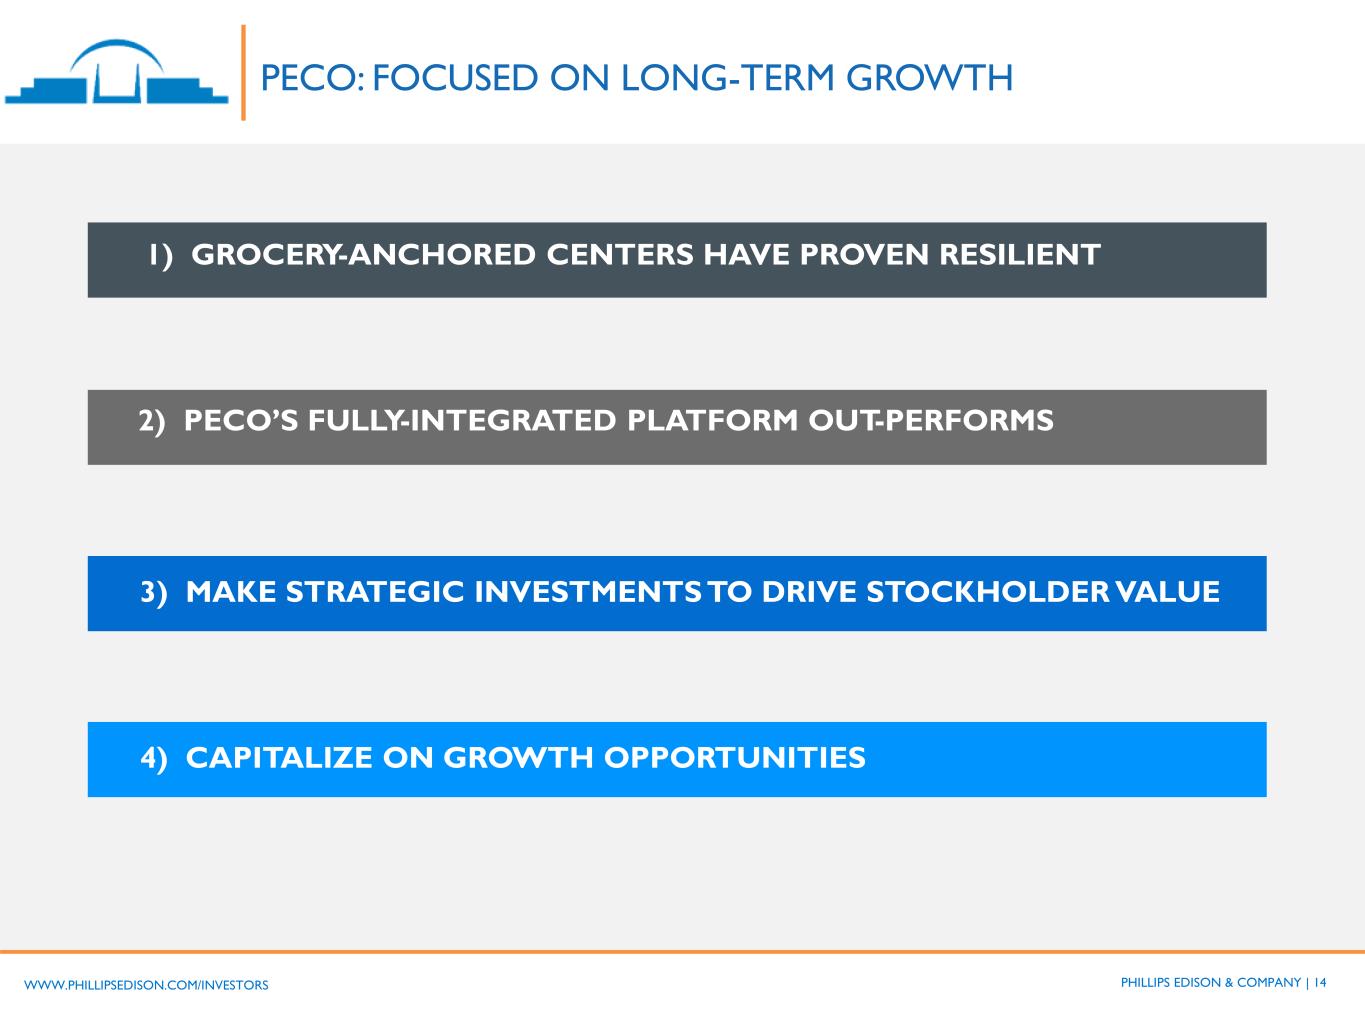
PHILLIPS EDISON & COMPANY | 14WWW.PHILLIPSEDISON.COM/INVESTORS PECO: FOCUSED ON LONG-TERM GROWTH 1) GROCERY-ANCHORED CENTERS HAVE PROVEN RESILIENT 2) PECO’S FULLY-INTEGRATED PLATFORM OUT-PERFORMS 3) MAKE STRATEGIC INVESTMENTS TO DRIVE STOCKHOLDER VALUE 4) CAPITALIZE ON GROWTH OPPORTUNITIES
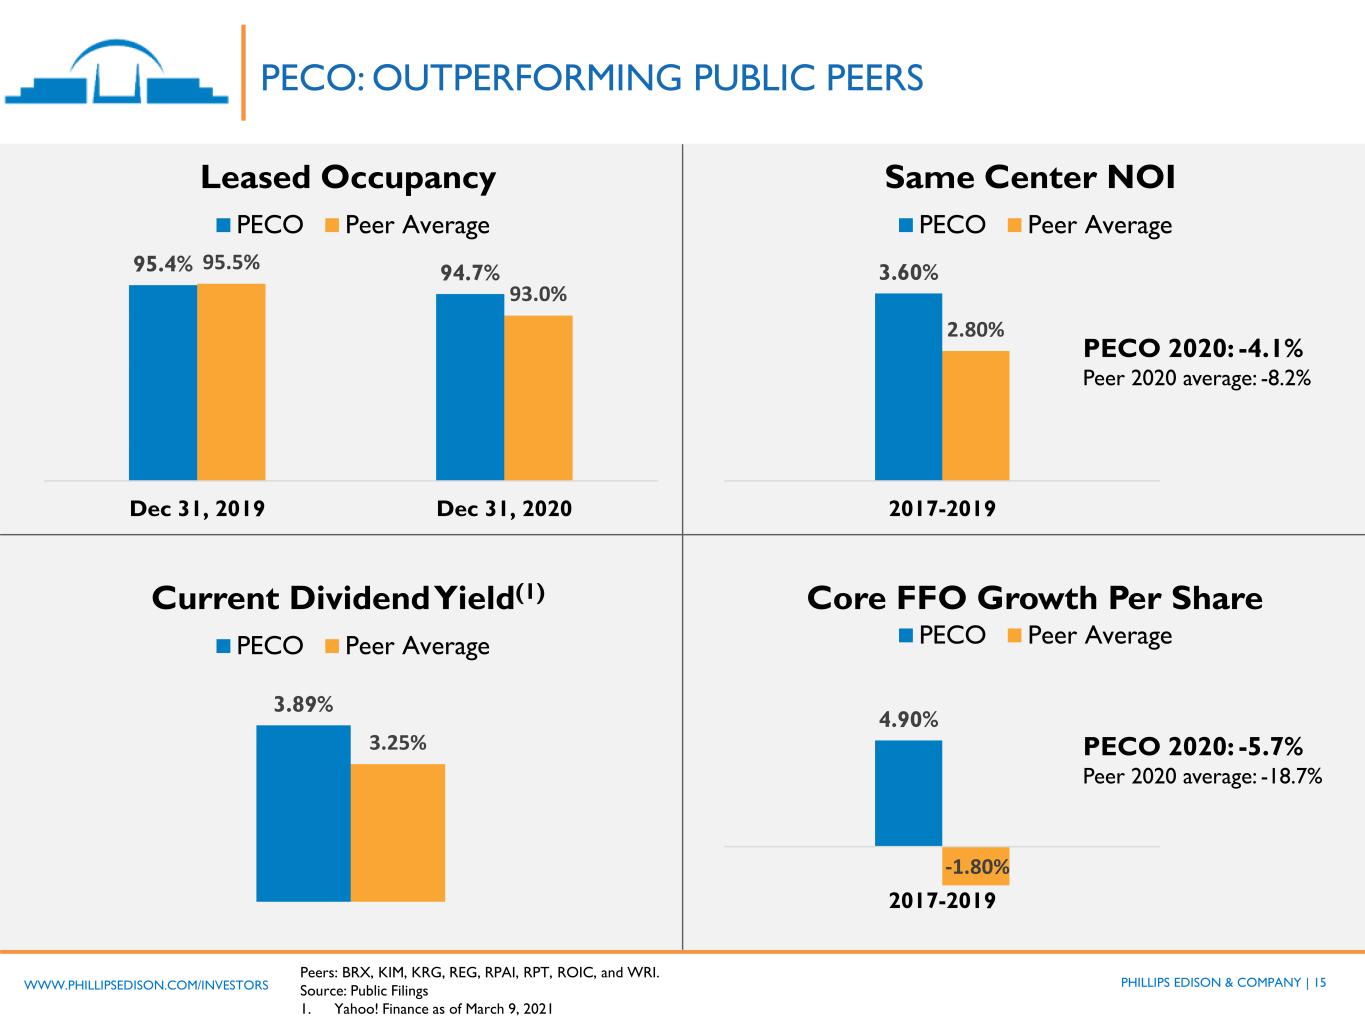
PHILLIPS EDISON & COMPANY | 15WWW.PHILLIPSEDISON.COM/INVESTORS PECO: OUTPERFORMING PUBLIC PEERS Leased Occupancy 95.4% 94.7%95.5% 93.0% Dec 31, 2019 Dec 31, 2020 PECO Peer Average Current Dividend Yield(1) 3.89% 3.25% PECO Peer Average Same Center NOI Core FFO Growth Per Share 3.60% 2.80% 2017-2019 PECO Peer Average 4.90% -1.80% 2017-2019 PECO Peer Average PECO 2020: -4.1% Peer 2020 average: -8.2% PECO 2020: -5.7% Peer 2020 average: -18.7% Peers: BRX, KIM, KRG, REG, RPAI, RPT, ROIC, and WRI. Source: Public Filings 1. Yahoo! Finance as of March 9, 2021
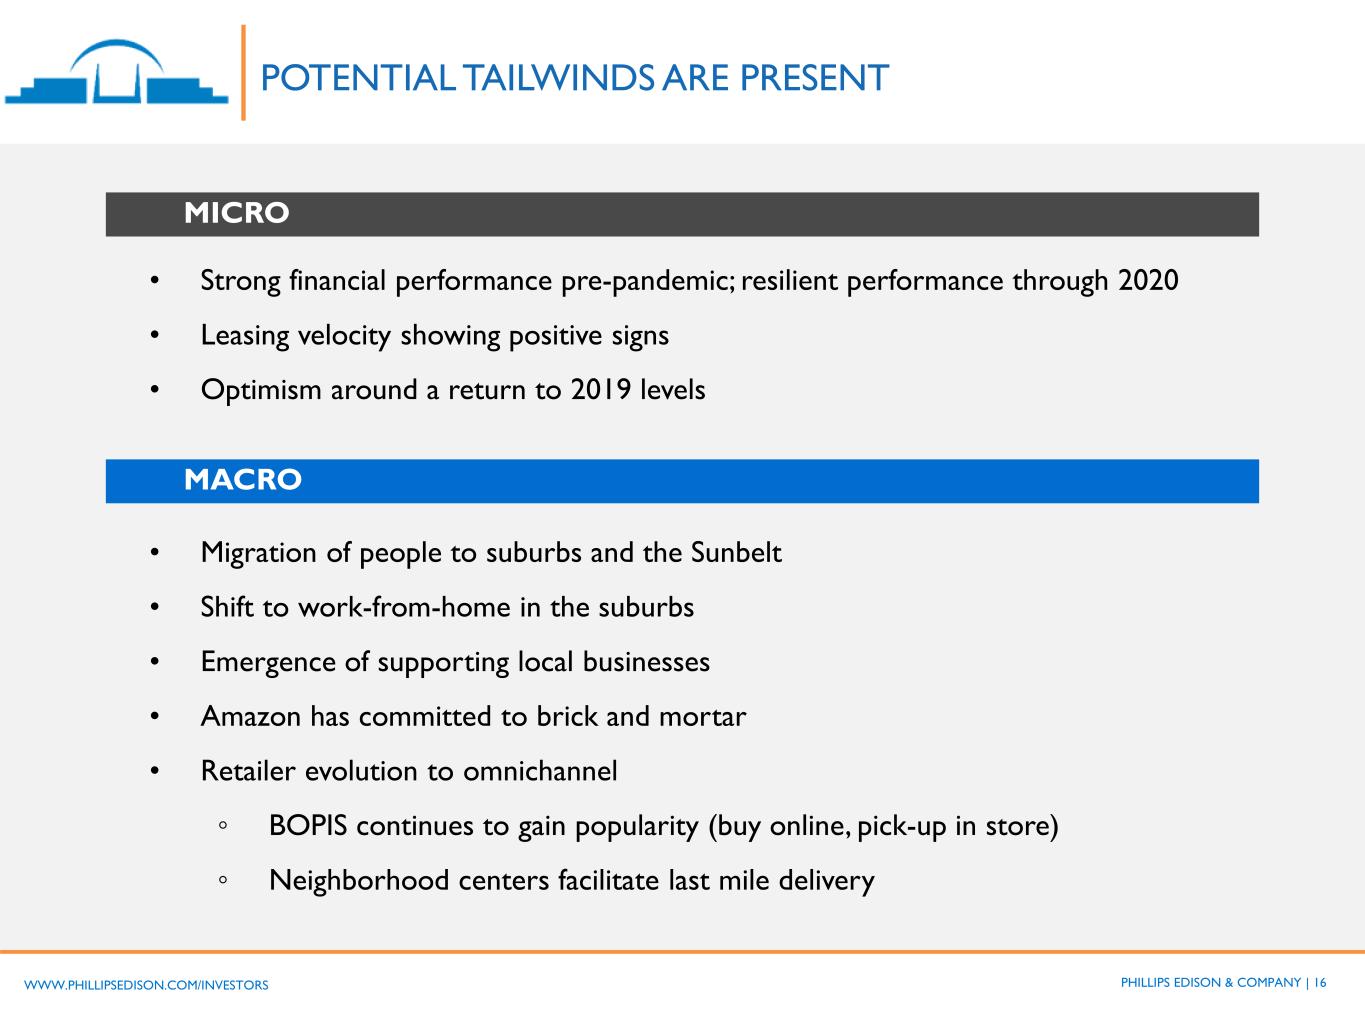
PHILLIPS EDISON & COMPANY | 16WWW.PHILLIPSEDISON.COM/INVESTORS POTENTIAL TAILWINDS ARE PRESENT MACRO MICRO • Strong financial performance pre-pandemic; resilient performance through 2020 • Leasing velocity showing positive signs • Optimism around a return to 2019 levels • Migration of people to suburbs and the Sunbelt • Shift to work-from-home in the suburbs • Emergence of supporting local businesses • Amazon has committed to brick and mortar • Retailer evolution to omnichannel ◦ BOPIS continues to gain popularity (buy online, pick-up in store) ◦ Neighborhood centers facilitate last mile delivery
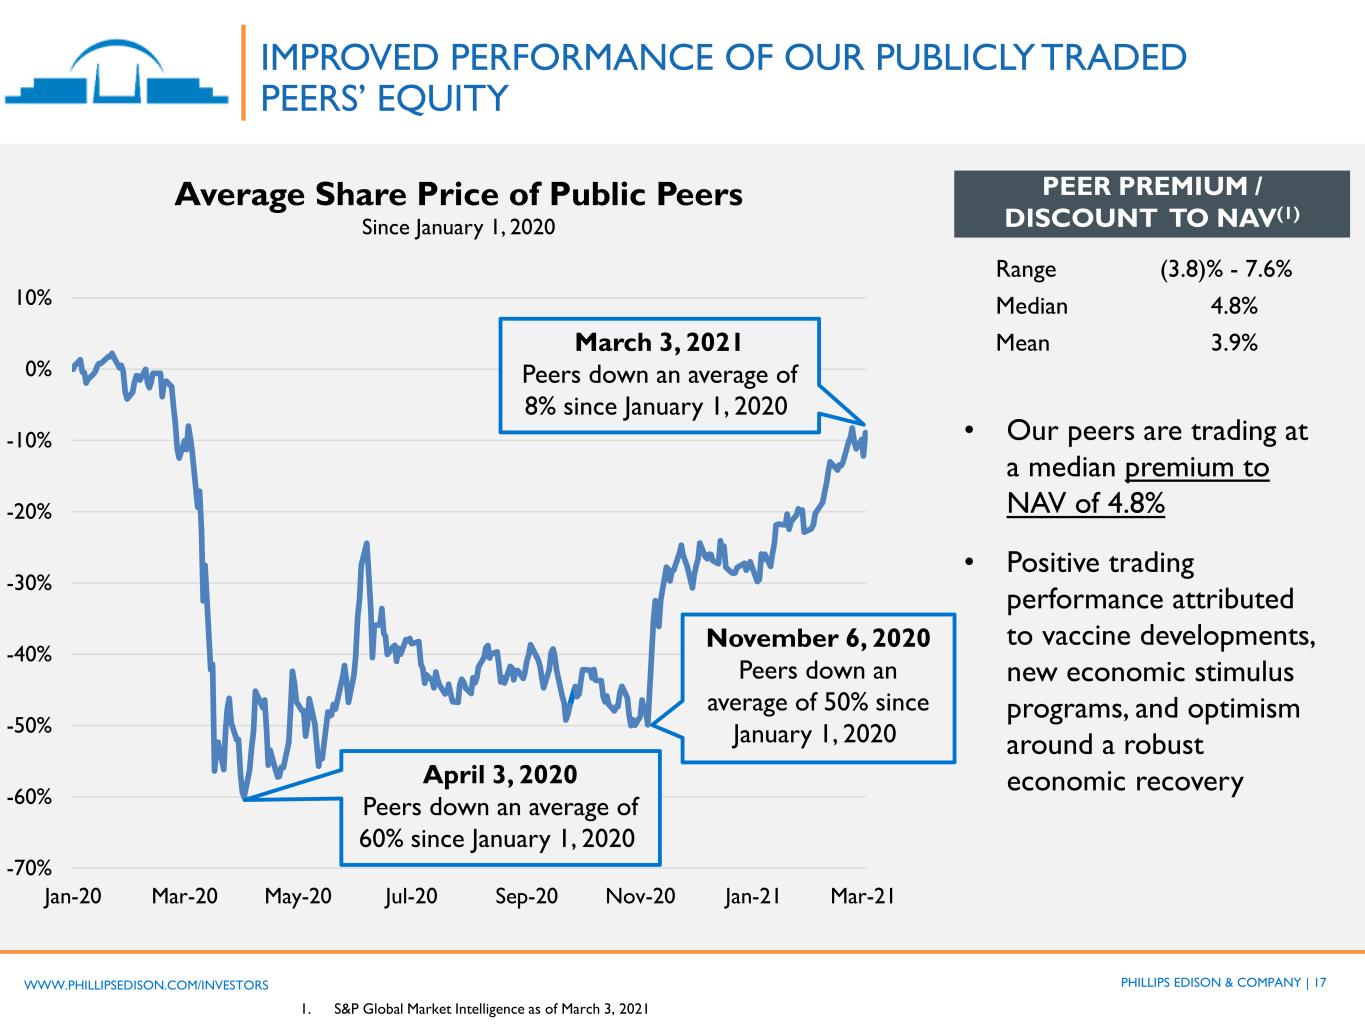
PHILLIPS EDISON & COMPANY | 17WWW.PHILLIPSEDISON.COM/INVESTORS -70% -60% -50% -40% -30% -20% -10% 0% 10% Jan-20 Mar-20 May-20 Jul-20 Sep-20 Nov-20 Jan-21 Mar-21 Average Share Price of Public Peers Since January 1, 2020 IMPROVED PERFORMANCE OF OUR PUBLICLY TRADED PEERS’ EQUITY Range (3.8)% - 7.6% Median 4.8% Mean 3.9%March 3, 2021 Peers down an average of 8% since January 1, 2020 April 3, 2020 Peers down an average of 60% since January 1, 2020 1. S&P Global Market Intelligence as of March 3, 2021 PEER PREMIUM / DISCOUNT TO NAV(1) • Our peers are trading at a median premium to NAV of 4.8% • Positive trading performance attributed to vaccine developments, new economic stimulus programs, and optimism around a robust economic recovery November 6, 2020 Peers down an average of 50% since January 1, 2020
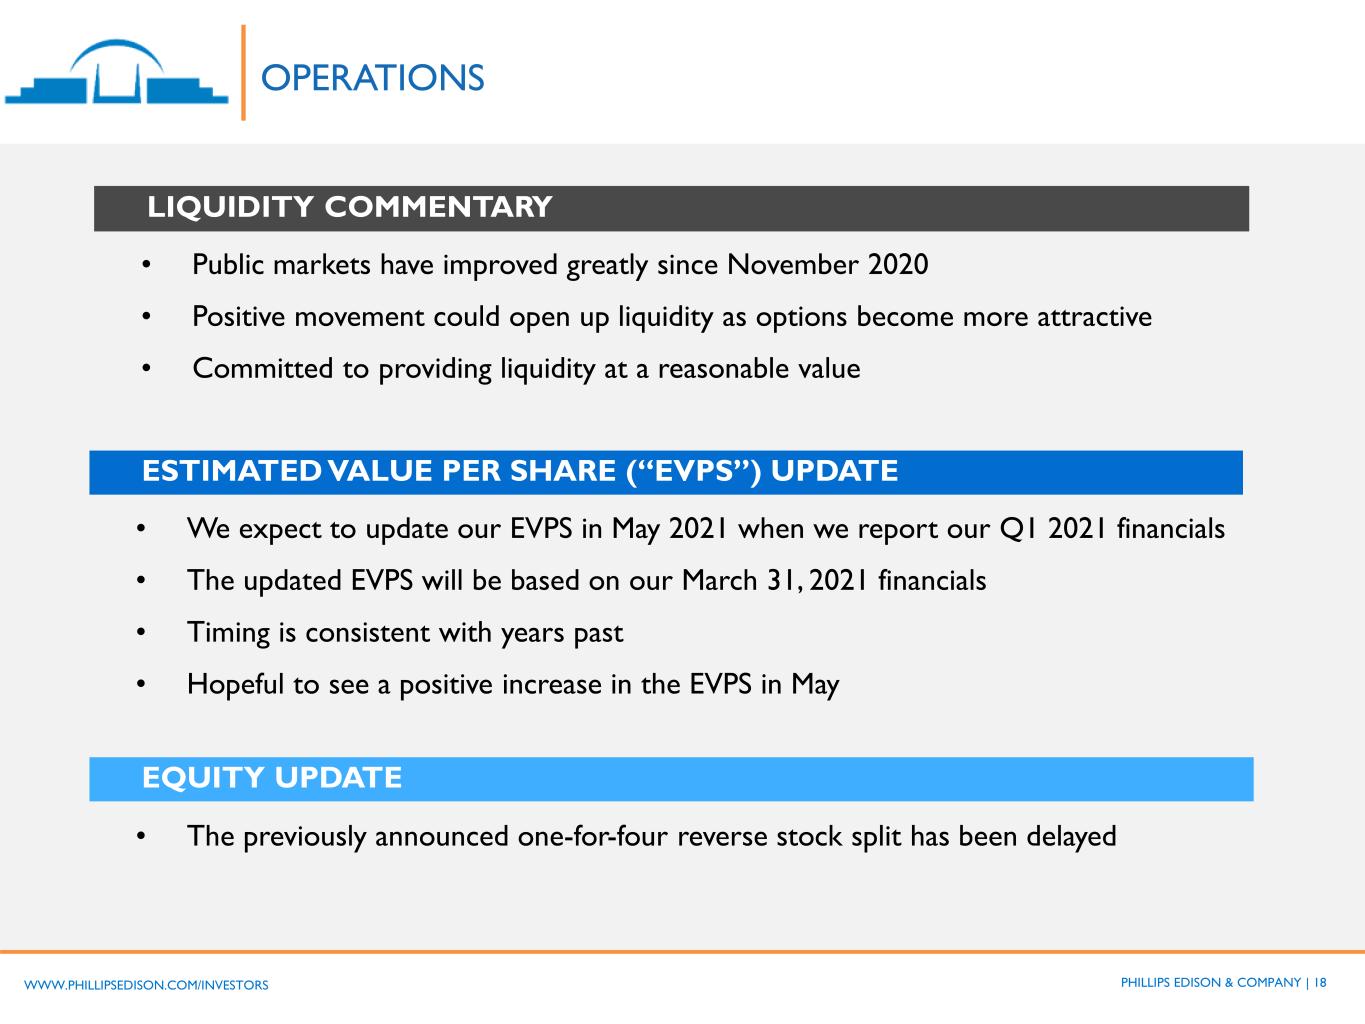
PHILLIPS EDISON & COMPANY | 18WWW.PHILLIPSEDISON.COM/INVESTORS OPERATIONS ESTIMATED VALUE PER SHARE (“EVPS”) UPDATE • We expect to update our EVPS in May 2021 when we report our Q1 2021 financials • The updated EVPS will be based on our March 31, 2021 financials • Timing is consistent with years past • Hopeful to see a positive increase in the EVPS in May EQUITY UPDATE • The previously announced one-for-four reverse stock split has been delayed LIQUIDITY COMMENTARY • Public markets have improved greatly since November 2020 • Positive movement could open up liquidity as options become more attractive • Committed to providing liquidity at a reasonable value
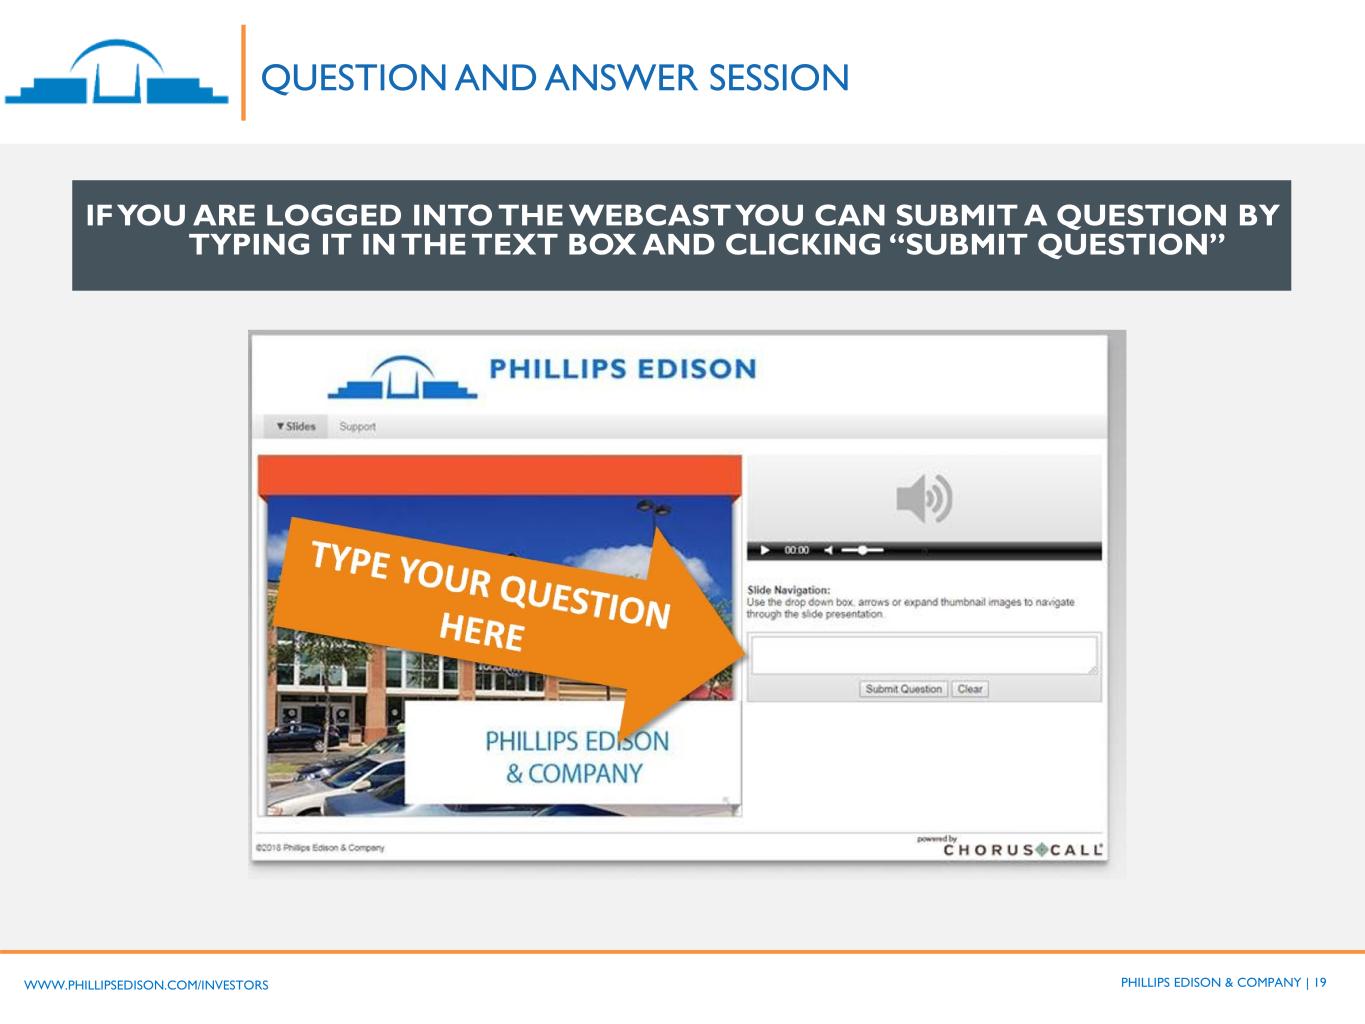
PHILLIPS EDISON & COMPANY | 19WWW.PHILLIPSEDISON.COM/INVESTORS QUESTION AND ANSWER SESSION IF YOU ARE LOGGED INTO THE WEBCAST YOU CAN SUBMIT A QUESTION BY TYPING IT IN THE TEXT BOX AND CLICKING “SUBMIT QUESTION”

PHILLIPS EDISON & COMPANY | 20WWW.PHILLIPSEDISON.COM/INVESTORS FOR MORE INFORMATION INVESTORRELATIONS@PHILLIPSEDISON.COM WWW.PHILLIPSEDISON.COM/INVESTORS INVESTORS AND NIGO SERVICING: (888) 518-8073 PECO ADVISOR SERVICES: (833) 347-5717 PECO uses, and intends to continue to use, its Investors website, which can be found at www.phillipsedison.com/investors, as a means of disclosing material nonpublic information and for complying with its disclosure obligations under Regulation FD.
APPENDIX
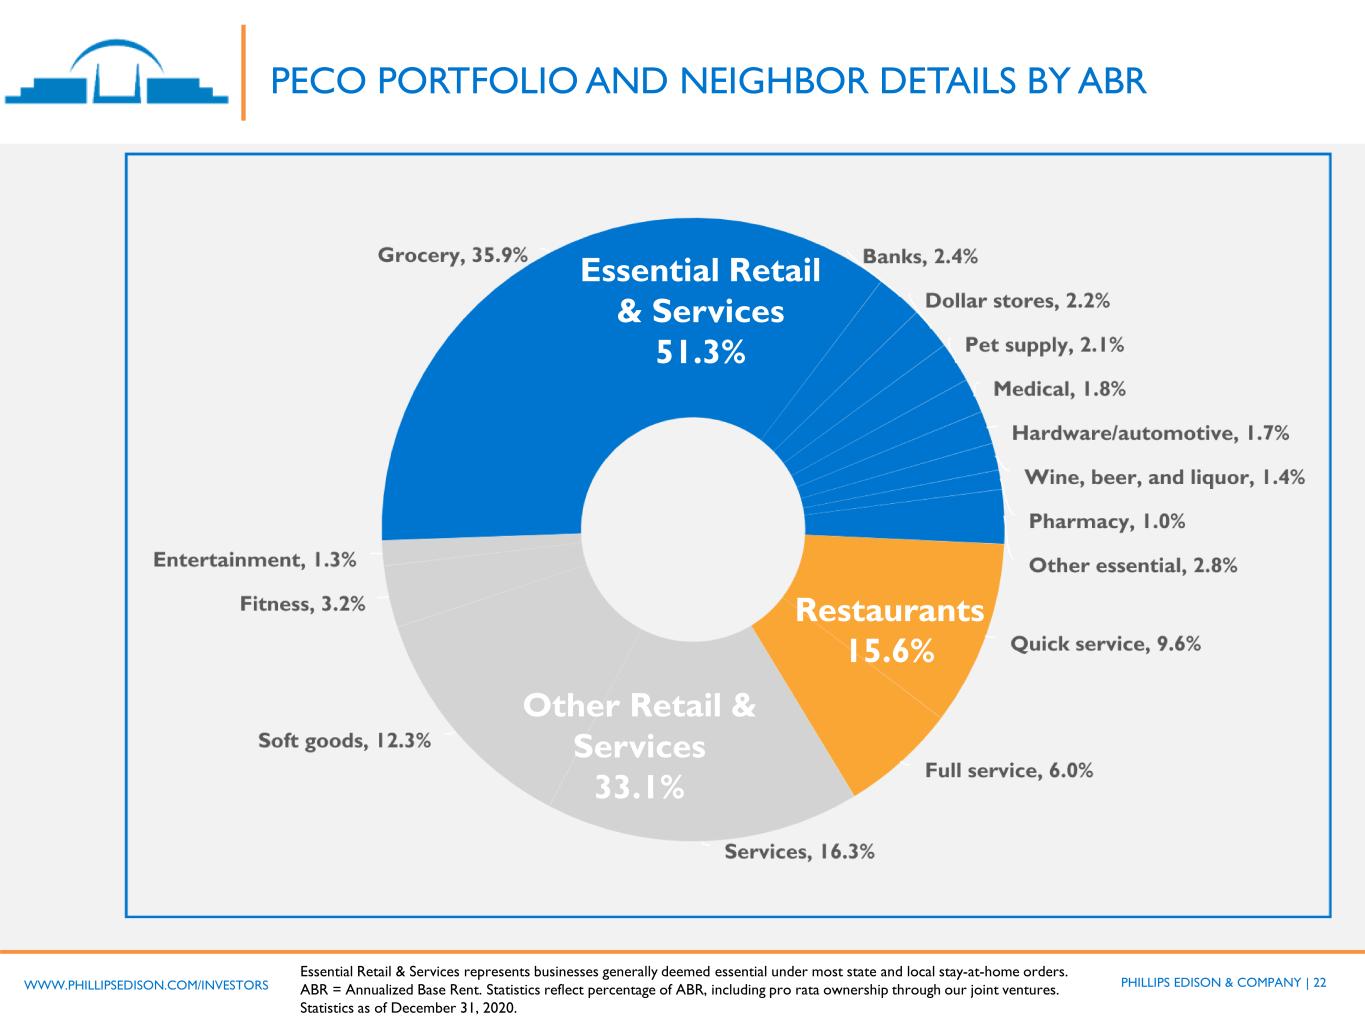
PHILLIPS EDISON & COMPANY | 22WWW.PHILLIPSEDISON.COM/INVESTORS Essential Retail & Services 51.3% Other Retail & Services 33.1% Restaurants 15.6% Essential Retail & Services represents businesses generally deemed essential under most state and local stay-at-home orders. ABR = Annualized Base Rent. Statistics reflect percentage of ABR, including pro rata ownership through our joint ventures. Statistics as of December 31, 2020. PECO PORTFOLIO AND NEIGHBOR DETAILS BY ABR
PHILLIPS EDISON & COMPANY | 23WWW.PHILLIPSEDISON.COM/INVESTORS NON-GAAP MEASURES PECO presents Same-Center NOI as a supplemental measure of its performance. PECO defines NOI as total operating revenues, adjusted to exclude non-cash revenue items, less property operating expenses and real estate taxes. For the three months and years ended December 31, 2020 and 2019, Same-Center NOI represents the NOI for the 275 properties that were wholly-owned and operational for the entire portion of both comparable reporting periods. PECO believes Same-Center NOI provides useful information to its investors about PECO’s financial and operating performance because it provides a performance measure of the revenues and expenses directly involved in owning and operating real estate assets and provides a perspective not immediately apparent from net income (loss). Because Same-Center NOI excludes the change in NOI from properties acquired or disposed of after December 31, 2018, it highlights operating trends such as occupancy levels, rental rates, and operating costs on properties that were operational for both comparable periods. Other REITs may use different methodologies for calculating Same-Center NOI, and accordingly, PECO’s Same-Center NOI may not be comparable to other REITs. Same-Center NOI should not be viewed as an alternative measure of PECO’s financial performance as it does not reflect the operations of its entire portfolio, nor does it reflect the impact of general and administrative expenses, depreciation and amortization, interest expense, other income (expense), or the level of capital expenditures and leasing costs necessary to maintain the operating performance of PECO’s properties that could materially impact its results from operations.
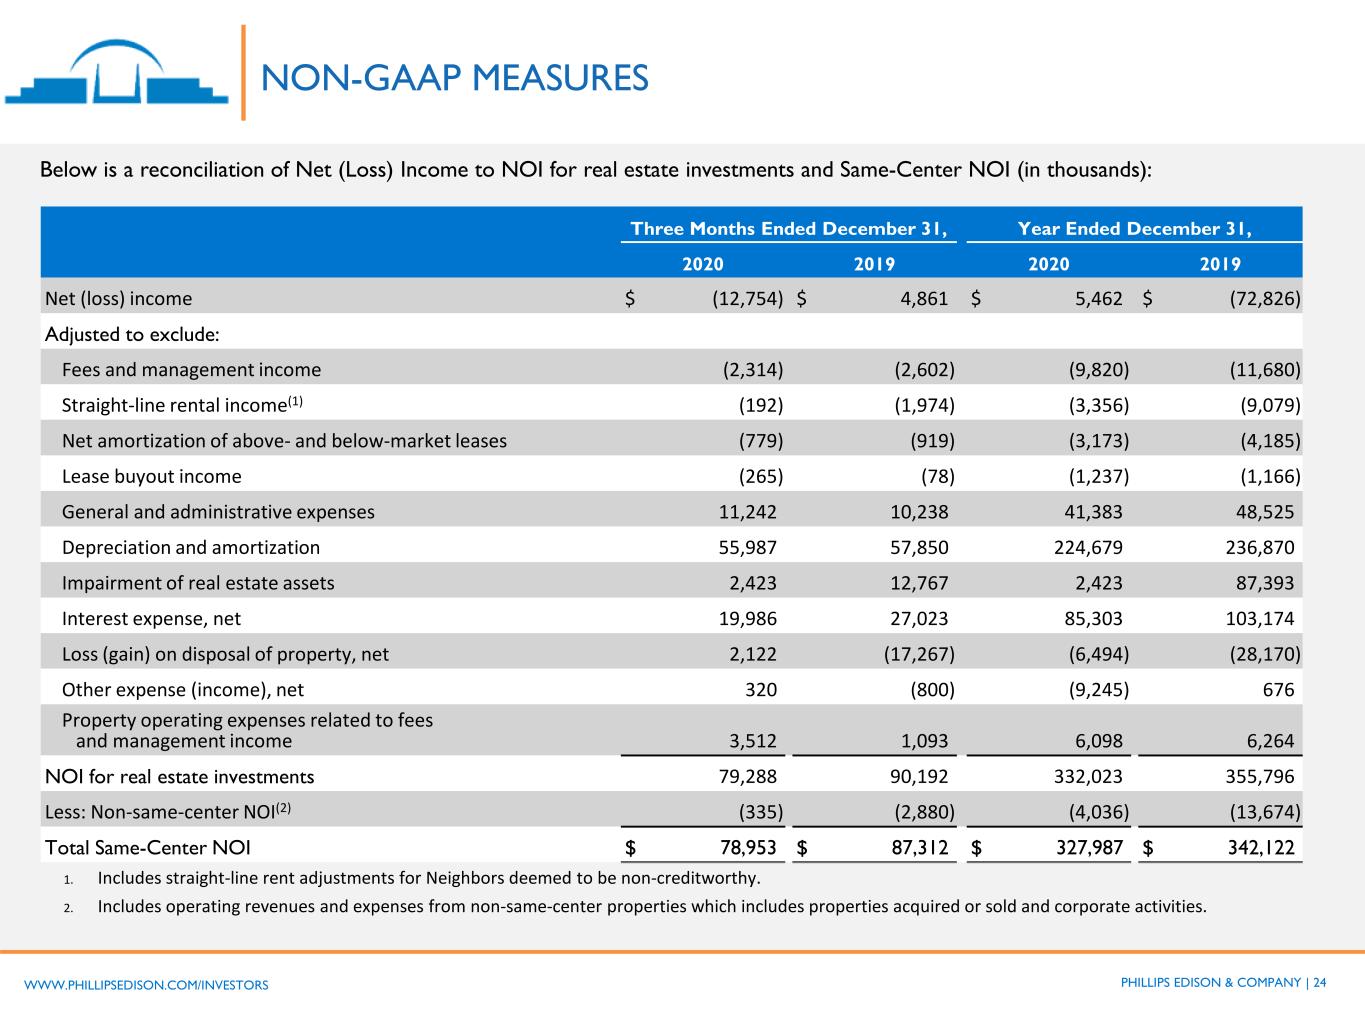
PHILLIPS EDISON & COMPANY | 24WWW.PHILLIPSEDISON.COM/INVESTORS NON-GAAP MEASURES Below is a reconciliation of Net (Loss) Income to NOI for real estate investments and Same-Center NOI (in thousands): Three Months Ended December 31, Year Ended December 31, 2020 2019 2020 2019 Net (loss) income $ (12,754) $ 4,861 $ 5,462 $ (72,826) Adjusted to exclude: Fees and management income (2,314) (2,602) (9,820) (11,680) Straight-line rental income(1) (192) (1,974) (3,356) (9,079) Net amortization of above- and below-market leases (779) (919) (3,173) (4,185) Lease buyout income (265) (78) (1,237) (1,166) General and administrative expenses 11,242 10,238 41,383 48,525 Depreciation and amortization 55,987 57,850 224,679 236,870 Impairment of real estate assets 2,423 12,767 2,423 87,393 Interest expense, net 19,986 27,023 85,303 103,174 Loss (gain) on disposal of property, net 2,122 (17,267) (6,494) (28,170) Other expense (income), net 320 (800) (9,245) 676 Property operating expenses related to fees and management income 3,512 1,093 6,098 6,264 NOI for real estate investments 79,288 90,192 332,023 355,796 Less: Non-same-center NOI(2) (335) (2,880) (4,036) (13,674) Total Same-Center NOI $ 78,953 $ 87,312 $ 327,987 $ 342,122 1. Includes straight-line rent adjustments for Neighbors deemed to be non-creditworthy. 2. Includes operating revenues and expenses from non-same-center properties which includes properties acquired or sold and corporate activities.
PHILLIPS EDISON & COMPANY | 25WWW.PHILLIPSEDISON.COM/INVESTORS NON-GAAP MEASURES Funds from Operations and Core Funds from Operations FFO is a non-GAAP performance financial measure that is widely recognized as a measure of REIT operating performance. The National Association of Real Estate Investment Trusts (“Nareit”) defines FFO as net income (loss) computed in accordance with GAAP, excluding gains (or losses) from sales of property and gains (or losses) from change in control, plus depreciation and amortization, and after adjustments for impairment losses on real estate and impairments of in-substance real estate investments in investees that are driven by measurable decreases in the fair value of the depreciable real estate held by the unconsolidated partnerships and joint ventures. Adjustments for unconsolidated partnerships and joint ventures are calculated to reflect FFO on the same basis. PECO calculates FFO Attributable to Stockholders and Convertible Noncontrolling Interests in a manner consistent with the Nareit definition, with an additional adjustment made for noncontrolling interests that are not convertible into common stock. Core FFO is an additional performance financial measure used by PECO as FFO includes certain non-comparable items that affect PECO’s performance over time. PECO believes that Core FFO is helpful in assisting management and investors with the assessment of the sustainability of operating performance in future periods. PECO believes it is more reflective of its core operating performance and provides an additional measure to compare its performance across reporting periods on a consistent basis by excluding items that may cause short-term fluctuations in net income (loss). To arrive at Core FFO, PECO adjusts FFO attributable to stockholders and convertible noncontrolling interests to exclude certain recurring and non-recurring items including, but not limited to, depreciation and amortization of corporate assets, changes in the fair value of the earn-out liability, amortization of unconsolidated joint venture basis differences, gains or losses on the extinguishment or modification of debt, other impairment charges, and transaction and acquisition expenses. FFO, FFO Attributable to Stockholders and Convertible Noncontrolling Interests, and Core FFO should not be considered alternatives to net income (loss) under GAAP, as an indication of PECO’s liquidity, nor as an indication of funds available to cover PECO’s cash needs, including its ability to fund distributions. Core FFO may not be a useful measure of the impact of long-term operating performance on value if PECO does not continue to operate its business plan in the manner currently contemplated. Accordingly, FFO, FFO Attributable to Stockholders and Convertible Noncontrolling Interests, and Core FFO should be reviewed in connection with other GAAP measurements, and should not be viewed as more prominent measures of performance than net income (loss) or cash flows from operations prepared in accordance with GAAP. PECO’s FFO, FFO Attributable to Stockholders and Convertible Noncontrolling Interests, and Core FFO, as presented, may not be comparable to amounts calculated by other REITs.
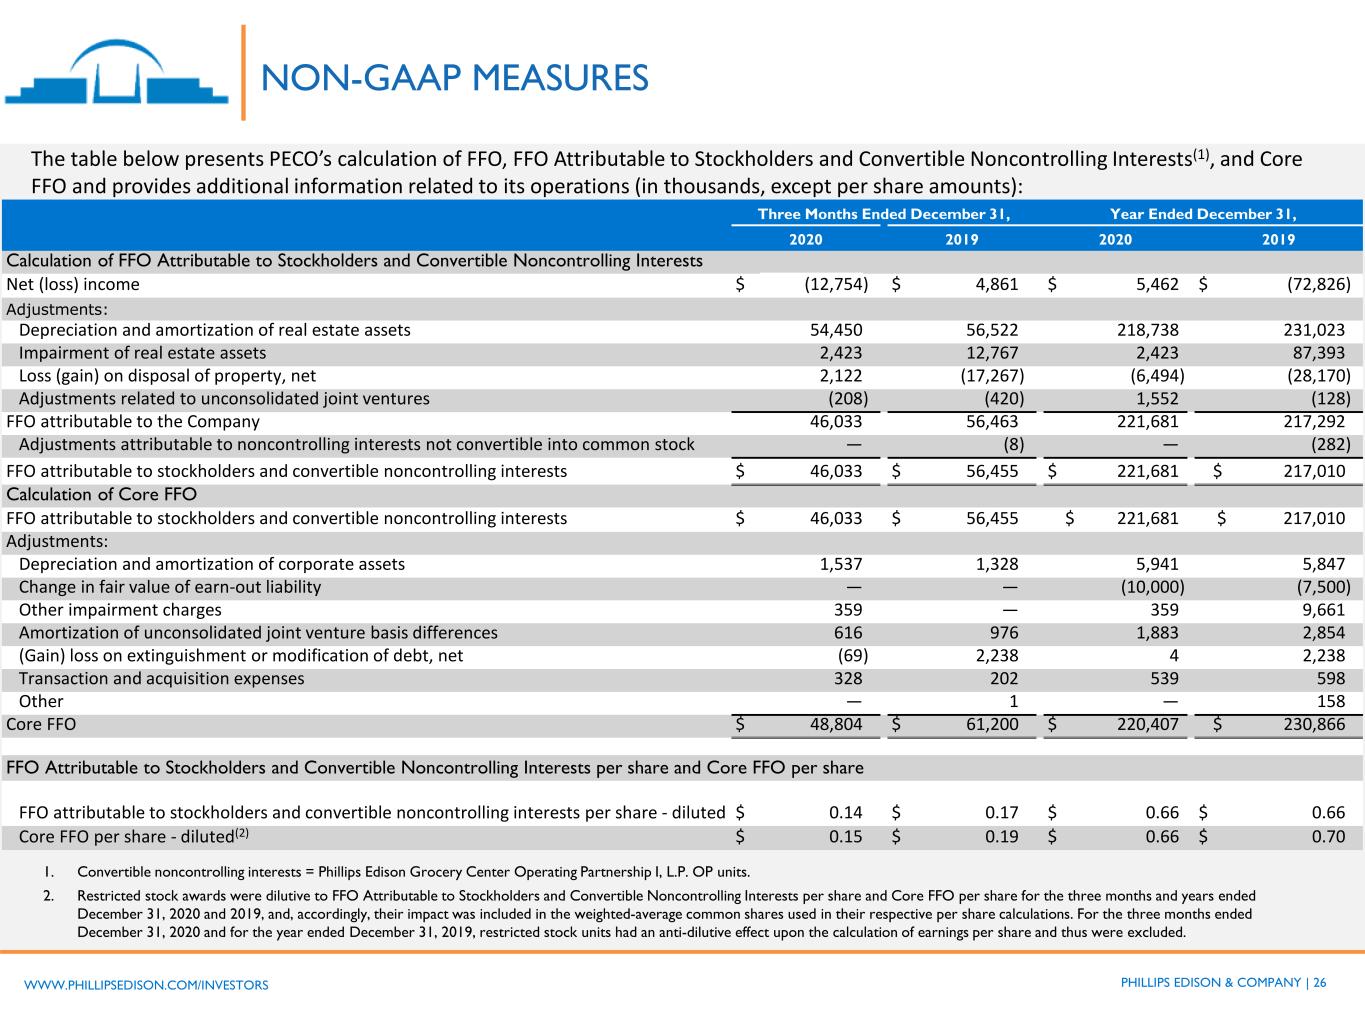
PHILLIPS EDISON & COMPANY | 26WWW.PHILLIPSEDISON.COM/INVESTORS NON-GAAP MEASURES The table below presents PECO’s calculation of FFO, FFO Attributable to Stockholders and Convertible Noncontrolling Interests(1), and Core FFO and provides additional information related to its operations (in thousands, except per share amounts): Three Months Ended December 31, Year Ended December 31, 2020 2019 2020 2019 Calculation of FFO Attributable to Stockholders and Convertible Noncontrolling Interests Net (loss) income $ (12,754) $ 4,861 $ 5,462 $ (72,826) Adjustments: Depreciation and amortization of real estate assets 54,450 56,522 218,738 231,023 Impairment of real estate assets 2,423 12,767 2,423 87,393 Loss (gain) on disposal of property, net 2,122 (17,267) (6,494) (28,170) Adjustments related to unconsolidated joint ventures (208) (420) 1,552 (128) FFO attributable to the Company 46,033 56,463 221,681 217,292 Adjustments attributable to noncontrolling interests not convertible into common stock — (8) — (282) FFO attributable to stockholders and convertible noncontrolling interests $ 46,033 $ 56,455 $ 221,681 $ 217,010 Calculation of Core FFO FFO attributable to stockholders and convertible noncontrolling interests $ 46,033 $ 56,455 $ 221,681 $ 217,010 Adjustments: Depreciation and amortization of corporate assets 1,537 1,328 5,941 5,847 Change in fair value of earn-out liability — — (10,000) (7,500) Other impairment charges 359 — 359 9,661 Amortization of unconsolidated joint venture basis differences 616 976 1,883 2,854 (Gain) loss on extinguishment or modification of debt, net (69) 2,238 4 2,238 Transaction and acquisition expenses 328 202 539 598 Other — 1 — 158 Core FFO $ 48,804 $ 61,200 $ 220,407 $ 230,866 FFO Attributable to Stockholders and Convertible Noncontrolling Interests per share and Core FFO per share FFO attributable to stockholders and convertible noncontrolling interests per share - diluted $ 0.14 $ 0.17 $ 0.66 $ 0.66 Core FFO per share - diluted(2) $ 0.15 $ 0.19 $ 0.66 $ 0.70 1. Convertible noncontrolling interests = Phillips Edison Grocery Center Operating Partnership I, L.P. OP units. 2. Restricted stock awards were dilutive to FFO Attributable to Stockholders and Convertible Noncontrolling Interests per share and Core FFO per share for the three months and years ended December 31, 2020 and 2019, and, accordingly, their impact was included in the weighted-average common shares used in their respective per share calculations. For the three months ended December 31, 2020 and for the year ended December 31, 2019, restricted stock units had an anti-dilutive effect upon the calculation of earnings per share and thus were excluded.
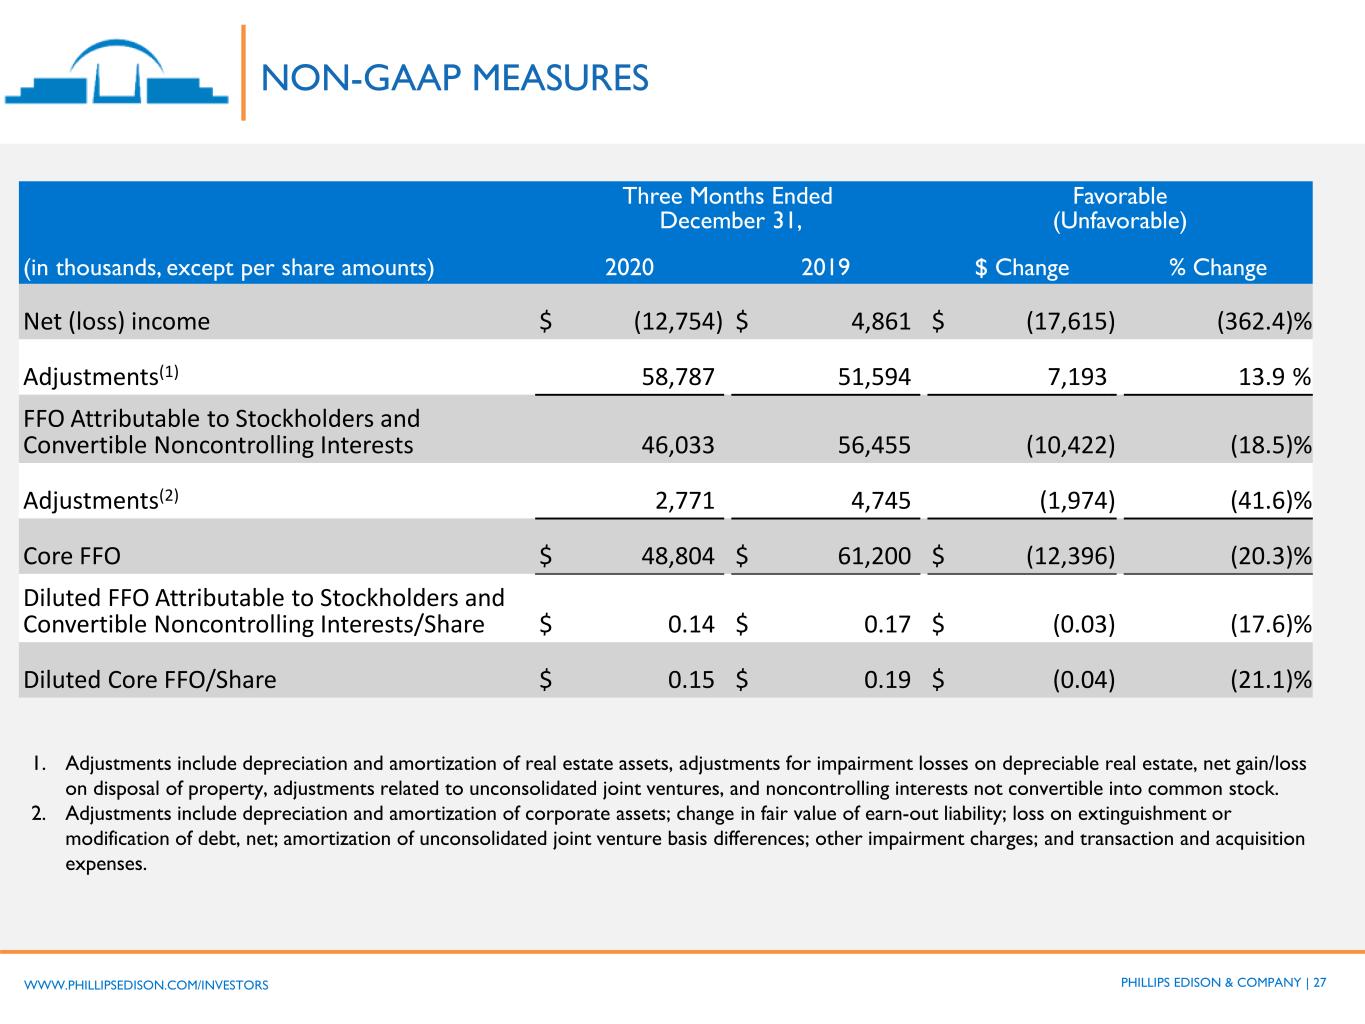
PHILLIPS EDISON & COMPANY | 27WWW.PHILLIPSEDISON.COM/INVESTORS NON-GAAP MEASURES Three Months Ended December 31, Favorable (Unfavorable) (in thousands, except per share amounts) 2020 2019 $ Change % Change Net (loss) income $ (12,754) $ 4,861 $ (17,615) (362.4)% Adjustments(1) 58,787 51,594 7,193 13.9 % FFO Attributable to Stockholders and Convertible Noncontrolling Interests 46,033 56,455 (10,422) (18.5)% Adjustments(2) 2,771 4,745 (1,974) (41.6)% Core FFO $ 48,804 $ 61,200 $ (12,396) (20.3)% Diluted FFO Attributable to Stockholders and Convertible Noncontrolling Interests/Share $ 0.14 $ 0.17 $ (0.03) (17.6)% Diluted Core FFO/Share $ 0.15 $ 0.19 $ (0.04) (21.1)% 1. Adjustments include depreciation and amortization of real estate assets, adjustments for impairment losses on depreciable real estate, net gain/loss on disposal of property, adjustments related to unconsolidated joint ventures, and noncontrolling interests not convertible into common stock. 2. Adjustments include depreciation and amortization of corporate assets; change in fair value of earn-out liability; loss on extinguishment or modification of debt, net; amortization of unconsolidated joint venture basis differences; other impairment charges; and transaction and acquisition expenses.
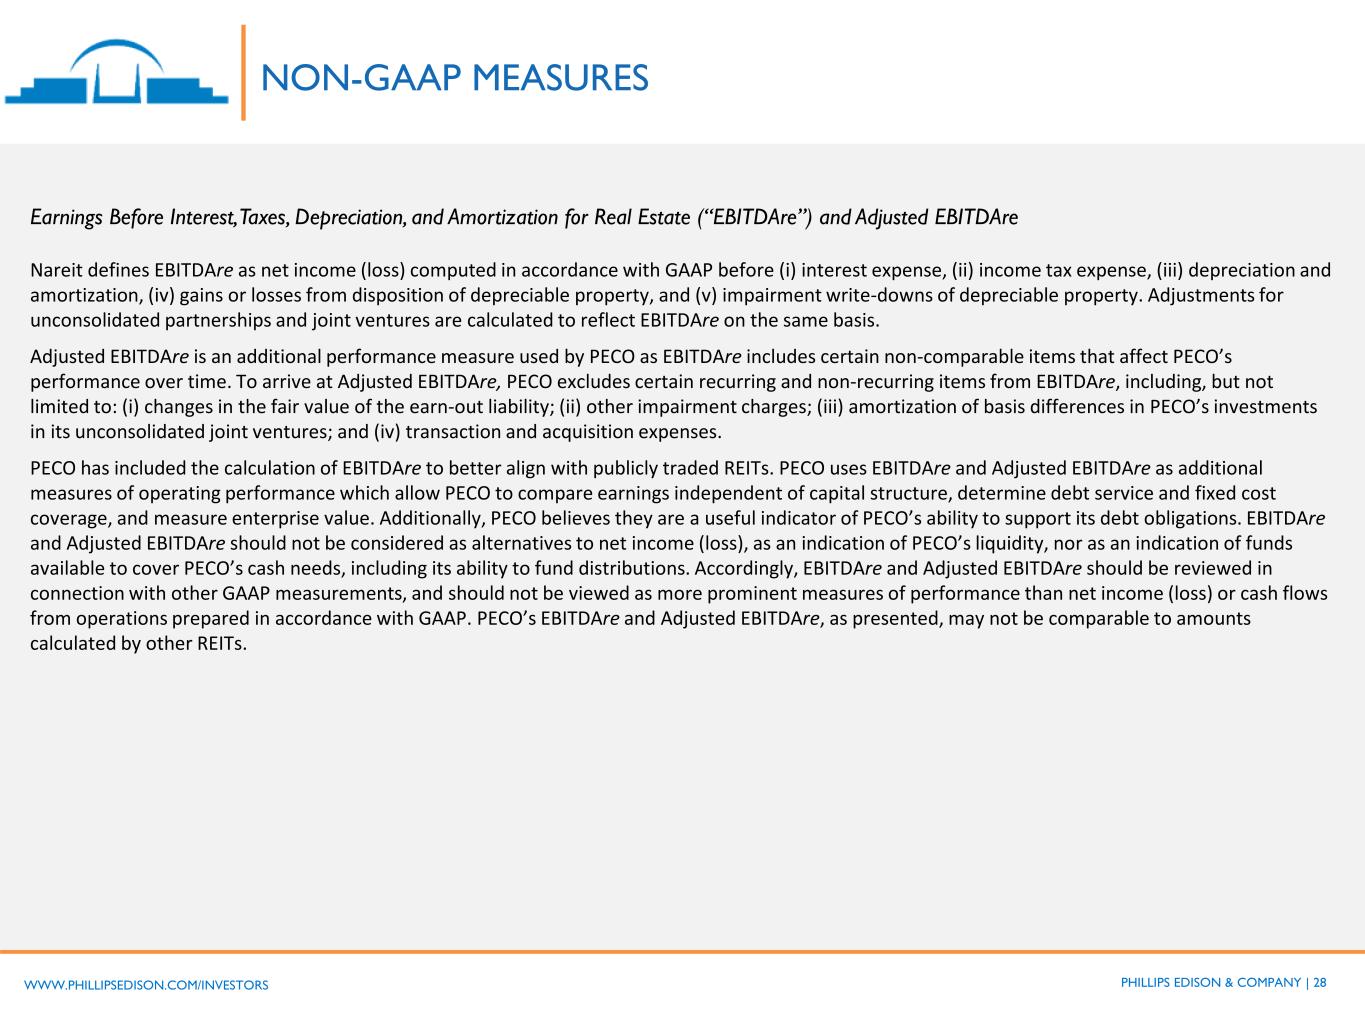
PHILLIPS EDISON & COMPANY | 28WWW.PHILLIPSEDISON.COM/INVESTORS Earnings Before Interest, Taxes, Depreciation, and Amortization for Real Estate (“EBITDAre”) and Adjusted EBITDAre Nareit defines EBITDAre as net income (loss) computed in accordance with GAAP before (i) interest expense, (ii) income tax expense, (iii) depreciation and amortization, (iv) gains or losses from disposition of depreciable property, and (v) impairment write-downs of depreciable property. Adjustments for unconsolidated partnerships and joint ventures are calculated to reflect EBITDAre on the same basis. Adjusted EBITDAre is an additional performance measure used by PECO as EBITDAre includes certain non-comparable items that affect PECO’s performance over time. To arrive at Adjusted EBITDAre, PECO excludes certain recurring and non-recurring items from EBITDAre, including, but not limited to: (i) changes in the fair value of the earn-out liability; (ii) other impairment charges; (iii) amortization of basis differences in PECO’s investments in its unconsolidated joint ventures; and (iv) transaction and acquisition expenses. PECO has included the calculation of EBITDAre to better align with publicly traded REITs. PECO uses EBITDAre and Adjusted EBITDAre as additional measures of operating performance which allow PECO to compare earnings independent of capital structure, determine debt service and fixed cost coverage, and measure enterprise value. Additionally, PECO believes they are a useful indicator of PECO’s ability to support its debt obligations. EBITDAre and Adjusted EBITDAre should not be considered as alternatives to net income (loss), as an indication of PECO’s liquidity, nor as an indication of funds available to cover PECO’s cash needs, including its ability to fund distributions. Accordingly, EBITDAre and Adjusted EBITDAre should be reviewed in connection with other GAAP measurements, and should not be viewed as more prominent measures of performance than net income (loss) or cash flows from operations prepared in accordance with GAAP. PECO’s EBITDAre and Adjusted EBITDAre, as presented, may not be comparable to amounts calculated by other REITs. NON-GAAP MEASURES
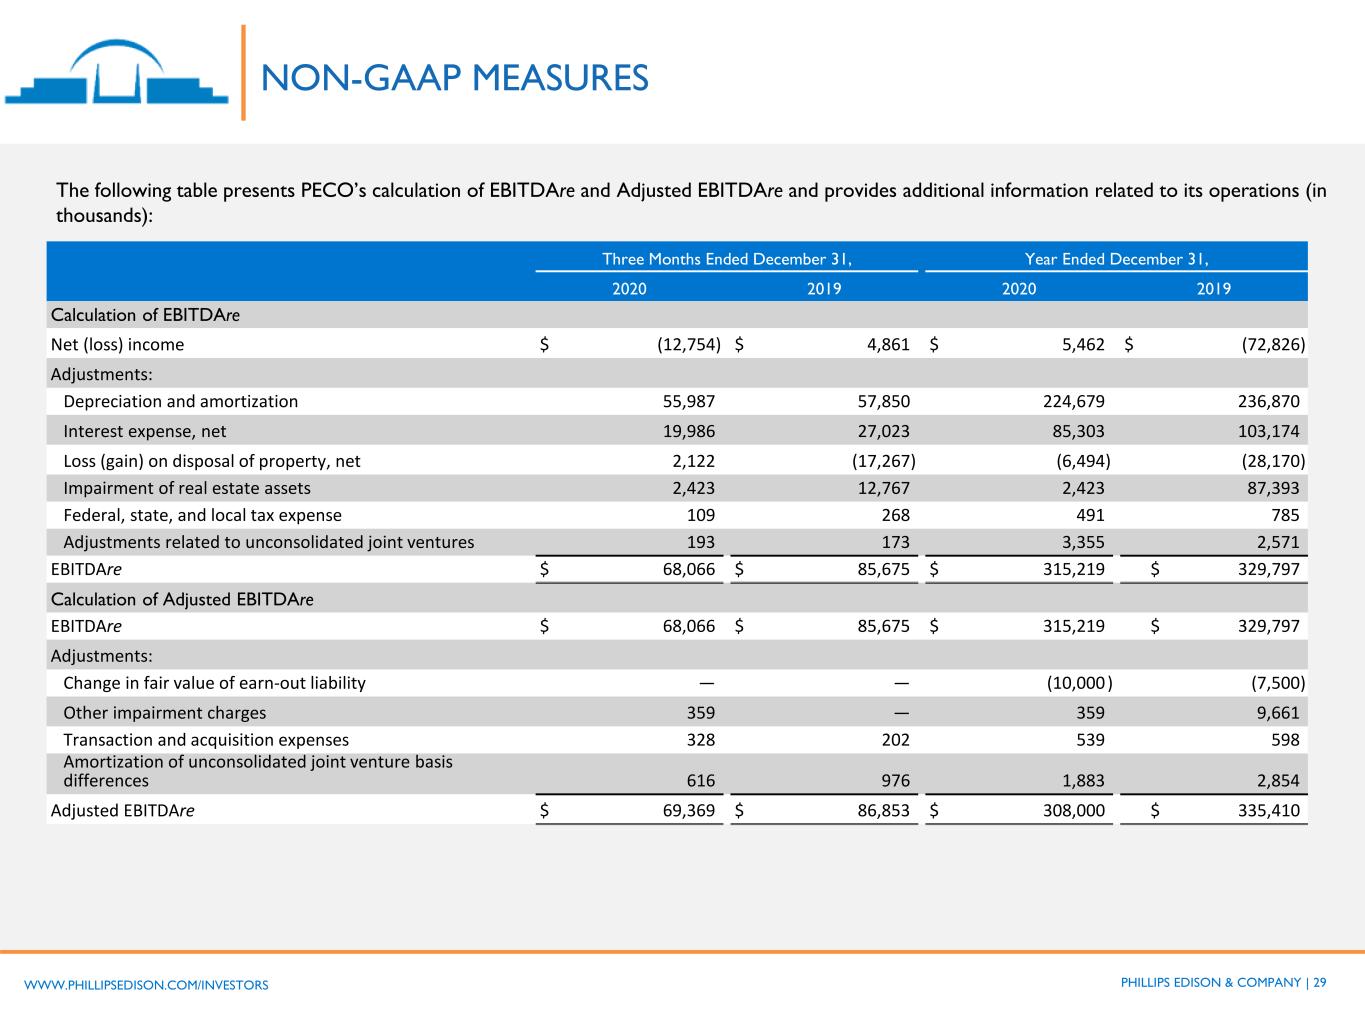
PHILLIPS EDISON & COMPANY | 29WWW.PHILLIPSEDISON.COM/INVESTORS NON-GAAP MEASURES The following table presents PECO’s calculation of EBITDAre and Adjusted EBITDAre and provides additional information related to its operations (in thousands): Three Months Ended December 31, Year Ended December 31, 2020 2019 2020 2019 Calculation of EBITDAre Net (loss) income $ (12,754) $ 4,861 $ 5,462 $ (72,826) Adjustments: Depreciation and amortization 55,987 57,850 224,679 236,870 Interest expense, net 19,986 27,023 85,303 103,174 Loss (gain) on disposal of property, net 2,122 (17,267) (6,494) (28,170) Impairment of real estate assets 2,423 12,767 2,423 87,393 Federal, state, and local tax expense 109 268 491 785 Adjustments related to unconsolidated joint ventures 193 173 3,355 2,571 EBITDAre $ 68,066 $ 85,675 $ 315,219 $ 329,797 Calculation of Adjusted EBITDAre EBITDAre $ 68,066 $ 85,675 $ 315,219 $ 329,797 Adjustments: Change in fair value of earn-out liability — — (10,000 ) (7,500) Other impairment charges 359 — 359 9,661 Transaction and acquisition expenses 328 202 539 598 Amortization of unconsolidated joint venture basis differences 616 976 1,883 2,854 Adjusted EBITDAre $ 69,369 $ 86,853 $ 308,000 $ 335,410
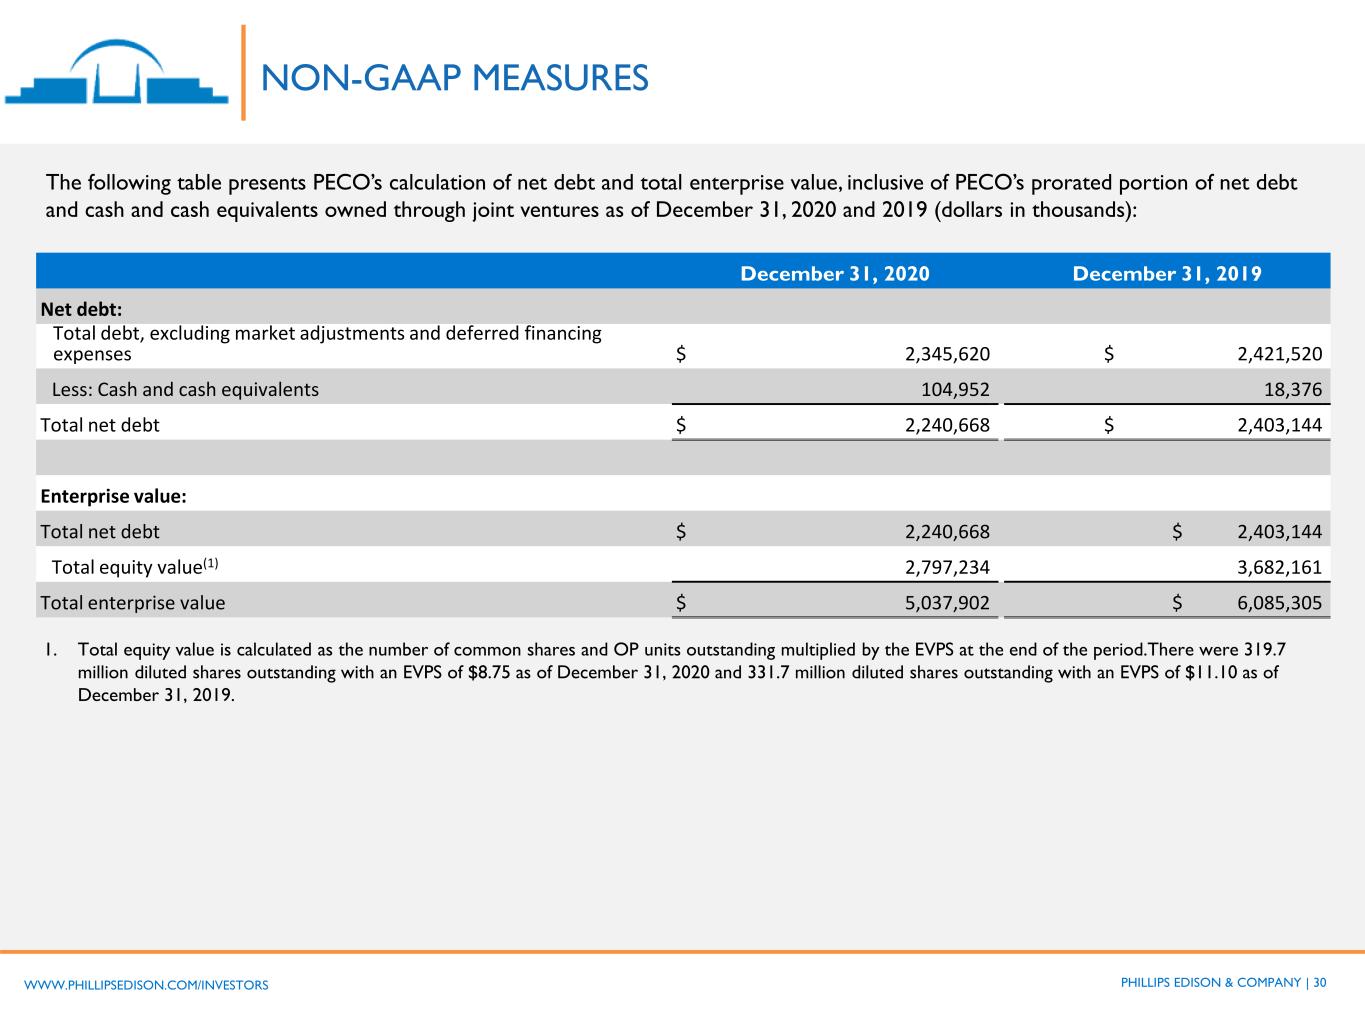
PHILLIPS EDISON & COMPANY | 30WWW.PHILLIPSEDISON.COM/INVESTORS December 31, 2020 December 31, 2019 Net debt: Total debt, excluding market adjustments and deferred financing expenses $ 2,345,620 $ 2,421,520 Less: Cash and cash equivalents 104,952 18,376 Total net debt $ 2,240,668 $ 2,403,144 Enterprise value: Total net debt $ 2,240,668 $ 2,403,144 Total equity value(1) 2,797,234 3,682,161 Total enterprise value $ 5,037,902 $ 6,085,305 1. Total equity value is calculated as the number of common shares and OP units outstanding multiplied by the EVPS at the end of the period.There were 319.7 million diluted shares outstanding with an EVPS of $8.75 as of December 31, 2020 and 331.7 million diluted shares outstanding with an EVPS of $11.10 as of December 31, 2019. The following table presents PECO’s calculation of net debt and total enterprise value, inclusive of PECO’s prorated portion of net debt and cash and cash equivalents owned through joint ventures as of December 31, 2020 and 2019 (dollars in thousands): NON-GAAP MEASURES
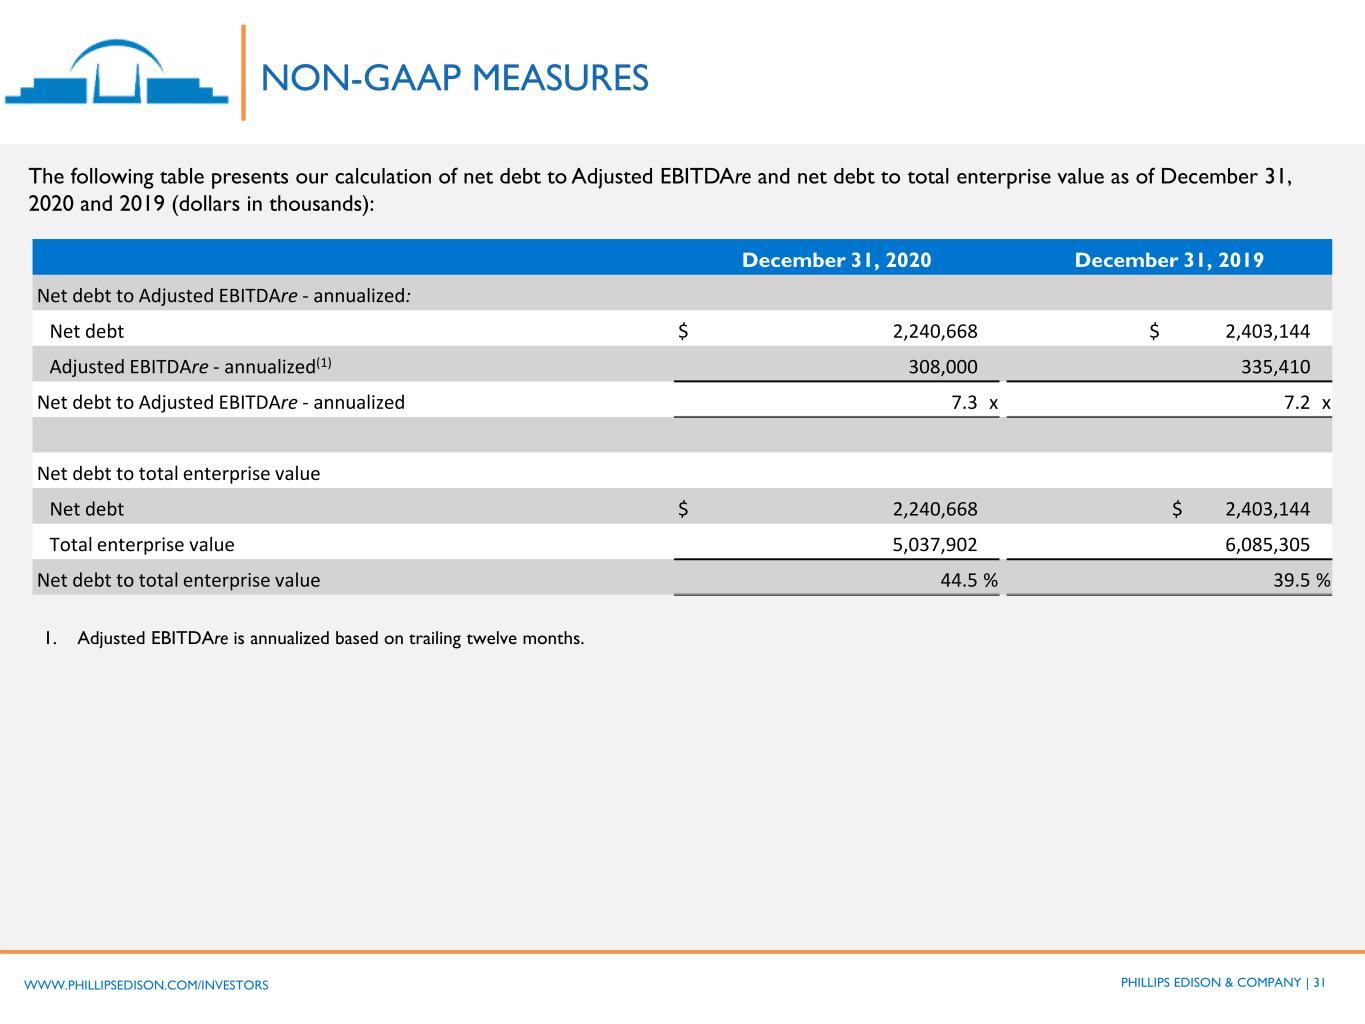
PHILLIPS EDISON & COMPANY | 31WWW.PHILLIPSEDISON.COM/INVESTORS NON-GAAP MEASURES The following table presents our calculation of net debt to Adjusted EBITDAre and net debt to total enterprise value as of December 31, 2020 and 2019 (dollars in thousands): 1. Adjusted EBITDAre is annualized based on trailing twelve months. December 31, 2020 December 31, 2019 Net debt to Adjusted EBITDAre - annualized: Net debt $ 2,240,668 $ 2,403,144 Adjusted EBITDAre - annualized(1) 308,000 335,410 Net debt to Adjusted EBITDAre - annualized 7.3 x 7.2 x Net debt to total enterprise value Net debt $ 2,240,668 $ 2,403,144 Total enterprise value 5,037,902 6,085,305 Net debt to total enterprise value 44.5 % 39.5 %
