Attached files
| file | filename |
|---|---|
| 8-K - 8-K - MIMEDX GROUP, INC. | d42321d8k.htm |

INNOVATING TREATMENTS THROUGH ADVANCED PLACENTAL SCIENCE March 9-10, 2021 2021 H.C. Wainwright & Co. Global Life Sciences Conference Exhibit 99.1
IMPORTANT CAUTIONARY STATEMENT This presentation contains forward-looking statements. Actual results may differ materially. Investors are cautioned against placing undue reliance on these statements. All statements relating to events or results that may occur in the future are forward-looking statements, including, without limitation, statements regarding the following: Our expectations regarding market size and opportunities, expected growth in certain markets, and demographic and market trends; there can be no assurance that the demand for our products will grow. The regulatory pathway for our products, including our existing and planned investigative new drug and investigative device exemption applications and pre-market approval requirements, the timing, design and success of our clinical trials and pursuit of biologic license applications (“BLAs”) and other regulatory approvals for certain products; the process of obtaining regulatory clearances or approvals to market a biological product or medical device from the FDA or similar regulatory authorities outside of the U.S. is costly and time consuming, and such clearances or approvals may not be granted on a timely basis, or at all. Our expectations regarding our ability to continue marketing our micronized products and certain other products during and following the end of the period of enforcement discretion announced by the United States Food and Drug Administration (“FDA”); to the extent our products do not qualify for regulation as human cells, tissues and cellular and tissue-based products solely under Section 361 of the Public Health Service Act (“Section 361”), this could result in removal of the applicable products from the market, would make the introduction of new tissue products more expensive and would significantly delay the expansion of our tissue product offerings and subject us to additional post-market regulatory requirements. Our expectations regarding future revenue growth, including product innovations, expansion into additional domestic and international markets, our product pipeline and the potential to increase our product offerings, and future research and development expenses; future revenue growth will require continued or additional market, regulatory, and payor acceptance of our products, and such acceptance or approvals may not be obtained on a timely basis, or at all. Our expectations regarding growth and investments in our business, including planned increases in the number of sales representatives and levels of R&D spending; such statements reflect current plans based on current conditions and actual results may vary. Our expectations regarding future CGMP compliance; the application of CGMP regulations to the manufacture of biologics is complicated and there can be no assurance that we will achieve CGMP compliance on a timely basis, or at all. Our expectations regarding future third party publication of data regarding our products; the publication of clinical research is time consuming and involves parties not under our control, so there can be no assurance that additional publications will be published on a timely basis, or at all. ongoing and future effects arising from the COVID-19 pandemic and the Company’s plans to adhere to governmental recommendations with respect thereto; the COVID-19 pandemic and governmental and societal responses thereto have adversely affected our business, results of operations and financial condition, and the continuation of the pandemic or the outbreak of other health epidemics could harm our business, results of operations, and financial condition.
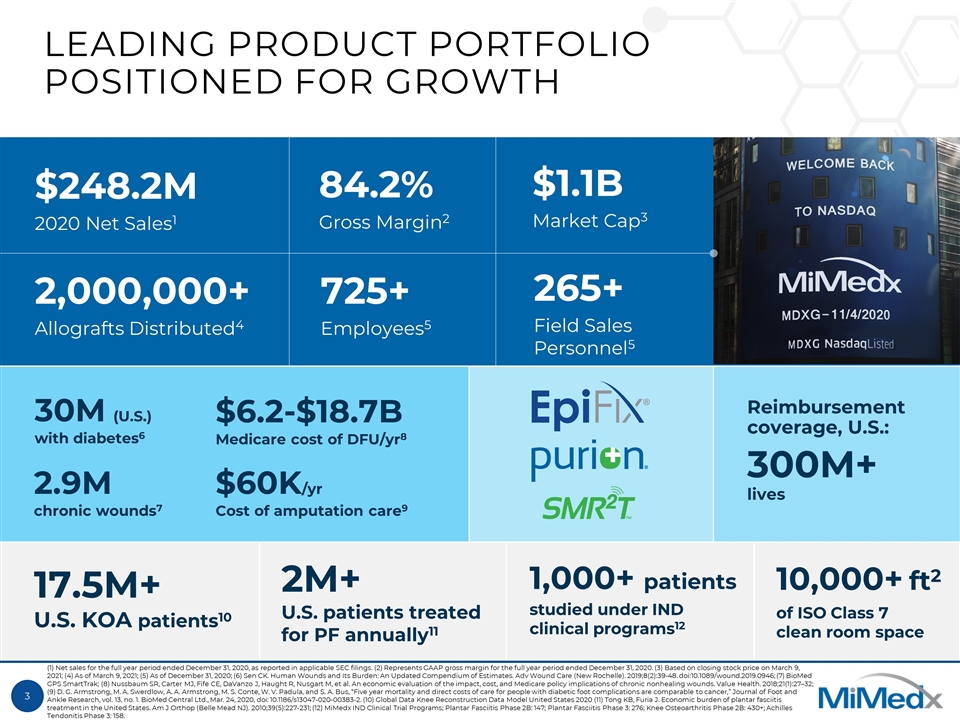
LEADING PRODUCT PORTFOLIO POSITIONED FOR GROWTH 2,000,000+ Allografts Distributed4 84.2% Gross Margin2 $248.2M 2020 Net Sales1 $1.1B Market Cap3 1,000+ patients studied under IND clinical programs12 (1) Net sales for the full year period ended December 31, 2020, as reported in applicable SEC filings. (2) Represents GAAP gross margin for the full year period ended December 31, 2020. (3) Based on closing stock price on March 9, 2021; (4) As of March 9, 2021; (5) As of December 31, 2020; (6) Sen CK. Human Wounds and Its Burden: An Updated Compendium of Estimates. Adv Wound Care (New Rochelle). 2019;8(2):39-48. doi:10.1089/wound.2019.0946; (7) BioMed GPS SmartTrak; (8) Nussbaum SR, Carter MJ, Fife CE, DaVanzo J, Haught R, Nusgart M, et al. An economic evaluation of the impact, cost, and Medicare policy implications of chronic nonhealing wounds. Value Health. 2018;21(1):27–32; (9) D. G. Armstrong, M. A. Swerdlow, A. A. Armstrong, M. S. Conte, W. V. Padula, and S. A. Bus, “Five year mortality and direct costs of care for people with diabetic foot complications are comparable to cancer,” Journal of Foot and Ankle Research, vol. 13, no. 1. BioMed Central Ltd., Mar. 24, 2020, doi: 10.1186/s13047-020-00383-2. (10) Global Data Knee Reconstruction Data Model United States 2020 (11) Tong KB, Furia J. Economic burden of plantar fasciitis treatment in the United States. Am J Orthop (Belle Mead NJ). 2010;39(5):227-231; (12) MiMedx IND Clinical Trial Programs; Plantar Fasciitis Phase 2B: 147; Plantar Fasciitis Phase 3: 276; Knee Osteoarthritis Phase 2B: 430+; Achilles Tendonitis Phase 3: 158. 30M (U.S.) with diabetes6 2.9M chronic wounds7 Reimbursement coverage, U.S.: 300M+ lives 10,000+ ft2 of ISO Class 7 clean room space 17.5M+ U.S. KOA patients10 2M+ U.S. patients treated for PF annually11 725+ Employees5 265+ Field Sales Personnel5 $6.2-$18.7B Medicare cost of DFU/yr8 $60K/yr Cost of amputation care9
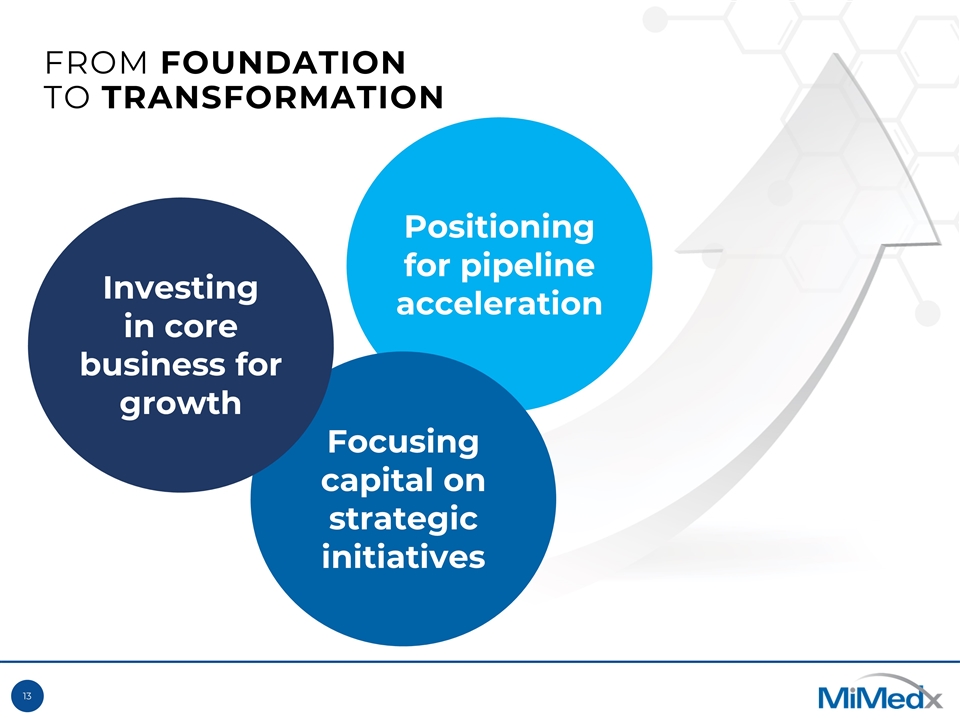
FROM FOUNDATION TO TRANSFORMATION Positioning for pipeline acceleration Focusing capital on strategic initiatives Investing in core business for growth
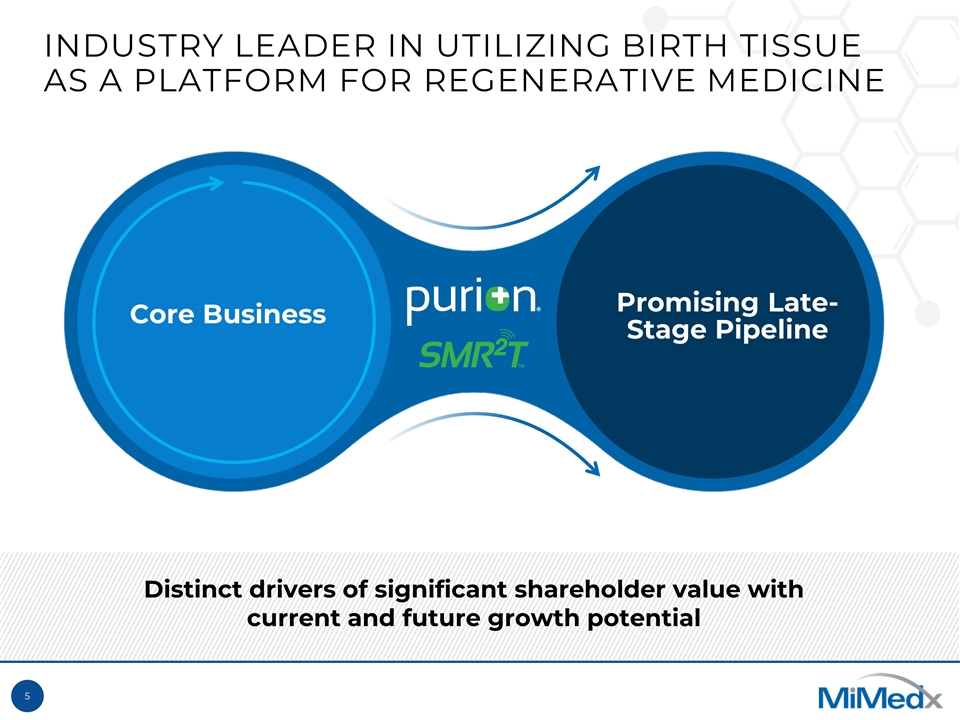
INDUSTRY LEADER IN UTILIZING BIRTH TISSUE AS A PLATFORM FOR REGENERATIVE MEDICINE Distinct drivers of significant shareholder value with current and future growth potential Core Business Promising Late-Stage Pipeline
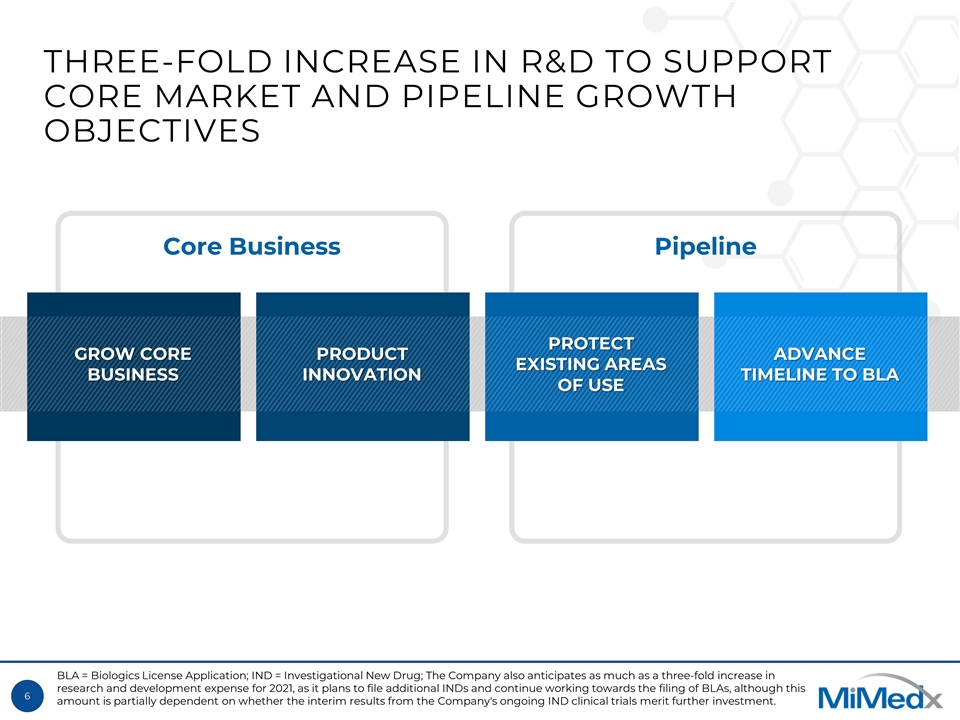
Core Business Pipeline THREE-FOLD INCREASE IN R&D TO SUPPORT CORE MARKET AND PIPELINE GROWTH OBJECTIVES ADVANCE TIMELINE TO BLA GROW CORE BUSINESS PROTECT EXISTING AREAS OF USE PRODUCT INNOVATION BLA = Biologics License Application; IND = Investigational New Drug; The Company also anticipates as much as a three-fold increase in research and development expense for 2021, as it plans to file additional INDs and continue working towards the filing of BLAs, although this amount is partially dependent on whether the interim results from the Company's ongoing IND clinical trials merit further investment.
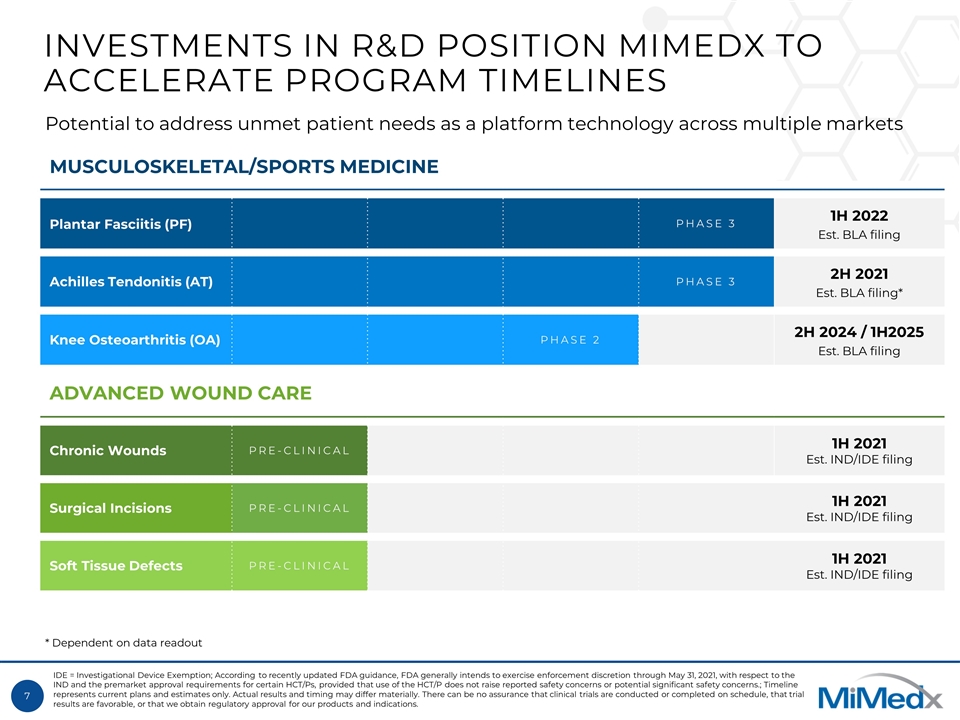
INVESTMENTS IN R&D POSITION MIMEDX TO ACCELERATE PROGRAM TIMELINES MUSCULOSKELETAL/SPORTS MEDICINE Plantar Fasciitis (PF) PHASE 3 1H 2022 Est. BLA filing Achilles Tendonitis (AT) PHASE 3 2H 2021 Est. BLA filing* Knee Osteoarthritis (OA) PHASE 2 2H 2024 / 1H2025 Est. BLA filing ADVANCED WOUND CARE Chronic Wounds PRE-CLINICAL 1H 2021 Est. IND/IDE filing Surgical Incisions PRE-CLINICAL 1H 2021 Est. IND/IDE filing Soft Tissue Defects PRE-CLINICAL 1H 2021 Est. IND/IDE filing Potential to address unmet patient needs as a platform technology across multiple markets IDE = Investigational Device Exemption; According to recently updated FDA guidance, FDA generally intends to exercise enforcement discretion through May 31, 2021, with respect to the IND and the premarket approval requirements for certain HCT/Ps, provided that use of the HCT/P does not raise reported safety concerns or potential significant safety concerns.; Timeline represents current plans and estimates only. Actual results and timing may differ materially. There can be no assurance that clinical trials are conducted or completed on schedule, that trial results are favorable, or that we obtain regulatory approval for our products and indications. * Dependent on data readout
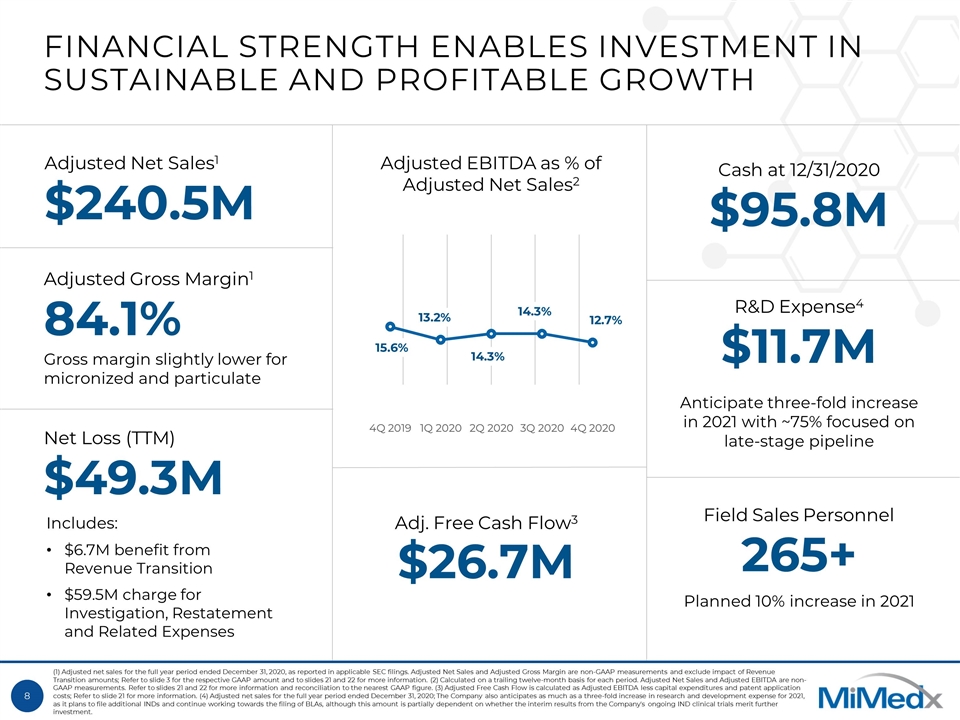
FINANCIAL STRENGTH ENABLES INVESTMENT IN SUSTAINABLE AND PROFITABLE GROWTH Adj. Free Cash Flow3 $26.7M (1) Adjusted net sales for the full year period ended December 31, 2020, as reported in applicable SEC filings. Adjusted Net Sales and Adjusted Gross Margin are non-GAAP measurements and exclude impact of Revenue Transition amounts; Refer to slide 3 for the respective GAAP amount and to slides 21 and 22 for more information. (2) Calculated on a trailing twelve-month basis for each period. Adjusted Net Sales and Adjusted EBITDA are non-GAAP measurements. Refer to slides 21 and 22 for more information and reconciliation to the nearest GAAP figure. (3) Adjusted Free Cash Flow is calculated as Adjusted EBITDA less capital expenditures and patent application costs; Refer to slide 21 for more information. (4) Adjusted net sales for the full year period ended December 31, 2020; The Company also anticipates as much as a three-fold increase in research and development expense for 2021, as it plans to file additional INDs and continue working towards the filing of BLAs, although this amount is partially dependent on whether the interim results from the Company's ongoing IND clinical trials merit further investment. Adjusted EBITDA as % of Adjusted Net Sales2 Adjusted Net Sales1 $240.5M Adjusted Gross Margin1 84.1% R&D Expense4 $11.7M Cash at 12/31/2020 $95.8M Net Loss (TTM) $49.3M Includes: $6.7M benefit from Revenue Transition $59.5M charge for Investigation, Restatement and Related Expenses Anticipate three-fold increase in 2021 with ~75% focused on late-stage pipeline Field Sales Personnel 265+ Planned 10% increase in 2021 Gross margin slightly lower for micronized and particulate
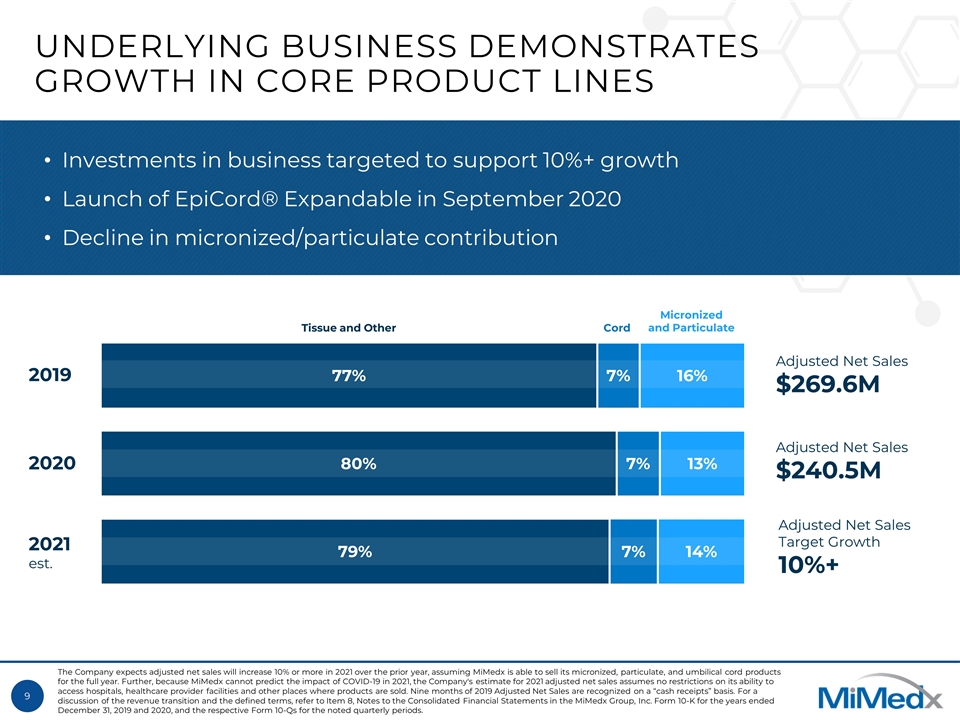
UNDERLYING BUSINESS DEMONSTRATES GROWTH IN CORE PRODUCT LINES Investments in business targeted to support 10%+ growth Launch of EpiCord® Expandable in September 2020 Decline in micronized/particulate contribution 2019 2021 est. 2020 Adjusted Net Sales $240.5M Adjusted Net Sales $269.6M Adjusted Net Sales Target Growth 10%+ Tissue and Other Micronized and Particulate Cord The Company expects adjusted net sales will increase 10% or more in 2021 over the prior year, assuming MiMedx is able to sell its micronized, particulate, and umbilical cord products for the full year. Further, because MiMedx cannot predict the impact of COVID-19 in 2021, the Company's estimate for 2021 adjusted net sales assumes no restrictions on its ability to access hospitals, healthcare provider facilities and other places where products are sold. Nine months of 2019 Adjusted Net Sales are recognized on a “cash receipts” basis. For a discussion of the revenue transition and the defined terms, refer to Item 8, Notes to the Consolidated Financial Statements in the MiMedx Group, Inc. Form 10-K for the years ended December 31, 2019 and 2020, and the respective Form 10-Qs for the noted quarterly periods.
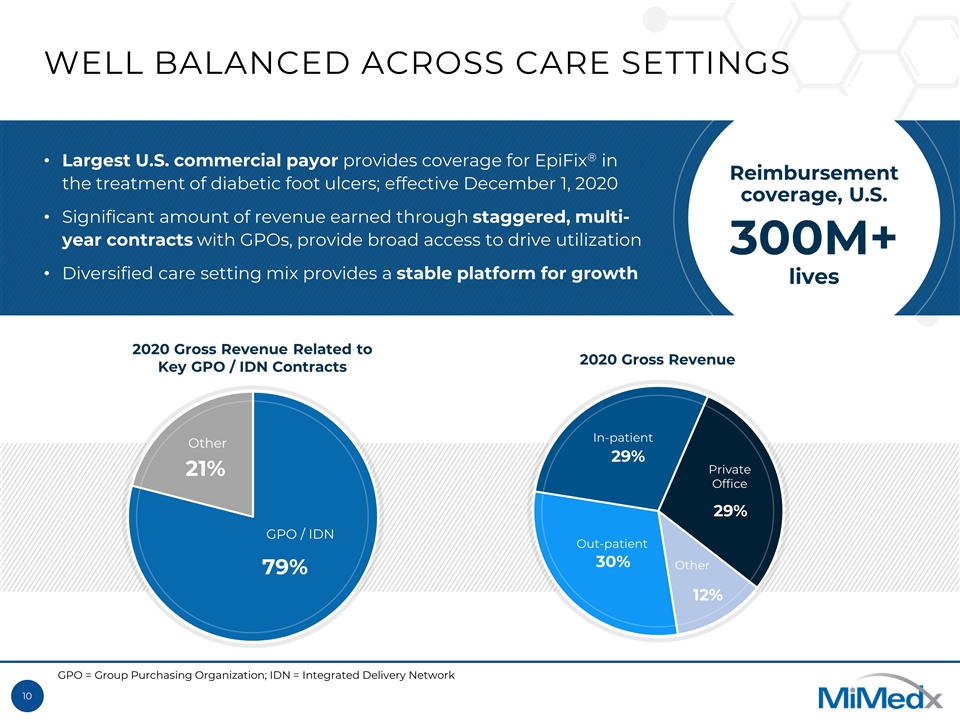
WELL BALANCED ACROSS CARE SETTINGS Largest U.S. commercial payor provides coverage for EpiFix® in the treatment of diabetic foot ulcers; effective December 1, 2020 Significant amount of revenue earned through staggered, multi-year contracts with GPOs, provide broad access to drive utilization Diversified care setting mix provides a stable platform for growth 2020 Gross Revenue Related to Key GPO / IDN Contracts 2020 Gross Revenue Private Office Out-patient In-patient Reimbursement coverage, U.S. 300M+ lives Other GPO = Group Purchasing Organization; IDN = Integrated Delivery Network GPO / IDN Other
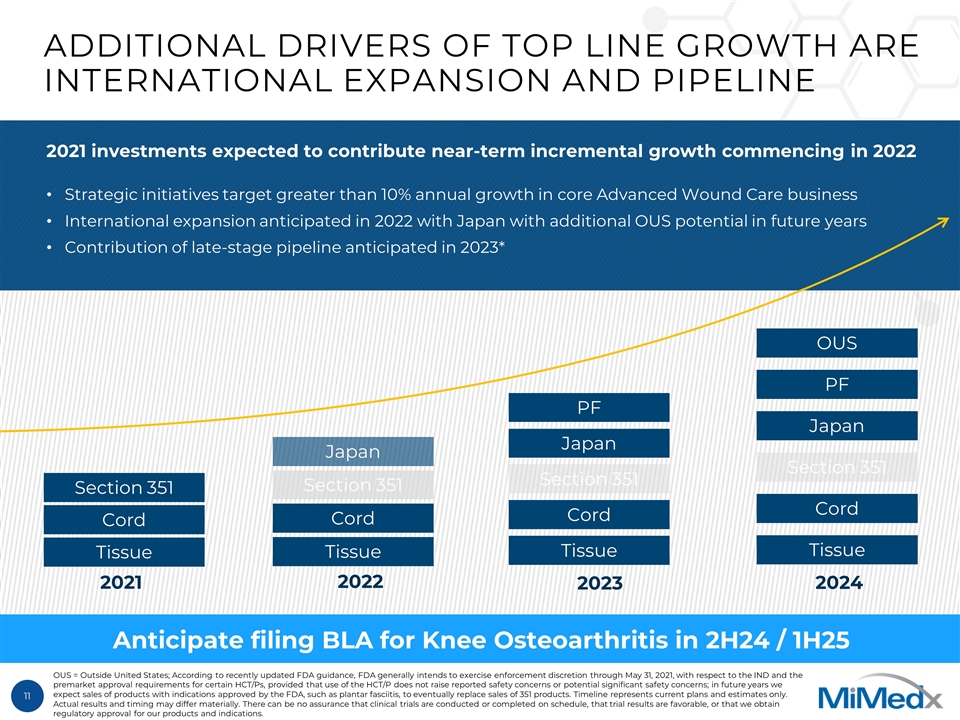
ADDITIONAL DRIVERS OF TOP LINE GROWTH ARE INTERNATIONAL EXPANSION AND PIPELINE 2021 2022 2023 2024 Anticipate filing BLA for Knee Osteoarthritis in 2H24 / 1H25 2021 investments expected to contribute near-term incremental growth commencing in 2022 Strategic initiatives target greater than 10% annual growth in core Advanced Wound Care business International expansion anticipated in 2022 with Japan with additional OUS potential in future years Contribution of late-stage pipeline anticipated in 2023* Section 351 Tissue Cord Section 351 Tissue Cord Japan PF Section 351 Tissue Cord Japan PF Tissue Cord Japan OUS Section 351 OUS = Outside United States; According to recently updated FDA guidance, FDA generally intends to exercise enforcement discretion through May 31, 2021, with respect to the IND and the premarket approval requirements for certain HCT/Ps, provided that use of the HCT/P does not raise reported safety concerns or potential significant safety concerns; in future years we expect sales of products with indications approved by the FDA, such as plantar fasciitis, to eventually replace sales of 351 products. Timeline represents current plans and estimates only. Actual results and timing may differ materially. There can be no assurance that clinical trials are conducted or completed on schedule, that trial results are favorable, or that we obtain regulatory approval for our products and indications.
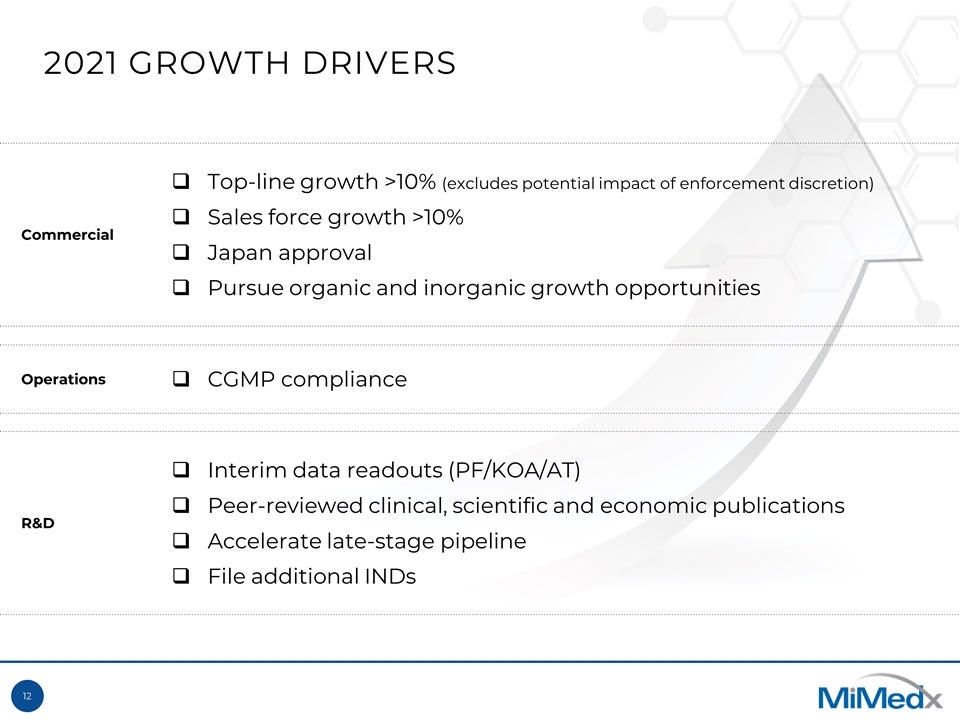
2021 GROWTH DRIVERS Commercial Top-line growth >10% (excludes potential impact of enforcement discretion) Sales force growth >10% Japan approval Pursue organic and inorganic growth opportunities Operations CGMP compliance R&D Interim data readouts (PF/KOA/AT) Peer-reviewed clinical, scientific and economic publications Accelerate late-stage pipeline File additional INDs
FROM FOUNDATION TO TRANSFORMATION Positioning for pipeline acceleration Focusing capital on strategic initiatives Investing in core business for growth
APPENDIX

= Joined since 2018 EXPERIENCED LEADERSHIP TEAM ROBERT STEIN, MD, PhD EVP, Research & Development SCOTT TURNER SVP, Operations & Procurement MARK ROGERS VP, Global Quality Assurance & Regulatory PETE CARLSON Chief Financial Officer MARK GRAVES Chief Compliance Officer STAN MICEK SVP, Business Development ROHIT KASHYAP, PhD Chief Commercial Officer BUTCH HULSE General Counsel & Secretary TIMOTHY R. WRIGHT Chief Executive Officer JACK HOWARTH SVP, Investor Relations
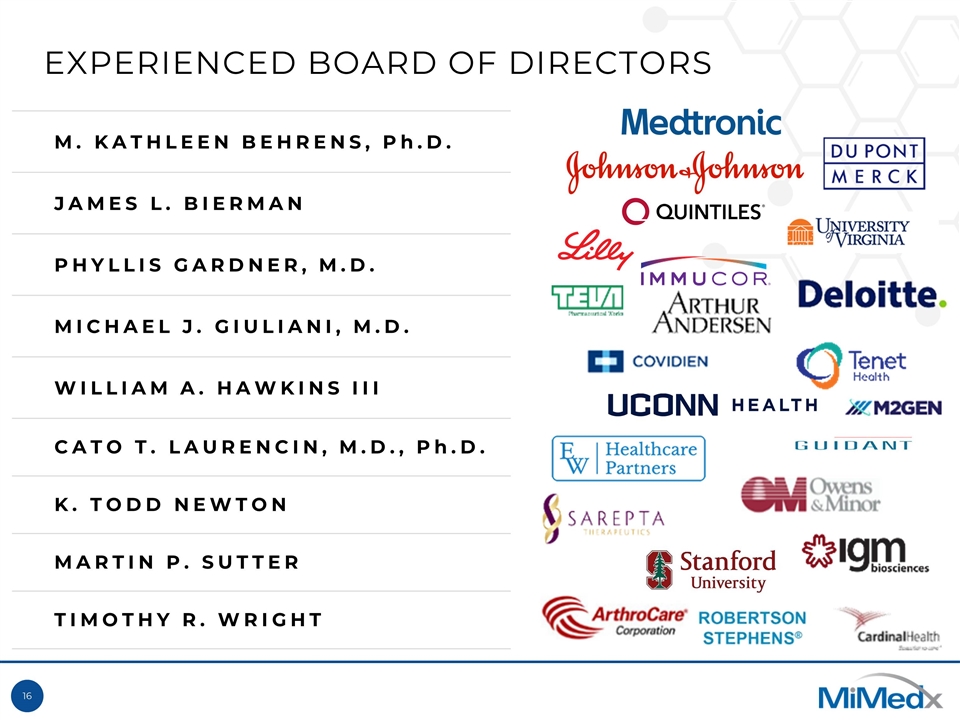
EXPERIENCED BOARD OF DIRECTORS M. KATHLEEN BEHRENS, Ph.D. JAMES L. BIERMAN PHYLLIS GARDNER, M.D. MICHAEL J. GIULIANI, M.D. WILLIAM A. HAWKINS III CATO T. LAURENCIN, M.D., Ph.D. K. TODD NEWTON MARTIN P. SUTTER TIMOTHY R. WRIGHT
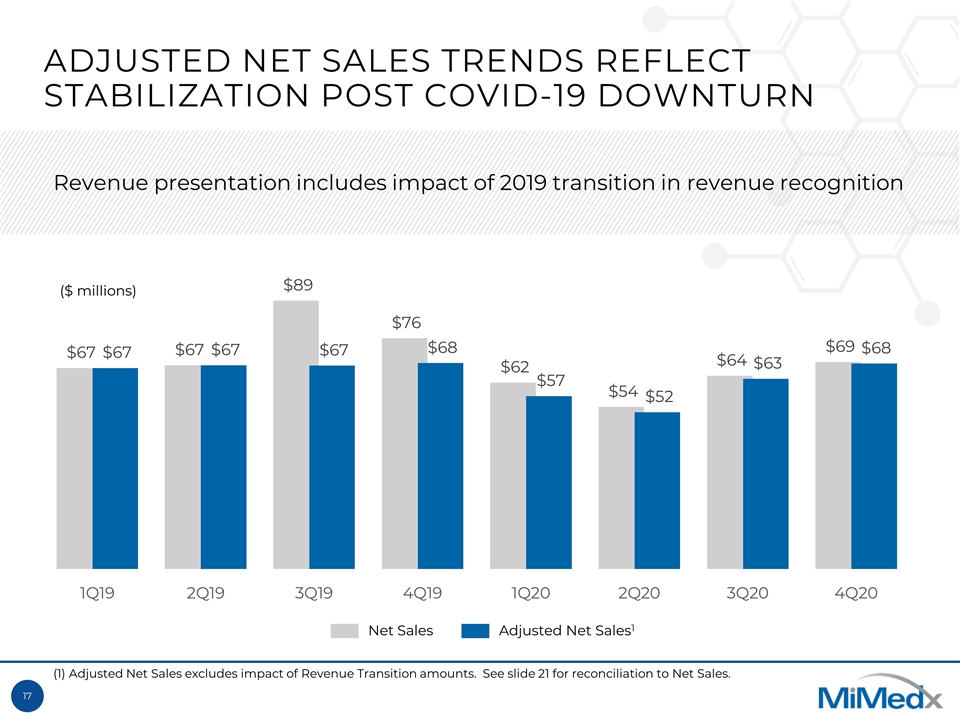
ADJUSTED NET SALES TRENDS REFLECT STABILIZATION POST COVID-19 DOWNTURN Net Sales Adjusted Net Sales1 (1) Adjusted Net Sales excludes impact of Revenue Transition amounts. See slide 21 for reconciliation to Net Sales. ($ millions) Revenue presentation includes impact of 2019 transition in revenue recognition
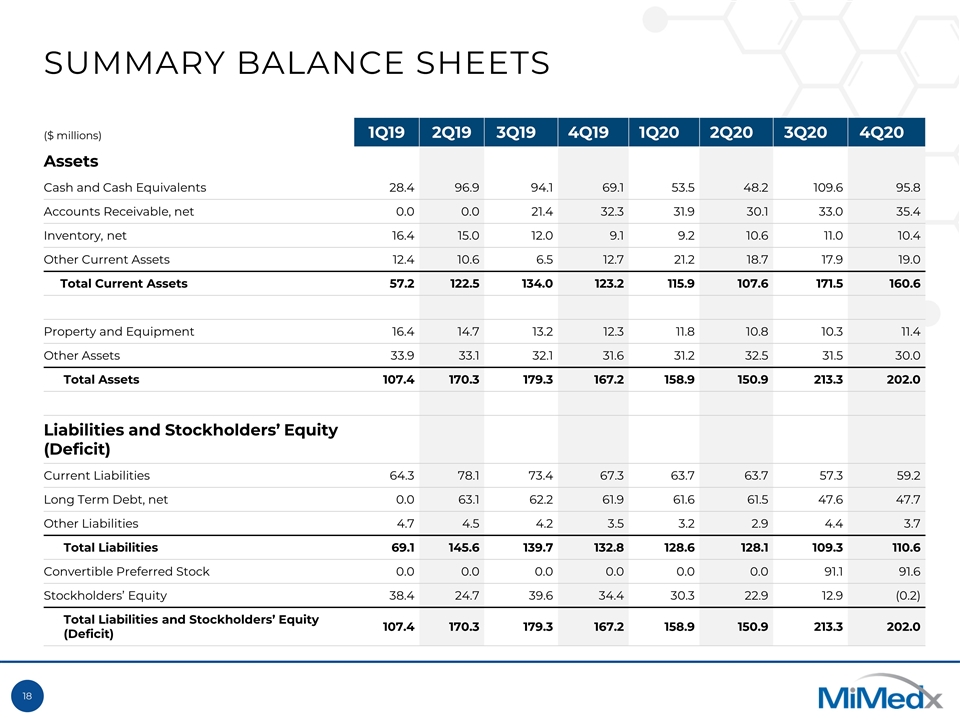
SUMMARY BALANCE SHEETS ($ millions) 1Q19 2Q19 3Q19 4Q19 1Q20 2Q20 3Q20 4Q20 Assets Cash and Cash Equivalents 28.4 96.9 94.1 69.1 53.5 48.2 109.6 95.8 Accounts Receivable, net 0.0 0.0 21.4 32.3 31.9 30.1 33.0 35.4 Inventory, net 16.4 15.0 12.0 9.1 9.2 10.6 11.0 10.4 Other Current Assets 12.4 10.6 6.5 12.7 21.2 18.7 17.9 19.0 Total Current Assets 57.2 122.5 134.0 123.2 115.9 107.6 171.5 160.6 Property and Equipment 16.4 14.7 13.2 12.3 11.8 10.8 10.3 11.4 Other Assets 33.9 33.1 32.1 31.6 31.2 32.5 31.5 30.0 Total Assets 107.4 170.3 179.3 167.2 158.9 150.9 213.3 202.0 Liabilities and Stockholders’ Equity (Deficit) Current Liabilities 64.3 78.1 73.4 67.3 63.7 63.7 57.3 59.2 Long Term Debt, net 0.0 63.1 62.2 61.9 61.6 61.5 47.6 47.7 Other Liabilities 4.7 4.5 4.2 3.5 3.2 2.9 4.4 3.7 Total Liabilities 69.1 145.6 139.7 132.8 128.6 128.1 109.3 110.6 Convertible Preferred Stock 0.0 0.0 0.0 0.0 0.0 0.0 91.1 91.6 Stockholders’ Equity 38.4 24.7 39.6 34.4 30.3 22.9 12.9 (0.2) Total Liabilities and Stockholders’ Equity (Deficit) 107.4 170.3 179.3 167.2 158.9 150.9 213.3 202.0
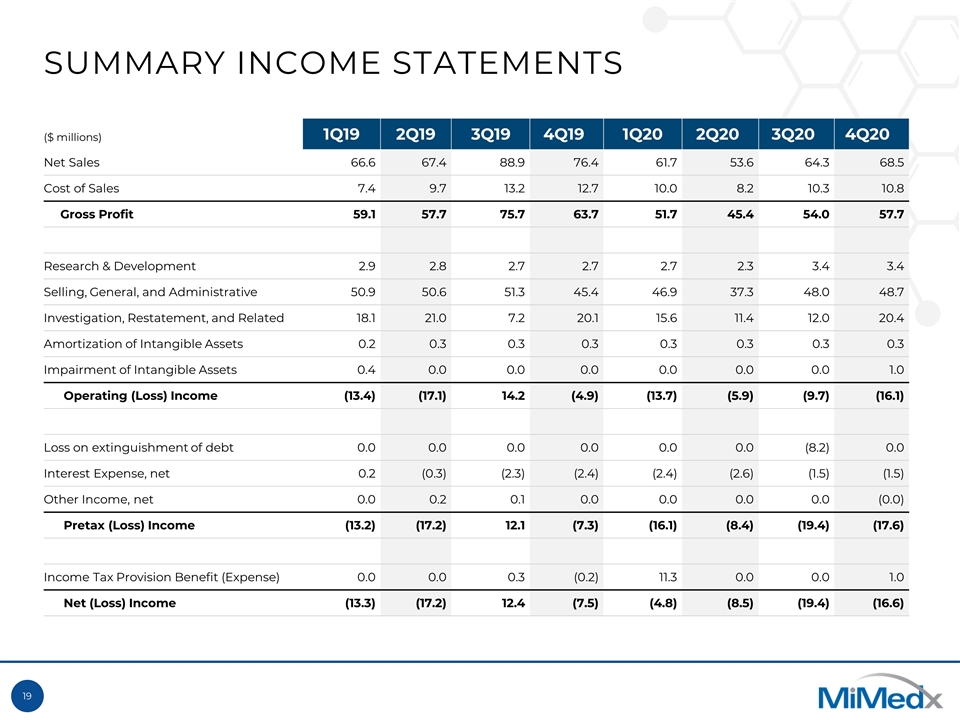
SUMMARY INCOME STATEMENTS ($ millions) 1Q19 2Q19 3Q19 4Q19 1Q20 2Q20 3Q20 4Q20 Net Sales 66.6 67.4 88.9 76.4 61.7 53.6 64.3 68.5 Cost of Sales 7.4 9.7 13.2 12.7 10.0 8.2 10.3 10.8 Gross Profit 59.1 57.7 75.7 63.7 51.7 45.4 54.0 57.7 Research & Development 2.9 2.8 2.7 2.7 2.7 2.3 3.4 3.4 Selling, General, and Administrative 50.9 50.6 51.3 45.4 46.9 37.3 48.0 48.7 Investigation, Restatement, and Related 18.1 21.0 7.2 20.1 15.6 11.4 12.0 20.4 Amortization of Intangible Assets 0.2 0.3 0.3 0.3 0.3 0.3 0.3 0.3 Impairment of Intangible Assets 0.4 0.0 0.0 0.0 0.0 0.0 0.0 1.0 Operating (Loss) Income (13.4) (17.1) 14.2 (4.9) (13.7) (5.9) (9.7) (16.1) Loss on extinguishment of debt 0.0 0.0 0.0 0.0 0.0 0.0 (8.2) 0.0 Interest Expense, net 0.2 (0.3) (2.3) (2.4) (2.4) (2.6) (1.5) (1.5) Other Income, net 0.0 0.2 0.1 0.0 0.0 0.0 0.0 (0.0) Pretax (Loss) Income (13.2) (17.2) 12.1 (7.3) (16.1) (8.4) (19.4) (17.6) Income Tax Provision Benefit (Expense) 0.0 0.0 0.3 (0.2) 11.3 0.0 0.0 1.0 Net (Loss) Income (13.3) (17.2) 12.4 (7.5) (4.8) (8.5) (19.4) (16.6)
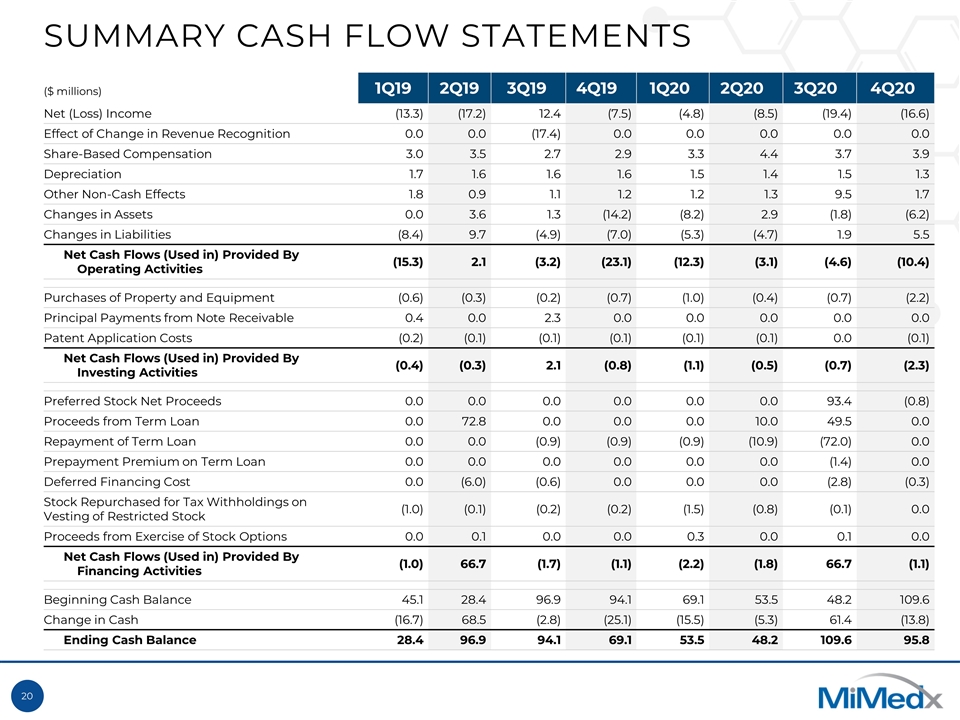
SUMMARY CASH FLOW STATEMENTS ($ millions) 1Q19 2Q19 3Q19 4Q19 1Q20 2Q20 3Q20 4Q20 Net (Loss) Income (13.3) (17.2) 12.4 (7.5) (4.8) (8.5) (19.4) (16.6) Effect of Change in Revenue Recognition 0.0 0.0 (17.4) 0.0 0.0 0.0 0.0 0.0 Share-Based Compensation 3.0 3.5 2.7 2.9 3.3 4.4 3.7 3.9 Depreciation 1.7 1.6 1.6 1.6 1.5 1.4 1.5 1.3 Other Non-Cash Effects 1.8 0.9 1.1 1.2 1.2 1.3 9.5 1.7 Changes in Assets 0.0 3.6 1.3 (14.2) (8.2) 2.9 (1.8) (6.2) Changes in Liabilities (8.4) 9.7 (4.9) (7.0) (5.3) (4.7) 1.9 5.5 Net Cash Flows (Used in) Provided By Operating Activities (15.3) 2.1 (3.2) (23.1) (12.3) (3.1) (4.6) (10.4) Purchases of Property and Equipment (0.6) (0.3) (0.2) (0.7) (1.0) (0.4) (0.7) (2.2) Principal Payments from Note Receivable 0.4 0.0 2.3 0.0 0.0 0.0 0.0 0.0 Patent Application Costs (0.2) (0.1) (0.1) (0.1) (0.1) (0.1) 0.0 (0.1) Net Cash Flows (Used in) Provided By Investing Activities (0.4) (0.3) 2.1 (0.8) (1.1) (0.5) (0.7) (2.3) Preferred Stock Net Proceeds 0.0 0.0 0.0 0.0 0.0 0.0 93.4 (0.8) Proceeds from Term Loan 0.0 72.8 0.0 0.0 0.0 10.0 49.5 0.0 Repayment of Term Loan 0.0 0.0 (0.9) (0.9) (0.9) (10.9) (72.0) 0.0 Prepayment Premium on Term Loan 0.0 0.0 0.0 0.0 0.0 0.0 (1.4) 0.0 Deferred Financing Cost 0.0 (6.0) (0.6) 0.0 0.0 0.0 (2.8) (0.3) Stock Repurchased for Tax Withholdings on Vesting of Restricted Stock (1.0) (0.1) (0.2) (0.2) (1.5) (0.8) (0.1) 0.0 Proceeds from Exercise of Stock Options 0.0 0.1 0.0 0.0 0.3 0.0 0.1 0.0 Net Cash Flows (Used in) Provided By Financing Activities (1.0) 66.7 (1.7) (1.1) (2.2) (1.8) 66.7 (1.1) Beginning Cash Balance 45.1 28.4 96.9 94.1 69.1 53.5 48.2 109.6 Change in Cash (16.7) 68.5 (2.8) (25.1) (15.5) (5.3) 61.4 (13.8) Ending Cash Balance 28.4 96.9 94.1 69.1 53.5 48.2 109.6 95.8
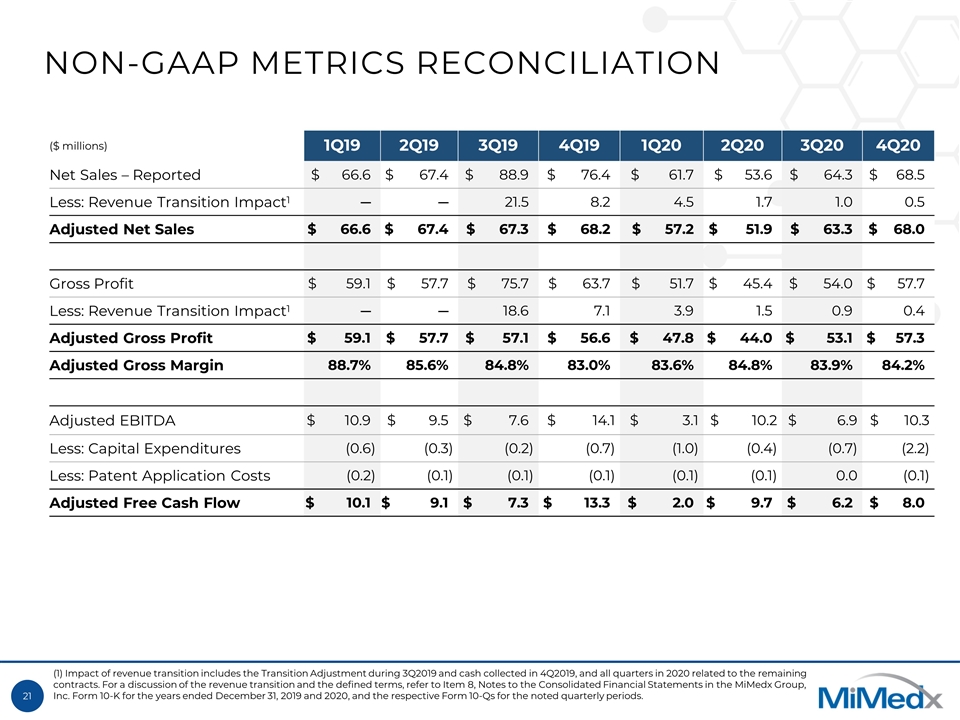
NON-GAAP METRICS RECONCILIATION ($ millions) 1Q19 2Q19 3Q19 4Q19 1Q20 2Q20 3Q20 4Q20 Net Sales – Reported $ 66.6 $ 67.4 $ 88.9 $ 76.4 $ 61.7 $ 53.6 $ 64.3 $ 68.5 Less: Revenue Transition Impact1 ─ ─ 21.5 8.2 4.5 1.7 1.0 0.5 Adjusted Net Sales $ 66.6 $ 67.4 $ 67.3 $ 68.2 $ 57.2 $ 51.9 $ 63.3 $ 68.0 Gross Profit $ 59.1 $ 57.7 $ 75.7 $ 63.7 $ 51.7 $ 45.4 $ 54.0 $ 57.7 Less: Revenue Transition Impact1 ─ ─ 18.6 7.1 3.9 1.5 0.9 0.4 Adjusted Gross Profit $ 59.1 $ 57.7 $ 57.1 $ 56.6 $ 47.8 $ 44.0 $ 53.1 $ 57.3 Adjusted Gross Margin 88.7% 85.6% 84.8% 83.0% 83.6% 84.8% 83.9% 84.2% Adjusted EBITDA $ 10.9 $ 9.5 $ 7.6 $ 14.1 $ 3.1 $ 10.2 $ 6.9 $ 10.3 Less: Capital Expenditures (0.6) (0.3) (0.2) (0.7) (1.0) (0.4) (0.7) (2.2) Less: Patent Application Costs (0.2) (0.1) (0.1) (0.1) (0.1) (0.1) 0.0 (0.1) Adjusted Free Cash Flow $ 10.1 $ 9.1 $ 7.3 $ 13.3 $ 2.0 $ 9.7 $ 6.2 $ 8.0 (1) Impact of revenue transition includes the Transition Adjustment during 3Q2019 and cash collected in 4Q2019, and all quarters in 2020 related to the remaining contracts. For a discussion of the revenue transition and the defined terms, refer to Item 8, Notes to the Consolidated Financial Statements in the MiMedx Group, Inc. Form 10-K for the years ended December 31, 2019 and 2020, and the respective Form 10-Qs for the noted quarterly periods.
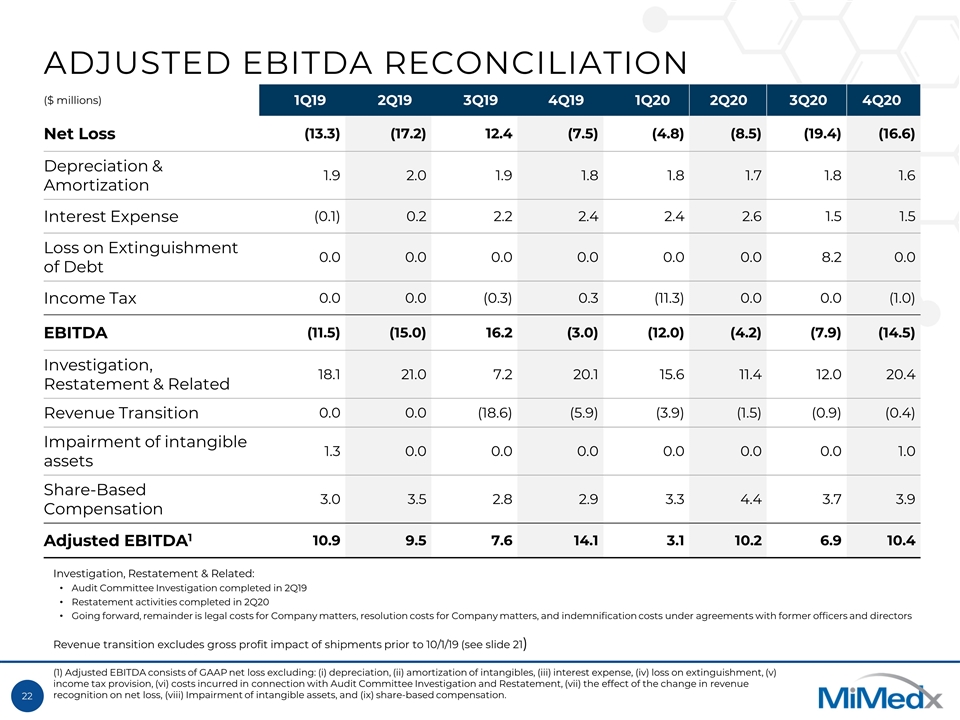
ADJUSTED EBITDA RECONCILIATION ($ millions) 1Q19 2Q19 3Q19 4Q19 1Q20 2Q20 3Q20 4Q20 Net Loss (13.3) (17.2) 12.4 (7.5) (4.8) (8.5) (19.4) (16.6) Depreciation & Amortization 1.9 2.0 1.9 1.8 1.8 1.7 1.8 1.6 Interest Expense (0.1) 0.2 2.2 2.4 2.4 2.6 1.5 1.5 Loss on Extinguishment of Debt 0.0 0.0 0.0 0.0 0.0 0.0 8.2 0.0 Income Tax 0.0 0.0 (0.3) 0.3 (11.3) 0.0 0.0 (1.0) EBITDA (11.5) (15.0) 16.2 (3.0) (12.0) (4.2) (7.9) (14.5) Investigation, Restatement & Related 18.1 21.0 7.2 20.1 15.6 11.4 12.0 20.4 Revenue Transition 0.0 0.0 (18.6) (5.9) (3.9) (1.5) (0.9) (0.4) Impairment of intangible assets 1.3 0.0 0.0 0.0 0.0 0.0 0.0 1.0 Share-Based Compensation 3.0 3.5 2.8 2.9 3.3 4.4 3.7 3.9 Adjusted EBITDA1 10.9 9.5 7.6 14.1 3.1 10.2 6.9 10.4 (1) Adjusted EBITDA consists of GAAP net loss excluding: (i) depreciation, (ii) amortization of intangibles, (iii) interest expense, (iv) loss on extinguishment, (v) income tax provision, (vi) costs incurred in connection with Audit Committee Investigation and Restatement, (vii) the effect of the change in revenue recognition on net loss, (viii) Impairment of intangible assets, and (ix) share-based compensation. Investigation, Restatement & Related: Audit Committee Investigation completed in 2Q19 Restatement activities completed in 2Q20 Going forward, remainder is legal costs for Company matters, resolution costs for Company matters, and indemnification costs under agreements with former officers and directors Revenue transition excludes gross profit impact of shipments prior to 10/1/19 (see slide 21)
