Attached files
Exhibit 99.3
| PRO FORMA VALUATION REPORT STANDARD CONVERSION |
| Blue Foundry Bancorp | Rutherford, New Jersey
HOLDING COMPANY FOR: Blue Foundry Bank | Rutherford, New Jersey |
Dated as of February 5, 2021

1311-A Dolley Madison Boulevard
Suite 2A
McLean, Virginia 22101
703.528.1700
rpfinancial.com
Exhibit 99.3

February 5, 2021
Board of Directors
Blue Foundry, MHC
Blue Foundry Bancorp
Blue Foundry Bank
19 Park Avenue
Rutherford, New Jersey 07070
Members of the Boards of Directors:
At your request, we have completed and hereby provide an independent appraisal (“Appraisal”) of the estimated pro forma market value of the common stock which is to be issued in connection with the mutual-to-stock conversion transaction described below.
This Appraisal is furnished pursuant to the requirements stipulated in the Code of Federal Regulations and has been prepared in accordance with the “Guidelines for Appraisal Reports for the Valuation of Savings and Loan Associations Converting from Mutual to Stock Form of Organization” (the “Valuation Guidelines”) of the Office of Thrift Supervision (“OTS”) and accepted by the Federal Reserve Board (“FRB”), the Office of the Comptroller of the Currency (“OCC”), the Federal Deposit Insurance Corporation (“FDIC”) and the New Jersey Department of Banking and Insurance (the “Department”), and applicable regulatory interpretations thereof.
Description of Plan of Conversion
On January 20, 2021, the Board of Directors of Blue Foundry, MHC (the “MHC”), a mutual holding company that owns all of the outstanding shares of common stock of Blue Foundry Bancorp, a New Jersey corporation (“Blue Foundry – NJ”), and Blue Foundry – NJ adopted the plan of conversion whereby the MHC will convert to stock form. As a result of the conversion, Blue Foundry – NJ, which currently owns all of the issued and outstanding common stock of Blue Foundry Bank, Rutherford, New Jersey (the “Bank”) will be succeeded by a Delaware corporation with the name of Blue Foundry Bancorp (the “Company”). Following the conversion, the MHC will no longer exist. For purposes of this document, the existing consolidated entity will hereinafter be referred to as Blue Foundry Bancorp or the Company.
Blue Foundry Bancorp will offer its common stock in a subscription offering to Eligible Account Holders, Tax-Qualified Plans including Blue Foundry Bank’s employee stock ownership plan (the “ESOP”), Supplemental Eligible Account Holders and Other Depositors, as such terms are defined in the Company’s prospectus for purposes of applicable federal regulatory guidelines governing mutual-to-stock conversions. To the extent shares remain available for purchase after satisfaction of all subscriptions received in the subscription offering, the shares may be offering for sale to members of the general public in a community and
| Washington Headquarters | ||
| 1311-A Dolley Madison Boulevard | Telephone: (703) 528-1700 | |
| Suite 2A | Fax No.: (703) 528-1788 | |
| McLean, VA 22101 | Toll-Free No.: (866) 723-0594 | |
| www.rpfinancial.com | E-Mail: mail@rpfinancial.com |
Boards of Directors
February 5, 2021
Page 2
syndicated community or firm commitment underwritten offerings. A portion of the net proceeds received from the sale of the common stock will be used to purchase all of the then to be issued and outstanding capital stock of Blue Foundry Bank and the balance of the net proceeds will be retained by the Company.
At this time, no other activities are contemplated for the Company other than the ownership of the Bank, a loan to the newly-formed ESOP and reinvestment of the proceeds that are retained by the Company. In the future, Blue Foundry Bancorp may acquire or organize other operating subsidiaries, diversify into other banking-related activities, pay dividends or repurchase its stock, although there are no specific plans to undertake such activities at the present time.
The plan of conversion provides for the establishment of a new charitable foundation (the “Foundation”). The Foundation contribution will total $9.0 million and will be funded with 750,000 shares of Blue Foundry Bancorp common stock and $1.5 million in cash. The purpose of the Foundation is to provide financial support to charitable organizations in the communities in which Blue Foundry Bank operates and to enable those communities to share in the Bank’s long-term growth. The Foundation will be dedicated completely to community activities and the promotion of charitable causes.
RP® Financial, LC.
RP® Financial, LC. (“RP Financial”) is a financial consulting firm serving the financial services industry nationwide that, among other things, specializes in financial valuations and analyses of business enterprises and securities, including the pro forma valuation for savings institutions converting from mutual-to-stock form. The background and experience of RP Financial is detailed in Exhibit V-1. We believe that, except for the fee we will receive for the Appraisal, we are independent of the Company, the Bank, the MHC and the other parties engaged by the Bank or the Company to assist in the stock conversion process.
Valuation Methodology
In preparing our Appraisal, we have reviewed the regulatory applications of the Company, the Bank and the MHC, including the prospectus as filed with the FRB, the FDIC, the Department and the Securities and Exchange Commission (“SEC”). We have conducted a financial analysis of the Company, the Bank and the MHC that has included a review of audited financial information for the fiscal years ended April 30, 2016 through April 30, 2020 and the years ended December 31, 2019 and December 31, 2020, and a review of various unaudited information and internal financial reports through December 31, 2020, and due diligence related discussions with the Company’s management; Crowe LLP, the Company’s independent auditor; Luse Gorman, PC, the Company’s conversion counsel and Keefe Bruyette & Woods, Inc., the Company’s marketing advisor in connection with the stock offering. All assumptions and conclusions set forth in the Appraisal were reached independently from such discussions. In addition, where appropriate, we have considered information based on other available published sources that we believe are reliable. While we believe the information and data gathered from all these sources are reliable, we cannot guarantee the accuracy and completeness of such information.
Boards of Directors
February 5, 2021
Page 3
We have investigated the competitive environment within which Blue Foundry Bancorp operates and have assessed Blue Foundry Bancorp’s relative strengths and weaknesses. We have kept abreast of the changing regulatory and legislative environment for financial institutions and analyzed the potential impact on Blue Foundry Bancorp and the industry as a whole. We have analyzed the potential effects of the stock conversion on Blue Foundry Bancorp’s operating characteristics and financial performance as they relate to the pro forma market value of Blue Foundry Bancorp. We have reviewed the economic and demographic characteristics of the Company’s primary market area. We have compared Blue Foundry Bancorp’s financial performance and condition with selected publicly-traded thrifts in accordance with the Valuation Guidelines, as well as all publicly-traded thrifts and thrift holding companies. We have reviewed the current conditions in the securities markets in general and the market for thrift stocks in particular, including the market for existing thrift issues and initial public offerings by thrifts and thrift holding companies. We have excluded from such analyses thrifts subject to announced or rumored acquisition, and/or institutions that exhibit other unusual characteristics.
The Appraisal is based on Blue Foundry Bancorp’s representation that the information contained in the regulatory applications and additional information furnished to us by Blue Foundry Bancorp and its independent auditor, legal counsel and other authorized agents are truthful, accurate and complete. We did not independently verify the financial statements and other information provided by Blue Foundry Bancorp, or its independent auditor, legal counsel and other authorized agents nor did we independently value the assets or liabilities of Blue Foundry Bancorp. The valuation considers Blue Foundry Bancorp only as a going concern and should not be considered as an indication of Blue Foundry Bancorp’s liquidation value.
Our appraised value is predicated on a continuation of the current operating environment for Blue Foundry Bancorp and for all thrifts and their holding companies. Changes in the local, state and national economy, the legislative and regulatory environment for financial institutions and mutual holding companies, the stock market, interest rates, and other external forces (such as natural disasters or significant world events) may occur from time to time, often with great unpredictability and may materially impact the value of thrift stocks as a whole or the value of Blue Foundry Bancorp’s stock alone. It is our understanding that there are no current plans for selling control of Blue Foundry Bancorp following completion of the conversion. To the extent that such factors can be foreseen, they have been factored into our analysis.
The estimated pro forma market value is defined as the price at which Blue Foundry Bancorp’s common stock, immediately upon completion of the stock offering, would change hands between a willing buyer and a willing seller, neither being under any compulsion to buy or sell and both having reasonable knowledge of relevant facts.
Valuation Conclusion
It is our opinion that, as of February 5, 2021, the estimated aggregate pro forma market value of the shares to be issued immediately following the conversion, including shares to be issued to the Foundation, equaled $217,500,000 at the midpoint, equal to 21,750,000 shares offered at a per share value of $10.00. Pursuant to conversion guidelines, the 15% valuation range indicates a minimum value of $186,000,000 and a maximum value of $249,000,000. Based on the $10.00 per share offering price determined by the Board, this valuation range
Boards of Directors
February 5, 2021
Page 4
equates to total shares outstanding of 18,600,000 at the minimum and 24,900,000 at the maximum. In the event the appraised value is subject to an increase, the aggregate pro forma market value may be increased up to a super maximum value of $285,225,000 without a resolicitation. Based on the $10.00 per share offering price, the super maximum value would result in total shares outstanding of 28,522,500. Based on this valuation range, the offering range is as follows: $178,500,000 at the minimum, $210,000,000 at the midpoint, $241,500,000 at the maximum and $277,725,000 at the super maximum. Based on the $10.00 per share offering price, the number of offering shares is as follows: 17,850,000 at the minimum, 21,000,000 at the midpoint, 24,150,500 at the maximum and 27,722,500 at the super maximum.
Limiting Factors and Considerations
The valuation is not intended, and must not be construed, as a recommendation of any kind as to the advisability of purchasing shares of the common stock. Moreover, because such valuation is determined in accordance with applicable regulatory guidelines and is necessarily based upon estimates and projections of a number of matters, all of which are subject to change from time to time, no assurance can be given that persons who purchase shares of common stock in the conversion offering will thereafter be able to buy or sell such shares at prices related to the foregoing valuation of the estimated pro forma market value thereof. The appraisal reflects only a valuation range as of this date for the pro forma market value of Blue Foundry Bancorp immediately upon issuance of the stock and does not take into account any trading activity with respect to the purchase and sale of common stock in the secondary market on the date of issuance of such securities or at anytime thereafter following the completion of the stock offering.
RP Financial’s valuation was based on the financial condition, operations and shares outstanding of Blue Foundry Bancorp as of December 31, 2020, the date of the financial data included in the prospectus.
RP Financial is not a seller of securities within the meaning of any federal and state securities laws and any report prepared by RP Financial shall not be used as an offer or solicitation with respect to the purchase or sale of any securities. RP Financial maintains a policy which prohibits RP Financial, its principals or employees from purchasing stock of its client institutions.
Boards of Directors
February 5, 2021
Page 5
This valuation will be updated as provided for in the conversion regulations and guidelines. These updates will consider, among other things, any developments or changes in the financial performance and condition of Blue Foundry Bancorp, management policies, and current conditions in the equity markets for thrift shares, both existing issues and new issues. These updates may also consider changes in other external factors which impact value including, but not limited to: various changes in the legislative and regulatory environment for financial institutions, the stock market and the market for thrift stocks, and interest rates. Should any such new developments or changes be material, in our opinion, to the valuation of the shares, appropriate adjustments to the estimated pro forma market value will be made. The reasons for any such adjustments will be explained in the update at the date of the release of the update. The valuation will also be updated at the completion of Blue Foundry Bancorp’s stock offering.
| Respectfully submitted, |
| RP® FINANCIAL, LC. |

|
| William E. Pommerening |
| Chief Executive Officer and |
| Managing Director |
|
Gregory E. Dunn |
| Director |

| RP® Financial, LC. |
TABLE OF CONTENTS | |
| i |
TABLE OF CONTENTS
BLUE FOUNDRY BANCORP
BLUE FOUNDRY BANK
Rutherford, New Jersey
| DESCRIPTION | PAGE NUMBER |
|||
| CHAPTER ONE OVERVIEW AND FINANCIAL ANALYSIS |
||||
| Introduction |
I.1 | |||
| Plan of Conversion |
I.1 | |||
| Strategic Overview |
I.2 | |||
| Balance Sheet Trends |
I.5 | |||
| Income and Expense Trends |
I.8 | |||
| Interest Rate Risk Management |
I.12 | |||
| Lending Activities and Strategy |
I.13 | |||
| Asset Quality |
I.15 | |||
| Funding Composition and Strategy |
I.15 | |||
| Subsidiaries |
I.16 | |||
| Legal Proceedings |
I.16 | |||
| CHAPTER TWO MARKET AREA ANALYSIS |
||||
| Introduction |
II.1 | |||
| National Economic Factors |
II.1 | |||
| Market Area Demographics |
II.5 | |||
| Regional Economy |
II.7 | |||
| Unemployment Trends |
II.8 | |||
| Market Area Deposit Characteristics and Competition |
II.9 | |||
| CHAPTER THREE PEER GROUP ANALYSIS |
||||
| Peer Group Selection |
III.1 | |||
| Financial Condition |
III.5 | |||
| Income and Expense Components |
III.8 | |||
| Loan Composition |
III.11 | |||
| Interest Rate Risk |
III.11 | |||
| Credit Risk |
III.14 | |||
| Summary |
III.14 | |||
| RP® Financial, LC. |
TABLE OF CONTENTS | |
| ii |
TABLE OF CONTENTS
BLUE FOUNDRY BANCORP
BLUE FOUNDRY BANK
Rutherford, New Jersey
(continued)
| DESCRIPTION |
PAGE NUMBER |
|||
| CHAPTER FOUR VALUATION ANALYSIS |
||||
| Introduction |
IV.1 | |||
| Appraisal Guidelines |
IV.1 | |||
| RP Financial Approach to the Valuation |
IV.1 | |||
| Valuation Analysis |
IV.2 | |||
| 1. Financial Condition |
IV.3 | |||
| 2. Profitability, Growth and Viability of Earnings |
IV.4 | |||
| 3. Asset Growth |
IV.6 | |||
| 4. Primary Market Area |
IV.6 | |||
| 5. Dividends |
IV.7 | |||
| 6. Liquidity of the Shares |
IV.8 | |||
| 7. Marketing of the Issue |
IV.8 | |||
| A. The Public Market |
IV.9 | |||
| B. The New Issue Market |
IV.14 | |||
| C. The Acquisition Market |
IV.16 | |||
| 8. Management |
IV.16 | |||
| 9. Effect of Government Regulation and Regulatory Reform |
IV.17 | |||
| Summary of Adjustments |
IV.17 | |||
| Valuation Approaches |
IV.17 | |||
| 1. Price-to-Earnings (“P/E”) |
IV.19 | |||
| 2. Price-to-Book (“P/B”) |
IV.19 | |||
| 3. Price-to-Assets (“P/A”) |
IV.21 | |||
| Comparison to Recent Offerings |
IV.21 | |||
| Valuation Conclusion |
IV.22 | |||
| RP® Financial, LC. |
LIST OF TABLES | |
| iii |
LIST OF TABLES
BLUE FOUNDRY BANCORP
BLUE FOUNDRY BANK
Rutherford, New Jersey
| TABLE |
DESCRIPTION |
PAGE | ||||
| 1.1 | Historical Balance Sheet Data | I.6 | ||||
| 1.2 | Historical Income Statements | I.9 | ||||
| 2.1 | Summary Demographic Data | II.6 | ||||
| 2.2 | Primary Market Area Employment Sectors | II.7 | ||||
| 2.3 | Largest Employers in Local Market Area | II.8 | ||||
| 2.4 | Unemployment Trends | II.9 | ||||
| 2.5 | Deposit Summary | II.10 | ||||
| 2.6 | Market Area Deposit Competitors | II.11 | ||||
| 3.1 | Peer Group of Publicly-Traded Thrifts | III.3 | ||||
| 3.2 | Balance Sheet Composition and Growth Rates | III.6 | ||||
| 3.3 | Income as a % of Average Assets and Yields, Costs, Spreads | III.9 | ||||
| 3.4 | Loan Portfolio Composition and Related Information | III.12 | ||||
| 3.5 | Interest Rate Risk Measures and Net Interest Income Volatility | III.13 | ||||
| 3.6 | Credit Risk Measures and Related Information | III.15 | ||||
| 4.1 | Market Area Unemployment Rates | IV.7 | ||||
| 4.2 | Pricing Characteristics and After-Market Trends | IV.15 | ||||
| 4.3 | Market Pricing Versus Peer Group | IV.20 | ||||
| RP® Financial, LC. | OVERVIEW AND FINANCIAL ANALYSIS | |
| I.1 |
I. OVERVIEW AND FINANCIAL ANALYSIS
Introduction
Blue Foundry Bank (the “Bank”), chartered in 1939, is a New Jersey chartered stock savings bank headquartered in Rutherford, New Jersey. In 1999, the Bank reorganized into the mutual holding company structure, forming Blue Foundry, MHC, a New Jersey mutual holding company (the “MHC”). The MHC owns 100% of the outstanding common stock of Blue Foundry Bancorp, a New Jersey corporation (“Bancorp”). The Bank is the wholly owned subsidiary of Bancorp. The Bank serves northern New Jersey through the administrative headquarters office and 16 full service branch offices. A map of the Bank’s office locations is provided in Exhibit I-1. The Bank is a member of the Federal Home Loan Bank (“FHLB”) system and its deposits are insured up to the maximum allowable amount by the Federal Deposit Insurance Corporation (“FDIC”). As of December 31, 2020, Bancorp had consolidated total assets of $1.943 billion, total deposits of $1.356 billion and total equity of $205.6 million equal to 10.58% of total assets. The MHC’s audited financial statements are included by reference as Exhibit I-2.
Plan of Conversion
On January 20, 2021, the Board of Directors of the MHC adopted a plan of conversion, incorporated herein by reference, whereby the MHC will convert to stock form. As a result of the conversion, Bancorp, which currently owns all of the issued and outstanding common stock of the Bank will be succeeded by Blue Foundry Bancorp, a newly formed Delaware stock holding company (“Blue Foundry Bancorp” or the “Company”). Following the conversion, the MHC will no longer exist. For purposes of this document, the existing consolidated entity will hereinafter also be referred to as Blue Foundry Bancorp or the Company.
Blue Foundry Bancorp will offer its common stock in a subscription offering to Eligible Account Holders, Tax-Qualified Employee Plans including the Bank’s employee stock ownership plan (the “ESOP”), Supplemental Eligible Account Holders and Other Depositors, as such terms are defined for purposes of applicable federal regulatory guidelines governing mutual-to-stock conversions. To the extent that shares remain available for purchase after satisfaction of all subscriptions received in the subscription offering, the shares may be offered for sale to members of the general public in a community offering and a syndicated community
| RP® Financial, LC. | OVERVIEW AND FINANCIAL ANALYSIS | |
| I.2 |
offering or a firm commitment underwritten offering. A portion of the net proceeds received from the sale of the common stock will be used to purchase all of the then to be issued and outstanding capital stock of the Bank and the balance of the net proceeds will be retained by the Company.
At this time, following the conversion no other activities are contemplated for the Company other than the ownership of the Bank, funding a loan to the newly-formed ESOP and reinvestment of the proceeds that are retained by the Company. In the future, Blue Foundry Bancorp may acquire or organize other operating subsidiaries, diversify into other banking-related activities, pay dividends or repurchase its stock, although there are no specific plans to undertake such activities at the present time.
The plan of conversion provides for the establishment of a new charitable foundation (the “Foundation”). The Foundation contribution will total $9.0 million and will be funded with 750,000 shares of Blue Foundry Bancorp common stock and $1.5 million in cash. The purpose of the Foundation is to provide financial support to charitable organizations in the communities in which the Bank operates and to enable those communities to share in the Bank’s long-term growth. The Foundation will be dedicated completely to community activities and the promotion of charitable causes.
Strategic Overview
Blue Foundry Bancorp maintains a community banking emphasis, with a primary strategic objective of meeting the borrowing and savings needs of its local customer base. The Company is pursuing a strategy of strengthening its community bank franchise dedicated to meeting the banking needs of business and retail customers in the communities that are served by the Company. To facilitate implementation of new strategic initiatives, the Company added senior management including the appointment of a new President and Chief Executive Officer in April 2018. Pursuant to implementation of new strategic initiatives, the Company invested in infrastructure, personnel and platforms. These investments included modernizing the Company’s technology architecture for purposes of facilitating innovation and promotion of new products, services and technology.
| RP® Financial, LC. | OVERVIEW AND FINANCIAL ANALYSIS | |
| I.3 |
Growth strategies are emphasizing increased lending diversification that is primarily targeting growth of commercial real estate and commercial business loans. The Company’s objective is to fund asset growth primarily through deposit growth, emphasizing growth of lower cost core deposits. Core deposit growth is expected to be in part facilitated by growth of commercial lending relationships, pursuant to which the Company is seeking to establish a full service banking relationship with its commercial loan customers through offering a full range of commercial loan products that can be packaged with lower cost commercial deposit products.
Investments serve as a supplement to the Company’s lending activities and the investment portfolio is considered to be indicative of a low risk investment strategy. Mortgage-backed securities guaranteed by government sponsored enterprises (“GSEs”) constitute the largest portion of the Company’s investment portfolio, followed by corporate bonds. Other investments held by the Company consist of U.S. Treasury securities, U.S. Government agency obligations, municipal bonds and collateralized loan obligations.
Deposits have consistently served as the primary funding source for the Company, supplemented with borrowings as an alternative funding source for purposes of managing funding costs and interest rate risk. Certificates of deposit (“CDs”) constitute the largest portion of the Company’s deposit base. Borrowings currently held by the Company consist of FHLB advances.
Blue Foundry Bancorp’s earnings base is largely dependent upon net interest income and operating expense levels. The Company has experienced net interest margin compression in recent years, as the result of a decline in yield earned on interest-earning assets and an increase in the cost of funds paid on interest-bearing liabilities. Operating expense ratios have been maintained at relatively low levels as a percent of assets, although operating expense ratios have increased in recent years as the Company has invested in infrastructure to facilitate implementation of its strategic plan. Historically, non-interest operating income has been a limited contributor to earnings, reflecting the Company’s traditional thrift operating strategy that has provided for only a modest earnings contribution from fee-based products and services. Growth of non-operating income is a strategic initiative for the Company, pursuant to which the Company is seeking to build full service banking relationships with its retail and commercial customers that will generate increased revenues derived from fee-based products and services. The amount of loan loss provisions established has increased in recent periods, which has been largely related to an increase in non-performing loans and for 2020 to also address the continued economic uncertainty resulting from the Covid-19 pandemic. With the exception of 2020, non-operating income and losses have not been a significant factor in the Company’s earnings. In 2020 the Company recorded a significant non-operating loss, which was largely due to goodwill impairment and the write-down of a Bank office property that was reclassified as held for sale.
| RP® Financial, LC. | OVERVIEW AND FINANCIAL ANALYSIS | |
| I.4 |
The post-offering business plan of the Company is expected to continue to focus on implementing strategic initiatives to develop and grow a full service community banking franchise. Accordingly, Blue Foundry Bancorp will continue to be an independent full service community bank, with a commitment to meeting the retail and commercial banking needs of individuals and businesses in northern New Jersey.
A key component of the Company’s business plan is to complete a public stock offering. The Company’s strengthened capital position will increase operating flexibility and facilitate implementation of planned growth strategies. Additionally, in the near term, the stock offering will serve to substantially increase regulator capital and liquidity and, thereby, facilitate building and maintaining loss reserves while also providing the Company with greater flexibility to work with borrowers affected by the Covid-19-induced recession. The Company’s strengthened capital position will also provide more of a cushion against potential credit quality related losses in future periods. Blue Foundry Bancorp’s higher capital position resulting from the infusion of stock proceeds will also serve to reduce interest rate risk, particularly through enhancing the Company’s interest-earning assets/interest-bearing liabilities (“IEA/IBL”) ratio. The additional funds realized from the stock offering will serve to raise the level of interest-earning assets funded with equity and, thereby, reduce the ratio of interest-earning assets funded with interest-bearing liabilities as the balance of interest-bearing liabilities will initially remain relatively unchanged following the conversion, which may facilitate a reduction in Blue Foundry Bancorp’s funding costs. Blue Foundry Bancorp’s strengthened capital position will also position the Company to pursue expansion opportunities. Such expansion would most likely occur through the establishment or acquisition of additional banking offices that would increase market penetration in the markets currently served by the Company or to gain a market presence into nearby complementary markets. The Company will also be bettered position to pursue growth through acquisition of other financial service providers following the stock offering, given its strengthened capital position and ability to offer stock as consideration. At this time, the Company has no specific plans for expansion through an acquisition, but will continue to evaluate expansion through acquisition as such opportunities arise. The projected uses of proceeds are highlighted below.
| RP® Financial, LC. | OVERVIEW AND FINANCIAL ANALYSIS | |
| I.5 |
| • | Blue Foundry Bancorp. The Company is expected to retain up to 50% of the net offering proceeds. At present, funds at the Company level, net of the loan to the ESOP and the cash contribution to the Foundation, are expected to be invested into a deposit at the Bank. Over time, the funds may be utilized for various corporate purposes, possibly including acquisitions, infusing additional equity into the Bank, repurchases of common stock and the payment of cash dividends. |
| • | Blue Foundry Bank. Approximately 50% of the net stock proceeds will be infused into the Bank in exchange for all of the Bank’s stock. Cash proceeds (i.e., net proceeds less deposits withdrawn to fund stock purchases) infused into the Bank are anticipated to become part of general operating funds and are expected to be primarily utilized to fund loan growth over time. |
Overall, it is the Company’s objective to pursue growth that will serve to increase returns, while, at the same time, growth will not be pursued that could potentially compromise the overall risk associated with Blue Foundry Bancorp’s operations.
Balance Sheet Trends
Table 1.1 shows the Company’s historical balance sheet data from fiscal yearend April 30, 2016 through December 31, 2020. The Company switched to a December 31 fiscal yearend in 2020. From fiscal yearend 2016 through December 31, 2020, Blue Foundry Bancorp’s assets increased at a 4.99% annual rate. Asset growth was funded by a combination of deposit growth and increased utilization of borrowings. A summary of Blue Foundry Bancorp’s key operating ratios over the past six fiscal years is presented in Exhibit I-3.
Blue Foundry Bancorp’s loans receivable portfolio decreased at a 0.15% annual rate from fiscal yearend 2016 through December 31, 2020, which consisted of loan growth from fiscal yearend 2016 through fiscal yearend 218 followed by loan shrinkage in 2019 and 2020. The Company’s loan shrinkage during a period of balance sheet growth provided for a reduction in the loans-to-assets ratio from 82.42% at fiscal yearend 2016 to 65.23% at December 31, 2020. Loan portfolio shrinkage in 2019 and 2020 was primarily due to the accelerated paydown of the 1-4 family loan portfolio, as homeowners took advantage of historically low interest rates to refinance their mortgages.
Trends in the Company’s loan portfolio composition over the past two years show that the concentration of 1-4 family permanent mortgage loans comprising total loans decreased from 54.39% at yearend 2019 to 48.27% at yearend 2020. Comparatively, commercial real estate/multi-family loans, which constitute the primary type of lending diversification for the Company, increased from 41.62% of total loans at yearend 2019 to 43.84% of total loans at yearend 2020. Other areas of lending diversification for the Company have been fairly limited, consisting primarily of commercial business loans, construction/land loans and home equity
| RP® Financial, LC. | OVERVIEW AND FINANCIAL ANALYSIS | |
| I.6 |
Table 1.1
Blue Foundry Bancorp
Historical Balance Sheet Data
| At April 30, |
At December 31, | 4/30/16- 12/31/20 Annual. Growth Rate |
||||||||||||||||||||||||||||||||||||||||||||||||||||||||||
| 2016 | 2017 | 2018 | 2019 | 2020 | 2019 | 2020 | ||||||||||||||||||||||||||||||||||||||||||||||||||||||
| Amount | Pct(1) | Amount | Pct(1) | Amount | Pct(1) | Amount | Pct(1) | Amount | Pct(1) | Amount | Pct(1) | Amount | Pct(1) | Pct | ||||||||||||||||||||||||||||||||||||||||||||||
| ($000) | (%) | ($000) | (%) | ($000) | (%) | ($000) | (%) | ($000) | (%) | ($000) | (%) | ($000) | (%) | (%) | ||||||||||||||||||||||||||||||||||||||||||||||
| Total Amount of: |
||||||||||||||||||||||||||||||||||||||||||||||||||||||||||||
| Assets |
$1,547,767 | 100.00 | % | $1,684,055 | 100.00 | % | $1,695,988 | 100.00 | % | $1,702,549 | 100.00 | % | $1,930,737 | 100.00 | % | $1,854,144 | 100.00 | % | $1,942,546 | 100.00 | % | 4.99 | % | |||||||||||||||||||||||||||||||||||||
| Cash and cash equivalents |
25,590 | 1.65 | % | 29,390 | 1.75 | % | 30,851 | 1.82 | % | 36,122 | 2.12 | % | 147,552 | 7.64 | % | 124,034 | 6.69 | % | 316,445 | 16.29 | % | 71.41 | % | |||||||||||||||||||||||||||||||||||||
| Equity securities |
— | 0.00 | % | — | 0.00 | % | — | 0.00 | % | 4,023 | 0.24 | % | — | 0.00 | % | 4,163 | 0.22 | % | — | 0.00 | % | NM | ||||||||||||||||||||||||||||||||||||||
| Investment securities |
163,088 | 10.54 | % | 140,270 | 8.33 | % | 134,851 | 7.95 | % | 121,943 | 7.16 | % | 276,817 | 14.34 | % | 213,918 | 11.54 | % | 251,592 | 12.95 | % | 9.73 | % | |||||||||||||||||||||||||||||||||||||
| Assets held for sale |
— | 0.00 | % | — | 0.00 | % | — | 0.00 | % | — | 0.00 | % | 5,695 | 0.29 | % | — | 0.00 | % | 5,295 | 0.27 | % | NM | ||||||||||||||||||||||||||||||||||||||
| Loans receivable, net |
1,275,740 | 82.42 | % | 1,428,956 | 84.85 | % | 1,446,221 | 85.27 | % | 1,459,315 | 85.71 | % | 1,422,970 | 73.70 | % | 1,409,776 | 76.03 | % | 1,267,114 | 65.23 | % | -0.15 | % | |||||||||||||||||||||||||||||||||||||
| FHLB stock |
8,529 | 0.55 | % | 15,342 | 0.91 | % | 9,079 | 0.54 | % | 11,392 | 0.67 | % | 18,795 | 0.97 | % | 15,411 | 0.83 | % | 16,860 | 0.87 | % | 15.72 | % | |||||||||||||||||||||||||||||||||||||
| Bank-owned life insurance |
— | 0.00 | % | — | 0.00 | % | — | 0.00 | % | 5,757 | 0.34 | % | 20,817 | 1.08 | % | 20,871 | 1.13 | % | 21,186 | 1.09 | % | NM | ||||||||||||||||||||||||||||||||||||||
| Goodwill and other intangibles |
15,460 | 1.00 | % | 15,460 | 0.92 | % | 15,460 | 0.91 | % | 15,460 | 0.91 | % | — | 0.00 | % | $20,871 | 1.13 | % | — | 0.00 | % | -100.00 | % | |||||||||||||||||||||||||||||||||||||
| Deposits |
$1,167,485 | 75.43 | % | $1,268,259 | 75.31 | % | $1,288,661 | 75.98 | % | $1,240,050 | 72.83 | % | $1,325,021 | 68.63 | % | $1,295,048 | 69.85 | % | $1,356,184 | 69.81 | % | 3.26 | % | |||||||||||||||||||||||||||||||||||||
| Borrowings |
147,000 | 9.50 | % | 175,000 | 10.39 | % | 162,000 | 9.55 | % | 207,800 | 12.21 | % | 372,400 | 19.29 | % | 296,900 | 16.01 | % | 329,400 | 16.96 | % | 18.87 | % | |||||||||||||||||||||||||||||||||||||
| Equity |
$214,725 | 13.87 | % | $220,630 | 13.10 | % | $225,408 | 13.29 | % | $239,359 | 14.06 | % | $206,769 | 10.71 | % | $237,621 | 12.82 | % | $205,601 | 10.58 | % | -0.93 | % | |||||||||||||||||||||||||||||||||||||
| Tangible equity |
$199,265 | 12.87 | % | $205,170 | 12.18 | % | $209,948 | 12.38 | % | $223,899 | 13.15 | % | $206,769 | 10.71 | % | $216,750 | 11.69 | % | $205,601 | 10.58 | % | 0.67 | % | |||||||||||||||||||||||||||||||||||||
| Loans/Deposits |
109.27 | % | 112.67 | % | 112.23 | % | 117.68 | % | 107.39 | % | 108.86 | % | 93.43 | % | ||||||||||||||||||||||||||||||||||||||||||||||
| (1) | Ratios are as a percent of ending assets. |
Sources: Blue Foundry Bancorp’s prospectus tables, audited and unaudited financial statements and RP Financial calculations.
| RP® Financial, LC. | OVERVIEW AND FINANCIAL ANALYSIS | |
| I.7 |
loans and lines of credit. As of December 31, 2020, commercial business loans equaled 4.27% of total loans, construction/land loans equaled 2.66% of total loans and home equity loans and lines of credit equaled 1.88% of total loans. The Company also held a nominal balance of consumer loans at yearend 2020.
The intent of the Company’s investment policy is to provide adequate liquidity and to generate a favorable return within the context of supporting Blue Foundry Bancorp’s overall credit and interest rate risk objectives. It is anticipated that proceeds retained at the holding company level will primarily be invested into short-term liquid funds held as a deposit at the Bank. Over the past six fiscal years, the Company’s level of cash and investment securities (inclusive of FHLB/FNBB stock) ranged from a low of 10.19% at fiscal yearend 2018 to a high of 30.11% at yearend 2020. Mortgage-backed securities totaling $130.8 million comprised the most significant component of the Company’s investment portfolio at December 31, 2020. Other investments held by the Company at December 31, 2020, consisted of corporate bonds ($59.3 million), municipal bonds ($24.8 million), U.S. Government agency obligations ($19.7 million), U.S. Treasury securities ($10.0 million) and collateralized loan obligations ($7.0 million). As of December 31, 2020, investments maintained as available for sale and held to maturity totaled $244.6 million and $7.0 million, respectively. Investments maintained as available for sale had a net unrealized gain of $5.7 million at December 31, 2020. As of December 31, 2020, the Company also held $316.4 million of cash and cash equivalents and $16.9 million of FHLB stock. Exhibit I-4 provides detail of the Company’s investment portfolio.
The Company also maintains an investment in bank-owned life insurance (“BOLI”) policies, which cover the lives of certain key individuals. The purpose of the investment is to provide funding for the benefit plans of the covered individuals. The life insurance policies earn tax-exempt income through cash value accumulation and death proceeds. As of December 31, 2020, the cash surrender value of the Company’s BOLI equaled $21.2 million.
Blue Foundry Bancorp’s funding needs have been addressed through a combination of deposits, borrowings and internal cash flows. From fiscal yearend 2016 through yearend 2020, the Company’s deposits increased at a 3.26% annual rate. Following a decline in deposits during fiscal year 2019, deposits increased in 2020. Recent deposit growth trends reflect that deposit growth has been driven by growth of core deposits, with interest-bearing checking account deposits accounting for the largest portion of the core deposit growth. Core deposits comprised 47.10% of total deposits at December 31, 2020, versus 39.17% of total deposits at December 31, 2019.
| RP® Financial, LC. | OVERVIEW AND FINANCIAL ANALYSIS | |
| I.8 |
Borrowings serve as an alternative funding source for the Company to address funding needs for growth and to support management of deposit costs and interest rate risk. Over the period covered in Table 1.1, borrowings ranged from a low of $147.0 million or 9.50% of assets at fiscal yearend 2016 to a high of $329.4 million or 16.96% of assets at yearend 2020. Borrowings held by the Company at December 31, 2020 consisted entirely of FHLB advances.
The Company’s equity decreased at a 0.93% annual rate from fiscal yearend 2016 to yearend 2020, as retention of earnings during fiscal years ended 2017 through 2019 was more than offset by the net loss reported for 2020. Asset growth combined with a slight decline in equity provided for a decrease in the Company’s equity-to-assets ratio from 13.87% at fiscal yearend 2016 to 10.58% at December 31, 2020. The Company recorded a goodwill impairment charge in the first quarter of 2020, which eliminated goodwill from its balance sheet and, therefore, as of December 31, 2020, the Company’s equity equaled tangible equity. The Bank maintained capital surpluses relative to all of its regulatory capital requirements at December 31, 2020. The addition of stock proceeds will serve to strengthen the Company’s capital position, as well as support growth opportunities. At the same time, the significant increase in Blue Foundry Bancorp’s pro forma capital position will initially depress its return on equity (“ROE”).
Income and Expense Trends
Table 1.2 shows the Company’s historical income statements for the past six fiscal years. The Company’s reported earnings ranged from a net loss of $31.5 million or 1.63% average assets during 2020 to net income of $10.5 million or 0.62% of average assets during 2019. The net loss reported for 2020 was largely due to non-operating losses, which consisted of a charge for goodwill impairment, the write-down of a Bank office property that was reclassified as held for sale and the write-down of real estate owned (“REO”). Net interest income and operating expenses represent the primary components of the Company’s earnings. Non-interest operating income has been somewhat of a limited source of earnings for the Company. Loan loss provisions have become a more significant earnings factor during the past two years, particularly in 2020 as the Company increased loan loss provisions to address the ongoing economic uncertainty resulting from the Covid-19 pandemic. Except for 2020, non-
| RP® Financial, LC. | OVERVIEW AND FINANCIAL ANALYSIS | |
| I.9 |
Table 1.2
Blue Foundry Bancorp
Historical Income Statements
| For the Year Ended April 30, | For the Year Ended December 31, | |||||||||||||||||||||||||||||||||||||||||||||||||||||||
| 2016 | 2017 | 2018 | 2019 | 2020 | 2019 | 2020 | ||||||||||||||||||||||||||||||||||||||||||||||||||
| Amount | Pct(1) | Amount | Pct(1) | Amount | Pct(1) | Amount | Pct(1) | Amount | Pct(1) | Amount | Pct(1) | Amount | Pct(1) | |||||||||||||||||||||||||||||||||||||||||||
| ($000) | (%) | ($000) | (%) | ($000) | (%) | ($000) | (%) | ($000) | (%) | ($000) | (%) | ($000) | (%) | |||||||||||||||||||||||||||||||||||||||||||
| Interest income |
$ | 55,539 | 3.67 | % | $ | 58,182 | 3.60 | % | $ | 62,915 | 3.72 | % | $ | 63,783 | 3.75 | % | $ | 65,173 | 3.59 | % | $ | 64,827 | 3.67 | % | $ | 61,625 | 3.19 | % | ||||||||||||||||||||||||||||
| Interest expense |
(11,941 | ) | -0.79 | % | (13,289 | ) | -0.82 | % | (14,905 | ) | -0.88 | % | (17,559 | ) | -1.03 | % | (23,781 | ) | -1.31 | % | (21,906 | ) | -1.24 | % | (22,557 | ) | -1.17 | % | ||||||||||||||||||||||||||||
|
|
|
|
|
|
|
|
|
|
|
|
|
|
|
|
|
|
|
|
|
|
|
|
|
|
|
|
|
|||||||||||||||||||||||||||||
| Net interest income |
$ | 43,598 | 2.88 | % | $ | 44,893 | 2.78 | % | $ | 48,010 | 2.84 | % | $ | 46,224 | 2.72 | % | $ | 41,392 | 2.28 | % | $ | 42,921 | 2.43 | % | $ | 39,068 | 2.02 | % | ||||||||||||||||||||||||||||
| Provision for loan losses |
(2,266 | ) | -0.15 | % | (1,046 | ) | -0.06 | % | 188 | 0.01 | % | 648 | 0.04 | % | (3,712 | ) | -0.20 | % | (1,265 | ) | -0.07 | % | (2,518 | ) | -0.13 | % | ||||||||||||||||||||||||||||||
|
|
|
|
|
|
|
|
|
|
|
|
|
|
|
|
|
|
|
|
|
|
|
|
|
|
|
|
|
|||||||||||||||||||||||||||||
| Net interest income after provisions |
$ | 41,332 | 2.73 | % | $ | 43,847 | 2.71 | % | $ | 48,198 | 2.85 | % | $ | 46,872 | 2.76 | % | $ | 37,680 | 2.07 | % | $ | 41,656 | 2.36 | % | $ | 36,550 | 1.89 | % | ||||||||||||||||||||||||||||
| Non-interest operating income |
$ | 935 | 0.06 | % | $ | 974 | 0.06 | % | $ | 1,308 | 0.08 | % | $ | 1,590 | 0.09 | % | $ | 2,514 | 0.14 | % | $ | 2,394 | 0.14 | % | $ | 2,528 | 0.13 | % | ||||||||||||||||||||||||||||
| Operating expense |
(33,977 | ) | -2.25 | % | (34,559 | ) | -2.14 | % | (37,180 | ) | -2.20 | % | (34,443 | ) | -2.03 | % | (43,049 | ) | -2.37 | % | (36,956 | ) | -2.09 | % | (48,894 | ) | -2.53 | % | ||||||||||||||||||||||||||||
|
|
|
|
|
|
|
|
|
|
|
|
|
|
|
|
|
|
|
|
|
|
|
|
|
|
|
|
|
|||||||||||||||||||||||||||||
| Net operating income |
$ | 8,290 | 0.55 | % | $ | 10,262 | 0.64 | % | $ | 12,326 | 0.73 | % | $ | 14,019 | 0.83 | % | ($ | 2,855 | ) | -0.16 | % | $ | 7,094 | 0.40 | % | ($ | 9,816 | ) | -0.51 | % | ||||||||||||||||||||||||||
| Non-Operating Income/(Losses) |
||||||||||||||||||||||||||||||||||||||||||||||||||||||||
| Gains (losses) on sales of securities |
$ | 110 | 0.01 | % | $ | 185 | 0.01 | % | ($ | 60 | ) | 0.00 | % | ($ | 97 | ) | -0.01 | % | $ | 226 | 0.01 | % | $ | 227 | 0.01 | % | $ | 68 | 0.00 | % | ||||||||||||||||||||||||||
| Gains (losses) on sale of assets |
736 | 0.05 | % | 176 | 0.01 | % | 83 | 0.00 | % | 38 | 0.00 | % | (12,765 | ) | -0.70 | % | — | 0.00 | % | (12,774 | ) | -0.66 | % | |||||||||||||||||||||||||||||||||
| REO income (loss) |
198 | 0.01 | % | (184 | ) | -0.01 | % | 5 | 0.00 | % | 565 | 0.03 | % | (1,202 | ) | -0.07 | % | — | 0.00 | % | (1,390 | ) | -0.07 | % | ||||||||||||||||||||||||||||||||
| Goodwill impairment |
— | 0.00 | % | — | 0.00 | % | — | 0.00 | % | — | 0.00 | % | (15,460 | ) | -0.85 | % | — | 0.00 | % | (15,460 | ) | -0.80 | % | |||||||||||||||||||||||||||||||||
|
|
|
|
|
|
|
|
|
|
|
|
|
|
|
|
|
|
|
|||||||||||||||||||||||||||||||||||||||
| Net non-operating income(loss) |
$ | 1,044 | 0.07 | % | $ | 177 | 0.01 | % | $ | 28 | 0.00 | % | $ | 506 | 0.03 | % | ($ | 29,201 | ) | -1.61 | % | $ | 227 | 0.01 | % | ($ | 29,556 | ) | -1.53 | % | ||||||||||||||||||||||||||
| Net income before tax |
$ | 9,334 | 0.62 | % | $ | 10,439 | 0.65 | % | $ | 12,354 | 0.73 | % | $ | 14,525 | 0.85 | % | ($ | 32,056 | ) | -1.76 | % | $ | 7,321 | 0.41 | % | ($ | 39,372 | ) | -2.04 | % | ||||||||||||||||||||||||||
| Income tax provision |
(3,180 | ) | -0.21 | % | (3,572 | ) | -0.22 | % | (6,094 | ) | -0.36 | % | (4,057 | ) | -0.24 | % | 5,173 | 0.28 | % | (1,839 | ) | -0.10 | % | 7,866 | 0.41 | % | ||||||||||||||||||||||||||||||
|
|
|
|
|
|
|
|
|
|
|
|
|
|
|
|
|
|
|
|
|
|
|
|
|
|
|
|
|
|||||||||||||||||||||||||||||
| Net income (loss) |
$ | 6,154 | 0.41 | % | $ | 6,867 | 0.42 | % | $ | 6,260 | 0.37 | % | $ | 10,468 | 0.62 | % | ($ | 26,883 | ) | -1.48 | % | $ | 5,482 | 0.31 | % | ($ | 31,506 | ) | -1.63 | % | ||||||||||||||||||||||||||
| Adjusted Earnings |
||||||||||||||||||||||||||||||||||||||||||||||||||||||||
| Net income |
$ | 6,154 | 0.41 | % | $ | 6,867 | 0.42 | % | $ | 6,260 | 0.37 | % | $ | 10,468 | 0.62 | % | ($ | 26,883 | ) | -1.48 | % | $ | 5,482 | 0.31 | % | ($ | 31,506 | ) | -1.63 | % | ||||||||||||||||||||||||||
| Add(Deduct): Non-operating income |
(1,044 | ) | -0.07 | % | (177 | ) | -0.01 | % | (28 | ) | 0.00 | % | (506 | ) | -0.03 | % | 29,201 | 1.61 | % | (227 | ) | -0.01 | % | 29,556 | 1.53 | % | ||||||||||||||||||||||||||||||
| Tax effect (2) |
418 | 0.03 | % | 71 | 0.00 | % | 9 | 0.00 | % | 157 | 0.01 | % | (9,052 | ) | -0.50 | % | 70 | 0.00 | % | (9,162 | ) | -0.47 | % | |||||||||||||||||||||||||||||||||
|
|
|
|
|
|
|
|
|
|
|
|
|
|
|
|
|
|
|
|
|
|
|
|
|
|
|
|
|
|||||||||||||||||||||||||||||
| Adjusted earnings |
$ | 5,528 | 0.37 | % | $ | 6,761 | 0.42 | % | $ | 6,241 | 0.37 | % | $ | 10,119 | 0.60 | % | ($ | 6,734 | ) | -0.37 | % | $ | 5,325 | 0.30 | % | ($ | 11,112 | ) | -0.57 | % | ||||||||||||||||||||||||||
| Expense Coverage Ratio (3) |
1.28x | 1.30x | 1.29x | 1.34x | 0.96x | 1.16x | 0.80x | |||||||||||||||||||||||||||||||||||||||||||||||||
| Efficiency Ratio (4) |
76.53 | % | 75.35 | % | 75.34 | % | 72.24 | % | 97.93 | % | 81.32 | % | 117.67 | % | ||||||||||||||||||||||||||||||||||||||||||
| (1) | Ratios are as a percent of average assets. |
| (2) | Assumes a 40.0% effective tax rate for 2016 and 2017 and a 26.0% effective tax rate for 2018 through December 31, 2020. |
| (3) | Expense coverage ratio calculated as net interest income before provisions for loan losses divided by operating expenses. |
| (4) | Efficiency ratio calculated as operating expenses divided by the sum of net interest income before provisions for loan losses plus non-interest operating income. |
Sources: Blue Foundry Bancorp’s prospectus tables, audited & unaudited financial statements and RP Financial calculations.
| RP® Financial, LC. | OVERVIEW AND FINANCIAL ANALYSIS | |
| I.10 |
operating income and losses have not been a significant factor in the Company’s earnings over the past six fiscal years.
During the period covered in Table 1.2, the Company’s net interest income to average assets ratio ranged from a low of 2.02% during 2020 to a high of 2.88% during fiscal year 2016. The decrease in the Company’s net interest income ratio from fiscal year 2016 through fiscal year 2019 was largely due to interest rate spread compression that resulted from a more significant increase in the cost of interest-bearing liabilities relative to the yield earned on interest-earning assets. The more significant increase in the interest expense ratio was mostly attributable to a shift in the Company’s funding composition towards a higher concentration of higher costing borrowings relative to lower costing deposits. Comparatively, the decline in the Company’s net interest income ratio during 2020 was due to interest rate spread compression that resulted from a more significant decrease in the yield on interest-earnings assets relative to the decrease in the cost of interest-bearing liabilities. During 2020, the decline in yield earned on interest-earning assets reflects a shift in the Company’s interest-earning asset composition towards a higher concentration of comparatively lower yielding investments and interest-earning deposits. The Company’s net interest rate spreads and yields and costs for the past six fiscal years are set forth in Exhibits I-3 and I-5.
Non-interest operating income has been somewhat of a limited contributor to the Company’s earnings over the past six fiscal years, reflecting the Company’s limited diversification into products and services that generate non-interest operating income. For the period covered in Table 1.2, sources of non-interest operating income ranged from a low of $935,000 or 0.06% of average assets during fiscal year 2016 to a high of $2.5 million or 0.13% of average assets during 2020. Fees and service charges and income earned on BOLI constitute the major sources of the Company’s non-interest operating revenues.
Operating expenses represent the other major component of the Company’s earnings, ranging from a low of $34.0 million or 2.25% of average assets during fiscal year 2016 to a high of $48.9 million or 2.53% of average assets during 2020. The increase in the Company’s operating expenses during 2020 includes investment in infrastructure to facilitate implementation of the Company’s strategic plan. Upward pressure will be placed on the Company’s operating expense ratio following the stock offering, due to expenses associated with operating as a publicly-traded company, including expenses related to the stock benefit plans. At the same time, the increase in capital realized from the stock offering will increase the Company’s capacity to leverage operating expenses through implementation of current growth strategies.
| RP® Financial, LC. | OVERVIEW AND FINANCIAL ANALYSIS | |
| I.11 |
Overall, the general trends in the Company’s net interest income and operating expense ratios since fiscal year 2016 reflect a decrease in core earnings, as indicated by the Company’s expense coverage ratios (net interest income divided by operating expenses). Blue Foundry Bancorp’s expense coverage ratio equaled 1.28 times during fiscal year 2016, versus a ratio of 0.80 times during 2020. The decrease in the expense coverage ratio since fiscal year 2016 was the result of a decrease in the net interest income ratio and an increase in the operating expense ratio. Similarly, Blue Foundry Bancorp’s efficiency ratio (operating expenses as a percent of the sum of net interest income and other operating income) of 76.53% during fiscal year 2016 was more favorable compared to its efficiency ratio of 117.67% during 2020.
Over the past six fiscal years, loan loss provisions established by the Company have ranged from a recovery of $648,000 or 0.04% of average assets during fiscal year 2019 to loan loss provisions of $3.7 million or 0.20% of average assets during the fiscal year ended April 30, 2020. For the twelve months ended December 31, 2020, loan loss provisions amounted to $2.5 million or 0.13% of average assets. The higher loan loss provisions established during 2020 were largely related to the potential negative impact that the Covid-19 pandemic may have on the Company’s financial condition and results of operations. As of December 31, 2020, the Company maintained an allowance for loan losses of $17.0 million, equal to 1.33% of total loans outstanding and 131.92% of non-performing loans (non-performing loans do not include accruing troubled debt restructurings). Exhibit I-6 sets forth the Company’s loan loss allowance activity during the past two years.
With the exception of 2020, non-operating income and losses over the past six fiscal years have been fairly limited. For 2020, the Company reported a net non-operating loss of $29.6 million or 1.53% of average assets. The net non-operating loss for 2020 consisted of a $12.8 million write-down of a Bank property that was reclassified as held for sale, a $15.5 goodwill impairment charge, a $1.4 loss on the write-down of REO and a $68,000 gain on the sale of securities. Overall, the non-operating gains and losses recorded by Company were viewed as non-recurring income items.
The Company effective tax rate ranged from a tax benefit of 19.98 % during 2020 to a tax expense of 49.33% during fiscal year 2018. The relatively high effective tax rate recorded for fiscal year 2018 includes a reduction in the value of Blue Foundry Bancorp’s deferred tax
| RP® Financial, LC. | OVERVIEW AND FINANCIAL ANALYSIS | |
| I.12 |
assets and a corresponding charge to income tax expense of $1.8 million as a result of the enactment of the Tax Cuts and Jobs Act of 2017, which reduced the maximum federal corporate income tax rate to 21% from 35%. As set forth in the prospectus, the Company’s effective marginal tax rate is 31.0%.
Interest Rate Risk Management
The Company’s balance sheet is liability sensitive in the short-term (less than one year). The Company’s interest rate risk analysis as of December 31, 2020 indicates that in the event of a 200 basis point increase in interest rates over a one year period, assuming a parallel and immediate shift across the yield curve over such period, net portfolio value would decrease by 4.5%, which was within Board approved policy limits (see Exhibit I-7).
The Company pursues a number of strategies to manage interest rate risk, particularly with respect to seeking to limit the repricing mismatch between interest rate sensitive assets and liabilities. The Company manages interest rate risk from the asset side of the balance sheet through underwriting originations 1-4 family loans to conform to secondary market standards that would facilitate the sale of those loans as warranted, maintaining most of the investment portfolio as available for sale, investing in securities with maturities of five years or less, emphasizing commercial real estate and commercial business lending as the primary areas of lending emphasis, which consists primarily of adjustable rate or shorter term fixed rate loans. As of December 31, 2020, of the Company’s total loans due after December 31, 2021, adjustable rate loans comprised 71.22% of those loans (see Exhibit I-8). On the liability side of the balance sheet, management of interest rate risk has been primarily pursued through emphasizing growth of lower costing and less interest rate sensitive transaction and savings account deposits and utilizing fixed rate FHLB advances with maturities extending out to 2025. Transaction and savings accounts comprised 47.10% of the Company’s total deposits at December 31, 2020.
The Company also utilizes interest rate swap agreements as part of its asset-liability management strategy. Interest rate swaps with notional amounts totaling $109.0 million at December 31, 2020 were designated as cash flow hedges of certain FHLB advances and were determined to be fully effective during 2020. As of December 31, 2020, the interest rate swaps had an unrealized loss of $5.5 million.
| RP® Financial, LC. | OVERVIEW AND FINANCIAL ANALYSIS | |
| I.13 |
The infusion of stock proceeds will serve to further limit the Company’s interest rate risk exposure, as most of the net proceeds will be redeployed into interest-earning assets and the increase in the Company’s capital position will lessen the proportion of interest rate sensitive liabilities funding assets.
Lending Activities and Strategy
Pursuant to the Company’s strategic plan, the Company is pursuing a diversified lending strategy emphasizing commercial real estate loans and commercial business loans as the primary areas of targeted loan growth. Other areas of lending for the Company include 1-4 family permanent mortgage loans, construction and land loans, home equity loans and lines of credit and consumer loans. Exhibit I-9 provides historical detail of Blue Foundry Bancorp’s loan portfolio composition for the past two years and Exhibit I-10 provides the contractual maturity of the Company’s loan portfolio by loan type as of December 31, 2020.
1-4 Family Residential Loans. Blue Foundry Bancorp offers fixed rate and adjustable rate 1-4 family permanent mortgage loans with terms of up to 30 years. Loans are generally underwritten to secondary market guidelines, so as to allow for the sale of such loans if such a strategy is warranted for purposes of interest rate risk management. ARM loans offered by the Bank have initial repricing terms ranging from three to ten years and then reprice annually for the balance of the loan term. ARM loans are indexed to corresponding U.S. Treasury securities rate. As of December 31, 2020, the Company’s outstanding balance of 1-4 family loans totaled $611.6 million equal to 48.27% of total loans outstanding.
Commercial Real Estate and Multi-Family Loans. Commercial real estate and multi-family loans consist largely of loans originated by the Company, which are generally collateralized by properties in the Company’s primary market area. On a limited basis, the Company supplements originations of commercial real estate and multi-family loans with purchased loan participations from local banks. Loan participations are subject to the same underwriting criteria and loan approvals as applied to loans originated by the Company. Blue Foundry Bancorp generally originates multi-family loans up to a loan-to-value (“LTV”) ratio of 80% and originates commercial real estate loans up to a LTV ratio of 75%. The Company generally requires a minimum debt-coverage ratio of 1.25 times for multi-family and commercial real estate loans. Commercial real estate and multi-family loans are originated with maximum terms of up to 15 years based on amortization periods between 25 and 30 years. Commercial real estate and multi-family loans are offered as fixed rate loans. Properties securing the the
| RP® Financial, LC. | OVERVIEW AND FINANCIAL ANALYSIS | |
| I.14 |
commercial real estate and multi-family loan portfolio include office buildings, industrial facilities, retail facilities and apartments. At December 31, 2020, the Company’s largest commercial real estate or multi-family loan had an outstanding balance of $21.8 million and is secured by a multi-family property. At December 31, 2020, this loan was performing in accordance with its original terms. As of December 31, 2020, the Company’s outstanding balance of commercial real estate and multi-family loans totaled $555.69 million equal to 43.84% of total loans outstanding and included $427.4 million of multi-family loans.
Commercial Business Loans. The commercial business loan portfolio is generated through extending loans to businesses operating in the local market area. Expansion of commercial business lending activities is a desired area of loan growth for the Company, pursuant to which the Company is seeking to become a full service community bank to its commercial loan customers through offering a full range of commercial loan products that can be packaged with lower cost commercial deposit products. Commercial business loans offered by the Company consist of floating lines of credit indexed to The Wall Street Journal prime rate and fixed rate term loans. Commercial business loans are generally secured by business assets, and the Company generally obtains personal guarantees with respect to all commercial business lines of credit. As of December 31, 2020, the Company’s outstanding balance of commercial business loans totaled $54.1 million equal to 4.27% of total loans outstanding.
Construction and Land Loans. Construction loans originated by the Companyconsist of loans to finance the construction of 1-4 family residences and commercial real estate and multi-family properties. Construction loans are interest only loans during the construction period, which is usually up to 12 to 24 months, and are generally offered up to a maximum LTV ratio of 80% of the appraised market value of the completed property. Land loans consist of properties acquired for development, as well as unimproved land. Land loans are typically extended up to a LTV ratio of 65% of the lesser of the appraised value or the purchase price of the property. Land loans are generally offered as fixed rate loans with terms of up to 15 years. As of December 31, 2020, the Company’s outstanding balance of construction and land loans totaled $33.7 million equal to 2.66% of total loans outstanding.
Home Equity Loans and Lines Credit. The Company’s 1-4 family lending activities include home equity loans and lines of credit. Home equity loans and lines of credit are originated with terms up to 20 years. Home equity lines of credit are tied to the prime rate as published in The Wall Street Journal. The Company will generally originate home equity loans
| RP® Financial, LC. | OVERVIEW AND FINANCIAL ANALYSIS | |
| I.15 |
and lines of credit up to a maximum loan-to value (“LTV”) ratio of 80%, inclusive of other liens on the property, on owner occupied properties. As of December 31, 2020, the Company’s outstanding balance of home equity loans and lines of credit totaled $23.8 million equal to 1.88% of total loans outstanding.
Consumer Loans. Consumer lending other than home equity loans and lines of credit has been a limited area of lending diversification for the Company, with such loans consisting of personal loans and installment loans. As of December 31, 2020, the Company’s outstanding balance of consumer loans was $98,000 equal to 0.01% of total loans.
Asset Quality
The Company experienced an increase in non-performing loans during 2020, which was due to an increase in non-performing 1-4 family loans. Over the past two years, Blue Foundry Bancorp’s balance of non-performing assets increased from $$6.9 million or 0.37% of assets at yearend 2019 to $13.5 million or 0.69% of assets at yearend 2020. As shown in Exhibit I-11, non-performing assets at December 31, 2020 consisted of $12.9 million of non-accruing loans and $623,000 of REO. Non-accruing loans held by the Company at December 31, 2020 were concentrated in 1-4 family permanent mortgage loans totaling $11.8 million.
To track the Company’s asset quality and the adequacy of valuation allowances, Blue Foundry Bancorp has established detailed asset classification policies and procedures which are consistent with regulatory guidelines. Classified assets are reviewed monthly by senior management and the Board. The loan portfolio is also reviewed by an independent third party. Pursuant to these procedures, when needed, the Company establishes additional valuation allowances to cover anticipated losses in classified or non-classified assets. As of December 31 2020, the Company maintained loan loss allowances of $17.0 million, equal to 1.33% of total loans receivable and 131.92% of non-performing loans.
Funding Composition and Strategy
Deposits have consistently served as the Company’s primary funding source and at December 31, 2020 deposits accounted for 80.46% of Blue Foundry Bancorp’s combined balance of deposits and borrowings. Exhibit I-12 sets forth the Company’s deposit composition for the past two years. Transaction and savings account deposits constituted 47.10% of total deposits at December 31, 2020, as compared to 39.17% of total deposits at December 31, 2019. The increase in the concentration of core deposits comprising total deposits from yearend 2019 to yearend 2020 was the result of growth of core deposits and a decrease in CDs. As of December 31, 2020, checking accounts comprised the largest concentrations of the Company’s core deposits equaling 56.70% of core deposits.
| RP® Financial, LC. | OVERVIEW AND FINANCIAL ANALYSIS | |
| I.16 |
The balance of the Company’s deposits consists of CDs, which equaled 52.90% of total deposits at December 31, 2020 compared to 60.83% of total deposits at December 31, 2019. Blue Foundry Bancorp’s current CD composition reflects a higher concentration of short-term CDs (maturities of one year or less). The CD portfolio totaled $717.4 million at December 31, 2020 and $581.0 million or 80.98% of the CDs were scheduled to mature in one year or less. As of December 31, 2020, jumbo CDs (CD accounts with balances of $250,000 or more) amounted to $47.5 million or 13.39% of total CDs.
Borrowings serve as an alternative funding source for the Company to facilitate management of funding costs and interest rate risk. The Company maintained $329.4 million of FHLB advances at December 31, 2020 with a weighted average rate of 1.49%. FHLB advances held by the Company at December 31, 2020 had laddered terms extending out to 2025.
Subsidiary Activity
Upon completion of the conversion, the Bank will be the sole and wholly owned subsidiary of Blue Foundry Bancorp.
Blue Foundry Bank has six wholly owned subsidiaries. Rutherford Center Development Corp., a New Jersey corporation, Blue Foundry Service Corporation, a New Jersey corporation, and Blue Foundry, LLC, a New Jersey limited liability company, hold certain real estate owned. 116-120 Route 23 North, LLC, a New Jersey limited liability company, and TrackView LLC, a New Jersey limited liability company, were each formed to hold certain real estate owned but are currently inactive. Blue Foundry Investment Company, a New Jersey company, was formed to hold certain of our investment securities for tax purposes.
Legal Proceedings
The Company is not currently party to any pending legal proceedings that the Company’s management believes would have a material adverse effect on the Company’s financial condition, results of operations or cash flows.
| RP® Financial, LC. | MARKET AREA | |
| II.1 |
II. MARKET AREA
Introduction
Headquartered in Rutherford, New Jersey, Blue Foundry Bancorp serves northeastern New Jersey through the administrative headquarters office and 16 full service branch offices. The Company’s branch network covers a four-county market area of Bergen County, Morris County, Essex County and Passaic County, which is adjacent to southern New York. The headquarters office and 10 branch offices are maintained in Bergen County, four branches are maintained in Morris County, two branches are maintained in Essex County and one branch is maintained in Passaic County. Exhibit II-1 provides information on the Company’s office properties.
The primary market area served by the Company is a part of the New York metropolitan area and, therefore, is suburban and urban in nature. With operations in a densely populated metropolitan area, the Company’s competitive environment includes a significant number of thrifts, commercial banks and other financial services companies, some of which have a regional or national presence. The regional economy is highly diversified, which includes a large commuter population with jobs in New York City. Accordingly, the local economy has felt the impact of the coronavirus-induced national recession.
Future growth opportunities for Blue Foundry Bancorp depend on the future growth and stability of the national and regional economy, demographic growth trends and the nature and intensity of the competitive environment. These factors have been examined to help determine the growth potential that exists for the Company, the relative economic health of the Company’s market area, and the resultant impact on value.
National Economic Factors
The future success of the Company’s operations is partially dependent upon various national and local economic trends. In assessing national economic trends over the past few quarters, July 2020 manufacturing activity increased to an index reading of 54.2 and July service sector activity accelerated to an index reading of 58.1. U.S. employers added 1.8 million jobs in July and the July unemployment rate fell to 10.2%. In late-July, economic data suggested that the economic recovery was stalling, as filings for initial unemployment claims rose for two consecutive weeks after nearly four months of declining weekly unemployment
| RP® Financial, LC. | MARKET AREA | |
| II.2 |
claims and second quarter GDP contracted at a record annual rate of 32.9%. July existing home sales increased 24.7%, while new home sales in July rose 13.9%. At the same time, the number of homeowners that were at least 90 days delinquent soared to a 10-year high in July. August manufacturing activity accelerated to an index reading of 56.0. Comparatively, August service sector activity slowed to an index 56.9. The U.S. economy added 1.4 million jobs in August and the August unemployment rate declined to 8.4%. Record low mortgage rates helped to fuel a 2.4% increase in August existing home sales and a 4.8% increase in August new home sales. August retail sales increased 0.6%, while durable-goods orders for August increased 0.4%. The consumer confidence index for September surged to 101.8, which was its highest level since March. September manufacturing activity increased to an index reading of 55.4, while September service sector activity accelerated to an index reading of 57.8. The U.S. economy added 661,000 jobs in September and the September unemployment rate dropped to 7.9%. Existing home sales for September increased 9.4%, versus a 3.5% decline in September new home sales. Third quarter GDP rebounded from the pandemic-induced slump, increasing at a 33.1% annualized pace.
Manufacturing activity for October 2020 expanded at its quickest pace in more than two years with an index reading of 59.3, while October service sector activity declined to an index reading of 56.6. U.S. employers added 638,000 jobs in October and the October unemployment rate dropped to 6.9%. October existing home sales rose to a 14-year high with an increase of 4.3% from September existing home sales, as low borrowing costs and a shift in living preferences during the pandemic fueled a surge in home purchases. November manufacturing and service activity slowed to respective index readings of 57.5 and 55.9. The U.S. economy added 245,000 job in November, which was less than expected, and the November unemployment rate dropped to 6.7%. November retail sales dropped 1.1%, amid a surge in coronavirus infections and new business restrictions. Existing home sales declined 2.5% in November, versus an 11.0% decline in November new home sales. Manufacturing activity for December accelerated to an index reading of 60.7, while service sector activity for December accelerated to an index reading of 57.2. U.S. payrolls for December declined by 140,000 which was the first decline since April. The December unemployment rate remained at 6.7%. Retail sales for December were down 0.7%. Existing and new home sales for December increased by 0.7% and 1.6%, respectively. Fourth quarter GDP increased at a 4.0% annualized rate, while GDP for all of 2020 contracted 3.5%.
| RP® Financial, LC. | MARKET AREA | |
| II.3 |
January 2021 manufacturing activity slowed to an index reading of 58.7, while service sector activity for January accelerated to an index reading of 58.7. U.S. employers added 49,000 jobs in January and the January unemployment rate fell to 6.3%.
In terms of interest rates trends over the past few quarters, a stable interest rate environment prevailed at the start of the third quarter of 2020. Long-term Treasury yields edged lower going into the second half of July, as a surge in coronavirus cases forced a number of states to reimpose lockdown measures. In mid-July, the average rate on a 30-year fixed rate mortgage fell to 2.98%, its lowest level on record. The 10-year Treasury yield edged below 0.60% going into late-July. At the conclusion of its late-July policy meeting, the Federal Reserve left its benchmark rate near zero and reiterated that it would continue to support the economy. The 10-year Treasury yield remained below 0.60% heading into mid-August and then trended up slightly to above 0.70% in late-August after the Federal Reserve dropped its long-standing practice of pre-emptively lifting interest rates to head off higher inflation. At the start of September, the 10-year Treasury yield fell below 0.70% and then edged back up over 0.70% with the release of the August employment report. For the balance of September, the 10-year Treasury yield stabilized in a range between 0.64% and 0.71% as the Federal Reserve signaled that it would keep its benchmark rate near zero through 2023.
Economic reports indicating the U.S. economy was continuing to improve and hopes of a new coronavirus relief deal pushed the 10-year Treasury yield above 0.75% in early-October 2020, which was followed by long-term Treasury yields stabilizing through mid-October. After increasing to a yield of 0.85% heading into late-October, the 10-year Treasury edged lower at the beginning of the last week of October as a surge in coronavirus cases added to worries about the economic outlook in the absence of a stimulus deal. Stronger-than-expected third quarter GDP growth pushed the 10-year Treasury yield up to 0.88% at the end of October. After edging lower with the release of the October employment report, long-term Treasury yields surged higher in the second week of November on news that a coronavirus vaccine being developed was 90% effective. Long-term Treasury yields edged lower going into the second half of November, as states implemented new lockdown measures amid a resurgence of coronavirus infections. Promising results for multiple Covid-19 vaccines and signs that U.S. lawmakers were committed to completing a new Covid-19 relief package contributed to long-term Treasury yields edging higher in early-December, which was followed by interest rates stabilizing for the balance of 2020. At its final meeting of the year in mid-December, the Federal Reserve left its benchmark at near zero and made no changes to its asset purchase program.
| RP® Financial, LC. | MARKET AREA | |
| II.4 |
Interest rates remained stable at the start of 2021 and then edged higher following the Georgia Senate election run-offs in early-January, as the 10-year Treasury yield climbed above 1.0% on expectations that additional fiscal stimulus would be forthcoming with Democrats taking control of the Senate. The 10-year Treasury yield stabilized around 1.10% going into the last week of January and then edged lower at the end of January, amid concerns of delays in distribution of the Covid-19 vaccine and the ability to end lockdowns or other restrictions. The Federal Reserve concluded its late-January meeting leaving its benchmark rate near zero and keeping its easy money policies in place. Expectations of more stimulus pushed long-term Treasury yields higher at the end of January and the first week of February, which provided for some steepening of the yield curve. As of February 5, 2021, the bond equivalent yields for U.S. Treasury bonds with terms of one and ten years equaled 0.06% and 1.19%, respectively, versus comparable year ago yields of 1.49% and 1.66%. Exhibit II-2 provides historical interest rate trends.
Based on the consensus outlook of economists surveyed by The Wall Street Journal in January 2021, GDP growth was projected to increase 4.3% in 2021 and then decrease to 3.0% in 2022. The U.S. unemployment rate was forecasted to equal 6.1% in June 2021 and then decrease to 5.3% in December 2021. An average of 419,000 jobs were projected to be added per month over the next four quarters. On average, the economists forecasted the federal funds rate to equal 0.13% in June 2021 and then edge up to 0.14% in December 2021. On average, the economists forecasted that the 10-year Treasury yield would equal 1.24% in June 2021 and then increase to 1.44% in December 2021. The surveyed economists also forecasted home prices would rise by 5.5% in 2021 and 2020 housing starts were forecasted to increase from 1.38 million in 2020 to 1.49 million in 2021.
The January 2021 mortgage finance forecast from the Mortgage Bankers Association (the “MBA”) was for 2021 existing home sales to increase by 10.2% from 2020 sales and new home sales were forecasted to increase by 18.1% in 2021 from sales in 2020. The 2021 median sale prices for existing and new homes were forecasted to increase by 3.2% and 0.4%, respectively. Total mortgage production was forecasted to decrease in 2021 to $2.719 trillion, compared to $3.573 trillion in 2020. The forecasted decrease in 2021 originations was based on a 10.5% increase in purchase volume and a 46.7% decrease in refinancing volume. Purchase mortgage originations were forecasted to total $1.574 trillion in 2021, versus refinancing volume totaling $1.145 trillion. Housing starts for 2021 were projected to increase by 7.2% to total 1.481 million.
| RP® Financial, LC. | MARKET AREA | |
| II.5 |
Market Area Demographics
Demographic and economic growth trends, measured by changes in population, number of households, age distribution and median household income, provide key insight into the health of the market area served by Blue Foundry Bancorp. Demographic data for Bergen, Morris, Passaic and Essex Counties, as well as for New Jersey and the U.S., is provided in Table 2.1.
The primary market area counties are densely populated markets, ranking among the largest populations in New Jersey. Bergen County has the largest population among the four primary market area counties and is the largest county in the state, while Essex County maintains the third largest population in New Jersey. Passaic County and Morris Count maintain the fifth and ninth largest populations out of the 21 counties that comprise New Jersey. The primary market area counties served by Blue Foundry Bancorp experienced relatively slow demographic growth during the 2016 to 2021 period, a characteristic typical of mature densely populated urban markets located throughout the Northeast Corridor. In fact, with the exception of Essex County, the primary market area counties experienced declines in population and household during the past five years. Population and household growth rates for the primary market area counties have been and are projected to remain well below the comparable U.S. measures, while approximating the comparable New Jersey growth rates.
Income measures show Bergen County and Morris County are relatively affluent markets, characterized by relatively high concentration of white-collar professionals. Comparatively, income measures for the counties of Essex and Passaic, which have a comparatively broader socioeconomic spectrum, were below the Bergen and Morris Counties measures and lower than the New Jersey income measures as well. The primary market area counties generally experienced income growth rates that were in line with the state and national growth rates for the 2016 through 2021 period. Consistent with the projected income growth rates for New Jersey and the U.S., income growth rates for the primary market area counties are projected to be less over the next five years. The affluence of Bergen County and Morris County is further evidenced by a comparison of household income distribution measures, as Bergen County and Morris County maintain a lower percentage of households with incomes of less than $25,000 and a much higher percentage of households with incomes over $100,000 relative to Essex County and Passaic County as well as the U.S. and New Jersey. Essex County and Passaic County also maintained higher percentages of households with incomes
| RP® Financial, LC. | MARKET AREA | |
| II.6 |
Table 2.1
Blue Foundry Bancorp
Summary Demographic Data
| Year | Growth Rate | |||||||||||||||||||
| 2016 | 2021 | 2026 | 2016-2021 | 2021-2026 | ||||||||||||||||
| (%) | (%) | |||||||||||||||||||
| Population (000) |
||||||||||||||||||||
| USA |
322,431 | 330,946 | 340,574 | 0.5 | % | 0.6 | % | |||||||||||||
| New Jersey |
8,985 | 8,884 | 8,911 | -0.2 | % | 0.1 | % | |||||||||||||
| Bergen, NJ |
943 | 934 | 942 | -0.2 | % | 0.2 | % | |||||||||||||
| Essex, NJ |
801 | 801 | 808 | 0.0 | % | 0.2 | % | |||||||||||||
| Morris, NJ |
501 | 491 | 489 | -0.4 | % | 0.0 | % | |||||||||||||
| Passaic, NJ |
512 | 501 | 501 | -0.4 | % | 0.0 | % | |||||||||||||
| Households (000) |
||||||||||||||||||||
| USA |
122,265 | 125,733 | 129,596 | 0.6 | % | 0.6 | % | |||||||||||||
| New Jersey |
3,289 | 3,255 | 3,267 | -0.2 | % | 0.1 | % | |||||||||||||
| Bergen, NJ |
349 | 344 | 347 | -0.3 | % | 0.1 | % | |||||||||||||
| Essex, NJ |
292 | 293 | 297 | 0.1 | % | 0.2 | % | |||||||||||||
| Morris, NJ |
185 | 182 | 182 | -0.3 | % | 0.0 | % | |||||||||||||
| Passaic, NJ |
170 | 166 | 166 | -0.4 | % | 0.0 | % | |||||||||||||
| Median Household Income ($) |
||||||||||||||||||||
| USA |
55,551 | 67,761 | 73,868 | 4.1 | % | 1.7 | % | |||||||||||||
| New Jersey |
72,173 | 89,080 | 97,516 | 4.3 | % | 1.8 | % | |||||||||||||
| Bergen, NJ |
86,188 | 107,018 | 116,847 | 4.4 | % | 1.8 | % | |||||||||||||
| Essex, NJ |
55,025 | 68,779 | 75,901 | 4.6 | % | 2.0 | % | |||||||||||||
| Morris, NJ |
102,857 | 120,735 | 130,046 | 3.3 | % | 1.5 | % | |||||||||||||
| Passaic, NJ |
61,292 | 78,541 | 86,975 | 5.1 | % | 2.1 | % | |||||||||||||
| Per Capita Income ($) |
||||||||||||||||||||
| USA |
30,002 | 37,689 | 41,788 | 4.7 | % | 2.1 | % | |||||||||||||
| New Jersey |
37,494 | 47,674 | 52,411 | 4.9 | % | 1.9 | % | |||||||||||||
| Bergen, NJ |
44,790 | 57,183 | 62,069 | 5.0 | % | 1.7 | % | |||||||||||||
| Essex, NJ |
33,130 | 43,048 | 47,537 | 5.4 | % | 2.0 | % | |||||||||||||
| Morris, NJ |
52,009 | 64,337 | 69,021 | 4.3 | % | 1.4 | % | |||||||||||||
| Passaic, NJ |
29,080 | 37,142 | 41,305 | 5.0 | % | 2.1 | % | |||||||||||||
| 2021 Age Distribution (%) |
0-14 Yrs. | 15-34 Yrs. | 35-54 Yrs. | 55-69 Yrs. | 70+ Yrs. | |||||||||||||||
| USA |
19.0 | 26.8 | 24.8 | 18.4 | 11.4 | |||||||||||||||
| New Jersey |
18.3 | 25.3 | 24.7 | 19.4 | 11.6 | |||||||||||||||
| Bergen, NJ |
17.1 | 23.7 | 25.1 | 20.1 | 12.6 | |||||||||||||||
| Essex, NJ |
20.0 | 26.1 | 26.5 | 17.3 | 9.7 | |||||||||||||||
| Morris, NJ |
17.4 | 24.1 | 23.8 | 21.0 | 12.4 | |||||||||||||||
| Passaic, NJ |
20.1 | 26.8 | 24.7 | 17.8 | 10.4 | |||||||||||||||
| Less Than | $25,000 to | $50,000 to | ||||||||||||||||||
| 2021 HH Income Dist. (%) |
25,000 | 50,000 | 100,000 | $100,000+ | ||||||||||||||||
| USA |
18.0 | 20.3 | 29.0 | 32.7 | ||||||||||||||||
| New Jersey |
14.1 | 15.5 | 25.6 | 44.8 | ||||||||||||||||
| Bergen, NJ |
11.5 | 13.2 | 22.5 | 52.8 | ||||||||||||||||
| Essex, NJ |
21.6 | 18.2 | 23.9 | 36.3 | ||||||||||||||||
| Morris, NJ |
7.9 | 10.7 | 22.7 | 58.6 | ||||||||||||||||
| Passaic, NJ |
17.4 | 16.4 | 27.0 | 39.2 | ||||||||||||||||
Source: S&P Global Market Intelligence.
| RP® Financial, LC. | MARKET AREA | |
| II.7 |
above $100,000 compared to the U.S. and were at a lower percentage compared to New Jersey. Essex County maintained a higher percentage of households with incomes less than $25,000 compared to the U.S. and New Jersey, while Passaic County maintained a lower and higher percentage of households with incomes less than $25,000 compared to the respective U.S. and New Jersey measures.
Age distribution measures for the primary market area counties were fairly similar to the comparable U.S. and state measures, with Bergen and Morris County exhibiting slightly older populations and Essex County and Passaic County exhibiting slight younger populations among the four primary market area counties as well as in comparison to the U.S. and New Jersey.
Regional Economy
Comparative employment data shown in Table 2.2 shows that, jobs in services and education/healthcare/social services accounted for the two largest employment sectors in all of the primary market area counties, as well as New Jersey. Finance/insurance/real estate jobs followed by wholesale/retail jobs were the third and fourth employment sectors for all of the primary market counties and New Jersey, with the exception of Passaic County which maintained a slightly higher concentration of wholesale/retail jobs compared to finance/insurance/real estate jobs. Overall, the distribution of employment exhibited in the primary market area is indicative of a fairly diversified economy.
Table 2.2
Blue Foundry Bancorp
Primary Market Area Employment Sectors
(Percent of Labor Force)
| Bergen | Essex | Morris | Passaic | |||||||||||||||||
| Employment Sector |
New Jersey | County | County | County | County | |||||||||||||||
| Services |
25.7 | % | 23.1 | % | 25.9 | % | 27.0 | % | 21.2 | % | ||||||||||
| Education,Healthcare, Soc. Serv. |
23.9 | % | 25.2 | % | 25.5 | % | 23.3 | % | 23.1 | % | ||||||||||
| Government |
2.0 | % | 2.6 | % | 2.1 | % | 2.3 | % | 1.9 | % | ||||||||||
| Wholesale/Retail Trade |
11.5 | % | 12.2 | % | 9.4 | % | 13.3 | % | 17.3 | % | ||||||||||
| Finance/Insurance/Real Estate |
17.4 | % | 17.8 | % | 15.2 | % | 18.0 | % | 16.4 | % | ||||||||||
| Manufacturing |
4.5 | % | 5.2 | % | 4.9 | % | 3.8 | % | 5.1 | % | ||||||||||
| Construction |
5.9 | % | 5.7 | % | 6.1 | % | 5.0 | % | 5.9 | % | ||||||||||
| Information |
2.7 | % | 3.0 | % | 2.9 | % | 3.5 | % | 2.2 | % | ||||||||||
| Transportation/Utility |
6.1 | % | 4.9 | % | 7.9 | % | 3.7 | % | 7.0 | % | ||||||||||
| Agriculture |
0.3 | % | 0.1 | % | 0.2 | % | 0.2 | % | 0.0 | % | ||||||||||
| 100.0 | % | 100.0 | % | 100.0 | % | 100.0 | % | 100.0 | % | |||||||||||
Source: S&P Global Market Intelligence.
| RP® Financial, LC. | MARKET AREA | |
| II.8 |
The market areas served by the Company, characterized primarily as the New York metropolitan area, has a highly developed and diverse economy. Financial services, professional services and healthcare related companies are among the largest employers in the New York metropolitan area. Table 2.3 lists the largest companies in the primary market area counties served by the Company’s branches.
Table 2.3
Blue Foundry Bancorp
Largest Employers in Local Market Area
| Company |
County |
Industry |
Fortune 500 Rank | |||||
| Market Area | ||||||||
| Prudential Financial |
Essex | Financial Services | 53 | |||||
| PBF Energy |
Morris | Energy | 125 | |||||
| Becton Dickinson |
Bergen | Medical Devices | 187 | |||||
| Cognizant Technology Solutions |
Bergen | IT Services | 194 | |||||
| ADP |
Essex | Payroll Services | 227 | |||||
| Public Service Enterprise Group |
Essex | Energy | 317 | |||||
| Avis Budget Group |
Morris | Rental Cars | 345 | |||||
| Quest Diagnostics |
Bergen | Lab Services | 410 | |||||
| Zoetis |
Morris | Veterinary Pharmaceuticals | 472 | |||||
| Ascena Retail Group |
Bergen | Retailer | 473 | |||||
Source: Fortune, May 2020
Unemployment Trends
Comparative unemployment rates for the primary market area counties, as well as for the U.S. and New Jersey, are shown in Table 2.4. December 2020 unemployment rates for the primary market area counties ranged from a low of 5.9% for Morris County to a high of 9.8% for Passaic County. Comparative unemployment rates for the U.S. and New Jersey equaled 6.5% and 7.4%, respectively. Pursuant to the coronavirus-induced recession, the December 2020 unemployment rates for the primary market area counties New Jersey and the U.S. were all significantly higher compared to a year ago.
| RP® Financial, LC. | MARKET AREA | |
| II.9 |
Table 2.4
Blue Foundry Bancorp
Unemployment Trends(1)
| Region |
December 2019 Unemployment |
December 2020 Unemployment | ||
| USA |
3.4% | 6.5% | ||
| New Jersey |
3.6% | 7.4% | ||
| Bergen, NJ |
2.8% | 6.8% | ||
| Essex, NJ |
4.5% | 9.5% | ||
| Morris, NJ |
2.8% | 5.9% | ||
| Passaic, NJ |
4.3% | 9.8% |
(1) Unemployment rates are not seasonally adjusted.
Source: S&P Global Market Intelligence.
Market Area Deposit Characteristics and Competition
The Company’s deposit base is closely tied to the economic fortunes of northern New Jersey and, in particular, the areas that are nearby to one of Blue Foundry Bancorp’s branches. Table 2.5 displays deposit market trends from June 30, 2015 through June 30, 2020 for all commercial bank and savings institution branches located in the market area counties, as well as New Jersey. Consistent with New Jersey, commercial banks maintained a larger market share of deposits than savings institutions in all the primary market area counties. Overall, from June 30, 2015 to June 30, 2020, bank and thrift deposits increased in all of the primary market area counties.
| RP® Financial, LC. | MARKET AREA | |
| II.10 |
Table 2.5
Blue Foundry Bancorp
Deposit Summary
| As of June 30, | ||||||||||||||||||||||||||||
| 2015 | 2020 | Deposit Growth Rate 2015-2020 |
||||||||||||||||||||||||||
| Deposits | Market Share |
No. of Branches |
Deposits | Market Share |
No. of Branches |
|||||||||||||||||||||||
| (Dollars in Thousands) | (%) | |||||||||||||||||||||||||||
| New Jersey |
$ | 301,749,000 | 100.0 | % | 2,218 | $ | 403,731,000 | 100.0 | % | 2,713 | 6.0 | % | ||||||||||||||||
| Commercial Banks |
231,476,000 | 76.7 | % | 1,320 | 363,767,000 | 90.1 | % | 2,277 | 9.5 | % | ||||||||||||||||||
| Savings Institutions |
70,273,000 | 23.3 | % | 898 | 39,964,000 | 9.9 | % | 436 | -10.7 | % | ||||||||||||||||||
| Bergen County |
$ | 47,408,000 | 100.0 | % | 474 | $ | 63,678,000 | 100.0 | % | 396 | 6.1 | % | ||||||||||||||||
| Commercial Banks |
35,365,000 | 74.6 | % | 351 | 55,851,000 | 87.7 | % | 323 | 9.6 | % | ||||||||||||||||||
| Savings Institutions |
12,042,000 | 25.4 | % | 123 | 7,828,000 | 12.3 | % | 73 | -8.3 | % | ||||||||||||||||||
| Blue Foundry Bancorp |
867,645 | 1.8 | % | 10 | 1,032,854 | 1.6 | % | 10 | 3.5 | % | ||||||||||||||||||
| Essex County |
$ | 26,471,000 | 100.0 | % | 252 | $ | 28,538,000 | 100.0 | % | 224 | 1.5 | % | ||||||||||||||||
| Commercial Banks |
15,150,000 | 57.2 | % | 183 | 25,467,000 | 89.2 | % | 184 | 10.9 | % | ||||||||||||||||||
| Savings Institutions |
11,322,000 | 42.8 | % | 69 | 3,071,000 | 10.8 | % | 40 | -23.0 | % | ||||||||||||||||||
| Blue Foundry Bancorp |
46,538 | 0.2 | % | 2 | 53,785 | 0.2 | % | 2 | 2.9 | % | ||||||||||||||||||
| Morris County |
$ | 22,156,000 | 100.0 | % | 225 | $ | 27,510,000 | 100.0 | % | 200 | 4.4 | % | ||||||||||||||||
| Commercial Banks |
17,795,000 | 80.3 | % | 183 | 24,876,000 | 90.4 | % | 173 | 6.9 | % | ||||||||||||||||||
| Savings Institutions |
4,362,000 | 19.7 | % | 42 | 2,634,000 | 9.6 | % | 27 | -9.6 | % | ||||||||||||||||||
| Blue Foundry Bancorp |
130,984 | 0.6 | % | 4 | 193,122 | 0.7 | % | 4 | 8.1 | % | ||||||||||||||||||
| Passaic County |
$ | 13,679,000 | 100.0 | % | 141 | $ | 19,389,000 | 100.0 | % | 114 | 7.2 | % | ||||||||||||||||
| Commercial Banks |
11,194,000 | 81.8 | % | 114 | 17,355,000 | 89.5 | % | 95 | 9.2 | % | ||||||||||||||||||
| Savings Institutions |
2,485,000 | 18.2 | % | 27 | 2,034,000 | 10.5 | % | 19 | -3.9 | % | ||||||||||||||||||
| Blue Foundry Bancorp |
62,175 | 0.5 | % | 1 | 76,126 | 0.4 | % | 1 | 4.1 | % | ||||||||||||||||||
Source: FDIC.
The Company maintains its largest balance and market share of deposits in Bergen County, where the Company is headquartered and maintains its largest branch presence. Based on June 30, 2020 deposit data, Blue Foundry Bancorp’s $1.033 billion of deposits provided for a 1.6% market share of bank and thrift deposits in Bergen County. The Bank’s deposit market share in the primary market area counties ranged from 0.2% in Essex County to 1.6% in Bergen County. Five year annual deposit growth rates for the primary market area counties ranged from 1.5% for Essex County to 7.2% for Passaic County. Comparatively, deposit growth rates for the Company ranged from 2.9% in Essex County to 8.1% in Morris County. During the five-year period covered in Table 2.5, the Company’s deposit market share increased slightly in Morris County, decreased slightly in Bergen and Passaic County, and stayed flat in Essex County.
| RP® Financial, LC. | MARKET AREA | |
| II.11 |
As implied by the Company’s relatively low market shares of deposits in the primary market area counties, competition among financial institutions in the Company’s market area is significant. Among the Company’s competitors are much larger and more diversified institutions, which have greater resources than maintained by Blue Foundry Bancorp. Financial institution competitors in the Company’s primary market area include other locally based thrifts and banks, as well as regional, super regional and money center banks. From a competitive standpoint, Blue Foundry Bancorp has sought to emphasize its community orientation in the markets served by its branches. Table 2.6 lists the Company’s largest competitors in the market area counties, based on deposit market share.
Table 2.6
Blue Foundry Bancorp
Market Area Deposit Competitors
| Location |
Name | Market Share | Rank | |||||
| Bergen County, NJ |
Toronto-Dominion Bank | 14.79 | ||||||
| Bank of America Corporation (NC) |
13.16 | |||||||
| JPMorgan Chase & Co. (NY) | 11.69 | |||||||
| Valley National Bancorp (NJ) | 8.74 | |||||||
| ConnectOne Bancorp Inc. (NJ) | 5.67 | |||||||
| Blue Foundry MHC (NJ) | 1.62 | 15 out of 45 | ||||||
| Essex County, NJ |
Investors Bancorp Inc (NJ) | 19.66 | ||||||
| Wells Fargo & Co. (CA) | 10.76 | |||||||
| JPMorgan Chase & Co. (NY) | 10.63 | |||||||
| Bank of America Corporation (NC) | 8.71 | |||||||
| Toronto-Dominion Bank | 8.30 | |||||||
| Blue Foundry MHC (NJ) | 0.19 | 29 out of 31 | ||||||
| Morris County, NJ |
Bank of America Corporation (NC) | 16.60 | ||||||
| JPMorgan Chase & Co. (NY) | 12.96 | |||||||
| Toronto-Dominion Bank | 10.26 | |||||||
| Wells Fargo & Co. (CA) | 10.17 | |||||||
| PNC Financial Services Group (PA) | 7.16 | |||||||
| Blue Foundry MHC (NJ) | 0.70 | 22 out of 29 | ||||||
| Passaic County, NJ |
Valley National Bancorp (NJ) | 37.20 | ||||||
| Toronto-Dominion Bank | 9.36 | |||||||
| Lakeland Bancorp (NJ) | 8.60 | |||||||
| PNC Financial Services Group (PA) | 7.63 | |||||||
| Wells Fargo & Co. (CA) | 7.39 | |||||||
| Blue Foundry MHC (NJ) | 0.40 | 15 out of 20 | ||||||
Source: S&P Global Market Intelligence.
| RP® Financial, LC. | PEER GROUP ANALYSIS | |
| III.1 |
III. PEER GROUP ANALYSIS
This chapter presents an analysis of Blue Foundry Bancorp’s operations versus a group of comparable savings institutions (the “Peer Group”) selected from the universe of all publicly-traded savings institutions in a manner consistent with the regulatory valuation guidelines. The basis of the pro forma market valuation of Blue Foundry Bancorp is derived from the pricing ratios of the Peer Group institutions, incorporating valuation adjustments for key differences in relation to the Peer Group. Since no Peer Group can be exactly comparable to Blue Foundry Bancorp, key areas examined for differences are: financial condition; profitability, growth and viability of earnings; asset growth; primary market area; dividends; liquidity of the shares; marketing of the issue; management; and effect of government regulations and regulatory reform.
Peer Group Selection
The Peer Group selection process is governed by the general parameters set forth in the regulatory valuation guidelines. Accordingly, the Peer Group is comprised of only those publicly-traded savings institutions whose common stock is either listed on the NYSE or NASDAQ, since their stock trading activity is regularly reported and generally more frequent than non-publicly traded and closely-held institutions. Institutions that are not listed on the NYSE or NASDAQ are inappropriate, since the trading activity for thinly-traded or closely-held stocks are typically highly irregular in terms of frequency and price and thus may not be a reliable indicator of market value. We have also excluded from the Peer Group those companies under acquisition or subject to rumored acquisition, mutual holding companies and recent conversions, since their pricing ratios are subject to unusual distortion and/or have limited trading history. A recent listing of the universe of all publicly-traded savings institutions is included as Exhibit III-1.
Ideally, the Peer Group, which must have at least 10 members to comply with the regulatory valuation guidelines, should be comprised of locally- or regionally-based institutions with comparable resources, strategies and financial characteristics. There are approximately 43 fully-converted, publicly-traded institutions nationally and, thus, it is typically the case that the Peer Group will be comprised of institutions with relatively comparable characteristics. To the extent that differences exist between the converting institution and the Peer Group, valuation adjustments will be applied to account for the differences. Since Blue Foundry Bancorp will be
| RP® Financial, LC. | PEER GROUP ANALYSIS | |
| III.2 |
a full public company upon completion of the offering, we considered only full public companies to be viable candidates for inclusion in the Peer Group. From the universe of publicly-traded thrifts, we selected ten institutions with characteristics similar to those of Blue Foundry Bancorp. In the selection process, we applied two “screens” to the universe of all public companies that were eligible for consideration:
| • | Screen #1 Mid-Atlantic and New England with assets between $725 million and $2.75 billion, tangible equity/tangible assets ratios of greater than 8.0% and positive core earnings. Seven companies met the criteria for Screen #1 and all seven were included in the Peer Group: ESSA Bancorp, Inc. of Pennsylvania, Hingham Institutions for Savings of Massachusetts, PCSB Financial Corporation of New York, Provident Bancorp, Inc. of Massachusetts, Prudential Bancorp, Inc. of Pennsylvania, Severn Bancorp, Inc. of Maryland and Western New England Bancorp, Inc. of Massachusetts. Exhibit III-2 provides financial and public market pricing characteristics of all publicly-traded Mid-Atlantic, New England and Midwest thrifts. |
| • | Screen #2 Midwest institutions with assets between $725 million and $2.75 billion, tangible equity/tangible assets ratios of greater than 8.0% and positive core earnings. Three companies met the criteria for Screen #2 and all three were included in the Peer Group: HMN Financial, Inc. of Minnesota, IF Bancorp, Inc. of Illinois and Waterstone Financial, Inc. of Wisconsin. Exhibit III-3 provides financial and public market pricing characteristics of all publicly-traded Midwest thrifts. |
Table 3.1 shows the general characteristics of each of the ten Peer Group companies and Exhibit III-4 provides summary demographic and deposit market share data for the primary market areas served by each of the Peer Group companies. While there are expectedly some differences between the Peer Group companies and Blue Foundry Bancorp, we believe that the Peer Group companies, on average, provide a good basis for valuation subject to valuation adjustments. The following sections present a comparison of Blue Foundry Bancorp’s financial condition, income and expense trends, loan composition, interest rate risk and credit risk versus the Peer Group as of the most recent publicly available date. Comparative data for all publicly-traded thrifts has been included in the Chapter III tables as well.
In addition to the selection criteria used to identify the Peer Group companies, a summary description of the key comparable characteristics of each of the Peer Group companies relative to Blue Foundry Bancorp’s characteristics is detailed below.
| • | ESSA Bancorp, Inc. of Pennsylvania. Comparable due to similar asset size, similar impact of loan loss provisions on earnings and similar combined concentration of mortgage-backed securities and 1-4 family loans as a percent of assets. |
| RP® Financial, LC. | Peer Group Analysis | |
| Page III.3 |
Table 3.1
Peer Group of Publicly-Traded Thrifts
As of September 30, 2020 or the Most Recent Data Available
| As of February 5, 2021 |
||||||||||||||||||||||||||||||||
| Ticker |
Financial Institution |
Exchange |
Region |
City |
State |
Total Assets |
Offices | Fiscal |
Conv. Date |
Stock Price |
Market Value |
|||||||||||||||||||||
| ($Mil) | ($) | ($Mil) | ||||||||||||||||||||||||||||||
| ESSA |
ESSA Bancorp, Inc. |
NASDAQGS | MA | Stroudsburg |
PA | $ | 1,894 | 23 | Sep | 4/3/2007 | $ | 15.59 | $ | 157 | ||||||||||||||||||
| HIFS |
Hingham Institution for Savings |
NASDAQGM | NE | Hingham |
MA | $ | 2,719 | 10 | Dec | 12/13/1988 | $ | 236.30 | $ | 505 | ||||||||||||||||||
| HMNF |
HMN Financial, Inc. |
NASDAQGM | MW | Rochester |
MN | $ | 898 | 14 | Dec | 6/30/1994 | $ | 19.00 | $ | 91 | ||||||||||||||||||
| IROQ |
IF Bancorp, Inc. |
NASDAQCM | MW | Watseka |
IL | $ | 726 | 8 | Jun | 7/7/2011 | $ | 20.50 | $ | 66 | ||||||||||||||||||
| PCSB |
PCSB Financial Corporation |
NASDAQCM | MA | Yorktown Heights |
NY | $ | 1,791 | 16 | Jun | 4/20/2017 | $ | 15.75 | $ | 236 | ||||||||||||||||||
| PVBC |
Provident Bancorp, Inc. |
NASDAQCM | NE | Amesbury |
MA | $ | 1,498 | 7 | Dec | 7/15/2015 | $ | 12.10 | $ | 219 | ||||||||||||||||||
| PBIP |
Prudential Bancorp, Inc. |
NASDAQGM | MA | Philadelphia |
PA | $ | 1,223 | 10 | Sep | 3/29/2005 | $ | 12.69 | $ | 101 | ||||||||||||||||||
| SVBI |
Severn Bancorp, Inc. |
NASDAQCM | MA | Annapolis |
MD | $ | 939 | 7 | Dec | NA | $ | 7.80 | $ | 100 | ||||||||||||||||||
| WSBF |
Waterstone Financial, Inc. |
NASDAQGS | MW | Wauwatosa |
WI | $ | 2,221 | 16 | Dec | 10/4/2005 | $ | 19.19 | $ | 455 | ||||||||||||||||||
| WNEB |
Western New England Bancorp, Inc. |
NASDAQGS | NE | Westfield |
MA | $ | 2,487 | 27 | Dec | 12/27/2001 | $ | 7.23 | $ | 178 | ||||||||||||||||||
Source: S&P Global Market Intelligence.
| RP® Financial, LC. | PEER GROUP ANALYSIS | |
| III.4 |
| • | Hingham Institution for Savings of Massachusetts. Comparable due to similar interest-bearing funding composition, similar impact of loan loss provisions on earnings, limited earnings contribution from sources of non-interest operating income and similar concentrations of multi-family and consumer loans as a percent of assets. |
| • | HMN Financial, Inc. of Minnesota. Comparable due to similar size of branch network. |
| • | IF Bancorp, Inc. of Illinois. Comparable due to similar operating expense ratio as a percent of average assets, similar combined concentration of mortgage-backed securities and 1-4 family loans as a percent of assets and similar concentration of construction/land loans as a percent of assets. |
| • | PCSB Financial Corporation of New York. Comparable due to New York metropolitan market area, similar size of branch network, similar asset size, similar interest-earning asset composition, similar impact of loan loss provisions on earnings, limited earnings contribution from sources of non-interest operating income and similar concentrations of construction/land and consumer loans as a percent of assets. |
| • | Provident Bancorp, Inc. of Massachusetts. Comparable due to limited earnings contribution from sources of non-interest operating income and similar concentrations of construction/land and consumer loans as a percent of assets. |
| • | Prudential Bancorp, Inc. of Pennsylvania. Comparable due to relatively low net interest income to average assets ratio, limited earnings contribution from sources of non-interest operating income, similar combined concentration of mortgage-backed securities and 1-4 family loans as a percent of assets and similar concentrations of commercial business and consumer loans as a percent of assets. |
| • | Severn Bancorp, Inc. of Maryland. Comparable due to similar impact of loan loss provisions on earnings and similar concentration of consumer loans as a percent of assets. |
| • | Waterstone Financial, Inc. of Wisconsin. Comparable due to similar size of branch network, similar combined concentration of mortgage-backed securities and 1-4 family loans as a percent of assets, similar concentrations of construction/land, commercial business and consumer loans as a percent of asset and similar ratio of non-performing assets as a percent of assets. |
| • | Western New England Bancorp, Inc. of Massachusetts. Comparable due to similar combined concentration of mortgage-backed securities and 1-4 family loans as a percent of assets, similar concentration of consumer loans as a percent of assets and similar ratio of non-performing assets as a percent of assets. |
In aggregate, the Peer Group companies maintained a similar level of tangible equity as the industry average (12.12% of assets versus 11.69% for all public companies), generated higher earnings as a percent of average assets (0.99% core ROAA versus 0.87% for all public companies) and earned a similar ROE (7.53% core ROE versus 7.23% for all public companies). Overall, the Peer Group’s average P/TB ratio and average core P/E multiple were below and similar to the respective averages for all publicly-traded thrifts.
| RP® Financial, LC. | PEER GROUP ANALYSIS | |
| III.5 |
| All Publicly-Traded |
Peer Group |
|||||||
| Financial Characteristics (Averages) |
||||||||
| Assets ($Mil) |
$ | 5,167 | $ | 1,640 | ||||
| Market capitalization ($Mil) |
$ | 601 | $ | 210 | ||||
| Tangible equity/assets (%) |
11.69 | % | 12.12 | % | ||||
| Core return on average assets (%) |
0.87 | 0.99 | ||||||
| Core return on average equity (%) |
7.23 | 7.53 | ||||||
| All Publicly-Traded |
Peer Group |
|||||||
| Pricing Ratios (Averages)(1) |
||||||||
| Core price/earnings (x) |
13.98 | x | 14.14 | x | ||||
| Price/tangible book (%) |
114.74 | % | 100.85 | % | ||||
| Price/assets (%) |
12.92 | 12.42 | ||||||
| (1) | Based on market prices as of February 5, 2021. |
Ideally, the Peer Group companies would be comparable to Blue Foundry Bancorp in terms of all of the selection criteria, but the universe of publicly-traded thrifts does not provide for an appropriate number of such companies. However, in general, the companies selected for the Peer Group were fairly comparable to Blue Foundry Bancorp, as will be highlighted in the following comparative analysis. Comparative data for all publicly-traded thrifts has been included in the Chapter III tables as well.
Financial Condition
Table 3.2 shows comparative balance sheet measures for Blue Foundry Bancorp and the Peer Group, reflecting the expected similarities and some differences given the selection procedures outlined above. The Company’s and the Peer Group’s ratios reflect balances as of December 31, 2020 and September 30, 2020, respectively. Blue Foundry Bancorp’s equity-to-assets ratio of 10.58% was below the Peer Group’s average net worth ratio of 12.37%. The Company’s pro forma capital position will increase with the addition of stock proceeds, which will provide the Company with an equity-to-assets ratio that will exceed the Peer Group’s ratio. Tangible equity-to-assets ratios for the Company and the Peer Group equaled 10.58% and 12.12%, respectively. The increase in Blue Foundry Bancorp’s pro forma capital position will be favorable from a risk perspective and in terms of future earnings potential that could be realized through leverage and lower funding costs. At the same time, the Company’s higher pro forma capitalization will initially depress return on equity. Both Blue Foundry Bancorp’s and the Peer Group’s capital ratios reflected capital surpluses with respect to the regulatory capital requirements.
| RP® Financial, LC. | Peer Group Analysis | |
| Page III.6 |
Table 3.2
Balance Sheet Composition and Growth Rates
Comparable Institution Analysis
As of September 30, 2020
| Balance Sheet as a Percent of Assets | Balance Sheet Annual Growth Rates | Regulatory Capital | ||||||||||||||||||||||||||||||||||||||||||||||||||||||||||||||||||||||||||||||||||||
| Cash & Equival. |
MBS & Invest |
BOLI | Net Loans (1) |
Deposits | Borrowed Funds |
Sub. Debt |
Total Equity |
Goodwill & Intang |
Tangible Equity |
Assets | MBS, Cash Invests |
Loans | Deposits | Borrows. &Subdebt |
Total Equity |
Tangible Equity |
Tier 1 Leverage |
Tier 1 Risk-Based |
Risk-Based Capital |
|||||||||||||||||||||||||||||||||||||||||||||||||||||||||||||||||||
| Blue Foundry Bancorp |
NJ | |||||||||||||||||||||||||||||||||||||||||||||||||||||||||||||||||||||||||||||||||||||
| December 31, 2020 |
16.29 | % | 13.82 | % | 1.09 | % | 65.23 | % | 69.81 | % | 16.96 | % | 0.00 | % | 10.58 | % | 0.00 | % | 10.58 | % | 4.77 | % | 63.60 | % | -10.12 | % | 4.72 | % | 10.95 | % | -13.48 | % | -7.45 | % | 10.72 | % | 19.93 | % | 21.18 | % | ||||||||||||||||||||||||||||||||||||||||||||||
| All Non-MHC Public Thrifts |
||||||||||||||||||||||||||||||||||||||||||||||||||||||||||||||||||||||||||||||||||||||
| Averages |
8.62 | % | 12.96 | % | 1.54 | % | 73.21 | % | 74.64 | % | 10.75 | % | 0.42 | % | 12.62 | % | 0.92 | % | 11.69 | % | 18.75 | % | 0.00 | % | 14.86 | % | 19.30 | % | 14.55 | % | 9.52 | % | 0.00 | % | 10.75 | % | 15.35 | % | 16.79 | % | ||||||||||||||||||||||||||||||||||||||||||||||
| Medians |
7.76 | % | 9.10 | % | 1.60 | % | 74.90 | % | 76.41 | % | 8.50 | % | 0.00 | % | 11.51 | % | 0.25 | % | 10.31 | % | 12.71 | % | 0.00 | % | 9.90 | % | 15.09 | % | 1.54 | % | 3.55 | % | 0.00 | % | 10.35 | % | 13.47 | % | 14.67 | % | ||||||||||||||||||||||||||||||||||||||||||||||
| Comparable Group |
||||||||||||||||||||||||||||||||||||||||||||||||||||||||||||||||||||||||||||||||||||||
| Averages |
7.66 | % | 13.28 | % | 1.68 | % | 74.60 | % | 76.21 | % | 9.77 | % | 0.22 | % | 12.37 | % | 0.25 | % | 12.12 | % | 12.02 | % | 17.34 | % | 11.26 | % | 16.01 | % | -3.93 | % | 10.88 | % | 10.92 | % | 11.45 | % | 15.03 | % | 16.10 | % | ||||||||||||||||||||||||||||||||||||||||||||||
| Medians |
8.35 | % | 9.98 | % | 1.77 | % | 75.15 | % | 79.43 | % | 6.77 | % | 0.00 | % | 11.38 | % | 0.11 | % | 11.29 | % | 10.18 | % | 9.30 | % | 8.47 | % | 16.89 | % | -16.04 | % | 3.32 | % | 3.35 | % | 10.57 | % | 13.21 | % | 14.35 | % | ||||||||||||||||||||||||||||||||||||||||||||||
| Comparable Group |
||||||||||||||||||||||||||||||||||||||||||||||||||||||||||||||||||||||||||||||||||||||
| ESSA |
ESSA Bancorp, Inc. | PA | 8.23 | % | 11.61 | % | 2.14 | % | 74.90 | % | 81.53 | % | 7.03 | % | 0.00 | % | 10.11 | % | 0.77 | % | 9.34 | % | 5.23 | % | -0.39 | % | 6.74 | % | 14.96 | % | -46.42 | % | 1.00 | % | 1.24 | % | 9.08 | % | 12.64 | % | 13.74 | % | ||||||||||||||||||||||||||||||||||||||||||||
| HIFS |
Hingham Institution for Savings | MA | 8.80 | % | 2.81 | % | 0.47 | % | 86.75 | % | 74.54 | % | 14.72 | % | 0.00 | % | 10.24 | % | 0.00 | % | 10.24 | % | 9.63 | % | 4.61 | % | 10.21 | % | 18.82 | % | -23.34 | % | 17.01 | % | 17.01 | % | 10.35 | % | 13.26 | % | 14.06 | % | ||||||||||||||||||||||||||||||||||||||||||||
| HMNF |
HMN Financial, Inc. | MN | 8.46 | % | 13.31 | % | 0.00 | % | 75.41 | % | 87.60 | % | 0.38 | % | 0.00 | % | 11.26 | % | 0.10 | % | 11.16 | % | 17.72 | % | 31.86 | % | 14.66 | % | 19.32 | % | -20.42 | % | 10.91 | % | 11.14 | % | 9.73 | % | 13.16 | % | 14.41 | % | ||||||||||||||||||||||||||||||||||||||||||||
| IROQ |
IF Bancorp, Inc. | IL | 2.58 | % | 22.79 | % | 1.30 | % | 71.38 | % | 82.88 | % | 4.32 | % | 0.00 | % | 11.51 | % | 0.00 | % | 11.51 | % | 7.05 | % | 14.00 | % | 5.56 | % | 8.13 | % | -10.59 | % | 8.10 | % | 8.10 | % | 10.63 | % | NA | NA | ||||||||||||||||||||||||||||||||||||||||||||||
| PCSB |
PCSB Financial Corporation | NY | 9.09 | % | 18.14 | % | 1.40 | % | 68.56 | % | 76.88 | % | 6.52 | % | 0.00 | % | 15.28 | % | 0.35 | % | 14.93 | % | 7.99 | % | 15.25 | % | 5.56 | % | 11.60 | % | -5.60 | % | -2.79 | % | -2.82 | % | 12.41 | % | 17.56 | % | 18.24 | % | ||||||||||||||||||||||||||||||||||||||||||||
| PVBC |
Provident Bancorp, Inc. | MA | 3.17 | % | 2.36 | % | 2.43 | % | 89.54 | % | 77.99 | % | 5.21 | % | 0.00 | % | 15.98 | % | 0.00 | % | 15.98 | % | 38.91 | % | -3.69 | % | 44.81 | % | 30.20 | % | 130.37 | % | 76.25 | % | 76.25 | % | 12.61 | % | 13.04 | % | 14.29 | % | ||||||||||||||||||||||||||||||||||||||||||||
| PBIP |
Prudential Bancorp, Inc. | PA | 9.74 | % | 37.26 | % | 2.66 | % | 48.09 | % | 63.02 | % | 23.43 | % | 0.00 | % | 10.55 | % | 0.53 | % | 10.03 | % | -5.12 | % | -11.30 | % | 0.49 | % | 3.42 | % | -23.94 | % | -7.52 | % | -7.81 | % | 10.51 | % | 16.88 | % | 18.08 | % | ||||||||||||||||||||||||||||||||||||||||||||
| SVBI |
Severn Bancorp, Inc. | MD | 15.73 | % | 8.05 | % | 0.58 | % | 71.72 | % | 83.42 | % | 2.13 | % | 2.20 | % | 11.53 | % | 0.12 | % | 11.41 | % | 13.68 | % | 94.86 | % | 0.35 | % | 19.19 | % | -34.16 | % | 3.50 | % | 3.53 | % | 13.59 | % | NA | NA | ||||||||||||||||||||||||||||||||||||||||||||||
| WSBF |
Waterstone Financial, Inc. | WI | 3.90 | % | 8.10 | % | 2.85 | % | 81.10 | % | 53.34 | % | 25.18 | % | 0.00 | % | 17.99 | % | 0.03 | % | 17.96 | % | 10.74 | % | 0.07 | % | 11.83 | % | 13.96 | % | 6.45 | % | 3.15 | % | 3.16 | % | 16.87 | % | 21.20 | % | 22.29 | % | ||||||||||||||||||||||||||||||||||||||||||||
| WNEB |
Western New England Bancorp, Inc. | MA | 6.92 | % | 8.36 | % | 2.91 | % | 78.56 | % | 80.88 | % | 8.80 | % | 0.00 | % | 9.26 | % | 0.62 | % | 8.63 | % | 14.40 | % | 28.15 | % | 12.39 | % | 20.47 | % | -11.65 | % | -0.76 | % | -0.64 | % | 8.76 | % | 12.47 | % | 13.71 | % | ||||||||||||||||||||||||||||||||||||||||||||
| (1) | Includes loans held for sale. |
Source: S&P Global Market Intelligence and RP® Financial, LC. calculations. The information provided in this table has been obtained from sources we believe are reliable, but we cannot guarantee the accuracy or completeness of such information.
Copyright (c) 2021 by RP® Financial, LC.
| RP® Financial, LC. | PEER GROUP ANALYSIS | |
| III.7 |
The interest-earning asset compositions for the Company and the Peer Group were somewhat similar, with loans constituting the largest concentration of interest-earning assets for both Blue Foundry Bancorp and the Peer Group. The Company’s loans-to-assets ratio of 65.23% was lower than the comparable Peer Group ratio of 74.60%. Comparatively, the Company’s cash and investments-to-assets ratio of 30.11% was higher than the comparable Peer Group ratio of 20.94%. Overall, Blue Foundry Bancorp’s interest-earning assets amounted to 95.34% of assets, which approximated the comparable Peer Group ratio of 95.54%. The Peer Group’s non-interest earning assets included bank-owned life insurance (“BOLI”) equal to 1.68% of assets and goodwill/intangibles equal to 0.25% of assets, while the Company maintained BOLI equal to 1.09% of assets and a zero balance of goodwill/intangibles.
Blue Foundry Bancorp’s funding liabilities reflected a funding composition that was somewhat similar to that of the Peer Group’s funding composition. The Company’s deposits equaled 69.81% of assets, which was below the Peer Group’s ratio of 76.21%. Comparatively, the Company maintained a higher level of borrowings than the Peer Group, as indicated by borrowings-to-assets ratios of 16.96% and 9.99% for Blue Foundry Bancorp and the Peer Group, respectively. Total interest-bearing liabilities maintained by the Company and the Peer Group, as a percent of assets, equaled 86.77% and 86.20%, respectively.
A key measure of balance sheet strength for a thrift institution is its IEA/IBL ratio. Presently, the Company’s IEA/IBL ratio is lower than the Peer Group’s ratio, based on IEA/IBL ratios of 109.88% and 110.84%, respectively. The additional capital realized from stock proceeds should serve to provide Blue Foundry Bancorp with an IEA/IBL ratio that exceeds the Peer Group’s ratio, as the increase in capital provided by the infusion of stock proceeds will serve to lower the level of interest-bearing liabilities funding assets and will be primarily deployed into interest-earning assets.
The growth rate section of Table 3.2 shows annual growth rates for key balance sheet items. Blue Foundry Bancorp’s and the Peer Group’s growth rates are based on annual growth for the twelve months ended December 31, 2020 and September 30, 2020, respectively. Blue Foundry Bancorp recorded a 4.77% increase in assets, versus asset growth of 12.02% recorded by the Peer Group. Asset growth for Blue Foundry Bancorp was driven by a 63.30% increase in cash and investments, which was in part funded by a 10.12% reduction in loans. Asset growth for the Peer Group included an 11.26% increase in loans and a 17.34% increase in cash and investments.
| RP® Financial, LC. | PEER GROUP ANALYSIS | |
| III.8 |
Deposit growth of 4.72% and a 10.95% increase in borrowings funded the Company’s asset growth. Comparatively, asset growth for the Peer Group was funded through deposit growth of 16.01%, which also funded a 3.93% reduction in borrowings. The Company’s tangible capital decreased 7.45%, which reflects the net loss recorded for 2020 and the elimination of goodwill as the result of impairment. Comparatively, the Peer Group’s tangible capital increased 10.92%, which included a 76.25% increase in tangible capital recorded by Provident Bancorp as the result of completing a second-step offering during the twelve month period. The Company’s post-conversion capital growth rate will initially be constrained by maintenance of a higher pro forma capital position. Additionally, implementation of any stock repurchases and dividend payments, pursuant to regulatory limitations and guidelines, could also slow the Company’s capital growth rate in the longer term following the stock offering.
Income and Expense Components
Table 3.3 displays statements of operations for the Company and the Peer Group. The Company’s and the Peer Group’s ratios are based on earnings for the twelve months ended December 31, 2020 and September 30, 2020, respectively. Blue Foundry Bancorp recorded a net loss equal to 1.63% of average assets, versus net income equal to 1.03% of average assets recorded by the Peer Group. Higher ratios of net interest income, non-interest operating income and non-operating income represented earnings advantages for the Peer Group, while lower ratios for loan loss provision and operating expenses as well as a tax benefit were earnings advantages for the Company.
The Peer Group’s higher net interest income to average assets ratio was primarily realized through a higher interest income ratio, which was facilitated by a higher yield earned on interest-earning assets (3.95% versus 3.32% for the Company). Likewise, the Peer Group’s lower interest expense ratio was facilitated by a lower cost of funds (1.24% versus 1.39% for the Company), as well as maintaining a lower concentration of interest-bearing liabilities as a percent of assets. Overall, Blue Foundry Bancorp and the Peer Group reported net interest income to average assets ratios of 2.02% and 2.85%, respectively.
In another key area of core earnings strength, the Company maintained a lower level of operating expenses than the Peer Group. For the period covered in Table 3.3, the Company and the Peer Group reported operating expense to average assets ratios of 2.53% and 2.84%, respectively. The Company’s lower operating expense ratio was achieved in part through maintaining a comparatively lower number of employees relative to its asset size. Assets per
| RP® Financial, LC. | Peer Group Analysis | |
| Page III.9 |
Table 3.3
Income as Percent of Average Assets and Yields, Costs, Spreads
Comparable Institution Analysis
For the 12 Months Ended September 30, 2020 or the Most Recent 12 Months Available
| Net Interest Income | Non-Interest Income | NonOp Items | Yields, Costs, and Spreads | |||||||||||||||||||||||||||||||||||||||||||||||||||||||||||||||||||||||
| Net Income |
Income | Expense | NII | Loss Provis. on IEA |
NII After Provis. |
Gain on Sale of Loans |
Other Non-Int Income |
Total Non-Int Expense |
Net Gains/ Losses (1) |
Extrao. Items |
Provision for Taxes |
Yield On IEA |
Cost Of IBL |
Yld-Cost Spread |
MEMO: Assets/ FTE Emp. |
MEMO: Effective Tax Rate |
||||||||||||||||||||||||||||||||||||||||||||||||||||||||||
| (%) | (%) | (%) | (%) | (%) | (%) | (%) | (%) | (%) | (%) | (%) | (%) | (%) | (%) | (%) | ($000) | (%) | ||||||||||||||||||||||||||||||||||||||||||||||||||||||||||
| Blue Foundry Bancorp |
NJ | |||||||||||||||||||||||||||||||||||||||||||||||||||||||||||||||||||||||||
| December 31, 2020 |
-1.63 | % | 3.19 | % | 1.17 | % | 2.02 | % | 0.13 | % | 1.89 | % | 0.00 | % | 0.13 | % | 2.53 | % | -1.53 | % | 0.00 | % | -0.41 | % | 3.32 | % | 1.39 | % | 1.93 | % | $ | 11,563 | -19.98 | % | ||||||||||||||||||||||||||||||||||||||||
| All Non-MHC Public Thrifts |
||||||||||||||||||||||||||||||||||||||||||||||||||||||||||||||||||||||||||
| Averages |
0.84 | % | 3.80 | % | 0.85 | % | 2.95 | % | 0.30 | % | 2.67 | % | 0.84 | % | 0.44 | % | 2.78 | % | 0.01 | % | 0.00 | % | 0.26 | % | 4.03 | % | 1.12 | % | 2.91 | % | $ | 8,680 | 22.93 | % | ||||||||||||||||||||||||||||||||||||||||
| Medians |
0.76 | % | 3.63 | % | 0.85 | % | 2.82 | % | 0.24 | % | 2.58 | % | 0.07 | % | 0.30 | % | 2.63 | % | 0.00 | % | 0.00 | % | 0.22 | % | 3.89 | % | 1.13 | % | 2.86 | % | $ | 7,309 | 23.10 | % | ||||||||||||||||||||||||||||||||||||||||
| Comparable Group |
||||||||||||||||||||||||||||||||||||||||||||||||||||||||||||||||||||||||||
| Averages |
1.03 | % | 3.79 | % | 0.94 | % | 2.85 | % | 0.22 | % | 2.63 | % | 1.18 | % | 0.35 | % | 2.84 | % | 0.05 | % | 0.00 | % | 0.35 | % | 3.95 | % | 1.24 | % | 2.72 | % | $ | 10,109 | 24.23 | % | ||||||||||||||||||||||||||||||||||||||||
| Medians |
0.76 | % | 3.76 | % | 0.92 | % | 2.67 | % | 0.20 | % | 2.55 | % | 0.06 | % | 0.35 | % | 2.32 | % | 0.00 | % | 0.00 | % | 0.26 | % | 3.92 | % | 1.16 | % | 2.63 | % | $ | 7,870 | 26.09 | % | ||||||||||||||||||||||||||||||||||||||||
| Comparable Group |
||||||||||||||||||||||||||||||||||||||||||||||||||||||||||||||||||||||||||
| ESSA |
ESSA Bancorp, Inc. |
PA | 0.76 | % | 3.38 | % | 0.84 | % | 2.54 | % | 0.17 | % | 2.37 | % | 0.08 | % | 0.47 | % | 2.01 | % | 0.02 | % | 0.00 | % | 0.17 | % | 3.57 | % | 1.10 | % | 2.47 | % | $ | 7,788 | 18.09 | % | ||||||||||||||||||||||||||||||||||||||
| HIFS |
Hingham Institution for Savings |
MA | 1.71 | % | 4.05 | % | 1.05 | % | 3.01 | % | 0.09 | % | 2.92 | % | 0.00 | % | 0.04 | % | 0.82 | % | 0.23 | % | 0.00 | % | 0.65 | % | 4.12 | % | 1.30 | % | 2.82 | % | $ | 31,618 | 27.62 | % | ||||||||||||||||||||||||||||||||||||||
| HMNF |
HMN Financial, Inc. |
MN | 1.03 | % | 3.85 | % | 0.39 | % | 3.46 | % | 0.22 | % | 3.24 | % | 0.93 | % | 0.66 | % | 3.37 | % | 0.00 | % | 0.00 | % | 0.43 | % | 3.98 | % | 0.62 | % | 3.36 | % | $ | 5,249 | 29.47 | % | ||||||||||||||||||||||||||||||||||||||
| IROQ |
IF Bancorp, Inc. |
IL | 0.64 | % | 3.74 | % | 1.09 | % | 2.65 | % | 0.07 | % | 2.58 | % | 0.17 | % | 0.54 | % | 2.48 | % | 0.07 | % | 0.00 | % | 0.25 | % | 3.85 | % | 1.35 | % | 2.50 | % | $ | 6,661 | 27.95 | % | ||||||||||||||||||||||||||||||||||||||
| PCSB |
PCSB Financial Corporation |
NY | 0.54 | % | 3.51 | % | 0.82 | % | 2.69 | % | 0.17 | % | 2.53 | % | 0.00 | % | 0.16 | % | 2.00 | % | 0.00 | % | 0.00 | % | 0.15 | % | 3.66 | % | 1.13 | % | 2.53 | % | $ | 10,655 | 21.85 | % | ||||||||||||||||||||||||||||||||||||||
| PVBC |
Provident Bancorp, Inc. |
MA | 0.81 | % | 4.56 | % | 0.53 | % | 4.03 | % | 0.51 | % | 3.52 | % | 0.00 | % | 0.29 | % | 2.55 | % | -0.14 | % | 0.00 | % | 0.30 | % | 4.79 | % | 0.96 | % | 3.83 | % | $ | 9,786 | 27.12 | % | ||||||||||||||||||||||||||||||||||||||
| PBIP |
Prudential Bancorp, Inc. |
PA | 0.76 | % | 3.36 | % | 1.54 | % | 1.81 | % | 0.24 | % | 1.57 | % | 0.04 | % | 0.12 | % | 1.32 | % | 0.47 | % | 0.00 | % | 0.13 | % | 3.53 | % | 1.83 | % | 1.70 | % | $ | 13,297 | 14.34 | % | ||||||||||||||||||||||||||||||||||||||
| SVBI |
Severn Bancorp, Inc. |
MD | 0.63 | % | 4.02 | % | 0.88 | % | 3.14 | % | 0.10 | % | 3.04 | % | 0.86 | % | 0.72 | % | 3.71 | % | -0.01 | % | 0.00 | % | 0.27 | % | 4.10 | % | 1.19 | % | 2.91 | % | $ | 5,321 | 30.04 | % | ||||||||||||||||||||||||||||||||||||||
| WSBF |
Waterstone Financial, Inc. |
WI | 2.97 | % | 3.78 | % | 1.28 | % | 2.50 | % | 0.29 | % | 2.21 | % | 9.76 | % | 0.11 | % | 7.98 | % | -0.13 | % | 0.00 | % | 0.99 | % | 4.07 | % | 1.75 | % | 2.32 | % | $ | 2,762 | 25.06 | % | ||||||||||||||||||||||||||||||||||||||
| WNEB |
Western New England Bancorp, Inc. |
MA | 0.42 | % | 3.60 | % | 0.95 | % | 2.65 | % | 0.36 | % | 2.29 | % | 0.00 | % | 0.42 | % | 2.16 | % | -0.02 | % | 0.00 | % | 0.11 | % | 3.86 | % | 1.13 | % | 2.73 | % | $ | 7,951 | 20.74 | % | ||||||||||||||||||||||||||||||||||||||
| (1) | Net gains/losses includes gain/loss on sale of securities and nonrecurring income and expense. |
Source: S&P Global Market Intelligence and RP® Financial, LC. calculations. The information provided in this table has been obtained from sources we believe are reliable, but we cannot guarantee the accuracy or completeness of such information.
Copyright (c) 2021 by RP® Financial, LC.
| RP® Financial, LC. | PEER GROUP ANALYSIS | |
| III.10 |
full time equivalent employee equaled $11.563 million for the Company, versus $10.109 million for the Peer Group.
When viewed together, net interest income and operating expenses provide considerable insight into a thrift’s earnings strength, since those sources of income and expenses are typically the most prominent components of earnings and are generally more predictable than losses and gains realized from the sale of assets or other non-recurring activities. In this regard, as measured by their expense coverage ratios (net interest income divided by operating expenses), the Company’s earnings were less favorable than the Peer Group’s earnings. Expense coverage ratios for Blue Foundry Bancorp and the Peer Group equaled 0.80x and 1.00x, respectively.
Sources of non-interest operating income provided a larger contribution to the Peer Group’s earnings, with such income amounting to 0.13% and 1.53% of Blue Foundry Bancorp’s and the Peer Group’s average assets, respectively. Taking non-interest operating income into account in comparing the Company’s and the Peer Group’s earnings, Blue Foundry Bancorp’s efficiency ratio (operating expenses, as a percent of the sum of non-interest operating income and net interest income) of 117.67% was less favorable than the Peer Group’s efficiency ratio of 64.84%.
Loan loss provisions had a slightly larger impact on the Peer Group’s earnings, as loan loss provisions established by the Company and the Peer Group equaled 0.13% and 0.22% of average assets, respectively
The Company recorded a net non-operating loss equal to 1.53% of average assets, which was largely due to goodwill impairment and the write-down of a Bank office property that was reclassified as held for sale. Comparatively, the Peer Group recorded a net non-operating gain equal to 0.05% of average assets. Typically, gains and losses generated from the sale of assets and other non-operating activities are viewed as earnings with a relatively high degree of volatility, and, thus, are not considered to be part of an institution’s core earnings. Extraordinary items were not a factor in either the Company’s or the Peer Group’s earnings.
The Company recorded an effective tax benefit of 19.98% compared to an effective tax rate of 24.23% for the Peer Group. As indicated in the prospectus, the Company’s effective marginal tax rate is equal to 31.0%.
| RP® Financial, LC. | PEER GROUP ANALYSIS | |
| III.11 |
Loan Composition
Table 3.4 presents data related to the Company’s and the Peer Group’s loan portfolio compositions (including the investment in mortgage-backed securities). In comparison to the Peer Group, the Company’s loan portfolio composition reflected a higher combined concentration of 1-4 family permanent mortgage loans and mortgage-backed securities (39.80% of assets versus 33.11% for the Peer Group), as the Company’s higher concentration of 1-4 family loans was partially offset the Peer Group’s higher concentration of mortgage-backed securities. Loan servicing intangibles constituted a more significant balance sheet item for the Peer Group, equal to an average of $1.4 million for the Peer Group compared to a zero balance for the Company.
Diversification into higher risk and higher yielding types of lending was more significant for the Peer Group. The Peer Group’s loan portfolio composition reflected higher concentrations of commercial real estate loans (21.80% of assets versus 6.60% of assets for the Company), construction/land loans (5.43% of assets versus 1.73% of assets for the Company), commercial business loans (13.22% of assets versus 2.78% of assets for the Company) and consumer loans (0.66% of assets versus 0.01% of assets for the Company), while the Company maintained a higher concentration of multi-family loans (22.00% of assets versus 9.39% of assets for the Peer Group). In total, construction/land, commercial real estate, multi-family, commercial business and consumer loans comprised 33.12% and 50.50% of the Company’s and the Peer Group’s assets, respectively. Overall, the Company’s asset composition provided for a lower risk weighted assets-to-assets ratio of 53.21% compared to 73.94% for the Peer Group.
Interest Rate Risk
Table 3.5 reflects various key ratios highlighting the relative interest rate risk exposure of the Company versus the Peer Group. In terms of balance sheet composition, Blue Foundry Bancorp’s interest rate risk characteristics implied a slightly higher degree of interest rate risk exposure relative to the comparable measures for the Peer Group. In particular, the Company’s tangible equity-to-assets ratio and IEA/IBL ratio were slightly below the respective Peer Group ratios., while the Company’s ratio of non-interest earning assets as a percent of assets approximated the Peer Group’s ratio. On a pro forma basis, the infusion of stock proceeds should serve to strengthen the Company’s balance sheet interest rate risk characteristics, given the increases that will be realized in Company’s tangible equity-to-assets and IEA/IBL ratios.
| RP® Financial, LC. | Peer Group Analysis | |
| Page III.12 |
Table 3.4
Loan Portfolio Composition and Related Information
Comparable Institution Analysis
As of September 30, 2020
| Portfolio Composition as a Percent of Assets | ||||||||||||||||||||||||||||||||||||||||
| MBS | 1-4 Family |
Constr. & Land |
Multi- Family |
Comm RE | Commerc. Business |
Consumer | RWA/ Assets |
Servicing Assets |
||||||||||||||||||||||||||||||||
| (%) | (%) | (%) | (%) | (%) | (%) | (%) | (%) | ($000) | ||||||||||||||||||||||||||||||||
| Blue Foundry Bancorp |
NJ |
|||||||||||||||||||||||||||||||||||||||
| December 31, 2020 |
7.09 | % | 32.71 | % | 1.73 | % | 22.00 | % | 6.60 | % | 2.78 | % | 0.01 | % | 53.21 | % | $ | 0 | ||||||||||||||||||||||
| All Non-MHC Public Thrifts |
||||||||||||||||||||||||||||||||||||||||
| Averages |
7.79 | % | 28.12 | % | 4.32 | % | 11.13 | % | 17.58 | % | 11.17 | % | 1.73 | % | 67.07 | % | $ | 9,686 | ||||||||||||||||||||||
| Medians |
6.76 | % | 24.76 | % | 4.15 | % | 4.17 | % | 15.52 | % | 7.81 | % | 0.21 | % | 67.50 | % | $ | 295 | ||||||||||||||||||||||
| Comparable Group |
||||||||||||||||||||||||||||||||||||||||
| Averages |
8.29 | % | 24.82 | % | 5.43 | % | 9.39 | % | 21.80 | % | 13.22 | % | 0.66 | % | 73.94 | % | $ | 1,357 | ||||||||||||||||||||||
| Medians |
6.96 | % | 23.57 | % | 4.54 | % | 4.64 | % | 21.90 | % | 9.78 | % | 0.21 | % | 73.50 | % | $ | 281 | ||||||||||||||||||||||
| Comparable Group |
||||||||||||||||||||||||||||||||||||||||
| ESSA |
ESSA Bancorp, Inc. |
PA |
4.83 | % | 36.73 | % | 4.60 | % | 5.38 | % | 15.52 | % | 11.29 | % | 2.19 | % | 74.00 | % | $ | 393 | ||||||||||||||||||||
| HIFS |
Hingham Institution for Savings |
MA |
0.00 | % | 38.96 | % | 6.12 | % | 20.88 | % | 21.05 | % | 0.34 | % | 0.02 | % | 77.20 | % | $ | 0 | ||||||||||||||||||||
| HMNF |
HMN Financial, Inc. |
MN |
7.95 | % | 19.33 | % | 5.32 | % | 3.90 | % | 33.80 | % | 11.77 | % | 2.34 | % | 72.99 | % | $ | 2,880 | ||||||||||||||||||||
| IROQ |
IF Bancorp, Inc. |
IL |
20.38 | % | 18.45 | % | 2.14 | % | 14.72 | % | 20.87 | % | 14.98 | % | 1.12 | % | NA | $ | 731 | |||||||||||||||||||||
| PCSB |
PCSB Financial Corporation |
NY |
10.70 | % | 15.42 | % | 1.00 | % | 10.89 | % | 34.86 | % | 5.70 | % | 0.02 | % | 71.05 | % | $ | 0 | ||||||||||||||||||||
| PVBC |
Provident Bancorp, Inc. |
MA |
1.24 | % | 3.89 | % | 2.66 | % | 3.15 | % | 23.25 | % | 57.32 | % | 0.47 | % | 90.73 | % | $ | 0 | ||||||||||||||||||||
| PBIP |
Prudential Bancorp, Inc. |
PA |
19.91 | % | 19.03 | % | 14.17 | % | 2.54 | % | 11.43 | % | 1.55 | % | 0.05 | % | 59.66 | % | $ | 0 | ||||||||||||||||||||
| SVBI |
Severn Bancorp, Inc. |
MD |
6.56 | % | 27.80 | % | 10.78 | % | 1.89 | % | 23.59 | % | 8.27 | % | 0.20 | % | NA | $ | 980 | |||||||||||||||||||||
| WSBF |
Waterstone Financial, Inc. |
WI |
4.02 | % | 38.57 | % | 3.00 | % | 27.00 | % | 10.86 | % | 2.60 | % | 0.04 | % | 78.50 | % | $ | 8,422 | ||||||||||||||||||||
| WNEB |
Western New England Bancorp, Inc. |
MA |
7.36 | % | 30.00 | % | 4.48 | % | 3.59 | % | 22.75 | % | 18.36 | % | 0.21 | % | 67.41 | % | $ | 168 | ||||||||||||||||||||
Source: S&P Global Market Intelligence and RP® Financial, LC. calculations. The information provided in this table has been obtained from sources we believe are reliable, but we cannot guarantee the accuracy or completeness of such information.
Copyright (c) 2021 by RP® Financial, LC.
| RP® Financial, LC. | PEER GROUP ANALYSIS | |
| Page III.13 |
Table 3.5
Interest Rate Risk Measures and Net Interest Income Volatility
Comparable Institution Analysis
As of September 30, 2020 or the Most Recent Date Available.
| Balance Sheet Measures | ||||||||||||||||||||||||||||||||||||||||||
| Tangible Equity/ Assets |
IEA/ IBL |
Non-Earn. Assets/ Assets |
Quarterly Change in Net Interest Income | |||||||||||||||||||||||||||||||||||||||
| 9/30/2020 | 6/30/2020 | 3/31/2020 | 12/31/2019 | 9/30/2019 | 6/30/2019 | |||||||||||||||||||||||||||||||||||||
| (%) | (%) | (%) | (change in net interest income is annualized in basis points) | |||||||||||||||||||||||||||||||||||||||
| Blue Foundry Bancorp |
NJ | |||||||||||||||||||||||||||||||||||||||||
| December 31, 2020 |
10.6 | % | 109.9 | % | 4.7 | % | -12 | -6 | -14 | -24 | -1 | -14 | ||||||||||||||||||||||||||||||
| All Non-MHC Public Thrifts |
||||||||||||||||||||||||||||||||||||||||||
| Average |
11.9 | % | 135.4 | % | 7.2 | % | -15 | -3 | -5 | -3 | -5 | -3 | ||||||||||||||||||||||||||||||
| Median |
10.5 | % | 132.9 | % | 7.2 | % | -10 | -4 | -5 | -2 | -4 | -6 | ||||||||||||||||||||||||||||||
| Comparable Group |
||||||||||||||||||||||||||||||||||||||||||
| Average |
12.1 | % | 111.0 | % | 4.5 | % | 3 | -6 | -6 | -4 | -1 | 0 | ||||||||||||||||||||||||||||||
| Median |
11.3 | % | 110.3 | % | 4.7 | % | 3 | -12 | -7 | -2 | 1 | -4 | ||||||||||||||||||||||||||||||
| Comparable Group |
||||||||||||||||||||||||||||||||||||||||||
| ESSA |
ESSA Bancorp, Inc. | PA | 9.3 | % | 107.0 | % | 5.3 | % | 10 | -14 | -8 | 4 | 2 | 5 | ||||||||||||||||||||||||||||
| HIFS |
Hingham Institution for Savings | MA | 10.2 | % | 110.2 | % | 1.6 | % | 30 | 33 | 2 | 2 | 15 | -6 | ||||||||||||||||||||||||||||
| HMNF |
HMN Financial, Inc. | MN | 11.2 | % | 110.5 | % | 2.8 | % | -11 | -18 | -4 | -20 | -35 | 27 | ||||||||||||||||||||||||||||
| IROQ |
IF Bancorp, Inc. | IL | 11.5 | % | 110.9 | % | 3.2 | % | -2 | 1 | 11 | -12 | 10 | -10 | ||||||||||||||||||||||||||||
| PCSB |
PCSB Financial Corporation | NY | 14.9 | % | 114.8 | % | 4.2 | % | -3 | -17 | -3 | -9 | 7 | 1 | ||||||||||||||||||||||||||||
| PVBC |
Provident Bancorp, Inc. | MA | 16.0 | % | 114.3 | % | 4.9 | % | 5 | -13 | -13 | 2 | -6 | 11 | ||||||||||||||||||||||||||||
| PBIP |
Prudential Bancorp, Inc. | PA | 10.0 | % | 110.0 | % | 4.9 | % | 4 | -7 | -15 | -4 | -8 | -10 | ||||||||||||||||||||||||||||
| SVBI |
Severn Bancorp, Inc. | MD | 11.4 | % | 108.8 | % | 4.5 | % | -12 | -15 | -14 | -5 | -1 | -6 | ||||||||||||||||||||||||||||
| WSBF |
Waterstone Financial, Inc. | WI | 18.0 | % | 118.6 | % | 6.9 | % | 1 | -6 | -15 | 0 | 1 | -9 | ||||||||||||||||||||||||||||
| WNEB |
Western New England Bancorp, Inc. | MA | 8.6 | % | 104.6 | % | 6.2 | % | 9 | -11 | -7 | 2 | 2 | -2 | ||||||||||||||||||||||||||||
NA=Change is greater than 100 basis points during the quarter.
Source: S&P Global Market Intelligence and RP® Financial, LC. calculations. The information provided in this table has been obtained from sources we believe are reliable, but we cannot guarantee the accuracy or completeness of such information.
Copyright (c) 2021 by RP® Financial, LC.
| RP® Financial, LC. | PEER GROUP ANALYSIS | |
| III.14 |
To analyze interest rate risk associated with the net interest margin, we reviewed quarterly changes in net interest income as a percent of average assets for Blue Foundry Bancorp and the Peer Group. In general, the comparative fluctuations in the Company’s and the Peer Group’s net interest income ratios implied that a greater degree of interest rate risk was associated with the Company’s net interest margin, based on the interest rate environment that prevailed during the period covered in Table 3.5. The stability of the Company’s net interest margin should be enhanced by the infusion of stock proceeds, as interest rate sensitive liabilities will be funding a lower portion of Blue Foundry Bancorp’s assets and the proceeds will be substantially deployed into interest-earning assets.
Credit Risk
Overall, based on a comparison of credit risk measures, the Company’s implied credit risk exposure was viewed to be similar to the Peer Group’s credit risk exposure. As shown in Table 3.6, the Company’s ratios for non-performing/assets and non-performing loans/loans equaled 0.74% and 1.07%, respectively, versus comparable measures of 0.85% and 1.10% for the Peer Group. These ratios include accruing loans that are classified as troubled debt restructurings, which accounted for 5% of the Company’s non-performing loan balance at December 31, 2020. The Company’s and Peer Group’s loss reserves as a percent of non-performing loans equaled 123.39% and 203.33%, respectively. Loss reserves maintained as percent of loans receivable equaled 1.33% for the Company, versus 1.15% for the Peer Group. Net loan charge-offs were a slightly larger factor for the Peer Group, as net loan charge-offs for the Peer Group equaled 0.03% of loans compared to a nominal amount for the Company.
Summary
Based on the above analysis, RP Financial concluded that the Peer Group forms a reasonable basis for determining the pro forma market value of the Company. Such general characteristics as asset size, capital position, interest-earning asset composition, funding composition, core earnings measures, loan composition, credit quality and exposure to interest rate risk all tend to support the reasonability of the Peer Group from a financial standpoint. Those areas where differences exist will be addressed in the form of valuation adjustments to the extent necessary.
| RP® Financial, LC. | Peer Group Analysis | |
| Page III.15 |
Table 3.6
Credit Risk Measures and Related Information
Comparable Institution Analysis
As of September 30, 2020
| REO/ Assets |
NPAs & 90+Del/ Assets (1) |
NPLs/ Loans (2) |
Rsrves/ Loans HFI |
Rsrves/ NPLs (2) |
Rsrves/ NPAs & 90+Del (1) |
Net Loan Chargeoffs (3) |
NLCs/ Loans |
|||||||||||||||||||||||||||||||
| (%) | (%) | (%) | (%) | (%) | (%) | ($000) | (%) | |||||||||||||||||||||||||||||||
| Blue Foundry Bancorp |
NJ | |||||||||||||||||||||||||||||||||||||
| December 31, 2020 |
0.03 | % | 0.74 | % | 1.07 | % | 1.33 | % | 123.39 | % | 118.03 | % | $ | 59 | 0.00 | % | ||||||||||||||||||||||
| All Non-MHC Public Thrifts |
||||||||||||||||||||||||||||||||||||||
| Averages |
0.04 | % | 0.69 | % | 0.55 | % | 0.91 | % | 1.16 | % | 182.20 | % | 158.17 | % | $ | 2,583 | ||||||||||||||||||||||
| Medians |
0.01 | % | 0.55 | % | 0.38 | % | 0.72 | % | 1.20 | % | 125.41 | % | 126.86 | % | $ | 268 | ||||||||||||||||||||||
| Comparable Group |
||||||||||||||||||||||||||||||||||||||
| Averages |
0.04 | % | 0.85 | % | 1.10 | % | 1.15 | % | 203.33 | % | 153.88 | % | $ | 356 | 0.03 | % | ||||||||||||||||||||||
| Medians |
0.02 | % | 0.73 | % | 0.88 | % | 1.27 | % | 118.79 | % | 115.62 | % | $ | 358 | 0.04 | % | ||||||||||||||||||||||
| Comparable Group |
||||||||||||||||||||||||||||||||||||||
| ESSA |
ESSA Bancorp, Inc. |
PA | 0.01 | % | 1.41 | % | 1.85 | % | 1.07 | % | 58.13 | % | 57.55 | % | $ | 505 | 0.04 | % | ||||||||||||||||||||
| HIFS |
Hingham Institution for Savings |
MA | 0.14 | % | 0.27 | % | 0.15 | % | 0.71 | % | 482.46 | % | 226.63 | % | $ | 708 | 0.03 | % | ||||||||||||||||||||
| HMNF |
HMN Financial, Inc. |
MN | 0.05 | % | 0.33 | % | 0.38 | % | 1.40 | % | 369.17 | % | 318.16 | % | $ | 447 | 0.07 | % | ||||||||||||||||||||
| IROQ |
IF Bancorp, Inc. |
IL | 0.06 | % | 0.24 | % | 0.23 | % | 1.24 | % | 537.69 | % | 369.45 | % | $ | 268 | 0.05 | % | ||||||||||||||||||||
| PCSB |
PCSB Financial Corporation |
NY | 0.00 | % | 0.33 | % | 0.46 | % | 0.71 | % | 154.58 | % | 146.56 | % | $ | 159 | 0.01 | % | ||||||||||||||||||||
| PVBC |
Provident Bancorp, Inc. |
MA | 0.00 | % | 1.81 | % | 1.99 | % | 1.31 | % | 65.80 | % | 65.80 | % | $ | 1,057 | 0.09 | % | ||||||||||||||||||||
| PBIP |
Prudential Bancorp, Inc. |
PA | 0.00 | % | 1.07 | % | 2.19 | % | 1.39 | % | 63.69 | % | 63.69 | % | $ | 115 | 0.02 | % | ||||||||||||||||||||
| SVBI |
Severn Bancorp, Inc. |
MD | 0.11 | % | 1.55 | % | 1.98 | % | 1.31 | % | 64.15 | % | 59.67 | % | -$ | 394 | -0.06 | % | ||||||||||||||||||||
| WSBF |
Waterstone Financial, Inc. |
WI | 0.03 | % | 0.70 | % | 0.81 | % | 1.31 | % | 127.64 | % | 121.30 | % | -$ | 157 | -0.01 | % | ||||||||||||||||||||
| WNEB |
Western New England Bancorp, Inc. |
MA | 0.00 | % | 0.76 | % | 0.95 | % | 1.05 | % | 109.94 | % | 109.94 | % | $ | 855 | 0.05 | % | ||||||||||||||||||||
| (1) | NPAs are defined as nonaccrual loans, accruing loans 90 days or more past due, performing TDRs, and OREO. |
| (2) | NPLs are defined as nonaccrual loans, accruing loans 90 days or more past due and performing TDRs. |
| (3) | Net loan chargeoffs are shown on a last twelve month basis. |
Source: S&P Global Market Intelligence and RP® Financial, LC. calculations. The information provided in this table has been obrained from sources we believe are reliable, but we cannot guarantee the accuracy or completeness of such information.
Copyright (c) 2021 by RP® Financial, LC.
| RP® Financial, LC. | VALUATION ANALYSIS | |
| IV.1 |
IV. VALUATION ANALYSIS
Introduction
This chapter presents the valuation analysis and methodology prepared pursuant to the regulatory valuation guidelines, and valuation adjustments and assumptions used to determine the estimated pro forma market value of the common stock to be issued in conjunction with the Company’s conversion transaction.
Appraisal Guidelines
The federal regulatory appraisal guidelines required by the FRB, the FDIC and the Department specify the pro forma market value methodology for estimating the pro forma market value of a converting thrift. Pursuant to this methodology: (1) a peer group of comparable publicly-traded institutions is selected; (2) a financial and operational comparison of the subject company to the peer group is conducted to discern key differences; and (3) a valuation analysis in which the pro forma market value of the subject company is determined based on the market pricing of the peer group as of the date of valuation, incorporating valuation adjustments for key differences. In addition, the pricing characteristics of recent conversions, both at conversion and in the aftermarket, must be considered.
RP Financial Approach to the Valuation
The valuation analysis herein complies with such regulatory approval guidelines. Accordingly, the valuation incorporates a detailed analysis based on the Peer Group, discussed in Chapter III, which constitutes “fundamental analysis” techniques. Additionally, the valuation incorporates a “technical analysis” of recently completed stock conversions, including closing pricing and aftermarket trading of such offerings. It should be noted that these valuation analyses cannot possibly fully account for all the market forces which impact trading activity and pricing characteristics of a particular stock on a given day.
The pro forma market value determined herein is a preliminary value for the Company’s to-be-issued stock. Throughout the conversion process, RP Financial will: (1) review changes in Blue Foundry Bancorp’s operations and financial condition; (2) monitor Blue Foundry Bancorp’s operations and financial condition relative to the Peer Group to identify any
| RP® Financial, LC. | VALUATION ANALYSIS | |
| IV.2 |
fundamental changes; (3) monitor the external factors affecting value including, but not limited to, local and national economic conditions, interest rates, and the stock market environment, including the market for thrift stocks; and (4) monitor pending conversion offerings (including those in the offering phase), both regionally and nationally. If material changes should occur during the conversion process, RP Financial will evaluate if updated valuation reports should be prepared reflecting such changes and their related impact on value, if any. RP Financial will also prepare a final valuation update at the closing of the offering to determine if the prepared valuation analysis and resulting range of value continues to be appropriate.
The appraised value determined herein is based on the current market and operating environment for the Company and for all thrifts. Subsequent changes in the local and national economy, the legislative and regulatory environment, the stock market, interest rates, and other external forces (such as natural disasters or major world events), which may occur from time to time (often with great unpredictability) may materially impact the market value of all thrift stocks, including Blue Foundry Bancorp’s value, or Blue Foundry Bancorp’s value alone. To the extent a change in factors impacting the Company’s value can be reasonably anticipated and/or quantified, RP Financial has incorporated the estimated impact into the analysis.
Valuation Analysis
A fundamental analysis discussing similarities and differences relative to the Peer Group was presented in Chapter III. The following sections summarize the key differences between the Company and the Peer Group and how those differences affect the pro forma valuation. Emphasis is placed on the specific strengths and weaknesses of the Company relative to the Peer Group in such key areas as financial condition, profitability, growth and viability of earnings, asset growth, primary market area, dividends, liquidity of the shares, marketing of the issue, management, and the effect of government regulations and/or regulatory reform. We have also considered the market for thrift stocks, in particular new issues, to assess the impact on value of the Company coming to market at this time.
| RP® Financial, LC. | VALUATION ANALYSIS | |
| IV.3 |
| 1. | Financial Condition |
The financial condition of an institution is an important determinant in pro forma market value because investors typically look to such factors as liquidity, capital, asset composition and quality, and funding sources in assessing investment attractiveness. The similarities and differences in the Company’s and the Peer Group’s financial strengths are noted as follows:
| • | Overall A/L Composition. In comparison to the Peer Group, the Company’s interest-earning asset composition showed a lower concentration of loans and a higher concentration of cash and investments. The Peer Group’s loan portfolio composition as a percent of assets reflected a greater degree of diversification into higher risk and higher yielding types of loans. Overall, in comparison to the Peer Group, the Company’s interest-earning asset composition provided for a lower yield earned on interest-earning assets and a lower risk weighted assets-to-assets ratio. Blue Foundry Bancorp’s funding composition reflected a lower level of deposits and a higher level of borrowings relative to the comparable Peer Group ratios, which translated into a higher cost of funds for the Company. Overall, as a percent of assets, the Company maintained a similar levels of interest-earning assets and interest-bearing liabilities compared to the Peer Group’s ratios, which resulted in similar IEA/IBL ratios for the Company and the Peer Group. After factoring in the impact of the net stock proceeds, the Company’s IEA/IBL ratio should exceed the Peer Group’s ratio. On balance, RP Financial concluded that asset/liability composition was a slightly negative factor in our adjustment for financial condition. |
| • | Credit Quality. The Company’s ratios for non-performing assets and non-performing loans were similar to the comparable Peer Group ratios. The Company and the Peer Group maintained similar loss reserves as a percent of non-performing loans, while the Peer Group maintained a slightly higher level of loss reserves as a percent of loans. Net loan charge-offs were a slightly larger factor for the Company. As noted above, the Company’s risk weighted assets-to-assets ratio was lower than the Peer Group’s ratio. Overall, RP Financial concluded that credit quality was a neutral factor in our adjustment for financial condition. |
| • | Balance Sheet Liquidity. The Company operates with a higher level of cash and investment securities relative to the Peer Group (30.11% of assets versus 20.94% for the Peer Group). Following the infusion of stock proceeds, the Company’s cash and investments ratio is expected to increase as the proceeds retained at the holding company level will be initially deployed into investments. The Company’s future borrowing capacity was considered to be slightly less than the Peer Group’s borrowing capacity, based on the higher level of borrowings that were maintained by the Company. Overall, RP Financial concluded that balance sheet liquidity was a slightly positive factor in our adjustment for financial condition. |
| • | Funding Liabilities. The Company’s interest-bearing funding composition reflected a lower concentration of deposits and a higher level of borrowings relative to the comparable Peer Group ratios, which translated into a higher cost of funds for the Company. Total interest-bearing liabilities as a percent of assets were similar for the Company and the Peer Group. Following the stock offering, the increase in the Company’s capital position will reduce the level of interest-bearing liabilities funding the Company’s assets. Overall, RP Financial concluded that funding liabilities were a slightly negative factor in our adjustment for financial condition. |
| • | Capital. The Company currently operates with a lower equity-to-assets ratio than the Peer Group. However, following the stock offering, Blue Foundry Bancorp’s pro forma capital position will likely exceed the Peer Group’s equity-to-assets ratio. The increase in the Company’s pro forma capital position will result in greater leverage potential and reduce the level of interest-bearing liabilities utilized to fund assets. At the same time, the Company’s more significant capital surplus will likely result in a lower ROE. On balance, RP Financial concluded that capital strength was a slightly positive factor in our adjustment for financial condition. |
| RP® Financial, LC. | VALUATION ANALYSIS | |
| IV.4 |
On balance, Blue Foundry Bancorp’s balance sheet strength was considered to be comparable to the Peer Group’s balance sheet strength and, thus, no adjustment was applied for the Company’s financial condition.
| 2. | Profitability, Growth and Viability of Earnings |
Earnings are a key factor in determining pro forma market value, as the level and risk characteristics of an institution’s earnings stream and the prospects and ability to generate future earnings heavily influence the multiple that the investment community will pay for earnings. The major factors considered in the valuation are described below.
| • | Reported Earnings. The Company’s reported earnings were lower than the Peer Group’s on a ROAA basis, as the Company reported a net loss equal to 1.63% of average assets. Comparatively, the Peer Group’s ROAA on a reported bases equaled 1.03%. The Company maintained a more favorable ratios for operating expenses and loan loss provisions, while the Peer Group’s maintained more favorable ratios for net interest income, non-interest operating income and net non-operating income. Reinvestment of stock proceeds into interest-earning assets will serve to increase the Company’s earnings, with the benefit of reinvesting proceeds expected to be somewhat offset by higher operating expenses associated with operating as a publicly-traded company and the implementation of stock benefit plans. Overall, the Company’s pro forma reported earnings were viewed as not as strong as the Peer Group’s earnings and, thus, RP Financial concluded that reported earnings were a moderately negative factor in our adjustment for profitability, growth and viability of earnings. |
| • | Core Earnings. Net interest income, operating expenses, non-interest operating income and loan loss provisions were reviewed in assessing the relative strengths and weaknesses of the Company’s and the Peer Group’s core earnings. In these measures, the Company operated with a lower net interest income ratio, a lower operating expense ratio, a lower level of non-interest operating income and a lower level of loan loss provisions. The Company’s ratios for net interest income and operating expenses translated into a lower expense coverage ratio in comparison to the Peer Group’s ratio (equal to 0.80x versus 1.00X for the Peer Group). Likewise, the Company’s efficiency ratio of 117.67% was less favorable than the Peer Group’s efficiency ratio of 64.84%. Loan loss provisions had a slightly larger impact on the Peer Group’s earnings. Overall, these measures, as well as the expected earnings benefits the Company should realize from the redeployment of stock proceeds into interest-earning assets and leveraging of post-conversion capital, which will be somewhat negated by expenses associated with the stock benefit plans and operating as a publicly-traded company, indicate that the Company’s pro forma core earnings will be less favorable than the Peer Group’s core earnings. Therefore, RP Financial concluded that this was a moderately negative factor in our adjustment for profitability, growth and viability of earnings. |
| RP® Financial, LC. | VALUATION ANALYSIS | |
| IV.5 |
| • | Interest Rate Risk. Quarterly changes in the Company’s and the Peer Group’s net interest income to average assets ratios indicated a greater degree of volatility was associated with the Company’s net interest margin. Other measures of interest rate risk, such as tangible equity/assets, IEA/IBL and non-interest earning assets/assets ratios were slightly more favorable for the Peer Group. On a pro forma basis, the infusion of stock proceeds can be expected to provide the Company with tangible equity-to-assets and IEA/ILB ratios that will exceed the Peer Group’s ratios, as well as enhance the stability of the Company’s net interest margin through the reinvestment of stock proceeds into interest-earning assets. On balance, RP Financial concluded that interest rate risk was a neutral factor in our adjustment for profitability, growth and viability of earnings. |
| • | Credit Risk. Loan loss provisions were a slightly larger factor in the Peer Group’s earnings (0.22% of average assets versus 0.13% of average assets for the Company). In terms of future exposure to credit quality related losses, the Peer Group maintained a higher concentration of assets in loans and exhibited a greater degree of lending diversification into higher risk types of loans. Credit quality measures for non-performing assets and loss reserves as a percent of non-performing loans and as a percent of loans were fairly similar for the Company and the Peer Group. Overall, RP Financial concluded that credit risk was a neutral negative factor in our adjustment for profitability, growth and viability of earnings. |
| • | Earnings Growth Potential. Several factors were considered in assessing earnings growth potential. First, the Peer Group maintained a higher interest rate spread than the Company, which would tend to facilitate the Peer Group continuing to maintain a stronger net interest margins going forward. Second, the infusion of stock proceeds will provide the Company with more significant growth potential through leverage than currently maintained by the Peer Group. Third, the Peer Group’s higher ratio of non-interest operating income and the Company’s lower operating expense ratio were viewed as respective advantages for the Company and Peer Group to sustain earnings growth during periods when net interest margins come under pressure as the result of adverse changes in interest rates. Overall, earnings growth potential was considered to be a neutral factor in our adjustment for profitability, growth and viability of earnings. |
| • | Return on Equity. Currently, the Company’s core ROE is lower than the Peer Group’s core ROE. Accordingly, as the result of the significant increase in capital that will be realized from the infusion of net stock proceeds into the Company’s equity, the Company’s pro forma return on equity on a core earnings basis will continue to be less than the Peer Group’s return on equity ratio. Accordingly, this was a moderately negative factor in the adjustment for profitability, growth and viability of earnings. |
On balance, Blue Foundry Bancorp’s pro forma earnings strength was considered to be less favorable than the Peer Group’s and, thus, a moderate downward adjustment was applied for profitability, growth and viability of earnings.
| RP® Financial, LC. | VALUATION ANALYSIS | |
| IV.6 |
| 3. | Asset Growth |
The Company recorded a 4.77% increase in assets, versus a 12.02% increase in assets recorded by the Peer Group. Asset growth for the Company was primarily driven by an increase in cash and investments, which was partially offset by a decline in loans. Comparatively, the Peer Group’s asset growth was primarily sustained by loan growth and supplemented with growth of cash and investments. On a pro forma basis, the Company’s tangible equity-to-assets ratio will exceed the Peer Group’s tangible equity-to-assets ratio, indicating greater leverage capacity for the Company. On balance, no adjustment was applied for asset growth.
| 4. | Primary Market Area |
The general condition of an institution’s market area has an impact on value, as future success is in part dependent upon opportunities for profitable activities in the local market served. Blue Foundry Bancorp serves northern New Jersey through 17 full service branch locations. Operating in a densely populated market area provides the Company with growth opportunities, but such growth must be achieved in a highly competitive market environment. The Company competes against significantly larger institutions that provide a larger array of services and have significantly larger branch networks than maintained by Blue Foundry Bancorp. The competitiveness of the market area is highlighted by the Company’s relatively low market share of deposits in Bergen County.
On average, the Peer Group companies generally operate in markets with smaller populations compared to Bergen County. Population growth for the primary market area counties served by the Peer Group companies reflect a range of growth rates, but overall population growth rates in the markets served by the Peer Group companies were higher compared to population shrinkage that was experienced by Bergen County during the past five years. However, Bergen County’s population growth over the next five years is projected to match the Peer Group’s projected population growth rate. Bergen County has a higher per capita income compared to the Peer Group’s average per capita income and the Peer Group’s primary market area counties were relatively less affluent markets within their respective states compared to Bergen County which had a significantly higher per capita income compared to New Jersey’s per capita income. The average and median deposit market shares maintained by the Peer Group companies were well above the Company’s market share of deposits in Bergen County. Overall, the degree of competition faced by the Peer Group companies was
| RP® Financial, LC. | VALUATION ANALYSIS | |
| IV.7 |
viewed as less than faced by the Company, while the growth potential in the markets served by the Peer Group companies was for the most part viewed to be similar to the Company’s primary market area growth potential. Summary demographic and deposit market share data for the Company and the Peer Group companies is provided in Exhibit III-4. As shown in Table 4.1, the average unemployment rate for the primary market area counties served by the Peer Group companies was the same as the unemployment rate reflected for Bergen County. On balance, we concluded that no adjustment was appropriate for the Company’s market area.
Table 4.1
Market Area Unemployment Rates
Blue Foundry Bancorp and the Peer Group Companies(1)
| County | December 2020 Unemployment |
|||||||
| Blue Foundry Bancorp - NJ |
Bergen | 6.8 | % | |||||
| Peer Group Average |
6.8 | % | ||||||
| ESSA Bancorp, Inc. – PA |
Monroe | 7.8 | % | |||||
| Hingham Institution for Savings – MA |
Plymouth | 7.3 | ||||||
| HMN Financial, Inc. – MN |
Olmstead | 3.8 | ||||||
| IF Bancorp, Inc. - IL |
Iroquois | 4.7 | ||||||
| PCSB Financial Corporation – NY |
Westchester | 6.0 | ||||||
| Provident Bancorp, Inc. – MA |
Essex | 7.7 | ||||||
| Prudential Bancorp, Inc. – PA |
Philadelphia | 9.3 | ||||||
| Severn Bancorp, Inc. - MD |
Anne Arundel | 4.9 | ||||||
| Waterstone Financial, Inc. – WI |
Milwaukee | 7.1 | ||||||
| Western New England Bancorp, Inc. – MA |
Hampden | 8.9 | ||||||
| (1) | Unemployment rates are not seasonally adjusted. |
Source: U.S. Bureau of Labor Statistics.
| 5. | Dividends |
At this time the Company has not established a dividend policy. Future declarations of dividends by the Board of Directors will depend upon a number of factors, including investment opportunities, growth objectives, financial condition, profitability, tax considerations, minimum capital requirements, regulatory limitations, stock market characteristics and general economic conditions.
| RP® Financial, LC. | VALUATION ANALYSIS | |
| IV.8 |
Nine out of the ten Peer Group companies pay regular cash dividends, with implied dividend yields ranging from 0.80% to 2.82%. The average dividend yield on the stocks of the Peer Group institutions equaled 1.83% as of February 5, 2021. Comparatively, as of February 5, 2021, the average dividend yield on the stocks of all fully-converted publicly-traded thrifts equaled 2.36%.
While the Company has not established a definitive dividend policy prior to converting, the Company’s dividend paying capacity is viewed to be less than Peer Group’s capacity to pay dividends, based on the Company’s lower pro forma core earnings. On balance, we concluded that a slight downward adjustment was warranted for this factor.
| 6. | Liquidity of the Shares |
The Peer Group is by definition composed of companies that are traded in the public markets. All ten of the Peer Group members trade on the NASDAQ. Typically, the number of shares outstanding and market capitalization provides an indication of how much liquidity there will be in a particular stock. The market capitalization of the Peer Group companies ranged from $66.4 million to $505.0 million as of February 5, 2021, with average and median market values of $210.1 million and $161.3 million, respectively. The shares issued and outstanding of the Peer Group companies ranged from 2.1 million to 24.9 million, with average and median shares outstanding of 11.6 million and 10.4 million, respectively. The Company’s stock offering is expected to have a pro forma market value that will be similar to the Peer Group’s average market value, while the Company’s pro forma shares outstanding will be in the upper end or exceed the Peer Group’s range of shares outstanding Like all of the Peer Group companies, the Company’s stock will be quoted on the NASDAQ following the stock offering. Overall, we anticipate that the Company’s stock will have a comparable trading market as the Peer Group companies on average and, therefore, concluded no adjustment was necessary for this factor.
| 7. | Marketing of the Issue |
We believe that three separate markets exist for thrift stocks, including those coming to market such as Blue Foundry Bancorp: (1) the after-market for public companies, in which trading activity is regular and investment decisions are made based upon financial condition, earnings, capital, ROE, dividends and future prospects; (2) the new issue market in which converting thrifts are evaluated on the basis of the same factors, but on a pro forma basis without the benefit of prior operations as a fully-converted publicly-held company and stock trading history; and (3) the acquisition market for thrift franchises in New Jersey. All three of these markets were considered in the valuation of the Company’s to-be-issued stock.
| RP® Financial, LC. | VALUATION ANALYSIS | |
| IV.9 |
| A. | The Public Market |
The value of publicly-traded thrift stocks is easily measurable, and is tracked by most investment houses and related organizations. Exhibit IV-1 provides pricing and financial data on all publicly-traded thrifts. In general, thrift stock values react to market stimuli such as interest rates, inflation, perceived industry health, projected rates of economic growth, regulatory issues and stock market conditions in general. Exhibit IV-2 displays historical stock market trends for various indices and includes historical stock price index values for thrifts and commercial banks. Exhibit IV-3 displays various stock price indices as of February 5, 2021.
In terms of assessing general stock market conditions, the performance of the overall stock market has been mixed in recent quarters. Stocks opened the second quarter of 2020 with a bruising sell-off after President Trump issued a warning on the coronavirus pandemic, which was followed by major U.S. stock indexes surging higher. News that New York recorded its first daily decline in Covid-19 deaths and the Federal Reserve’s commitment to provide an unprecedent level of support for the economy were noted factors that powered the stock market rally. The second week of April concluded with stocks posting their biggest week of gains since 1974. Stocks advanced a second consecutive week going into mid-April, as investors reacted to reports that an antiviral medicine was showing promise and the growing potential for the gradual reopening of the U.S. economy. Energy shares led stocks lower heading into the second half of April, as oil prices plunged below $0 a barrel. Promising news for a coronavirus drug and the Federal Reserve’s statement that it was in no hurry to end stimulus measures contributed to broader stock market gains through the end of April. Overall, April was the best month for stocks in decades, as the Dow Jones Industrial Average (“DJIA”) and S&P 500 posted respective gains of 11% and 13%. Comparatively, the NASDAQ was down 0.3% in April. Following a sell-off at the start of May, the broader stock market trended higher ahead of the April employment report and then rallied sharply higher with the release of the April employment report on May 8th. Stocks fell broadly the first few trading days the following week, as investors reacted to a sharp decline in the April consumer price index and the Federal Reserve’s grim assessment on how long it would take the U.S. economy to recover. Going into the second half of May, stocks surged higher on positive results reported by a drugmaker’s early study of a potential coronavirus vaccine and optimism that the U.S. economy would start to recover as all 50 states relaxed some of their coronavirus restrictions. Optimism about economies reopening and the potential development of a coronavirus vaccine continued to propel stock market gains in late-May and early-June. Stocks continued to surge higher to
| RP® Financial, LC. | VALUATION ANALYSIS | |
| IV.10 |
close out the first week of trading in June, as investors reacted to a surprisingly strong May employment report. The rebound in the broader stock market continued into the beginning of the second week of June, with the NASDAQ closing at a record high and the S&P 500 moving into positive territory for the year. Stocks closed out the second week of trading in June posting their worst weekly loss since March, as growing fears of a surge in coronavirus infections fueled a stock market route on June 11th. After Federal Reserve officials highlighted the pandemic’s potential to weaken the U.S. economy over the long-term, shares of banks and manufacturers were among the hardest hit stocks in the sell-off. A rebound in May retail sales and the Federal Reserve’s announcement that it would broaden its program to purchase bonds of U.S. companies translated into stocks rallying going into the second half of June, which was followed by a wavering stock market environment through multiple trading sessions as investors weighed a rise in coronavirus infections against signs of the U.S. economy recovering. A record number of new coronavirus cases in some large states fueled a late-June sell-off in the broader stock market, as investors reacted to reinstatement of lockdown measures by some of those states. Growing expectations for additional stimulus from the Federal Reserve contributed to stocks rallying to close out the second quarter, as U.S. stocks wrapped up their best quarter in more than 20 years. For the second quarter of 2020, the DJIA was up 18%, the S&P 500 was up 20% and the NASDAQ was up 31%.
Stocks started out the third quarter of 2020 trading mixed ahead of the release of the June employment report and then rallied higher with the release of the June employment report, which showed the U.S. economy added more jobs than expected. Volatility prevailed in the broader stock market through mid-July, as investors weighed hopes of a Covid-19 vaccine after two companies received “fast track” designations for the development of their coronavirus vaccine candidates against a resurgence in Covid-19 positive cases that was providing for an uneven reopening of the U.S. economy. Stocks retreated heading into the last week of July, as the first weekly increase in new unemployment claims since March raised concerns that mounting coronavirus infections and a renewed wave of mandated lockdowns could slow an economic recovery. The broader stock market continued to trade unevenly in the final week of July, as investors reacted to mixed second quarter earnings reports by some large companies, a record decline in second quarter GDP and the Federal Reserve’s reiteration that it would continue to support the U.S. economy. Overall, technology stocks were the strongest performing stocks during July, as the NASDAQ closed out July at a new record high. Progress in Congressional negotiations for a new coronavirus relief package and initial weekly
| RP® Financial, LC. | VALUATION ANALYSIS | |
| IV.11 |
unemployment claims falling to their lowest level since the coronavirus hit the U.S. in March fueled stock market gains during the first week of August. The DJIA extended its winning streak to seven sessions on August 10th, as investors assessed the likelihood of another round of stimulus spending and the slowing pace of new coronavirus infections. Led by advances in technology shares, the broader stock market continued to surge higher through the second half of August with the NASDAQ and S&P 500 posting a number of new record highs. Overall, the month of August was the best month for U.S. stocks since April, with stimulus from the U.S. Government, signs of economic revival and progress toward a coronavirus vaccine fueling the gains in the broader stock market. An upbeat report on August manufacturing activity helped to extend the stock market rally into early-September, as the DJIA closed above 29000 for the first time since February. A sell-off in technology stocks led the stock market lower going into the second week of September, as NASDAQ fell into correction territory amid concerns that technology shares had become overvalued. Stocks rebounded heading into mid-September, as technology stocks led the broader stock market higher on large acquisitions announced by Oracle and Nvidia. A decline in oil and gold prices pressured economically sensitive shares lower going in the second half of September, which was followed by a one-day sell-off in technology shares as hopes for additional fiscal stimulus dimmed and investors continued to question the valuation of tech stocks. Stocks regained some lost ground in the final week of the third quarter, which was led by a rebound in economically sensitive shares.
Stocks traded lower at the start of the fourth quarter of 2020, as investors reacted to the September employment report that showed job growth was less than expected. News of President Trump’s improving health propelled stocks higher at the beginning of the second week of October, which was followed by a one-day sell-off caused by a halt in negotiations for a new economic relief package. Stocks rallied higher following the one-day sell-off on revived hopes for a new stimulus deal, as Democratic and White House negotiators resumed negotiations for a coronavirus relief bill. Mixed earnings reports at the start of the third quarter earnings season pressured stocks lower going into mid-October. The sell-off in the broader stock market sharpened during the second half of October, as a surge in coronavirus cases added to worries about the economic outlook in the absence of a stimulus deal. Better-than-expected economic data for third quarter GDP growth and October manufacturing activity contributed to stocks rallying ahead of the election in early-November. The stock market rallied continued on Election Day and the following day, as Wall Street reacted to election results that indicated a Biden presidency gridlocked by a Republican-controlled Senate. News of promising
| RP® Financial, LC. | VALUATION ANALYSIS | |
| IV.12 |
results for two Covid-19 vaccines bolstered stock markets gains through the end of November, which included the DJIA closing above 30000 for the first time. Overall, for the month of November, the DJIA increased 12%, marking its best month since January 1987, while the NASDAQ and S&P 500 posted respective gains of 12% and 11%. Signs of progress on a stimulus relief package and the effectiveness rates for the forthcoming Covid-19 vaccines helped to sustain the broader stock market rally through the first week of December, with the NASDAQ and S&P 500 closing at new record highs. Stocks retreated going into mid-December, as negotiations over a coronavirus relief package stalled. As Congress neared a deal on a new coronavirus relief package, all three major U.S. stock indexes closed at record highs going into the second half of December. Stocks paused after closing at new record highs, as Covid-19 concerns overshadowed Congress’s approval of a coronavirus relief package. All three major U.S. stock indexes closed at record highs in the final week of 2020, as the rollout of the coronavirus vaccine and passage of a new stimulus package buoyed investors’ sentiment.
A wave of new Covid-19 infections prompted a sell-off in the broader stock at the at the start of 2021, which was followed by stocks rallying higher on expectations that there would be a big boost in government spending under a Democrat-controlled Senate. Stocks fell in mid-January, as initial jobless claims posted their biggest weekly increase since the Covid-19 pandemic hit in March. After all three major U.S. stock indexes closed at record highs going into the second half of January, all three major U.S. stock indexes suffered their sharpest losses in late-January amid concerns about how effectively the Covid-19 vaccine was being distributed. Robust fourth quarter earnings posted by some large-cap stocks and a decline in initial jobless claims for a third straight week contributed to stocks rallying higher in the first week of February. On February 5, 2021, the DJIA closed at 31148.24, an increase of 7.0% from one year ago and an increase of 1.8% year-to-date, and the NASDAQ closed at 13856.30, an increase of 45.5% from one year ago and an increase of 7.5% year-to-date. The S&P 500 Index closed at 3886.83 on February 5, 2021, an increase of 16.8% from one year ago and an increase of 3.5% year-to-date.
The market for thrift stocks has also experienced varied trends in recent quarters. Financial shares pulled back in early-July 2020 amid a dramatic surge in confirmed coronavirus infections in the south and west regions of the U.S., which forced several states to pause or reverse plans to reopen businesses. Growing optimism of a Covid-19 vaccine being developed in the near term contributed to financial shares trading higher along with the broader stock market heading into mid-July, which was followed by a slight pullback in financial shares as big
| RP® Financial, LC. | VALUATION ANALYSIS | |
| IV.13 |
bank second quarter earnings reports warned of a protracted downturn for the U.S. economy. Financial shares traded unevenly throughout the second half of July, in light of uncertainty over the outlook for the U.S. economy and related impact on credit quality. After trading lower the first few trading days of August, financial shares participated in the broader stock market rally going into mid-August. Financial shares diverged from the broader stock market rally in the second half of August and into early-September, as economic uncertainty revolving around the Covid-19 pandemic weighed on the shares of economically sensitive stocks. After trading higher with the release of the better-than-expected employment report for August 2020, thrift stocks retreated in the second week of September. Financial shares edged higher at the conclusion of the Federal Reserve’s mid-September policy meeting, whereby the Federal Reserve pledged to support the economic recovery by setting a higher bar to raise interest rates and by signaling it expected to hold rates near zero for at least three more years. The sell-off in economically sensitive shares going into the second half of September translated into market losses for bank and thrift stocks, which was followed by an uptick in financial shares at the close of the third quarter.
The positive trend in thrift stocks continued through the first two weeks of October 2020, as economically sensitive stocks climbed on hopes for passage of a new coronavirus stimulus bill. Despite better-than-expected third quarter earnings results posted by some big banks at the start of the third quarter earnings season, financial shares traded lower in mid-October. Financial shares rallied going into late-October, as news that weekly initial jobless claims fell by 55,000 pushed the 10-year Treasury yield up to 0.85%. Financial shares sold-off along with the broader stock market during the last week of October, as rising coronavirus cases shook investors’ confidence in the economic recovery. Financial shares also participated in the broader stock market rally during the first two trading days of November and on Election Day, but then diverged from the broader stock market rally the day following the election as investors bet that the election results and a potentially long period of vote counting would delay and potentially reduce another round of stimulus. Amid building hopes that drug-makers were on the brink of pushing out vaccines effective enough to fight the coronavirus, economically sensitive stocks, such as bank stocks, were among the strongest performing sectors for the balance of November. After trading lower on last day of November, the positive trend in thrift stocks resumed through the first half of December on signs of a progress in negotiations over a coronavirus relief package. Amid a surge in coronavirus infections and the Federal Reserve leaving its benchmark interest rate near zero, thrift shares edged lower going into final week of 2020 and then rebounded in the last week of 2020 after President Trump signed a Covid-19 relief bill.
| RP® Financial, LC. | VALUATION ANALYSIS | |
| IV.14 |
Thrift shares traded flat at the start of 2021 and then rallied higher in the second week of January on expectations of additional stimulus after Democrats took control of the Senate. Thrift shares reversed course and trended lower in the second half of January on concerns over the lingering economic impact of the coronavirus and related impact on loan demand and credit quality. A decline in coronavirus cases across the U.S. helped thrift shares to rebound in the first week of February. On February 5, 2021, the SNL Thrift Index for all publicly-traded thrifts closed at 851.8, a decrease of 5.2% from one year ago and an increase of 4.3% year-to-date.
| B. | The New Issue Market |
In addition to thrift stock market conditions in general, the new issue market for converting thrifts is also an important consideration in determining the Company’s pro forma market value. The new issue market is separate and distinct from the market for seasoned thrift stocks in that the pricing ratios for converting issues are computed on a pro forma basis, specifically: (1) the numerator and denominator are both impacted by the conversion offering amount, unlike existing stock issues in which price change affects only the numerator; and (2) the pro forma pricing ratio incorporates assumptions regarding source and use of proceeds, effective tax rates, stock plan purchases, etc. which impact pro forma financials, whereas pricing for existing issues are based on reported financials. The distinction between pricing of converting and existing issues is perhaps no clearer than in the case of the price/book (“P/B”) ratio in that the P/B ratio of a converting thrift will typically result in a discount to book value whereas in the current market for existing thrifts the P/B ratio may reflect a premium to book value. Therefore, it is appropriate to also consider the market for new issues, both at the time of the conversion and in the aftermarket.
As shown in Table 4.2, there have been no standard conversions completed during the past three months. The most recently completed standard conversion offering, which is considered to be relevant for Blue Foundry Bancorp’s pro forma pricing, was completed by Eastern Bankshares, Inc. of Massachusetts (“Eastern”) on October 15, 2020. Eastern raised gross proceeds of $1.8 billion, which was slightly above the maximum of its offering range. Eastern’s closing pro forma price/tangible book ratio equaled 65.0%. Eastern’s stock price was up 24.8%s after the first week of trading. As of February 5, 2021, Eastern’s stock price was up
| RP® Financial, LC. | Valuation Analysis | |
| IV.15 |
Table 4.2
Pricing Characteristics and After-Market Trends
Conversions Completed in Trailing 12 Months
| Institutional Information | Pre-Conversion Data | Offering Information | Contribution to | Insider Purchases | Pro Forma Data | Post-IPO Pricing Trends | ||||||||||||||||||||||||||||||||||||||||||||||||||||||||||||||||||||||||||||||||||||||||||||||||||||||||||||||||||||||||||
| Financial Info. | Asset Quality | Char. Found. | % Off Incl. Fdn.+Merger Shares | Pricing Ratios(2)(5) | Financial Charac. | Closing Price: | ||||||||||||||||||||||||||||||||||||||||||||||||||||||||||||||||||||||||||||||||||||||||||||||||||||||||||||||||||||||||||
| Excluding Foundation | % of | Benefit Plans | Initial | First | After | After | ||||||||||||||||||||||||||||||||||||||||||||||||||||||||||||||||||||||||||||||||||||||||||||||||||||||||||||||||||||||||||
| Conversion | Equity/ | NPAs/ | Res. | Gross | % | % of | Exp./ | Public Off. | Recog. | Stk | Mgmt.& | Div. | Core | Core | Core | IPO | Trading | % | First | % | First | % | Thru | % | ||||||||||||||||||||||||||||||||||||||||||||||||||||||||||||||||||||||||||||||||||||||||||||||||||||||||
| Institution |
Date | Ticker | Assets | Assets | Assets | Cov. | Proc. | Offer | Mid. | Proc. | Form | Inc. Fdn. | ESOP | Plans | Option | Dirs. | Yield | P/TB | P/E | P/A | ROA | TE/A | ROE | Price | Day | Chg | Week(3) | Chg | Month(4) | Chg | 2/5/2021 | Chg | ||||||||||||||||||||||||||||||||||||||||||||||||||||||||||||||||||||||||||||||||||||||||||||||||
| ($Mil) | (%) | (%) | (%) | ($Mil.) | (%) | (%) | (%) | (%) | (%) | (%) | (%) | (%)(1) | (%) | (%) | (x) | (%) | (%) | (%) | (%) | ($) | ($) | (%) | ($) | (%) | ($) | (%) | ($) | (%) | ||||||||||||||||||||||||||||||||||||||||||||||||||||||||||||||||||||||||||||||||||||||||||||||||||||
| Standard Conversions |
||||||||||||||||||||||||||||||||||||||||||||||||||||||||||||||||||||||||||||||||||||||||||||||||||||||||||||||||||||||||||||||||
| Eastern Bankshares, Inc., MA* |
10/15/20 | EBC-NASDAQ | $ | 13,997 | 12.10 | % | 0.04 | % | 211 | % | $ | 1,797.1 | 100 | % | 118 | % | 1.6 | % | S | 4.0 | % | 8.0 | % | 4.0 | % | 10.0 | % | 0.1 | % | 0.00 | % | 65.0 | % | 22.8x | 12.0 | % | 0.5 | % | 19.0 | % | 2.5 | % | $ | 10.00 | $ | 12.15 | 21.5 | % | $ | 12.48 | 24.8 | % | $ | 13.62 | 36.2 | % | $ | 16.18 | 61.8 | % | ||||||||||||||||||||||||||||||||||||||||||||||||||||||||||||||||||||
| Systematic Savings Bank, MO |
10/14/20 | SSSB-OTCPink | $ | 40 | 12.64 | % | 8.00 | % | NM | $ | 6.0 | 100 | % | 132 | % | 14.3 | % | N.A. | N.A. | 0.0 | % | 0.0 | % | 0.0 | % | 18.0 | % | 0.00 | % | 58.6 | % | 46.5x | 13.2 | % | 0.3 | % | 22.5 | % | 1.3 | % | $ | 10.00 | $ | 10.00 | 0.0 | % | $ | 10.00 | 0.0 | % | $ | 10.00 | 0.0 | % | $ | 10.00 | 0.0 | % | ||||||||||||||||||||||||||||||||||||||||||||||||||||||||||||||||||||||
|
|
|
|
|
|
|
|
|
|
|
|
|
|
|
|
|
|
|
|
|
|
|
|
|
|
|
|
|
|
|
|
|
|
|
|
|
|
|
|
|
|
|
|
|
|
|
|
|
|
|
|
|
|
|
|
|
|
|
|
|
|||||||||||||||||||||||||||||||||||||||||||||||||||||||||||||||||||||
| Averages - Standard Conversions: |
|
$ | 7,018 | 12.37 | % | 4.02 | % | 211 | % | $ | 901.5 | 100 | % | 125 | % | 7.9 | % | N.A. | N.A. | 4.0 | % | 2.0 | % | 5.0 | % | 9.1 | % | 0.00 | % | 61.8 | % | 34.7x | 12.6 | % | 0.4 | % | 20.8 | % | 1.9 | % | $ | 10.00 | $ | 11.08 | 10.8 | % | $ | 11.24 | 12.4 | % | $ | 11.81 | 18.1 | % | $ | 13.09 | 30.9 | % | ||||||||||||||||||||||||||||||||||||||||||||||||||||||||||||||||||||||
| Medians - Standard Conversions: |
|
$ | 7,018 | 12.37 | % | 4.02 | % | 211 | % | $ | 901.5 | 100 | % | 125 | % | 7.9 | % | N.A. | N.A. | 4.0 | % | 2.0 | % | 5.0 | % | 9.1 | % | 0.00 | % | 61.8 | % | 34.7x | 12.6 | % | 0.4 | % | 20.8 | % | 1.9 | % | $ | 10.00 | $ | 11.08 | 10.8 | % | $ | 11.24 | 12.4 | % | $ | 11.81 | 18.1 | % | $ | 13.09 | 30.9 | % | ||||||||||||||||||||||||||||||||||||||||||||||||||||||||||||||||||||||
| Second Step Conversions |
||||||||||||||||||||||||||||||||||||||||||||||||||||||||||||||||||||||||||||||||||||||||||||||||||||||||||||||||||||||||||||||||
| Affinity Bancshares, Inc., GA |
1/21/21 | AFBI-NASDAQ | $ | 888 | 8.93 | % | 0.56 | % | 154 | % | $ | 37.0 | 54 | % | 132 | % | 4.1 | % | N.A. | N.A. | 8.0 | % | 4.0 | % | 10.0 | % | 3.5 | % | 0.00 | % | 75.3 | % | 17.6x | 7.5 | % | 0.4 | % | 10.2 | % | 3.6 | % | $ | 10.00 | $ | 10.85 | 8.5 | % | $ | 10.75 | 7.5 | % | $ | 10.75 | 7.5 | % | $ | 10.75 | 7.5 | % | |||||||||||||||||||||||||||||||||||||||||||||||||||||||||||||||||||||
| Generations Bancorp NY, Inc. |
1/13/21 | GBNY-NASDAQ | $ | 368 | 8.10 | % | 1.08 | % | 54 | % | $ | 14.8 | 60 | % | 98 | % | 8.8 | % | N.A. | N.A. | 8.0 | % | 4.0 | % | 10.0 | % | 3.1 | % | 0.00 | % | 61.7 | % | 15.0x | 6.5 | % | 0.4 | % | 10.5 | % | 4.0 | % | $ | 10.00 | $ | 10.05 | 0.5 | % | $ | 9.56 | -4.4 | % | $ | 9.74 | -2.6 | % | $ | 9.74 | -2.6 | % | |||||||||||||||||||||||||||||||||||||||||||||||||||||||||||||||||||||
|
|
|
|
|
|
|
|
|
|
|
|
|
|
|
|
|
|
|
|
|
|
|
|
|
|
|
|
|
|
|
|
|
|
|
|
|
|
|
|
|
|
|
|
|
|
|
|
|
|
|
|
|
|
|
|
|
|
|
|
|
|||||||||||||||||||||||||||||||||||||||||||||||||||||||||||||||||||||
| Averages - Second Step Conversions: |
|
$ | 628 | 8.52 | % | 0.82 | % | 104 | % | $ | 25.9 | 57 | % | 115 | % | 6.5 | % | N.A. | N.A. | 8.0 | % | 4.0 | % | 10.0 | % | 3.3 | % | 0.00 | % | 68.5 | % | 16.3x | 7.0 | % | 0.4 | % | 10.3 | % | 3.8 | % | $ | 10.00 | $ | 10.45 | 4.5 | % | $ | 10.16 | 1.6 | % | $ | 10.25 | 2.5 | % | $ | 10.25 | 2.5 | % | ||||||||||||||||||||||||||||||||||||||||||||||||||||||||||||||||||||||
| Medians - Second Step Conversions: |
|
$ | 628 | 8.52 | % | 0.82 | % | 104 | % | $ | 25.9 | 57 | % | 115 | % | 6.5 | % | N.A. | N.A. | 8.0 | % | 4.0 | % | 10.0 | % | 3.3 | % | 0.00 | % | 68.5 | % | 16.3x | 7.0 | % | 0.4 | % | 10.3 | % | 3.8 | % | $ | 10.00 | $ | 10.45 | 4.5 | % | $ | 10.16 | 1.6 | % | $ | 10.25 | 2.5 | % | $ | 10.25 | 2.5 | % | ||||||||||||||||||||||||||||||||||||||||||||||||||||||||||||||||||||||
| Mutual Holding Companies |
||||||||||||||||||||||||||||||||||||||||||||||||||||||||||||||||||||||||||||||||||||||||||||||||||||||||||||||||||||||||||||||||
|
|
|
|
|
|
|
|
|
|
|
|
|
|
|
|
|
|
|
|
|
|
|
|
|
|
|
|
|
|
|
|
|
|
|
|
|
|
|
|
|
|
|
|
|
|
|
|
|
|
|
|
|
|
|
|
|
|
|
|
|
|||||||||||||||||||||||||||||||||||||||||||||||||||||||||||||||||||||
| Averages - All Conversions: |
|
$ | 3,823 | 10.44 | % | 2.42 | % | 139 | % | $ | 463.7 | 78 | % | 120 | % | 7.2 | % | N.A. | N.A. | 6.0 | % | 3.0 | % | 7.5 | % | 6.2 | % | 0.00 | % | 65.1 | % | 23.6x | 9.8 | % | 0.4 | % | 15.5 | % | 2.8 | % | $ | 10.00 | $ | 10.76 | 7.6 | % | $ | 10.70 | 7.0 | % | $ | 11.03 | 10.3 | % | $ | 11.67 | 16.7 | % | ||||||||||||||||||||||||||||||||||||||||||||||||||||||||||||||||||||||
| Medians - All Conversions: |
|
$ | 628 | 10.52 | % | 4.02 | % | 154 | % | $ | 25.9 | 80 | % | 125 | % | 6.5 | % | N.A. | N.A. | 8.0 | % | 4.0 | % | 10.0 | % | 3.3 | % | 0.00 | % | 63.4 | % | 20.2x | 9.8 | % | 0.4 | % | 14.8 | % | 3.0 | % | $ | 10.00 | $ | 10.45 | 4.5 | % | $ | 10.38 | 3.8 | % | $ | 10.38 | 3.8 | % | $ | 10.38 | 3.8 | % | ||||||||||||||||||||||||||||||||||||||||||||||||||||||||||||||||||||||
|
|
|
|
|
|
|
|
|
|
|
|
|
|
|
|
|
|
|
|
|
|
|
|
|
|
|
|
|
|
|
|
|
|
|
|
|
|
|
|
|
|
|
|
|
|
|
|
|
|
|
|
|
|
|
|
|
|
|
|
|
|||||||||||||||||||||||||||||||||||||||||||||||||||||||||||||||||||||
Note: * - Appraisal performed by RP Financial; BOLD = RP Financial assisted in the business plan preparation, “NT” - Not Traded; “NA” - Not Applicable, Not Available; C/S-Cash/Stock.
| (1) As a percent of MHC offering for MHC transactions. |
(5) Mutual holding company pro forma data on full conversion basis. | |||
| (2) Does not take into account the adoption of SOP 93-6. |
(6) Simultaneously completed acquisition of another financial institution. | |||
| (3) Latest price if offering is less than one week old. |
(7) Simultaneously converted to a commercial bank charter. | |||
| (4) Latest price if offering is more than one week but less than one month old. |
(8) Former credit union. |
2/5/2021 | ||
| RP® Financial, LC. | VALUATION ANALYSIS | |
| IV.16 |
61.8% from its IPO price.
| C. | The Acquisition Market |
Also considered in the valuation was the potential impact on Blue Foundry Bancorp’s pro forma market value of recently completed and pending acquisitions of other thrifts and banks operating in New Jersey. As shown in Exhibit IV-4, there were 22 New Jersey bank and thrift acquisitions completed from the beginning of 2017 through February 5, 2021 and there was one acquisition pending for a New Jersey financial institution. The recent acquisition activity involving New Jersey savings institutions may imply a certain degree of acquisition speculation for the Company’s stock. To the extent that acquisition speculation may impact the Company’s offering, we have largely taken this into account in selecting companies for the Peer Group which operate in markets that have experienced a comparable level of acquisition activity as the Company’s market and, thus, are subject to the same type of acquisition speculation that may influence Blue Foundry Bancorp’s stock. However, since converting thrifts are subject to a three-year regulatory moratorium from being acquired, acquisition speculation in Blue Foundry Bancorp’s stock would tend to be less compared to the stocks of the Peer Group companies.
* * * * * * * * * * *
In determining our valuation adjustment for marketing of the issue, we considered trends in both the overall thrift market, the new issue market including the new issue market for thrift conversions and the local acquisition market for thrift stocks. Taking these factors and trends into account, RP Financial concluded that no adjustment was appropriate in the valuation analysis for purposes of marketing of the issue.
| 8. | Management |
The Company’s management team appears to have experience and expertise in all of the key areas of the Company’s operations. Over the last few years, the Company has made a significant investment in management through hiring senior level management to fill certain key positions and retraining certain other key officers to facilitate implementation of the Company’s strategic plan. Exhibit IV-5 provides summary resumes of the Company’s Board of Directors and senior management.
| RP® Financial, LC. | VALUATION ANALYSIS | |
| IV.17 |
Similarly, the returns, equity positions and other operating measures of the Peer Group companies are indicative of well-managed financial institutions, which have Boards and management teams that have been effective in implementing competitive operating strategies. Therefore, on balance, we concluded no valuation adjustment relative to the Peer Group was appropriate for this factor.
| 9. | Effect of Government Regulation and Regulatory Reform |
In summary, as a fully-converted, FDIC insured institution, Blue Foundry Bancorp will operate in substantially the same regulatory environment as the Peer Group members — all of whom are adequately capitalized institutions and are operating with no apparent restrictions. Exhibit IV-6 reflects Blue Foundry Bank’s pro forma regulatory capital ratios. On balance, no adjustment has been applied for the effect of government regulation and regulatory reform.
Summary of Adjustments
Overall, based on the factors discussed above, we concluded that the Company’s pro forma market value should reflect the following valuation adjustments relative to the Peer Group:
| Key Valuation Parameters: |
Valuation Adjustment | |
| Financial Condition | No Adjustment | |
| Profitability, Growth and Viability of Earnings | Moderate Downward | |
| Asset Growth | No Adjustment | |
| Primary Market Area | No Adjustment | |
| Dividends | Slight Downward | |
| Liquidity of the Shares | No Adjustment | |
| Marketing of the Issue | No Adjustment | |
| Management | No Adjustment | |
| Effect of Govt. Regulations and Regulatory Reform | No Adjustment |
Valuation Approaches
In applying the accepted valuation methodology promulgated by the FDIC and the Department i.e., the pro forma market value approach, we considered the three key pricing ratios in valuing the Company’s to-be-issued stock – price/earnings (“P/E”), price/book (“P/B”), and price/assets (“P/A”) approaches – all performed on a pro forma basis including the effects of the stock proceeds. In computing the pro forma impact of the conversion and the related pricing ratios, we have incorporated the valuation parameters disclosed in the Company’s prospectus for reinvestment rate, effective tax rate, stock benefit plan assumptions and expenses (summarized in Exhibits IV-7 and IV-8).
| RP® Financial, LC. | VALUATION ANALYSIS | |
| IV.18 |
In our estimate of value, we assessed the relationship of the pro forma pricing ratios relative to the Peer Group and recent conversion offerings.
RP Financial’s valuation placed an emphasis on the following:
| • | P/E Approach. The P/E approach is generally the best indicator of long-term value for a stock. However, given that the Company’s pro forma earnings reflect a net loss on both a reported and core earnings basis, the P/E approach was less meaningful for the Company’s valuation. |
| • | P/B Approach. P/B ratios have generally served as a useful benchmark in the valuation of thrift stocks, particularly in the context of an initial public offering, as the earnings approach involves assumptions regarding the use of proceeds. RP Financial considered the P/B approach to be a useful indicator of pro forma value, taking into account the pricing ratios under the P/E approach, which were not meaningful (“NM”) and the P/A approach. We have also modified the P/B approach to exclude the impact of intangible assets (i.e., price/tangible book value or “P/TB”), in that the investment community frequently makes this adjustment in its evaluation of this pricing approach. |
| • | P/A Approach. P/A ratios are generally a less reliable indicator of market value, as investors typically assign less weight to assets and attribute greater weight to book value and earnings. Furthermore, this approach as set forth in the regulatory valuation guidelines does not take into account the amount of stock purchases funded by deposit withdrawals, thus understating the pro forma P/A ratio. At the same time, the P/A ratio is an indicator of franchise value, and, in the case of highly capitalized institutions, high P/A ratios may limit the investment community’s willingness to pay market multiples for earnings or book value when ROE is expected to be low. |
The Company will adopt “Employers’ Accounting for Employee Stock Ownership Plans” (“ASC 718-40”), which will cause earnings per share computations to be based on shares issued and outstanding excluding unreleased ESOP shares. For purposes of preparing the pro forma pricing analyses, we have reflected all shares issued in the offering, including all ESOP shares, to capture the full dilutive impact, particularly since the ESOP shares are economically dilutive, receive dividends and can be voted. However, we did consider the impact of the adoption of ASC 718-40 in the valuation.
Based on the application of the three valuation approaches, taking into consideration the valuation adjustments discussed above and the dilutive impact of the stock contribution to the Foundation, RP Financial concluded that, as of February 5, 2021, the pro forma market value of Blue Foundry Bancorp’s conversion stock was $217,500,000 at the midpoint, equal to 21,750,000 shares at $10.00 per share.
| RP® Financial, LC. | VALUATION ANALYSIS | |
| IV.19 |
1. Price-to-Earnings (“P/E”). The application of the P/E valuation method requires calculating the Company’s pro forma market value by applying a valuation P/E multiple to the pro forma earnings base. In applying this technique, we considered both reported earnings and a recurring earnings base, that is, earnings adjusted to exclude any one-time non-operating items, plus the estimated after-tax earnings benefit of the reinvestment of the net proceeds. The Company’s reported earnings equaled a net loss of $31.5 million for the twelve months ended December 31, 2020. In deriving Blue Foundry Bancorp’s core earnings, the adjustments made to reported earnings were to eliminate gains on sales of securities of $68,00; write-down of REO of $1.390 million; loss on assets held for sale of $12.775 million, goodwill impairment of $15.460 million and pension expense reduction from the termination of a defined pension plan of $1.775 million. As shown below, on a tax effected basis, assuming an effective marginal tax rate of 31.0% for the earnings adjustments, the Company’s core earnings were determined to equal a net loss of $9.887 million for the twelve months ended December 31, 2020.
| Amount | ||||
| ($000) | ||||
| Net income (loss) |
($ | 31,506 | ) | |
| Deduct: Gain on sales of securities(1) |
(47 | ) | ||
| Add: Write-down of REO(1) |
959 | |||
| Add: Goodwill impairment(1) |
10,667 | |||
| Add: Loss on assets held for sale(1) |
8,815 | |||
| Add: Pension expense reduction(1) |
1,225 | |||
|
|
|
|||
| Core earnings estimate |
($ | 9,887 | ) | |
| (1) | Tax effected at 31.0%. |
Based on the Company’s reported and estimated core earnings net losses, the Company’s pro forma reported and core P/E multiples were NM throughout the valuation range. Comparatively, the Peer Group’s average reported and core P/E multiples equaled 13.42 times and 14.14 times, respectively (see Table 4.3). The Peer Group’s median reported and core earnings multiples equaled 12.27 times and 14.87 times, respectively.
2. Price-to-Book (“P/B”). The application of the P/B valuation method requires calculating the Company’s pro forma market value by applying a valuation P/B ratio, as derived from the Peer Group’s P/B ratio, to the Company’s pro forma book value. Based
| RP® Financial, LC. | VALUATION ANALYSIS | |
| IV.20 |
Table 4.3
Market Pricing Versus Peer Group
Blue Foundry Bancorp
As of February 5, 2021
| Market | Per Share Data | |||||||||||||||||||||||||||||||||||||||||||||||||||||||||||||||||||||||||||||||||||
| Capitalization | Core | Book | Dividends(3) | Financial Characteristics(5) | Offering | |||||||||||||||||||||||||||||||||||||||||||||||||||||||||||||||||||||||||||||||
| Price/ | Market | 12 Month | Value/ | Pricing Ratios(2) |
Amount/ | Payout | Total | Equity/ | Tang. Eq./ | NPAs/ | Reported | Core | Size | |||||||||||||||||||||||||||||||||||||||||||||||||||||||||||||||||||||||
| Share | Value | EPS(1) | Share | P/E |
P/B | P/A | P/TB | P/Core |
Share | Yield | Ratio(4) | Assets | Assets | T. Assets | Assets | ROAA | ROAE | ROAA | ROAE | ($Mil) | ||||||||||||||||||||||||||||||||||||||||||||||||||||||||||||||||
| ($) | ($Mil) | ($) | ($) | (x) | (%) | (%) | (%) | (x) | ($) | (%) | (%) | ($Mil) | (%) | (%) | (%) | (%) | (%) | (%) | (%) | |||||||||||||||||||||||||||||||||||||||||||||||||||||||||||||||||
| Blue Foundry Bancorp |
NJ | |||||||||||||||||||||||||||||||||||||||||||||||||||||||||||||||||||||||||||||||||||
| Super Maximum |
$ | 10.00 | $ | 285.23 | ($ | 0.50 | ) | $ | 15.13 | NM | 66.09 | % | 13.15 | % | 66.09 | % | NM | $ | 0.00 | 0.00 | % | 0.00 | % | $ | 2,168 | 19.90 | % | 19.90 | % | 0.65 | % | -1.60 | % | -8.06 | % | -0.66 | % | -3.34 | % | $ | 277.73 | |||||||||||||||||||||||||||||||||||||||||||
| Maximum |
$ | 10.00 | $ | 249.00 | ($ | 0.56 | ) | $ | 16.07 | NM | 62.23 | % | 11.65 | % | 62.23 | % | NM | $ | 0.00 | 0.00 | % | 0.00 | % | $ | 2,137 | 18.72 | % | 18.72 | % | 0.66 | % | -1.61 | % | -8.59 | % | -0.65 | % | -3.50 | % | $ | 241.50 | |||||||||||||||||||||||||||||||||||||||||||
| Midpoint |
$ | 10.00 | $ | 217.50 | ($ | 0.63 | ) | $ | 17.12 | NM | 58.41 | % | 10.31 | % | 58.41 | % | NM | $ | 0.00 | 0.00 | % | 0.00 | % | $ | 2,109 | 17.66 | % | 17.66 | % | 0.67 | % | -1.61 | % | -9.13 | % | -0.65 | % | -3.66 | % | $ | 210.00 | |||||||||||||||||||||||||||||||||||||||||||
| Minimum |
$ | 10.00 | $ | 186.00 | ($ | 0.71 | ) | $ | 18.54 | NM | 53.94 | % | 8.93 | % | 53.94 | % | NM | $ | 0.00 | 0.00 | % | 0.00 | % | $ | 2,082 | 16.57 | % | 16.57 | % | 0.68 | % | -1.62 | % | -9.76 | % | -0.64 | % | -3.84 | % | $ | 178.50 | |||||||||||||||||||||||||||||||||||||||||||
| All Non-MHC Public Thrifts(6) |
||||||||||||||||||||||||||||||||||||||||||||||||||||||||||||||||||||||||||||||||||||
| Averages |
$ | 23.33 | $ | 601.07 | $ | 1.85 | $ | 19.90 | 13.96x | 103.63 | % | 12.92 | % | 114.74 | % | 13.98x | $ | 0.43 | 2.36 | % | 47.00 | % | $ | 5,167 | 12.62 | % | 11.78 | % | 0.69 | % | 0.84 | % | 6.91 | % | 0.87 | % | 7.23 | % | ||||||||||||||||||||||||||||||||||||||||||||||
| Median |
$ | 15.28 | $ | 192.19 | $ | 0.87 | $ | 15.86 | 12.66x | 94.14 | % | 11.60 | % | 100.75 | % | 13.14x | $ | 0.32 | 2.21 | % | 35.59 | % | $ | 1,791 | 11.51 | % | 10.33 | % | 0.55 | % | 0.76 | % | 5.88 | % | 0.78 | % | 6.15 | % | ||||||||||||||||||||||||||||||||||||||||||||||
| All Non-MHC State of NJ(6) |
||||||||||||||||||||||||||||||||||||||||||||||||||||||||||||||||||||||||||||||||||||
| Averages |
$ | 14.29 | $ | 1,019.56 | $ | 0.89 | $ | 15.74 | 16.17x | 88.45 | % | 12.09 | % | 109.88 | % | 15.04x | $ | 0.56 | 3.73 | % | 58.85 | % | $ | 8,590 | 13.79 | % | 11.66 | % | 0.61 | % | 0.70 | % | 4.86 | % | 0.76 | % | 5.27 | % | ||||||||||||||||||||||||||||||||||||||||||||||
| Medians |
$ | 13.22 | $ | 922.29 | $ | 0.78 | $ | 14.26 | 17.39x | 90.99 | % | 12.33 | % | 104.93 | % | 15.30x | $ | 0.44 | 3.33 | % | 57.89 | % | $ | 7,310 | 13.55 | % | 12.81 | % | 0.71 | % | 0.67 | % | 4.78 | % | 0.73 | % | 5.26 | % | ||||||||||||||||||||||||||||||||||||||||||||||
| Comparable Group |
||||||||||||||||||||||||||||||||||||||||||||||||||||||||||||||||||||||||||||||||||||
| Averages |
$ | 36.62 | $ | 210.10 | $ | 2.83 | $ | 27.24 | 13.42x | 98.28 | % | 12.42 | % | 100.85 | % | 14.14x | $ | 0.43 | 1.83 | % | 28.62 | % | $ | 1,640 | 12.37 | % | 12.14 | % | 0.82 | % | 1.03 | % | 7.93 | % | 0.99 | % | 7.53 | % | ||||||||||||||||||||||||||||||||||||||||||||||
| Medians |
$ | 15.67 | $ | 161.31 | $ | 1.00 | $ | 16.16 | 12.27x | 89.45 | % | 10.23 | % | 92.99 | % | 14.87x | $ | 0.24 | 1.76 | % | 27.77 | % | $ | 1,645 | 11.38 | % | 11.30 | % | 0.73 | % | 0.76 | % | 6.22 | % | 0.70 | % | 5.16 | % | ||||||||||||||||||||||||||||||||||||||||||||||
| Comparable Group |
||||||||||||||||||||||||||||||||||||||||||||||||||||||||||||||||||||||||||||||||||||
| ESSA |
ESSA Bancorp, Inc. | PA | $ | 15.59 | $ | 157.22 | $ | 1.38 | $ | 17.60 | 10.68x | 86.89 | % | 9.03 | % | 93.91 | % | 10.71x | $ | 0.44 | 2.82 | % | 30.14 | % | $ | 1,894 | 10.11 | % | 9.41 | % | 1.09 | % | 0.76 | % | 7.43 | % | 0.75 | % | 7.37 | % | ||||||||||||||||||||||||||||||||||||||||||||
| HIFS |
Hingham Institution for Savings | MA | $ | 236.30 | $ | 504.95 | $ | 18.50 | $ | 130.24 | 10.16x | 172.45 | % | 17.68 | % | 172.45 | % | 11.64x | $ | 1.88 | 0.80 | % | 10.62 | % | $ | 2,719 | 10.24 | % | 10.24 | % | 0.27 | % | 1.71 | % | 17.54 | % | 1.53 | % | 15.71 | % | ||||||||||||||||||||||||||||||||||||||||||||
| HMNF |
HMN Financial, Inc. | MN | $ | 19.00 | $ | 90.61 | $ | 1.84 | $ | 20.91 | 8.56x | 87.76 | % | 9.96 | % | 88.50 | % | NM | $ | 0.00 | 0.00 | % | 0.00 | % | $ | 898 | 11.26 | % | 11.17 | % | 0.38 | % | 1.03 | % | 8.83 | % | 1.04 | % | 8.95 | % | ||||||||||||||||||||||||||||||||||||||||||||
| IROQ |
IF Bancorp, Inc. | IL | $ | 20.50 | $ | 66.43 | $ | 1.34 | $ | 25.78 | 12.58x | 78.23 | % | 9.31 | % | 78.23 | % | NM | $ | 0.30 | 1.46 | % | 18.40 | % | $ | 726 | 11.51 | % | 11.51 | % | 0.24 | % | 0.64 | % | 5.57 | % | 0.59 | % | 5.10 | % | ||||||||||||||||||||||||||||||||||||||||||||
| PCSB |
PCSB Financial Corporation | NY | $ | 15.75 | $ | 241.41 | $ | 0.59 | $ | 16.45 | 25.00x | 94.14 | % | 14.17 | % | 96.39 | % | 24.90x | $ | 0.16 | 1.02 | % | 25.40 | % | $ | 1,791 | 15.28 | % | 14.98 | % | 0.33 | % | 0.54 | % | 3.34 | % | 0.54 | % | 3.36 | % | ||||||||||||||||||||||||||||||||||||||||||||
| PVBC |
Provident Bancorp, Inc. | MA | $ | 12.10 | $ | 219.00 | $ | 0.66 | $ | 12.30 | 18.33x | 97.72 | % | 15.31 | % | 97.72 | % | 16.00x | $ | 0.12 | 0.99 | % | 18.18 | % | $ | 1,498 | 15.98 | % | 15.98 | % | 1.81 | % | 0.81 | % | 4.57 | % | 0.93 | % | 5.21 | % | ||||||||||||||||||||||||||||||||||||||||||||
| PBIP |
Prudential Bancorp, Inc. | PA | $ | 12.69 | $ | 101.48 | $ | 0.58 | $ | 15.86 | 11.97x | 77.32 | % | 8.50 | % | 81.30 | % | NM | $ | 0.28 | 2.21 | % | 66.98 | % | $ | 1,223 | 10.55 | % | 10.08 | % | 1.10 | % | 0.76 | % | 6.88 | % | 0.39 | % | 3.56 | % | ||||||||||||||||||||||||||||||||||||||||||||
| SVBI |
Severn Bancorp, Inc. | MD | $ | 7.80 | $ | 99.98 | $ | 0.42 | $ | 8.45 | 15.00x | 91.15 | % | 10.49 | % | 92.08 | % | 14.87x | $ | 0.16 | 2.05 | % | 30.77 | % | $ | 939 | 11.53 | % | 11.43 | % | 1.57 | % | 0.63 | % | 5.06 | % | 0.64 | % | 5.11 | % | ||||||||||||||||||||||||||||||||||||||||||||
| WSBF |
Waterstone Financial, Inc. | WI | $ | 19.19 | $ | 454.54 | $ | 2.60 | $ | 15.84 | 5.82x | 116.54 | % | 22.04 | % | 121.36 | % | 5.66x | $ | 0.80 | 4.17 | % | 41.21 | % | $ | 2,221 | 17.99 | % | 17.96 | % | 0.70 | % | 2.97 | % | 15.96 | % | 3.07 | % | 16.53 | % | ||||||||||||||||||||||||||||||||||||||||||||
| WNEB |
Western New England Bancorp, Inc. | MA | $ | 7.23 | $ | 165.39 | $ | 0.40 | $ | 8.99 | 16.07x | 80.63 | % | 7.72 | % | 86.52 | % | 15.23x | $ | 0.20 | 2.77 | % | 44.44 | % | $ | 2,487 | 9.26 | % | 8.69 | % | 0.76 | % | 0.42 | % | 4.16 | % | 0.45 | % | 4.45 | % | ||||||||||||||||||||||||||||||||||||||||||||
| (1) | Core income, on a diluted per-share basis. Core income is net income after taxes and before extraordinary items, less net income attributable to noncontrolling interest, gain on the sale of securities, amortization of intangibles, goodwill and nonrecurring items. Assumed tax rate is 35%. |
| (2) | P/E = Price to earnings; P/B = Price to book; P/A = Price to assets; P/TB = Price to tangible book value; and P/Core = Price to core earnings. P/E and P/Core =NM if the ratio is negative or above 35x. |
| (3) | Indicated 12 month dividend, based on last quarterly dividend declared. |
| (4) | Indicated 12 month dividend as a percent of trailing 12 month earnings. |
| (5) | Equity and tangible equity equal common equity and tangible common equity, respectively. ROAA (return on average assets) and ROAE (return on average equity) are indicated ratios based on trailing 12 month earnings and average equity and assets balances. |
| (6) | Excludes from averages and medians those companies the subject of actual or rumored acquisition activities or unusual operating characteristics. |
Source: S&P Global Market Intelligence and RP Financial, LC. calculations. The information provided in this report has been obtained from sources we believe are reliable, but we cannot guarantee the accuracy or completeness of such information.
| Copyright | (c) 2021 by RP® Financial, LC. |
| RP® Financial, LC. | VALUATION ANALYSIS | |
| IV.21 |
on the $217.5 million midpoint valuation, the Company’s pro forma P/B and P/TB ratios both equaled 58.41%. In comparison to the average P/B and P/TB ratios for the Peer Group of 98.28% and 100.85%, the Company’s ratios reflected a discount of 40.57% on a P/B basis and a discount of 42.08% on a P/TB basis. In comparison to the Peer Group’s median P/B and P/TB ratios of 89.45% and 92.99%, respectively, the Company’s pro forma P/B and P/TB ratios at the midpoint value reflected discounts of 34.70% and 37.19%, respectively. At the top of the super maximum, the Company’s P/B and P/TB ratios both equaled 66.09%. In comparison to the Peer Group’s average P/B and P/TB ratios, the Company’s P/B and P/TB ratios at the top of the super maximum reflected discounts of 32.75% and 34.47%, respectively. In comparison to the Peer Group’s median P/B and P/TB ratios, the Company’s P/B and P/TB ratios at the top of the super maximum reflected discounts of 26.12% and 28.93%, respectively. RP Financial considered the discounts under the P/B approach to be reasonable, given the nature of the calculation of the P/B ratio which mathematically results in a ratio discounted to book value. The discounts reflected under the P/B approach were also supported by the Company’s NM reported and core P/E multiples.
3. Price-to-Assets (“P/A”). The P/A valuation methodology determines market value by applying a valuation P/A ratio to the Company’s pro forma asset base, conservatively assuming no deposit withdrawals are made to fund stock purchases. In all likelihood there will be deposit withdrawals, which results in understating the pro forma P/A ratio which is computed herein. At the $217.5 million midpoint of the valuation range, the Company’s value equaled 10.31% of pro forma assets. Comparatively, the Peer Group companies exhibited an average P/A ratio of 12.42%, which implies a discount of 16.99% has been applied to the Company’s pro forma P/A ratio. In comparison to the Peer Group’s median P/A ratio of 10.23%, the Company’s pro forma P/A ratio at the midpoint value reflects a premium of 0.78%.
Comparison to Recent Offerings
As indicated at the beginning of this chapter, RP Financial’s analysis of recent conversion offering pricing characteristics at closing and in the aftermarket has been limited to a “technical” analysis and, thus, the pricing characteristics of recent conversion offerings cannot be a primary determinate of value. Particular focus was placed on the P/TB approach in this analysis, since the P/E multiples do not reflect the actual impact of reinvestment and the source of the stock proceeds (i.e., external funds vs. deposit withdrawals). In comparison to the 65.00% closing forma P/TB ratio of Eastern’s standard conversion offering, the Company’s P/TB ratio of 58.41% at the midpoint value reflects an implied discount of 10.14%. At the top of the super maximum, the Company’s P/TB ratio of 66.09% reflects an implied premium of 1.68% relative to Eastern’s P/TB ratio at closing.
| RP® Financial, LC. | VALUATION ANALYSIS | |
| IV.22 |
Valuation Conclusion
Based on the foregoing, it is our opinion that, as of February 5, 2021, the estimated aggregate pro forma market value of the shares to be issued immediately following the conversion, including shares to be issued to the Foundation, equaled $217,500,000 at the midpoint, equal to 21,750,000 shares offered at a per share value of $10.00. Pursuant to conversion guidelines, the 15% valuation range indicates a minimum value of $186,000,000 and a maximum value of $249,000,000. Based on the $10.00 per share offering price determined by the Board, this valuation range equates to total shares outstanding of 18,600,000 at the minimum and 24,900,000 at the maximum. In the event the appraised value is subject to an increase, the aggregate pro forma market value may be increased up to a super maximum value of $285,225,000 without a resolicitation. Based on the $10.00 per share offering price, the super maximum value would result in total shares outstanding of 28,522,500. Based on this valuation range, the offering range is as follows: $178,500,000 at the minimum, $210,000,000 at the midpoint, $241,500,000 at the maximum and $277,725,000 at the super maximum. Based on the $10.00 per share offering price, the number of offering shares is as follows: 17,850,000 at the minimum, 21,000,000 at the midpoint, 24,150,000 at the maximum and 27,772,500 at the super maximum. The pro forma valuation calculations relative to the Peer Group are shown in Table 4.3 and are detailed in Exhibit IV-7 and Exhibit IV-8.
| RP® Financial, LC. | LIST OF EXHIBITS |
EXHIBITS
| RP® Financial, LC. | LIST OF EXHIBITS |
LIST OF EXHIBITS
| Exhibit |
Description | |
| I-1 | Map of Office Locations | |
| I-2 | Audited Financial Statements | |
| I-3 | Key Operating Ratios | |
| I-4 | Investment Portfolio Composition | |
| I-5 | Yields and Costs | |
| I-6 | Loan Loss Allowance Activity | |
| I-7 | Interest Rate Risk Analysis | |
| I-8 | Fixed and Adjustable Rate Loans | |
| I-9 | Loan Portfolio Composition | |
| I-10 | Contractual Maturity by Loan Type | |
| I-11 | Non-Performing Assets | |
| I-12 | Deposit Composition | |
| II-1 | Description of Office Properties | |
| II-2 | Historical Interest Rates | |
| III-1 | General Characteristics of Publicly-Traded Institutions | |
| III-2 | Public Market Pricing of Mid-Atlantic and New England Thrift Institutions | |
| III-3 | Public Market Pricing of Midwest Thrift Institutions | |
| III-4 | Peer Group Market Area Comparative Analysis | |
| RP® Financial, LC. | LIST OF EXHIBITS |
LIST OF EXHIBITS (continued)
| Exhibit |
Description | |
| IV-1 | Stock Prices: As of February 5, 2021 | |
| IV-2 | Historical Stock Price Indices | |
| IV-3 | Stock Indices as of February 5, 2021 | |
| IV-4 | Market Area Acquisition Activity | |
| IV-5 | Director and Senior Management Summary Resumes | |
| IV-6 | Pro Forma Regulatory Capital Ratios | |
| IV-7 | Pro Forma Analysis Sheet | |
| IV-8 | Pro Forma Effect of Conversion Proceeds | |
| V-1 | Firm Qualifications Statement | |
EXHIBIT I-1
Blue Foundry Bancorp
Map of Office Locations
Exhibit I-1
Blue Foundry Bancorp
Map of Office Locations
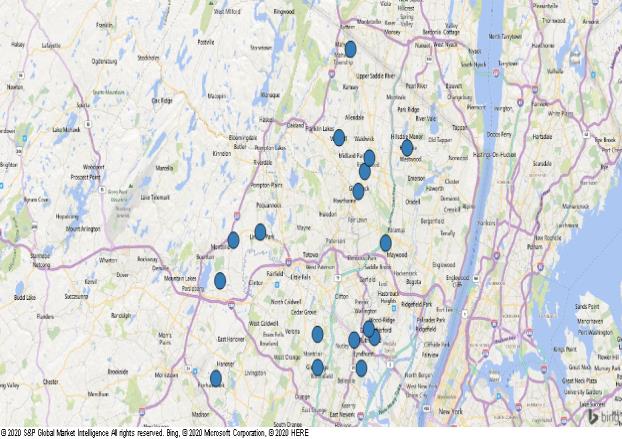
EXHIBIT I-2
Blue Foundry Bancorp
Audited Financial Statements
[Incorporated by Reference]
EXHIBIT I-3
Blue Foundry Bancorp
Key Operating Ratios
Exhibit I-3
Blue Foundry Bancorp
Key Operating Ratios
| At or For the Year Ended December 31, |
At or For the Year Ended April 30, | |||||||||||||||||||||||
| 2020 | 2019 | 2019 | 2018 | 2017 | 2016 | |||||||||||||||||||
| Performance Ratios: |
||||||||||||||||||||||||
| Return (loss) on average assets(1) |
(1.63 | )% | 0.31 | % | 0.62 | % | 0.37 | % | 0.41 | % | 0.40 | % | ||||||||||||
| Return (loss) on average equity(2) |
(14.62 | ) | 2.31 | 4.47 | 2.78 | 3.14 | 2.89 | |||||||||||||||||
| Interest rate spread(3) |
1.93 | 2.33 | 2.63 | 2.77 | 2.68 | 2.80 | ||||||||||||||||||
| Net interest margin(4) |
2.10 | 2.55 | 2.82 | 2.92 | 2.81 | 2.93 | ||||||||||||||||||
| Efficiency ratio(5) |
191.51 | 81.15 | 71.28 | 75.35 | 75.06 | 74.55 | ||||||||||||||||||
| Average interest-earning assets to average interest-bearing liabilities |
114.27 | 116.87 | 117.12 | 116.07 | 115.41 | 115.74 | ||||||||||||||||||
| Loans to deposits |
94.68 | 109.98 | 118.75 | 113.30 | 113.80 | 110.40 | ||||||||||||||||||
| Equity to assets(6) |
10.58 | 12.82 | 13.88 | 13.29 | 13.10 | 13.87 | ||||||||||||||||||
| Capital Ratios:(7) |
||||||||||||||||||||||||
| Tier 1 capital (to adjusted total assets) |
10.72 | 12.32 | 13.13 | 12.40 | 12.42 | 12.82 | ||||||||||||||||||
| Tier I capital (to risk-weighted assets) |
19.93 | 20.29 | 20.44 | 18.29 | 18.67 | 20.34 | ||||||||||||||||||
| Total capital (to risk-weighted assets) |
21.18 | 21.54 | 21.68 | 19.50 | 19.92 | 21.60 | ||||||||||||||||||
| Common equity Tier 1 capital (to risk-weighted assets) |
19.93 | 20.29 | 20.44 | 18.29 | 18.67 | 20.34 | ||||||||||||||||||
| Asset Quality Ratios: |
||||||||||||||||||||||||
| Allowance for loan losses as a percent of total loans |
1.34 | 1.03 | 0.91 | 0.96 | 1.01 | 1.03 | ||||||||||||||||||
| Allowance for loan losses as a percent of non-performing loans |
131.92 | 295.36 | 299.53 | 344.37 | 87.14 | 53.91 | ||||||||||||||||||
| Net charge-offs to average outstanding loans during the period |
— | — | 0.01 | (0.02 | ) | 0.01 | (0.35 | ) | ||||||||||||||||
| Non-performing loans as a percent of total loans |
1.00 | 0.34 | 0.30 | 0.28 | 1.14 | 1.90 | ||||||||||||||||||
| Non-performing assets as a percent of total assets |
0.69 | 0.37 | 0.38 | 0.82 | 1.16 | 1.78 | ||||||||||||||||||
| Other Data: |
||||||||||||||||||||||||
| Number of offices |
16 | 17 | 17 | 17 | 17 | 17 | ||||||||||||||||||
| Number of full-time equivalent employees |
168 | 179 | 196 | 202 | 199 | 198 | ||||||||||||||||||
| (1) | Represents net income divided by average total assets. |
| (2) | Represents net income divided by average equity. |
| (3) | Represents the difference between the weighted average yield on average interest-earning assets and the weighted average cost on average interest-bearing liabilities. |
| (4) | Represents net interest income as a percent of average interest-earning assets. |
| (5) | Represents non-interest expense divided by the sum of net interest income and non-interest income. |
| (6) | Represents average equity divided by average total assets. |
| (7) | Bank only. Capital ratios at April 30 are based on March 31 call report data for such year. |
Source: Blue Foundry Bancorp’s prospectus.
EXHIBIT I-4
Blue Foundry Bancorp
Investment Portfolio Composition
Exhibit I-4
Blue Foundry Bancorp
Investment Portfolio Composition
| One Year or Less | More than One Year to Five Years |
More than Five Years to Ten Years |
More than Ten Years | Total | ||||||||||||||||||||||||||||||||||||||||
| Amortized Cost |
Weighted Average Yield |
Amortized Cost |
Weighted Average Yield |
Amortized Cost |
Weighted Average Yield |
Amortized Cost |
Weighted Average Yield |
Amortized Cost |
Fair Value |
Weighted Average Yield |
||||||||||||||||||||||||||||||||||
| (Dollars in thousands) | ||||||||||||||||||||||||||||||||||||||||||||
| Securities held-to-maturity: |
||||||||||||||||||||||||||||||||||||||||||||
| Corporate bonds |
$ | — | — | % | $ | — | — | % | $ | — | — | % | $ | — | — | % | $ | — | $ | — | — | % | ||||||||||||||||||||||
| Collateralized loan obligation |
— | — | % | — | — | % | — | — | % | 7,005 | 1.90 | % | 7,005 | 6,978 | 1.90 | % | ||||||||||||||||||||||||||||
|
|
|
|
|
|
|
|||||||||||||||||||||||||||||||||||||||
| Total |
$ | — | — | % | $ | — | — | % | $ | — | — | % | $ | 7,005 | 1.90 | % | $ | 7,005 | $ | 6,978 | 1.90 | % | ||||||||||||||||||||||
|
|
|
|
|
|
|
|||||||||||||||||||||||||||||||||||||||
Source: Blue Foundry Bancorp’s prospectus.
EXHIBIT I-5
Blue Foundry Bancorp
Yields and Costs
Exhibit I-5
Blue Foundry Bancorp
Yields and Costs
| Year Ended December 31, | ||||||||||||||||||||||||
| 2020 | 2019 | |||||||||||||||||||||||
| Average Balance |
Interest and Dividends |
Yield/Cost | Average Balance |
Interest and Dividends |
Yield/Cost | |||||||||||||||||||
| (Dollars in thousands) | ||||||||||||||||||||||||
| Assets: |
||||||||||||||||||||||||
| Loans |
$ | 1,388,863 | $ | 54,125 | 3.90 | % | $ | 1,451,556 | $ | 58,656 | 4.04 | % | ||||||||||||
| Mortgage-backed securities |
124,164 | 3,176 | 2.56 | % | 57,554 | 1,740 | 3.02 | % | ||||||||||||||||
| Investment securities |
125,794 | 2,715 | 2.16 | % | 90,791 | 2,328 | 2.56 | % | ||||||||||||||||
| FHLB stock |
17,356 | 954 | 5.50 | % | 12,243 | 720 | 5.88 | % | ||||||||||||||||
| Other interest-earning assets |
200,068 | 654 | 0.33 | % | 73,260 | 1,384 | 1.89 | % | ||||||||||||||||
|
|
|
|
|
|
|
|
|
|||||||||||||||||
| Total interest-earning assets |
1,856,245 | 61,625 | 3.32 | % | 1,685,405 | 64,827 | 3.85 | % | ||||||||||||||||
| Non-interest-earning assets |
72,297 | 62,690 | ||||||||||||||||||||||
|
|
|
|
|
|||||||||||||||||||||
| Total assets |
$ | 1,928,542 | $ | 1,748,095 | ||||||||||||||||||||
|
|
|
|
|
|||||||||||||||||||||
| Liabilities and equity: |
||||||||||||||||||||||||
| NOW and demand accounts |
$ | 272,824 | $ | 714 | 0.26 | % | $ | 246,925 | $ | 959 | 0.39 | % | ||||||||||||
| Savings and money market accounts |
239,102 | 658 | 0.28 | % | 222,369 | 654 | 0.29 | % | ||||||||||||||||
| Time deposit |
767,931 | 14,509 | 1.89 | % | 745,541 | 15,173 | 2.04 | % | ||||||||||||||||
|
|
|
|
|
|
|
|
|
|||||||||||||||||
| Total interest-bearing deposits |
1,279,858 | 15,881 | 1.24 | % | 1,214,835 | 16,786 | 1.38 | % | ||||||||||||||||
| FHLB advances |
344,517 | 6,676 | 1.94 | % | 227,247 | 5,120 | 2.25 | % | ||||||||||||||||
|
|
|
|
|
|
|
|
|
|||||||||||||||||
| Total interest-bearing liabilities |
1,624,374 | 22,557 | 1.39 | % | 1,442,082 | 21,906 | 1.52 | % | ||||||||||||||||
| Non-interest-bearing deposits |
46,629 | 44,802 | ||||||||||||||||||||||
| Other non-interest-bearing liabilities |
42,110 | 23,452 | ||||||||||||||||||||||
|
|
|
|
|
|||||||||||||||||||||
| Total liabilities |
1,713,113 | 1,510,336 | ||||||||||||||||||||||
| Total equity |
215,428 | 237,759 | ||||||||||||||||||||||
|
|
|
|
|
|||||||||||||||||||||
| Total liabilities and equity |
$ | 1,928,542 | $ | 1,748,095 | ||||||||||||||||||||
|
|
|
|
|
|||||||||||||||||||||
| Net interest income |
$ | 39,068 | $ | 42,921 | ||||||||||||||||||||
|
|
|
|
|
|||||||||||||||||||||
| Net interest rate spread(1) |
1.93 | % | 2.33 | % | ||||||||||||||||||||
|
|
|
|
|
|||||||||||||||||||||
| Net interest-earning assets(2) |
$ | 231,871 | $ | 243,323 | ||||||||||||||||||||
|
|
|
|
|
|||||||||||||||||||||
| Net interest margin(3) |
2.10 | % | 2.55 | % | ||||||||||||||||||||
|
|
|
|
|
|||||||||||||||||||||
| Average interest-earning assets to average interest-bearing liabilities |
114.27 | % | 116.87 | % | ||||||||||||||||||||
|
|
|
|
|
|||||||||||||||||||||
| (1) | Net interest rate spread represents the difference between the yield on average interest-earning assets and the cost of average interest-bearing liabilities. |
| (2) | Net interest-earning assets represent total interest-earnings assets less total interest-bearing liabilities. |
| (3) | Net interest margin represents net interest income divided by average total interest-earnings assets. |
Source: Blue Foundry Bancorp’s prospectus.
EXHIBIT I-6
Blue Foundry Bancorp
Loan Loss Allowance Activity
Exhibit I-6
Blue Foundry Bancorp
Loan Loss Allowance Activity
| Year Ended December 31, | ||||||||
| 2020 | 2019 | |||||||
| (Dollars in thousands) | ||||||||
| Allowance for loan losses at beginning of period |
$ | 14,500 | $ | 13,225 | ||||
| Provision for loan losses |
2,518 | 1,265 | ||||||
| Charge-offs: |
||||||||
| Residential one-to-four family |
49 | — | ||||||
| Multifamily |
— | — | ||||||
| Non-residential |
— | — | ||||||
| Construction and land |
— | — | ||||||
| Junior liens |
— | — | ||||||
| Commercial and industrial |
— | — | ||||||
| Consumer and other |
10 | 15 | ||||||
|
|
|
|
|
|||||
| Total charge-offs |
59 | 15 | ||||||
|
|
|
|
|
|||||
| Recoveries: |
||||||||
| Residential one-to-four family |
— | — | ||||||
| Multifamily |
— | 25 | ||||||
| Non-residential |
— | — | ||||||
| Construction and land |
— | — | ||||||
| Junior liens |
— | — | ||||||
| Commercial and industrial |
— | — | ||||||
| Consumer and other |
— | — | ||||||
|
|
|
|
|
|||||
| Total recoveries |
— | 25 | ||||||
|
|
|
|
|
|||||
| Net charge-offs (recoveries) |
59 | (10 | ) | |||||
| Allowance for loan losses at end of period |
$ | 16,959 | $ | 14,500 | ||||
|
|
|
|
|
|||||
| Allowance for loan losses to non-performing loans at end of period |
131.92 | % | 295.36 | % | ||||
| Allowance for loan losses to total loans outstanding at end of period |
1.34 | % | 1.03 | % | ||||
| Net charge-offs (recoveries) to average loans outstanding during period |
— | % | — | % | ||||
Source: Blue Foundry Bancorp’s Prospectus.
EXHIBIT I-7
Blue Foundry Bancorp
Interest Rate Risk Analysis
Exhibit I-7
Blue Foundry Bancorp
Interest Rate Risk Analysis
| Net Portfolio Value(2) | Net Portfolio Value as Percent of Portfolio Value of Assets(3) |
|||||||||||||||||||
| (Dollars in thousands) | ||||||||||||||||||||
| Basis Point Change in Interest Rates(1) |
Dollar Amount | Dollar Change |
Percent Change |
NPV Ratio(4) | Change | |||||||||||||||
| 400 |
$ | 222,005 | $ | (38,344 | ) | (15 | )% | 11 | % | (2 | )% | |||||||||
| 300 |
237,756 | (22,593 | ) | (9 | )% | 12 | % | (1 | )% | |||||||||||
| 200 |
248,515 | (11,834 | ) | (5 | )% | 13 | % | (1 | )% | |||||||||||
| 100 |
252,708 | (7,641 | ) | (3 | )% | 13 | % | — | % | |||||||||||
| 0 |
260,349 | — | — | % | 13 | % | — | % | ||||||||||||
| (100) |
291,947 | 31,598 | 12 | % | 15 | % | 2 | % | ||||||||||||
| (1) | Assumes an immediate uniform change in interest rates at all maturities. |
| (2) | NPV is the discounted present value of expected cash flows from assets, liabilities and off-balance sheet contracts. |
| (3) | Present value of assets represents the discounted present value of incoming cash flows on interest-earning assets. |
| (4) | NPV Ratio represents NPV divided by the present value of assets. |
Source: Blue Foundry Bancorp’s prospectus.
EXHIBIT I-8
Blue Foundry Bancorp
Fixed and Adjustable Rate Loans
Exhibit I-8
Blue Foundry Bancorp
Fixed and Adjustable Rate Loans
| Fixed Rates | Floating or Adjustable Rates |
Total | ||||||||||
| (In thousands) | ||||||||||||
| Residential one-to-four family |
$ | 187,801 | $ | 427,912 | $ | 615,713 | ||||||
| Multifamily |
67,435 | 361,671 | 429,106 | |||||||||
| Non-residential |
46,916 | 76,414 | 123,330 | |||||||||
| Construction and land |
— | 1,465 | 1,465 | |||||||||
| Junior liens |
3,587 | 20,102 | 23,689 | |||||||||
| Commercial and industrial |
52,867 | — | 52,867 | |||||||||
| Consumer and other |
32 | — | 32 | |||||||||
|
|
|
|
|
|
|
|||||||
| Total |
$ | 358,638 | $ | 887,564 | $ | 1,246,202 | ||||||
Source: Blue Foundry Bancorp’s prospectus.
EXHIBIT I-9
Blue Foundry Bancorp
Loan Portfolio Composition
Exhibit I-9
Blue Foundry Bancorp
Loan Portfolio Composition
| At December 31, | ||||||||||||||||
| 2020 | 2019 | |||||||||||||||
| Amount | Percent | Amount | Percent | |||||||||||||
| (Dollars in thousands) | ||||||||||||||||
| Residential one-to-four family |
$ | 611,603 | 47.82 | % | $ | 766,736 | 54.13 | % | ||||||||
| Multifamily |
427,436 | 33.42 | 459,547 | 32.44 | ||||||||||||
| Non-residential |
128,141 | 10.02 | 127,123 | 8.97 | ||||||||||||
| Construction and land |
33,691 | 2.63 | 34,479 | 2.43 | ||||||||||||
| Junior liens |
23,814 | 1.86 | 28,589 | 2.02 | ||||||||||||
| Commercial and industrial |
54,053 | 4.23 | — | — | ||||||||||||
| Consumer and other |
99 | 0.01 | 124 | 0.01 | ||||||||||||
|
|
|
|
|
|
|
|
|
|||||||||
| Total loans receivable |
1,278,837 | 100.00 | % | 1,416,598 | 100.00 | % | ||||||||||
|
|
|
|
|
|||||||||||||
| Deferred fees, costs and discounts, net |
5,236 | 7,678 | ||||||||||||||
| Less: allowance for loan losses |
(16,959 | ) | (14,500 | ) | ||||||||||||
|
|
|
|
|
|||||||||||||
| Loans receivable, net |
$ | 1,267,114 | $ | 1,409,776 | ||||||||||||
|
|
|
|
|
|||||||||||||
Source: Blue Foundry Bancorp’s prospectus.
EXHIBIT I-10
Blue Foundry Bancorp
Contractual Maturity by Loan Type
Exhibit I-10
Blue Foundry Bancorp
Contractual Maturity by Loan Type
| At December 31, 2020 | ||||||||||||||||||||||||||||||||
| One-to-Four Family |
Multifamily | Non-Residential | Construction and Land |
Junior Liens |
Commercial and Industrial |
Consumer and Other |
Total Loans | |||||||||||||||||||||||||
| (In thousands) | ||||||||||||||||||||||||||||||||
| Amounts due in: |
||||||||||||||||||||||||||||||||
| One year or less |
$ | 567 | $ | — | $ | 4,894 | $ | 32,229 | $ | 230 | $ | — | $ | 67 | $ | 37,987 | ||||||||||||||||
| More than one year through five years |
5,401 | 17,694 | 21,160 | 1,191 | 1,138 | 53,922 | — | 100,506 | ||||||||||||||||||||||||
| More than five years through fifteen years |
106,781 | 86,412 | 37,112 | — | 1,516 | 131 | 32 | 231,984 | ||||||||||||||||||||||||
| More than fifteen years |
498,854 | 323,330 | 64,975 | 271 | 20,930 | — | — | 908,360 | ||||||||||||||||||||||||
|
|
|
|
|
|
|
|
|
|
|
|
|
|
|
|
|
|||||||||||||||||
| Total |
$ | 611,603 | $ | 427,436 | $ | 128,141 | $ | 33,691 | $ | 23,814 | $ | 54,053 | $ | 99 | $ | 1,278,837 | ||||||||||||||||
|
|
|
|
|
|
|
|
|
|
|
|
|
|
|
|
|
|||||||||||||||||
Source: Blue Foundry Bancorp’s prospectus.
EXHIBIT I-11
Blue Foundry Bancorp
Non-Performing Assets
Exhibit I-11
Blue Foundry Bancorp
Non-Performing Assets
| At December 31, | ||||||||
| 2020 | 2019 | |||||||
| (Dollars in thousands) | ||||||||
| Non-accrual loans: |
||||||||
| Residential one-to-four family |
$11,813 | $3,444 | ||||||
| Multifamily |
156 | 263 | ||||||
| Non-residential |
805 | 966 | ||||||
| Construction and land |
— | — | ||||||
| Junior liens |
82 | 236 | ||||||
| Commercial and industrial |
— | — | ||||||
| Consumer and other |
— | — | ||||||
|
|
|
|
|
|||||
| Total |
12,856 | 4,909 | ||||||
|
|
|
|
|
|||||
| Accruing loans past due 90 days or more: |
||||||||
| Residential one-to-four family |
— | — | ||||||
| Multifamily |
— | — | ||||||
| Non-residential |
— | — | ||||||
| Construction and land |
— | — | ||||||
| Junior liens |
— | — | ||||||
| Commercial and industrial |
— | — | ||||||
| Consumer and other |
— | — | ||||||
|
|
|
|
|
|||||
| Total |
— | — | ||||||
|
|
|
|
|
|||||
| Total non-performing loans |
12,856 | 4,909 | ||||||
|
|
|
|
|
|||||
| Real estate owned |
623 | 2,014 | ||||||
|
|
|
|
|
|||||
| Other non-performing assets |
— | — | ||||||
|
|
|
|
|
|||||
| Total non-performing assets |
$ | 13,479 | $ | 6,923 | ||||
|
|
|
|
|
|||||
| Troubled debt restructurings (accruing): |
||||||||
| Residential one-to-four family |
$ | 2,413 | $ | 2,469 | ||||
| Multifamily |
— | — | ||||||
| Non-residential |
3,877 | 4,112 | ||||||
| Construction and land |
— | — | ||||||
| Junior liens |
— | — | ||||||
| Commercial and industrial |
— | — | ||||||
| Consumer and other |
45 | 52 | ||||||
|
|
|
|
|
|||||
| Total troubled debt restructurings (accruing) |
$ | 6,335 | $ | 6,633 | ||||
|
|
|
|
|
|||||
| Total troubled debt restructurings (accruing) and total non-performing assets |
$ | 32,670 | $ | 18,465 | ||||
| Total non-performing loans to total loans |
1.00 | % | 0.34 | % | ||||
| Total non-performing loans to total assets |
0.66 | 0.26 | ||||||
| Total non-performing assets to total assets |
0.69 | 0.37 | ||||||
| Total non-performing assets and troubled debt restructurings (accruing) to total assets |
1.68 | 1.00 | ||||||
Source: Blue Foundry Bancorp’s prospectus.
EXHIBIT I-12
Blue Foundry Bancorp
Deposit Composition
Exhibit I-12
Blue Foundry Bancorp
Deposit Composition
| At December 31, | ||||||||||||||||
| 2020 | 2019 | |||||||||||||||
| Amount | Amount | Amount | Percent | |||||||||||||
| (Dollars in thousands) | ||||||||||||||||
| Interest bearing (NOW) demand accounts |
$ | 362,169 | 26.71 | % | $ | 285,946 | 22.08 | % | ||||||||
| Savings and money market accounts |
276,584 | 20.39 | 221,377 | 17.09 | ||||||||||||
| Time deposits |
717,431 | 52.90 | 787,726 | 60.83 | ||||||||||||
|
|
|
|
|
|
|
|
|
|||||||||
| Total |
$ | 1,356,184 | 100.00 | % | $ | 1,295,049 | 100.00 | % | ||||||||
|
|
|
|
|
|
|
|
|
|||||||||
Source: Blue Foundry Bancorp’s prospectus.
EXHIBIT II-1
Blue Foundry Bancorp
Description of Office Properties
Exhibit II-1
Blue Foundry Bancorp
Description of Office Properties
| Location |
Year Opened |
Owned/ Leased |
Net Book Value at December 31, 2020 |
Lease Liability at December 31, 2020 |
Construction in Process (Not Reflected in Book Value) at December 31, 2020 |
|||||||||||||||
| (In thousands) | ||||||||||||||||||||
| Main Office: |
||||||||||||||||||||
| 19 Park Ave |
1939 | Leased | $ | 606 | $ | 372 | $ | — | ||||||||||||
| Rutherford, New Jersey 07070 |
||||||||||||||||||||
| Administrative Headquarters (upon relocation currently scheduled for spring 2021): |
||||||||||||||||||||
| 7 Sylvan Way |
2021 | Leased | — | 19,654 | 3,503 | |||||||||||||||
| Parsippany, New Jersey 07054 |
||||||||||||||||||||
| Full Service Branches: |
||||||||||||||||||||
| 280 Union Avenue |
1939 | Owned | 206 | — | — | |||||||||||||||
| Rutherford, New Jersey 07070 |
||||||||||||||||||||
| Clifton Commons Shopping Center |
1999 | Land Lease | 428 | 686 | 74 | |||||||||||||||
| 102 Kingsland Road |
||||||||||||||||||||
| Clifton, New Jersey 07014 |
||||||||||||||||||||
| 753 Ridge Road |
1939 | Owned | 688 | — | 118 | |||||||||||||||
| Lyndhurst, New Jersey 07071 |
||||||||||||||||||||
| 222 Ridgewood Avenue |
2012 | Owned | 2,368 | — | 13 | |||||||||||||||
| Glen Ridge, New Jersey 07028 |
||||||||||||||||||||
| 250 W. Passaic Street |
1939 | Leased | 20 | 255 | — | |||||||||||||||
| Rochelle Park, New Jersey 07662 |
||||||||||||||||||||
| 217 Rock Road |
2002 | Owned | 1,429 | — | 779 | |||||||||||||||
| Glen Rock, New Jersey 07452 |
||||||||||||||||||||
| 55 North Broad Street |
1885 | Leased | 27 | 198 | — | |||||||||||||||
| Ridgewood, New Jersey 07450 |
||||||||||||||||||||
| 531 North Maple Avenue |
1996 | Owned | 901 | — | — | |||||||||||||||
| Ridgewood, New Jersey 07450 |
||||||||||||||||||||
| 60 Beaverbrook Road |
1989 | Leased | 7 | 237 | — | |||||||||||||||
Exhibit II-1 (continued)
Blue Foundry Bancorp
Description of Office Properties
| 440 Hillsdale Avenue |
1939 | Leased | 70 | 254 | — | |||||||||||||||
| Hillsdale, New Jersey 07642 |
||||||||||||||||||||
| Boulder Run Shopping Center |
1985 | Leased | 207 | 940 | — | |||||||||||||||
| 319 Franklin Avenue |
||||||||||||||||||||
| Wyckoff, New Jersey 07481 |
||||||||||||||||||||
| 448 Main Road |
2009 | Owned | 2,247 | — | — | |||||||||||||||
| Towaco, New Jersey 07082 |
||||||||||||||||||||
| 66 North Beverwyck Road |
2007 | Owned | 1,017 | — | — | |||||||||||||||
| Lake Hiawatha, New Jersey 07034 |
||||||||||||||||||||
| 209 Ridgedale Avenue |
2008 | Land Lease | 1,508 | 1,507 | 12 | |||||||||||||||
| Florham Park, New Jersey 07932 |
||||||||||||||||||||
| 4 East Ramapo Avenue |
1939 | Leased | 224 | 229 | — | |||||||||||||||
| Mahwah, New Jersey 07430 |
||||||||||||||||||||
| To-Be-Opened Branches: |
||||||||||||||||||||
| 453 Main Street |
2021 | Leased | — | 1,115 | 21 | |||||||||||||||
| Chatham, New Jersey 07928 |
||||||||||||||||||||
| 123 Montgomery Street |
2021 | Leased | — | — | 13 | |||||||||||||||
| Jersey City, New Jersey 07302 |
Source: Blue Foundry Bancorp’s prospectus.
EXHIBIT II-2
Historical Interest Rates
Exhibit II-2
Historical Interest Rates(1)
| Year/Qtr. Ended |
Prime Rate |
90 Day T-Note |
One Year T-Note |
10 Year T-Note |
||||||||||||||
| 2007: |
Quarter 1 | 8.25 | % | 5.04 | % | 4.90 | % | 4.65 | % | |||||||||
| Quarter 2 | 8.25 | % | 4.82 | % | 4.91 | % | 5.03 | % | ||||||||||
| Quarter 3 | 7.75 | % | 3.82 | % | 4.05 | % | 4.59 | % | ||||||||||
| Quarter 4 | 7.25 | % | 3.36 | % | 3.34 | % | 3.91 | % | ||||||||||
| 2008: |
Quarter 1 | 5.25 | % | 1.38 | % | 1.55 | % | 3.45 | % | |||||||||
| Quarter 2 | 5.00 | % | 1.90 | % | 2.36 | % | 3.99 | % | ||||||||||
| Quarter 3 | 5.00 | % | 0.92 | % | 1.78 | % | 3.85 | % | ||||||||||
| Quarter 4 | 3.25 | % | 0.11 | % | 0.37 | % | 2.25 | % | ||||||||||
| 2009: |
Quarter 1 | 3.25 | % | 0.21 | % | 0.57 | % | 2.71 | % | |||||||||
| Quarter 2 | 3.25 | % | 0.19 | % | 0.56 | % | 3.53 | % | ||||||||||
| Quarter 3 | 3.25 | % | 0.14 | % | 0.40 | % | 3.31 | % | ||||||||||
| Quarter 4 | 3.25 | % | 0.06 | % | 0.47 | % | 3.85 | % | ||||||||||
| 2010: |
Quarter 1 | 3.25 | % | 0.16 | % | 0.41 | % | 3.84 | % | |||||||||
| Quarter 2 | 3.25 | % | 0.18 | % | 0.32 | % | 2.97 | % | ||||||||||
| Quarter 3 | 3.25 | % | 0.18 | % | 0.32 | % | 2.97 | % | ||||||||||
| Quarter 4 | 3.25 | % | 0.12 | % | 0.29 | % | 3.30 | % | ||||||||||
| 2011: |
Quarter 1 | 3.25 | % | 0.09 | % | 0.30 | % | 3.47 | % | |||||||||
| Quarter 2 | 3.25 | % | 0.03 | % | 0.19 | % | 3.18 | % | ||||||||||
| Quarter 3 | 3.25 | % | 0.02 | % | 0.13 | % | 1.92 | % | ||||||||||
| Quarter 4 | 3.25 | % | 0.02 | % | 0.12 | % | 1.89 | % | ||||||||||
| 2012: |
Quarter 1 | 3.25 | % | 0.07 | % | 0.19 | % | 2.23 | % | |||||||||
| Quarter 2 | 3.25 | % | 0.09 | % | 0.21 | % | 1.67 | % | ||||||||||
| Quarter 3 | 3.25 | % | 0.10 | % | 0.17 | % | 1.65 | % | ||||||||||
| Quarter 4 | 3.25 | % | 0.05 | % | 0.16 | % | 1.78 | % | ||||||||||
| 2013: |
Quarter 1 | 3.25 | % | 0.07 | % | 0.14 | % | 1.87 | % | |||||||||
| Quarter 2 | 3.25 | % | 0.04 | % | 0.15 | % | 2.52 | % | ||||||||||
| Quarter 3 | 3.25 | % | 0.02 | % | 0.10 | % | 2.64 | % | ||||||||||
| Quarter 4 | 3.25 | % | 0.07 | % | 0.13 | % | 3.04 | % | ||||||||||
| 2014: |
Quarter 1 | 3.25 | % | 0.05 | % | 0.13 | % | 2.73 | % | |||||||||
| Quarter 2 | 3.25 | % | 0.04 | % | 0.11 | % | 2.53 | % | ||||||||||
| Quarter 3 | 3.25 | % | 0.02 | % | 0.13 | % | 2.52 | % | ||||||||||
| Quarter 4 | 3.25 | % | 0.04 | % | 0.25 | % | 2.17 | % | ||||||||||
| 2015: |
Quarter 1 | 3.25 | % | 0.03 | % | 0.26 | % | 1.94 | % | |||||||||
| Quarter 2 | 3.25 | % | 0.01 | % | 0.28 | % | 2.35 | % | ||||||||||
| Quarter 3 | 3.25 | % | 0.00 | % | 0.33 | % | 2.06 | % | ||||||||||
| Quarter 4 | 3.50 | % | 0.16 | % | 0.65 | % | 2.27 | % | ||||||||||
| 2016: |
Quarter 1 | 3.50 | % | 0.21 | % | 0.59 | % | 1.78 | % | |||||||||
| Quarter 2 | 3.50 | % | 0.26 | % | 0.45 | % | 1.49 | % | ||||||||||
| Quarter 3 | 3.50 | % | 0.29 | % | 0.59 | % | 1.60 | % | ||||||||||
| Quarter 4 | 3.75 | % | 0.51 | % | 0.85 | % | 2.45 | % | ||||||||||
| 2017: |
Quarter 1 | 4.00 | % | 0.76 | % | 1.03 | % | 2.40 | % | |||||||||
| Quarter 2 | 4.25 | % | 1.03 | % | 1.24 | % | 2.31 | % | ||||||||||
| Quarter 3 | 4.25 | % | 1.06 | % | 1.31 | % | 2.33 | % | ||||||||||
| Quarter 4 | 4.50 | % | 1.39 | % | 1.76 | % | 2.40 | % | ||||||||||
| 2018: |
Quarter 1 | 4.75 | % | 1.73 | % | 2.09 | % | 2.74 | % | |||||||||
| Quarter 2 | 5.00 | % | 1.93 | % | 2.33 | % | 2.85 | % | ||||||||||
| Quarter 3 | 5.25 | % | 2.19 | % | 2.59 | % | 3.05 | % | ||||||||||
| Quarter 4 | 5.50 | % | 2.45 | % | 2.63 | % | 2.69 | % | ||||||||||
| 2019: |
Quarter 1 | 5.50 | % | 2.40 | % | 2.40 | % | 2.41 | % | |||||||||
| Quarter 2 | 5.00 | % | 2.12 | % | 1.92 | % | 2.00 | % | ||||||||||
| Quarter 3 | 4.75 | % | 1.88 | % | 1.75 | % | 1.68 | % | ||||||||||
| Quarter 4 | 4.75 | % | 1.55 | % | 1.59 | % | 1.92 | % | ||||||||||
| 2020: |
Quarter 1 | 3.25 | % | 0.11 | % | 0.17 | % | 0.70 | % | |||||||||
| Quarter 2 | 3.25 | % | 0.16 | % | 0.16 | % | 0.66 | % | ||||||||||
| Quarter 3 | 3.25 | % | 0.10 | % | 0.12 | % | 0.69 | % | ||||||||||
| Quarter 4 | 3.25 | % | 0.09 | % | 0.10 | % | 0.93 | % | ||||||||||
| As of February 5, 2021 | 3.25 | % | 0.03 | % | 0.06 | % | 1.19 | % | ||||||||||
| (1) | End of period data. |
Sources: Federal Reserve and The Wall Street Journal.
EXHIBIT III-1
General Characteristics of Publicly-Traded Institutions
Exhibit III-1
Characteristics of Publicly-Traded Thrifts
February 5, 2021
| As of | ||||||||||||||||||||||||||||||
| February 5, 2021 | ||||||||||||||||||||||||||||||
| Total | Fiscal | Conv. | Stock | Market | ||||||||||||||||||||||||||
| Ticker |
Financial Institution |
Exchange | Region | City | State | Assets | Offices | Mth End | Date | Price | Value | |||||||||||||||||||
| ($Mil) | ($) | ($Mil) | ||||||||||||||||||||||||||||
| AFBI |
Affinity Bancshares, Inc. | NASDAQCM | SE | Covington | GA | $ | 888 | 3 | Dec | 4/27/17 | $ | 10.75 | $ | 74 | ||||||||||||||||
| AX |
Axos Financial, Inc. | NYSE | WE | Las Vegas | NV | $ | 13,382 | 1 | Jun | 3/14/05 | $ | 43.95 | $ | 2,595 | ||||||||||||||||
| BYFC |
Broadway Financial Corporation | NASDAQCM | WE | Los Angeles | CA | $ | 499 | 3 | Dec | 1/8/96 | $ | 2.21 | $ | 41 | ||||||||||||||||
| CFFN |
Capitol Federal Financial, Inc. | NASDAQGS | MW | Topeka | KS | $ | 9,487 | 54 | Sep | 3/31/99 | $ | 12.65 | $ | 1,711 | ||||||||||||||||
| CARV |
Carver Bancorp, Inc. | NASDAQCM | MA | New York | NY | $ | 673 | 7 | Mar | 10/24/94 | $ | 8.90 | $ | 27 | ||||||||||||||||
| CBMB |
CBM Bancorp, Inc. | NASDAQCM | MA | Baltimore | MD | $ | 232 | 4 | Dec | 9/27/18 | $ | 13.95 | $ | 48 | ||||||||||||||||
| CNNB |
Cincinnati Bancorp, Inc. | NASDAQCM | MW | Cincinnati | OH | $ | 232 | 6 | Dec | 10/14/15 | $ | 11.96 | $ | 36 | ||||||||||||||||
| ESBK |
Elmira Savings Bank | NASDAQCM | MA | Elmira | NY | $ | 674 | 12 | Dec | 3/1/85 | $ | 12.24 | $ | 43 | ||||||||||||||||
| ESSA |
ESSA Bancorp, Inc. | NASDAQGS | MA | Stroudsburg | PA | $ | 1,894 | 23 | Sep | 4/3/07 | $ | 15.59 | $ | 157 | ||||||||||||||||
| FFBW |
FFBW, Inc. | NASDAQCM | MW | Brookfield | WI | $ | 286 | 7 | Dec | 10/10/17 | $ | 10.42 | $ | 74 | ||||||||||||||||
| FNWB |
First Northwest Bancorp | NASDAQGM | WE | Port Angeles | WA | $ | 1,565 | 12 | Dec | 1/29/15 | $ | 15.71 | $ | 149 | ||||||||||||||||
| FBC |
Flagstar Bancorp, Inc. | NYSE | MW | Troy | MI | $ | 29,476 | 159 | Dec | 4/30/97 | $ | 45.06 | $ | 2,373 | ||||||||||||||||
| FSBW |
FS Bancorp, Inc. | NASDAQCM | WE | Mountlake Terrace |
WA | $ | 2,055 | 23 | Dec | 7/9/12 | $ | 58.85 | $ | 253 | ||||||||||||||||
| GBNY |
Generations Bancorp NY, Inc. | NASDAQCM | MA | Seneca Falls | NY | #VALUE! | 11 | Dec | 7/10/06 | $ | 9.74 | $ | 24 | |||||||||||||||||
| HONE |
HarborOne Bancorp, Inc. | NASDAQGS | NE | Brockton | MA | $ | 4,428 | 29 | Dec | 6/29/16 | $ | 11.32 | $ | 616 | ||||||||||||||||
| HIFS |
Hingham Institution for Savings | NASDAQGM | NE | Hingham | MA | $ | 2,719 | 10 | Dec | 12/13/88 | $ | 236.30 | $ | 505 | ||||||||||||||||
| HMNF |
HMN Financial, Inc. | NASDAQGM | MW | Rochester | MN | $ | 898 | 14 | Dec | 6/30/94 | $ | 19.00 | $ | 91 | ||||||||||||||||
| HFBL |
Home Federal Bancorp, Inc. of Louisiana | NASDAQCM | SW | Shreveport | LA | $ | 542 | 8 | Jun | 1/18/05 | $ | 29.09 | $ | 45 | ||||||||||||||||
| HVBC |
HV Bancorp, Inc. | NASDAQCM | MA | Doylestown | PA | $ | 508 | 5 | Dec | 1/11/17 | $ | 16.81 | $ | 34 | ||||||||||||||||
| IROQ |
IF Bancorp, Inc. | NASDAQCM | MW | Watseka | IL | $ | 726 | 8 | Jun | 7/7/11 | $ | 20.50 | $ | 66 | ||||||||||||||||
| KRNY |
Kearny Financial Corp. | NASDAQGS | MA | Fairfield | NJ | $ | 7,310 | 49 | Jun | 2/23/05 | $ | 10.65 | $ | 922 | ||||||||||||||||
| EBSB |
Meridian Bancorp, Inc. | NASDAQGS | NE | Peabody | MA | $ | 6,567 | 43 | Dec | 1/22/08 | $ | 15.91 | $ | 799 | ||||||||||||||||
| MSVB |
Mid-Southern Bancorp, Inc. | NASDAQCM | MW | Salem | IN | $ | 218 | 3 | Dec | 4/8/98 | $ | 16.24 | $ | 48 | ||||||||||||||||
| NYCB |
New York Community Bancorp, Inc. | NYSE | MA | Westbury | NY | $ | 54,932 | 239 | Dec | 11/23/93 | $ | 10.41 | $ | 4,829 | ||||||||||||||||
| NFBK |
Northfield Bancorp, Inc. | NASDAQGS | MA | Woodbridge | NJ | $ | 5,589 | 38 | Dec | 11/7/07 | $ | 13.22 | $ | 690 | ||||||||||||||||
| NWBI |
Northwest Bancshares, Inc. | NASDAQGS | MA | Warren | PA | $ | 13,789 | 171 | Dec | 11/4/94 | $ | 13.17 | $ | 1,673 | ||||||||||||||||
| PCSB |
PCSB Financial Corporation | NASDAQCM | MA | Yorktown Heights |
NY | $ | 1,791 | 16 | Jun | 4/20/17 | $ | 15.75 | $ | 241 | ||||||||||||||||
| PVBC |
Provident Bancorp, Inc. | NASDAQCM | NE | Amesbury | MA | $ | 1,498 | 7 | Dec | 7/15/15 | $ | 12.10 | $ | 219 | ||||||||||||||||
| PROV |
Provident Financial Holdings, Inc. | NASDAQGS | WE | Riverside | CA | $ | 1,184 | 14 | Jun | 6/27/96 | $ | 15.40 | $ | 115 | ||||||||||||||||
| PFS |
Provident Financial Services, Inc. | NYSE | MA | Jersey City | NJ | $ | 12,871 | 101 | Dec | 1/15/03 | $ | 18.99 | $ | 1,446 | ||||||||||||||||
| PBIP |
Prudential Bancorp, Inc. | NASDAQGM | MA | Philadelphia | PA | $ | 1,223 | 10 | Sep | 3/29/05 | $ | 12.69 | $ | 101 | ||||||||||||||||
| RNDB |
Randolph Bancorp, Inc. | NASDAQGM | NE | Stoughton | MA | $ | 723 | 5 | Dec | 7/1/16 | $ | 20.00 | $ | 103 | ||||||||||||||||
| RVSB |
Riverview Bancorp, Inc. | NASDAQGS | WE | Vancouver | WA | $ | 1,425 | 17 | Mar | 10/26/93 | $ | 5.62 | $ | 126 | ||||||||||||||||
| SVBI |
Severn Bancorp, Inc. | NASDAQCM | MA | Annapolis | MD | $ | 939 | 7 | Dec | $ | 7.80 | $ | 100 | |||||||||||||||||
| STXB |
Spirit of Texas Bancshares, Inc. | NASDAQGS | SW | Conroe | TX | $ | 2,925 | 37 | Dec | 5/3/18 | $ | 19.37 | $ | 331 | ||||||||||||||||
| SBT |
Sterling Bancorp, Inc. | NASDAQCM | MW | Southfield | MI | $ | 3,937 | 30 | Dec | 11/16/17 | $ | 5.11 | $ | 255 | ||||||||||||||||
| TBNK |
Territorial Bancorp Inc. | NASDAQGS | WE | Honolulu | HI | $ | 2,106 | 30 | Dec | 7/13/09 | $ | 24.77 | $ | 226 | ||||||||||||||||
| TSBK |
Timberland Bancorp, Inc. | NASDAQGM | WE | Hoquiam | WA | $ | 1,566 | 24 | Sep | 1/12/98 | $ | 27.10 | $ | 225 | ||||||||||||||||
| TBK |
Triumph Bancorp, Inc. | NASDAQGS | SW | Dallas | TX | $ | 5,837 | 64 | Dec | 11/6/14 | $ | 64.06 | $ | 1,580 | ||||||||||||||||
| TRST |
TrustCo Bank Corp NY | NASDAQGS | MA | Glenville | NY | $ | 5,736 | 148 | Dec | $ | 6.51 | $ | 628 | |||||||||||||||||
| WSBF |
Waterstone Financial, Inc. | NASDAQGS | MW | Wauwatosa | WI | $ | 2,221 | 16 | Dec | 10/4/05 | $ | 19.19 | $ | 455 | ||||||||||||||||
| WNEB |
Western New England Bancorp, Inc. | NASDAQGS | NE | Westfield | MA | $ | 2,487 | 27 | Dec | 12/27/01 | $ | 7.23 | $ | 165 | ||||||||||||||||
| WSFS |
WSFS Financial Corporation | NASDAQGS | MA | Wilmington | DE | $ | 13,830 | 93 | Dec | 11/26/86 | $ | 45.26 | $ | 2,161 | ||||||||||||||||
| WVFC |
WVS Financial Corp. | NASDAQGM | MA | Pittsburgh | PA | $ | 332 | 6 | Jun | 11/29/93 | $ | 15.15 | $ | 26 | ||||||||||||||||
| BCOW |
1895 Bancorp Of Wisconsin, Inc. (MHC) | NASDAQCM | MW | Greenfield | WI | $ | 505 | 6 | Dec | 1/8/19 | $ | 9.85 | $ | 45 | ||||||||||||||||
| BSBK |
Bogota Financial Corp. (MHC) | NASDAQCM | MA | Teaneck | NJ | $ | 754 | 4 | Dec | 1/15/20 | $ | 9.12 | $ | 120 | ||||||||||||||||
| CLBK |
Columbia Financial, Inc. (MHC) | NASDAQGS | MA | Fair Lawn | NJ | $ | 8,865 | 61 | Dec | 4/19/18 | $ | 15.80 | $ | 1,753 | ||||||||||||||||
| FSEA |
First Seacoast Bancorp (MHC) | NASDAQCM | NE | Dover | NH | $ | 477 | 5 | Dec | 7/16/19 | $ | 8.73 | $ | 51 | ||||||||||||||||
| GCBC |
Greene County Bancorp, Inc. (MHC) | NASDAQCM | MA | Catskill | NY | $ | 1,799 | 19 | Jun | 12/30/98 | $ | 24.70 | $ | 210 | ||||||||||||||||
| KFFB |
Kentucky First Federal Bancorp (MHC) | NASDAQGM | MW | Frankfort | KY | $ | 328 | 7 | Jun | 3/2/05 | $ | 6.46 | $ | 53 | ||||||||||||||||
| LSBK |
Lake Shore Bancorp, Inc. (MHC) | NASDAQGM | MA | Dunkirk | NY | $ | 683 | 12 | Dec | 4/3/06 | $ | 13.44 | $ | 77 | ||||||||||||||||
| MGYR |
Magyar Bancorp, Inc. (MHC) | NASDAQGM | MA | New Brunswick |
NJ | $ | 754 | 7 | Sep | 1/23/06 | $ | 10.61 | $ | 62 | ||||||||||||||||
| OFED |
Oconee Federal Financial Corp. (MHC) | NASDAQCM | SE | Seneca | SC | $ | 520 | 8 | Jun | 1/13/11 | $ | 24.00 | $ | 135 | ||||||||||||||||
| PDLB |
PDL Community Bancorp (MHC) | NASDAQGM | MA | Bronx | NY | $ | 1,277 | 14 | Dec | 9/29/17 | $ | 9.72 | $ | 161 | ||||||||||||||||
| PBFS |
Pioneer Bancorp, Inc. (MHC) | NASDAQCM | MA | Albany | NY | $ | 1,629 | 23 | Jun | 7/17/19 | $ | 10.91 | $ | 273 | ||||||||||||||||
| RBKB |
Rhinebeck Bancorp, Inc. (MHC) | NASDAQCM | MA | Poughkeepsie | NY | $ | 1,113 | 15 | Dec | 1/16/19 | $ | 9.21 | $ | 99 | ||||||||||||||||
| TFSL |
TFS Financial Corporation (MHC) | NASDAQGS | MW | Cleveland | OH | $ | 14,642 | 37 | Sep | 4/20/07 | $ | 17.53 | $ | 4,848 | ||||||||||||||||
Source: S&P Global Market Intelligence.
EXHIBIT III-2
Public Market Pricing of Mid-Atlantic and New England Thrift Institutions
Exhibit III-2
Public Market Pricing of Mid-Atlantic and New England Institutions
As of February 5, 2021
| Market | Per Share Data | |||||||||||||||||||||||||||||||||||||||||||||||||||||||||||||||||||||||||||||||||||||
| Capitalization | Core | Book | Dividends(3) | Financial Characteristics(5) | ||||||||||||||||||||||||||||||||||||||||||||||||||||||||||||||||||||||||||||||||||
| Price/ | Market | 12 Month | Value/ | Pricing Ratios(2) | Amount/ | Payout | Total | Equity/ | Tang. Eq./ | NPAs/ | Reported | Core | ||||||||||||||||||||||||||||||||||||||||||||||||||||||||||||||||||||||||||
| Share | Value | EPS(1) | Share | P/E | P/B | P/A | P/TB | P/Core | Share | Yield | Ratio (4) | Assets | Assets | T. Assets | Assets | ROAA | ROAE | ROAA | ROAE | |||||||||||||||||||||||||||||||||||||||||||||||||||||||||||||||||||
| ($) | ($Mil) | ($) | ($) | (x) | (%) | (%) | (%) | (x) | ($) | (%) | (%) | ($Mil) | (%) | (%) | (%) | (%) | (%) | (%) | (%) | |||||||||||||||||||||||||||||||||||||||||||||||||||||||||||||||||||
| All Non-MHC Public Companies(6) |
|
|||||||||||||||||||||||||||||||||||||||||||||||||||||||||||||||||||||||||||||||||||||
| Averages |
|
$ | 23.33 | $ | 601.07 | $ | 1.85 | $ | 19.90 | 13.96 | 103.6 | % | 12.9 | % | 114.7 | % | 13.98 | $ | 0.43 | 2.36 | % | 47 | % | $ | 5,167 | 12.62 | % | 11.78 | % | 0.69 | % | 0.84 | % | 6.91 | % | 0.87 | % | 7.23 | % | |||||||||||||||||||||||||||||||||||||||||||||||
| Median |
|
$ | 15.28 | $ | 192.19 | $ | 0.87 | $ | 15.86 | 12.66 | 94.1 | % | 11.6 | % | 100.8 | % | 13.14 | $ | 0.32 | 2.21 | % | 36 | % | $ | 1,791 | 11.51 | % | 10.33 | % | 0.55 | % | 0.76 | % | 5.88 | % | 0.78 | % | 6.15 | % | |||||||||||||||||||||||||||||||||||||||||||||||
| Comparable Group |
|
|||||||||||||||||||||||||||||||||||||||||||||||||||||||||||||||||||||||||||||||||||||
| Averages |
|
$ | 23.90 | $ | 676.53 | $ | 1.69 | $ | 20.30 | 14.31x | 96.95 | % | 11.70 | % | 108.27 | % | 14.05x | $ | 0.45 | 2.74 | % | 55.10 | % | $ | 6,397 | 12.21 | % | 11.11 | % | 0.72 | % | 0.76 | % | 6.22 | % | 0.75 | % | 6.12 | % | |||||||||||||||||||||||||||||||||||||||||||||||
| Medians |
|
$ | 13.17 | $ | 219.00 | $ | 0.74 | $ | 14.31 | 13.73x | 92.27 | % | 11.76 | % | 97.72 | % | 13.43x | $ | 0.32 | 2.64 | % | 44.44 | % | $ | 2,190 | 11.48 | % | 10.08 | % | 0.65 | % | 0.76 | % | 5.54 | % | 0.74 | % | 5.63 | % | |||||||||||||||||||||||||||||||||||||||||||||||
| Comparable Group |
||||||||||||||||||||||||||||||||||||||||||||||||||||||||||||||||||||||||||||||||||||||
| CARV |
Carver Bancorp, Inc. | NY | $ | 8.90 | $ | 27.26 | ($ | 1.44 | ) | $ | 9.91 | NM | 89.80 | % | 3.89 | % | 89.80 | % | NM | $ | 0.00 | 0.00 | % | NA | $ | 673 | 6.90 | % | 6.90 | % | 1.25 | % | -0.79 | % | -9.90 | % | -0.90 | % | -11.29 | % | ||||||||||||||||||||||||||||||||||||||||||||||
| CBMB |
CBM Bancorp, Inc. | MD | $ | 13.95 | $ | 48.02 | $ | 0.17 | $ | 14.34 | NM | 97.29 | % | 22.31 | % | 97.29 | % | NM | NA | NA | 250.00 | % | $ | 232 | 22.94 | % | 22.94 | % | 0.55 | % | 0.32 | % | 1.27 | % | 0.27 | % | 1.07 | % | ||||||||||||||||||||||||||||||||||||||||||||||||
| ESBK |
Elmira Savings Bank | NY | $ | 12.24 | $ | 43.12 | $ | 1.09 | $ | 17.01 | 10.29x | 71.03 | % | 6.69 | % | 89.11 | % | 10.30x | $ | 0.60 | 4.90 | % | 57.14 | % | $ | 674 | 8.90 | % | 7.20 | % | NA | 0.60 | % | 6.42 | % | 0.60 | % | 6.44 | % | |||||||||||||||||||||||||||||||||||||||||||||||
| ESSA |
ESSA Bancorp, Inc. | PA | $ | 15.59 | $ | 157.22 | $ | 1.38 | $ | 17.60 | 10.68x | 86.89 | % | 9.03 | % | 93.91 | % | 10.71x | $ | 0.44 | 2.82 | % | 30.14 | % | $ | 1,894 | 10.11 | % | 9.41 | % | 1.09 | % | 0.76 | % | 7.43 | % | 0.75 | % | 7.37 | % | ||||||||||||||||||||||||||||||||||||||||||||||
| GBNY |
Generations Bancorp NY, Inc. | NY | $ | 9.74 | $ | 23.94 | NA | NA | NM | NA | NA | NA | NM | NA | NA | NA | NA | NA | NA | NA | NA | NA | NA | NA | ||||||||||||||||||||||||||||||||||||||||||||||||||||||||||||||
| HVBC |
HV Bancorp, Inc. | PA | $ | 16.81 | $ | 33.81 | $ | 1.87 | $ | 16.75 | 8.76x | 100.35 | % | 7.36 | % | 100.35 | % | 9.01x | NA | NA | NA | $ | 508 | 7.33 | % | 7.33 | % | 0.49 | % | 1.02 | % | 11.87 | % | 0.99 | % | 11.54 | % | |||||||||||||||||||||||||||||||||||||||||||||||||
| KRNY |
Kearny Financial Corp. | NJ | $ | 10.65 | $ | 922.29 | $ | 0.58 | $ | 12.56 | 17.46x | 82.81 | % | 12.33 | % | 104.93 | % | 16.59x | $ | 0.32 | 3.00 | % | 52.46 | % | $ | 7,310 | 15.38 | % | 12.81 | % | 0.72 | % | 0.66 | % | 4.11 | % | 0.70 | % | 4.40 | % | ||||||||||||||||||||||||||||||||||||||||||||||
| NYCB |
New York Community Bancorp, Inc. | NY | $ | 10.41 | $ | 4,829.22 | $ | 0.83 | $ | 13.43 | 10.21x | 76.18 | % | 8.65 | % | 123.43 | % | 10.30x | $ | 0.68 | 6.53 | % | 66.67 | % | $ | 54,932 | 12.26 | % | 8.21 | % | 0.13 | % | 0.79 | % | 6.32 | % | 0.78 | % | 6.25 | % | ||||||||||||||||||||||||||||||||||||||||||||||
| NFBK |
Northfield Bancorp, Inc. | NJ | $ | 13.22 | $ | 690.21 | $ | 0.78 | $ | 14.26 | 17.39x | 91.54 | % | 12.52 | % | 96.94 | % | 15.30x | $ | 0.44 | 3.33 | % | 57.89 | % | $ | 5,589 | 13.55 | % | 12.89 | % | 0.39 | % | 0.67 | % | 4.78 | % | 0.73 | % | 5.26 | % | ||||||||||||||||||||||||||||||||||||||||||||||
| NWBI |
Northwest Bancshares, Inc. | PA | $ | 13.17 | $ | 1,672.85 | $ | 0.70 | $ | 12.11 | 21.24x | 108.72 | % | 12.12 | % | 147.19 | % | 16.48x | $ | 0.76 | 5.77 | % | 122.58 | % | $ | 13,789 | 11.22 | % | 8.52 | % | 0.92 | % | 0.54 | % | 4.53 | % | 0.68 | % | 5.70 | % | ||||||||||||||||||||||||||||||||||||||||||||||
| PCSB |
PCSB Financial Corporation | NY | $ | 15.75 | $ | 241.41 | $ | 0.59 | $ | 16.45 | 25.00x | 94.14 | % | 14.17 | % | 96.39 | % | 24.90x | $ | 0.16 | 1.02 | % | 25.40 | % | $ | 1,791 | 15.28 | % | 14.98 | % | NA | 0.54 | % | 3.34 | % | 0.54 | % | 3.36 | % | |||||||||||||||||||||||||||||||||||||||||||||||
| PFS |
Provident Financial Services, Inc. | NJ | $ | 18.99 | $ | 1,446.18 | $ | 1.32 | $ | 20.41 | 13.66x | 90.99 | % | 11.41 | % | 127.76 | % | 13.22x | $ | 0.92 | 4.84 | % | 66.19 | % | $ | 12,871 | 12.44 | % | 9.30 | % | 0.71 | % | 0.78 | % | 5.70 | % | 0.84 | % | 6.15 | % | ||||||||||||||||||||||||||||||||||||||||||||||
| PBIP |
Prudential Bancorp, Inc. | PA | $ | 12.69 | $ | 101.48 | $ | 0.58 | $ | 15.86 | 11.97x | 77.32 | % | 8.50 | % | 81.30 | % | NM | $ | 0.28 | 2.21 | % | 66.98 | % | $ | 1,223 | 10.55 | % | 10.08 | % | 1.10 | % | 0.76 | % | 6.88 | % | 0.39 | % | 3.56 | % | ||||||||||||||||||||||||||||||||||||||||||||||
| SVBI |
Severn Bancorp, Inc. | MD | $ | 7.80 | $ | 99.98 | $ | 0.42 | $ | 8.45 | 15.00x | 91.15 | % | 10.49 | % | 92.08 | % | 14.87x | $ | 0.16 | 2.05 | % | 30.77 | % | $ | 939 | 11.53 | % | 11.43 | % | 1.57 | % | 0.63 | % | 5.06 | % | 0.64 | % | 5.11 | % | ||||||||||||||||||||||||||||||||||||||||||||||
| TRST |
TrustCo Bank Corp NY | NY | $ | 6.51 | $ | 627.78 | $ | 0.53 | $ | 5.81 | 11.99x | 110.49 | % | 10.64 | % | 110.60 | % | 12.20x | $ | 0.27 | 4.19 | % | 50.19 | % | $ | 5,736 | 9.77 | % | 9.76 | % | 0.59 | % | 0.97 | % | 9.64 | % | 0.95 | % | 9.47 | % | ||||||||||||||||||||||||||||||||||||||||||||||
| WSFS |
WSFS Financial Corporation | DE | $ | 45.26 | $ | 2,161.44 | $ | 2.02 | $ | 36.77 | 19.94x | 120.63 | % | 15.08 | % | 175.11 | % | 22.48x | $ | 0.48 | 1.06 | % | 21.15 | % | $ | 13,830 | 13.46 | % | 9.83 | % | 0.33 | % | 0.78 | % | 5.38 | % | 0.80 | % | 5.55 | % | ||||||||||||||||||||||||||||||||||||||||||||||
| WVFC |
WVS Financial Corp. | PA | $ | 15.15 | $ | 26.33 | $ | 1.22 | $ | 19.94 | 15.30x | 75.00 | % | 9.08 | % | 75.00 | % | 15.10x | $ | 0.40 | 2.64 | % | 40.40 | % | $ | 332 | 11.42 | % | 11.42 | % | 0.00 | % | 0.59 | % | 5.88 | % | 0.60 | % | 5.96 | % | ||||||||||||||||||||||||||||||||||||||||||||||
| HONE |
HarborOne Bancorp, Inc. | MA | $ | 11.32 | $ | 616.39 | $ | 0.61 | $ | 11.90 | 13.80x | 93.00 | % | 14.44 | % | 104.09 | % | 13.43x | $ | 0.12 | 1.06 | % | 10.98 | % | $ | 4,428 | 15.67 | % | 14.23 | % | 1.22 | % | 0.76 | % | 4.66 | % | 0.80 | % | 4.91 | % | ||||||||||||||||||||||||||||||||||||||||||||||
| HIFS |
Hingham Institution for Savings | MA | $ | 236.30 | $ | 504.95 | $ | 18.50 | $ | 130.24 | 10.16x | 172.45 | % | 17.68 | % | 172.45 | % | 11.64x | $ | 1.88 | 0.80 | % | 10.62 | % | $ | 2,719 | 10.24 | % | 10.24 | % | 0.27 | % | 1.71 | % | 17.54 | % | 1.53 | % | 15.71 | % | ||||||||||||||||||||||||||||||||||||||||||||||
| EBSB |
Meridian Bancorp, Inc. | MA | $ | 15.91 | $ | 799.05 | $ | 1.21 | $ | 14.28 | 12.33x | 108.46 | % | 12.60 | % | 111.66 | % | 13.05x | $ | 0.32 | 2.01 | % | 24.81 | % | $ | 6,567 | 11.39 | % | 11.09 | % | 0.08 | % | 1.00 | % | 8.73 | % | 0.97 | % | 8.46 | % | ||||||||||||||||||||||||||||||||||||||||||||||
| PVBC |
Provident Bancorp, Inc. | MA | $ | 12.10 | $ | 219.00 | $ | 0.66 | $ | 12.30 | 18.33x | 97.72 | % | 15.31 | % | 97.72 | % | 16.00x | $ | 0.12 | 0.99 | % | 18.18 | % | $ | 1,498 | 15.98 | % | 15.98 | % | NA | 0.81 | % | 4.57 | % | 0.93 | % | 5.21 | % | |||||||||||||||||||||||||||||||||||||||||||||||
| RNDB |
Randolph Bancorp, Inc. | MA | $ | 20.00 | $ | 102.86 | $ | 3.28 | $ | 17.19 | 6.60x | 116.38 | % | 15.28 | % | NA | 6.11x | NA | NA | NA | $ | 723 | 13.13 | % | NA | 1.57 | % | 2.30 | % | 18.55 | % | 2.49 | % | 20.05 | % | |||||||||||||||||||||||||||||||||||||||||||||||||||
| WNEB |
Western New England Bancorp, Inc. | MA | $ | 7.23 | $ | 165.39 | $ | 0.40 | $ | 8.99 | 16.07x | 80.63 | % | 7.72 | % | 86.52 | % | 15.23x | $ | 0.20 | 2.77 | % | 44.44 | % | $ | 2,487 | 9.26 | % | 8.69 | % | NA | 0.42 | % | 4.16 | % | 0.45 | % | 4.45 | % | |||||||||||||||||||||||||||||||||||||||||||||||
| MHCs |
||||||||||||||||||||||||||||||||||||||||||||||||||||||||||||||||||||||||||||||||||||||
| BSBK |
Bogota Financial Corp. (MHC) | NJ | $ | 9.12 | $ | 120.00 | NA | $ | 9.68 | NM | 93.41 | % | 16.20 | % | 93.41 | % | 27.98x | NA | NA | NA | $ | 754 | 16.91 | % | 16.91 | % | NA | 0.25 | % | 1.63 | % | 0.50 | % | 3.27 | % | |||||||||||||||||||||||||||||||||||||||||||||||||||
| CLBK |
Columbia Financial, Inc. (MHC) | NJ | $ | 15.80 | $ | 1,752.85 | $ | 0.51 | $ | 8.89 | 30.38x | 173.33 | % | 19.92 | % | 189.54 | % | 27.57x | NA | NA | NA | $ | 8,865 | 11.48 | % | 10.55 | % | NA | 0.60 | % | 4.98 | % | 0.66 | % | 5.55 | % | ||||||||||||||||||||||||||||||||||||||||||||||||||
| GCBC |
Greene County Bancorp, Inc. (MHC) | NY | $ | 24.70 | $ | 210.28 | $ | 2.19 | $ | 15.62 | 10.65x | 151.57 | % | 11.28 | % | 151.57 | % | NM | $ | 0.48 | 1.94 | % | 20.26 | % | $ | 1,799 | 7.39 | % | 7.39 | % | 0.29 | % | 1.19 | % | 15.05 | % | 1.19 | % | 15.05 | % | ||||||||||||||||||||||||||||||||||||||||||||||
| LSBK |
Lake Shore Bancorp, Inc. (MHC) | NY | $ | 13.44 | $ | 76.62 | $ | 0.76 | $ | 14.55 | 17.45x | 91.09 | % | 11.41 | % | 91.09 | % | 17.62x | $ | 0.52 | 3.87 | % | 48.05 | % | $ | 683 | 12.43 | % | 12.43 | % | 0.56 | % | 0.70 | % | 5.34 | % | 0.70 | % | 5.31 | % | ||||||||||||||||||||||||||||||||||||||||||||||
| MGYR |
Magyar Bancorp, Inc. (MHC) | NJ | $ | 10.61 | $ | 61.62 | $ | 0.37 | $ | 9.78 | 20.79x | 105.88 | % | 8.31 | % | 105.88 | % | 21.16x | NA | NA | NA | $ | 754 | 7.54 | % | 7.54 | % | 2.03 | % | 0.32 | % | 3.85 | % | 0.31 | % | 3.75 | % | |||||||||||||||||||||||||||||||||||||||||||||||||
| PDLB |
PDL Community Bancorp (MHC) | NY | $ | 9.72 | $ | 161.09 | ($ | 0.01 | ) | $ | 9.25 | NM | 105.05 | % | 13.02 | % | 105.05 | % | NM | NA | NA | NA | $ | 1,277 | 12.40 | % | 12.40 | % | 1.38 | % | -0.46 | % | -3.28 | % | -0.02 | % | -0.15 | % | ||||||||||||||||||||||||||||||||||||||||||||||||
| PBFS |
Pioneer Bancorp, Inc. (MHC) | NY | $ | 10.91 | $ | 273.28 | $ | 0.27 | $ | 8.68 | NM | 125.74 | % | 17.40 | % | 131.19 | % | NM | NA | NA | NA | $ | 1,629 | 13.84 | % | 13.34 | % | 1.01 | % | 0.51 | % | 3.35 | % | 0.48 | % | 3.11 | % | |||||||||||||||||||||||||||||||||||||||||||||||||
| RBKB |
Rhinebeck Bancorp, Inc. (MHC) | NY | $ | 9.21 | $ | 98.87 | $ | 0.50 | $ | 10.35 | 16.75x | 88.02 | % | 9.08 | % | 89.25 | % | 16.62x | NA | NA | NA | $ | 1,113 | 10.35 | % | 10.22 | % | 0.63 | % | 0.51 | % | 4.72 | % | 0.51 | % | 4.78 | % | |||||||||||||||||||||||||||||||||||||||||||||||||
| FSEA |
First Seacoast Bancorp (MHC) | NH | $ | 8.73 | $ | 51.21 | $ | 0.18 | $ | 9.66 | NM | 90.40 | % | 11.13 | % | 90.40 | % | NM | NA | NA | NA | $ | 477 | 12.31 | % | 12.31 | % | 0.19 | % | 0.30 | % | 2.29 | % | 0.25 | % | 1.88 | % | |||||||||||||||||||||||||||||||||||||||||||||||||
| (1) | Core income, on a diluted per-share basis. Core income is net income after taxes and before extraordinary items, less net income attributable to noncontrolling interest, gain on the sale of securities, amortization of intangibles, goodwill and nonrecurring items. Assumed tax rate is 35%. |
| (2) | P/E = Price to earnings; P/B = Price to book; P/A = Price to assets; P/TB = Price to tangible book value; and P/Core = Price to core earnings. P/E and P/Core =NM if the ratio is negative or above 35x. |
| (3) | Indicated 12 month dividend, based on last quarterly dividend declared. |
| (4) | Indicated 12 month dividend as a percent of trailing 12 month earnings. |
| (5) | Equity and tangible equity equal common equity and tangible common equity, respectively. ROAA (return on average assets) and ROAE (return on average equity) are indicated ratios based on trailing 12 month earnings and average equity and assets balances. |
| (6) | Excludes from averages and medians those companies the subject of actual or rumored acquisition activities or unusual operating characteristics. |
Source: SNL Financial, LC. and RP Financial, LC. calculations. The information provided in this report has been obtained from sources we believe are reliable, but we cannot guarantee the accuracy or completeness of such information.
Copyright (c) 2021 by RP® Financial, LC.
EXHIBIT III-3
Public Market Pricing of Midwest Thrift Institutions
Exhibit III-3
Public Market Pricing of Midwest Institutions
As of February 5, 2021
| Market | Per Share Data | |||||||||||||||||||||||||||||||||||||||||||||||||||||||||||||||||||||||||||||||||||
| Capitalization | Core | Book | Dividends(3) | Financial Characteristics(5) | ||||||||||||||||||||||||||||||||||||||||||||||||||||||||||||||||||||||||||||||||
| Price/ | Market | 12 Month | Value/ | Pricing Ratios(2) | Amount/ | Payout | Total | Equity/ | Tang. Eq./ | NPAs/ | Reported | Core | ||||||||||||||||||||||||||||||||||||||||||||||||||||||||||||||||||||||||
| Share | Value | EPS(1) | Share | P/E | P/B | P/A | P/TB | P/Core | Share | Yield | Ratio (4) | Assets | Assets | T. Assets | Assets | ROAA | ROAE | ROAA | ROAE | |||||||||||||||||||||||||||||||||||||||||||||||||||||||||||||||||
| ($) | ($Mil) | ($) | ($) | (x) | (%) | (%) | (%) | (x) | ($) | (%) | (%) | ($Mil) | (%) | (%) | (%) | (%) | (%) | (%) | (%) | |||||||||||||||||||||||||||||||||||||||||||||||||||||||||||||||||
| All Non-MHC Public Companies(6) |
||||||||||||||||||||||||||||||||||||||||||||||||||||||||||||||||||||||||||||||||||||
| Averages |
$ | 23.33 | $ | 601.07 | $ | 1.85 | $ | 19.90 | 13.96 | 103.6 | % | 12.9 | % | 114.7 | % | 13.98 | $ | 0.43 | 2.36 | % | 47 | % | $ | 5,167 | 12.62 | % | 11.78 | % | 0.69 | % | 0.84 | % | 6.91 | % | 0.87 | % | 7.23 | % | ||||||||||||||||||||||||||||||||||||||||||||||
| Median |
$ | 15.28 | $ | 192.19 | $ | 0.87 | $ | 15.86 | 12.66 | 94.1 | % | 11.6 | % | 100.8 | % | 13.14 | $ | 0.32 | 2.21 | % | 36 | % | $ | 1,791 | 11.51 | % | 10.33 | % | 0.55 | % | 0.76 | % | 5.88 | % | 0.78 | % | 6.15 | % | ||||||||||||||||||||||||||||||||||||||||||||||
| Comparable Group |
||||||||||||||||||||||||||||||||||||||||||||||||||||||||||||||||||||||||||||||||||||
| Averages |
$ | 17.79 | $ | 567.60 | $ | 1.85 | $ | 17.63 | 13.39x | 99.11 | % | 16.68 | % | 100.90 | % | 14.56x | $ | 0.25 | 1.36 | % | 38.47 | % | $ | 5,276 | 16.18 | % | 16.08 | % | 0.75 | % | 0.96 | % | 7.17 | % | 1.01 | % | 7.94 | % | ||||||||||||||||||||||||||||||||||||||||||||||
| Medians |
$ | 16.24 | $ | 90.61 | $ | 0.97 | $ | 15.20 | 10.57x | 89.56 | % | 16.81 | % | 89.97 | % | 12.68x | $ | 0.20 | 0.74 | % | 24.32 | % | $ | 898 | 13.54 | % | 13.41 | % | 0.54 | % | 0.69 | % | 5.57 | % | 0.74 | % | 5.64 | % | ||||||||||||||||||||||||||||||||||||||||||||||
| Comparable Group |
||||||||||||||||||||||||||||||||||||||||||||||||||||||||||||||||||||||||||||||||||||
| CFFN |
Capitol Federal Financial, Inc. | KS | $ | 12.65 | $ | 1,710.52 | $ | 0.48 | $ | 9.25 | 28.75x | 137.54 | % | 18.28 | % | 138.41 | % | 28.22x | $ | 0.34 | 2.69 | % | 106.82 | % | $ | 9,487 | 13.54 | % | 13.41 | % | 0.27 | % | 0.69 | % | 4.92 | % | 0.70 | % | 5.04 | % | ||||||||||||||||||||||||||||||||||||||||||||
| CNNB |
Cincinnati Bancorp, Inc. | OH | $ | 11.96 | $ | 35.59 | $ | 0.61 | $ | 13.35 | 19.93x | 89.56 | % | 15.34 | % | 89.97 | % | 19.71x | NA | NA | NA | $ | 232 | 17.13 | % | 17.07 | % | 0.54 | % | 0.77 | % | 6.10 | % | 0.78 | % | 6.17 | % | |||||||||||||||||||||||||||||||||||||||||||||||
| FFBW |
FFBW, Inc. | WI | $ | 10.42 | $ | 74.11 | NA | $ | 13.32 | NM | 78.24 | % | 28.10 | % | 78.28 | % | NM | NA | NA | NA | $ | 286 | 35.92 | % | 35.90 | % | 0.63 | % | 0.63 | % | 2.41 | % | NA | NA | ||||||||||||||||||||||||||||||||||||||||||||||||||
| FBC |
Flagstar Bancorp, Inc. | MI | $ | 45.06 | $ | 2,372.68 | $ | 7.90 | $ | 38.41 | 4.73x | 117.33 | % | NA | 126.55 | % | 4.64x | $ | 0.20 | 0.44 | % | 1.58 | % | $ | 29,476 | 7.45 | % | 6.94 | % | 0.33 | % | 1.75 | % | 22.74 | % | 1.79 | % | 23.96 | % | |||||||||||||||||||||||||||||||||||||||||||||
| HMNF |
HMN Financial, Inc. | MN | $ | 19.00 | $ | 90.61 | $ | 1.84 | $ | 20.91 | 8.56x | 87.76 | % | 9.96 | % | 88.50 | % | NM | $ | 0.00 | 0.00 | % | NA | $ | 898 | 11.26 | % | 11.17 | % | 0.38 | % | 1.03 | % | 8.83 | % | 1.04 | % | 8.95 | % | |||||||||||||||||||||||||||||||||||||||||||||
| IROQ |
IF Bancorp, Inc. | IL | $ | 20.50 | $ | 66.43 | $ | 1.34 | $ | 25.78 | 12.58x | 78.23 | % | 9.31 | % | 78.23 | % | NM | $ | 0.30 | 1.46 | % | 18.40 | % | $ | 726 | 11.51 | % | 11.51 | % | 0.24 | % | 0.64 | % | 5.57 | % | 0.59 | % | 5.10 | % | ||||||||||||||||||||||||||||||||||||||||||||
| MSVB |
Mid-Southern Bancorp, Inc. | IN | $ | 16.24 | $ | 48.50 | $ | 0.35 | $ | 15.20 | NM | 106.86 | % | 23.91 | % | 106.86 | % | NM | $ | 0.12 | 0.74 | % | 24.32 | % | $ | 218 | 22.38 | % | 22.38 | % | 1.19 | % | 0.56 | % | 2.36 | % | 0.52 | % | 2.20 | % | ||||||||||||||||||||||||||||||||||||||||||||
| SBT |
Sterling Bancorp, Inc. | MI | $ | 5.11 | $ | 255.41 | ($ | 0.30 | ) | $ | 6.63 | NM | 79.92 | % | 6.53 | % | 79.92 | % | NM | $ | 0.00 | 0.00 | % | NA | $ | 3,937 | 8.41 | % | 8.41 | % | 2.50 | % | -0.43 | % | -4.39 | % | -0.43 | % | -4.43 | % | ||||||||||||||||||||||||||||||||||||||||||||
| WSBF |
Waterstone Financial, Inc. | WI | $ | 19.19 | $ | 454.54 | $ | 2.60 | $ | 15.84 | 5.82x | 116.54 | % | 22.04 | % | 121.36 | % | 5.66x | $ | 0.80 | 4.17 | % | 41.21 | % | $ | 2,221 | 17.99 | % | 17.96 | % | 0.70 | % | 2.97 | % | 15.96 | % | 3.07 | % | 16.53 | % | ||||||||||||||||||||||||||||||||||||||||||||
| MHCs |
||||||||||||||||||||||||||||||||||||||||||||||||||||||||||||||||||||||||||||||||||||
| BCOW |
1895 Bancorp Of Wisconsin, Inc. (MHC) | WI | $ | 9.85 | $ | 45.20 | $ | 0.12 | $ | 12.50 | 32.83x | 78.78 | % | 9.31 | % | 78.78 | % | NM | NA | NA | NA | $ | 505 | 11.81 | % | 11.81 | % | 0.37 | % | 0.30 | % | 2.52 | % | 0.13 | % | 1.05 | % | |||||||||||||||||||||||||||||||||||||||||||||||
| KFFB |
Kentucky First Federal Bancorp (MHC) | KY | $ | 6.46 | $ | 53.05 | ($ | 0.21 | ) | $ | 6.29 | NM | 102.66 | % | 16.09 | % | 104.57 | % | NM | $ | 0.40 | 6.19 | % | NA | $ | 328 | 15.82 | % | 15.57 | % | NA | -3.81 | % | -20.62 | % | -0.54 | % | -2.94 | % | |||||||||||||||||||||||||||||||||||||||||||||
| TFSL |
TFS Financial Corporation (MHC) | OH | $ | 17.53 | $ | 4,848.02 | NA | $ | 5.97 | NM | 296.67 | % | 33.75 | % | 298.42 | % | NM | $ | 1.12 | 6.39 | % | 373.33 | % | $ | 14,642 | 11.42 | % | 11.36 | % | 1.04 | % | 0.56 | % | 4.88 | % | NA | NA | |||||||||||||||||||||||||||||||||||||||||||||||
| (1) | Core income, on a diluted per-share basis. Core income is net income after taxes and before extraordinary items, less net income attributable to noncontrolling interest, gain on the sale of securities, amortization of intangibles, goodwill and nonrecurring items. Assumed tax rate is 35%. |
| (2) | P/E = Price to earnings; P/B = Price to book; P/A = Price to assets; P/TB = Price to tangible book value; and P/Core = Price to core earnings. P/E and P/Core =NM if the ratio is negative or above 35x. |
| (3) | Indicated 12 month dividend, based on last quarterly dividend declared. |
| (4) | Indicated 12 month dividend as a percent of trailing 12 month earnings. |
| (5) | Equity and tangible equity equal common equity and tangible common equity, respectively. ROAA (return on average assets) and ROAE (return on average equity) are indicated ratios based on trailing 12 month earnings and average equity and assets balances. |
| (6) | Excludes from averages and medians those companies the subject of actual or rumored acquisition activities or unusual operating characteristics. |
Source: SNL Financial, LC. and RP Financial, LC. calculations. The information provided in this report has been obtained from sources we believe are reliable, but we cannot guarantee the accuracy or completeness of such information.
Copyright (c) 2021 by RP® Financial, LC.
EXHIBIT III-4
Peer Group Market Area Comparative Analysis
Exhibit III-4
Peer Group Market Area Comparative Analysis
| Proj. | Per Capita Income | Deposit | ||||||||||||||||||||||||||||||||
| Population | Pop. | 2016-2021 | 2021-2026 | 2021 | % State | Market | ||||||||||||||||||||||||||||
| Institution |
County |
2016 | 2021 | 2026 | % Change | % Change | Amount | Average | Share (1) | |||||||||||||||||||||||||
| ESSA Bancorp, Inc. |
Monroe, PA | 164,857 | 171,166 | 172,658 | 0.8 | % | 0.2 | % | 32,216 | 87.3 | % | 28.72 | % | |||||||||||||||||||||
| Hingham Institution for Savings |
Plymouth, MA | 511,963 | 525,369 | 539,355 | 0.5 | % | 0.5 | % | 49,722 | 118.0 | % | 10.91 | % | |||||||||||||||||||||
| HMN Financial, Inc. |
Olmsted, MN | 152,655 | 160,589 | 167,296 | 1.0 | % | 0.8 | % | 43,936 | 107.2 | % | 6.04 | % | |||||||||||||||||||||
| IF Bancorp, Inc. |
Iroquois, IL | 28,599 | 26,613 | 25,608 | -1.4 | % | -0.8 | % | 28,928 | 101.3 | % | 22.22 | % | |||||||||||||||||||||
| PCSB Financial Corporation |
Westchester, NY | 979,959 | 967,400 | 970,003 | -0.3 | % | 0.1 | % | 60,382 | 163.7 | % | 0.41 | % | |||||||||||||||||||||
| Provident Bancorp, Inc. |
Essex, MA | 777,791 | 793,814 | 813,863 | 0.4 | % | 0.5 | % | 48,443 | 128.3 | % | 2.29 | % | |||||||||||||||||||||
| Prudential Bancorp, Inc. |
Philadelphia, PA | 1,569,473 | 1,588,749 | 1,606,225 | 0.2 | % | 0.2 | % | 30,040 | 61.3 | % | 1.02 | % | |||||||||||||||||||||
| Severn Bancorp, Inc. |
Anne Arundel, MD | 567,226 | 585,055 | 603,525 | 0.6 | % | 0.6 | % | 53,217 | 116.8 | % | 4.87 | % | |||||||||||||||||||||
| Waterstone Financial, Inc. |
Milwaukee, WI | 958,242 | 942,546 | 941,193 | -0.3 | % | 0.0 | % | 30,901 | 83.8 | % | 1.41 | % | |||||||||||||||||||||
| Western New England Bancorp, Inc. |
Hampden, MA | 469,440 | 465,407 | 468,105 | -0.2 | % | 0.1 | % | 32,565 | 88.3 | % | 13.11 | % | |||||||||||||||||||||
| Averages: | 618,021 | 622,671 | 630,783 | 0.1 | % | 0.2 | % | 41,035 | 105.6 | % | 9.10 | % | ||||||||||||||||||||||
| Medians: | 539,595 | 555,212 | 571,440 | 0.3 | % | 0.2 | % | 38,251 | 104.2 | % | 5.46 | % | ||||||||||||||||||||||
| Blue Foundry Bancorp |
Bergen, NJ | 943,331 | 934,026 | 942,245 | -0.2 | % | 0.2 | % | 57,183 | 155.0 | % | 1.62 | % | |||||||||||||||||||||
| (1) | Total institution deposits in headquarters county as percent of total county deposits as of June 30, 2020. |
Sources: S&P Global Market Intelligence and FDIC.
EXHIBIT IV-1
Stock Prices:
As of February 5, 2021
| RP® Financial, LC. |
Exhibit IV-1A
Weekly Thrift Market Line - Part One
Prices As of February 5, 2021
| Market Capitalization | Price Change Data | Current Per Share Financials | ||||||||||||||||||||||||||||||||||||||||||||||||||||||||||||||
| Price/ | Shares | Market | 52 Week (1) | % Change From | LTM | LTM Core | BV/ | TBV/ | Assets/ | Assets | ||||||||||||||||||||||||||||||||||||||||||||||||||||||
| Share (1) | Outstanding | Capitalization | High | Low | Last Wk | Last Wk | 52 Wks (2) | MRY (2) | EPS (3) | EPS (3) | Share | Share (4) | Share | |||||||||||||||||||||||||||||||||||||||||||||||||||
| ($) | (000) | ($Mil) | ($) | ($) | ($) | (%) | (%) | (%) | ($) | ($) | ($) | ($) | ($) | |||||||||||||||||||||||||||||||||||||||||||||||||||
| Companies |
||||||||||||||||||||||||||||||||||||||||||||||||||||||||||||||||
| AFBI |
Affinity Bancshares, Inc. | SE | 10.75 | 6,876 | 73.9 | 11.80 | 5.36 | 10.67 | 0.75 | -8.46 | 8.60 | 0.26 | 0.56 | 10.46 | 7.95 | 129.18 | 888,170 | |||||||||||||||||||||||||||||||||||||||||||||||
| AX |
Axos Financial, Inc. | WE | 43.95 | 59,077 | 2,595.0 | 44.05 | 13.69 | 38.95 | 12.84 | 53.40 | 17.11 | 3.45 | 3.71 | 21.79 | 19.75 | 243.64 | 14,393,267 | |||||||||||||||||||||||||||||||||||||||||||||||
| BYFC |
Broadway Financial Corporation | WE | 2.21 | 27,466 | 60.7 | 7.23 | 1.04 | 2.03 | 8.87 | 47.33 | 19.46 | 0.00 | NA | 1.76 | 1.76 | 18.18 | 499,217 | |||||||||||||||||||||||||||||||||||||||||||||||
| CFFN |
Capitol Federal Financial, Inc. | MW | 12.65 | 135,324 | 1,710.5 | 13.50 | 8.75 | 12.42 | 1.85 | -5.10 | 1.20 | 0.44 | 0.45 | 9.20 | NA | 70.99 | 9,606,964 | |||||||||||||||||||||||||||||||||||||||||||||||
| CARV |
Carver Bancorp, Inc. | MA | 8.90 | 3,063 | 27.3 | 22.97 | 1.25 | 8.19 | 8.67 | 256.00 | 37.13 | -1.31 | -1.44 | 9.91 | 9.91 | 219.62 | 672,653 | |||||||||||||||||||||||||||||||||||||||||||||||
| CBMB |
CBM Bancorp, Inc. | MA | 13.95 | 3,442 | 48.0 | 15.05 | 10.61 | 13.95 | 0.00 | -2.52 | 5.05 | 0.20 | 0.17 | 14.34 | 14.34 | 67.45 | 232,186 | |||||||||||||||||||||||||||||||||||||||||||||||
| CNNB |
Cincinnati Bancorp, Inc. | MW | 11.96 | 2,976 | 35.6 | 12.00 | 6.33 | 11.75 | 1.79 | 11.88 | 0.08 | 0.60 | 0.61 | 13.35 | 13.29 | 77.95 | 231,943 | |||||||||||||||||||||||||||||||||||||||||||||||
| ESBK |
Elmira Savings Bank | MA | 12.24 | 3,523 | 43.1 | 16.57 | 10.30 | 12.21 | 0.25 | -26.27 | 6.43 | 1.19 | 1.19 | 17.23 | 13.74 | 0.00 | 644,587 | |||||||||||||||||||||||||||||||||||||||||||||||
| ESSA |
ESSA Bancorp, Inc. | MA | 15.59 | 10,085 | 157.2 | 17.58 | 9.70 | 14.28 | 9.17 | -10.20 | 3.93 | 1.46 | 1.46 | 17.94 | 16.60 | 0.00 | 1,868,818 | |||||||||||||||||||||||||||||||||||||||||||||||
| FFBW |
FFBW, Inc. | MW | 10.42 | 7,112 | 74.1 | 10.76 | 6.74 | 10.28 | 1.36 | -3.07 | 3.99 | 0.26 | NA | 13.32 | 13.31 | 0.00 | 285,787 | |||||||||||||||||||||||||||||||||||||||||||||||
| FNWB |
First Northwest Bancorp | WE | 15.71 | 9,480 | 148.9 | 17.85 | 8.77 | 13.70 | 14.67 | -6.77 | 0.71 | 1.10 | 0.84 | 18.19 | 18.19 | 0.00 | 1,654,349 | |||||||||||||||||||||||||||||||||||||||||||||||
| FBC |
Flagstar Bancorp, Inc. | MW | 45.06 | 52,656 | 2,372.7 | 47.92 | 16.76 | 42.85 | 5.16 | 23.28 | 10.55 | 9.52 | 9.70 | NA | NA | 0.00 | 31,038,000 | |||||||||||||||||||||||||||||||||||||||||||||||
| FSBW |
FS Bancorp, Inc. | WE | 58.85 | 4,157 | 252.6 | 60.65 | 27.50 | 53.62 | 9.75 | 8.56 | 7.39 | 8.97 | 8.77 | 54.27 | 52.61 | 0.00 | 2,113,241 | |||||||||||||||||||||||||||||||||||||||||||||||
| GBNY |
Generations Bancorp NY, Inc. | MA | 9.74 | 2,458 | 23.9 | 11.75 | 5.85 | 9.83 | -0.91 | -5.98 | -6.53 | NA | NA | NA | NA | 0.00 | 371,789 | |||||||||||||||||||||||||||||||||||||||||||||||
| HONE |
HarborOne Bancorp, Inc. | NE | 11.32 | 54,451 | 616.4 | 11.65 | 6.45 | 10.86 | 4.24 | 2.44 | 4.24 | 0.82 | 0.84 | 12.17 | 10.88 | 0.00 | 4,483,615 | |||||||||||||||||||||||||||||||||||||||||||||||
| HIFS |
Hingham Institution for Savings | NE | 236.30 | 2,137 | 504.9 | 238.99 | 125.55 | 219.26 | 7.77 | 15.29 | 9.40 | 23.25 | 20.31 | 137.02 | 137.02 | 0.00 | 2,857,093 | |||||||||||||||||||||||||||||||||||||||||||||||
| HMNF |
HMN Financial, Inc. | MW | 19.00 | 4,769 | 90.6 | 21.50 | 13.06 | 17.76 | 6.98 | -9.97 | 10.46 | 2.22 | NA | 21.65 | 21.47 | 0.00 | 909,580 | |||||||||||||||||||||||||||||||||||||||||||||||
| HFBL |
Home Federal Bancorp, Inc. of Louisiana | SW | 29.09 | 1,563 | 45.5 | 35.93 | 20.00 | 30.91 | -5.89 | -15.02 | 0.73 | 2.71 | NA | 30.46 | 30.46 | 0.00 | 535,394 | |||||||||||||||||||||||||||||||||||||||||||||||
| HVBC |
HV Bancorp, Inc. | MA | 16.81 | 2,012 | 33.8 | 17.48 | 9.75 | 16.40 | 2.50 | -1.98 | -2.10 | 1.92 | 1.87 | 16.75 | 16.75 | 0.00 | 507,739 | |||||||||||||||||||||||||||||||||||||||||||||||
| IROQ |
IF Bancorp, Inc. | MW | 20.50 | 3,240 | 66.4 | 23.00 | 15.03 | 19.82 | 3.41 | -10.87 | -6.95 | 1.63 | NA | 26.21 | 26.21 | 0.00 | 713,399 | |||||||||||||||||||||||||||||||||||||||||||||||
| KRNY |
Kearny Financial Corp. | MA | 10.65 | 86,600 | 922.3 | 12.26 | 6.91 | 10.35 | 2.90 | -12.27 | 0.85 | 0.61 | 0.64 | 12.86 | NA | 0.00 | 7,335,153 | |||||||||||||||||||||||||||||||||||||||||||||||
| EBSB |
Meridian Bancorp, Inc. | NE | 15.91 | 50,223 | 799.1 | 18.36 | 8.88 | 15.15 | 5.02 | -11.98 | 6.71 | 1.29 | 1.22 | 14.67 | 14.25 | 0.00 | 6,619,848 | |||||||||||||||||||||||||||||||||||||||||||||||
| MSVB |
Mid-Southern Bancorp, Inc. | MW | 16.24 | 2,986 | 48.5 | 16.59 | 9.71 | 15.13 | 7.34 | 20.30 | 12.70 | 0.37 | 0.35 | 15.20 | 15.20 | 0.00 | 218,281 | |||||||||||||||||||||||||||||||||||||||||||||||
| NYCB |
New York Community Bancorp, Inc. | MA | 10.41 | 463,902 | 4,829.2 | 11.88 | 7.72 | 10.46 | -0.48 | -8.76 | -1.33 | 1.02 | 1.01 | 13.66 | 8.43 | 0.00 | 56,306,120 | |||||||||||||||||||||||||||||||||||||||||||||||
| NFBK |
Northfield Bancorp, Inc. | MA | 13.22 | 52,210 | 690.2 | 16.33 | 8.72 | 12.36 | 6.96 | -18.55 | 7.22 | 0.76 | 0.86 | 14.44 | 13.64 | 0.00 | 5,514,544 | |||||||||||||||||||||||||||||||||||||||||||||||
| NWBI |
Northwest Bancshares, Inc. | MA | 13.17 | 127,019 | 1,672.8 | 15.99 | 8.52 | 12.75 | 3.29 | -16.27 | 3.38 | 0.62 | 0.80 | 12.11 | 8.95 | 0.00 | 13,806,268 | |||||||||||||||||||||||||||||||||||||||||||||||
| PCSB |
PCSB Financial Corporation | MA | 15.75 | 15,328 | 241.4 | 20.35 | 11.01 | 14.74 | 6.89 | -22.38 | -1.19 | 0.63 | 0.63 | 16.73 | 16.34 | 0.00 | 1,789,839 | |||||||||||||||||||||||||||||||||||||||||||||||
| PVBC |
Provident Bancorp, Inc. | NE | 12.10 | 18,099 | 219.0 | 12.50 | 7.21 | 11.53 | 4.94 | 1.00 | 0.83 | 0.66 | 0.76 | 12.38 | 12.38 | 0.00 | 1,505,781 | |||||||||||||||||||||||||||||||||||||||||||||||
| PROV |
Provident Financial Holdings, Inc. | WE | 15.40 | 7,442 | 114.6 | 22.46 | 11.40 | 16.05 | -4.05 | -30.88 | -1.97 | 0.72 | 0.72 | 16.79 | 16.79 | 0.00 | 1,170,727 | |||||||||||||||||||||||||||||||||||||||||||||||
| PFS |
Provident Financial Services, Inc. | MA | 18.99 | 76,155 | 1,446.2 | 23.56 | 9.05 | 18.52 | 2.54 | -19.09 | 5.73 | 1.39 | 1.44 | 20.87 | 14.86 | 0.00 | 12,919,741 | |||||||||||||||||||||||||||||||||||||||||||||||
| PBIP |
Prudential Bancorp, Inc. | MA | 12.69 | 7,997 | 101.5 | 18.36 | 9.53 | 11.81 | 7.45 | -28.91 | -8.38 | 1.06 | NA | 16.41 | 15.61 | 0.00 | 1,193,267 | |||||||||||||||||||||||||||||||||||||||||||||||
| RNDB |
Randolph Bancorp, Inc. | NE | 20.00 | 5,143 | 102.9 | 24.70 | 7.92 | 19.00 | 5.26 | 23.08 | -9.34 | 3.03 | 3.28 | 17.19 | NA | 0.00 | 722,968 | |||||||||||||||||||||||||||||||||||||||||||||||
| RVSB |
Riverview Bancorp, Inc. | WE | 5.62 | 22,345 | 125.6 | 7.35 | 3.77 | 5.21 | 7.87 | -22.38 | 6.84 | 0.44 | 0.45 | 6.80 | 5.56 | 0.00 | 1,436,184 | |||||||||||||||||||||||||||||||||||||||||||||||
| SVBI |
Severn Bancorp, Inc. | MA | 7.80 | 12,817 | 100.0 | 8.80 | 4.26 | 7.75 | 0.65 | -4.67 | 9.24 | 0.52 | 0.52 | 8.56 | 8.47 | 0.00 | 952,553 | |||||||||||||||||||||||||||||||||||||||||||||||
| STXB |
Spirit of Texas Bancshares, Inc. | SW | 19.37 | 17,082 | 330.9 | 21.59 | 8.96 | 17.94 | 7.97 | -7.05 | 15.30 | 1.78 | 1.99 | 21.12 | 15.94 | 0.00 | 3,085,464 | |||||||||||||||||||||||||||||||||||||||||||||||
| SBT |
Sterling Bancorp, Inc. | MW | 5.11 | 49,982 | 255.4 | 7.58 | 2.53 | 4.68 | 9.19 | -30.85 | 12.56 | -0.26 | NA | 6.39 | 6.39 | 0.00 | 3,914,045 | |||||||||||||||||||||||||||||||||||||||||||||||
| TBNK |
Territorial Bancorp Inc. | WE | 24.77 | 9,110 | 225.7 | 30.41 | 19.23 | 23.86 | 3.81 | -16.82 | 3.08 | 2.01 | 1.90 | 26.14 | 26.14 | 0.00 | 2,110,799 | |||||||||||||||||||||||||||||||||||||||||||||||
| TSBK |
Timberland Bancorp, Inc. | WE | 27.10 | 8,318 | 225.4 | 28.28 | 13.60 | 25.25 | 7.33 | -3.25 | 11.71 | 2.97 | 3.01 | 23.24 | 21.24 | 0.00 | 1,588,405 | |||||||||||||||||||||||||||||||||||||||||||||||
| TBK |
Triumph Bancorp, Inc. | SW | 64.06 | 24,660 | 1,579.7 | 65.63 | 19.03 | 57.34 | 11.72 | 49.25 | 31.95 | 2.53 | NA | 27.42 | 19.78 | 0.00 | 5,935,791 | |||||||||||||||||||||||||||||||||||||||||||||||
| TRST |
TrustCo Bank Corp NY | MA | 6.51 | 96,433 | 627.8 | 8.19 | 4.30 | 6.22 | 4.66 | -19.83 | -2.40 | 0.54 | 0.53 | 5.89 | 5.89 | 0.00 | 5,901,796 | |||||||||||||||||||||||||||||||||||||||||||||||
| WSBF |
Waterstone Financial, Inc. | MW | 19.19 | 23,686 | 454.5 | 19.98 | 12.10 | 18.47 | 3.90 | 7.03 | 1.97 | 3.30 | 3.39 | 16.47 | NA | 0.00 | 2,184,587 | |||||||||||||||||||||||||||||||||||||||||||||||
| WNEB |
Western New England Bancorp, Inc. | NE | 7.23 | 24,664 | 165.4 | 9.53 | 4.45 | 6.41 | 12.79 | -22.92 | 4.93 | 0.45 | 0.47 | 8.97 | 8.36 | 0.00 | 2,365,886 | |||||||||||||||||||||||||||||||||||||||||||||||
| WSFS |
WSFS Financial Corporation | MA | 45.26 | 47,756 | 2,161.4 | 47.78 | 17.84 | 42.97 | 5.33 | 8.54 | 0.85 | 2.27 | 2.01 | 37.52 | 25.85 | 0.00 | 14,333,914 | |||||||||||||||||||||||||||||||||||||||||||||||
| WVFC |
WVS Financial Corp. | MA | 15.15 | 1,742 | 26.3 | 16.89 | 13.00 | 14.70 | 3.06 | -9.85 | 5.75 | 0.99 | 1.00 | 20.20 | 20.20 | 0.00 | 317,444 | |||||||||||||||||||||||||||||||||||||||||||||||
| MHCs |
||||||||||||||||||||||||||||||||||||||||||||||||||||||||||||||||
| BCOW |
1895 Bancorp Of Wisconsin, Inc. (MHC) | MW | 9.85 | 4,589 | 45.2 | 12.01 | 7.43 | 9.46 | 4.12 | -17.02 | -1.10 | 0.30 | 0.12 | 12.50 | 12.50 | 0.00 | ||||||||||||||||||||||||||||||||||||||||||||||||
| BSBK |
Bogota Financial Corp. (MHC) | MA | 9.12 | 13,158 | 120.0 | 11.50 | 6.07 | 9.07 | 0.55 | -20.70 | 2.36 | 0.17 | 0.33 | 9.76 | 9.76 | 0.00 | ||||||||||||||||||||||||||||||||||||||||||||||||
| CLBK |
Columbia Financial, Inc. (MHC) | MA | 15.80 | 110,940 | 1,752.8 | 17.34 | 10.27 | 15.42 | 2.46 | -8.09 | 1.54 | 0.52 | 0.57 | 9.12 | 8.34 | 0.00 | ||||||||||||||||||||||||||||||||||||||||||||||||
| FSEA |
First Seacoast Bancorp (MHC) | NE | 8.73 | 5,866 | 51.2 | 9.80 | 5.07 | 8.67 | 0.69 | -9.06 | -1.68 | 0.22 | 0.18 | 9.66 | 9.66 | 0.00 | ||||||||||||||||||||||||||||||||||||||||||||||||
| GCBC |
Greene County Bancorp, Inc. (MHC) | MA | 24.70 | 8,513 | 210.3 | 30.25 | 15.01 | 23.72 | 4.13 | -16.13 | -3.10 | 2.32 | NA | 16.30 | 16.30 | 0.00 | ||||||||||||||||||||||||||||||||||||||||||||||||
| KFFB |
Kentucky First Federal Bancorp (MHC) | MW | 6.46 | 8,212 | 53.1 | 8.16 | 4.40 | 6.31 | 2.38 | -17.22 | 2.22 | -1.50 | NA | 6.29 | 6.18 | 0.00 | ||||||||||||||||||||||||||||||||||||||||||||||||
| LSBK |
Lake Shore Bancorp, Inc. (MHC) | MA | 13.44 | 5,701 | 76.6 | 15.90 | 8.95 | 13.01 | 3.31 | -13.35 | 3.38 | 0.77 | 0.76 | 14.75 | 14.75 | 0.00 | ||||||||||||||||||||||||||||||||||||||||||||||||
| MGYR |
Magyar Bancorp, Inc. (MHC) | MA | 10.61 | 5,811 | 61.6 | 14.30 | 7.50 | 11.00 | -3.59 | -14.20 | 10.01 | 0.51 | 0.50 | 10.02 | 10.02 | 0.00 | ||||||||||||||||||||||||||||||||||||||||||||||||
| OFED |
Oconee Federal Financial Corp. (MHC) | SE | 24.00 | 5,604 | 134.5 | 28.00 | 15.25 | 24.39 | -1.60 | -8.01 | -5.14 | 0.73 | 0.73 | 15.87 | 15.37 | 0.00 | ||||||||||||||||||||||||||||||||||||||||||||||||
| PDLB |
PDL Community Bancorp (MHC) | MA | 9.72 | 16,574 | 161.1 | 14.64 | 7.31 | 9.42 | 3.18 | -32.97 | -7.52 | -0.29 | -0.01 | 9.25 | 9.25 | 0.00 | ||||||||||||||||||||||||||||||||||||||||||||||||
| PBFS |
Pioneer Bancorp, Inc. (MHC) | MA | 10.91 | 25,048 | 273.3 | 15.28 | 8.02 | 10.45 | 4.40 | -28.22 | 3.22 | 0.30 | 0.27 | 8.68 | 8.32 | 0.00 | ||||||||||||||||||||||||||||||||||||||||||||||||
| RBKB |
Rhinebeck Bancorp, Inc. (MHC) | MA | 9.21 | 10,735 | 98.9 | 11.25 | 5.90 | 9.03 | 2.05 | -15.74 | 7.72 | 0.55 | 0.55 | 10.46 | 10.32 | 0.00 | ||||||||||||||||||||||||||||||||||||||||||||||||
| TFSL |
TFS Financial Corporation (MHC) | MW | 17.53 | 276,556 | 4,848.0 | 22.47 | 12.65 | 17.67 | -0.79 | -18.08 | -0.57 | 0.30 | NA | 5.91 | 5.87 | 0.00 | ||||||||||||||||||||||||||||||||||||||||||||||||
| (1) | Average of High/Low or Bid/Ask price per share. |
| (2) | Or since offering price if converted of first listed in the past 52 weeks. Percent change figures are actual year-to-date and are not annualized. |
| (3) | EPS (earnings per share) is based on actual trailing 12 month data and is not shown on a pro forma basis. |
| (4) | Excludes intangibles (such as goodwill, value of core deposits, etc.). |
| (5) | ROA (return on assets) and ROE (return on equity) are indicated ratios based on trailing 12 month common earnings and average common equity and total assets balances. |
| (6) | Annualized based on last regular quarterly cash dividend announcement. |
| (7) | Indicated dividend as a percent of trailing 12 month earnings. |
| (8) | Excluded from averages due to actual or rumored acquisition activities or unusual operating characteristics. |
| (9) | For MHC institutions, market value reflects share price multiplied by public (non-MHC) shares. |
Source: S&P Global Market Intelligence and RP® Financial, LC. calculations. The information provided in this table has been obtained from sources we believe are reliable, but we cannot guarantee the accuracy or completeness of such information.
Copyright (c) 2021 by RP® Financial, LC.
| RP® Financial, LC. |
Exhibit IV-1B
Weekly Thrift Market Line - Part Two
Prices As of February 5, 2021
| Key Financial Ratios | Asset Quality Ratios | Pricing Ratios | Dividend Data (6) | |||||||||||||||||||||||||||||||||||||||||||||||||||||||||||||||||
| Equity/ | Tang Equity/ | Reported Earnings | Core Earnings | NPAs/ | Rsvs/ | Price/ | Price/ | Price/ | Price/ | Price/ | Div/ | Dividend | Payout | |||||||||||||||||||||||||||||||||||||||||||||||||||||||
| Assets(1) | Assets(1) | ROA(5) | ROE(5) | ROA(5) | ROE(5) | Assets | NPLs | Earnings | Book | Assets | Tang Book | Core Earnings | Share | Yield | Ratio (7) | |||||||||||||||||||||||||||||||||||||||||||||||||||||
| (%) | (%) | (%) | (%) | (%) | (%) | (%) | (%) | (x) | (%) | (%) | (%) | (x) | ($) | (%) | (%) | |||||||||||||||||||||||||||||||||||||||||||||||||||||
| Companies |
||||||||||||||||||||||||||||||||||||||||||||||||||||||||||||||||||||
| AFBI |
Affinity Bancshares, Inc. | SE | 8.92 | 6.93 | 0.32 | 2.55 | 0.69 | 5.55 | 0.76 | 103.99 | 41.35 | 102.74 | 9.16 | 135.14 | 19.09 | NA | NA | NM | ||||||||||||||||||||||||||||||||||||||||||||||||||
| AX |
Axos Financial, Inc. | WE | 8.95 | 8.18 | 1.59 | 16.93 | 1.71 | 18.20 | 1.22 | 80.58 | 12.74 | 201.65 | 18.04 | 222.50 | 11.85 | NA | NA | NM | ||||||||||||||||||||||||||||||||||||||||||||||||||
| BYFC |
Broadway Financial Corporation | WE | 9.89 | 9.89 | -0.03 | -0.26 | NA | NA | 0.96 | 66.99 | NM | 125.52 | 12.41 | 125.52 | NA | 0.00 | 0.00 | NM | ||||||||||||||||||||||||||||||||||||||||||||||||||
| CFFN |
Capitol Federal Financial, Inc. | MW | 13.29 | NA | 0.64 | 4.69 | 0.64 | 4.69 | NA | NA | 28.75 | 137.54 | 18.28 | 138.41 | 28.22 | 0.34 | 2.69 | 106.82 | ||||||||||||||||||||||||||||||||||||||||||||||||||
| CARV |
Carver Bancorp, Inc. | MA | 6.90 | 6.90 | -0.79 | -9.90 | -0.90 | -11.29 | 1.25 | 58.83 | NM | 89.80 | 3.89 | 89.80 | NM | 0.00 | 0.00 | NM | ||||||||||||||||||||||||||||||||||||||||||||||||||
| CBMB |
CBM Bancorp, Inc. | MA | 22.94 | 22.94 | 0.32 | 1.27 | 0.27 | 1.07 | 0.55 | 337.30 | 69.75 | 97.29 | 22.31 | 97.29 | 84.11 | NA | NA | 250.00 | ||||||||||||||||||||||||||||||||||||||||||||||||||
| CNNB |
Cincinnati Bancorp, Inc. | MW | 17.13 | 17.07 | 0.77 | 6.10 | 0.78 | 6.17 | 0.54 | 118.50 | 19.93 | 89.56 | 15.34 | 89.97 | 19.71 | NA | NA | NM | ||||||||||||||||||||||||||||||||||||||||||||||||||
| ESBK |
Elmira Savings Bank | MA | 9.43 | 7.66 | 0.64 | 6.95 | 0.64 | 6.97 | NA | 103.71 | 10.29 | 71.03 | 6.69 | 89.11 | 10.30 | 0.60 | 4.90 | 57.14 | ||||||||||||||||||||||||||||||||||||||||||||||||||
| ESSA |
ESSA Bancorp, Inc. | MA | 10.39 | 9.69 | 0.79 | 7.77 | 0.78 | 7.75 | NA | NA | 10.68 | 86.89 | 9.03 | 93.91 | 10.71 | 0.44 | 2.82 | 30.14 | ||||||||||||||||||||||||||||||||||||||||||||||||||
| FFBW |
FFBW, Inc. | MW | 35.92 | 35.90 | 0.63 | 2.41 | NA | NA | 0.63 | 143.79 | 40.08 | 78.24 | 28.10 | 78.28 | NA | NA | NA | NM | ||||||||||||||||||||||||||||||||||||||||||||||||||
| FNWB |
First Northwest Bancorp | WE | 11.27 | 11.27 | 0.72 | 5.79 | 0.55 | 4.40 | NA | NA | 14.28 | 86.37 | 9.73 | 86.37 | 18.80 | 0.24 | 1.53 | 20.00 | ||||||||||||||||||||||||||||||||||||||||||||||||||
| FBC |
Flagstar Bancorp, Inc. | MW | 7.09 | 6.62 | 2.00 | 26.22 | 2.04 | NA | 0.35 | 247.06 | 4.73 | 117.33 | NA | 126.55 | 4.64 | 0.20 | 0.44 | 1.58 | ||||||||||||||||||||||||||||||||||||||||||||||||||
| FSBW |
FS Bancorp, Inc. | WE | 10.88 | 10.59 | 2.02 | 18.74 | 1.98 | 18.32 | NA | NA | 6.56 | 108.43 | 11.80 | 111.87 | 6.71 | 0.84 | 1.43 | 7.02 | ||||||||||||||||||||||||||||||||||||||||||||||||||
| GBNY |
Generations Bancorp NY, Inc. | MA | 7.75 | NA | NA | NA | NA | NA | NA | NA | NA | NA | NA | NA | NA | NA | NA | NA | ||||||||||||||||||||||||||||||||||||||||||||||||||
| HONE |
HarborOne Bancorp, Inc. | NE | 15.53 | 14.11 | 1.05 | 6.55 | 1.08 | 6.73 | NA | NA | 13.80 | 93.00 | 14.44 | 104.09 | 13.43 | 0.12 | 1.06 | 10.98 | ||||||||||||||||||||||||||||||||||||||||||||||||||
| HIFS |
Hingham Institution for Savings | NE | 10.25 | 10.25 | 1.88 | 18.96 | 1.65 | 16.56 | NA | NA | 10.16 | 172.45 | 17.68 | 172.45 | 11.64 | 1.88 | 0.80 | 10.62 | ||||||||||||||||||||||||||||||||||||||||||||||||||
| HMNF |
HMN Financial, Inc. | MW | 11.35 | 11.27 | 1.21 | 10.56 | NA | NA | NA | NA | 8.56 | 87.76 | 9.96 | 88.50 | NA | 0.00 | 0.00 | NM | ||||||||||||||||||||||||||||||||||||||||||||||||||
| HFBL |
Home Federal Bancorp, Inc. of Louisiana | SW | 9.61 | 9.61 | 0.93 | 9.31 | NA | NA | NA | NA | 10.73 | 95.50 | 9.18 | 95.50 | NA | 0.66 | 2.27 | 24.17 | ||||||||||||||||||||||||||||||||||||||||||||||||||
| HVBC |
HV Bancorp, Inc. | MA | 7.33 | 7.33 | 1.02 | 11.87 | 0.99 | 11.54 | 0.49 | 76.54 | 8.76 | 100.35 | 7.36 | 100.35 | 9.01 | NA | NA | NM | ||||||||||||||||||||||||||||||||||||||||||||||||||
| IROQ |
IF Bancorp, Inc. | MW | 11.90 | 11.90 | 0.70 | 6.06 | NA | NA | NA | NA | 12.58 | 78.23 | 9.31 | 78.23 | NA | 0.30 | 1.46 | 18.40 | ||||||||||||||||||||||||||||||||||||||||||||||||||
| KRNY |
Kearny Financial Corp. | MA | 14.89 | NA | 0.73 | 4.66 | 0.76 | 4.85 | NA | NA | 17.46 | 82.81 | 12.33 | 104.93 | 16.59 | 0.32 | 3.00 | 52.46 | ||||||||||||||||||||||||||||||||||||||||||||||||||
| EBSB |
Meridian Bancorp, Inc. | NE | 11.61 | 11.32 | 1.01 | 8.76 | 0.95 | 8.28 | NA | NA | 12.33 | 108.46 | 12.60 | 111.66 | 13.05 | 0.32 | 2.01 | 24.81 | ||||||||||||||||||||||||||||||||||||||||||||||||||
| MSVB |
Mid-Southern Bancorp, Inc. | MW | 22.38 | 22.38 | 0.56 | 2.36 | 0.52 | 2.20 | 1.19 | 63.20 | 43.89 | 106.86 | 23.91 | 106.86 | 46.93 | 0.12 | 0.74 | 24.32 | ||||||||||||||||||||||||||||||||||||||||||||||||||
| NYCB |
New York Community Bancorp, Inc. | MA | 12.15 | 8.19 | 0.94 | 7.62 | 0.94 | 7.55 | NA | NA | 10.21 | 76.18 | 8.65 | 123.43 | 10.30 | 0.68 | 6.53 | 66.67 | ||||||||||||||||||||||||||||||||||||||||||||||||||
| NFBK |
Northfield Bancorp, Inc. | MA | 13.67 | 13.01 | 0.70 | 5.07 | 0.80 | 5.76 | NA | 231.96 | 17.39 | 91.54 | 12.52 | 96.94 | 15.30 | 0.44 | 3.33 | 57.89 | ||||||||||||||||||||||||||||||||||||||||||||||||||
| NWBI |
Northwest Bancshares, Inc. | MA | 11.14 | 8.48 | 0.58 | 4.72 | 0.75 | 6.09 | 0.92 | 108.18 | 21.24 | 108.72 | 12.12 | 147.19 | 16.48 | 0.76 | 5.77 | 122.58 | ||||||||||||||||||||||||||||||||||||||||||||||||||
| PCSB |
PCSB Financial Corporation | MA | 15.05 | 14.75 | 0.55 | 3.50 | 0.55 | 3.51 | NA | 194.03 | 25.00 | 94.14 | 14.17 | 96.39 | 24.90 | 0.16 | 1.02 | 25.40 | ||||||||||||||||||||||||||||||||||||||||||||||||||
| PVBC |
Provident Bancorp, Inc. | NE | 15.66 | 15.66 | 0.89 | 5.05 | 1.02 | 5.79 | NA | NA | 18.33 | 97.72 | 15.31 | 97.72 | 16.00 | 0.12 | 0.99 | 18.18 | ||||||||||||||||||||||||||||||||||||||||||||||||||
| PROV |
Provident Financial Holdings, Inc. | WE | 10.68 | 10.68 | 0.47 | 4.34 | 0.47 | 4.34 | 0.88 | 83.14 | 21.39 | 91.70 | 9.79 | 91.70 | 21.39 | 0.56 | 3.64 | 77.78 | ||||||||||||||||||||||||||||||||||||||||||||||||||
| PFS |
Provident Financial Services, Inc. | MA | 12.54 | 9.26 | 0.86 | 6.49 | 0.88 | 6.70 | NA | NA | 13.66 | 90.99 | 11.41 | 127.76 | 13.22 | 0.92 | 4.84 | 66.19 | ||||||||||||||||||||||||||||||||||||||||||||||||||
| PBIP |
Prudential Bancorp, Inc. | MA | 11.00 | 10.52 | 0.73 | 6.77 | NA | NA | NA | NA | 11.97 | 77.32 | 8.50 | 81.30 | NA | 0.28 | 2.21 | 66.98 | ||||||||||||||||||||||||||||||||||||||||||||||||||
| RNDB |
Randolph Bancorp, Inc. | NE | 13.13 | NA | 2.30 | 18.55 | 2.49 | 20.05 | 1.57 | 58.62 | 6.60 | 116.38 | 15.28 | NA | 6.11 | NA | NA | NM | ||||||||||||||||||||||||||||||||||||||||||||||||||
| RVSB |
Riverview Bancorp, Inc. | WE | 10.57 | 8.81 | 0.74 | 6.61 | 0.75 | 6.68 | NA | NA | 12.77 | 82.69 | 8.74 | 101.16 | 12.63 | 0.20 | 3.56 | 45.45 | ||||||||||||||||||||||||||||||||||||||||||||||||||
| SVBI |
Severn Bancorp, Inc. | MA | 11.51 | 11.41 | 0.76 | 6.21 | 0.76 | 6.27 | 1.26 | 79.04 | 15.00 | 91.15 | 10.49 | 92.08 | 14.87 | 0.16 | 2.05 | 30.77 | ||||||||||||||||||||||||||||||||||||||||||||||||||
| STXB |
Spirit of Texas Bancshares, Inc. | SW | 11.69 | 9.09 | 1.12 | 8.97 | 1.25 | 10.03 | NA | NA | 10.88 | 91.71 | 10.72 | 121.50 | 9.73 | 0.36 | 1.86 | 8.99 | ||||||||||||||||||||||||||||||||||||||||||||||||||
| SBT |
Sterling Bancorp, Inc. | MW | 8.17 | 8.17 | -0.35 | -3.85 | NA | NA | NA | NA | NM | 79.92 | 6.53 | 79.92 | NA | 0.00 | 0.00 | NM | ||||||||||||||||||||||||||||||||||||||||||||||||||
| TBNK |
Territorial Bancorp Inc. | WE | 11.78 | 11.78 | 0.89 | 7.55 | 0.84 | 7.12 | NA | NA | 12.32 | 94.75 | 11.16 | 94.75 | 13.06 | 0.92 | 3.71 | 50.75 | ||||||||||||||||||||||||||||||||||||||||||||||||||
| TSBK |
Timberland Bancorp, Inc. | WE | 12.17 | 11.24 | 1.69 | 13.63 | 1.71 | 13.79 | 0.37 | 246.50 | 9.12 | 116.60 | 14.19 | 127.60 | 9.02 | 0.84 | 3.10 | 30.64 | ||||||||||||||||||||||||||||||||||||||||||||||||||
| TBK |
Triumph Bancorp, Inc. | SW | 12.24 | 9.34 | 1.18 | 9.67 | NA | NA | NA | NA | 25.32 | 233.66 | 27.04 | 323.89 | NA | NA | NA | NM | ||||||||||||||||||||||||||||||||||||||||||||||||||
| TRST |
TrustCo Bank Corp NY | MA | 9.63 | 9.62 | 0.94 | 9.47 | 0.93 | 9.31 | NA | NA | 11.99 | 110.49 | 10.64 | 110.60 | 12.20 | 0.27 | 4.19 | 50.19 | ||||||||||||||||||||||||||||||||||||||||||||||||||
| WSBF |
Waterstone Financial, Inc. | MW | 18.91 | NA | 3.77 | 20.62 | 3.87 | 21.19 | NA | NA | 5.82 | 116.54 | 22.04 | 121.36 | 5.66 | 0.80 | 4.17 | 41.21 | ||||||||||||||||||||||||||||||||||||||||||||||||||
| WNEB |
Western New England Bancorp, Inc. | NE | 9.58 | 8.99 | 0.48 | 4.86 | 0.51 | 5.13 | NA | NA | 16.07 | 80.63 | 7.72 | 86.52 | 15.23 | 0.20 | 2.77 | 44.44 | ||||||||||||||||||||||||||||||||||||||||||||||||||
| WSFS |
WSFS Financial Corporation | MA | 12.48 | 8.94 | 0.86 | 6.18 | 0.76 | 5.46 | 0.42 | 398.30 | 19.94 | 120.63 | 15.08 | 175.11 | 22.48 | 0.48 | 1.06 | 21.15 | ||||||||||||||||||||||||||||||||||||||||||||||||||
| WVFC |
WVS Financial Corp. | MA | 12.11 | 12.11 | 0.50 | 4.81 | 0.51 | 4.87 | NA | NA | 15.30 | 75.00 | 9.08 | 75.00 | 15.10 | 0.40 | 2.64 | 40.40 | ||||||||||||||||||||||||||||||||||||||||||||||||||
| MHCs |
||||||||||||||||||||||||||||||||||||||||||||||||||||||||||||||||||||
| BCOW |
1895 Bancorp Of Wisconsin, Inc. (MHC) | MW | 11.81 | 11.81 | 0.30 | 2.52 | 0.13 | 1.05 | 0.37 | 143.09 | 32.83 | 78.78 | 9.31 | 78.78 | 79.58 | NA | NA | NM | ||||||||||||||||||||||||||||||||||||||||||||||||||
| BSBK |
Bogota Financial Corp. (MHC) | MA | 17.34 | 17.34 | 0.28 | 1.66 | 0.54 | 3.19 | NA | NA | 53.65 | 93.41 | 16.20 | 93.41 | 27.98 | NA | NA | NM | ||||||||||||||||||||||||||||||||||||||||||||||||||
| CLBK |
Columbia Financial, Inc. (MHC) | MA | 11.49 | 10.62 | 0.66 | 5.67 | 0.73 | 6.25 | NA | NA | 30.38 | 173.33 | 19.92 | 189.54 | 27.57 | NA | NA | NM | ||||||||||||||||||||||||||||||||||||||||||||||||||
| FSEA |
First Seacoast Bancorp (MHC) | NE | 12.31 | 12.31 | 0.30 | 2.29 | 0.25 | 1.88 | 0.19 | 349.03 | 39.68 | 90.40 | 11.13 | 90.40 | 48.17 | NA | NA | NM | ||||||||||||||||||||||||||||||||||||||||||||||||||
| GCBC |
Greene County Bancorp, Inc. (MHC) | MA | 7.44 | 7.44 | 1.18 | 15.37 | NA | NA | NA | NA | 10.65 | 151.57 | 11.28 | 151.57 | NA | 0.48 | 1.94 | 20.26 | ||||||||||||||||||||||||||||||||||||||||||||||||||
| KFFB |
Kentucky First Federal Bancorp (MHC) | MW | 15.67 | 15.43 | -3.78 | -21.67 | NA | NA | NA | NA | NM | 102.66 | 16.09 | 104.57 | NA | 0.40 | 6.19 | NM | ||||||||||||||||||||||||||||||||||||||||||||||||||
| LSBK |
Lake Shore Bancorp, Inc. (MHC) | MA | 12.52 | 12.52 | 0.69 | 5.38 | 0.68 | 5.33 | NA | NA | 17.45 | 91.09 | 11.41 | 91.09 | 17.62 | 0.52 | 3.87 | 48.05 | ||||||||||||||||||||||||||||||||||||||||||||||||||
| MGYR |
Magyar Bancorp, Inc. (MHC) | MA | 7.85 | 7.85 | 0.41 | 5.31 | 0.40 | 5.21 | NA | NA | 20.79 | 105.88 | 8.31 | 105.88 | 21.16 | NA | NA | NM | ||||||||||||||||||||||||||||||||||||||||||||||||||
| OFED |
Oconee Federal Financial Corp. (MHC) | SE | 17.11 | 16.66 | 0.82 | 4.72 | 0.82 | 4.71 | 0.49 | 57.09 | 32.88 | 151.25 | 25.88 | 156.14 | 32.86 | 0.40 | 1.67 | 54.79 | ||||||||||||||||||||||||||||||||||||||||||||||||||
| PDLB |
PDL Community Bancorp (MHC) | MA | 12.40 | 12.40 | -0.46 | -3.28 | -0.02 | -0.15 | 1.38 | 81.43 | NM | 105.05 | 13.02 | 105.05 | NM | NA | NA | NM | ||||||||||||||||||||||||||||||||||||||||||||||||||
| PBFS |
Pioneer Bancorp, Inc. (MHC) | MA | 13.84 | 13.34 | 0.51 | 3.35 | 0.48 | 3.11 | 1.01 | 145.52 | 36.37 | 125.74 | 17.40 | 131.19 | 39.86 | NA | NA | NM | ||||||||||||||||||||||||||||||||||||||||||||||||||
| RBKB |
Rhinebeck Bancorp, Inc. (MHC) | MA | 10.32 | 10.19 | 0.55 | 5.18 | 0.55 | 5.22 | NA | NA | 16.75 | 88.02 | 9.08 | 89.25 | 16.62 | NA | NA | NM | ||||||||||||||||||||||||||||||||||||||||||||||||||
| TFSL |
TFS Financial Corporation (MHC) | MW | 11.38 | 11.32 | 0.56 | 4.89 | NA | NA | NA | NA | 58.43 | 296.67 | 33.75 | 298.42 | NA | 1.12 | 6.39 | 373.33 | ||||||||||||||||||||||||||||||||||||||||||||||||||
| (1) | Average of High/Low or Bid/Ask price per share. |
| (2) | Or since offering price if converted of first listed in the past 52 weeks. Percent change figures are actual year-to-date and are not annualized. |
| (3) | EPS (earnings per share) is based on actual trailing 12 month data and is not shown on a pro forma basis. |
| (4) | Exludes intangibles (such as goodwill, value of core deposits, etc.). |
| (5) | ROA (return on assets) and ROE (return on equity) are indicated ratios based on trailing 12 month common earnings and average common equity and total assets balances. |
| (6) | Annualized based on last regular quarterly cash dividend announcement. |
| (7) | Indicated dividend as a percent of trailing 12 month earnings. |
| (8) | Excluded from averages due to actual or rumored acquisition activities or unusual operating characteristics. |
| (9) | For MHC institutions, market value reflects share price multiplied by public (non-MHC) shares. |
Source: S&P Global Market Intelligence and RP® Financial, LC. calculations. The information provided in this table has been obtained from sources we believe are reliable, but we cannot guarantee the accuracy or completeness of such information.
Copyright (c) 2021 by RP® Financial, LC.
EXHIBIT IV-2
Historical Stock Price Indices
Exhibit IV-2
Historical Stock Price Indices(1)
| SNL | SNL | |||||||||||||||||||||
| NASDAQ | Thrift | Bank | ||||||||||||||||||||
| Year/Qtr. Ended |
DJIA | S&P 500 | Composite | Index | Index | |||||||||||||||||
| 2007: |
Quarter 1 | 12354.4 | 1420.9 | 2421.6 | 1703.6 | 634.40 | ||||||||||||||||
| Quarter 2 | 13408.6 | 1503.4 | 2603.2 | 1645.9 | 622.63 | |||||||||||||||||
| Quarter 3 | 13895.6 | 1526.8 | 2701.5 | 1523.3 | 595.80 | |||||||||||||||||
| Quarter 4 | 13264.8 | 1468.4 | 2652.3 | 1058.0 | 492.85 | |||||||||||||||||
| 2008: |
Quarter 1 | 12262.9 | 1322.7 | 2279.1 | 1001.5 | 442.5 | ||||||||||||||||
| Quarter 2 | 11350.0 | 1280.0 | 2293.0 | 822.6 | 332.2 | |||||||||||||||||
| Quarter 3 | 10850.7 | 1166.4 | 2082.3 | 760.1 | 414.8 | |||||||||||||||||
| Quarter 4 | 8776.4 | 903.3 | 1577.0 | 653.9 | 268.3 | |||||||||||||||||
| 2009: |
Quarter 1 | 7608.9 | 797.9 | 1528.6 | 542.8 | 170.1 | ||||||||||||||||
| Quarter 2 | 8447.0 | 919.3 | 1835.0 | 538.8 | 227.6 | |||||||||||||||||
| Quarter 3 | 9712.3 | 1057.1 | 2122.4 | 561.4 | 282.9 | |||||||||||||||||
| Quarter 4 | 10428.1 | 1115.1 | 2269.2 | 587.0 | 260.8 | |||||||||||||||||
| 2010: |
Quarter 1 | 10856.6 | 1169.4 | 2398.0 | 626.3 | 301.1 | ||||||||||||||||
| Quarter 2 | 9744.0 | 1030.7 | 2109.2 | 564.5 | 257.2 | |||||||||||||||||
| Quarter 3 | 9744.0 | 1030.7 | 2109.2 | 564.5 | 257.2 | |||||||||||||||||
| Quarter 4 | 11577.5 | 1257.6 | 2652.9 | 592.2 | 290.1 | |||||||||||||||||
| 2011: |
Quarter 1 | 12319.7 | 1325.8 | 2781.1 | 578.1 | 293.1 | ||||||||||||||||
| Quarter 2 | 12414.3 | 1320.6 | 2773.5 | 540.8 | 266.8 | |||||||||||||||||
| Quarter 3 | 10913.4 | 1131.4 | 2415.4 | 443.2 | 198.9 | |||||||||||||||||
| Quarter 4 | 12217.6 | 1257.6 | 2605.2 | 481.4 | 221.3 | |||||||||||||||||
| 2012: |
Quarter 1 | 13212.0 | 1408.5 | 3091.6 | 529.3 | 284.9 | ||||||||||||||||
| Quarter 2 | 12880.1 | 1362.2 | 2935.1 | 511.6 | 257.3 | |||||||||||||||||
| Quarter 3 | 13437.1 | 1440.7 | 3116.2 | 557.6 | 276.8 | |||||||||||||||||
| Quarter 4 | 13104.1 | 1426.2 | 3019.5 | 565.8 | 292.7 | |||||||||||||||||
| 2013: |
Quarter 1 | 14578.5 | 1569.2 | 3267.5 | 602.3 | 318.9 | ||||||||||||||||
| Quarter 2 | 14909.6 | 1606.3 | 3404.3 | 625.3 | 346.7 | |||||||||||||||||
| Quarter 3 | 15129.7 | 1681.6 | 3771.5 | 650.8 | 354.4 | |||||||||||||||||
| Quarter 4 | 16576.7 | 1848.4 | 4176.6 | 706.5 | 394.4 | |||||||||||||||||
| 2014: |
Quarter 1 | 16457.7 | 1872.3 | 4199.0 | 718.9 | 410.8 | ||||||||||||||||
| Quarter 2 | 16826.6 | 1960.2 | 4408.2 | 723.9 | 405.2 | |||||||||||||||||
| Quarter 3 | 17042.9 | 1972.3 | 4493.4 | 697.7 | 411.0 | |||||||||||||||||
| Quarter 4 | 17823.1 | 2058.9 | 4736.1 | 738.7 | 432.8 | |||||||||||||||||
| 2015: |
Quarter 1 | 17776.1 | 2067.9 | 4900.9 | 749.3 | 418.8 | ||||||||||||||||
| Quarter 2 | 17619.5 | 2063.1 | 4986.9 | 795.7 | 448.4 | |||||||||||||||||
| Quarter 3 | 16284.7 | 1920.0 | 4620.2 | 811.7 | 409.4 | |||||||||||||||||
| Quarter 4 | 17425.0 | 2043.9 | 5007.4 | 809.1 | 431.5 | |||||||||||||||||
| 2016: |
Quarter 1 | 17685.1 | 2059.7 | 4869.9 | 788.1 | 381.4 | ||||||||||||||||
| Quarter 2 | 17930.0 | 2098.9 | 4842.7 | 780.9 | 385.6 | |||||||||||||||||
| Quarter 3 | 18308.2 | 2168.3 | 5312.0 | 827.2 | 413.7 | |||||||||||||||||
| Quarter 4 | 19762.6 | 2238.8 | 5383.1 | 966.7 | 532.7 | |||||||||||||||||
| 2017: |
Quarter 1 | 20663.2 | 2362.7 | 5911.7 | 918.9 | 535.8 | ||||||||||||||||
| Quarter 2 | 21349.6 | 2423.4 | 6140.4 | 897.1 | 552.4 | |||||||||||||||||
| Quarter 3 | 22405.1 | 2519.4 | 6496.0 | 939.3 | 573.2 | |||||||||||||||||
| Quarter 4 | 24719.2 | 2673..6 | 6903.4 | 937.6 | 617.7 | |||||||||||||||||
| 2018: |
Quarter 1 | 24103.1 | 2640.9 | 7063.5 | 941.5 | 606.8 | ||||||||||||||||
| Quarter 2 | 24271.4 | 2718.4 | 7510.3 | 961.2 | 597.8 | |||||||||||||||||
| Quarter 3 | 26458.3 | 2914.0 | 8046.4 | 905.6 | 597.8 | |||||||||||||||||
| Quarter 4 | 23327.5 | 2506.9 | 6635.3 | 772.0 | 502.9 | |||||||||||||||||
| 2019: |
Quarter 1 | 25928.7 | 2834.4 | 7729.3 | 837.8 | 543.8 | ||||||||||||||||
| Quarter 2 | 26600.0 | 2941.8 | 8006.2 | 845.3 | 573.0 | |||||||||||||||||
| Quarter 3 | 26916.8 | 2976.7 | 7999.3 | 890.5 | 584.5 | |||||||||||||||||
| Quarter 4 | 28538.4 | 3230.8 | 8972.6 | 920.7 | 663.9 | |||||||||||||||||
| 2020: |
Quarter 1 | 21917.2 | 2584.6 | 7700.1 | 632.8 | 392.9 | ||||||||||||||||
| Quarter 2 | 25812.9 | 3100.3 | 10058.8 | 658.5 | 430.8 | |||||||||||||||||
| Quarter 3 | 27781.7 | 3363.0 | 11167.5 | 605.8 | 417.8 | |||||||||||||||||
| Quarter 4 | 30606.5 | 3756.1 | 12888.3 | 816.7 | 558.8 | |||||||||||||||||
| As of February 5, 2021 | 31148.2 | 3886.8 | 13856.3 | 851.8 | 604.8 | |||||||||||||||||
| (1) | End of period data. |
Sources: S&P Global Market Intelligence and The Wall Street Journal.
EXHIBIT IV-3
Stock Indices as of February 5, 2021

Index Summary (Current Data)
Industry Banking
Geography All
| Index Name |
Current Value | As Of | Day’s Change | Day’s
Change (%) |
||||||||||||
| SNL Banking Indexes |
||||||||||||||||
| SNL U.S. Bank and Thrift |
576.20 | 2/5/2021 | (0.66 | ) | (0.11 | ) | ||||||||||
| SNL U.S. Bank |
604.77 | 2/5/2021 | (0.66 | ) | (0.11 | ) | ||||||||||
| SNL U.S. Thrift |
851.79 | 2/5/2021 | (2.74 | ) | (0.32 | ) | ||||||||||
| SNL TARP Participants |
143.21 | 2/5/2021 | 1.23 | 0.87 | ||||||||||||
| KBW Nasdaq Bank Index |
106.28 | 2/5/2021 | (0.08 | ) | (0.07 | ) | ||||||||||
| KBW Nasdaq Regional Bank Index |
106.62 | 2/5/2021 | (0.10 | ) | (0.10 | ) | ||||||||||
| S&P 500 Bank |
339.96 | 2/5/2021 | (0.82 | ) | (0.24 | ) | ||||||||||
| NASDAQ Bank |
3,972.37 | 2/5/2021 | (2.57 | ) | (0.06 | ) | ||||||||||
| S&P 500 Commercial Banks |
485.69 | 2/5/2021 | (1.17 | ) | (0.24 | ) | ||||||||||
| S&P 500 Diversified Banks |
569.50 | 2/5/2021 | (1.04 | ) | (0.18 | ) | ||||||||||
| S&P 500 Regional Banks |
126.76 | 2/5/2021 | (0.54 | ) | (0.42 | ) | ||||||||||
| SNL Asset Size Indexes |
||||||||||||||||
| SNL U.S. Bank < $250M |
34.52 | 2/5/2021 | (1.49 | ) | (4.13 | ) | ||||||||||
| SNL U.S. Bank $250M-$500M |
534.79 | 2/5/2021 | 16.23 | 3.13 | ||||||||||||
| SNL U.S. Thrift < $250M |
1,612.75 | 2/5/2021 | (2.19 | ) | (0.14 | ) | ||||||||||
| SNL U.S. Thrift $250M-$500M |
5,753.50 | 2/5/2021 | 52.37 | 0.92 | ||||||||||||
| SNL U.S. Bank < $500M |
1,054.55 | 2/5/2021 | 13.01 | 1.25 | ||||||||||||
| SNL U.S. Thrift < $500M |
2,025.68 | 2/5/2021 | 11.48 | 0.57 | ||||||||||||
| SNL U.S. Bank $500M-$1B |
1,159.06 | 2/5/2021 | 12.41 | 1.08 | ||||||||||||
| SNL U.S. Thrift $500M-$1B |
3,623.95 | 2/5/2021 | 9.87 | 0.27 | ||||||||||||
| SNL U.S. Bank $1B-$5B |
1,102.99 | 2/5/2021 | 2.55 | 0.23 | ||||||||||||
| SNL U.S. Thrift $1B-$5B |
2,416.16 | 2/5/2021 | 6.03 | 0.25 | ||||||||||||
| SNL U.S. Bank $5B-$10B |
1,473.68 | 2/5/2021 | 2.06 | 0.14 | ||||||||||||
| SNL U.S. Thrift $5B-$10B |
1,029.23 | 2/5/2021 | 0.79 | 0.08 | ||||||||||||
| SNL U.S. Bank > $10B |
487.22 | 2/5/2021 | (0.61 | ) | (0.13 | ) | ||||||||||
| SNL U.S. Thrift > $10B |
149.61 | 2/5/2021 | (1.01 | ) | (0.67 | ) | ||||||||||
| SNL Market Cap Indexes |
||||||||||||||||
| SNL Micro Cap U.S. Bank |
556.34 | 2/5/2021 | 2.27 | 0.41 | ||||||||||||
| SNL Micro Cap U.S. Thrift |
1,078.57 | 2/5/2021 | 4.11 | 0.38 | ||||||||||||
| SNL Micro Cap U.S. Bank & Thrift |
654.43 | 2/5/2021 | 2.64 | 0.41 | ||||||||||||
| SNL Small Cap U.S. Bank |
659.74 | 2/5/2021 | 0.92 | 0.14 | ||||||||||||
| SNL Small Cap U.S. Thrift |
654.55 | 2/5/2021 | 0.08 | 0.01 | ||||||||||||
| SNL Small Cap U.S. Bank & Thrift |
677.04 | 2/5/2021 | 0.86 | 0.13 | ||||||||||||
| SNL Mid Cap U.S. Bank |
401.78 | 2/5/2021 | 0.11 | 0.03 | ||||||||||||
| SNL Mid Cap U.S. Thrift |
286.55 | 2/5/2021 | (1.40 | ) | (0.49 | ) | ||||||||||
| SNL Mid Cap U.S. Bank & Thrift |
395.31 | 2/5/2021 | (0.12 | ) | (0.03 | ) | ||||||||||
| SNL Large Cap U.S. Bank |
384.45 | 2/5/2021 | (0.54 | ) | (0.14 | ) | ||||||||||
| SNL Large Cap U.S. Thrift |
97.84 | 1/29/2021 | (4.65 | ) | ||||||||||||
| SNL Large Cap U.S. Bank & Thrift |
387.76 | 2/5/2021 | (0.54 | ) | (0.14 | ) | ||||||||||
| SNL Geographic Indexes |
||||||||||||||||
| SNL Mid-Atlantic U.S. Bank |
631.73 | 2/5/2021 | (0.44 | ) | (0.07 | ) | ||||||||||
| SNL Mid-Atlantic U.S. Thrift |
2,883.60 | 2/5/2021 | (20.56 | ) | (0.71 | ) | ||||||||||
| SNL Midwest U.S. Bank |
630.72 | 2/5/2021 | (0.26 | ) | (0.04 | ) | ||||||||||
| SNL Midwest U.S. Thrift |
3,188.59 | 2/5/2021 | (23.51 | ) | (0.73 | ) | ||||||||||
| SNL New England U.S. Bank |
558.98 | 2/5/2021 | 2.12 | 0.38 | ||||||||||||
| SNL New England U.S. Thrift |
3,150.15 | 2/5/2021 | (8.49 | ) | (0.27 | ) | ||||||||||
| SNL Southeast U.S. Bank |
420.99 | 2/5/2021 | (1.01 | ) | (0.24 | ) | ||||||||||
| SNL Southeast U.S. Thrift |
447.93 | 2/5/2021 | 3.16 | 0.71 | ||||||||||||
| SNL Southwest U.S. Bank |
1,153.01 | 2/5/2021 | (4.16 | ) | (0.36 | ) | ||||||||||
| SNL Southwest U.S. Thrift |
1,305.60 | 2/5/2021 | 16.43 | 1.27 | ||||||||||||
| SNL Western U.S. Bank |
1,137.71 | 2/5/2021 | (0.97 | ) | (0.09 | ) | ||||||||||
| SNL Western U.S. Thrift |
190.79 | 2/5/2021 | 2.98 | 1.59 | ||||||||||||
| SNL Stock Exchange Indexes |
||||||||||||||||
| SNL U.S. Bank NYSE |
521.89 | 2/5/2021 | (0.71 | ) | (0.14 | ) | ||||||||||
| SNL U.S. Thrift NYSE |
121.84 | 2/5/2021 | (0.51 | ) | (0.42 | ) | ||||||||||
| SNL U.S. Bank NYSE American |
763.00 | 2/5/2021 | 2.35 | 0.31 | ||||||||||||
| SNL U.S. Bank NASDAQ |
903.80 | 2/5/2021 | (0.09 | ) | (0.01 | ) | ||||||||||
| SNL U.S. Thrift NASDAQ |
2,496.30 | 2/5/2021 | (6.89 | ) | (0.28 | ) | ||||||||||
| SNL U.S. Bank Pink |
448.34 | 2/5/2021 | 1.17 | 0.26 | ||||||||||||
| SNL U.S. Thrift Pink |
411.35 | 2/5/2021 | 1.88 | 0.46 | ||||||||||||
| SNL Bank TSX |
1,184.94 | 2/5/2021 | 1.54 | 0.13 | ||||||||||||
| SNL OTHER Indexes |
||||||||||||||||
| SNL U.S. Thrift MHCs |
5,695.92 | 2/5/2021 | (45.06 | ) | (0.78 | ) | ||||||||||
| SNL Pink Asset Size Indexes |
||||||||||||||||
| SNL U.S. Bank Pink < $100M |
213.80 | 2/5/2021 | 0.00 | 0.00 | ||||||||||||
| SNL U.S. Bank Pink $100M-$500M |
511.65 | 2/5/2021 | (1.07 | ) | (0.21 | ) | ||||||||||
| SNL U.S. Bank Pink > $500M |
387.59 | 2/5/2021 | 1.30 | 0.34 | ||||||||||||
| Broad Market Indexes |
||||||||||||||||
| DJIA |
31,148.24 | 2/5/2021 | 92.38 | 0.30 | ||||||||||||
| S&P 500 |
3,886.83 | 2/5/2021 | 15.09 | 0.39 | ||||||||||||
| S&P 400 Mid Cap |
2,476.67 | 2/5/2021 | 24.35 | 0.99 | ||||||||||||
| S&P 600 Small Cap |
1,252.75 | 2/5/2021 | 14.47 | 1.17 | ||||||||||||
| S&P 500 Financials |
512.69 | 2/5/2021 | 0.44 | 0.09 | ||||||||||||
| SNL U.S. Financial Institutions |
1,090.64 | 2/5/2021 | (0.82 | ) | (0.08 | ) | ||||||||||
| MSCI US IMI Financials |
1,857.09 | 2/5/2021 | 3.47 | 0.19 | ||||||||||||
| NASDAQ |
13,856.30 | 2/5/2021 | 78.56 | 0.57 | ||||||||||||
| NASDAQ Finl |
5,553.40 | 2/5/2021 | 15.51 | 0.28 | ||||||||||||
| NYSE |
15,069.60 | 2/5/2021 | 94.17 | 0.63 | ||||||||||||
| Russell 1000 |
2,204.27 | 2/5/2021 | 10.49 | 0.48 | ||||||||||||
| Russell 2000 |
2,233.33 | 2/5/2021 | 30.91 | 1.40 | ||||||||||||
| Russell 3000 |
2,350.17 | 2/5/2021 | 12.68 | 0.54 | ||||||||||||
| S&P TSX Composite |
18,135.90 | 2/5/2021 | 93.92 | 0.52 |
Intraday data is available for certain exchanges. In all cases, the data is at least 15 minutes delayed.
| * | - Intraday data is not currently available. Data is as of the previous close. |
| ** | - Non-publicly traded institutions and institutions outside of your current subscription are not included in custom indexes. Data is as of the previous close. |
All SNL indexes are market-value weighted; i.e., an institution’s effect on an index is proportional to that institution’s market capitalization.
Source: MSCI. MSCI makes no express or implied warranties or representations and shall have no liability whatsoever with respect to any MSCI data contained herein. The MSCI data may not be further redistributed or used as a basis for other indices or any securities or financial products.
EXHIBIT IV-4
Market Area Acquisition Activity
Exhibit IV-4
New Jersey Bank and Thrift Acquisitions 2017-Present
| Target Financials at Announcement | Deal Terms and Pricing at Announcement | |||||||||||||||||||||||||||||||||||||||||||||||||||||||||||||||||
| Total | NPAs/ | Rsrvs/ | Deal | Value/ | Prem/ | |||||||||||||||||||||||||||||||||||||||||||||||||||||||||||||
| Announce | Complete | Assets | E/A | TE/A | ROAA | ROAE | Assets | NPLs | Value | Share | P/B | P/TB | P/E | P/A | Cdeps | |||||||||||||||||||||||||||||||||||||||||||||||||||
| Date |
Date |
Buyer Name |
Target Name |
($000) | (%) | (%) | (%) | (%) | (%) | (%) | ($M) | ($) | (%) | (%)(x) |
|
(%) | (%) | |||||||||||||||||||||||||||||||||||||||||||||||||
| 09/03/2020 |
Pending | Bogota Financial Corp. (MHC) | NJ | Gibraltar Bank | NJ | 107,314 | 11.92 | 11.92 | 0.27 | 2.27 | 0.08 | 750.00 | NA | NA | NA | NA | NA | NA | NA | |||||||||||||||||||||||||||||||||||||||||||||||
| 03/12/2020 |
07/31/2020 | Provident Financial Services | NJ | SB One Bancorp | NJ | 2,001,657 | 9.95 | 8.63 | 1.20 | 11.66 | 0.83 | 79.77 | 212.1 | 22.092 | 103.77 | 121.47 | 9.20 | 10.59 | 3.25 | |||||||||||||||||||||||||||||||||||||||||||||||
| 12/18/2019 |
07/10/2020 | Kearny Financial Corp. | NJ | MSB Financial Corp. | NJ | 591,253 | 10.86 | 10.86 | 0.71 | 6.08 | 2.24 | 42.78 | 95.7 | 18.291 | 150.82 | 150.82 | 22.86 | 16.21 | 8.29 | |||||||||||||||||||||||||||||||||||||||||||||||
| 12/03/2019 |
04/01/2020 | Columbia Financial Inc. (MHC) | NJ | RSB Bancorp, MHC | NJ | 442,128 | 13.68 | 13.68 | -0.80 | -5.52 | 0.47 | 60.74 | NA | NA | NA | NA | NA | NA | NA | |||||||||||||||||||||||||||||||||||||||||||||||
| 08/16/2019 |
01/02/2020 | ConnectOne Bancorp Inc. | NJ | Bancorp of New Jersey, Inc. | NJ | 924,718 | 10.01 | 10.01 | 0.65 | 6.56 | 1.42 | 72.25 | 113.4 | 15.480 | 122.04 | 122.04 | 19.60 | 12.27 | 4.62 | |||||||||||||||||||||||||||||||||||||||||||||||
| 08/09/2019 |
01/01/2020 | OceanFirst Financial Corp. | NJ | Two River Bancorp | NJ | 1,153,797 | 10.52 | 9.10 | 1.05 | 10.07 | 0.80 | 185.02 | 181.2 | 20.793 | 148.25 | 174.24 | 15.40 | 15.71 | 9.50 | |||||||||||||||||||||||||||||||||||||||||||||||
| 06/26/2019 |
12/01/2019 | Valley National Bancorp | NJ | Oritani Financial Corp. | NJ | 4,074,702 | 13.02 | 13.02 | 1.28 | 9.62 | 0.27 | 274.01 | 734.7 | 16.288 | 138.35 | 138.35 | 13.69 | 18.03 | 9.72 | |||||||||||||||||||||||||||||||||||||||||||||||
| 06/24/2019 |
11/08/2019 | 1st Constitution Bancorp | NJ | Shore Community Bank | NJ | 273,938 | 11.62 | 11.62 | 1.45 | 13.20 | 0.62 | 343.90 | 51.7 | 16.544 | 162.28 | 162.28 | 13.23 | 18.86 | 9.98 | |||||||||||||||||||||||||||||||||||||||||||||||
| 06/07/2019 |
11/01/2019 | Columbia Financial Inc. (MHC) | NJ | Stewardship Financial Corporation NJ | 961,130 | 8.56 | 8.56 | 0.83 | 10.08 | 0.77 | 108.70 | 137.2 | 15.750 | 166.74 | 166.74 | 17.31 | 14.28 | 8.19 | ||||||||||||||||||||||||||||||||||||||||||||||||
| 03/19/2019 |
09/30/2019 | First Bank | NJ | Grand Bank, National Association | NJ | 196,935 | 11.27 | 11.04 | 0.49 | 4.56 | 4.15 | 42.19 | 22.1 42326.297 | 99.33 | 101.74 | 27.83 | 11.20 | 0.27 | ||||||||||||||||||||||||||||||||||||||||||||||||
| 10/25/2018 |
01/31/2019 | OceanFirst Financial Corp. | NJ | Capital Bank of New Jersey | NJ | 495,306 | 9.31 | 9.31 | 1.20 | 13.23 | 0.06 | NM | 76.8 | 30.238 | 166.66 | 166.66 | 13.16 | 15.51 | 7.63 | |||||||||||||||||||||||||||||||||||||||||||||||
| 08/23/2018 |
01/04/2019 | Lakeland Bancorp | NJ | Highlands Bancorp, Inc. | NJ | 487,870 | 6.21 | 5.98 | 0.55 | 8.60 | 0.74 | 136.70 | 55.2 | 19.793 | NA | NA | 22.49 | 11.32 | NA | |||||||||||||||||||||||||||||||||||||||||||||||
| 06/20/2018 |
12/21/2018 | SB One Bancorp | NJ | Enterprise Bank N.J. | NJ | 243,703 | 12.45 | 12.45 | 0.81 | 6.26 | 1.07 | 201.41 | 49.8 | 13.773 | 148.25 | 148.25 | 24.36 | 20.42 | 16.77 | |||||||||||||||||||||||||||||||||||||||||||||||
| 05/24/2018 |
10/31/2018 | MB MHC | NJ | Metuchen, MHC | NJ | 259,000 | 10.26 | 10.26 | 0.13 | 1.26 | 0.19 | 447.02 | NA | NA | NA | NA | NA | NA | NA | |||||||||||||||||||||||||||||||||||||||||||||||
| 12/07/2017 |
07/01/2018 | William Penn Bncp Inc. (MHC) | PA | Audubon Savings Bank | NJ | 157,421 | 7.09 | 7.09 | 0.07 | 1.11 | 0.30 | 164.32 | NA | NA | NA | NA | NA | NA | NA | |||||||||||||||||||||||||||||||||||||||||||||||
| 10/18/2017 |
04/30/2018 | First Bank | NJ | Delanco Bancorp, Inc. | NJ | 127,050 | 10.76 | 10.76 | 0.15 | 1.44 | 3.96 | 28.30 | 13.4 | 14.153 | 97.87 | 97.87 | 67.39 | 10.53 | -0.29 | |||||||||||||||||||||||||||||||||||||||||||||||
| 06/07/2017 |
04/17/2018 | BCB Bancorp Inc. | NJ | IA Bancorp, Inc. | NJ | 235,234 | 8.07 | 8.07 | -0.40 | -4.79 | 3.06 | 31.62 | 12.4 | NA | 102.30 | 102.30 | NA | 5.29 | 0.24 | |||||||||||||||||||||||||||||||||||||||||||||||
| 11/06/2017 |
04/11/2018 | 1st Constitution Bancorp | NJ | New Jersey Community Bank | NJ | 103,572 | 8.94 | 8.94 | -1.21 | -12.58 | NA | NA | 7.6 | 3.999 | 82.40 | 82.40 | NA | 7.38 | NA | |||||||||||||||||||||||||||||||||||||||||||||||
| 11/01/2017 |
04/02/2018 | Kearny Financial Corp. | NJ | Clifton Bancorp Inc. | NJ | 1,554,521 | 18.39 | 18.39 | 0.43 | 2.08 | 0.36 | 133.66 | 408.3 | 17.925 | 138.31 | 138.31 | 59.75 | 26.26 | 19.86 | |||||||||||||||||||||||||||||||||||||||||||||||
| 11/03/2017 |
03/26/2018 | Spencer Savings Bank SLA | NJ | Wawel Bank (MHC) | NJ | 71,802 | 9.42 | 9.42 | -0.68 | -7.05 | 0.21 | 374.03 | 3.4 | 4.000 | 126.89 | 126.89 | NA | 4.68 | -6.02 | |||||||||||||||||||||||||||||||||||||||||||||||
| 07/21/2017 |
03/01/2018 | Delmar Bancorp | MD | Liberty Bell Bank | NJ | 147,837 | 6.69 | 6.69 | 0.11 | 1.71 | 2.51 | 68.23 | 16.8 | 1.910 | 169.41 | 169.41 | NM | 11.36 | 6.83 | |||||||||||||||||||||||||||||||||||||||||||||||
| 06/30/2017 |
01/31/2018 | OceanFirst Financial Corp. | NJ | Sun Bancorp, Inc. | NJ | 2,255,773 | 14.31 | 12.84 | 2.82 | 22.15 | 0.28 | 246.22 | 487.1 | 25.272 | 149.19 | 169.21 | 7.75 | 21.59 | 12.70 | |||||||||||||||||||||||||||||||||||||||||||||||
| 04/11/2017 |
01/04/2018 | Sussex Bancorp | NJ | Community Bank of Bergen County, NJ | 355,726 | 8.28 | 8.28 | 0.49 | 5.68 | 2.30 | 38.52 | 46.6 | NA | 158.16 | 158.16 | 28.03 | 13.10 | 6.04 | ||||||||||||||||||||||||||||||||||||||||||||||||
| Average: | 748,799 | 10.50 | 10.30 | 0.50 | 4.68 | 1.21 | 182.35 | 135.06 | 138.73 | 24.14 | 13.93 | 6.92 | ||||||||||||||||||||||||||||||||||||||||||||||||||||||
| Median: | 355,726 | 10.26 | 10.01 | 0.49 | 5.68 | 0.75 | 133.66 | 143.30 | 143.30 | 19.60 | 13.10 | 7.63 | ||||||||||||||||||||||||||||||||||||||||||||||||||||||
Source: S&P Global Market Intelligence.
EXHIBIT IV-5
Blue Foundry Bancorp
Director and Senior Management Summary Resumes
Exhibit IV-5
Blue Foundry Bancorp
Director and Senior Management Summary Resumes
Directors
James D. Nesci serves as President and Chief Executive Officer of Blue Foundry Bank, a position he has held since 2018. In addition, he is a board member of the New Jersey Bankers Association. Mr. Nesci has been instrumental in developing the Blue Foundry Bank brand. Prior to his role at Blue Foundry Bank, he served as Head of National Sales for TD Bank’s $20 billion U.S. wealth management business. Before joining TD Bank, Mr. Nesci served as Executive Vice President and Chief Wealth Management Officer of Provident Bank and was President of Beacon Trust, a wholly owned subsidiary of Provident Bank. Prior to this, Mr. Nesci was Chief Operating Officer with Wilmington Trust Company, National Wealth Management. Mr. Nesci earned two separate MBAs from Columbia Business School and the London Business School, respectively, as well as a BBA in Finance from Hofstra University in New York. Mr. Nesci’s positions as President and Chief Executive Officer foster clear accountability, effective decision-making, a clear and direct channel of communication from senior management to the full Board of Directors, and alignment on corporate strategy.
Kenneth Grimbilas is the current Chairman of Blue Foundry Bank Board of Directors and has served as a Director for over 22 years. Mr. Grimbilas is the Chief Executive Officer of Tornqvist, Inc., a boutique fabrication and machine shop that has served many clients in the pharmaceuticals, government, transportation, aerospace, entertainment, and consumer goods industries. In addition, Mr. Grimbilas has been a member of the board of the Chilton Memorial Hospital Foundation, now Chilton Medical Center, part of Atlantic Health. Mr. Grimbilas’ experience provides the Board of Directors with extensive knowledge of business and operational matters and the Northeastern New Jersey market area.
J. Christopher Ely is President and Owner of One Madison Management Corp. since 1985 and has also acted as the Accounting Manager at Lever Brothers and a Staff Accountant at Price Waterhouse. He received a Bachelor of Science in Business Administration with a concentration in Accounting from Montclair State College. Additionally, he held a Certified Public Accounting Certification from 1981 to 1999. Mr. Ely provides the Board of Directors with significant knowledge of residential real estate as well as experience in managing a large business in Northeastern New Jersey.
Robert T. Goldstein is an Investment Advisory Representative at Astorino Financial Group, Inc. Previously, he was the President and Owner of Robert J. Goldstein & Associates, Inc., an employee benefits consulting and brokerage firm, which he sold to World Insurance, LLC in 2018. Mr. Goldstein received his Bachelor of Science in Mathematics from Fairfield University. He is a former Trustee and a Committee Member of the Glen Ridge Country Club and was previously a Board Member of Lacordaire Academy in Upper Montclair. Mr. Goldstein offers a valuable perspective and experience on employee benefits matters and with developing a successful business.
Patrick H. Kinzler is currently a Managing Principal at HLW International LLP and has previously held positions at PNC Bank, SmithKline Beecham, and KPMG Consulting. Mr. Kinzler received a Bachelor’s degree in Business Administration and Accounting from Shippensburg State University and an MBA in Finance from Temple University. Mr. Kinzler’s experience assists the Board of Directors in assessing our accounting practices, tax matters and operational needs.
Exhibit IV-5 (continued)
Blue Foundry Bancorp
Director and Senior Management Summary Resumes
Margaret Letsche is retired. Prior to her retirement, Ms. Letsche was the Executive Director of 55 Kip Center, a non-profit community center for older adults. Ms. Letsche earned an Associate Degree in Business Management from Morris County Community College and a Bachelor’s degree in Psychology from Felician College. She holds professional certifications from Rutgers in Continued Education and Professional Development and is certified by the American Institute of Fitness Educators and the American Senior Fitness Association. She also has received her NACD Fellowship certificate. Ms. Letsche is a current Board Member on the Rutherford Community Blood Bank and has previously served on the Borough of Rutherford Zoning Board and the Municipal Alliance Committee. She was a founding member of the Lindsey Meyer Pumpkin Run which held an annual 5k event raising money and awareness for Cystic Fibrosis and supporting local scholarships. Ms. Letsche’s experience in our community provides valuable insight into the economic and business needs of our community, as well as insight into where we can best serve our community in other ways, including charitable donations.
Jonathan M. Shaw is President and Owner of Salon Development Corp, a regional chain of hair salons founded in 1964, and President and Owner of Lemon Tree Development, the national franchisor of Lemon Tree Hair Salons. Mr. Shaw received a Bachelor of Science from Syracuse University. As a business owner and entrepreneur, Mr. Shaw offers a valuable perspective on developing a successful business as well as the challenges and risks an organization may face as it grows its product offerings and markets into new areas.
Mirella Lang is a senior member of AQR’s Business Development team, collaborating with institutional investors throughout the United States. Prior to AQR, Mirella was a Director in the Financial Institutions Group in the investment banking division at UBS, and earlier at Merrill Lynch & Co. She earned a Bachelor of Science in Accounting from Washington & Lee University and received an MBA from the University of California at Berkeley’s Haas School of Business. Mirella serves on the Board of ASSIST, a non-profit organization focused on high school exchange education for exceptionally gifted international students. Ms. Lang’s experience with investment management, investment banking and the financial institutions industry brings valuable skills to our board.
Executive Officers Who are Not Directors
The following sets forth information regarding our executive officers who are not directors. Age information is as of December 31, 2020. The executive officers of Blue Foundry Bancorp and Blue Foundry Bank are elected annually.
Daniel Chen, age 46, has been our Executive Vice President and Chief Financial Officer since May 2019. Prior to starting at Blue Foundry Bank, Mr. Chen acted as Treasurer at Cross River Bank, Managing Director at MetLife Investments, and Vice President at Morgan Stanley. Mr. Chen received a Bachelor’s degree in Economics from the University of Pennsylvania, The Wharton School and a Master’s degree in Business Administration with a Concentration in Finance and Management from Columbia Business School. He is a Certified Public Accountant in New York State.
Elyse D. Beidner, age 67, has been our Executive Vice President and Chief Legal Officer since 2004. Prior to joining Blue Foundry Bank, Ms. Beidner has gained more than 25 years of experience providing legal support for various financial institutions including JP Morgan Chase and Bank of America. She earned her Bachelor’s degree in French and Spanish from Goucher College, her Juris Doctor degree from Widener University School of Law, and her Masters in Corporate Law from New York University School of Law.
Exhibit IV-5 (continued)
Blue Foundry Bancorp
Director and Senior Management Summary Resumes
Brent Michael Ciurlino, age 62, has been our Executive Vice President and Chief Compliance Officer since May 2020. Previously, Mr. Ciurlino held the positions of Senior Vice President-Risk & Operations at Newtek Business Services Corp., Chief Operating & Risk Officer at Freedom Mortgage Corp., Corporate Manager for the Federal Deposit Insurance Corp., Deputy Director-Asset Management Services at Resolution Trust Corp. and Chairman, Board Compliance Committee for Patriot National Bancorp, Inc. Mr. Ciurlino received his Bachelor of Science from the University of Maine and a Master of Science from Washington State University.
Elizabeth Miller, age 61, has been our Executive Vice President and Chief Retail Officer since October 2018. Elizabeth has a Bachelor’s degree in Business and Marketing from Montclair State University.
Acela Roselle, age 60, has been our Executive Vice President and Human Resources Director since 1999. Prior to joining Blue Foundry Bank, Ms. Roselle acted as the Employment Manager at Meadowlands Hospital Medical Center. Ms. Roselle attended The Wood Business School in New York and obtained a SHRM PHR Certification through Fairleigh Dickinson University in 2000.
Mugur Tolea, age 53, has been our Executive Vice President, Chief Technology Officer since January 2021. Prior to joining Blue Foundry Bank, Mr. Tolea was the Vice President of Technology for Search and Discoverability at Walmart eCommerce and Jet.com. Previously, his experience was built in leadership roles of VP of Engineering at Amazon, Shutterstock and Audible. Mr. Tolea holds a PhD Title “Magna Cum Laude,” in Neural Networks from the Polytechnical Institute of Grenoble, France.
Michele Dowling Johnson, age 54, has been our Executive Vice President and Chief Marketing Officer since May 2020. Prior to joining Blue Foundry Bank, Ms. Johnson held senior marketing leadership positions at bluemercury, Dean & DeLuca, L’Oréal and Revlon, specializing in brand management, digital marketing and ecommerce. Ms. Johnson received a Bachelor of Science degree in Business Management from Cornell University and an MBA from Fordham University in Marketing and International Business.
Thomas Packwood, age 55, has been our Senior Vice President and Chief Audit Executive since 2011. Prior to joining Blue Foundry Bank, Mr. Packwood held senior positions at Deloitte, U.S.B. Holding Co., USA Bank, and RSM US LLP. Mr. Packwood received a Bachelor’s degree in Accounting from Villanova University and is a Certified Public Accountant. Additionally, he invented and implemented a patented quarterly Risk Assessment and Management System. Thomas serves as a volunteer at the Rutherford Community Pantry.
Source: Blue Foundry Bancorp’s prospectus.
EXHIBIT IV-6
Blue Foundry Bancorp
Pro Forma Regulatory Capital Ratios
Exhibit IV-6
Blue Foundry Bancorp
Pro Forma Regulatory Capital Ratios
| Blue Foundry Bank Historical at December 31, 2020 |
Pro Forma at December 31, 2020, Based Upon the Sale in the Stock Offering of | |||||||||||||||||||||||||||||||||||||||
| 17,850,000 Shares | 21,000,000 Shares | 24,150,000 Shares | 27,772,500 Shares(1) | |||||||||||||||||||||||||||||||||||||
| Amount | Percent of Assets |
Amount | Percent of Assets |
Amount | Percent of Assets |
Amount | Percent of Assets |
Amount | Percent of Assets |
|||||||||||||||||||||||||||||||
| (Dollars in thousands) | ||||||||||||||||||||||||||||||||||||||||
| Equity |
$205,227 | 10.55 | % | $255,211 | 12.55 | % | $267,058 | 13.04 | % | $278,905 | 13.51 | % | $292,529 | 14.05 | % | |||||||||||||||||||||||||
|
|
|
|
|
|
|
|
|
|
|
|
|
|
|
|
|
|
|
|
|
|||||||||||||||||||||
| Tier 1 leverage capital(2)(3) |
$206,258 | 10.72 | % | $256,242 | 12.74 | % | $268,089 | 13.23 | % | $279,936 | 13.71 | % | $293,560 | 14.25 | % | |||||||||||||||||||||||||
| Tier 1 leverage requirement |
96,168 | 5.00 | % | 100,542 | 5.00 | % | 101,324 | 5.00 | % | 102,105 | 5.00 | % | 103,004 | 5.00 | % | |||||||||||||||||||||||||
|
|
|
|
|
|
|
|
|
|
|
|
|
|
|
|
|
|
|
|
|
|||||||||||||||||||||
| Excess |
$110,090 | 5.72 | % | $155,699 | 7.74 | % | $166,765 | 8.23 | % | $177,830 | 8.71 | % | $190,557 | 9.25 | % | |||||||||||||||||||||||||
|
|
|
|
|
|
|
|
|
|
|
|
|
|
|
|
|
|
|
|
|
|||||||||||||||||||||
| Tier 1 risk-based capital(2)(3) |
$206,258 | 19.93 | % | $256,242 | 24.34 | % | $268,089 | 25.39 | % | $279,936 | 26.44 | % | $293,560 | 27.63 | % | |||||||||||||||||||||||||
| Tier 1 risk-based requirement |
82,806 | 8.00 | % | 84,205 | 8.00 | % | 84,455 | 8.00 | % | 84,705 | 8.00 | % | 84,993 | 8.00 | % | |||||||||||||||||||||||||
|
|
|
|
|
|
|
|
|
|
|
|
|
|
|
|
|
|
|
|
|
|||||||||||||||||||||
| Excess |
$123,452 | 11.93 | % | $172,037 | 16.34 | % | $183,633 | 17.39 | % | $195,230 | 18.44 | % | $208,567 | 19.63 | % | |||||||||||||||||||||||||
|
|
|
|
|
|
|
|
|
|
|
|
|
|
|
|
|
|
|
|
|
|||||||||||||||||||||
| Total risk-based capital(2)(3) |
$219,262 | 21.18 | % | $269,246 | 25.58 | % | $281,093 | 26.63 | % | $292,940 | 27.67 | % | $306,564 | 28.86 | % | |||||||||||||||||||||||||
| Total risk-based requirement |
103,507 | 10.00 | % | 105,257 | 10.00 | % | 105,569 | 10.00 | % | 105,882 | 10.00 | % | 106,241 | 10.00 | % | |||||||||||||||||||||||||
|
|
|
|
|
|
|
|
|
|
|
|
|
|
|
|
|
|
|
|
|
|||||||||||||||||||||
| Excess |
$115,755 | 11.18 | % | $163,989 | 15.58 | % | $175,523 | 16.63 | % | $187,058 | 17.67 | % | $200,323 | 18.86 | % | |||||||||||||||||||||||||
|
|
|
|
|
|
|
|
|
|
|
|
|
|
|
|
|
|
|
|
|
|||||||||||||||||||||
| Common equity tier 1 risk-based capital(2)(3) |
$206,258 | 19.93 | % | $256,242 | 24.34 | % | $268,089 | 25.39 | % | $279,936 | 26.44 | % | $293,560 | 27.63 | % | |||||||||||||||||||||||||
| Common equity tier 1 risk-based requirement |
67,279 | 6.50 | % | 68,417 | 6.50 | % | 68,620 | 6.50 | % | 68,823 | 6.50 | % | 69,057 | 6.50 | % | |||||||||||||||||||||||||
|
|
|
|
|
|
|
|
|
|
|
|
|
|
|
|
|
|
|
|
|
|||||||||||||||||||||
| Excess |
$138,979 | 13.43 | % | $187,825 | 17.84 | % | $199,469 | 18.89 | % | $211,113 | 19.94 | % | $224,503 | 21.13 | % | |||||||||||||||||||||||||
|
|
|
|
|
|
|
|
|
|
|
|
|
|
|
|
|
|
|
|
|
|||||||||||||||||||||
| Reconciliation of capital infused into Blue Foundry Bank: |
||||||||||||||||||||||||||||||||||||||||
| Net proceeds |
|
$ | 87,484 | $ | 103,111 | $ | 188,738 | $ | 136,708 | |||||||||||||||||||||||||||||||
| Less: Common stock acquired by stock-based benefit plan |
|
(7,440 | ) | (8,700 | ) | (9,960 | ) | (11,409 | ) | |||||||||||||||||||||||||||||||
| Less: Common stock acquired by employee stock ownership plan |
|
(14,880 | ) | (17,400 | ) | (19,920 | ) | (22,818 | ) | |||||||||||||||||||||||||||||||
| Less: Cost to withdraw from defined benefit pension plan(4) |
|
(15,180 | ) | (15,180 | ) | (15,180 | ) | (15,180 | ) | |||||||||||||||||||||||||||||||
|
|
|
|
|
|
|
|
|
|||||||||||||||||||||||||||||||||
| Pro forma increase |
|
$ | 49,984 | $ | 61,831 | $ | 73,678 | $ | 87,301 | |||||||||||||||||||||||||||||||
|
|
|
|
|
|
|
|
|
|||||||||||||||||||||||||||||||||
| (1) | As adjusted to give effect to an increase in the number of shares, which could occur due to a 15% increase in the offering range to reflect demand for the shares or changes in market conditions following the commencement of the stock offering. |
| (2) | Tier 1 leverage capital levels are shown as a percentage of total average assets. Risk-based capital levels are shown as a percentage of risk-weighted assets. |
| (3) | Pro forma amounts and percentages assume net proceeds are invested in assets that carry a 20% risk weighting. |
Represents the estimated after-tax expense associated with any potential withdrawal by Blue Foundry Bank from the defined benefit pension plan, based on an estimated total cost to withdraw of $22.0 million. Based on estimates provided in July 2020 by the administrator of the plan,
Source: Blue Foundry Bancorp’s prospectus.
EXHIBIT IV-7
Blue Foundry Bancorp
Pro Forma Analysis Sheet
Exhibit IV-7
PRO FORMA ANALYSIS SHEET
Blue Foundry Bancorp
Prices as of February 5, 2021
| Peer Group | New Jersey Companies | All Publicly-Traded | ||||||||||||||||||||||||||||||||||
| Price Multiple |
Symbol | Subject (1) | Average | Median | Average | Median | Average | Median | ||||||||||||||||||||||||||||
| Price-earnings ratio (x) |
P/E | NM | x | 13.42 | x | 12.27 | x | 13.42 | x | 12.27 | x | 13.96 | x | 12.66 | x | |||||||||||||||||||||
| Price-core earnings ratio (x) |
P/Core | NM | x | 14.14 | x | 14.87 | x | 14.14 | x | 14.87 | x | 13.98 | x | 13.14 | x | |||||||||||||||||||||
| Price-book ratio (%) |
= | P/B | 58.41 | % | 98.28 | % | 89.45 | % | 98.28 | % | 89.45 | % | 103.63 | % | 94.14 | % | ||||||||||||||||||||
| Price-tangible book ratio (%) |
= | P/TB | 58.41 | % | 100.85 | % | 92.99 | % | 100.85 | % | 92.99 | % | 114.74 | % | 100.75 | % | ||||||||||||||||||||
| Price-assets ratio (%) |
= | P/A | 10.31 | % | 12.42 | % | 10.23 | % | 12.42 | % | 10.23 | % | 12.92 | % | 11.60 | % | ||||||||||||||||||||
| Valuation Parameters |
||||||||||
| Pre-Conversion Earnings (Y) |
($ | 31,506,000 | ) | ESOP Stock Purchases (E) | 8.00 | % (6) | ||||
| Pre-Conversion Earnings (CY) |
($ | 9,887,000 | ) | Cost of ESOP Borrowings (S) | 0.00 | % (5) | ||||
| Pre-Conversion Book Value (2)(B) |
$ | 191,066,000 | ESOP Amortization (T) | 25.00 | years | |||||
| Pre-Conv. Tang. Book Val. (2)(TB) |
$ | 191,066,000 | RRP Amount (M) | 4.00 | % | |||||
| Pre-Conversion Assets (A)(2) |
$ | 1,928,011,000 | RRP Vesting (N) | 5.00 | years (6) | |||||
| Reinvestment Rate (2)(R) |
0.36 | % | Foundation (F) | 4.29 | % | |||||
| Est. Conversion Expenses (4)(X) |
2.00 | % | Tax Benefit (Z) | 2,790,000 | ||||||
| Tax Rate (TAX) |
31.00 | % | Percentage Sold (PCT) | 100.00 | % | |||||
| Shares Tax |
$ | 0 | Option (O1) | 10.00 | % (7) | |||||
| Estimated Option Value (O2) | 31.70 | % (7) | ||||||||
| Option vesting (O3) | 5.00 (7 | ) | ||||||||
| Option pct taxable (O4) | 25.00 | % (7) |
| Calculation of Pro Forma Value After Conversion |
||||||||||||
| 1. |
V= |
P/E * (Y) |
V= | NM | ||||||||
| 1 - P/E * PCT * ((1-X-E-M-F)*R*(1-TAX) - (1-TAX)*E/T - (1-TAX)*M/N) - (1-(TAX*O4))*(O1*O2)/O3) | ||||||||||||
| 2. |
V= |
P/Core * (Y) |
V= | NM | ||||||||
| 1 - P/core * PCT * ((1-X-E-M-F)*R*(1-TAX) - (1-TAX)*E/T - (1-TAX)*M/N) - (1-(TAX*O4))*(O1*O2)/O3) | ||||||||||||
| 3. |
V= |
P/B * (B+Z) | V= | $217,500,000 | ||||||||
| 1 - P/B * PCT * (1-X-E-M-F) | ||||||||||||
| 4. |
V= |
P/TB * (TB+Z) | V= | $217,500,000 | ||||||||
| 1 - P/TB * PCT * (1-X-E-M-F) | ||||||||||||
| 5. |
V= |
P/A * (A+Z) | V= | $217,500,000 | ||||||||
| 1 - P/A * PCT * (1-X-E-M-F) | ||||||||||||
| Shares | Aggregate | |||||||||||||||||||||||
| Shares Issued | Price Per | Gross Offering | Issued To | Total Shares | Market Value | |||||||||||||||||||
| Conclusion |
To the Public | Share | Proceeds | Foundation | Issued | of Shares Issued | ||||||||||||||||||
| Supermaximum |
27,772,500 | 10.00 | $ | 277,725,000 | 750,000 | 28,522,500 | $ | 285,225,000 | ||||||||||||||||
| Maximum |
24,150,000 | 10.00 | 241,500,000 | 750,000 | 24,900,000 | 249,000,000 | ||||||||||||||||||
| Midpoint |
21,000,000 | 10.00 | 210,000,000 | 750,000 | 21,750,000 | 217,500,000 | ||||||||||||||||||
| Minimum |
17,850,000 | 10.00 | 178,500,000 | 750,000 | 18,600,000 | 186,000,000 | ||||||||||||||||||
| (1) | Pricing ratios shown reflect the midpoint value. |
| (2) | Adjusted for $15.180 million after-tax expense for termination of pension plan and consolidatiion of $645,000 of net MHC assets. |
| (3) | Net return reflects a reinvestment rate of 0.36 percent and a tax rate of 31.0 percent. |
| (4) | Offering expenses shown at estimated midpoint value. |
| (5) | No cost is applicable since holding company will fund the ESOP loan. |
| (6) | ESOP and MRP amortize over 25 years and 5 years, respectively; amortization expenses tax effected at 31.0 percent. |
| (7) | 10 percent option plan with an estimated Black-Scholes valuation of 31.70 percent of the exercise price, including a 5 year vesting with 25 percent of the options (granted to directors) tax effected at 31.0 percent. |
EXHIBIT IV-8
Blue Foundry Bancorp
Pro Forma Effect of Conversion Proceeds
Exhibit IV-8
PRO FORMA EFFECT OF CONVERSION PROCEEDS
Blue Foundry Bancorp
At the Minimum
| 1. Pro Forma Market Capitalization |
$ | 186,000,000 | ||
| Less: Foundation Shares |
7,500,000 | |||
|
|
|
|||
| 2. Offering Proceeds |
$ | 178,500,000 | ||
| Less: Estimated Offering Expenses |
3,532,833 | |||
|
|
|
|||
| Net Conversion Proceeds |
$ | 174,967,167 | ||
|
|
|
|||
| 3. Estimated Additional Income from Conversion Proceeds |
||||
| Net Conversion Proceeds |
$ | 174,967,167 | ||
| Less: Cash Contribution to Foundation |
1,500,000 | |||
| Less: Non-Cash Stock Purchases (1) |
22,320,000 | |||
|
|
|
|||
| Net Proceeds Reinvested |
$ | 151,147,167 | ||
| Estimated net incremental rate of return |
0.25 | % | ||
|
|
|
|||
| Reinvestment Income |
$ | 375,450 | ||
| Less: Shares Tax |
0 | |||
| Less: Estimated cost of ESOP borrowings (2) |
0 | |||
| Less: Amortization of ESOP borrowings (3) |
410,688 | |||
| Less: Amortization of Options (4) |
1,087,849 | |||
| Less: Recognition Plan Vesting (5) |
1,026,720 | |||
|
|
|
|||
| Net Earnings Impact |
($ | 2,149,807 | ) |
| 4. Pro Forma Earnings | Before Conversion |
Net Earnings Increase |
After Conversion |
|||||||||
| 12 Months ended December 31, 2020 (reported) |
($ | 31,506,000 | ) | ($ | 2,149,807 | ) | ($ | 33,655,807 | ) | |||
| 12 Months ended December 31, 2020 (core) |
($ | 9,887,000 | ) | ($ | 2,149,807 | ) | ($ | 12,036,807 | ) | |||
| 5. Pro Forma Net Worth | Before Conversion |
Net Cash Proceeds |
Tax Benefit Of Contribution |
After Conversion |
||||||||||||
| December 31, 2020 |
$ | 191,066,000 | $ | 151,147,167 | $ | 2,790,000 | $ | 345,003,167 | ||||||||
| December 31, 2020 (Tangible) |
$ | 191,066,000 | $ | 151,147,167 | $ | 2,790,000 | $ | 345,003,167 | ||||||||
| 6. Pro Forma Assets | Before Conversion |
Net Cash Proceeds |
Tax Benefit Of Contribution |
After Conversion |
||||||||||||
| December 31, 2020 |
$ | 1,928,011,000 | $ | 151,147,167 | $ | 2,790,000 | $ | 2,081,948,167 | ||||||||
| (1) | Includes ESOP and RRP stock purchases equal to 8.0 and 4.0 percent of total shares issued, respectively. |
| (2) | ESOP stock purchases are internally financed by a loan from the holding company. |
| (3) | ESOP borrowings are amortized over 25 years, amortization expense is tax-effected at a 31.0 percent rate. |
| (4) | Option valuation based on Black-Scholes model, 5 year vesting, and assumes 25 percent is taxable. |
| (5) | RRP is amortized over 5 years, and amortization expense is tax effected at 31.0 percent. |
| Exhibit IV-8 |
| PRO FORMA EFFECT OF CONVERSION PROCEEDS |
| Blue Foundry Bancorp |
| At the Midpoint |
| 1. Pro Forma Market Capitalization |
$ | 217,500,000 | ||
| Less: Foundation Shares |
7,500,000 | |||
|
|
|
|||
| 2. Offering Proceeds |
$ | 210,000,000 | ||
| Less: Estimated Offering Expenses |
3,779,163 | |||
|
|
|
|||
| Net Conversion Proceeds |
$ | 206,220,837 | ||
| 3. Estimated Additional Income from Conversion Proceeds |
||||
| Net Conversion Proceeds |
$ | 206,220,837 | ||
| Less: Cash Contribution to Foundation |
1,500,000 | |||
| Less: Non-Cash Stock Purchases (1) |
26,100,000 | |||
|
|
|
|||
| Net Proceeds Reinvested |
$ | 178,620,837 | ||
| Estimated net incremental rate of return |
0.25 | % | ||
|
|
|
|||
| Reinvestment Income |
$ | 443,694 | ||
| Less: Shares Tax |
0 | |||
| Less: Estimated cost of ESOP borrowings (2) |
0 | |||
| Less: Amortization of ESOP borrowings (3) |
480,240 | |||
| Less: Amortization of Options (4) |
1,272,081 | |||
| Less: Recognition Plan Vesting (5) |
1,200,600 | |||
|
|
|
|||
| Net Earnings Impact |
($ | 2,509,227 | ) |
| 4. Pro Forma Earnings | Before Conversion |
Net Earnings Increase |
After Conversion |
|||||||||
| 12 Months ended December 31, 2020 (reported) |
($ | 31,506,000 | ) | ($ | 2,509,227 | ) | ($ | 34,015,227 | ) | |||
| 12 Months ended December 31, 2020 (core) |
($ | 9,887,000 | ) | ($ | 2,509,227 | ) | ($ | 12,396,227 | ) | |||
| 5. Pro Forma Net Worth | Before Conversion |
Net Cash Proceeds |
Tax Benefit Of Contribution |
After Conversion |
||||||||||||
| December 31, 2020 |
$ | 191,066,000 | $ | 178,620,837 | $ | 2,790,000 | $ | 372,476,837 | ||||||||
| December 31, 2020 (Tangible) |
$ | 191,066,000 | $ | 178,620,837 | $ | 2,790,000 | $ | 372,476,837 | ||||||||
| 6. Pro Forma Assets | Before Conversion |
Net Cash Proceeds |
Tax Benefit Of Contribution |
After Conversion | ||||||||||||
| December 31, 2020 |
$ | 1,928,011,000 | $ | 178,620,837 | $ | 2,790,000 | $ | 2,109,421,837 | ||||||||
| (1) | Includes ESOP and RRP stock purchases equal to 8.0 and 4.0 percent of total shares issued, respectively. |
| (2) | ESOP stock purchases are internally financed by a loan from the holding company. |
| (3) | ESOP borrowings are amortized over 25 years, amortization expense is tax-effected at a 31.0 percent rate. |
| (4) | Option valuation based on Black-Scholes model, 5 year vesting, and assumes 25 percent is taxable. |
| (5) | RRP is amortized over 5 years, and amortization expense is tax effected at 31.0 percent. |
Exhibit IV-8
PRO FORMA EFFECT OF CONVERSION PROCEEDS
Blue Foundry Bancorp
At the Maximum Value
| 1. Pro Forma Market Capitalization |
$ | 249,000,000 | ||
| Less: Foundation Shares |
7,500,000 | |||
|
|
|
|||
| 2. Offering Proceeds |
$ | 241,500,000 | ||
| Less: Estimated Offering Expenses |
4,025,493 | |||
|
|
|
|||
| Net Conversion Proceeds |
$ | 237,474,507 | ||
| 3. Estimated Additional Income from Conversion Proceeds |
||||
| Net Conversion Proceeds |
$ | 237,474,507 | ||
| Less: Cash Contribution to Foundation |
1,500,000 | |||
| Less: Non-Cash Stock Purchases (1) |
29,880,000 | |||
|
|
|
|||
| Net Proceeds Reinvested |
$ | 206,094,507 | ||
| Estimated net incremental rate of return |
0.25 | % | ||
|
|
|
|||
| Reinvestment Income |
$ | 511,939 | ||
| Less: Shares Tax |
0 | |||
| Less: Estimated cost of ESOP borrowings (2) |
0 | |||
| Less: Amortization of ESOP borrowings (3) |
549,792 | |||
| Less: Amortization of Options (4) |
1,456,314 | |||
| Less: Recognition Plan Vesting (5) |
1,374,480 | |||
|
|
|
|||
| Net Earnings Impact |
($ | 2,868,647 | ) |
| 4. Pro Forma Earnings | Before Conversion |
Net Earnings Increase |
After Conversion |
|||||||||||
| 12 Months ended December 31, 2020 (reported) |
($ | 31,506,000 | ) | ($ | 2,868,647 | ) | ($ | 34,374,647 | ) | |||||
| 12 Months ended December 31, 2020 (core) |
($ | 9,887,000 | ) | ($ | 2,868,647 | ) | ($ | 12,755,647 | ) | |||||
| 5. Pro Forma Net Worth | Before Conversion |
Net Cash Proceeds |
Tax Benefit Of Contribution |
After Conversion |
||||||||||||
| December 31, 2020 |
$ | 191,066,000 | $ | 206,094,507 | $ | 2,790,000 | $ | 399,950,507 | ||||||||
| December 31, 2020 (Tangible) |
$ | 191,066,000 | $ | 206,094,507 | $ | 2,790,000 | $ | 399,950,507 | ||||||||
| 6. Pro Forma Assets | Before Conversion |
Net Cash Proceeds |
Tax Benefit Of Contribution |
After Conversion |
||||||||||||
|
|
|
|
|
|
|
|
|
|||||||||
| December 31, 2020 |
$ | 1,928,011,000 | $ | 206,094,507 | $ | 2,790,000 | $ | 2,136,895,507 | ||||||||
| (1) | Includes ESOP and RRP stock purchases equal to 8.0 and 4.0 percent of total shares issued, respectively. |
| (2) | ESOP stock purchases are internally financed by a loan from the holding company. |
| (3) | ESOP borrowings are amortized over 25 years, amortization expense is tax-effected at a 31.0 percent rate. |
| (4) | Option valuation based on Black-Scholes model, 5 year vesting, and assumes 25 percent is taxable. |
| (5) | RRP is amortized over 5 years, and amortization expense is tax effected at 31.0 percent. |
Exhibit IV-8
PRO FORMA EFFECT OF CONVERSION PROCEEDS
Blue Foundry Bancorp
At the Super Maximum Value
| 1. Pro Forma Market Capitalization |
$ | 285,225,000 | ||
| Less: Foundation Shares |
7,500,000 | |||
|
|
|
|||
| 2. Offering Proceeds |
$ | 277,725,000 | ||
| Less: Estimated Offering Expenses |
4,308,772 | |||
|
|
|
|||
| Net Conversion Proceeds |
$ | 273,416,228 | ||
| 3. Estimated Additional Income from Conversion Proceeds |
||||
| Net Conversion Proceeds |
$ | 273,416,228 | ||
| Less: Cash Contribution to Foundation |
1,500,000 | |||
| Less: Non-Cash Stock Purchases (1) |
34,227,000 | |||
|
|
|
|||
| Net Proceeds Reinvested |
$ | 237,689,228 | ||
| Estimated net incremental rate of return |
0.25 | % | ||
|
|
|
|||
| Reinvestment Income |
$ | 590,420 | ||
| Less: Shares Tax |
0 | |||
| Less: Estimated cost of ESOP borrowings (2) |
0 | |||
| Less: Amortization of ESOP borrowings (3) |
629,777 | |||
| Less: Amortization of Options (4) |
1,668,181 | |||
| Less: Recognition Plan Vesting (5) |
1,574,442 | |||
|
|
|
|||
| Net Earnings Impact |
($ | 3,281,980 | ) |
| 4. Pro Forma Earnings | Before Conversion |
Net Earnings Increase |
After Conversion |
|||||||||
| 12 Months ended December 31, 2020 (reported) |
($ | 31,506,000 | ) | ($ | 3,281,980 | ) | ($ | 34,787,980 | ) | |||
| 12 Months ended December 31, 2020 (core) |
($ | 9,887,000 | ) | ($ | 3,281,980 | ) | ($ | 13,168,980 | ) | |||
| 5. Pro Forma Net Worth | Before Conversion |
Net Cash Proceeds |
Tax Benefit Of Contribution |
After Conversion |
||||||||||||||
| December 31, 2020 |
$ | 191,066,000 | $ | 237,689,228 | $ | 2,790,000 | $ | 431,545,228 | ||||||||||
| December 31, 2020 (Tangible) |
$ | 191,066,000 | $ | 237,689,228 | $ | 2,790,000 | $ | 431,545,228 | ||||||||||
| 6. Pro Forma Assets | Before Conversion |
Net Cash Proceeds |
Tax Benefit Of Contribution |
After Conversion |
||||||||||||||
| December 31, 2020 |
$ | 1,928,011,000 | $ | 237,689,228 | $ | 2,790,000 | $ | 2,168,490,228 | ||||||||||
| (1) | Includes ESOP and RRP stock purchases equal to 8.0 and 4.0 percent of total shares issued, respectively. |
| (2) | ESOP stock purchases are internally financed by a loan from the holding company. |
| (3) | ESOP borrowings are amortized over 25 years, amortization expense is tax-effected at a 31.0 percent rate. |
| (4) | Option valuation based on Black-Scholes model, 5 year vesting, and assumes 25 percent is taxable. |
| (5) | RRP is amortized over 5 years, and amortization expense is tax effected at 31.0 percent. |
EXHIBIT V-1
RP® Financial, LC.
Firm Qualifications Statement

FIRM QUALIFICATION STATEMENT
RP® Financial (“RP®) provides financial and management consulting, merger advisory and valuation services to the financial services industry nationwide. We offer a broad array of services, high quality and prompt service, hands-on involvement by principals and senior staff, careful structuring of strategic initiatives and sophisticated valuation and other analyses consistent with industry practices and regulatory requirements. Our staff maintains extensive background in financial and management consulting, valuation and investment banking. Our clients include commercial banks, thrifts, credit unions, mortgage companies, insurance companies and other financial services companies.
STRATEGIC PLANNING SERVICES
RP®’s strategic planning services are designed to provide effective feasible plans with quantifiable results. We analyze strategic options to enhance shareholder value, achieve regulatory approval or realize other objectives. Such services involve conducting situation analyses; establishing mission/vision statements, developing strategic goals and objectives; and identifying strategies to enhance franchise and/or market value, capital management, earnings enhancement, operational matters and organizational issues. Strategic recommendations typically focus on: capital formation and management, asset/liability targets, profitability, return on equity and stock pricing. Our proprietary financial simulation models provide the basis for evaluating the impact of various strategies and assessing their feasibility and compatibility with regulations.
MERGER ADVISORY SERVICES
RP®’s merger advisory services include targeting potential buyers and sellers, assessing acquisition merit, conducting due diligence, negotiating and structuring merger transactions, preparing merger business plans and financial simulations, rendering fairness opinions, preparing mark-to-market analyses, valuing intangible assets and supporting the implementation of post-acquisition strategies. Our merger advisory services involve transactions of financially healthy companies and failed bank deals. RP® is also expert in de novo charters and shelf charters. Through financial simulations, comprehensive data bases, valuation proficiency and regulatory familiarity, RP®’s merger advisory services center on enhancing shareholder returns.
VALUATION SERVICES
RP®’s extensive valuation practice includes bank and thrift mergers, thrift mutual-to-stock conversions, goodwill impairment, insurance company demutualizations, ESOPs, subsidiary companies, merger accounting and other purposes. We are highly experienced in performing appraisals which conform to regulatory guidelines and appraisal standards. RP® is the nation’s leading valuation firm for thrift mutual-to-stock conversions, with appraised values ranging up to $4 billion.
OTHER CONSULTING SERVICES
RP® offers other consulting services including evaluating the impact of regulatory changes (TARP, etc.), branching and diversification strategies, feasibility studies and special research. We assist banks/thrifts in preparing CRA plans and evaluating wealth management activities on a de novo or merger basis. Our other consulting services are facilitated by proprietary valuation and financial simulation models.
KEY PERSONNEL (Years of Relevant Experience & Contact Information)
| Ronald S. Riggins, Managing Director (40) |
(703) 647-6543 | rriggins@rpfinancial.com | ||
| William E. Pommerening, Managing Director (36) |
(703) 647-6546 | wpommerening@rpfinancial.com | ||
| Gregory E. Dunn, Director (37) |
(703) 647-6548 | gdunn@rpfinancial.com | ||
| James P. Hennessey, Director (33) |
(703) 647-6544 | jhennessey@rpfinancial.com | ||
| James J. Oren, Director (33) |
(703) 647-6549 | joren@rpfinancial.com |
|
Washington Headquarters | ||
| 1311-A Dolley Madison Boulevard | Telephone: (703) 528-1700 | |
| Suite 2A | Fax No.: (703) 528-1788 | |
| McLean, VA 22101 | Toll-Free No.: (866) 723-0594 | |
| www.rpfinancial.com | E-Mail: mail@rpfinancial.com | |