Attached files
| file | filename |
|---|---|
| 8-K - 8-K - Riley Exploration Permian, Inc. | brhc10021368_8k.htm |
Exhibit 99.1

Riley Exploration Permian, Inc.NYSE: REPX Investor PresentationMarch
2021 www.rileypermian.com NYSE American: REPX

Disclaimer Forward-Looking StatementsThis presentation contains projections and other
forward-looking statements within the meaning of Section 27A of the U.S. Securities Act of 1933 and Section 21E of the U.S. Securities Exchange Act of 1934. These projections and statements reflect Riley Exploration Permian, Inc.’s (“Riley
Permian”) current views with respect to future events and financial performance. No assurances can be given, however, that these events will occur or that these projections will be achieved, and actual results could differ materially from
those projected as a result of certain factors. A discussion of these factors is included in Riley Permian’s periodic reports filed with the U.S. Securities and Exchange Commission (“SEC”).This presentation also contains Riley Permian’s
updated capital expenditure and production guidance for 2021 and certain forward-looking information with respect to 2022. The actual levels of production, capital expenditures, expenses and other estimates may be higher or lower than these
estimates due to, among other things, uncertainty in drilling schedules, changes in market demand and unanticipated delays in production. These estimates are based on numerous assumptions, including assumptions related to number of wells
drilled, average spud to release times, rig count, and production rates for wells placed on production. All or any of these assumptions may not prove to be accurate, which could result in actual results differing materially from estimates. If
any of the rigs currently being utilized or intended to be utilized becomes unavailable for any reason, and the Company is not able to secure a replacement on a timely basis, we may not be able to drill, complete and place on production the
expected number of wells. Similarly, average spud to release times may not be maintained in 2021. No assurance can be made that new wells will produce in line with historic performance, or that existing wells will continue to produce in line
with expectations. Our ability to fund our 2021 and future capital budgets is subject to numerous risks and uncertainties, including volatility in commodity prices and the potential for unanticipated increases in costs associated with
drilling, production and transportation. In addition, our production estimate assumes there will not be any new federal, state or local regulation of portions of the energy industry in which we operate, or an interpretation of existing
regulation, that will be materially adverse to our business.Actual results may differ materially from company projections and other forward-looking statements and can be affected by a variety of factors outside the control of Riley Permian,
all of which may be amplified by the COVID-19 pandemic and its unpredictable nature, including among other things: fluctuations in the price we receive for our oil, gas, and NGL production, including local market price differentials, which
may be exacerbated by the demand destruction resulting from COVID-19; disruptions to the availability of workers and contractors due to illness and stay at home orders related to the COVID-19 pandemic; cost and availability of gathering,
pipeline, refining, transportation and other midstream and downstream activities and our ability to sell oil, gas, and NGLs, which may be negatively impacted by the COVID-19 pandemic, severe weather and other risks and lead to a lack of any
available markets; availability of supply chains and critical equipment and supplies; higher than expected costs and expenses, including the availability and cost of services and materials; compliance with environmental and other regulations,
including new regulations that may result from the recent change in federal and state administrations and legislatures; legislative or regulatory changes, including initiatives related to hydraulic fracturing, emissions, and disposal of
produced water, which may be negatively impacted by the recent change in Presidential administration or legislatures; the ability to receive drilling and other permits or approvals and rights-of-way in a timely manner (or at all), which may
be negatively impacted by the impact of COVID-19 restrictions on regulatory employees who process and approve permits, other approvals and rights-of-way and which may be restricted by new Presidential and Secretarial orders and regulation and
legislation; reductions in the quantity of oil, gas, and NGLs sold and prices received because of decreased demand and/or curtailments in production relating to mechanical, transportation, storage, capacity, marketing, weather, the COVID-19
pandemic, or other problems; declines in the SEC PV10 value of our oil and gas properties resulting in full cost ceiling test impairments to the carrying values of our oil and gas properties; the effectiveness of our internal control over
financial reporting; success of Riley Permian’s risk management activities; availability of financing and access to capital markets; estimates of proved reserves, exploitation potential, or exploration prospect size; greater than expected
production decline rates; timing and amount of future production of oil, gas, and NGLs; cybersecurity threats, technology system failures and data security issues; the inability to transport, process and store oil and gas; hedging activities
and the viability of our hedging counterparties, many of whom have been negatively impacted by the COVID-19 pandemic; economic and competitive conditions; lack of available insurance; cash flow and anticipated liquidity; insufficient
liquidity or other factors that may cause the Company to reduce, suspend or totally eliminate dividend payments in the future, whether variable or fixed; continuing compliance with the financial covenant contained in our amended and restated
credit agreement; the loss of certain federal income tax deductions; litigation; environmental liabilities; new federal regulations regarding species or habitats; exploration and development opportunities that we pursue may not result in
economic, productive oil and gas properties; drilling of wells; development drilling and testing results; performance of acquired properties and newly drilled wells; ability to obtain industry partners to jointly explore certain prospects,
and the willingness and ability of those partners to meet capital obligations when requested; unexpected future capital expenditures; amount, nature, and timing of capital expenditures; proving up undeveloped acreage and maintaining
production on leases; unforeseen liabilities associated with acquisitions and dispositions; establishing valuation allowances against our net deferred tax assets; potential payments for failing to meet minimum oil, gas, NGL, or water delivery
or sales commitments; increased financing costs due to a significant increase in interest rates; risks associated with concentration of operations in one major geographic area; availability and cost of capital; title to properties; ability to
complete property sales or other transactions; and other factors discussed in Riley Permian’s reports filed with the SEC. Riley Permian encourages readers to consider the risks and uncertainties associated with projections and other
forward-looking statements. In addition, Riley Permian assumes no obligation to publicly revise or update any forward-looking statements based on future events or circumstances.For additional discussion of the factors that may cause us not to
achieve our financial projections and/or production estimates, see Riley Permian’s filings with the SEC, including its forms 10-K, 10-Q and 8-K and any amendments thereto. We do not undertake any obligation to release publicly the results of
any future revisions we may make to this prospective data or to update this prospective data to reflect events or circumstances after the date of this presentation. Therefore, you are cautioned not to place undue reliance on this
information.None of the information contained in this presentation has been audited by any independent auditor. This presentation is prepared as a convenience for securities analysts and investors and may be useful as a reference tool. Riley
Permian may elect to modify the format or discontinue publication at any time, without notice to securities analysts or investors.
No Offer or SolicitationThis presentation does not constitute an offer to sell or the solicitation of
an offer to buy any securities or a solicitation of any vote or approval, nor shall there be any sale of securities in any jurisdiction in which such offer, solicitation or sale would be unlawful prior to registration or qualification under
the securities laws of any such jurisdiction. No offer of securities shall be made except by means of a prospectus meeting the requirements of Section 10 of the Securities Act of 1933, as amended.Use of non-GAAP Financial InformationThis
presentation includes certain financial measures that are not calculated in accordance with U.S. generally accepted accounting principles (“GAAP”). These measures include (i) EBITDA, (ii) Adjusted EBITDA, (iii) Net Debt, (iv) Free Cash Flow
and (v) PV-10. These non- GAAP financial measures are not measures of financial performance prepared or presented in accordance with GAAP and may exclude items that are significant in understanding and assessing our financial results.
Therefore, these measures should not be considered in isolation, and users of any such information should not place undue reliance thereon. See the Appendix for the descriptions and reconciliations of these non-GAAP measures presented in this
presentation to the most directly comparable financial measures calculated in accordance with GAAP. Riley Permian is unable to provide a reconciliation of non-GAAP financial measures contained in this presentation that are presented on a
forward-looking basis because Riley Permian is unable, without unreasonable efforts, to estimate and quantify the most directly comparable GAAP components, largely because predicting future operating results is subject to many factors outside
of Riley Permian's control and not readily predictable and that are not part of Riley Permian's routine operating activities, including various domestic and international economic, regulatory, political and legal factors.Oil & Gas
Reserves The SEC generally permits oil and natural gas companies, in filings made with the SEC, to disclose proved reserves, which are reserve estimates that geological and engineering data demonstrate with reasonable certainty to be
recoverable in future years from known reservoirs under existing economic and operating conditions, and certain probable and possible reserves that meet the SEC’s definitions for such terms. In this presentation, Riley Permian may use the
terms “resource potential,” “resource play,” “estimated ultimate recovery,” or “EURs,” “type curve” and “standardized measure,” each of which the SEC guidelines restrict from being included in filings with the SEC without strict compliance
with SEC definitions. These terms refer to Riley Permian’s internal estimates of unbooked hydrocarbon quantities that may be potentially discovered through exploratory drilling or recovered with additional drilling or recovery techniques.
“Resource potential” is used by Riley Permian to refer to the estimated quantities of hydrocarbons that may be added to proved reserves, largely from a specified resource play potentially supporting numerous drilling locations. A “resource
play” is a term used by Riley Permian to describe an accumulation of hydrocarbons known to exist over a large areal expanse and/or thick vertical section potentially supporting numerous drilling locations, which, when compared to a
conventional play, typically has a lower geological and/or commercial development risk. “EURs” are based on Riley Permian’s previous operating experience in a given area and publicly available information relating to the operations of
producers who are conducting operations in these areas. Unbooked resource potential or “EURs” do not constitute reserves within the meaning of the Society of Petroleum Engineer’s Petroleum Resource Management System or SEC rules and do not
include any proved reserves. Actual quantities of reserves that may be ultimately recovered from Riley Permian’s interests may differ substantially from those presented herein. Factors affecting ultimate recovery include the scope of Riley
Permian’s ongoing drilling program, which will be directly affected by the availability of capital, decreases in oil, natural gas liquids and natural gas prices, well spacing, drilling and production costs, availability and cost of drilling
services and equipment, lease expirations, transportation constraints, regulatory approvals, negative revisions to reserve estimates and other factors, as well as actual drilling results, including geological and mechanical factors affecting
recovery rates. “EURs” from reserves may change significantly as development of Riley Permian’s core assets provides additional data. In addition, Riley Permian’s production forecasts and expectations for future periods are dependent upon
many assumptions, including estimates of production decline rates from existing wells and the undertaking and outcome of future drilling activity, which may be affected by significant commodity price declines or drilling cost increases. “Type
curve” refers to a production profile of a well, or a particular category of wells, for a specific play and/or area. The “standardized measure” of discounted future new cash flows is calculated in accordance with SEC regulations and a
discount rate of 10%. Actual results may vary considerably and should not be considered to represent the fair market value of Riley Permian’s proved reserves.Industry and Marketing DataAlthough all information and opinions expressed in this
presentation, including market data and other statistical information (including estimates and projections relating to addressable markets), were obtained from sources believed to be reliable and are included in good faith, Riley Permian has
not independently verified the information and makes no representation or warranty, express or implied, as to its accuracy or completeness. Some data is also based on the good faith estimates of Riley Permian, which are derived from its
review of internal sources as well as the independent sources described above. This presentation contains preliminary information only, is subject to change at any time and, is not, and should not be assumed to be, complete or to constitute
all the information necessary to adequately make an informed decision regarding your engagement with Riley Permian. While Riley Permian is not aware of any misstatements regarding the industry and market data presented in this presentation,
such data involve risks and uncertainties and are subject to change based on various factors, including those factors discussed under “Forward Looking Statements” above. Riley Permian has no intention and undertakes no obligation to update or
revise any such information or data, whether as a result of new information, future events or otherwise, except as required by law. Disclaimer

14%2020 vs. 2019 Production Growth(1) 67%1Q21Cash Margin(2) $28MMFY21E Free Cash Flow, per
Guidance(3) 8% FY21E Free Cash Flow Yield(3) 65%FY21EReinvestment Rate, per Guidance(4) 9Consecutive Quarters of Dividend Payments 5.6%Current Dividend Yield(5) 1.4xNet Debt Leverage(6) Investment Highlights of a New Breed, Small Cap
E&P Year-over-Year Production Growth measured from 09/30/19 to 09/30/20.All-in cash margin calculated on a per Boe basis as total revenues after realized hedge impact, less all-in cash costs which consist of LOE, ad valorem and
production taxes, Cash G&A and interest expense.Please refer to the Non-GAAP Financial Measures “Free Cash Flow” in the Appendix of this presentation. See page 9 for initial guidance for fiscal year 2021. Free Cash Flow Yield is
calculated using Free Cash Flow divided by Market Cap based on 03/03/2021 closing price of $19.94 per share.Reinvestment Rate defined as CAPEX divided by estimated Discretionary Cash Flow. Please refer to the Non-GAAP Financial Measures
“Discretionary Cash Flow” in the Appendix of this presentation. See page 9 for initial guidance for fiscal year 2021.Yield based on 03/03/2021 closing price of $19.94 per share. Future dividends subject to the discretion and approval of the
Board of Directors.Non-GAAP financial measure. Please refer to the Non-GAAP Financial Measures “Net Debt” in the Appendix of this presentation.
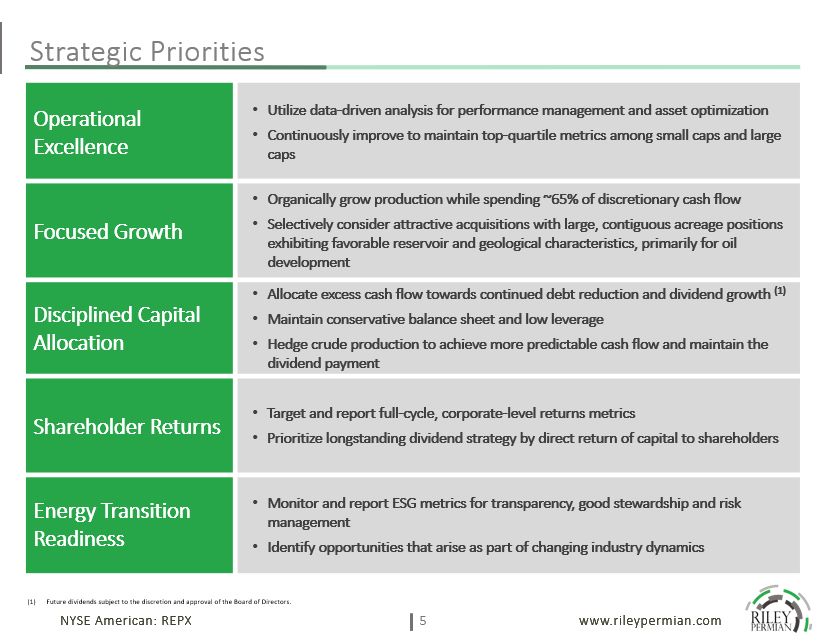
Strategic Priorities Operational Excellence Utilize data-driven analysis for performance
management and asset optimizationContinuously improve to maintain top-quartile metrics among small caps and large caps Focused Growth Organically grow production while spending ~65% of discretionary cash flowSelectively consider attractive
acquisitions with large, contiguous acreage positions exhibiting favorable reservoir and geological characteristics, primarily for oil development Disciplined Capital Allocation Allocate excess cash flow towards continued debt reduction and
dividend growth (1)Maintain conservative balance sheet and low leverageHedge crude production to achieve more predictable cash flow and maintain the dividend payment Shareholder Returns Target and report full-cycle, corporate-level returns
metricsPrioritize longstanding dividend strategy by direct return of capital to shareholders Energy Transition Readiness Monitor and report ESG metrics for transparency, good stewardship and risk managementIdentify opportunities that arise
as part of changing industry dynamics Future dividends subject to the discretion and approval of the Board of Directors.

Corporate Profile Company Market Information Merger completed on February 26, 2021 between
Riley Exploration – Permian, LLC and Tengasco, Inc.Company subsequently renamed Riley Exploration Permian, Inc.Headquartered in Oklahoma City, OKFiscal year is 10/1 – 9/30Quarterly dividend of $0.28/sh. (5.6% current annual yield(1)); record
date of April 16, 2021 with next payment date on May 7, 2021 NYSE American Ticker REPX Shares Outstanding 17.8 million Equity Market Cap (1) $355.1 million Net Debt (2) $95.6 million Enterprise
Value $450.8 million Management Team Board of Directors Bobby D. Riley Chief Executive Officer and Chairman of the Board Bobby D. Riley Chief Executive Officer and Chairman of the Board Kevin M. Riley President Michael J.
Rugen Chief Financial Officer and Director Michael J. Rugen Chief Financial Officer and Director Bryan H. Lawrence Independent Director Corey Riley Executive Vice President of Business Intelligence Brent Arriaga Independent
Director – Audit (Chair), Compensation and Nominating and Corporate Governance Committee Michael Palmer Executive Vice President of Land E. Wayne Nordberg Independent Director – Audit, Compensation (Chair) and Nominating and Corporate
Governance Committee Dividend Yield and Equity Market Cap based on 03/03/2021 closing price of $19.94 per share. Net Debt as of 12/31/20. Please refer to the Non-GAAP Financial Measures “Net Debt” in the Appendix of this presentation.
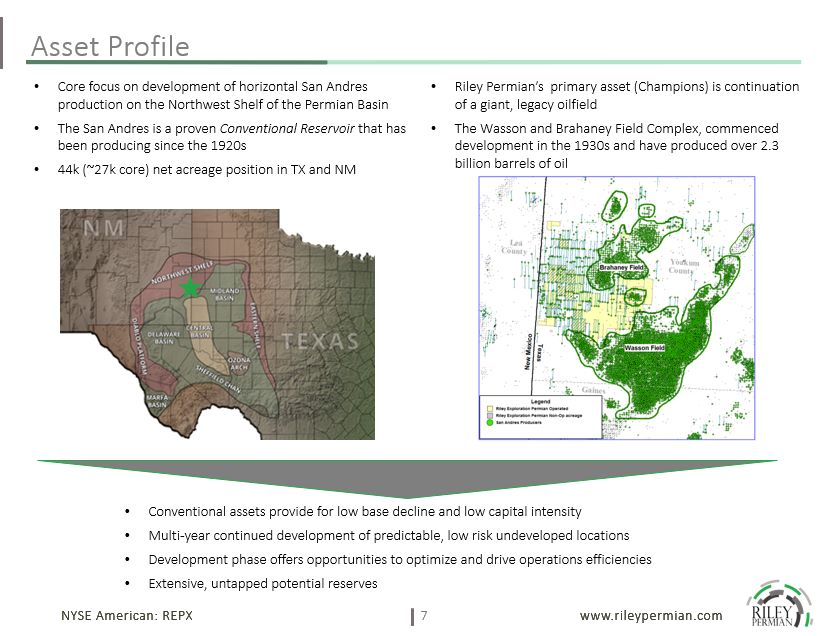
Asset Profile Core focus on development of horizontal San Andres production on the Northwest Shelf
of the Permian BasinThe San Andres is a proven Conventional Reservoir that has been producing since the 1920s44k (~27k core) net acreage position in TX and NM Riley Permian’s primary asset (Champions) is continuation of a giant, legacy
oilfieldThe Wasson and Brahaney Field Complex, commenced development in the 1930s and have produced over 2.3 billion barrels of oil Conventional assets provide for low base decline and low capital intensityMulti-year continued development
of predictable, low risk undeveloped locationsDevelopment phase offers opportunities to optimize and drive operations efficienciesExtensive, untapped potential reserves

Fiscal 1Q21 Highlights Activity Drilled 2 gross / 2 net wells, which are being completed in
2Q21Brought online 5 gross (2.7 net) wells Production 5.95 MBbls/d7.59 Mboe/d, 7% growth vs. Q420 Spending $8.8 MM total Capex48% of Discretionary Cash Flow (1) Financials $19.7 MM Adjusted EBITDAX (2)$9.7 MM Free Cash Flow, before
dividends (1) Leverage Reduced debt by $3.5MM to 1.4x Net Debt/EBITDA(3)$97.5MM outstanding on credit facility Non-GAAP financial measures. Please refer to the Non-GAAP Financial Measures “Discretionary Cash Flow” and “Free Cash Flow” in
the Appendix of this presentation.Non-GAAP financial measure. Please refer to the Non-GAAP Financial Measures “Adjusted EBITDAX” in the Appendix of this presentation.Non-GAAP financial measure. Please refer to the Non-GAAP Financial Measures
“Net Debt” in the Appendix of this presentation.

Initial Guidance for Fiscal Year 2021 Activity Drill 12 gross / 9 net wellsComplete 5 gross / 4.7
net wells Production 6.4 MBbls/d8.4 Mboe/d, 18% growth vs. FY20 Spending $52 MM total Capex65% reinvestment rate of Discretionary Cash Flow (1) (2) Financials $85 MM Adjusted EBITDAX (2) (3)$28 MM Free Cash Flow, before dividends (1)
(2) Leverage Free Cash Flow in excess of dividends to be used to further reduce Net Debt (3)Targeting 1.0x Net Leverage by 9/30/21 Non-GAAP financial measures. Please refer to the Non-GAAP Financial Measures “Discretionary Cash Flow” and
“Free Cash Flow” in the Appendix of this presentation.Based on NYMEX oil pricing as of 02/22/2021 with the impact of hedging and basin differentials, average oil price realization of $51.55.Non-GAAP financial measure. Please refer to the
Non-GAAP Financial Measures “Adjusted EBITDAX” in the Appendix of this presentation.Non-GAAP financial measure. Please refer to the Non-GAAP Financial Measures “Net Debt” in the Appendix of this presentation.

Performance Based Culture Average Daily Production (Boe/d)(1) Adjusted EBITDAX ($MM)(2) Lease
Operating Expense and Cash G&A (3) ($/Boe) Leverage Ratio (Net Debt/LTM Adj. EBITDAX)(4) Since inception, Riley Permian has delivered steady production growth, while focusing on cost control and lowering Lease Operating and G&A
(cash). One BOE is equal to six Mcf of natural gas or one Bbl of oil or NGL based on approximate energy equivalency.Non-GAAP financial measure. Please refer to the Non-GAAP Financial Measures “Adjusted EBITDAX” in the Appendix of this
presentation. Lease Operating Expenses plus Net Cash G&A (Cash G&A + Related Party Expenses – Contract Services Revenue – Net Cash G&A)Non-GAAP financial measure. Please refer to the Non-GAAP Financial Measures “Net Debt” in the
Appendix of this presentation.. Annual Results Quarterly Results Annual Results Quarterly Results Annual Results Quarterly Results Annual Results Quarterly Results

Competitive Cash Margins and Operating Costs All-in Cash Margins ($/Boe) (1) All-in Cash
Operating Costs ($/Boe) All-in cash margin calculated on a per Boe basis as total revenues after realized hedge impact, less all-in cash costs which consist of LOE, ad valorem and production taxes, Cash G&A and interest expense.

Riley Permian Reserves Summary Total Reserves by Category Proved Reserves by Category Proved
Reserves by Commodity Undeveloped 3P Locations as of September 30, 2020 Reserve Type Oil (MBbls) Natural Gas (MMcf) NGL (MBbls) Total (Mboe) Gross Horizontal Drilling Locations % by Reserve Type Net Horizontal
Drilling Locations % by Reserve Type Proved Developed Producing 19,149 31,138 5,847 30,186 Proved Undeveloped 18,009 22,546 4,834 26,601 69 30% 50 29% Total Proved
Reserves 37,158 53,684 10,681 56,786 69 30% 50 29% Probable Developed Non-Producing 704 968 210 1,075 Probable Undeveloped 41,908 52,634 11,370 62,050 117 50% 97 56% Possible
Undeveloped 9,422 9,376 2,021 13,006 47 20% 27 16% Total 3P Reserves 89,192 116,662 24,282 132,918 233 100% 174 100% SEC pricing based on the 12-month unweighted arithmetic average of the first day of the month price for
each month in the period October 2019 through September 2020. For oil and NGL volumes, the average West Texas Intermediate (WTI) spot price of $43.63 per barrel is adjusted for quality, transportation fees, and market differentials. For gas
volumes, the average Henry Hub spot price of $1.967 per MMBTU is adjusted for energy content, transportation fees, and market differentials.
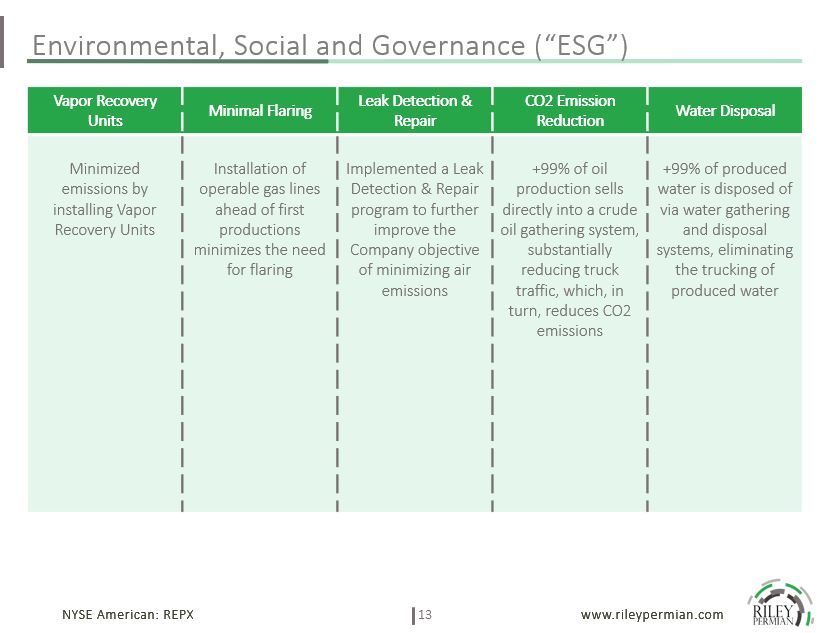
Environmental, Social and Governance (“ESG”) Vapor Recovery Units Minimal Flaring Leak Detection
& Repair CO2 Emission Reduction Water Disposal Minimized emissions by installing Vapor Recovery Units Installation of operable gas lines ahead of first productions minimizes the need for flaring Implemented a Leak Detection &
Repair program to further improve the Company objective of minimizing air emissions +99% of oil production sells directly into a crude oil gathering system, substantially reducing truck traffic, which, in turn, reduces CO2 emissions +99% of
produced water is disposed of via water gathering and disposal systems, eliminating the trucking of produced water
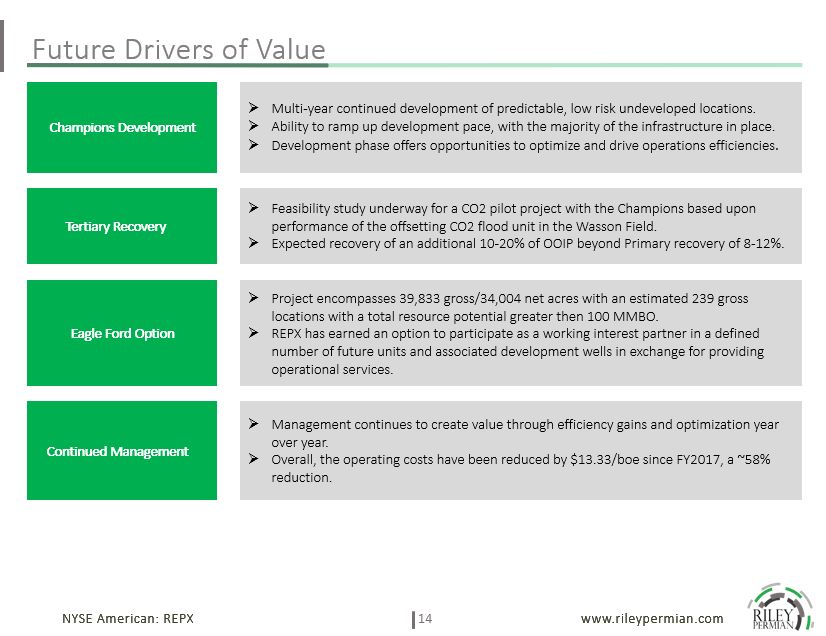
Future Drivers of Value Champions Development Multi-year continued development of predictable,
low risk undeveloped locations.Ability to ramp up development pace, with the majority of the infrastructure in place.Development phase offers opportunities to optimize and drive operations efficiencies. Tertiary Recovery Feasibility study
underway for a CO2 pilot project with the Champions based upon performance of the offsetting CO2 flood unit in the Wasson Field.Expected recovery of an additional 10-20% of OOIP beyond Primary recovery of 8-12%. Eagle Ford Option Project
encompasses 39,833 gross/34,004 net acres with an estimated 239 gross locations with a total resource potential greater then 100 MMBO.REPX has earned an option to participate as a working interest partner in a defined number of future units
and associated development wells in exchange for providing operational services. Continued Management Management continues to create value through efficiency gains and optimization year over year.Overall, the operating costs have been
reduced by $13.33/boe since FY2017, a ~58% reduction.

Appendix

Non-GAAP Financial Measures – “Adjusted EBITDAX” Adjusted EBITDAXREPX defines “Adjusted EBITDAX” as
net income (loss) adjusted for certain cash and non-cash items, including depreciation, depletion, amortization and accretion, or DD&A, impairment of long-lived assets, provision for the carrying value of assets, exploration expenses,
commodity derivative (gain) loss, settlements on commodity derivatives, premiums paid for derivatives that settled during the period, unit-based compensation expense, amortization of debt discount and debt issuance costs included in interest
expense, income taxes, and non-recurring charges. Adjusted EBITDAX should not be considered as an alternative to, or more meaningful than, net income as determined in accordance with GAAP or as an indicator of REPX’s operating performance.
Certain items excluded from Adjusted EBITDAX are significant components in understanding and assessing a company’s financial performance, such as a company’s cost of capital and tax structure, as well as the historic costs of depreciable
assets, none of which are components of Adjusted EBITDAX. REPX’s computations of Adjusted EBITDAX may not be comparable to other similarly titled measures of other companies. Non-GAAP Financial MeasureAdjusted EBITDAX is not a measure of net
income (loss) as determined by United States generally accepted accounting principles, or GAAP. Adjusted EBITDAX is a supplemental non-GAAP financial measure that is used by management and external users of financial statements, such as
industry analysts, investors, lenders and rating agencies. REPX management believes Adjusted EBITDAX is useful because it allows us to more effectively evaluate our operating performance and compare the results of our operations from period
to period without regard to our financing methods or capital structure. REPX excludes the items listed above from net income (loss) in arriving at Adjusted EBITDAX because these amounts can vary substantially from company to company within
REPX’s industry depending upon accounting methods and book values of assets, capital structures and the method by which the assets were acquired. Certain items excluded from Adjusted EBITDAX are significant components in understanding and
assessing a company’s financial performance, such as a company’s cost of capital, hedging strategy and tax structure, as well as the historic costs of depreciable assets, none of which are components of Adjusted EBITDAX. REPX’s computations
of Adjusted EBITDAX may not be comparable to other similarly titled measure of other companies. REPX believes that Adjusted EBITDAX is a widely followed measure of operating performance.The following table provides a reconciliation from the
GAAP measure of Net Income (Loss) to Adjusted EBITDAX. Adjusted EBITDAX ($ in 000s) Reconciliation Reconciliation of Net Income (Loss) to Adjusted EBITDAX FQ1 2021 FY 2020 FY 2019 FY 2018 Net Income (Loss) $ (7,941) $ 35,144 $
51,866 $ (723) Exploration expense 424 9,923 5,074 5,992 Depletion, depreciation, amortization and accretion 5,990 21,479 20,182 15,714 Unit-based compensation expense 413 963 898 4,000 Transaction
costs 1,049 1,431 4,553 878 Interest expense 1,235 5,299 4,924 1,707 Unrealized Gain (Loss) on Derivatives 19,082 (6,962) (26,198) 9,616 Income Tax Expense (Benefit) (515) 718 1,410 -
Restructuring Costs - 392 - - Adjusted EBITDAX $ 19,737 $ 68,387 $ 62,709 $ 37,184
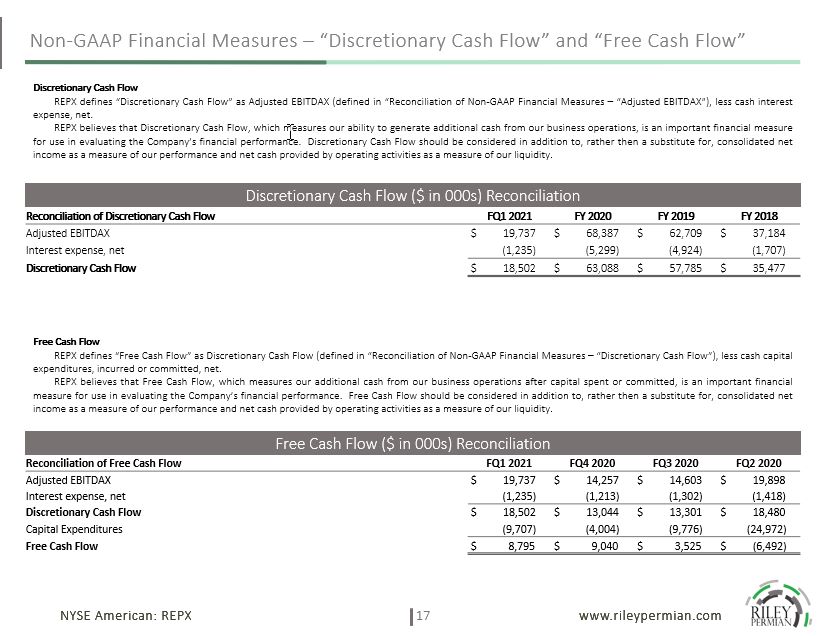
Non-GAAP Financial Measures – “Discretionary Cash Flow” and “Free Cash Flow” Discretionary Cash
FlowREPX defines “Discretionary Cash Flow” as Adjusted EBITDAX (defined in “Reconciliation of Non-GAAP Financial Measures – “Adjusted EBITDAX”), less cash interest expense, net.REPX believes that Discretionary Cash Flow, which measures our
ability to generate additional cash from our business operations, is an important financial measure for use in evaluating the Company’s financial performance. Discretionary Cash Flow should be considered in addition to, rather then a
substitute for, consolidated net income as a measure of our performance and net cash provided by operating activities as a measure of our liquidity. Discretionary Cash Flow ($ in 000s) Reconciliation Reconciliation of Discretionary Cash
Flow FQ1 2021 FY 2020 FY 2019 FY 2018 Adjusted EBITDAX $ 19,737 $ 68,387 $ 62,709 $ 37,184 Interest expense, net (1,235) (5,299) (4,924) (1,707) Discretionary Cash Flow $ 18,502 $ 63,088 $ 57,785 $ 35,477
Free Cash FlowREPX defines “Free Cash Flow” as Discretionary Cash Flow (defined in “Reconciliation of Non-GAAP Financial Measures – “Discretionary Cash Flow”), less cash capital expenditures, incurred or committed, net.REPX believes that
Free Cash Flow, which measures our additional cash from our business operations after capital spent or committed, is an important financial measure for use in evaluating the Company’s financial performance. Free Cash Flow should be considered
in addition to, rather then a substitute for, consolidated net income as a measure of our performance and net cash provided by operating activities as a measure of our liquidity. Free Cash Flow ($ in 000s) Reconciliation Reconciliation of
Free Cash Flow FQ1 2021 FQ4 2020 FQ3 2020 FQ2 2020 Adjusted EBITDAX $ 19,737 $ 14,257 $ 14,603 $ 19,898 Interest expense, net (1,235) (1,213) (1,302) (1,418) Discretionary Cash Flow $ 18,502 $ 13,044 $
13,301 $ 18,480 Capital Expenditures (9,707) (4,004) (9,776) (24,972) Free Cash Flow $ 8,795 $ 9,040 $ 3,525 $ (6,492)

Non-GAAP Financial Measures – “Net Debt” Net Debt The Company defines net debt as debt less cash and
cash equivalents. Net debt should not be considered an alternative to, or more meaningful then, total debt, the most directly comparable GAAP measure. Management uses net debt to determine the Company’s outstanding debt obligations that would
not be readily satisfied by its cash and cash equivalents on hand. The Company believes this metric is useful to analysts and investors in determining the Company’s leverage position because the Company has the ability to, and may decide to,
use a portion of its cash and cash equivalents to reduce debt. The following table provides a reconciliation from the GAAP measure of total Long-term debt to Net Debt. Net Debt ($ in 000s) Reconciliation Reconciliation of Net Debt FQ1
2021 FY 2020 FY 2019 Long-term debt $ 97,500 $ 101,000 $ 97,000 Cash and cash equivalents 1,877 1,660 3,726 Net Debt $ 95,623 $ 99,340 $ 93,274

Leadership Team Bobby Riley, Chief Executive Officer and Chairman of the BoardMr. Riley was
appointed as the Chairman of REP’s board of managers, President and Chief Executive Officer in June 2016. Mr. Riley also served as the Chief Executive Officer of REG from when it was founded in 2012 to May 1, 2018. Prior to joining REP,
Mr. Riley was the Chairman and Chief Executive Officer of Riley Exploration, LLC, or REX, since he founded REX in 2007 through 2012. Mr. Riley has nearly 40 years of experience in the independent oil and gas sector, in North America, South
America, Europe, Africa and Asia. He has an extensive background in all aspects of oil and gas management and operations, including drilling, completion, work-over and production. In addition to his management and operational expertise, he
has designed and patented specialized completion equipment that was licensed to Baker-Hughes and participated in the design, development and testing of Intelligent Well Bore Systems, which was sold to Weatherford International in 2000. In
2009, Mr. Riley created a joint venture with a private equity group to invest in unconventional oil and gas plays and deployed over $350.0 million of debt and equity capital in the Eagle Ford Shale and the Permian Basin. The joint venture
acquired approximately 50,000 acres of prime leasehold acreage, drilled and completed over 40 wells and reached peak production of 4,000 BOE/d. From 2005 to 2007 Mr. Riley was Vice President of Operations at Activa Resources, Inc., or Activa,
a publicly-traded exploration and production company. From 2002 to 2005, he was Managing Partner of Tuleta Energy Partners, LLC, a privately-held exploration and production company, until it was acquired by Activa Resources, Inc. From 1991 to
2001 Mr. Riley was President of an oil and gas service company specializing in well design and reservoir data acquisition, that was active in Nigeria, Venezuela, and Norway. He founded his first independent exploration and production company,
Durango Energy, Inc., in 1984, and operated up to 150 wells in Oklahoma. Prior to that he was District Manager of Monitoring Systems Inc., a drilling and well control instrumentation company, installing equipment on jack-up rigs and
semi-submersibles in the U.S., Brazil and Korea. Mr. Riley began his oil and gas career with Cameron Iron Works in Houston, Texas, in 1974. Mr. Riley has a bachelor’s degree in Business, Accounting and Finance from the University of Science
& Arts of Oklahoma and completed the Advanced Drilling Operations and Well Control program at Murchison Drilling Schools. He is a member of the American Petroleum Institute and the Society of Professional Engineers and is IADC / MMS
Well-Cap Certified. Kevin Riley, PresidentMr. Riley was appointed as REP’s President on January 23, 2020, prior to that he had served as REP’s Executive Vice President and Chief Operating Officer since June 2016. Prior to joining REP,
Mr. Kevin Riley served in various roles, including Chief Operating Officer of REG from when it was founded in 2012 through 2016. He led the successful acquisition and development of REG’s +50,000 acres located across three active operating
areas: the Permian Basin, Eagle Ford Shale and Arkoma-Woodford Shale. From 2007 to 2012, Mr. Kevin Riley was the Chief Operating Officer of REX. Mr. Kevin Riley co-founded REX in 2007, which developed early entrant positions into the
Wolfberry trend of the Permian Basin and the Eagle Ford Shale in Karnes County. He had direct oversight of REP’s land, drilling, completion and production activities, which included more than 70,000 acres under lease and +50 operated
horizontal wells via a multi-rig drilling program. Mr. Kevin Riley holds a degree in Business Administration from the University of Central Oklahoma and a Master of Business Administration with emphasis in Energy from the University of
Oklahoma. He is a member of the Independent Petroleum Association of America, American Association of Petroleum Landmen and the Society of Petroleum Engineers.Michael J. Rugen, Chief Financial OfficerMr. Rugen was named Chief Financial
Officer of Tengasco, Inc. (“TGC”) in September 2009 and as interim Chief Executive Officer in June 2013. Mr. Rugen is a certified public accountant (Texas) with over 35 years of experience in exploration, production and oilfield service.
Prior to joining TGC, Mr. Rugen spent 2 years as Vice President of Accounting and Finance for Nighthawk Oilfield Services. From 2001 to June 2007, he was a Manager/Sr. Manager with UHY Advisors, primarily responsible for managing internal
audit and Sarbanes-Oxley 404 engagements for various oil and gas clients. In 1999 and 2000, Mr. Rugen provided finance and accounting consulting services with Jefferson Wells International. From 1982 to 1998, Mr. Rugen held various accounting
and management positions at BHP Petroleum, with accounting responsibilities for onshore and offshore US operations as well as operations in Trinidad and Bolivia. Mr. Rugen earned a Bachelor of Science in Accounting in 1982 from Indiana
University.

Leadership Team (cont’d) Corey Riley, Executive Vice President of Business IntelligenceMr. Riley
joined REP in April of 2019 as Executive Vice President of Business Intelligence and is responsible for the strategies and technologies used by the organization to collect, integrate and analyze business information to support the
organizations strategic decisions. Mr. Corey Riley has a diverse experience in technology, accounting, finance, corporate planning, management and executive leadership. Prior to joining REP, he was the Chief Financial Officer of REG from when
it was founded in 2012 through mid-2015 when he was promoted to President and served in that role through 2019. Mr. Corey Riley co-founded REX in 2007, the predecessor to REG and was involved with the company until 2012. Mr. Corey Riley holds
a bachelor’s degree in Biology from the University of Central Oklahoma and a Master of Business Administration with a focus in Technology from Oklahoma Christian University.Michael Palmer, Executive Vice President of LandMr. Palmer joined REP
as Executive Vice President Corporate Land in April 2017. Prior to joining REP, Mr. Michael Palmer worked for Continental Resources, Inc. as Manager over their Mid-Continent mineral acquisition company and previously as Land Supervisor of its
Bakken assets in North Dakota and Montana. He was employed more than 10 years in similar capacities at SandRidge Energy, Inc., Encore Acquisition Company and Hanna Oil & Gas, working predominately in the Permian Basin as well as Montana,
Kansas, Oklahoma and Arkansas. Mr. Michael Palmer holds a B.B.A. in Energy Management and Finance from the University of Oklahoma and is an active member of the AAPL and OCAPL.

Board of Directors Bobby Riley (see previous slide)Mike Rugen (see previous slide)Brent ArriagaMr.
Arriaga is the Corporate Controller of Helix Energy Solutions Group, Inc., an offshore energy service company. Mr. Arriaga has over 20 years of experience in finance and accounting in the energy and financial services industries spanning
several continents. Prior to his role at Helix, Mr. Arriaga held roles in financial accounting and controllership at Weatherford International, Citigroup, Inc., and Credit Suisse Group. Mr. Arriaga began his career as an auditor at KPMG LLP.
Mr. Arriaga holds a Bachelor of Business Administration in Accounting from the University of Texas at Austin and a Master of Business Administration from Rice University, Jesse H. Jones Graduate School of Business, where he was a Jones
Scholar. Mr. Arriaga is a Certified Public Accountant in the State of Texas and is a Chartered Financial Analyst.Bryan LawrenceMr. Lawrence was appointed as a member of REP’s board of managers in June 2016. Mr. Lawrence is a founder and
senior manager of Yorktown Partners, LLC, the investment manager of the Yorktown Partners group of investment funds, which make investments in companies engaged in the energy industry and has served in such positions since 1982. The Yorktown
Partners investment funds were formerly affiliated with the investment firm of Dillon, Read & Co. Inc. where Mr. Lawrence had been employed since 1966, serving as Managing Director until the merger of Dillon Read with SBC Warburg in
September 1997. Mr. Lawrence also serves as a director of Carbon Energy Corporation, Hallador Energy Company, Ramaco Resources, Inc. and general partner of Star Group, L.P. (each a United States publicly traded company) and certain non-public
companies in the energy industry in which Yorktown Partners investment funds hold equity interest. Mr. Lawrence is a graduate of Hamilton College and also has an M.B.A. from Columbia University.E. Wayne NordbergMr. Nordberg is currently the
Chairman and Chief Investment Officer of Hollow Brook Wealth Management, LLC, a private investment management firm serving family offices, foundations, charities and pensions, and has served in such positions since 1995. He has over 50 years
of experience in investment research and portfolio management. From 2003 to 2007, Mr. Nordberg was a Senior Director at Ingalls & Snyder, LLC, a privately owned registered investment advisor. He also formerly served on the Board of
Directors of Lord, Abbett & Co., a mutual fund family, from 1988 to 1998. Mr. Nordberg also serves as an independent director of The Reeves Utility Income Fund, a $1 billion closed end investment trust listed on the NYSE, specializing in
energy companies.