Attached files
| file | filename |
|---|---|
| 8-K - 8-K - Santander Holdings USA, Inc. | q42020santanderholdingsusa.htm |

Fixed Income Investor Presentation Fourth Quarter and Full Year 2020 March 3, 2021 SANTANDER HOLDINGS USA, INC.
2 DISCLAIMER This presentation of Santander Holdings USA, Inc. (“SHUSA”) contains “forward-looking statements” within the meaning of the Private Securities Litigation Reform Act of 1995 regarding the financial condition, results of operations, business plans and future performance of SHUSA. Words such as “may,” “could,” “should,” “will,” “believe,” “expect,” “anticipate,” “estimate,” “intend,” “plan,” “goal” or similar expressions are intended to indicate forward-looking statements. In this presentation, we may sometimes refer to certain non-GAAP figures or financial ratios to help illustrate certain concepts. These ratios, each of which is defined in this document, if utilized, may include Pre- Tax Pre- Provision Income, the Tangible Common Equity to Tangible Assets Ratio, and the Texas Ratio. This information supplements our results as reported in accordance with generally accepted accounting principles (“GAAP”) and should not be viewed in isolation from, or as a substitute for, our GAAP results. We believe that this additional information and the reconciliations we provide may be useful to investors, analysts, regulators and others as they evaluate the impact of these items on our results for the periods presented due to the extent to which the items are indicative of our ongoing operations. Where applicable, we provide GAAP reconciliations for such additional information. SHUSA’s subsidiaries include Banco Santander International (“BSI”), Santander Investment Securities, Inc. (“SIS”), Santander Securities LLC (“SSLLC”), Santander Financial Services, Inc. (“SFS”), and Santander Asset Management, LLC, as well as several other subsidiaries. Although SHUSA believes that the expectations reflected in these forward-looking statements are reasonable as of the date on which the statements are made, these statements are not guarantees of future performance and involve risks and uncertainties based on various factors and assumptions, many of which are beyond SHUSA’s control. Among the factors that could cause SHUSA’s financial performance to differ materially from that suggested by forward-looking statements are: (1) the adverse impact of a novel strain of coronavirus (“COVID-19”) on our business, financial condition, liquidity and results of operations; (2) the effects of regulation, actions and/or policies of the Federal Reserve, the Federal Deposit Insurance Corporation (the "FDIC"), the Office of the Comptroller of the Currency (the “OCC”) and the Consumer Financial Protection Bureau (the “CFPB”), and other changes in monetary and fiscal policies and regulations, including policies that affect market interest rates and money supply, actions related to COVID-19 as well as in the impact of changes in and interpretations of GAAP, including adoption of the Financial Accounting Standards Board’s current expected credit losses credit reserving framework, the failure to adhere to which could subject SHUSA and/or its subsidiaries to formal or informal regulatory compliance and enforcement actions and result in fines, penalties, restitution and other costs and expenses, changes in our business practices, and reputational harm; (3) SHUSA’s ability to manage credit risk that may increase to the extent our loans are concentrated by loan type, industry segment, borrower type or location of the borrower of collateral; (4) the extent of recessionary conditions in the U.S. related to COVID-19 and the strength of the U.S. economy in general and regional and local economies in which SHUSA conducts operations in particular, which may affect, among other things, the level of non-performing assets, charge-offs, and provisions for credit losses; (5) acts of God, including pandemics and other significant public health emergencies, and other natural or man-made disasters and SHUSA’s ability to deal with disruptions caused by such acts, emergencies, and disasters; (6) inflation, interest rate, market and monetary fluctuations, including effects from the pending discontinuation of the London Interbank Offered Rate as an interest rate benchmark, may, among other things, reduce net interest margins, and impact funding sources and the ability to originate and distribute financial products in the primary and secondary markets; (7) the pursuit of protectionist trade or other related policies, including tariffs by the U.S., its global trading partners, and/or other countries, and/or trade disputes generally; (8) the ability of certain European member countries to continue to service their debt and the risk that a weakened European economy could negatively affect U.S.-based financial institutions, counterparties with which SHUSA does business, as well as the stability of global financial markets, including economic instability and recessionary conditions in Europe and negative economic effects related to the exit of the United Kingdom from the European Union; (9) adverse movements and volatility in debt and equity capital markets and adverse changes in the securities markets, including those related to the financial condition of significant issuers in SHUSA’s investment portfolio; (10) SHUSA's ability to grow revenue, manage expenses, attract and retain highly-skilled people and raise capital necessary to achieve its business goals and comply with regulatory requirements; (11) SHUSA’s ability to effectively manage its capital and liquidity, including approval of its capital plans by its regulators and its subsidiaries’ ability to pay dividends to it; (12) changes in credit ratings assigned to SHUSA or its subsidiaries that could change the cost of funding or limit our access to capital markets; (13) the ability to manage risks inherent in our businesses, including through effective use of systems and controls, insurance, derivatives and capital management; (14) SHUSA’s ability to timely develop competitive new products and services in a changing environment that are responsive to the needs of SHUSA's customers and are profitable to SHUSA, the success of our marketing efforts to customers, and the potential for new products and services to impose additional unexpected costs, losses or other liabilities not anticipated at their initiation, and expose SHUSA to increased operational risk; (15) competitors of SHUSA may have greater financial resources or lower costs, or be subject to different regulatory requirements than SHUSA, may innovate more effectively, or may develop products and technology that enable those competitors to compete more successfully than SHUSA and cause SHUSA to lose business or market share and impact our net income adversely; (16) Santander Consumer USA Inc.’s (“SC’s”) agreement with Fiat Chrysler Automobiles US LLC (“FCA”) may not result in currently anticipated levels of growth and is subject to certain conditions that could result in termination of the agreement; (17) changes in customer spending, investment or savings behavior; (18) loss of customer deposits that could increase our funding costs; (19) the ability of SHUSA and its third-party vendors to convert, maintain and upgrade, as necessary, SHUSA’s data processing and other information technology (“IT”) infrastructure on a timely and acceptable basis, within projected cost estimates and without significant disruption to our business; (20) SHUSA’s ability to control operational risks, data security breach risks and outsourcing risks, and the possibility of errors in quantitative models and software SHUSA uses to manage its business, including as a result of cyber-attacks, technological failure, human error, fraud or malice, and the possibility that SHUSA’s controls will prove insufficient, fail or be circumvented; (21) changes to tax laws and regulations and the outcome of ongoing tax audits by federal, state and local income tax authorities that may require SHUSA to pay additional taxes or recover fewer overpayments compared to what has been accrued or paid as of period-end; (22) the costs and effects of regulatory or judicial actions or proceedings, including possible business restrictions resulting from such actions or proceedings; and (23) adverse publicity and negative public opinion, whether specific to SHUSA or regarding other industry participants or industry-wide factors, or other reputational harm; and (24) acts of terrorism or domestic or foreign military conflicts; and (26) the other factors that are described in Part I, Item IA – Risk Factors of SHUSA’s 2020 Annual Report on Form 10-K. Because this information is intended only to assist investors, it does not constitute investment advice or an offer to invest, and in making this presentation available, SHUSA gives no advice and makes no recommendation to buy, sell, or otherwise deal in shares or other securities of Banco Santander, S.A. (“Santander”), SHUSA, Santander Bank, N.A. (“Santander Bank” or “SBNA”), SC or any other securities or investments. It is not our intention to state, indicate, or imply in any manner that current or past results are indicative of future results or expectations. As with all investments, there are associated risks, and you could lose money investing. Prior to making any investment, a prospective investor should consult with its own investment, accounting, legal, and tax advisers to evaluate independently the risks, consequences, and suitability of that investment. No offering of securities shall be made in the United States except pursuant to registration under the U.S. Securities Act of 1933, as amended, or an exemption therefrom.
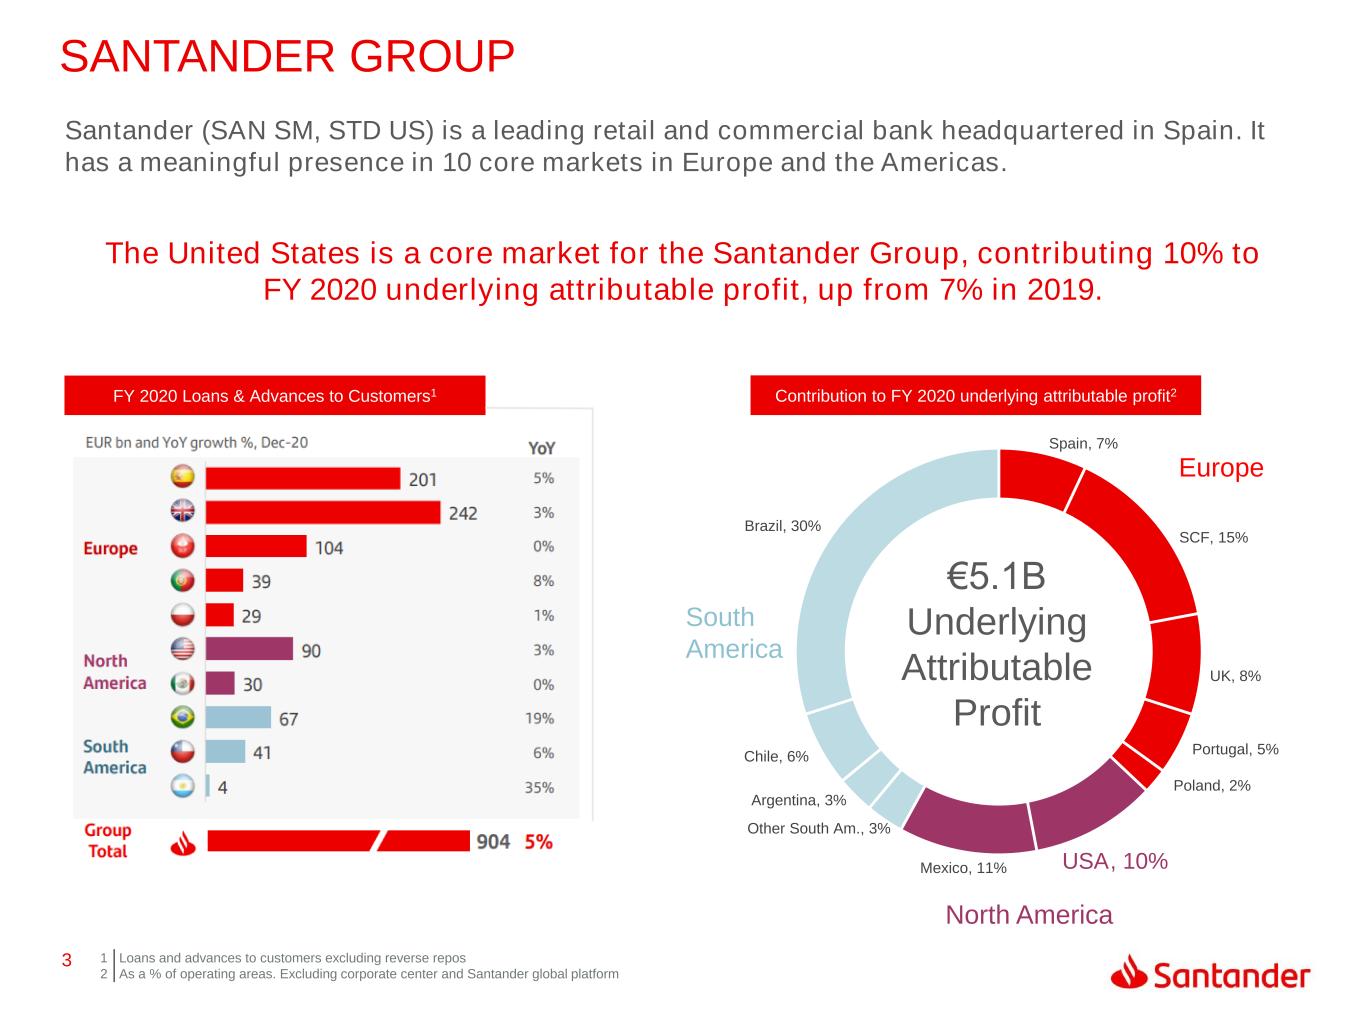
3 Spain, 7% SCF, 15% UK, 8% Portugal, 5% Poland, 2% USA, 10%Mexico, 11% Other South Am., 3% Argentina, 3% Chile, 6% Brazil, 30% SANTANDER GROUP The United States is a core market for the Santander Group, contributing 10% to FY 2020 underlying attributable profit, up from 7% in 2019. 1 2 Loans and advances to customers excluding reverse repos As a % of operating areas. Excluding corporate center and Santander global platform FY 2020 Loans & Advances to Customers1 Europe South America North America Contribution to FY 2020 underlying attributable profit2 €5.1B Underlying Attributable Profit Santander (SAN SM, STD US) is a leading retail and commercial bank headquartered in Spain. It has a meaningful presence in 10 core markets in Europe and the Americas.
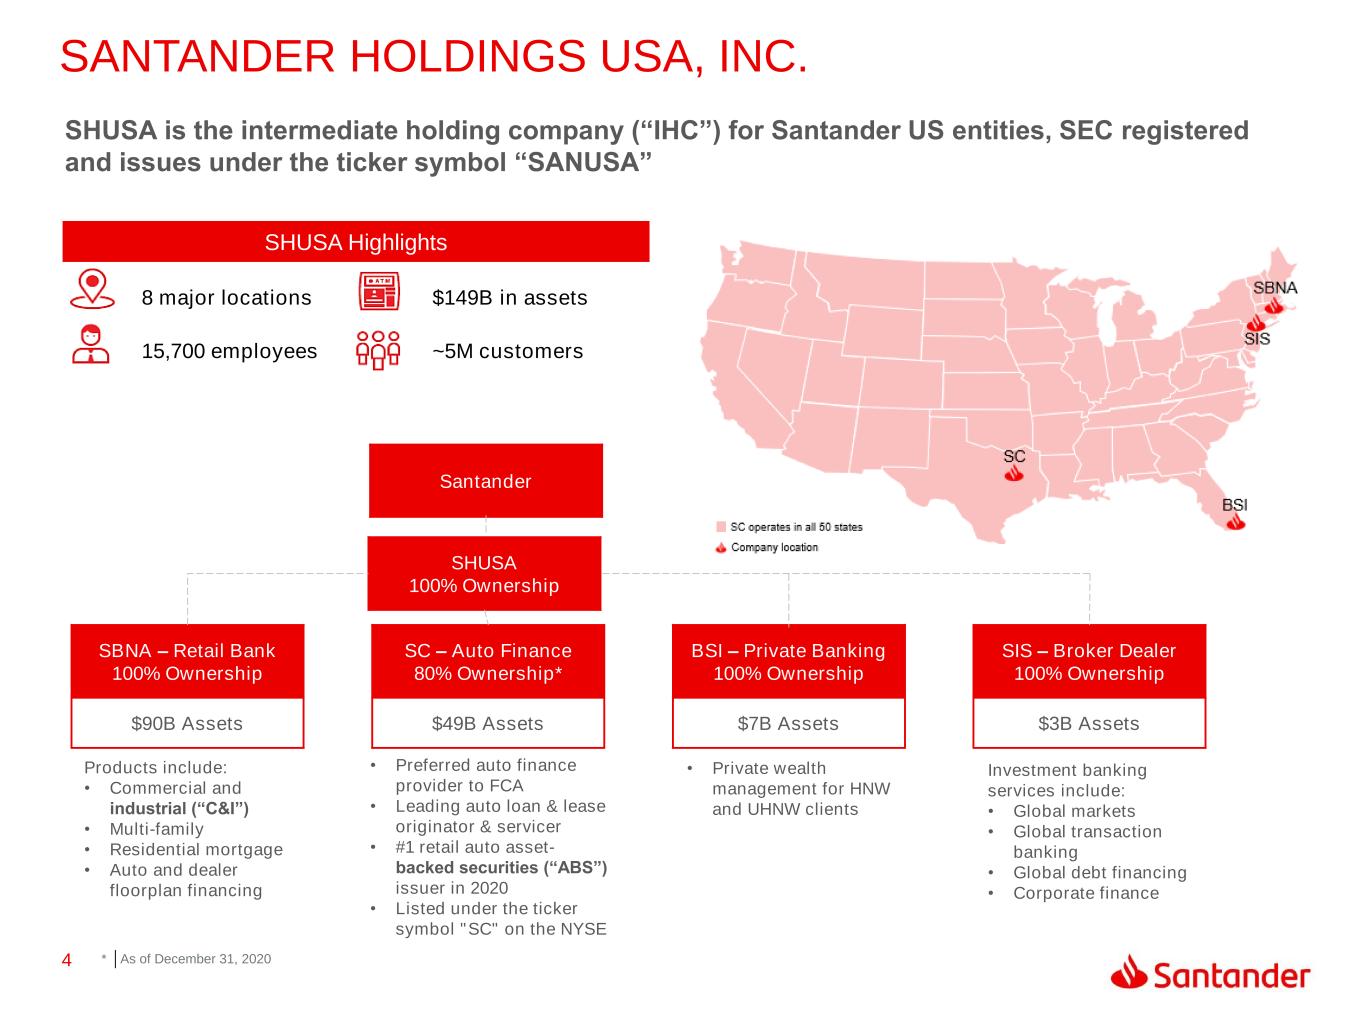
4 SANTANDER HOLDINGS USA, INC. SHUSA Highlights 15,700 employees ~5M customers $149B in assets8 major locations SHUSA is the intermediate holding company (“IHC”) for Santander US entities, SEC registered and issues under the ticker symbol “SANUSA” SHUSA 100% Ownership SBNA – Retail Bank 100% Ownership $90B Assets SC – Auto Finance 80% Ownership* $49B Assets BSI – Private Banking 100% Ownership $7B Assets SIS – Broker Dealer 100% Ownership $3B Assets Products include: • Commercial and industrial (“C&I”) • Multi-family • Residential mortgage • Auto and dealer floorplan financing • Preferred auto finance provider to FCA • Leading auto loan & lease originator & servicer • #1 retail auto asset- backed securities (“ABS”) issuer in 2020 • Listed under the ticker symbol "SC" on the NYSE • Private wealth management for HNW and UHNW clients Investment banking services include: • Global markets • Global transaction banking • Global debt financing • Corporate finance * As of December 31, 2020 Santander
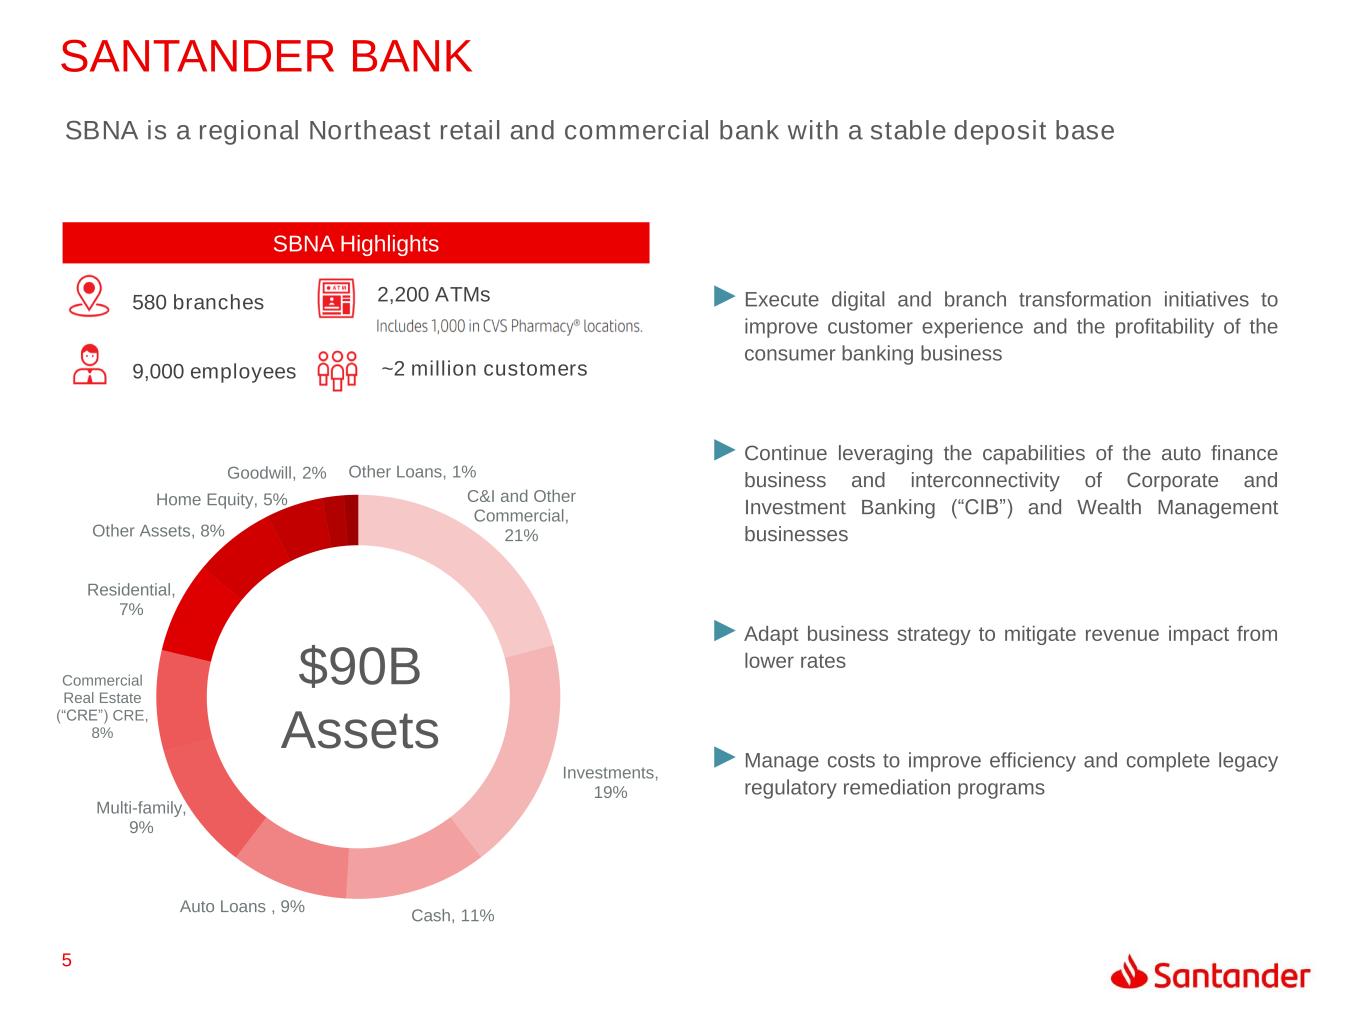
5 C&I and Other Commercial, 21% Investments, 19% Cash, 11% Auto Loans , 9% Multi-family, 9% Commercial Real Estate (“CRE”) CRE, 8% Residential, 7% Other Assets, 8% Home Equity, 5% Goodwill, 2% Other Loans, 1% SANTANDER BANK SBNA Highlights SBNA is a regional Northeast retail and commercial bank with a stable deposit base $90B Assets 580 branches ~2 million customers9,000 employees 2,200 ATMs ► Execute digital and branch transformation initiatives to improve customer experience and the profitability of the consumer banking business ► Continue leveraging the capabilities of the auto finance business and interconnectivity of Corporate and Investment Banking (“CIB”) and Wealth Management businesses ► Adapt business strategy to mitigate revenue impact from lower rates ► Manage costs to improve efficiency and complete legacy regulatory remediation programs
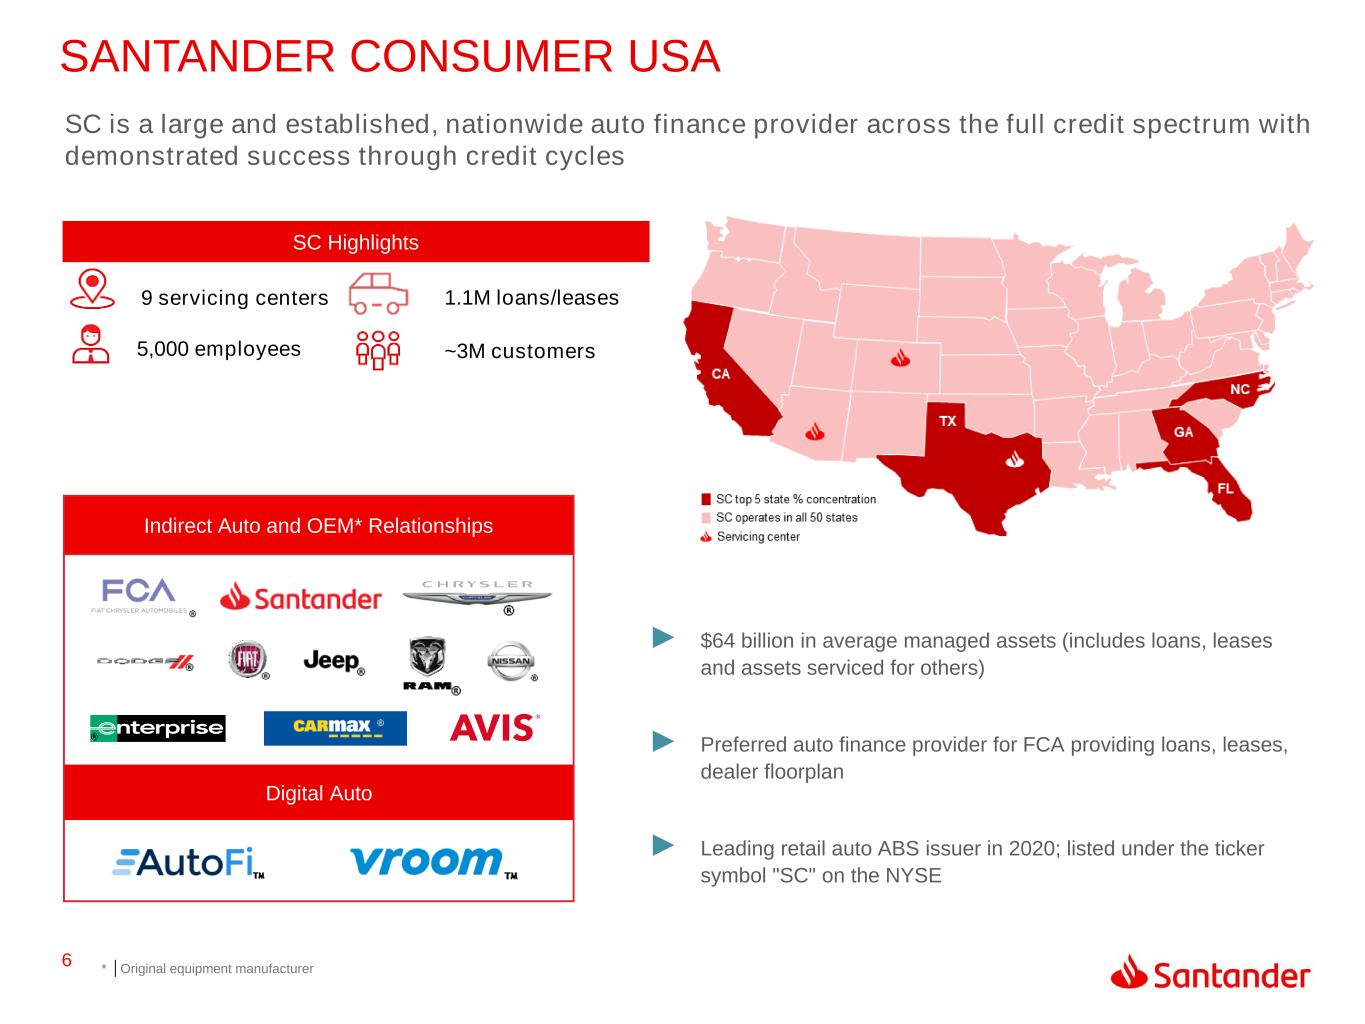
6 Digital Auto SANTANDER CONSUMER USA SC Highlights 5,000 employees ~3M customers 1.1M loans/leases9 servicing centers SC is a large and established, nationwide auto finance provider across the full credit spectrum with demonstrated success through credit cycles Indirect Auto and OEM* Relationships ► $64 billion in average managed assets (includes loans, leases and assets serviced for others) ► Preferred auto finance provider for FCA providing loans, leases, dealer floorplan ► Leading retail auto ABS issuer in 2020; listed under the ticker symbol "SC" on the NYSE * Original equipment manufacturer
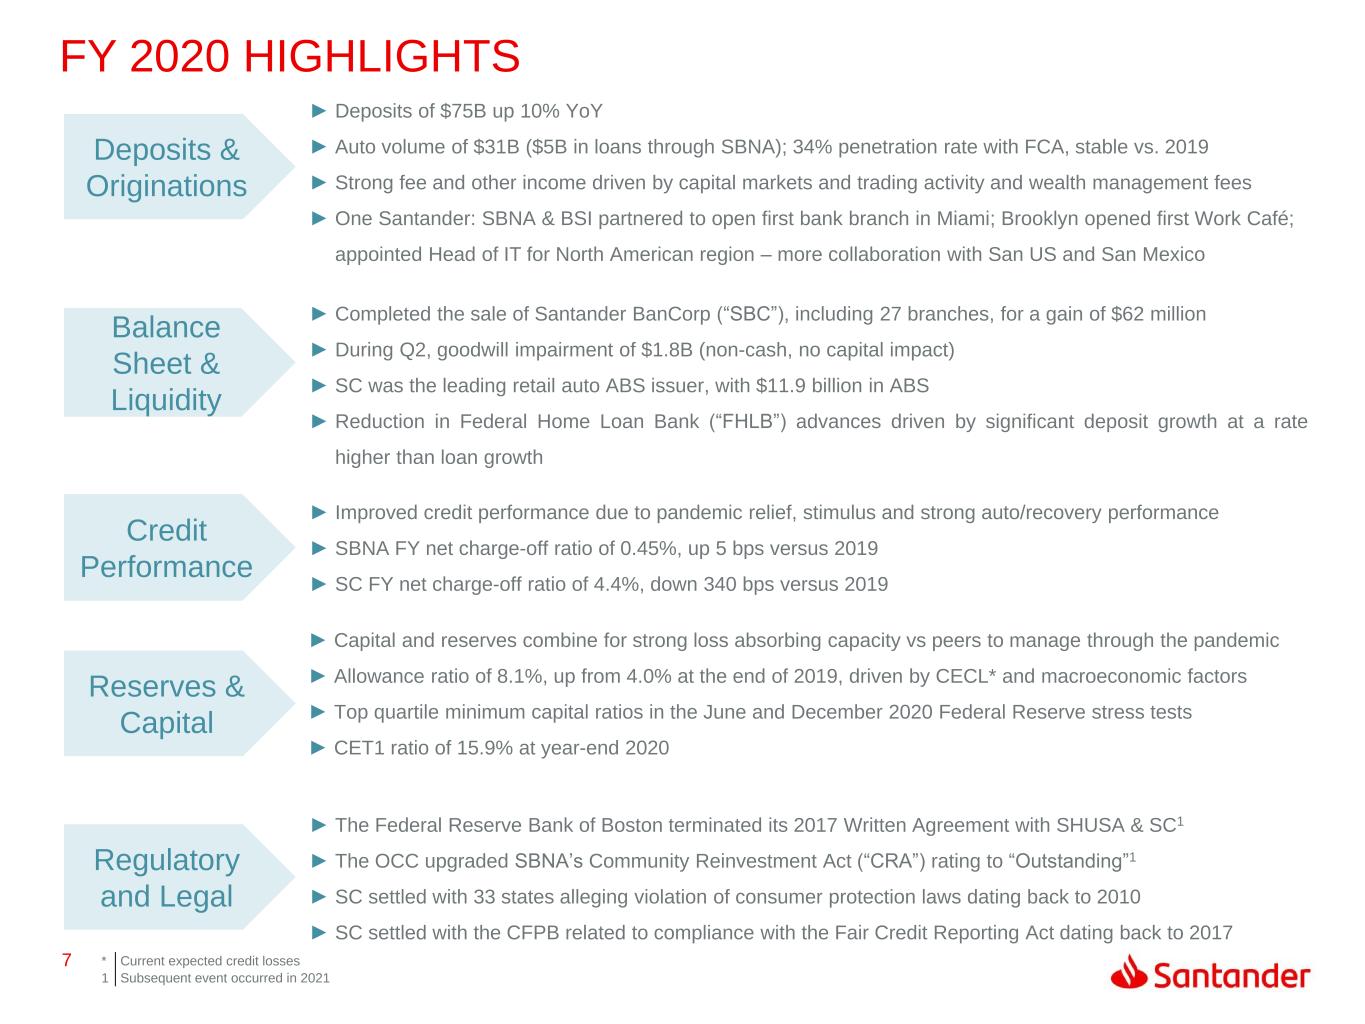
7 ► The Federal Reserve Bank of Boston terminated its 2017 Written Agreement with SHUSA & SC1 ► The OCC upgraded SBNA’s Community Reinvestment Act (“CRA”) rating to “Outstanding”1 ► SC settled with 33 states alleging violation of consumer protection laws dating back to 2010 ► SC settled with the CFPB related to compliance with the Fair Credit Reporting Act dating back to 2017 FY 2020 HIGHLIGHTS Credit Performance Deposits & Originations Balance Sheet & Liquidity Reserves & Capital ► Deposits of $75B up 10% YoY ► Auto volume of $31B ($5B in loans through SBNA); 34% penetration rate with FCA, stable vs. 2019 ► Strong fee and other income driven by capital markets and trading activity and wealth management fees ► One Santander: SBNA & BSI partnered to open first bank branch in Miami; Brooklyn opened first Work Café; appointed Head of IT for North American region – more collaboration with San US and San Mexico ► Capital and reserves combine for strong loss absorbing capacity vs peers to manage through the pandemic ► Allowance ratio of 8.1%, up from 4.0% at the end of 2019, driven by CECL* and macroeconomic factors ► Top quartile minimum capital ratios in the June and December 2020 Federal Reserve stress tests ► CET1 ratio of 15.9% at year-end 2020 Regulatory and Legal ► Completed the sale of Santander BanCorp (“SBC”), including 27 branches, for a gain of $62 million ► During Q2, goodwill impairment of $1.8B (non-cash, no capital impact) ► SC was the leading retail auto ABS issuer, with $11.9 billion in ABS ► Reduction in Federal Home Loan Bank (“FHLB”) advances driven by significant deposit growth at a rate higher than loan growth ► Improved credit performance due to pandemic relief, stimulus and strong auto/recovery performance ► SBNA FY net charge-off ratio of 0.45%, up 5 bps versus 2019 ► SC FY net charge-off ratio of 4.4%, down 340 bps versus 2019 * Current expected credit losses 1 Subsequent event occurred in 2021
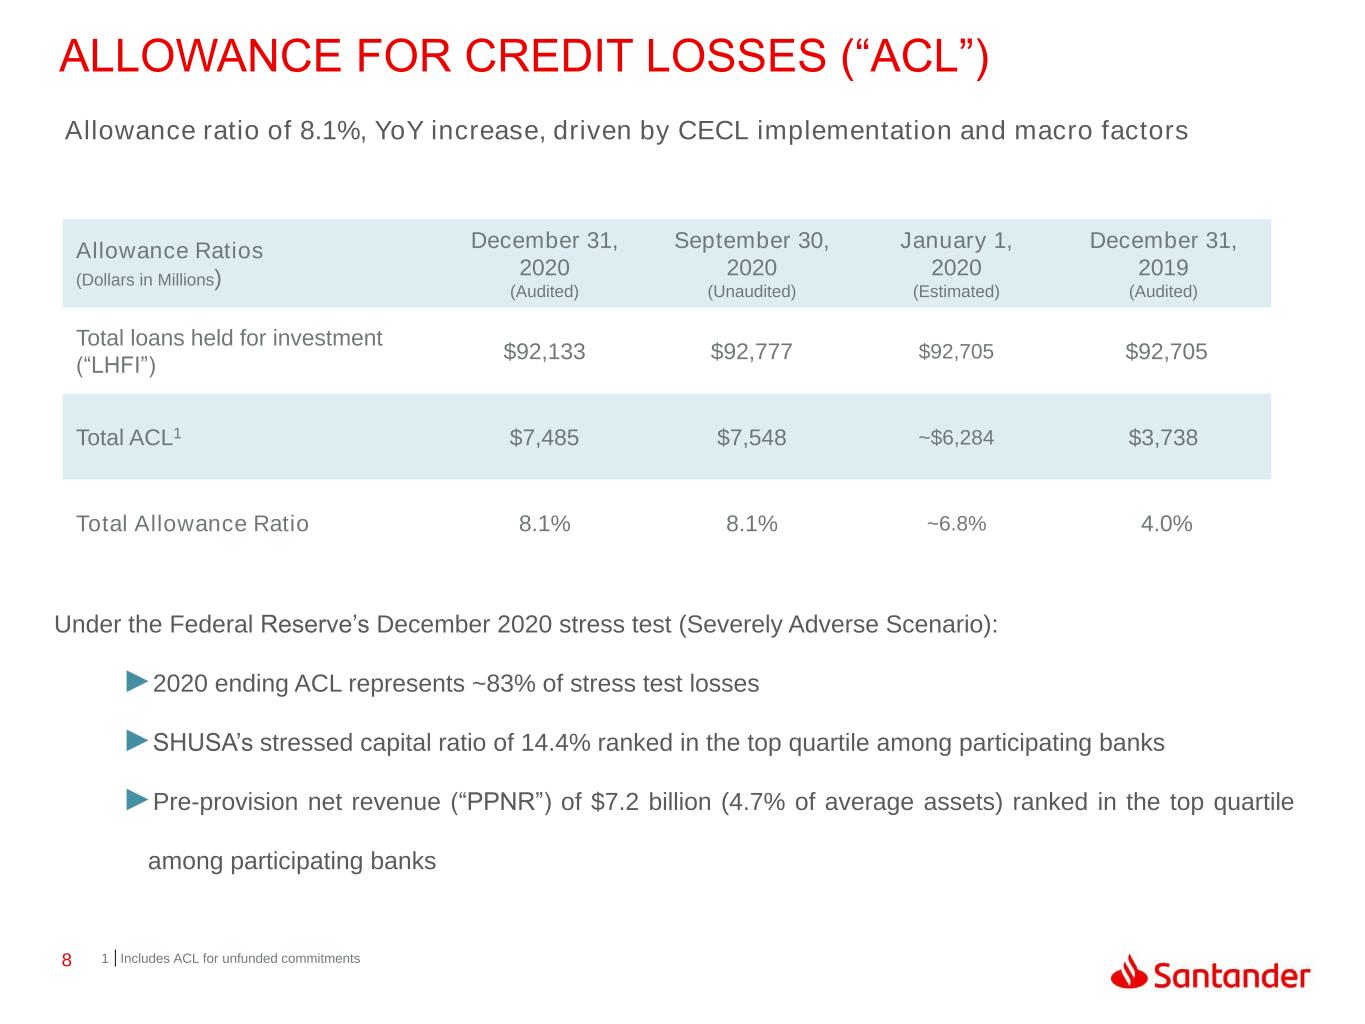
8 ALLOWANCE FOR CREDIT LOSSES (“ACL”) Allowance Ratios (Dollars in Millions) December 31, 2020 (Audited) September 30, 2020 (Unaudited) January 1, 2020 (Estimated) December 31, 2019 (Audited) Total loans held for investment (“LHFI”) $92,133 $92,777 $92,705 $92,705 Total ACL1 $7,485 $7,548 ~$6,284 $3,738 Total Allowance Ratio 8.1% 8.1% ~6.8% 4.0% Under the Federal Reserve’s December 2020 stress test (Severely Adverse Scenario): ►2020 ending ACL represents ~83% of stress test losses ►SHUSA’s stressed capital ratio of 14.4% ranked in the top quartile among participating banks ►Pre-provision net revenue (“PPNR”) of $7.2 billion (4.7% of average assets) ranked in the top quartile among participating banks 1 Includes ACL for unfunded commitments Allowance ratio of 8.1%, YoY increase, driven by CECL implementation and macro factors
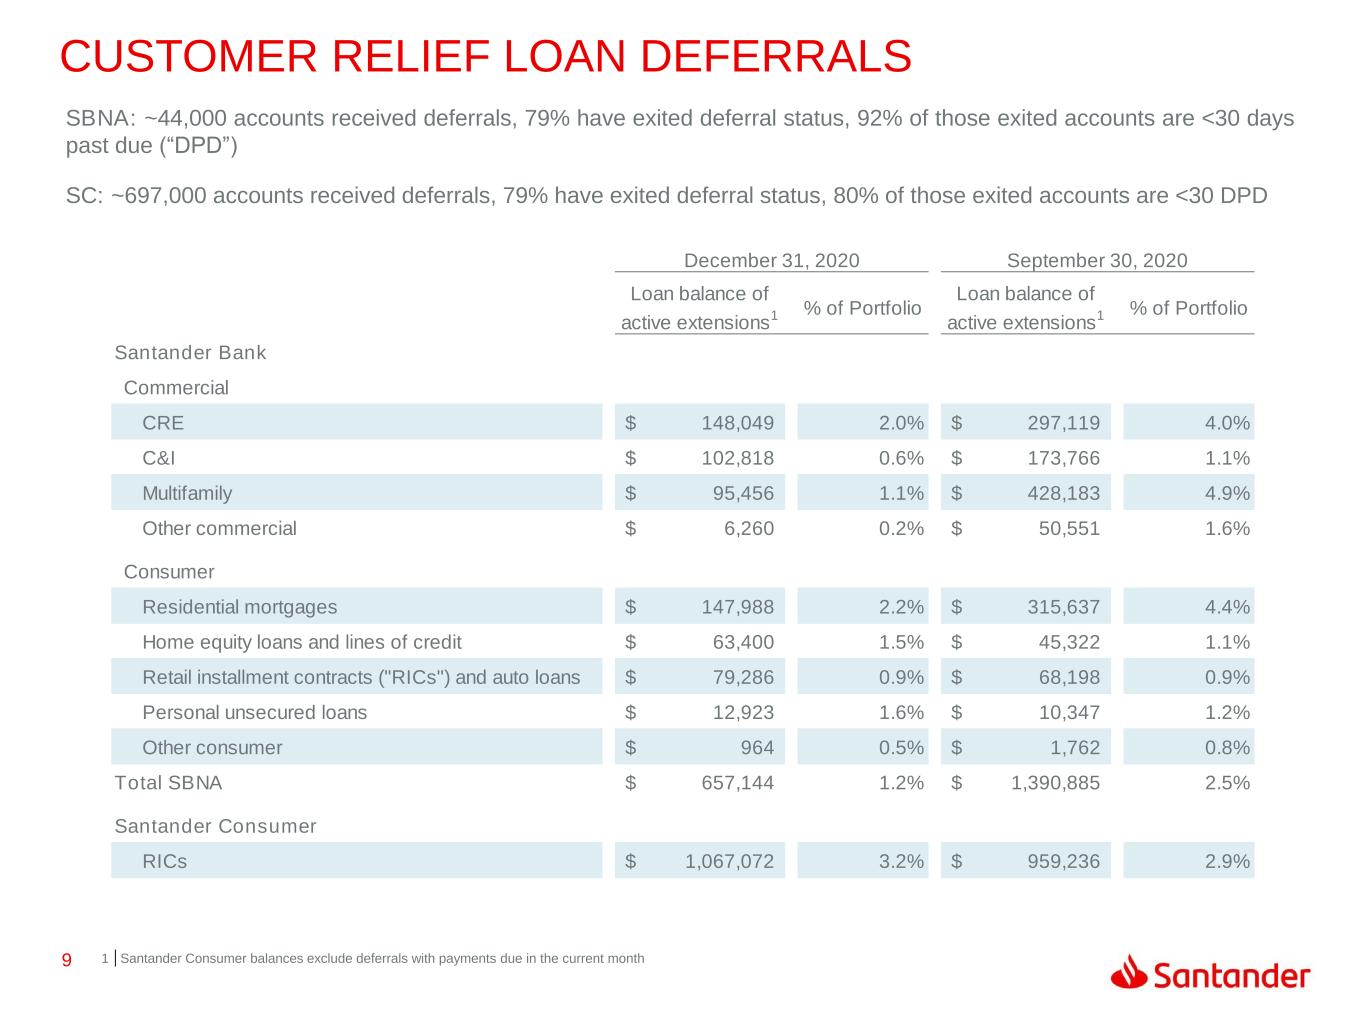
9 CUSTOMER RELIEF LOAN DEFERRALS 1 Santander Consumer balances exclude deferrals with payments due in the current month SBNA: ~44,000 accounts received deferrals, 79% have exited deferral status, 92% of those exited accounts are <30 days past due (“DPD”) SC: ~697,000 accounts received deferrals, 79% have exited deferral status, 80% of those exited accounts are <30 DPD Loan balance of active extensions 1 % of Portfolio Loan balance of active extensions 1 % of Portfolio Santander Bank Commercial CRE 148,049$ 2.0% 297,119$ 4.0% C&I 102,818$ 0.6% 173,766$ 1.1% Multifamily 95,456$ 1.1% 428,183$ 4.9% Other commercial 6,260$ 0.2% 50,551$ 1.6% Consumer Residential mortgages 147,988$ 2.2% 315,637$ 4.4% Home equity loans and lines of credit 63,400$ 1.5% 45,322$ 1.1% Retail installment contracts ("RICs") and auto loans 79,286$ 0.9% 68,198$ 0.9% Personal unsecured loans 12,923$ 1.6% 10,347$ 1.2% Other consumer 964$ 0.5% 1,762$ 0.8% Total SBNA 657,144$ 1.2% 1,390,885$ 2.5% Santander Consumer RICs 1,067,072$ 3.2% 959,236$ 2.9% December 31, 2020 September 30, 2020
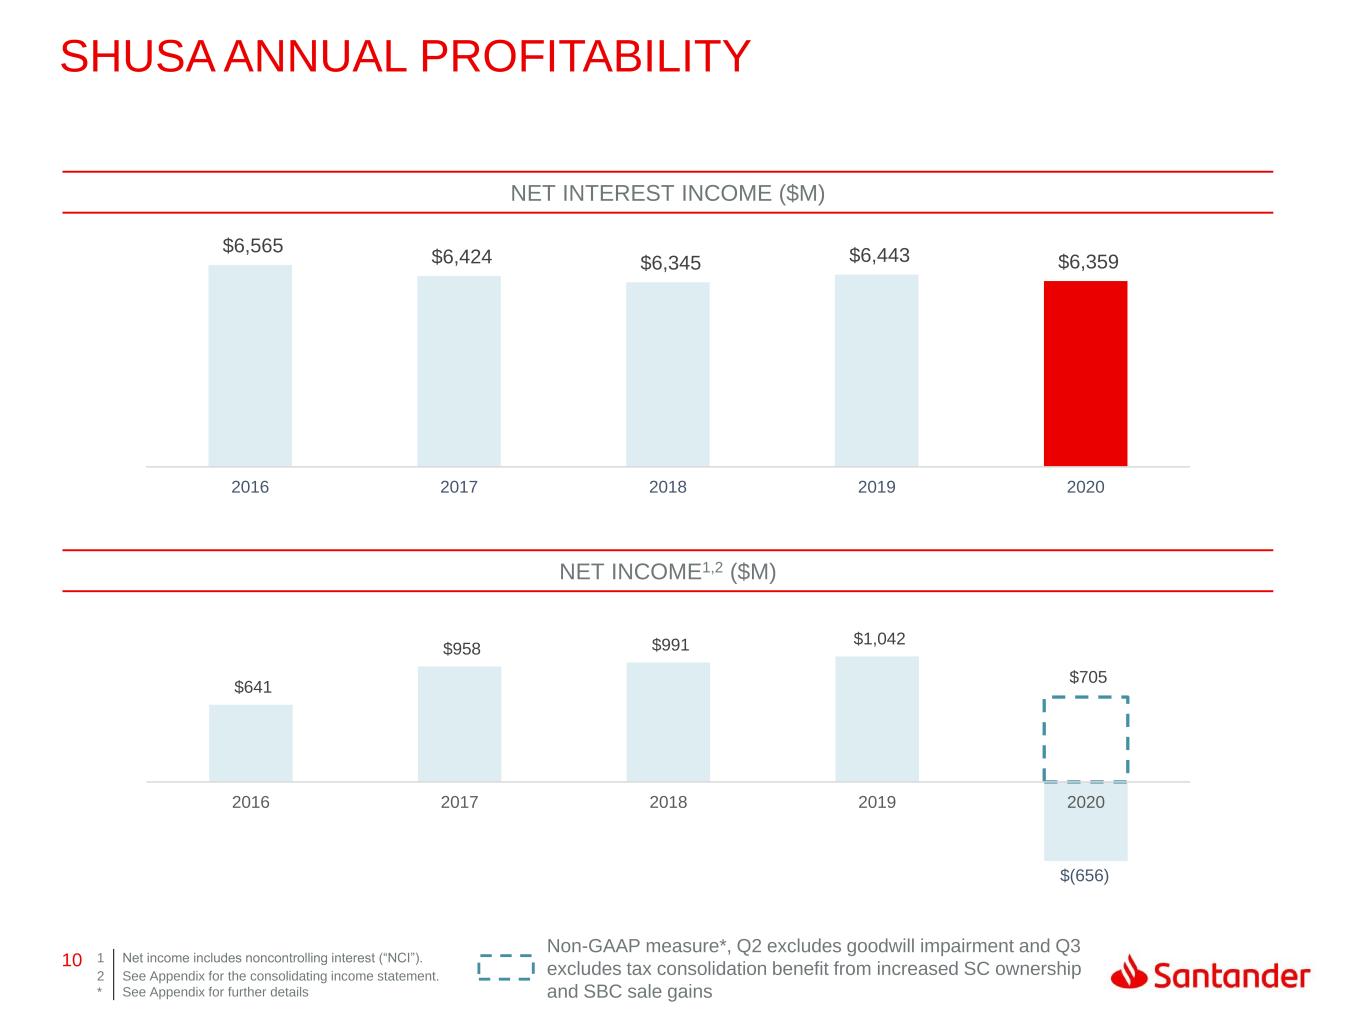
10 $(656) $641 $958 $991 $1,042 $705 2016 2017 2018 2019 2020 $6,565 $6,424 $6,345 $6,443 $6,359 2016 2017 2018 2019 2020 SHUSA ANNUAL PROFITABILITY NET INTEREST INCOME ($M) NET INCOME1,2 ($M) 1 Net income includes noncontrolling interest (“NCI”). 2 * See Appendix for the consolidating income statement. See Appendix for further details Non-GAAP measure*, Q2 excludes goodwill impairment and Q3 excludes tax consolidation benefit from increased SC ownership and SBC sale gains
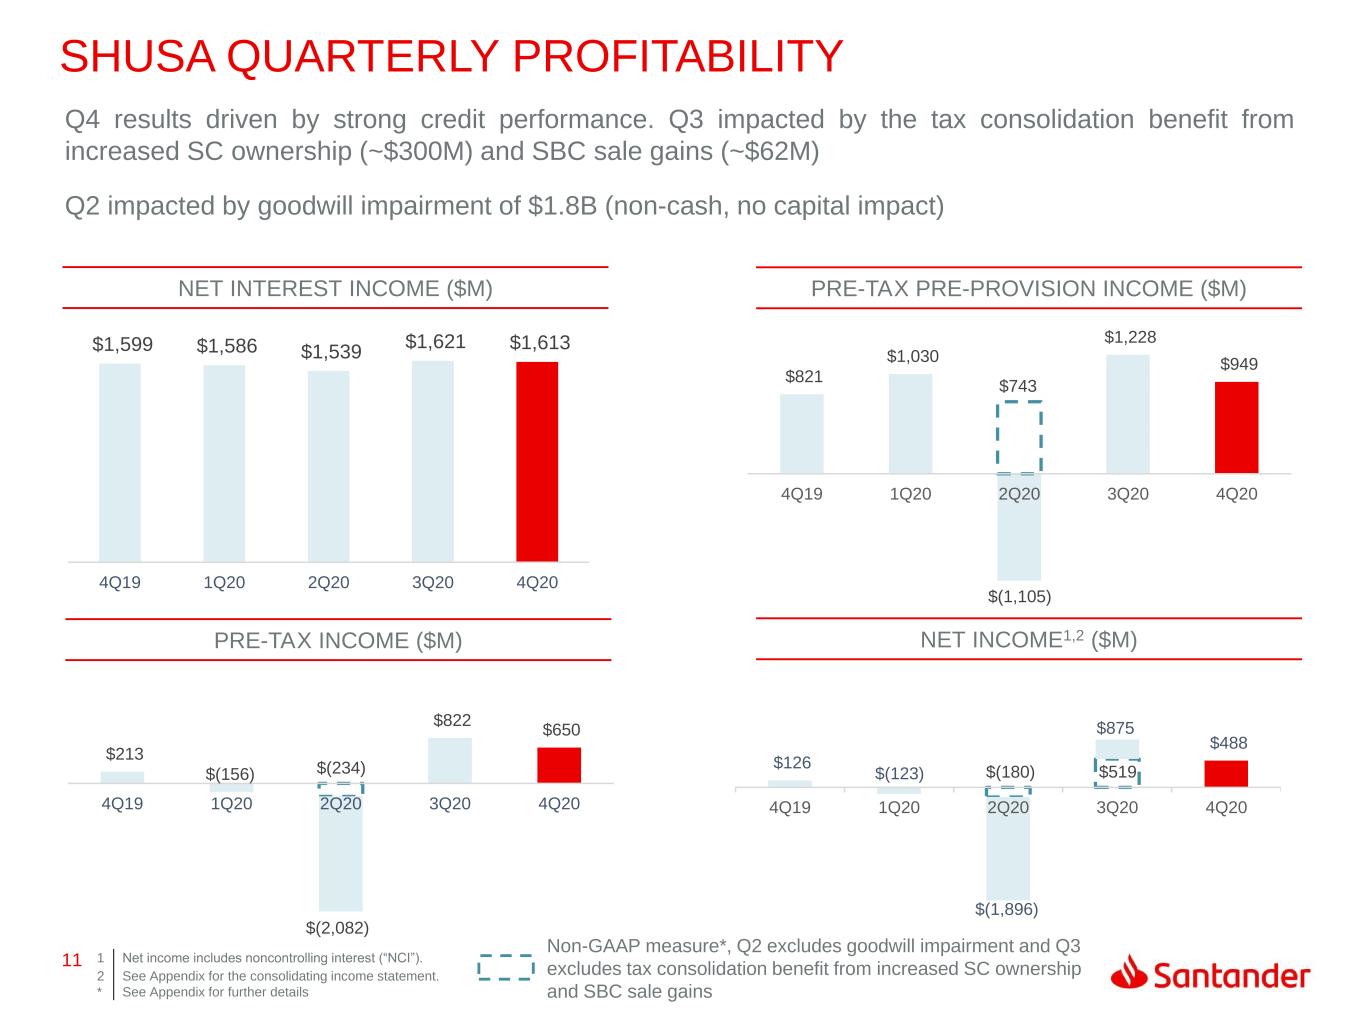
11 $(180) $519 $126 $(123) $(1,896) $875 $488 4Q19 1Q20 2Q20 3Q20 4Q20 $(1,105) $821 $1,030 $743 $1,228 $949 4Q19 1Q20 2Q20 3Q20 4Q20 $(156) $(234) $213 $(2,082) $822 $650 4Q19 1Q20 2Q20 3Q20 4Q20 $1,599 $1,586 $1,539 $1,621 $1,613 4Q19 1Q20 2Q20 3Q20 4Q20 SHUSA QUARTERLY PROFITABILITY NET INTEREST INCOME ($M) PRE-TAX INCOME ($M) NET INCOME1,2 ($M) PRE-TAX PRE-PROVISION INCOME ($M) 1 Net income includes noncontrolling interest (“NCI”). 2 * See Appendix for the consolidating income statement. See Appendix for further details Q4 results driven by strong credit performance. Q3 impacted by the tax consolidation benefit from increased SC ownership (~$300M) and SBC sale gains (~$62M) Q2 impacted by goodwill impairment of $1.8B (non-cash, no capital impact) Non-GAAP measure*, Q2 excludes goodwill impairment and Q3 excludes tax consolidation benefit from increased SC ownership and SBC sale gains
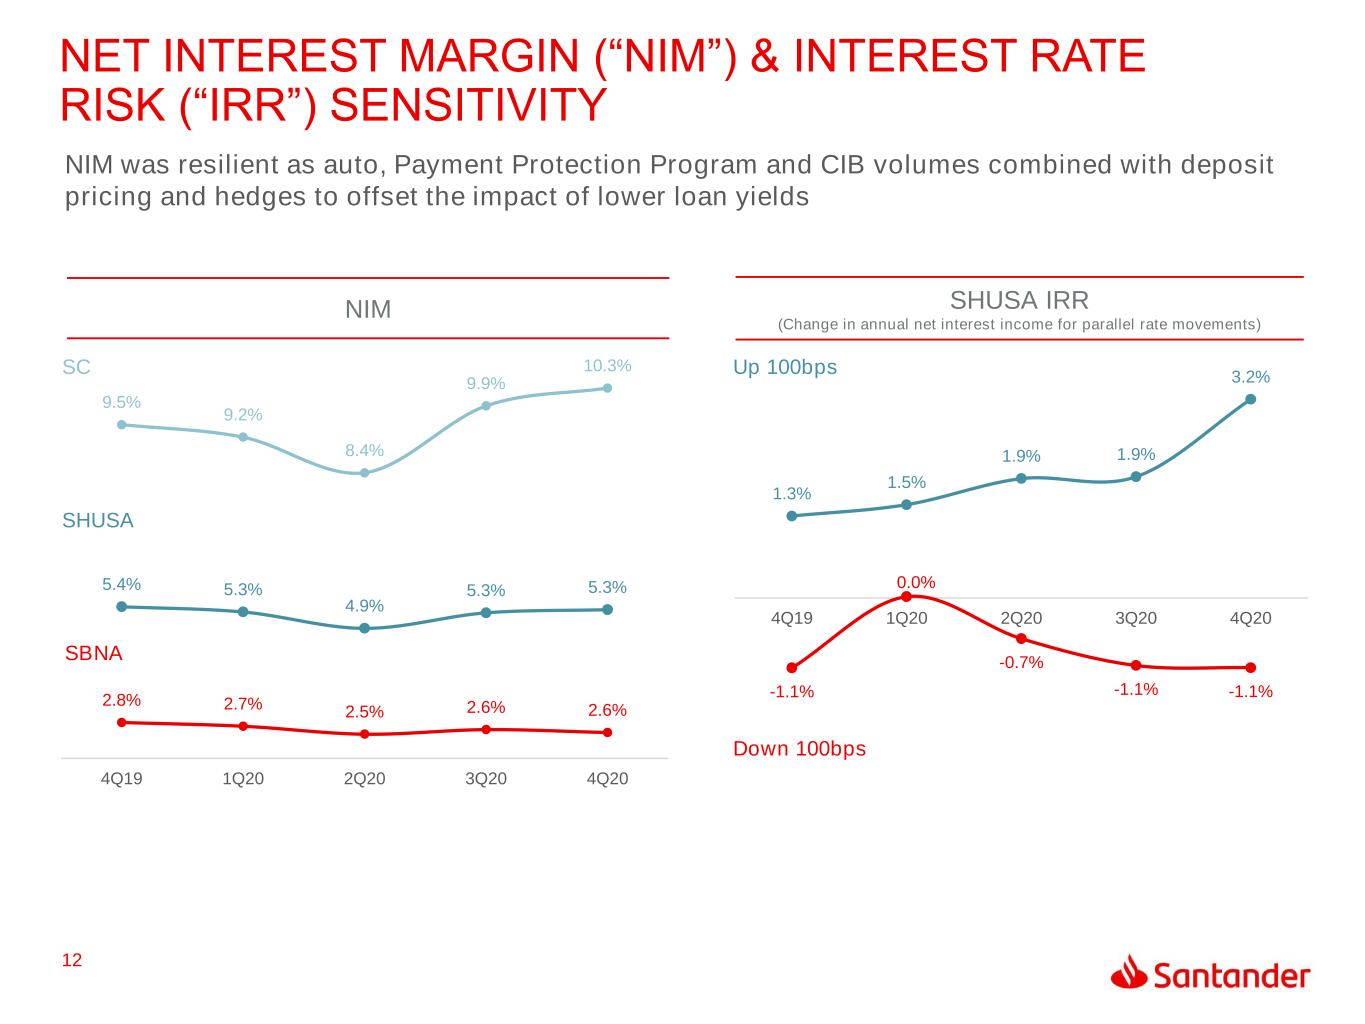
12 5.4% 5.3% 4.9% 5.3% 5.3% 9.5% 9.2% 8.4% 9.9% 10.3% 2.8% 2.7% 2.5% 2.6% 2.6% 4Q19 1Q20 2Q20 3Q20 4Q20 -1.1% 0.0% -0.7% -1.1% -1.1% 1.3% 1.5% 1.9% 1.9% 3.2% 4Q19 1Q20 2Q20 3Q20 4Q20 NET INTEREST MARGIN (“NIM”) & INTEREST RATE RISK (“IRR”) SENSITIVITY NIM was resilient as auto, Payment Protection Program and CIB volumes combined with deposit pricing and hedges to offset the impact of lower loan yields SC SHUSA SBNA NIM Down 100bps Up 100bps SHUSA IRR (Change in annual net interest income for parallel rate movements)
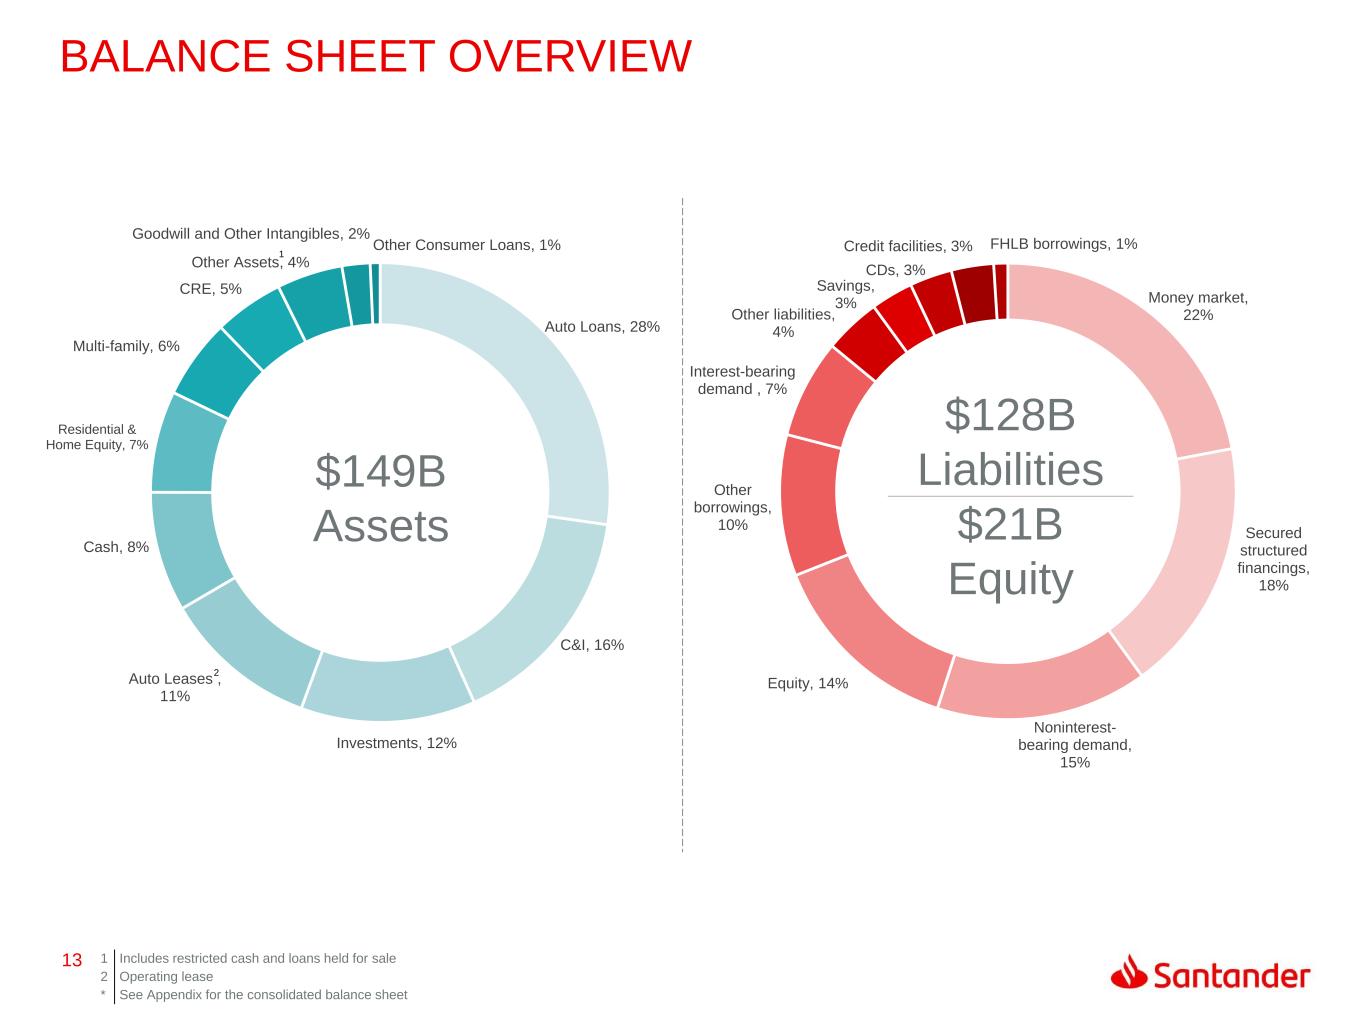
13 Money market, 22% Secured structured financings, 18% Noninterest- bearing demand, 15% Equity, 14% Other borrowings, 10% Interest-bearing demand , 7% Other liabilities, 4% Savings, 3% CDs, 3% Credit facilities, 3% FHLB borrowings, 1% Auto Loans, 28% C&I, 16% Investments, 12% Auto Leases , 11% Cash, 8% Residential & Home Equity, 7% Multi-family, 6% CRE, 5% Other Assets, 4% Goodwill and Other Intangibles, 2% Other Consumer Loans, 1% BALANCE SHEET OVERVIEW 1 Includes restricted cash and loans held for sale 2 Operating lease * See Appendix for the consolidated balance sheet $149B Assets $128B Liabilities $21B Equity 2 1
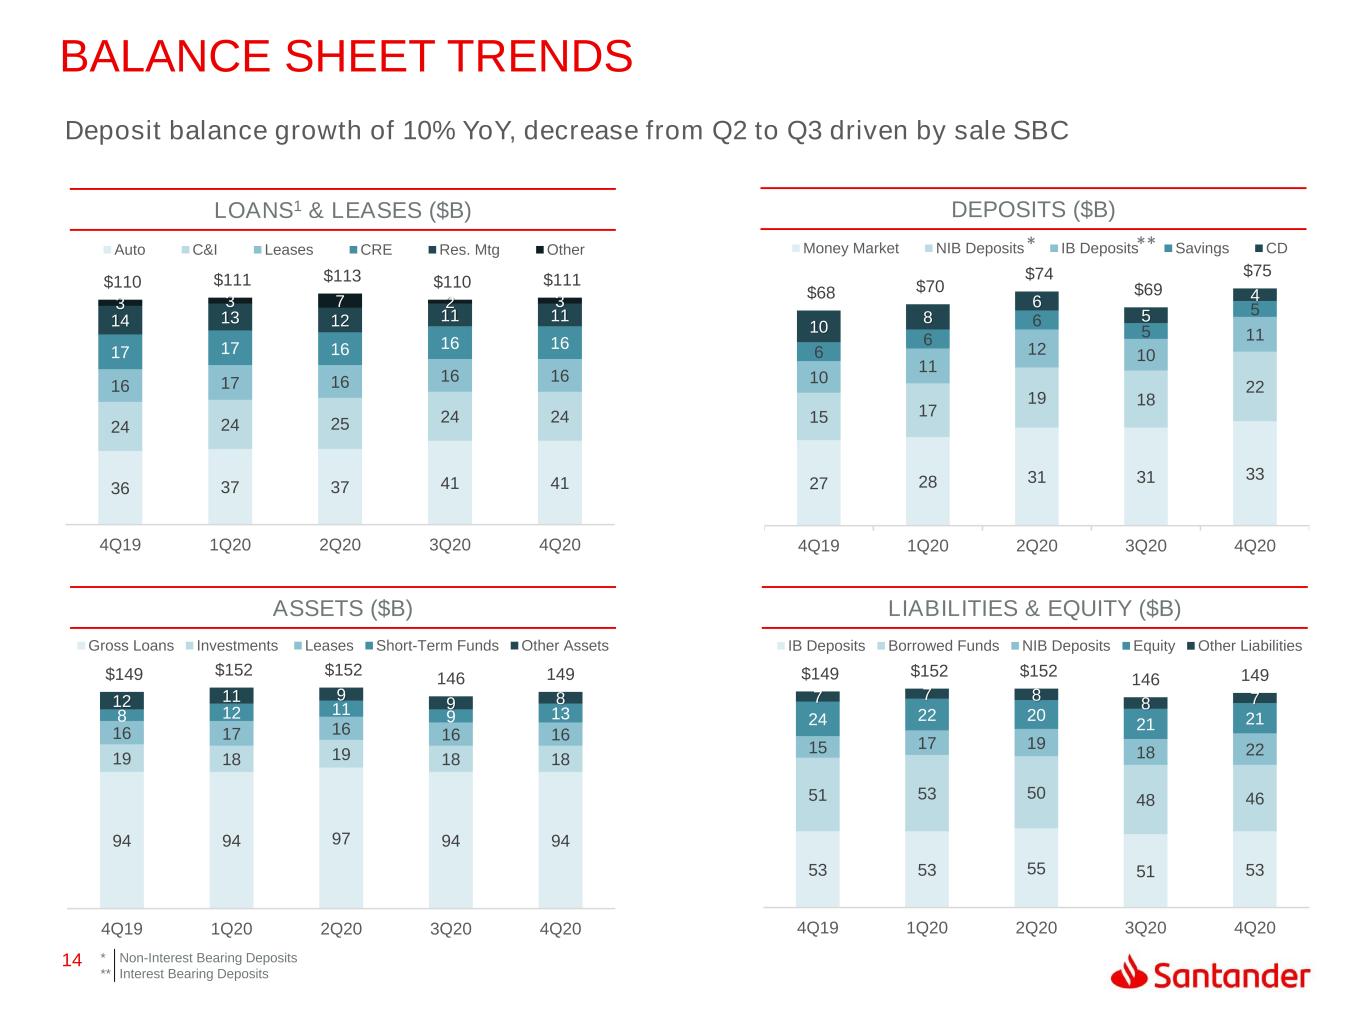
14 27 28 31 31 33 15 17 19 18 22 10 11 12 10 11 6 6 6 5 5 10 8 6 5 4$68 $70 $74 $69 $75 4Q19 1Q20 2Q20 3Q20 4Q20 Money Market NIB Deposits IB Deposits Savings CD 36 37 37 41 41 24 24 25 24 24 16 17 16 16 16 17 17 16 16 16 14 13 12 11 11 3 3 7 2 3 $110 $111 $113 $110 $111 4Q19 1Q20 2Q20 3Q20 4Q20 Auto C&I Leases CRE Res. Mtg Other LOANS1 & LEASES ($B) DEPOSITS ($B) 53 53 55 51 53 51 53 50 48 46 15 17 19 18 22 24 22 20 21 21 7 7 8 8 7 $149 $152 $152 146 149 4Q19 1Q20 2Q20 3Q20 4Q20 IB Deposits Borrowed Funds NIB Deposits Equity Other Liabilities 94 94 97 94 94 19 18 19 18 18 16 17 16 16 16 8 12 11 9 13 12 11 9 9 8 $149 $152 $152 146 149 4Q19 1Q20 2Q20 3Q20 4Q20 Gross Loans Investments Leases Short-Term Funds Other Assets ASSETS ($B) LIABILITIES & EQUITY ($B) Deposit balance growth of 10% YoY, decrease from Q2 to Q3 driven by sale SBC BALANCE SHEET TRENDS * ** Non-Interest Bearing Deposits Interest Bearing Deposits * **
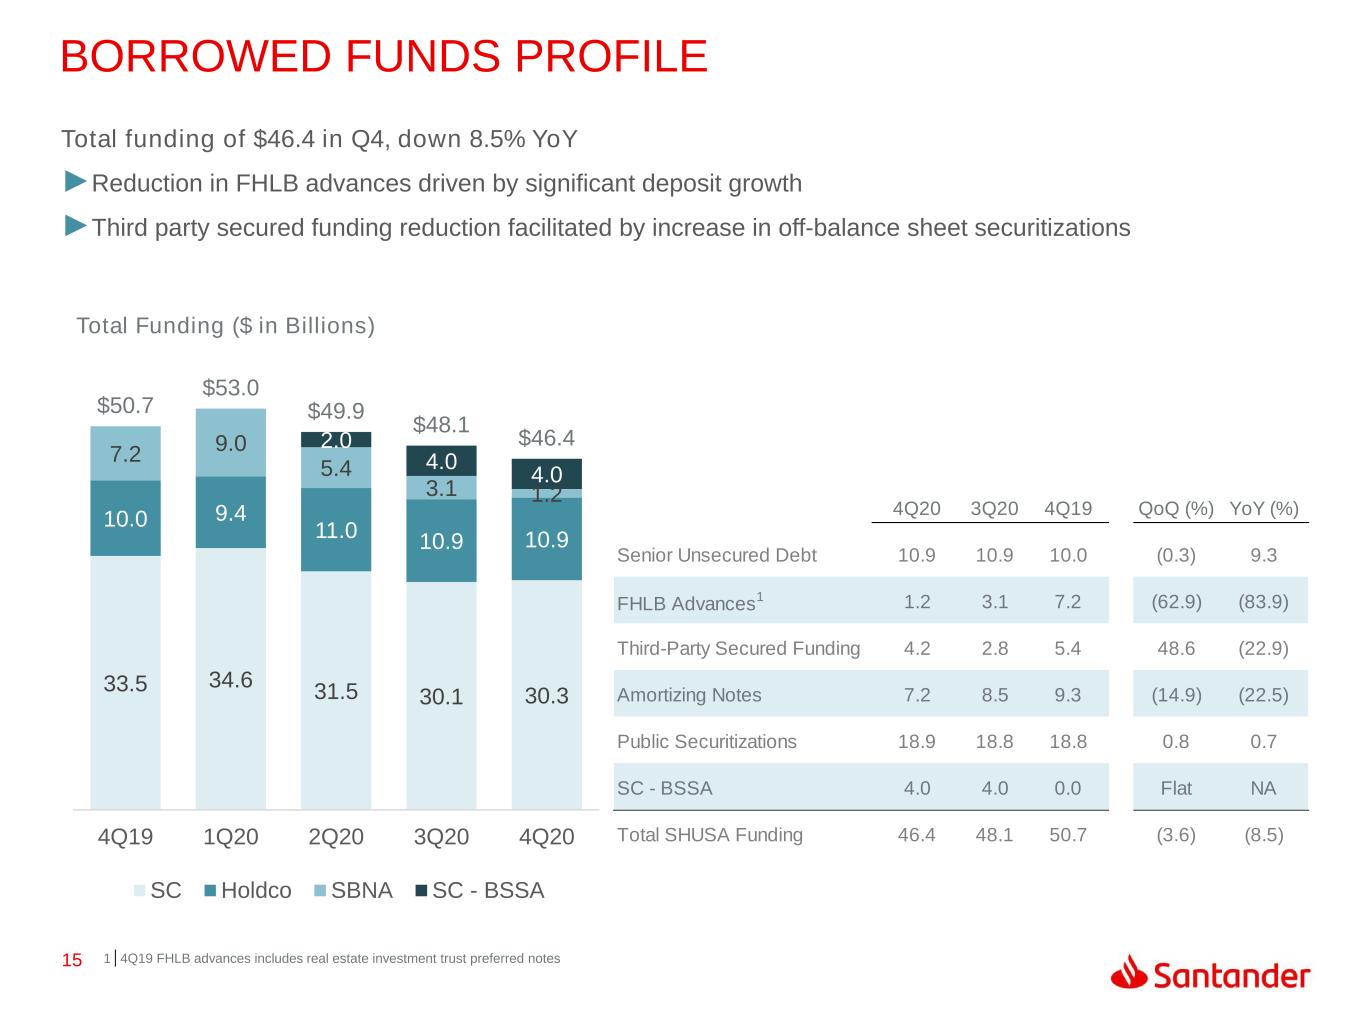
15 4Q20 3Q20 4Q19 QoQ (%) YoY (%) Senior Unsecured Debt 10.9 10.9 10.0 (0.3) 9.3 FHLB Advances 1 1.2 3.1 7.2 (62.9) (83.9) Third-Party Secured Funding 4.2 2.8 5.4 48.6 (22.9) Amortizing Notes 7.2 8.5 9.3 (14.9) (22.5) Public Securitizations 18.9 18.8 18.8 0.8 0.7 SC - BSSA 4.0 4.0 0.0 Flat NA Total SHUSA Funding 46.4 48.1 50.7 (3.6) (8.5) 33.5 34.6 31.5 30.1 30.3 10.0 9.4 11.0 10.9 10.9 7.2 9.0 5.4 3.1 1.2 2.0 4.0 4.0 $50.7 $53.0 $49.9 $48.1 $46.4 4Q19 1Q20 2Q20 3Q20 4Q20 SC Holdco SBNA SC - BSSA BORROWED FUNDS PROFILE Total Funding ($ in Billions) Total funding of $46.4 in Q4, down 8.5% YoY ►Reduction in FHLB advances driven by significant deposit growth ►Third party secured funding reduction facilitated by increase in off-balance sheet securitizations 1 4Q19 FHLB advances includes real estate investment trust preferred notes
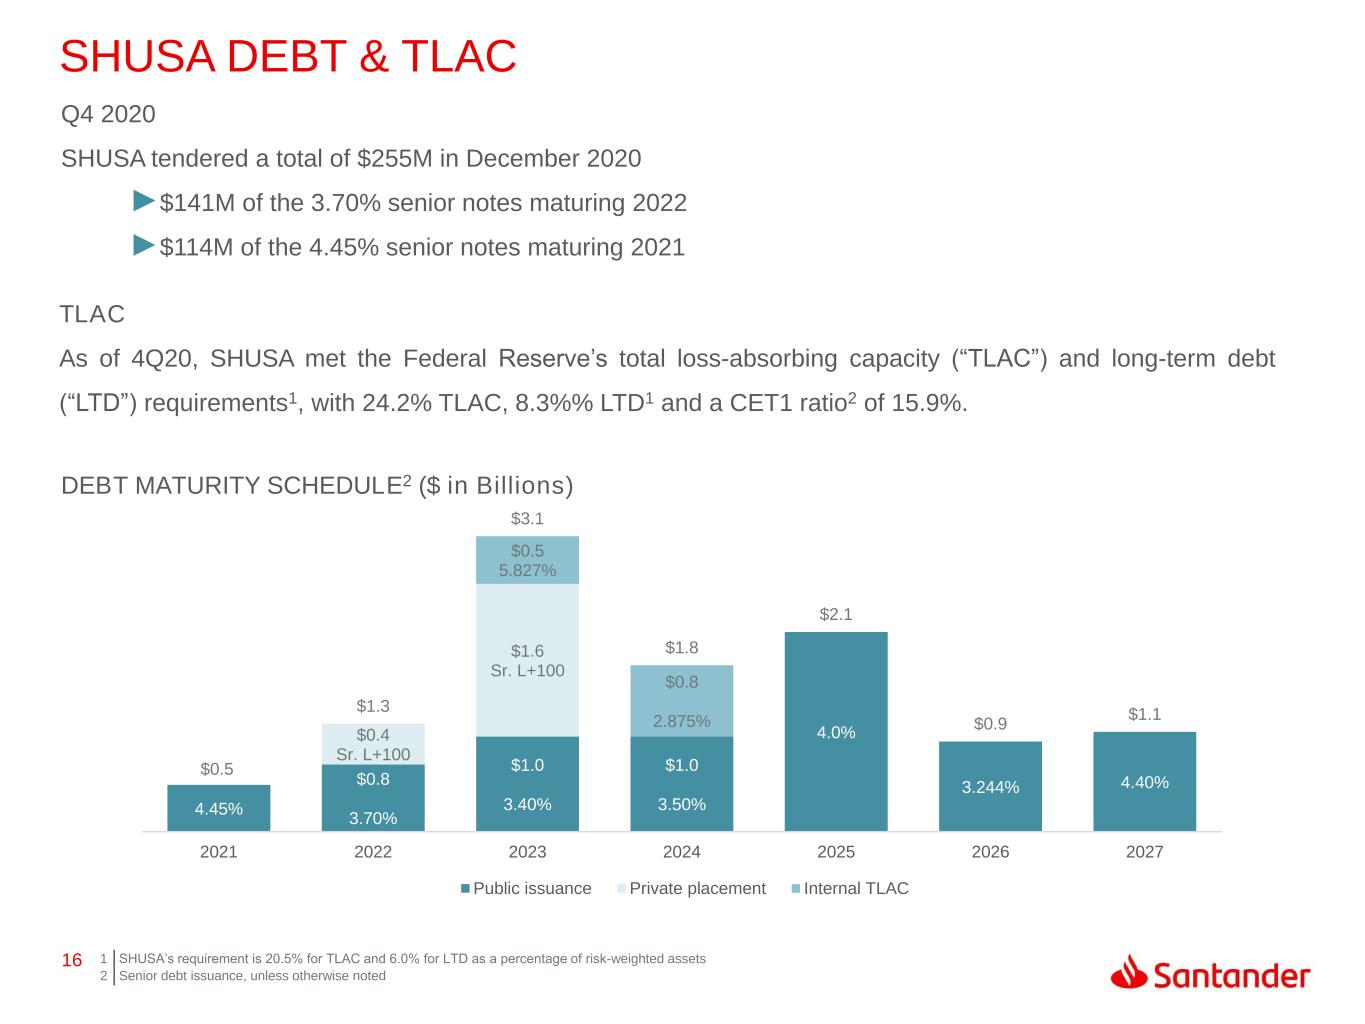
16 4.45% $0.8 3.70% $1.0 3.40% $1.0 3.50% 4.0% 3.244% 4.40% $0.4 Sr. L+100 $1.6 Sr. L+100 $0.5 5.827% $0.8 2.875% $0.5 $1.3 $3.1 $1.8 $2.1 $0.9 $1.1 2021 2022 2023 2024 2025 2026 2027 Public issuance Private placement Internal TLAC SHUSA DEBT & TLAC Q4 2020 SHUSA tendered a total of $255M in December 2020 ►$141M of the 3.70% senior notes maturing 2022 ►$114M of the 4.45% senior notes maturing 2021 1 SHUSA’s requirement is 20.5% for TLAC and 6.0% for LTD as a percentage of risk-weighted assets 2 Senior debt issuance, unless otherwise noted DEBT MATURITY SCHEDULE2 ($ in Billions) TLAC As of 4Q20, SHUSA met the Federal Reserve’s total loss-absorbing capacity (“TLAC”) and long-term debt (“LTD”) requirements1, with 24.2% TLAC, 8.3%% LTD1 and a CET1 ratio2 of 15.9%.
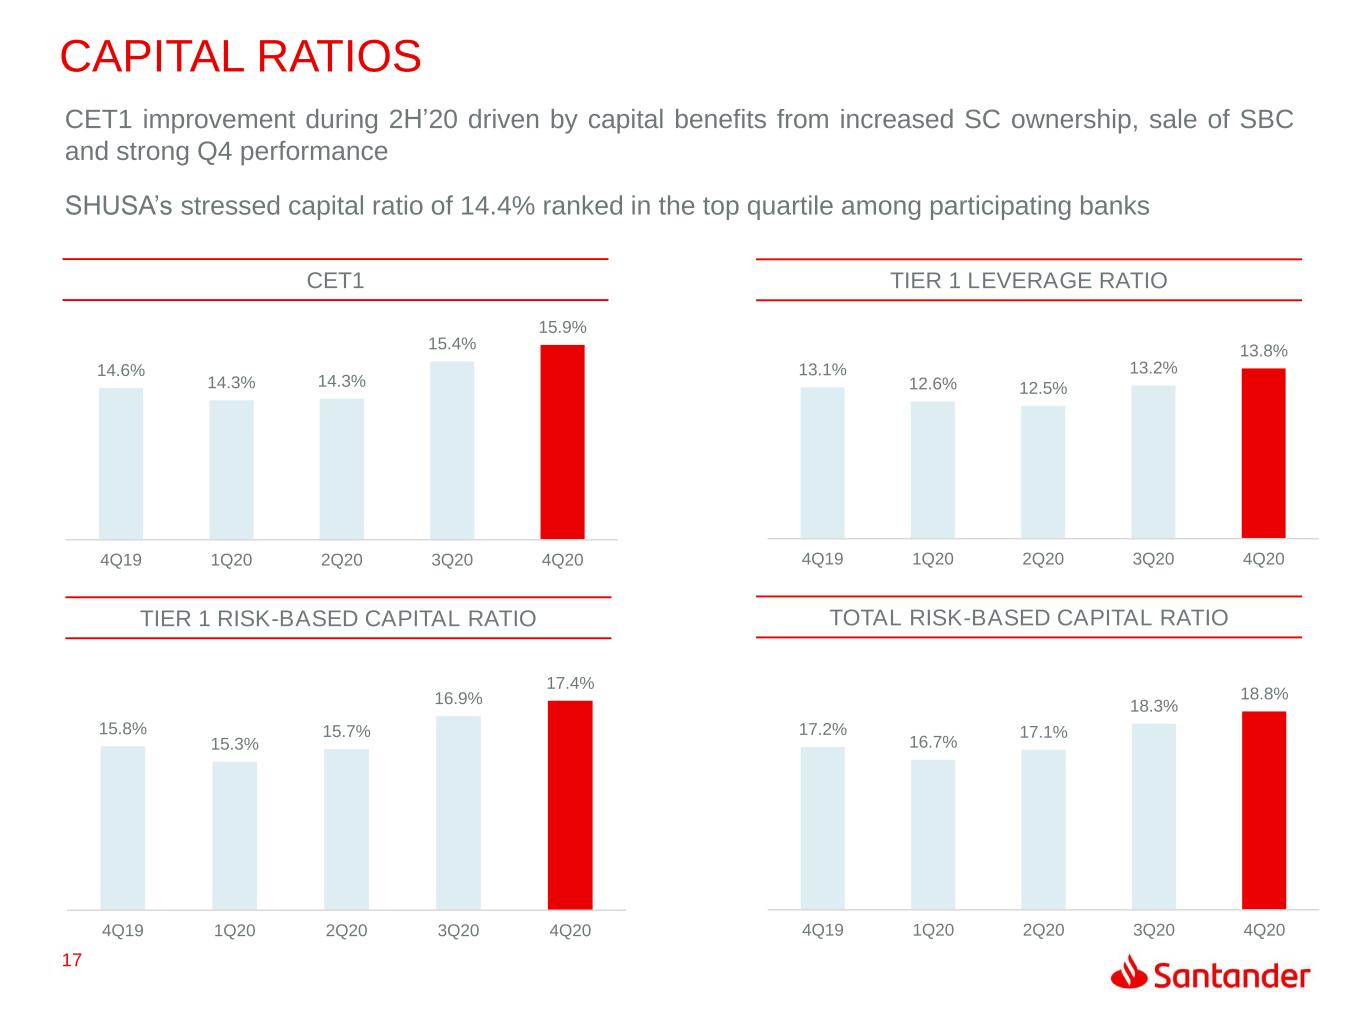
17 15.8% 15.3% 15.7% 16.9% 17.4% 4Q19 1Q20 2Q20 3Q20 4Q20 13.1% 12.6% 12.5% 13.2% 13.8% 4Q19 1Q20 2Q20 3Q20 4Q20 17.2% 16.7% 17.1% 18.3% 18.8% 4Q19 1Q20 2Q20 3Q20 4Q20 14.6% 14.3% 14.3% 15.4% 15.9% 4Q19 1Q20 2Q20 3Q20 4Q20 CAPITAL RATIOS CET1 TIER 1 RISK-BASED CAPITAL RATIO TOTAL RISK-BASED CAPITAL RATIO TIER 1 LEVERAGE RATIO CET1 improvement during 2H’20 driven by capital benefits from increased SC ownership, sale of SBC and strong Q4 performance SHUSA’s stressed capital ratio of 14.4% ranked in the top quartile among participating banks
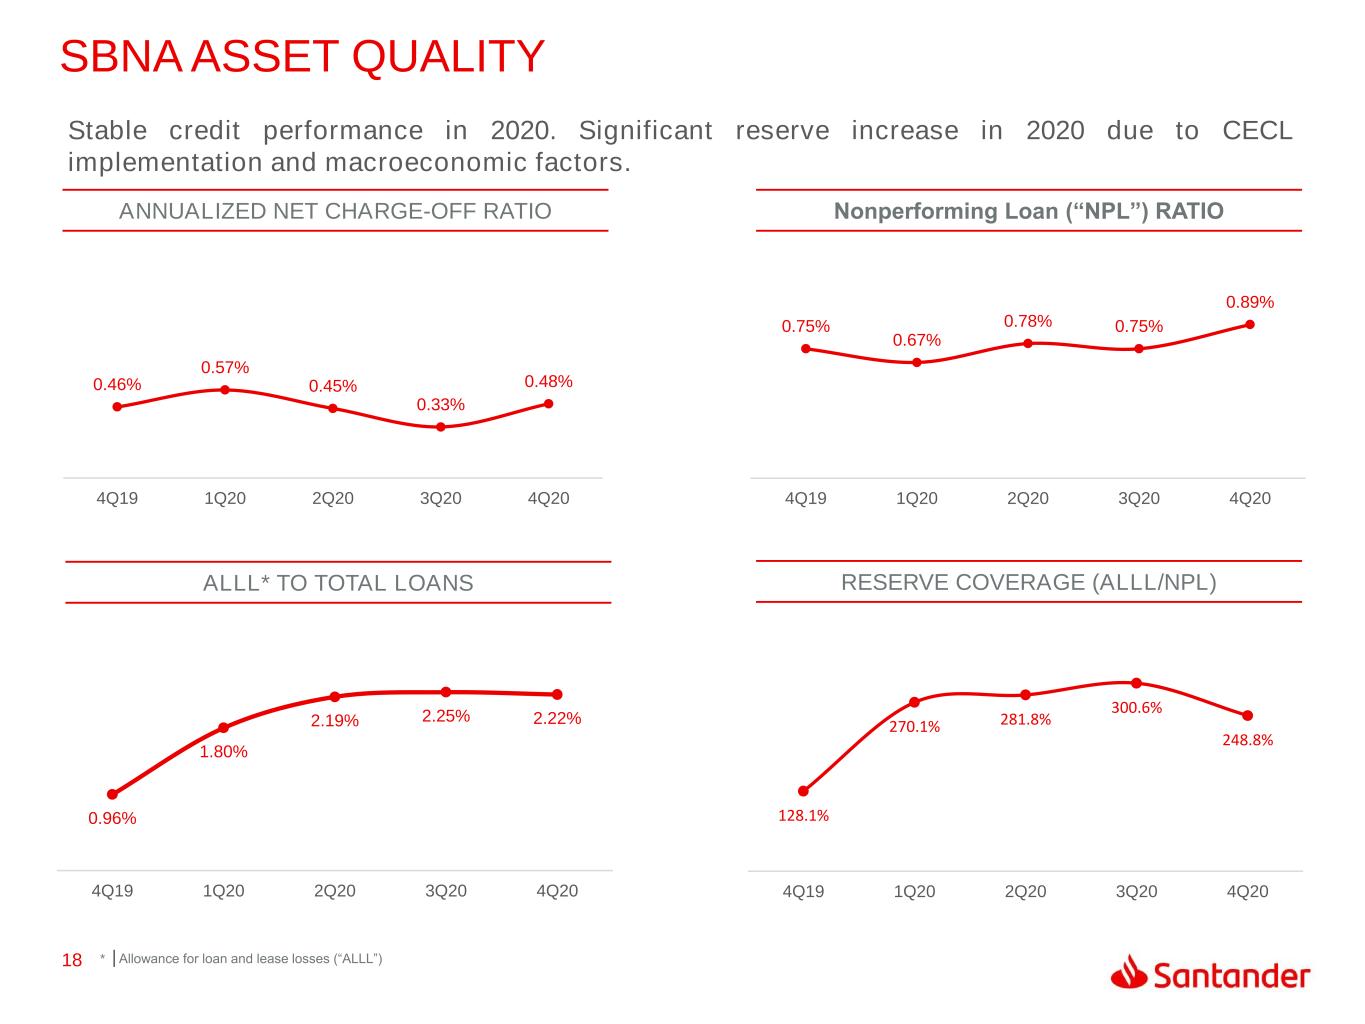
18 128.1% 270.1% 281.8% 300.6% 248.8% 4Q19 1Q20 2Q20 3Q20 4Q20 0.96% 1.80% 2.19% 2.25% 2.22% 4Q19 1Q20 2Q20 3Q20 4Q20 0.75% 0.67% 0.78% 0.75% 0.89% 4Q19 1Q20 2Q20 3Q20 4Q20 0.46% 0.57% 0.45% 0.33% 0.48% 4Q19 1Q20 2Q20 3Q20 4Q20 SBNA ASSET QUALITY Stable credit performance in 2020. Significant reserve increase in 2020 due to CECL implementation and macroeconomic factors. ANNUALIZED NET CHARGE-OFF RATIO ALLL* TO TOTAL LOANS RESERVE COVERAGE (ALLL/NPL) Nonperforming Loan (“NPL”) RATIO * Allowance for loan and lease losses (“ALLL”)
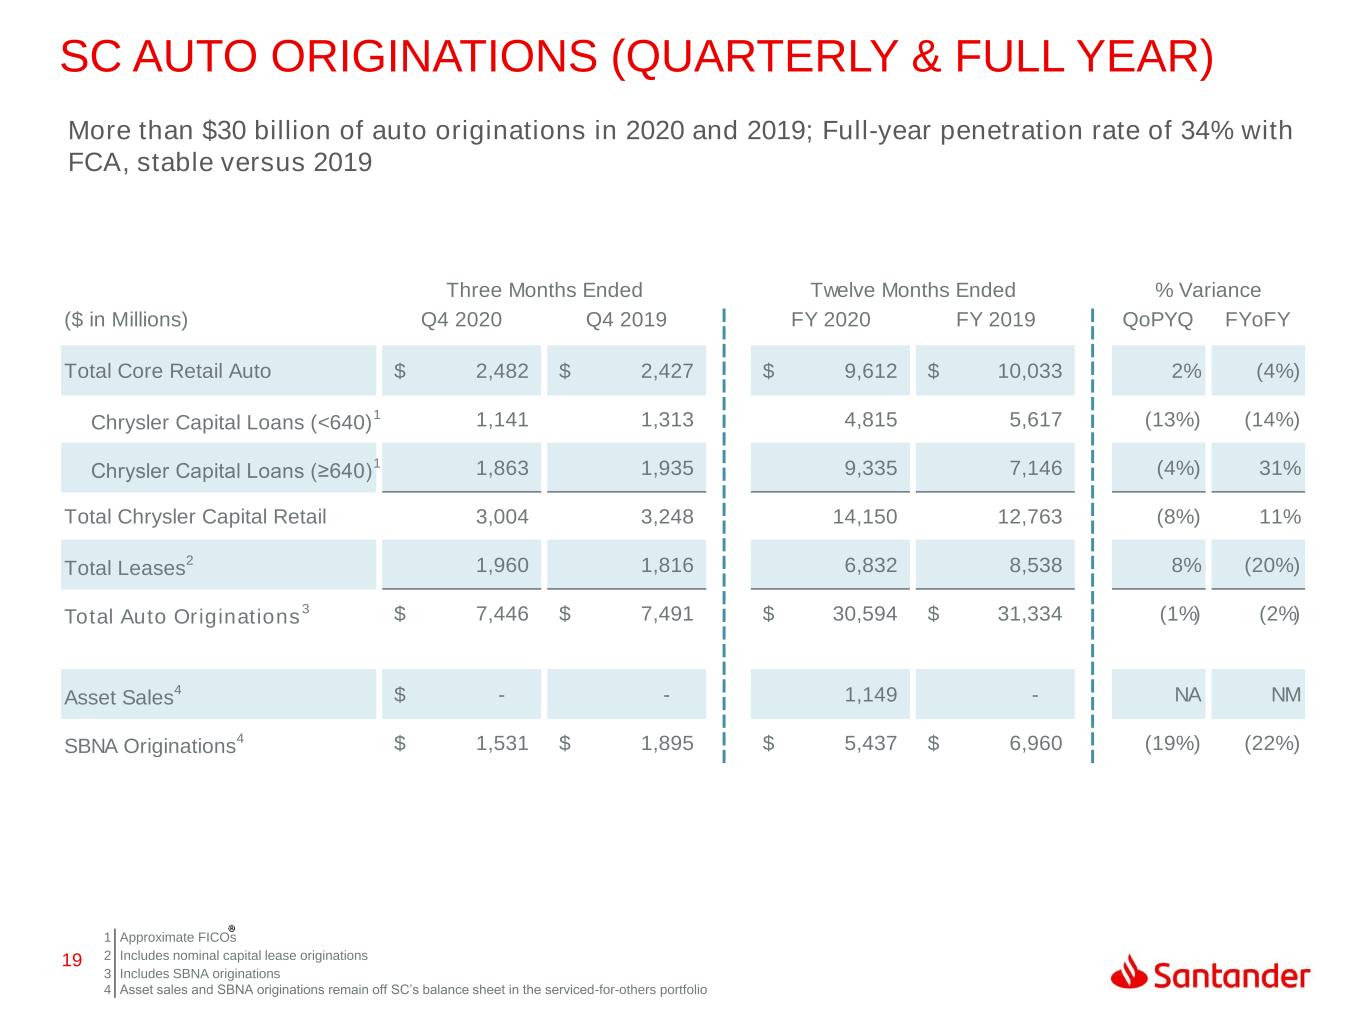
19 SC AUTO ORIGINATIONS (QUARTERLY & FULL YEAR) 1 Approximate FICOs 2 Includes nominal capital lease originations 3 4 Includes SBNA originations Asset sales and SBNA originations remain off SC’s balance sheet in the serviced-for-others portfolio Three Months Ended Twelve Months Ended ($ in Millions) Q4 2020 Q4 2019 FY 2020 FY 2019 QoPYQ FYoFY Total Core Retail Auto 2,482$ 2,427$ 9,612$ 10,033$ 2% (4%) Chrysler Capital Loans (<640) 1 1,141 1,313 4,815 5,617 (13%) (14%) Chrysler Capital Loans (≥640) 1 1,863 1,935 9,335 7,146 (4%) 31% Total Chrysler Capital Retail 3,004 3,248 14,150 12,763 (8%) 11% Total Leases 2 1,960 1,816 6,832 8,538 8% (20%) Total Auto Originations 3 7,446$ 7,491$ 30,594$ 31,334$ (1%) (2%) Asset Sales 4 -$ - 1,149 - NA NM SBNA Originations 4 1,531$ 1,895$ 5,437$ 6,960$ (19%) (22%) % Variance More than $30 billion of auto originations in 2020 and 2019; Full-year penetration rate of 34% with FCA, stable versus 2019
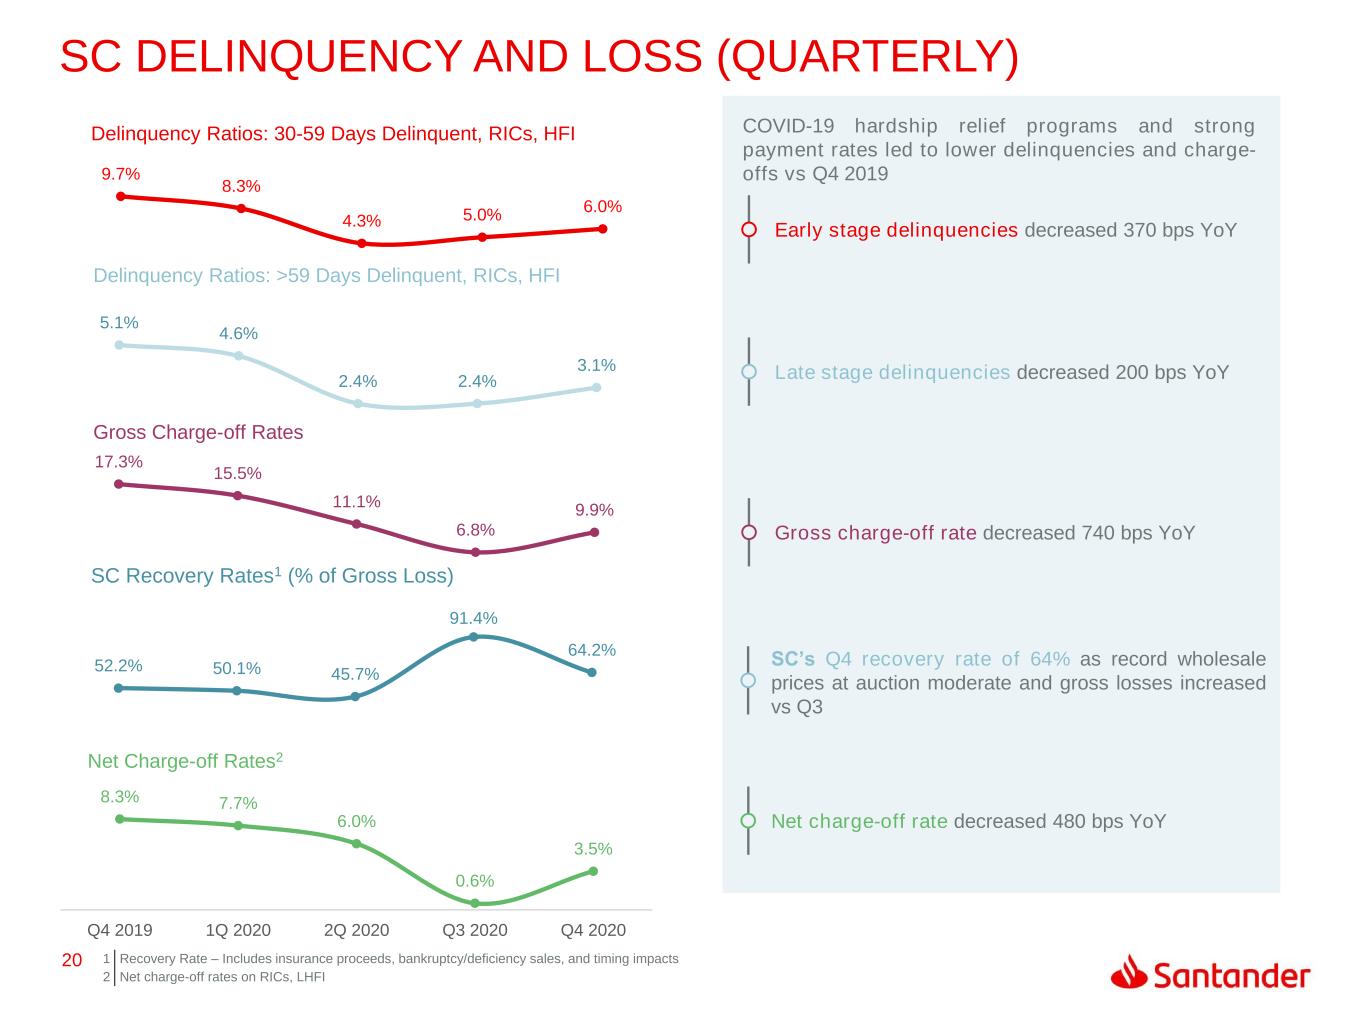
20 1 Recovery Rate – Includes insurance proceeds, bankruptcy/deficiency sales, and timing impacts 2 Net charge-off rates on RICs, LHFI SC DELINQUENCY AND LOSS (QUARTERLY) SC Recovery Rates1 (% of Gross Loss) Net Charge-off Rates2 Delinquency Ratios: 30-59 Days Delinquent, RICs, HFI Delinquency Ratios: >59 Days Delinquent, RICs, HFI Gross Charge-off Rates Late stage delinquencies decreased 200 bps YoY Gross charge-off rate decreased 740 bps YoY SC’s Q4 recovery rate of 64% as record wholesale prices at auction moderate and gross losses increased vs Q3 Net charge-off rate decreased 480 bps YoY Early stage delinquencies decreased 370 bps YoY COVID-19 hardship relief programs and strong payment rates led to lower delinquencies and charge- offs vs Q4 2019 8.3% 7.7% 6.0% 0.6% 3.5% Q4 2019 1Q 2020 2Q 2020 Q3 2020 Q4 2020 52.2% 50.1% 45.7% 91.4% 64.2% 17.3% 15.5% 11.1% 6.8% 9.9% 5.1% 4.6% 2.4% 2.4% 3.1% 9.7% 8.3% 4.3% 5.0% 6.0%
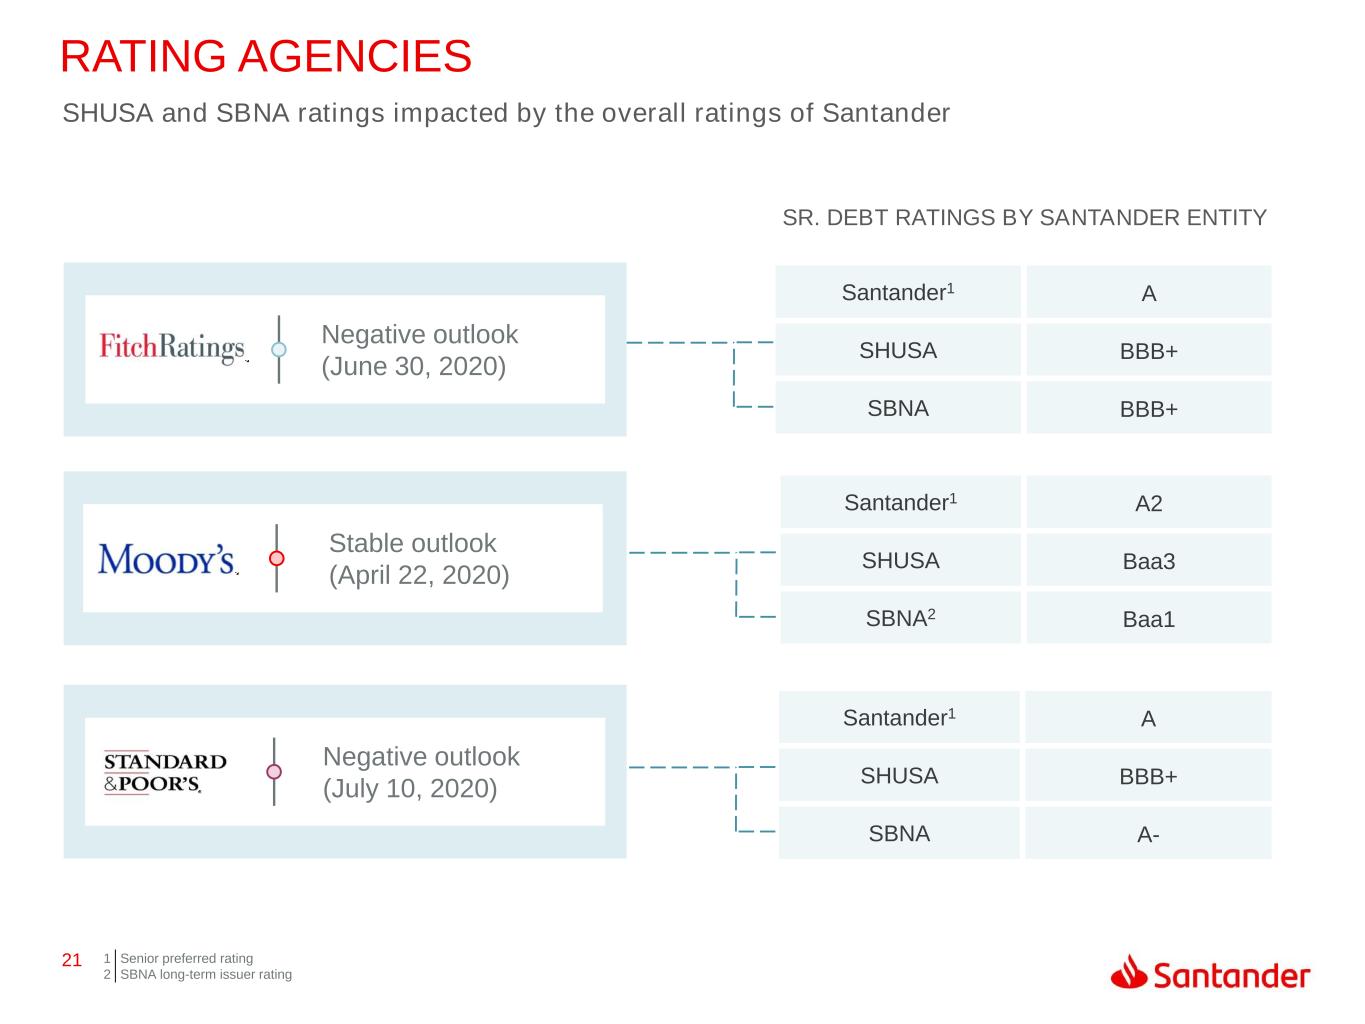
21 Santander1 A2 SHUSA Baa3 SBNA2 Baa1 Santander1 A SHUSA BBB+ SBNA A- RATING AGENCIES Negative outlook (June 30, 2020) SHUSA and SBNA ratings impacted by the overall ratings of Santander SR. DEBT RATINGS BY SANTANDER ENTITY Santander1 A SHUSA BBB+ SBNA BBB+ Stable outlook (April 22, 2020) Negative outlook (July 10, 2020) 1 2 Senior preferred rating SBNA long-term issuer rating
APPENDIX
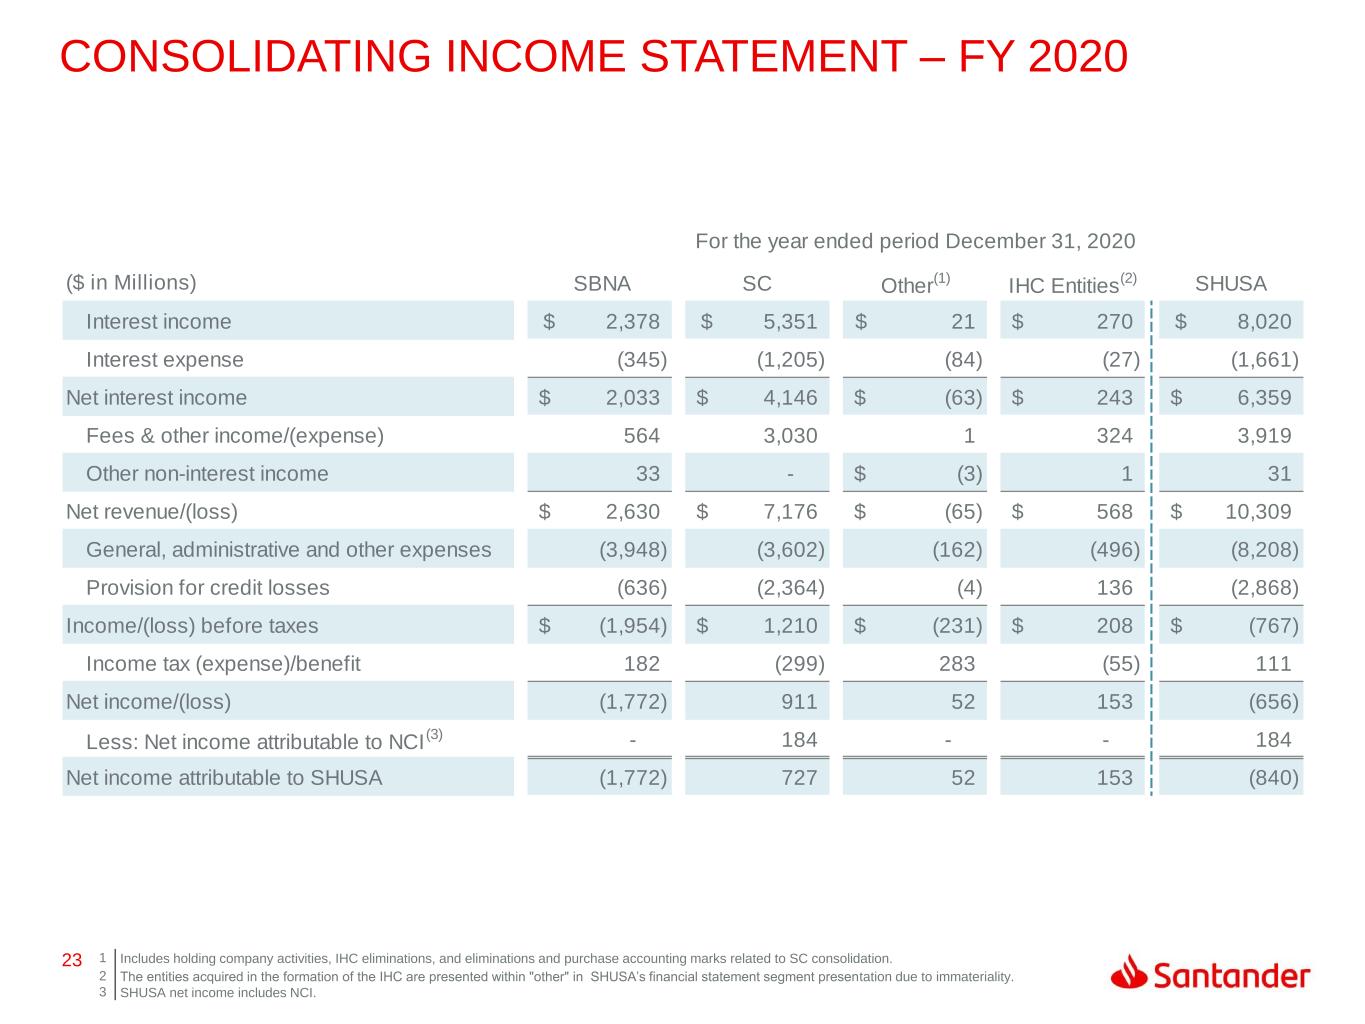
23 CONSOLIDATING INCOME STATEMENT – FY 2020 1 Includes holding company activities, IHC eliminations, and eliminations and purchase accounting marks related to SC consolidation. 2 3 The entities acquired in the formation of the IHC are presented within "other" in SHUSA’s financial statement segment presentation due to immateriality. SHUSA net income includes NCI. For the year ended period December 31, 2020 ($ in Millions) SBNA SC Other (1) IHC Entities (2) SHUSA Interest income 2,378$ 5,351$ 21$ 270$ 8,020$ Interest expense (345) (1,205) (84) (27) (1,661) Net interest income 2,033$ 4,146$ (63)$ 243$ 6,359$ Fees & other income/(expense) 564 3,030 1 324 3,919 Other non-interest income 33 - (3)$ 1 31 Net revenue/(loss) 2,630$ 7,176$ (65)$ 568$ 10,309$ General, administrative and other expenses (3,948) (3,602) (162) (496) (8,208) Provision for credit losses (636) (2,364) (4) 136 (2,868) Income/(loss) before taxes (1,954)$ 1,210$ (231)$ 208$ (767)$ Income tax (expense)/benefit 182 (299) 283 (55) 111 Net income/(loss) (1,772) 911 52 153 (656) Less: Net income attributable to NCI (3) - 184 - - 184 Net income attributable to SHUSA (1,772) 727 52 153 (840)
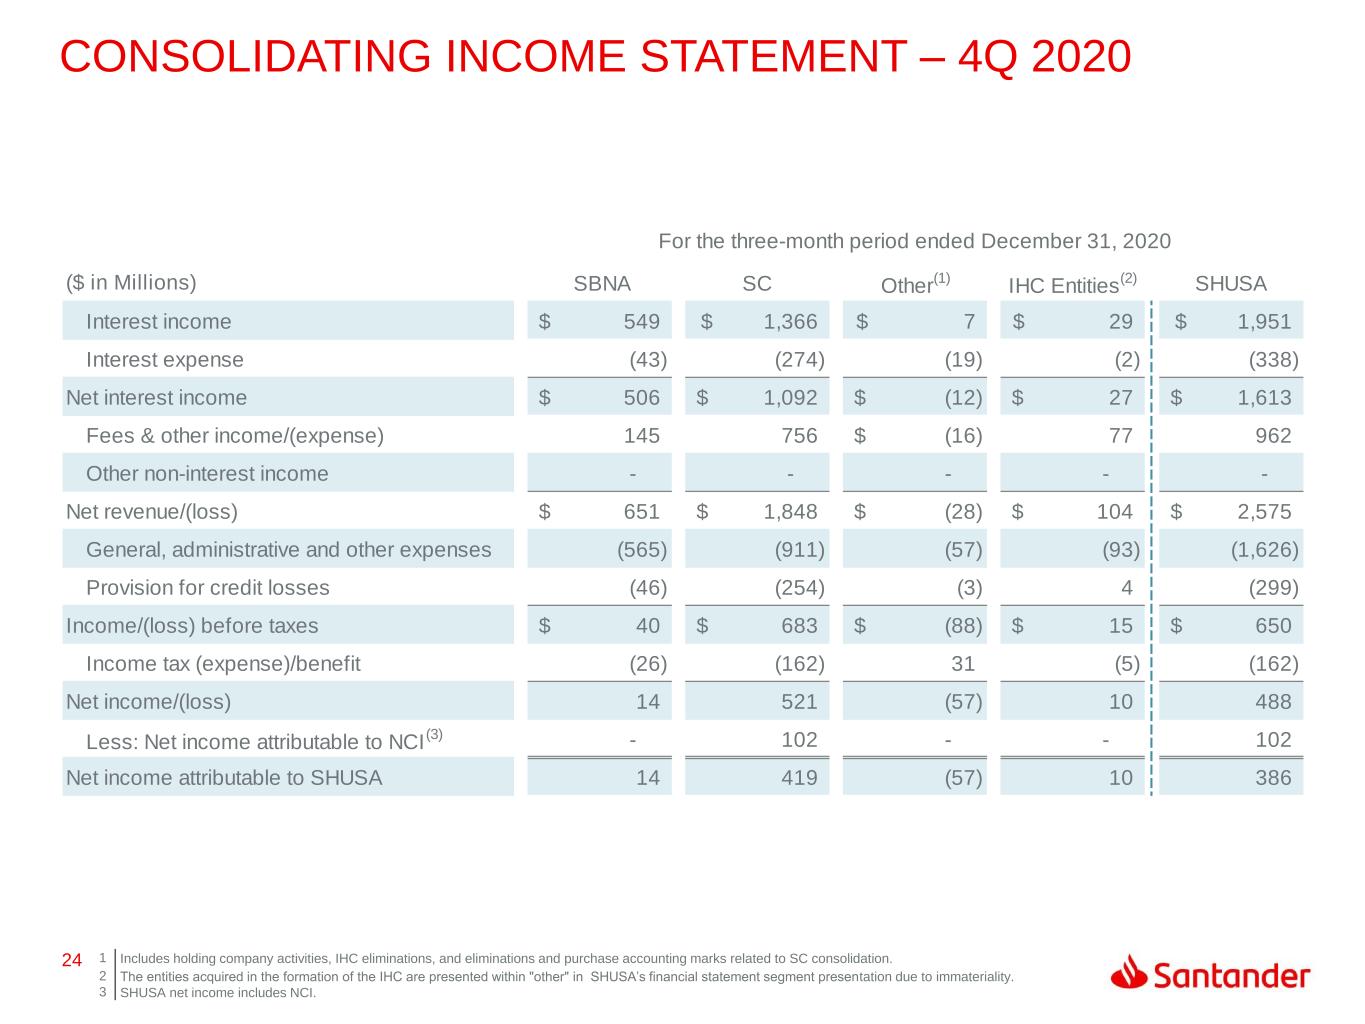
24 CONSOLIDATING INCOME STATEMENT – 4Q 2020 1 Includes holding company activities, IHC eliminations, and eliminations and purchase accounting marks related to SC consolidation. 2 3 The entities acquired in the formation of the IHC are presented within "other" in SHUSA’s financial statement segment presentation due to immateriality. SHUSA net income includes NCI. For the three-month period ended December 31, 2020 ($ in Millions) SBNA SC Other (1) IHC Entities (2) SHUSA Interest income 549$ 1,366$ 7$ 29$ 1,951$ Interest expense (43) (274) (19) (2) (338) Net interest income 506$ 1,092$ (12)$ 27$ 1,613$ Fees & other income/(expense) 145 756 (16)$ 77 962 Other non-interest income - - - - - Net revenue/(loss) 651$ 1,848$ (28)$ 104$ 2,575$ General, administrative and other expenses (565) (911) (57) (93) (1,626) Provision for credit losses (46) (254) (3) 4 (299) Income/(loss) before taxes 40$ 683$ (88)$ 15$ 650$ Income tax (expense)/benefit (26) (162) 31 (5) (162) Net income/(loss) 14 521 (57) 10 488 Less: Net income attributable to NCI (3) - 102 - - 102 Net income attributable to SHUSA 14 419 (57) 10 386
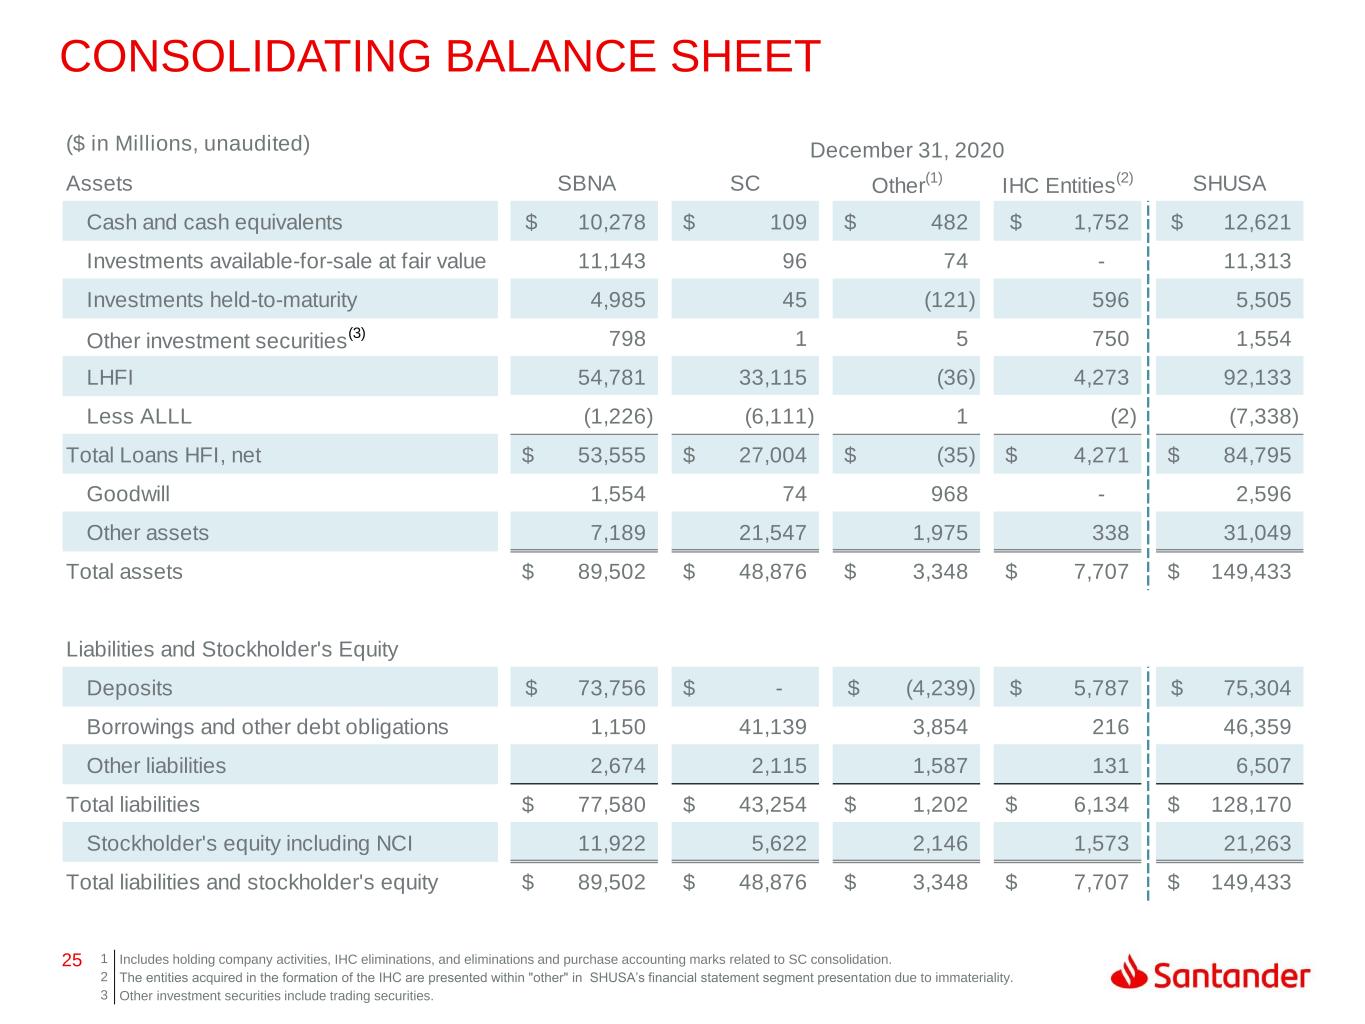
25 CONSOLIDATING BALANCE SHEET 1 Includes holding company activities, IHC eliminations, and eliminations and purchase accounting marks related to SC consolidation. 2 The entities acquired in the formation of the IHC are presented within "other" in SHUSA’s financial statement segment presentation due to immateriality. 3 Other investment securities include trading securities. ($ in Millions, unaudited) Assets SBNA SC Other (1) IHC Entities (2) SHUSA Cash and cash equivalents 10,278$ 109$ 482$ 1,752$ 12,621$ Investments available-for-sale at fair value 11,143 96 74 - 11,313 Investments held-to-maturity 4,985 45 (121) 596 5,505 Other investment securities (3) 798 1 5 750 1,554 LHFI 54,781 33,115 (36) 4,273 92,133 Less ALLL (1,226) (6,111) 1 (2) (7,338) Total Loans HFI, net 53,555$ 27,004$ (35)$ 4,271$ 84,795$ Goodwill 1,554 74 968 - 2,596 Other assets 7,189 21,547 1,975 338 31,049 Total assets 89,502$ 48,876$ 3,348$ 7,707$ 149,433$ Liabilities and Stockholder's Equity Deposits 73,756$ -$ (4,239)$ 5,787$ 75,304$ Borrowings and other debt obligations 1,150 41,139 3,854 216 46,359 Other liabilities 2,674 2,115 1,587 131 6,507 Total liabilities 77,580$ 43,254$ 1,202$ 6,134$ 128,170$ Stockholder's equity including NCI 11,922 5,622 2,146 1,573 21,263 Total liabilities and stockholder's equity 89,502$ 48,876$ 3,348$ 7,707$ 149,433$ December 31, 2020
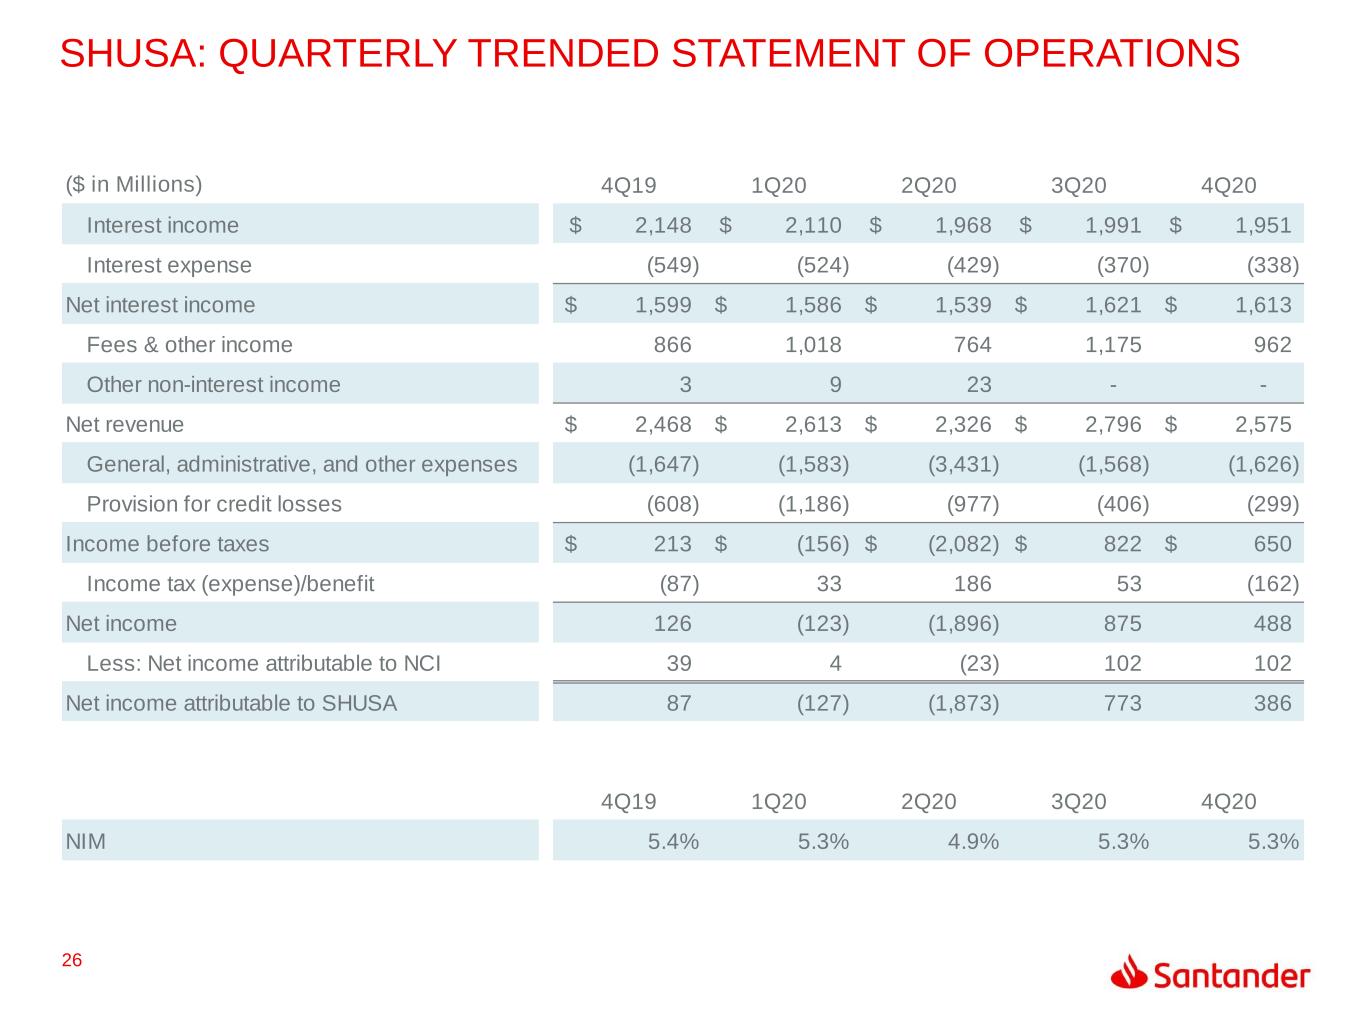
26 SHUSA: QUARTERLY TRENDED STATEMENT OF OPERATIONS ($ in Millions) 4Q19 1Q20 2Q20 3Q20 4Q20 Interest income 2,148$ 2,110$ 1,968$ 1,991$ 1,951$ Interest expense (549) (524) (429) (370) (338) Net interest income 1,599$ 1,586$ 1,539$ 1,621$ 1,613$ Fees & other income 866 1,018 764 1,175 962 Other non-interest income 3 9 23 - - Net revenue 2,468$ 2,613$ 2,326$ 2,796$ 2,575$ General, administrative, and other expenses (1,647) (1,583) (3,431) (1,568) (1,626) Provision for credit losses (608) (1,186) (977) (406) (299) Income before taxes 213$ (156)$ (2,082)$ 822$ 650$ Income tax (expense)/benefit (87) 33 186 53 (162) Net income 126 (123) (1,896) 875 488 Less: Net income attributable to NCI 39 4 (23) 102 102 Net income attributable to SHUSA 87 (127) (1,873) 773 386 4Q19 1Q20 2Q20 3Q20 4Q20 NIM 5.4% 5.3% 4.9% 5.3% 5.3%
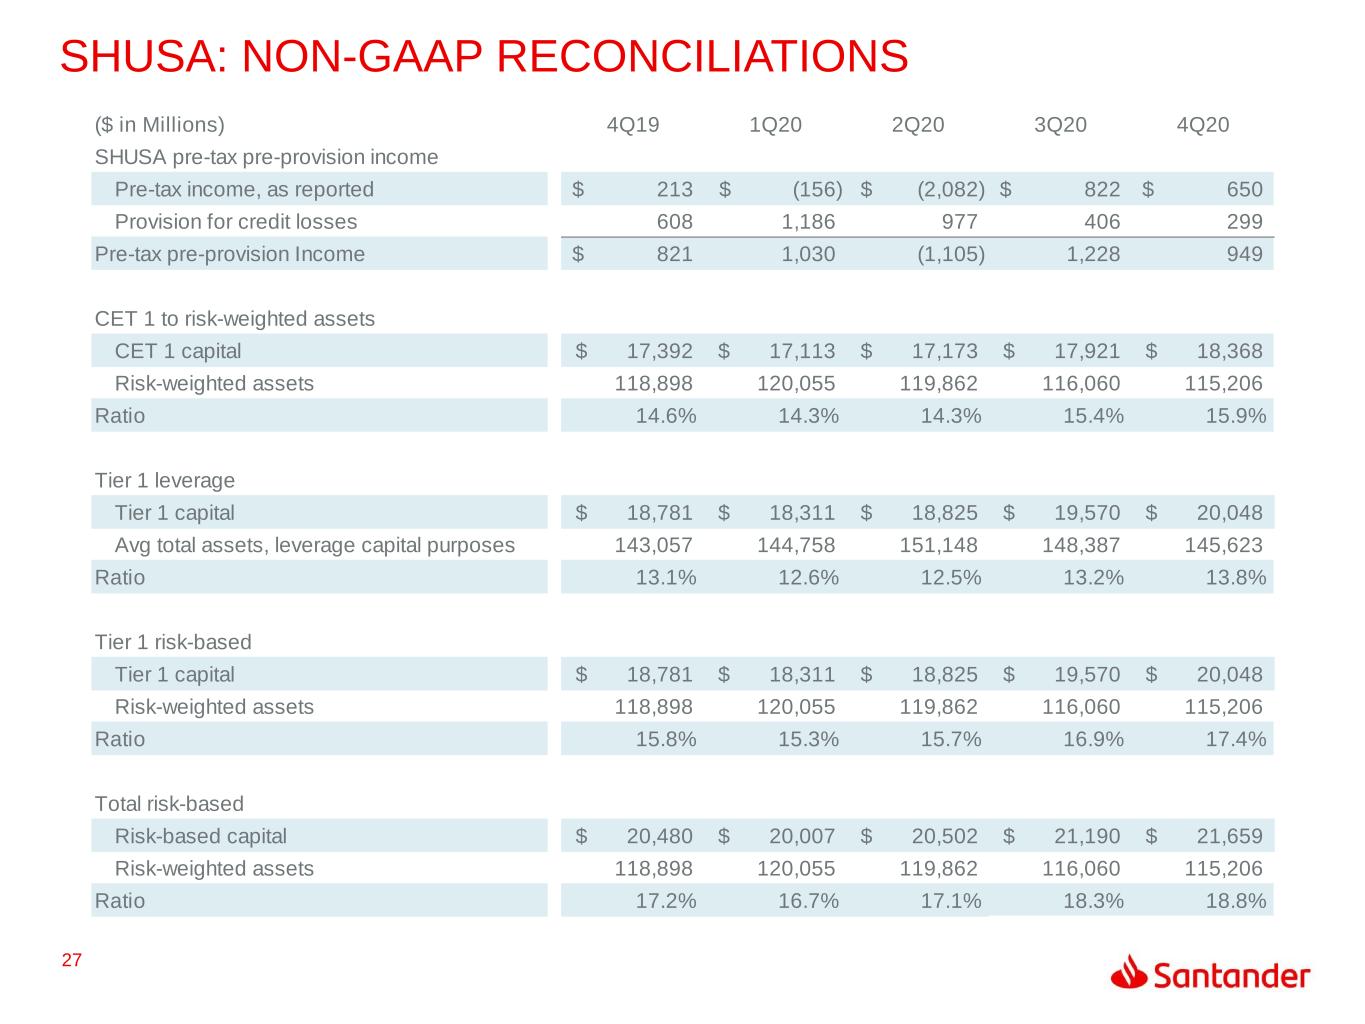
27 SHUSA: NON-GAAP RECONCILIATIONS ($ in Millions) 4Q19 1Q20 2Q20 3Q20 4Q20 SHUSA pre-tax pre-provision income Pre-tax income, as reported 213$ (156)$ (2,082)$ 822$ 650$ Provision for credit losses 608 1,186 977 406 299 Pre-tax pre-provision Income 821$ 1,030 (1,105) 1,228 949 CET 1 to risk-weighted assets CET 1 capital 17,392$ 17,113$ 17,173$ 17,921$ 18,368$ Risk-weighted assets 118,898 120,055 119,862 116,060 115,206 Ratio 14.6% 14.3% 14.3% 15.4% 15.9% Tier 1 leverage Tier 1 capital 18,781$ 18,311$ 18,825$ 19,570$ 20,048$ Avg total assets, leverage capital purposes 143,057 144,758 151,148 148,387 145,623 Ratio 13.1% 12.6% 12.5% 13.2% 13.8% Tier 1 risk-based Tier 1 capital 18,781$ 18,311$ 18,825$ 19,570$ 20,048$ Risk-weighted assets 118,898 120,055 119,862 116,060 115,206 Ratio 15.8% 15.3% 15.7% 16.9% 17.4% Total risk-based Risk-based capital 20,480$ 20,007$ 20,502$ 21,190$ 21,659$ Risk-weighted assets 118,898 120,055 119,862 116,060 115,206 Ratio 17.2% 16.7% 17.1% 18.3% 18.8%
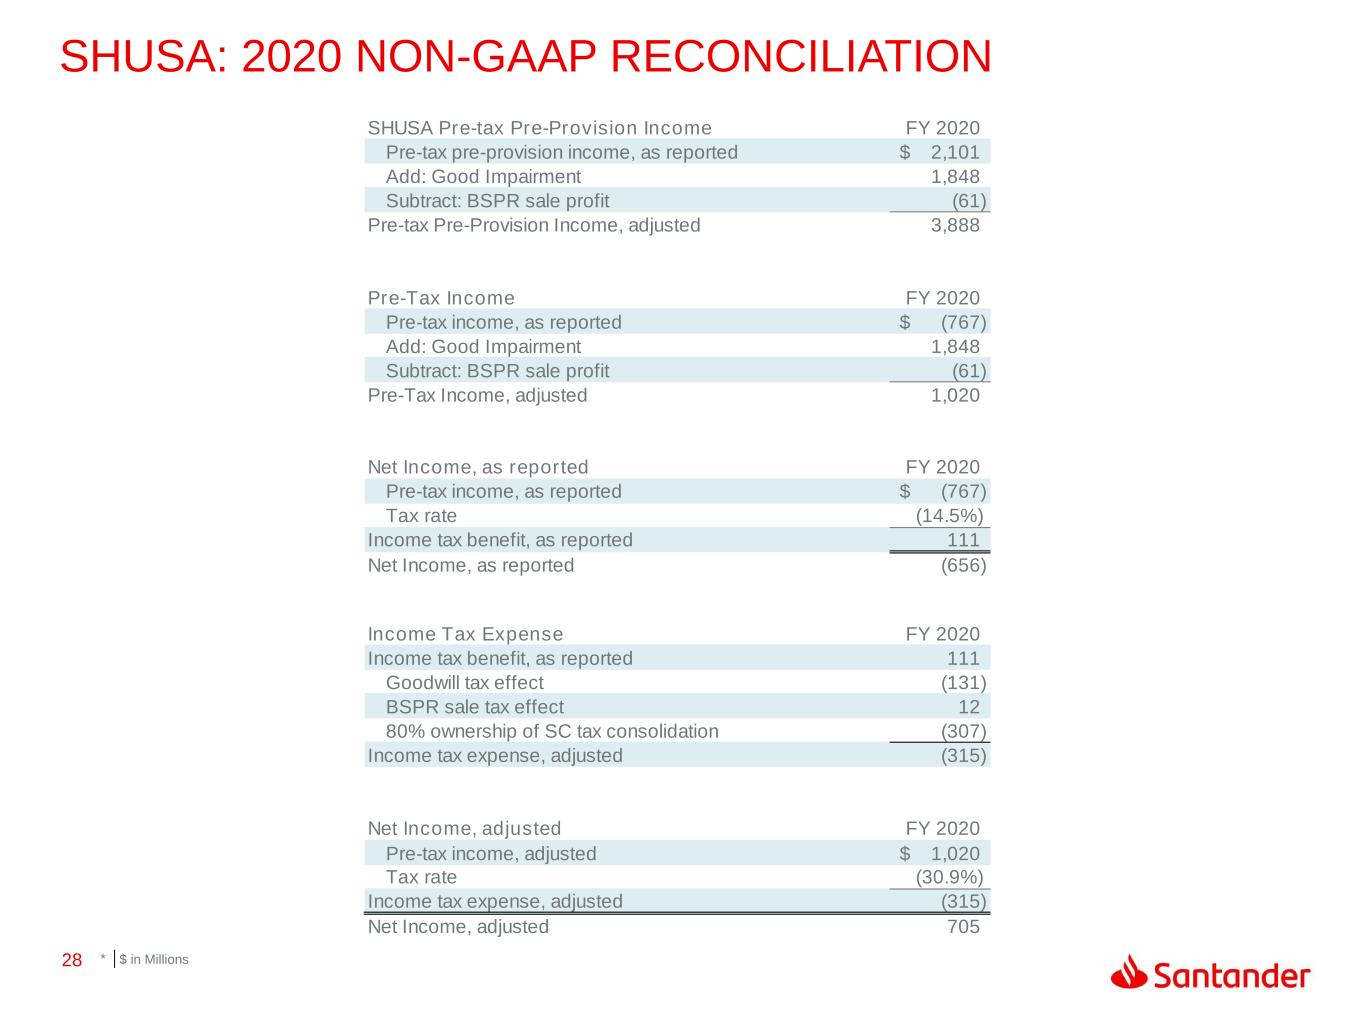
28 SHUSA: 2020 NON-GAAP RECONCILIATION SHUSA Pre-tax Pre-Provision Income FY 2020 Pre-tax pre-provision income, as reported 2,101$ Add: Good Impairment 1,848 Subtract: BSPR sale profit (61) Pre-tax Pre-Provision Income, adjusted 3,888 Pre-Tax Income FY 2020 Pre-tax income, as reported (767)$ Add: Good Impairment 1,848 Subtract: BSPR sale profit (61) Pre-Tax Income, adjusted 1,020 Net Income, as reported FY 2020 Pre-tax income, as reported (767)$ Tax rate (14.5%) Income tax benefit, as reported 111 Net Income, as reported (656) Income Tax Expense FY 2020 Income tax benefit, as reported 111 Goodwill tax effect (131) BSPR sale tax effect 12 80% ownership of SC tax consolidation (307) Income tax expense, adjusted (315) Net Income, adjusted FY 2020 Pre-tax income, adjusted 1,020$ Tax rate (30.9%) Income tax expense, adjusted (315) Net Income, adjusted 705 * $ in Millions
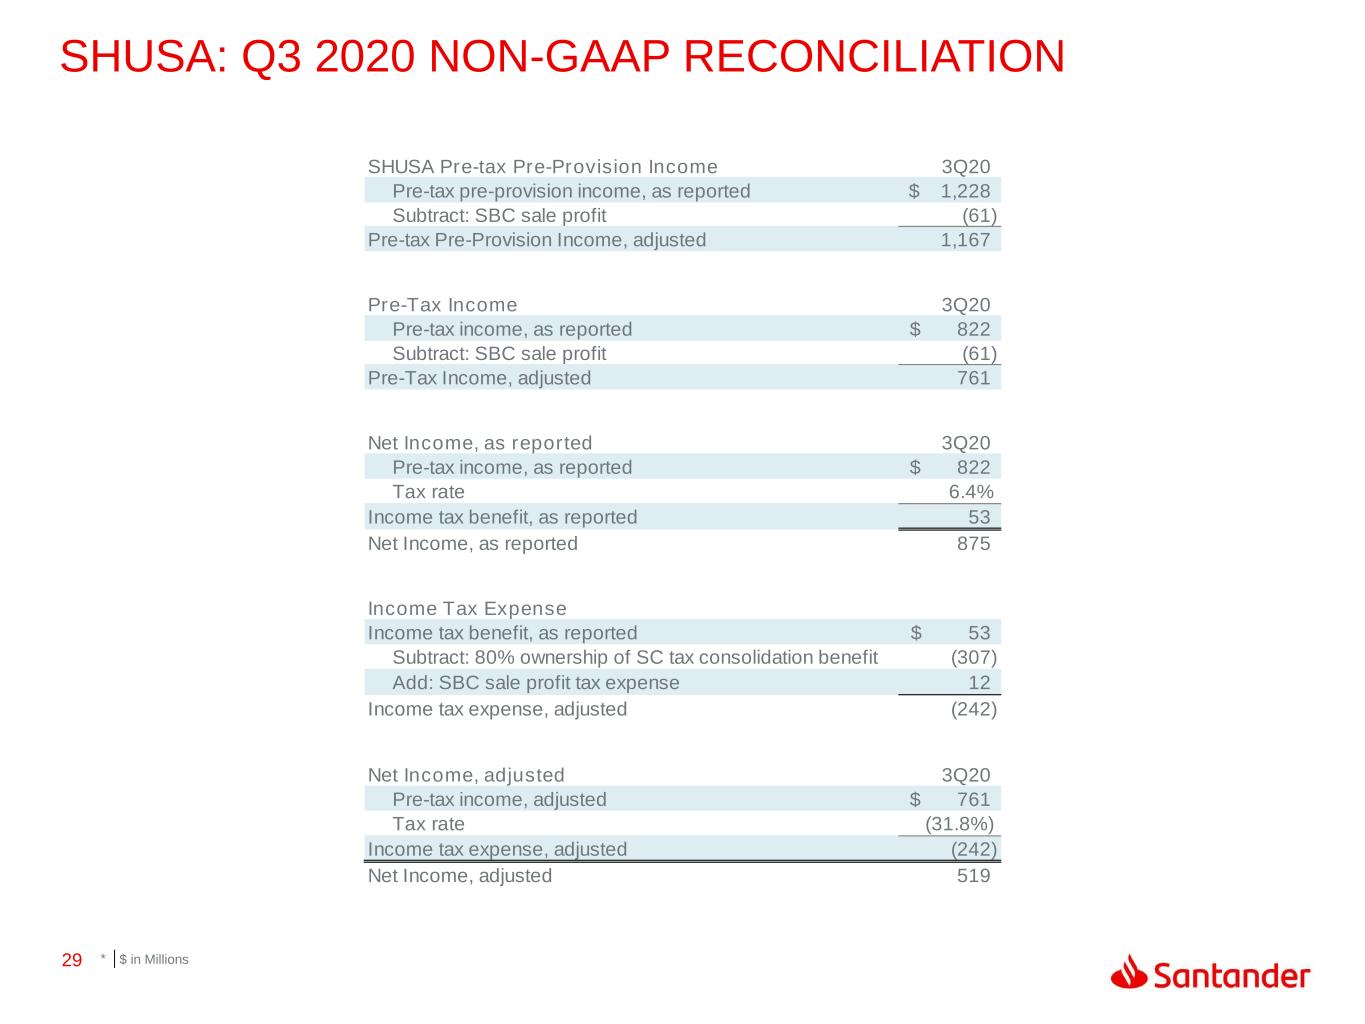
29 SHUSA: Q3 2020 NON-GAAP RECONCILIATION SHUSA Pre-tax Pre-Provision Income 3Q20 Pre-tax pre-provision income, as reported 1,228$ Subtract: SBC sale profit (61) Pre-tax Pre-Provision Income, adjusted 1,167 Pre-Tax Income 3Q20 Pre-tax income, as reported 822$ Subtract: SBC sale profit (61) Pre-Tax Income, adjusted 761 Net Income, as reported 3Q20 Pre-tax income, as reported 822$ Tax rate 6.4% Income tax benefit, as reported 53 Net Income, as reported 875 Income Tax Expense Income tax benefit, as reported 53$ Subtract: 80% ownership of SC tax consolidation benefit (307) Add: SBC sale profit tax expense 12 Income tax expense, adjusted (242) Net Income, adjusted 3Q20 Pre-tax income, adjusted 761$ Tax rate (31.8%) Income tax expense, adjusted (242) Net Income, adjusted 519 * $ in Millions
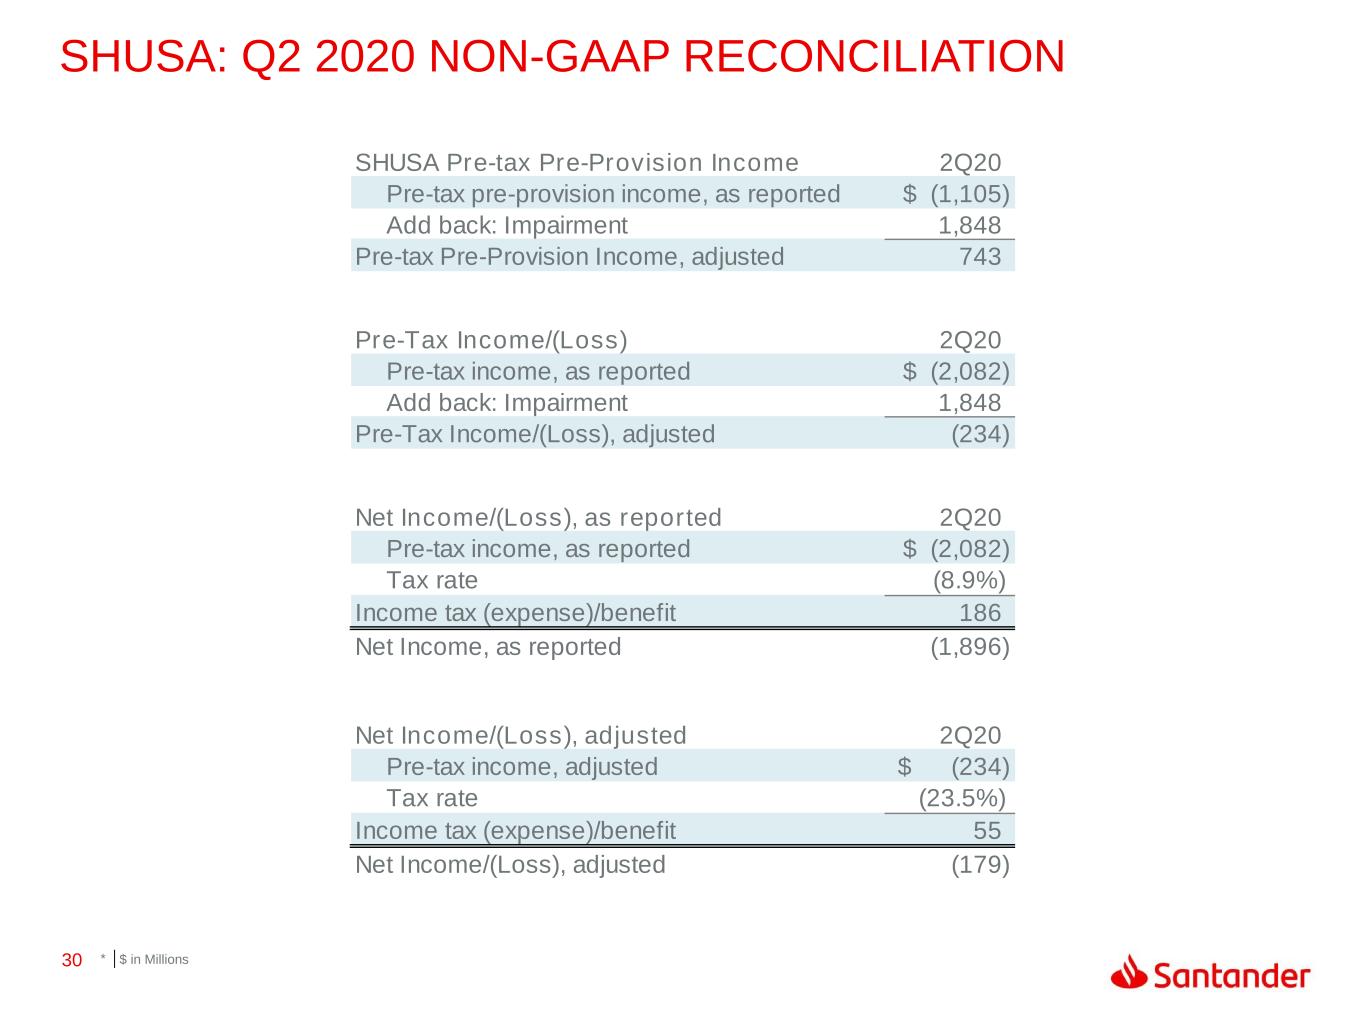
30 SHUSA: Q2 2020 NON-GAAP RECONCILIATION SHUSA Pre-tax Pre-Provision Income 2Q20 Pre-tax pre-provision income, as reported (1,105)$ Add back: Impairment 1,848 Pre-tax Pre-Provision Income, adjusted 743 Pre-Tax Income/(Loss) 2Q20 Pre-tax income, as reported (2,082)$ Add back: Impairment 1,848 Pre-Tax Income/(Loss), adjusted (234) Net Income/(Loss), as reported 2Q20 Pre-tax income, as reported (2,082)$ Tax rate (8.9%) Income tax (expense)/benefit 186 Net Income, as reported (1,896) Net Income/(Loss), adjusted 2Q20 Pre-tax income, adjusted (234)$ Tax rate (23.5%) Income tax (expense)/benefit 55 Net Income/(Loss), adjusted (179) * $ in Millions
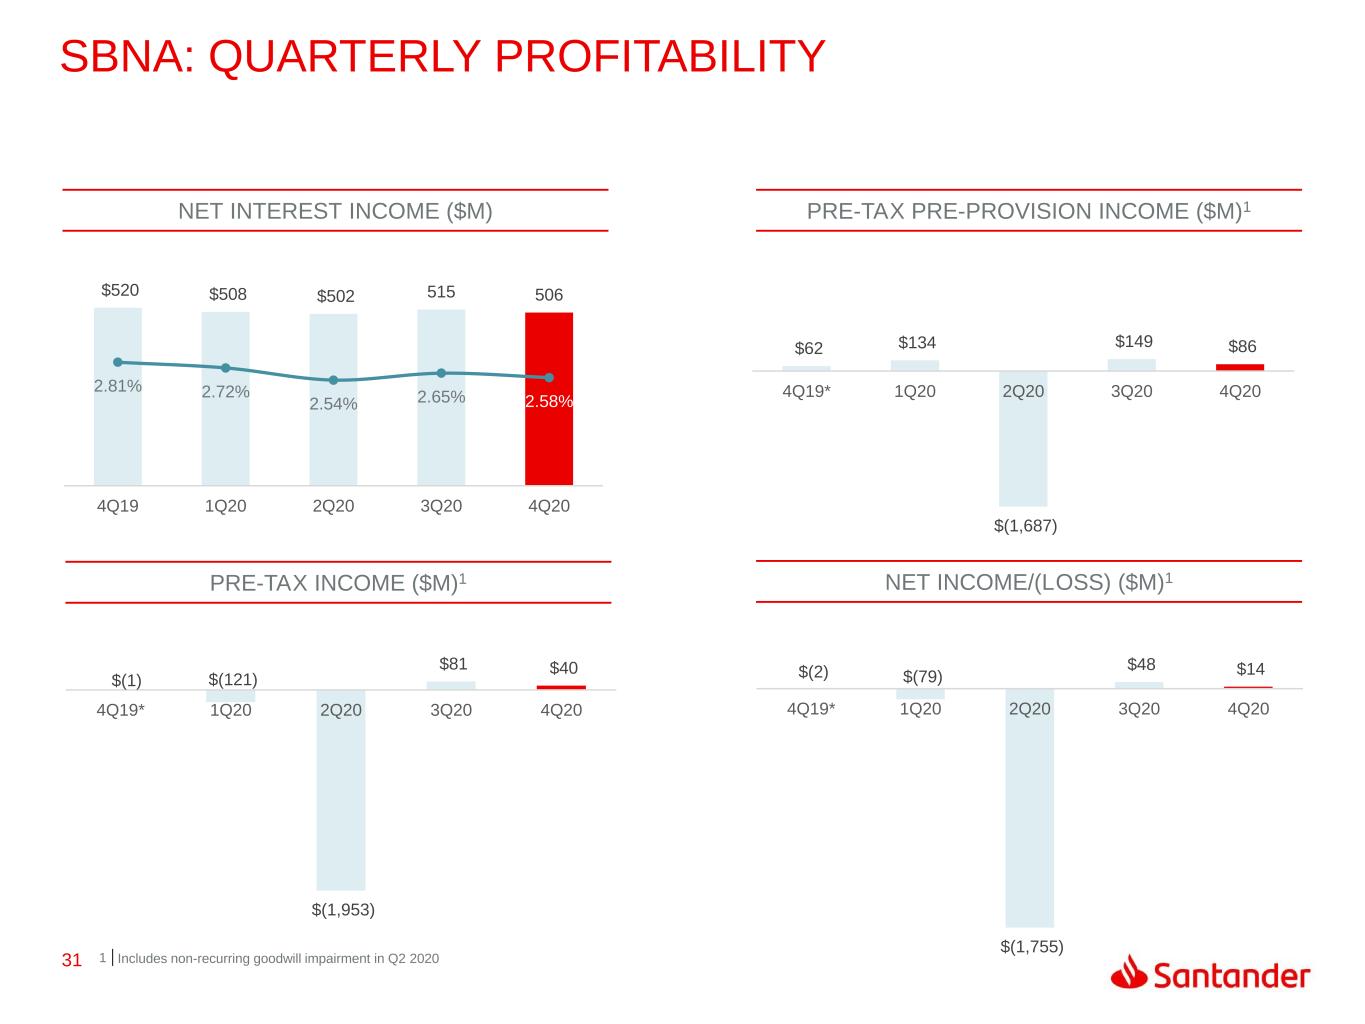
31 $62 $134 $(1,687) $149 $86 4Q19* 1Q20 2Q20 3Q20 4Q20 $520 $508 $502 515 506 2.81% 2.72% 2.54% 2.65% 2.58% 1.00% 1.50% 2.00% 2.50% 3.00% 3.50% 4.00% $- $100 $200 $300 $400 $500 $600 4Q19 1Q20 2Q20 3Q20 4Q20 $(1) $(121) $(1,953) $81 $40 4Q19* 1Q20 2Q20 3Q20 4Q20 $(2) $(79) $(1,755) $48 $14 4Q19* 1Q20 2Q20 3Q20 4Q20 SBNA: QUARTERLY PROFITABILITY NET INTEREST INCOME ($M) PRE-TAX INCOME ($M)1 NET INCOME/(LOSS) ($M)1 PRE-TAX PRE-PROVISION INCOME ($M)1 1 Includes non-recurring goodwill impairment in Q2 2020
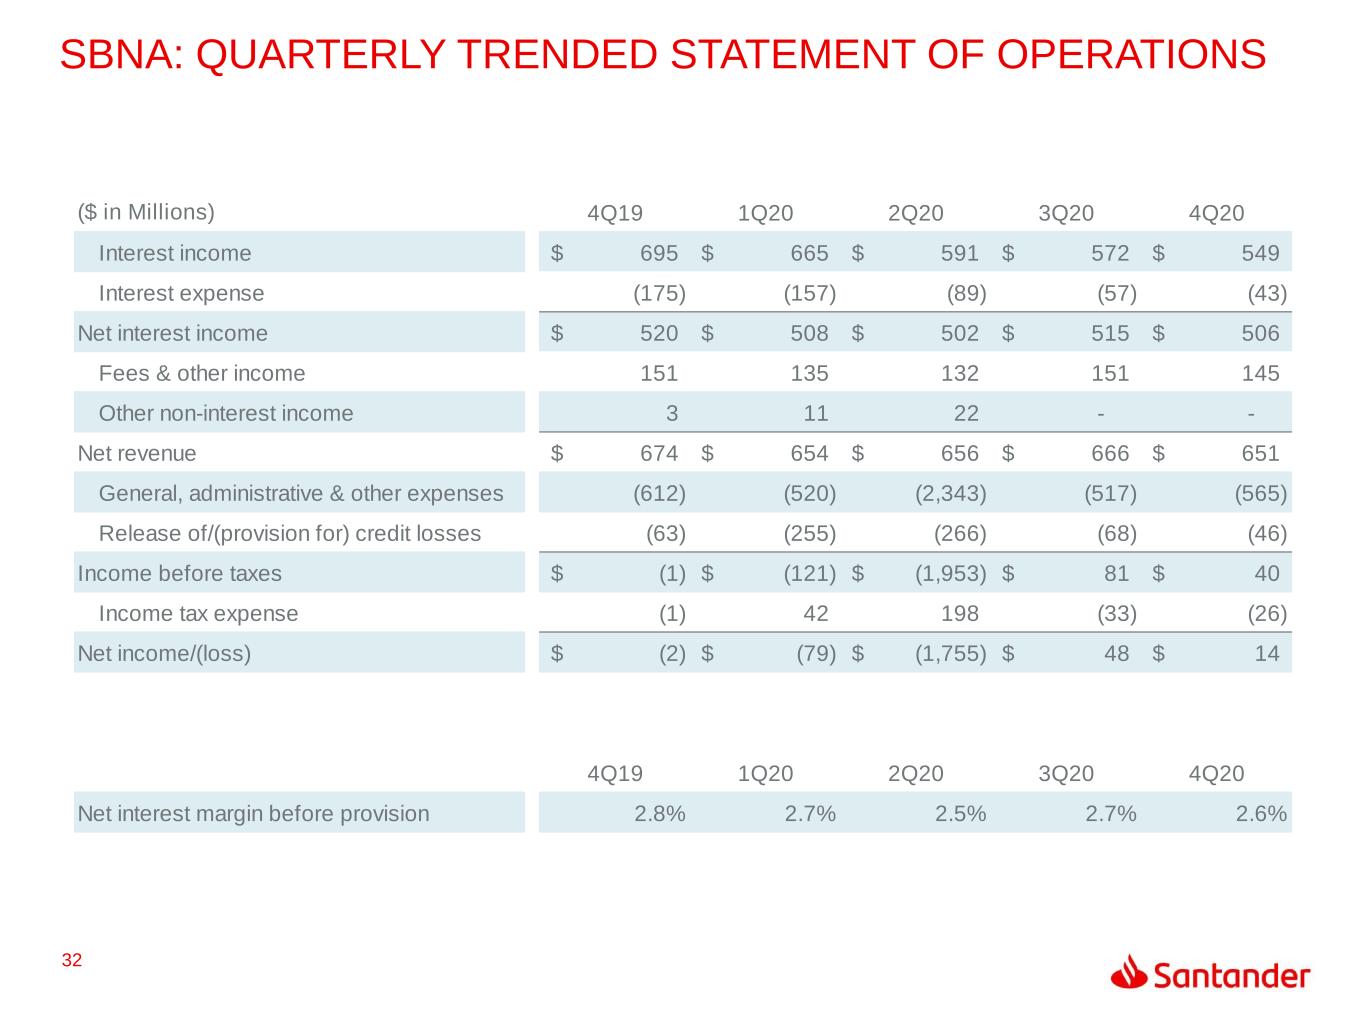
32 SBNA: QUARTERLY TRENDED STATEMENT OF OPERATIONS ($ in Millions) 4Q19 1Q20 2Q20 3Q20 4Q20 Interest income 695$ 665$ 591$ 572$ 549$ Interest expense (175) (157) (89) (57) (43) Net interest income 520$ 508$ 502$ 515$ 506$ Fees & other income 151 135 132 151 145 Other non-interest income 3 11 22 - - Net revenue 674$ 654$ 656$ 666$ 651$ General, administrative & other expenses (612) (520) (2,343) (517) (565) Release of/(provision for) credit losses (63) (255) (266) (68) (46) Income before taxes (1)$ (121)$ (1,953)$ 81$ 40$ Income tax expense (1) 42 198 (33) (26) Net income/(loss) (2)$ (79)$ (1,755)$ 48$ 14$ 4Q19 1Q20 2Q20 3Q20 4Q20 Net interest margin before provision 2.8% 2.7% 2.5% 2.7% 2.6%
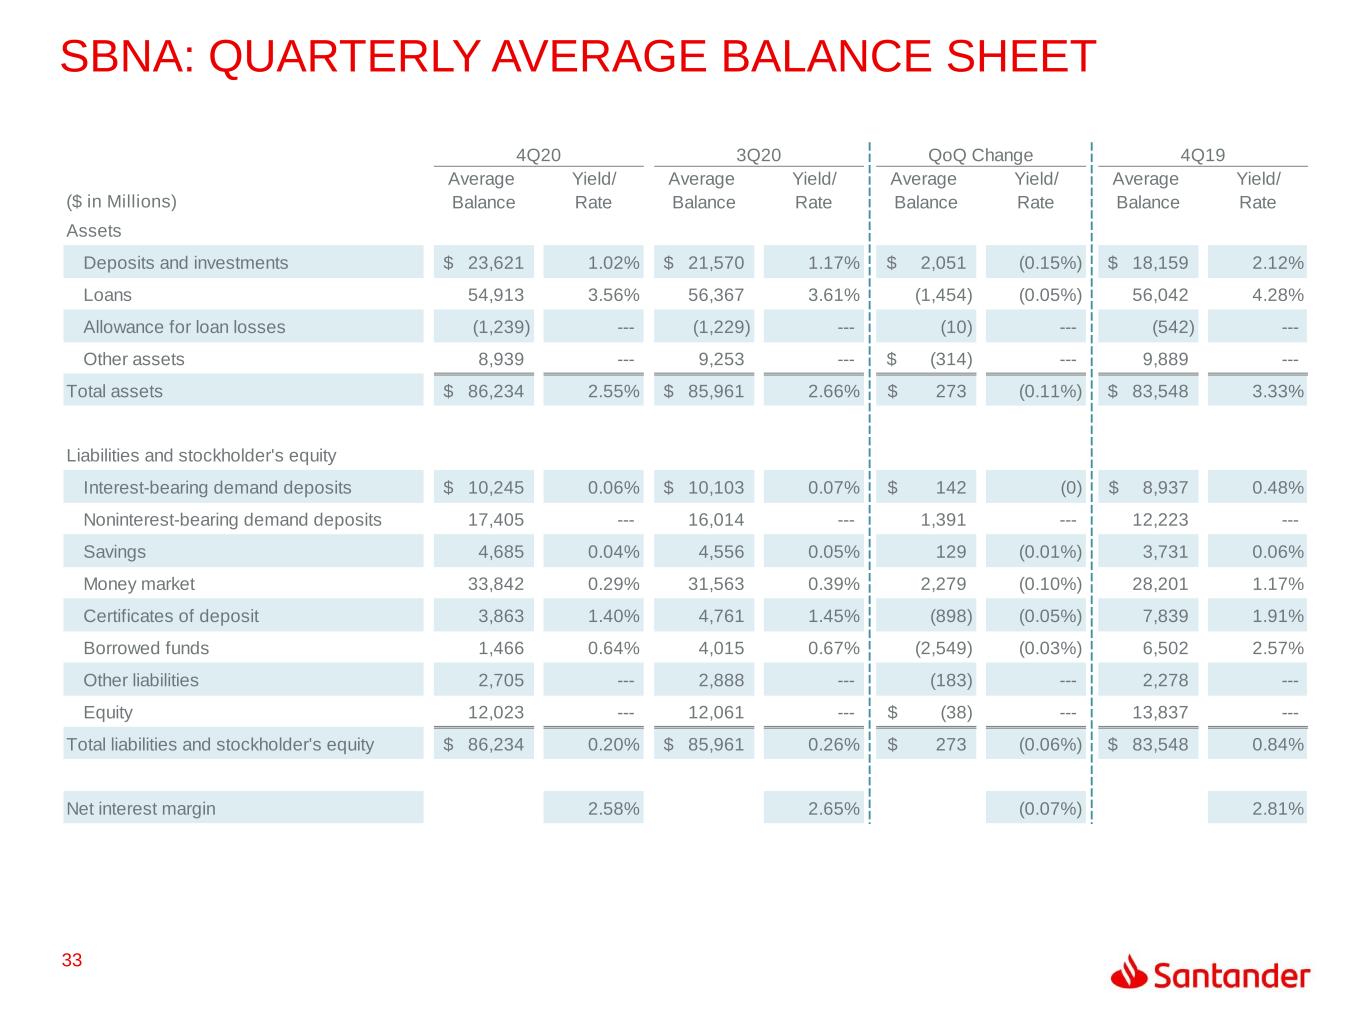
33 SBNA: QUARTERLY AVERAGE BALANCE SHEET Average Yield/ Average Yield/ Average Yield/ Average Yield/ ($ in Millions) Balance Rate Balance Rate Balance Rate Balance Rate Assets Deposits and investments 23,621$ 1.02% 21,570$ 1.17% 2,051$ (0.15%) 18,159$ 2.12% Loans 54,913 3.56% 56,367 3.61% (1,454) (0.05%) 56,042 4.28% Allowance for loan losses (1,239) --- (1,229) --- (10) --- (542) --- Other assets 8,939 --- 9,253 --- (314)$ --- 9,889 --- Total assets 86,234$ 2.55% 85,961$ 2.66% 273$ (0.11%) 83,548$ 3.33% Liabilities and stockholder's equity Interest-bearing demand deposits 10,245$ 0.06% 10,103$ 0.07% 142$ (0) 8,937$ 0.48% Noninterest-bearing demand deposits 17,405 --- 16,014 --- 1,391 --- 12,223 --- Savings 4,685 0.04% 4,556 0.05% 129 (0.01%) 3,731 0.06% Money market 33,842 0.29% 31,563 0.39% 2,279 (0.10%) 28,201 1.17% Certificates of deposit 3,863 1.40% 4,761 1.45% (898) (0.05%) 7,839 1.91% Borrowed funds 1,466 0.64% 4,015 0.67% (2,549) (0.03%) 6,502 2.57% Other liabilities 2,705 --- 2,888 --- (183) --- 2,278 --- Equity 12,023 --- 12,061 --- (38)$ --- 13,837 --- Total liabilities and stockholder's equity 86,234$ 0.20% 85,961$ 0.26% 273$ (0.06%) 83,548$ 0.84% Net interest margin 2.58% 2.65% (0.07%) 2.81% 4Q20 3Q20 QoQ Change 4Q19
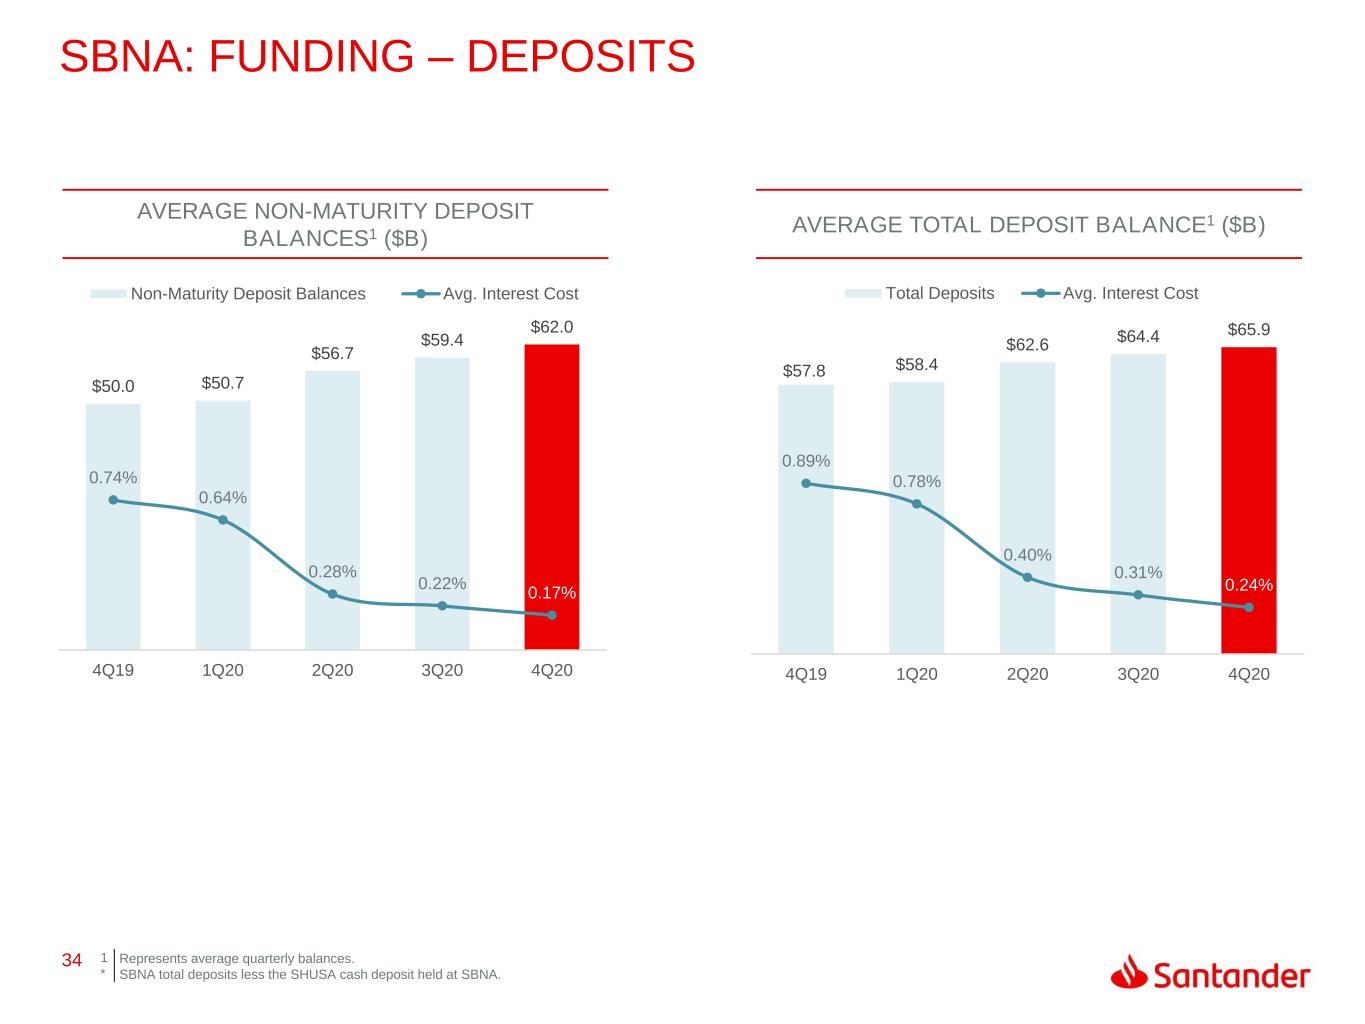
34 $50.0 $50.7 $56.7 $59.4 $62.0 0.74% 0.64% 0.28% 0.22% 0.17% 0.00% 0.20% 0.40% 0.60% 0.80% 1.00% 1.20% 1.40% 1.60% - 10.0 20.0 30.0 40.0 50.0 60.0 70.0 4Q19 1Q20 2Q20 3Q20 4Q20 Non-Maturity Deposit Balances Avg. Interest Cost $57.8 $58.4 $62.6 $64.4 $65.9 0.89% 0.78% 0.40% 0.31% 0.24% 0.00% 0.20% 0.40% 0.60% 0.80% 1.00% 1.20% 1.40% 1.60% - 10.0 20.0 30.0 40.0 50.0 60.0 70.0 4Q19 1Q20 2Q20 3Q20 4Q20 Total Deposits Avg. Interest Cost SBNA: FUNDING – DEPOSITS 1 * Represents average quarterly balances. SBNA total deposits less the SHUSA cash deposit held at SBNA. AVERAGE NON-MATURITY DEPOSIT BALANCES1 ($B) AVERAGE TOTAL DEPOSIT BALANCE1 ($B)
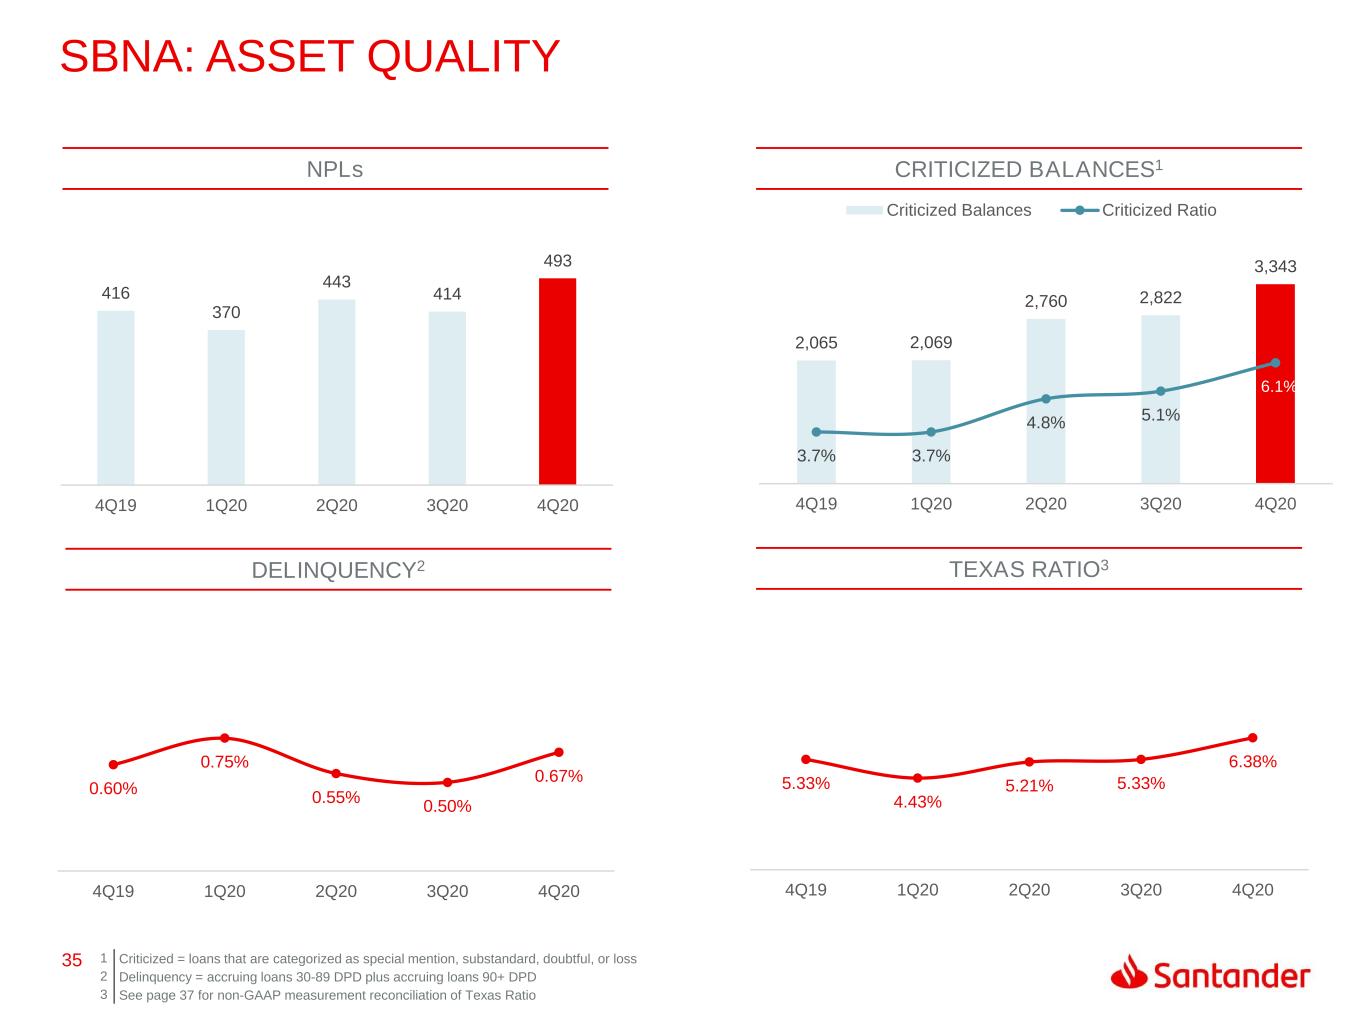
35 5.33% 4.43% 5.21% 5.33% 6.38% 4Q19 1Q20 2Q20 3Q20 4Q20 416 370 443 414 493 4Q19 1Q20 2Q20 3Q20 4Q20 2,065 2,069 2,760 2,822 3,343 3.7% 3.7% 4.8% 5.1% 6.1% 2.00% 3.00% 4.00% 5.00% 6.00% 7.00% 8.00% 9.00% 10.00% 0 500 1,000 1,500 2,000 2,500 3,000 3,500 4,000 4Q19 1Q20 2Q20 3Q20 4Q20 Criticized Balances Criticized Ratio 0.60% 0.75% 0.55% 0.50% 0.67% 4Q19 1Q20 2Q20 3Q20 4Q20 NPLs SBNA: ASSET QUALITY 1 Criticized = loans that are categorized as special mention, substandard, doubtful, or loss 2 Delinquency = accruing loans 30-89 DPD plus accruing loans 90+ DPD 3 See page 37 for non-GAAP measurement reconciliation of Texas Ratio DELINQUENCY2 TEXAS RATIO3 CRITICIZED BALANCES1
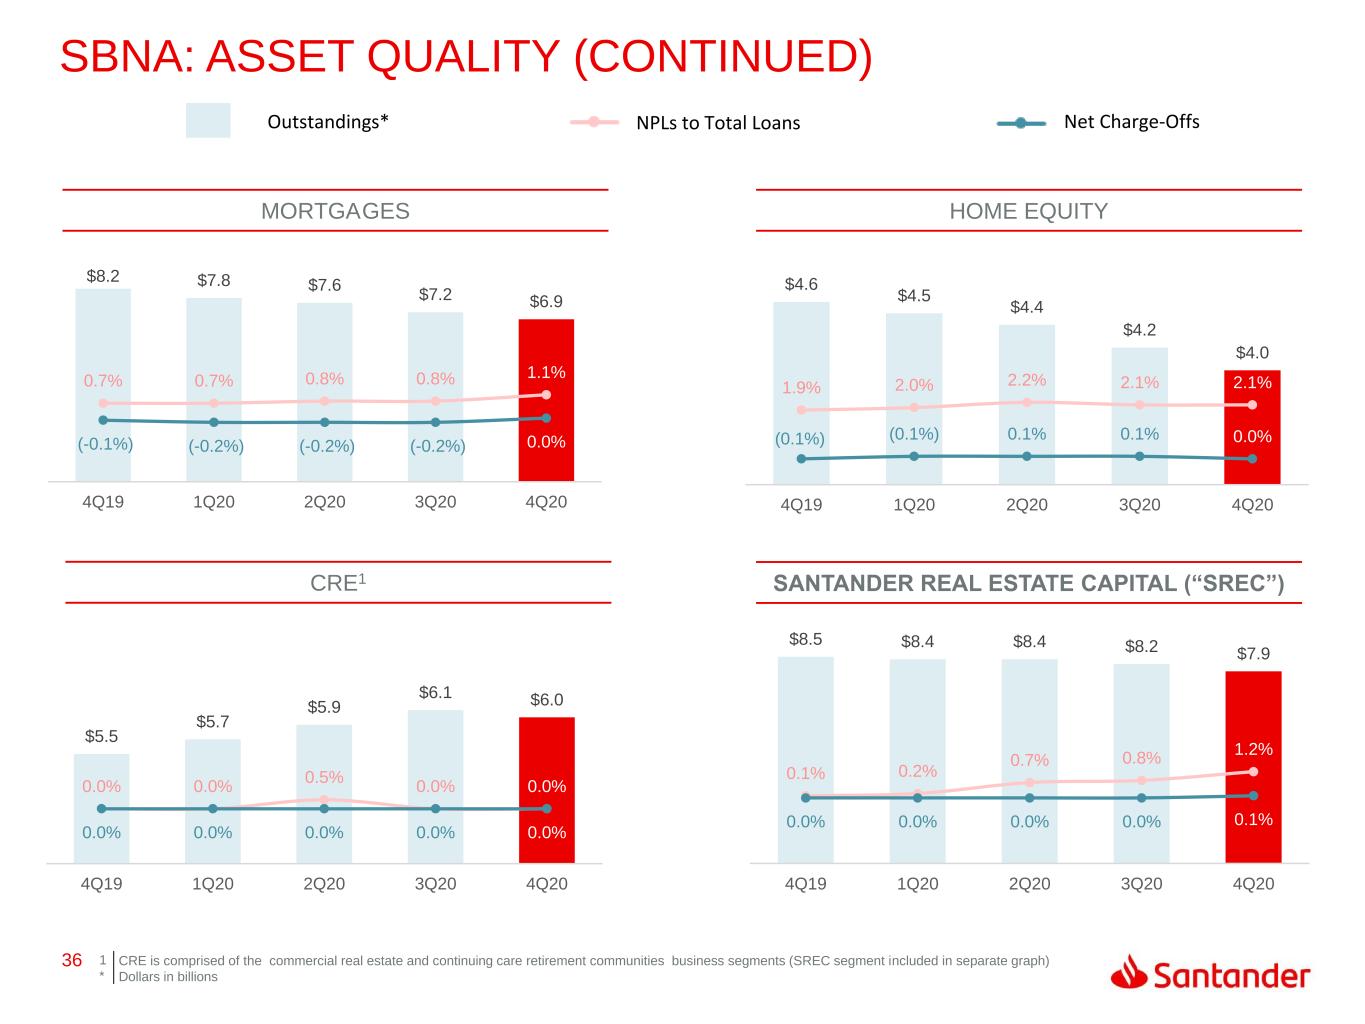
36 $5.5 $5.7 $5.9 $6.1 $6.0 0.0% 0.0% 0.5% 0.0% 0.0% 0.0% 0.0% 0.0% 0.0% 0.0% (-3.0%) (-2.0%) (-1.0%) 0.0% 1.0% 2.0% 3.0% 4.0% 5.0% 6.0% 7.0% $4.0 $4.5 $5.0 $5.5 $6.0 $6.5 4Q19 1Q20 2Q20 3Q20 4Q20 $8.5 $8.4 $8.4 $8.2 $7.9 0.1% 0.2% 0.7% 0.8% 1.2% 0.0% 0.0% 0.0% 0.0% 0.1% (-3.0%) (-2.0%) (-1.0%) 0.0% 1.0% 2.0% 3.0% 4.0% 5.0% 6.0% 7.0% $0.0 $1.0 $2.0 $3.0 $4.0 $5.0 $6.0 $7.0 $8.0 $9.0 4Q19 1Q20 2Q20 3Q20 4Q20 $8.2 $7.8 $7.6 $7.2 $6.9 0.7% 0.7% 0.8% 0.8% 1.1% (-0.1%) (-0.2%) (-0.2%) (-0.2%) 0.0% (-3.0%) (-2.0%) (-1.0%) 0.0% 1.0% 2.0% 3.0% 4.0% 5.0% 6.0% 7.0% $0.0 $1.0 $2.0 $3.0 $4.0 $5.0 $6.0 $7.0 $8.0 $9.0 4Q19 1Q20 2Q20 3Q20 4Q20 $4.6 $4.5 $4.4 $4.2 $4.0 1.9% 2.0% 2.2% 2.1% 2.1% (0.1%) (0.1%) 0.1% 0.1% 0.0% (-1.0%) 0.0% 1.0% 2.0% 3.0% 4.0% 5.0% 6.0% 7.0% $3.0 $3.2 $3.4 $3.6 $3.8 $4.0 $4.2 $4.4 $4.6 $4.8 4Q19 1Q20 2Q20 3Q20 4Q20 SBNA: ASSET QUALITY (CONTINUED) 1 * CRE is comprised of the commercial real estate and continuing care retirement communities business segments (SREC segment included.in separate graph) Dollars in billions MORTGAGES CRE1 SANTANDER REAL ESTATE CAPITAL (“SREC”) HOME EQUITY Outstandings* NPLs to Total Loans Net Charge-Offs
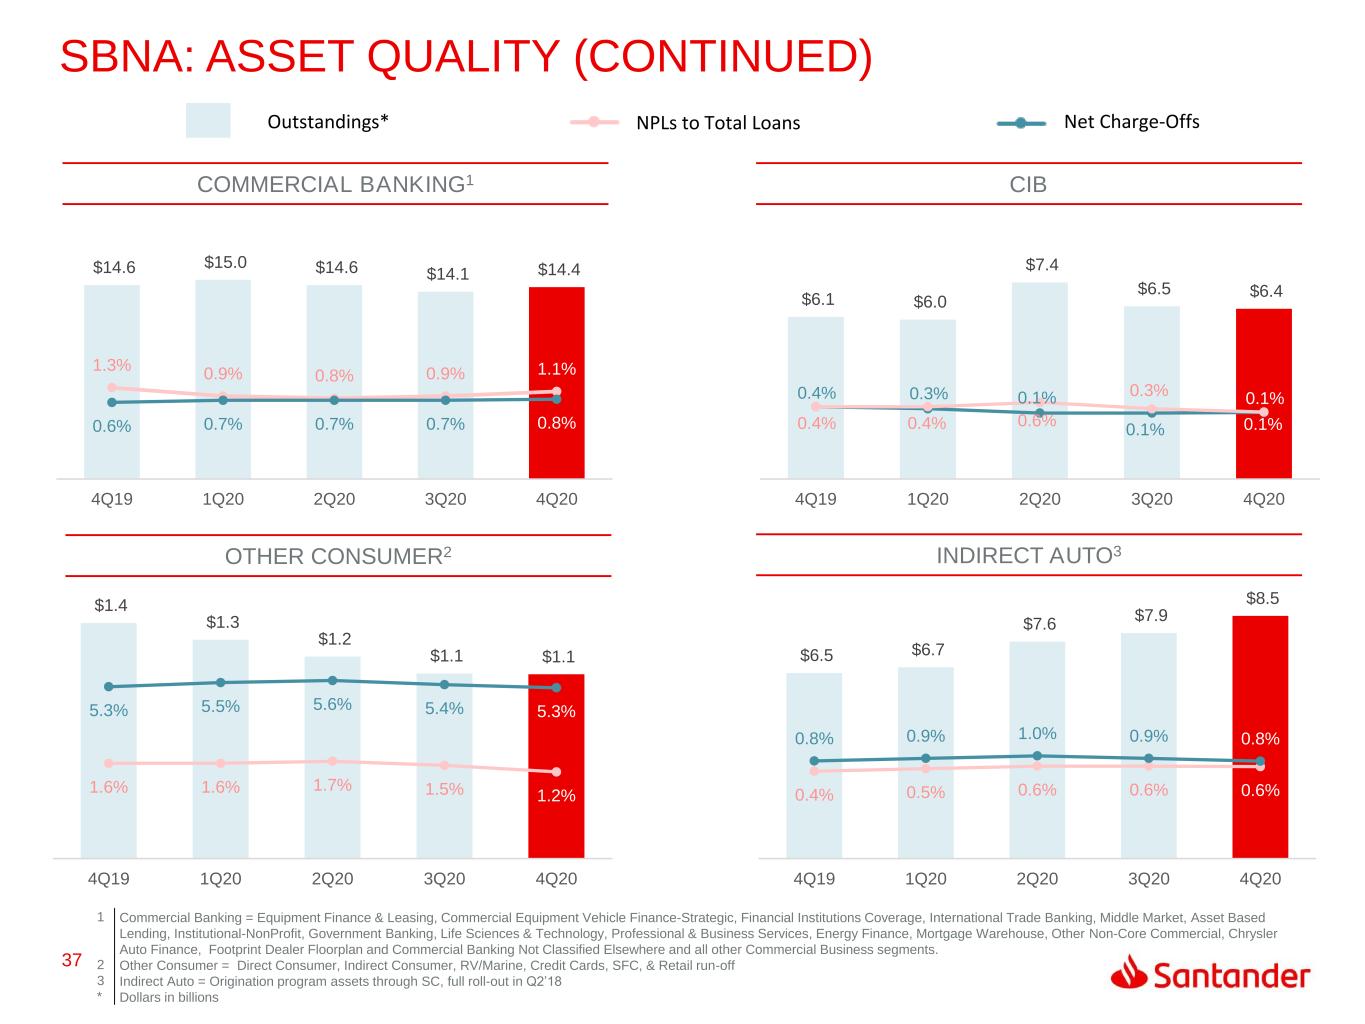
37 $1.4 $1.3 $1.2 $1.1 $1.1 1.6% 1.6% 1.7% 1.5% 1.2% 5.3% 5.5% 5.6% 5.4% 5.3% (-3.0%) (-1.0%) 1.0% 3.0% 5.0% 7.0% 9.0% - $0.2 $0.4 $0.6 $0.8 $1.0 $1.2 $1.4 $1.6 4Q19 1Q20 2Q20 3Q20 4Q20 $6.5 $6.7 $7.6 $7.9 $8.5 0.4% 0.5% 0.6% 0.6% 0.6% 0.8% 0.9% 1.0% 0.9% 0.8% (-3.0%) (-2.0%) (-1.0%) 0.0% 1.0% 2.0% 3.0% 4.0% 5.0% 6.0% 7.0% - $1.0 $2.0 $3.0 $4.0 $5.0 $6.0 $7.0 $8.0 $9.0 4Q19 1Q20 2Q20 3Q20 4Q20 $14.6 $15.0 $14.6 $14.1 $14.4 1.3% 0.9% 0.8% 0.9% 1.1% 0.6% 0.7% 0.7% 0.7% 0.8% (-3.0%) (-2.0%) (-1.0%) 0.0% 1.0% 2.0% 3.0% 4.0% 5.0% 6.0% 7.0% - $2.0 $4.0 $6.0 $8.0 $10.0 $12.0 $14.0 $16.0 4Q19 1Q20 2Q20 3Q20 4Q20 $6.1 $6.0 $7.4 $6.5 $6.4 0.4% 0.3% 0.1% 0.1% 0.1%0.4% 0.4% 0.6% 0.3% 0.1% (-3.0%) (-2.0%) (-1.0%) 0.0% 1.0% 2.0% 3.0% 4.0% 5.0% 6.0% 7.0% - $1.0 $2.0 $3.0 $4.0 $5.0 $6.0 $7.0 $8.0 4Q19 1Q20 2Q20 3Q20 4Q20 SBNA: ASSET QUALITY (CONTINUED) 1 2 3 * Commercial Banking = Equipment Finance & Leasing, Commercial Equipment Vehicle Finance-Strategic, Financial Institutions Coverage, International Trade Banking, Middle Market, Asset Based .Lending, Institutional-NonProfit, Government Banking, Life Sciences & Technology, Professional & Business Services, Energy Finance, Mortgage Warehouse, Other Non-Core Commercial, Chrysler .Auto Finance, .Footprint Dealer Floorplan and Commercial Banking Not Classified Elsewhere and all other Commercial Business segments. Other Consumer = Direct Consumer, Indirect Consumer, RV/Marine, Credit Cards, SFC, & Retail run-off Indirect Auto = Origination program assets through SC, full roll-out in Q2’18 Dollars in billions COMMERCIAL BANKING1 OTHER CONSUMER2 INDIRECT AUTO3 CIB Outstandings* NPLs to Total Loans Net Charge-Offs
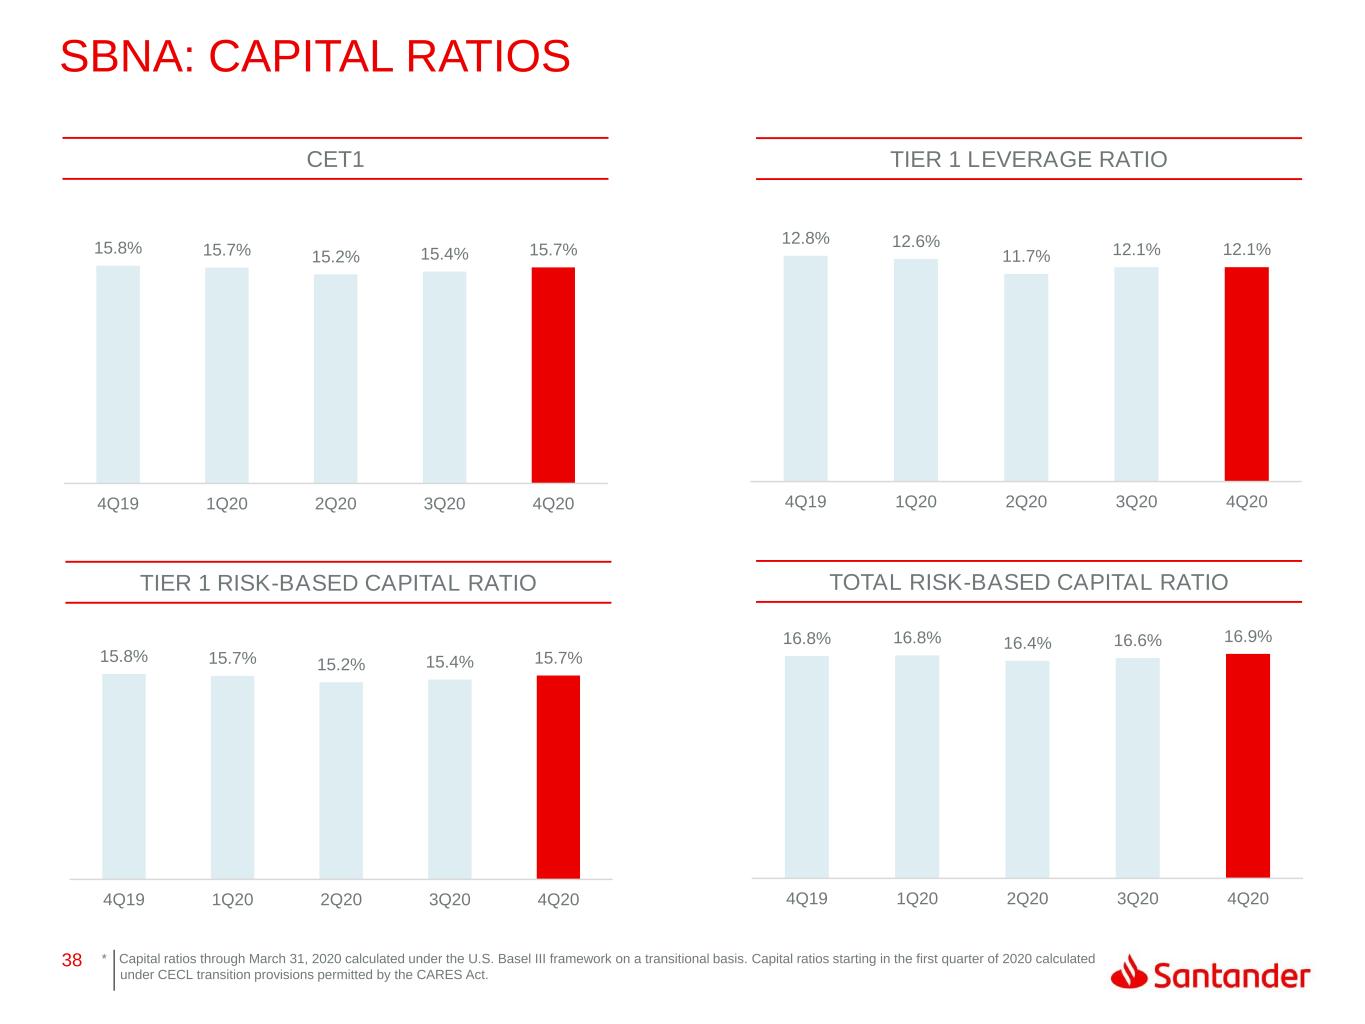
38 16.8% 16.8% 16.4% 16.6% 16.9% 4Q19 1Q20 2Q20 3Q20 4Q20 15.8% 15.7% 15.2% 15.4% 15.7% 4Q19 1Q20 2Q20 3Q20 4Q20 12.8% 12.6% 11.7% 12.1% 12.1% 4Q19 1Q20 2Q20 3Q20 4Q20 15.8% 15.7% 15.2% 15.4% 15.7% 4Q19 1Q20 2Q20 3Q20 4Q20 SBNA: CAPITAL RATIOS CET1 TIER 1 RISK-BASED CAPITAL RATIO TOTAL RISK-BASED CAPITAL RATIO TIER 1 LEVERAGE RATIO * Capital ratios through March 31, 2020 calculated under the U.S. Basel III framework on a transitional basis. Capital ratios starting in the first quarter of 2020 calculated .under CECL transition provisions permitted by the CARES Act.
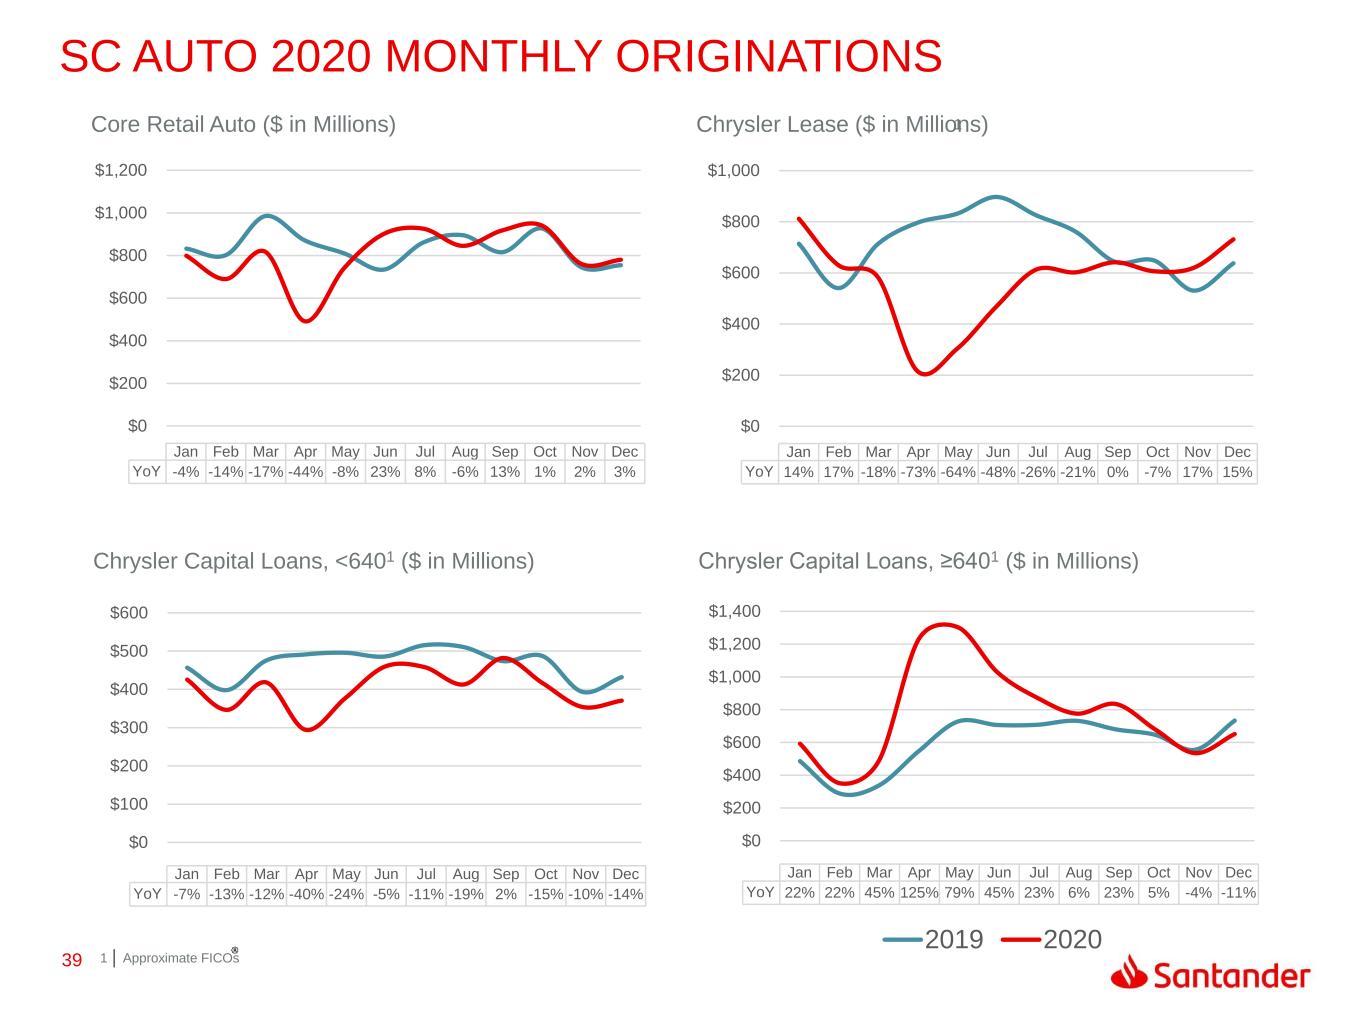
39 Jan Feb Mar Apr May Jun Jul Aug Sep Oct Nov Dec YoY 22% 22% 45% 125% 79% 45% 23% 6% 23% 5% -4% -11% 2019 2020 SC AUTO 2020 MONTHLY ORIGINATIONS $0 $200 $400 $600 $800 $1,000 $1,200 $1,400 Jan Feb Mar Apr May Jun Jul Aug Sep Oct Nov Dec YoY -7% -13% -12% -40% -24% -5% -11% -19% 2% -15% -10% -14% $0 $100 $200 $300 $400 $500 $600 Jan Feb Mar Apr May Jun Jul Aug Sep Oct Nov Dec YoY 14% 17% -18% -73% -64% -48% -26% -21% 0% -7% 17% 15% $0 $200 $400 $600 $800 $1,000 Jan Feb Mar Apr May Jun Jul Aug Sep Oct Nov Dec YoY -4% -14% -17% -44% -8% 23% 8% -6% 13% 1% 2% 3% $0 $200 $400 $600 $800 $1,000 $1,200 Core Retail Auto ($ in Millions) Chrysler Lease ($ in Millions) Chrysler Capital Loans, <6401 ($ in Millions) Chrysler Capital Loans, ≥6401 ($ in Millions) 1 1 Approximate FICOs
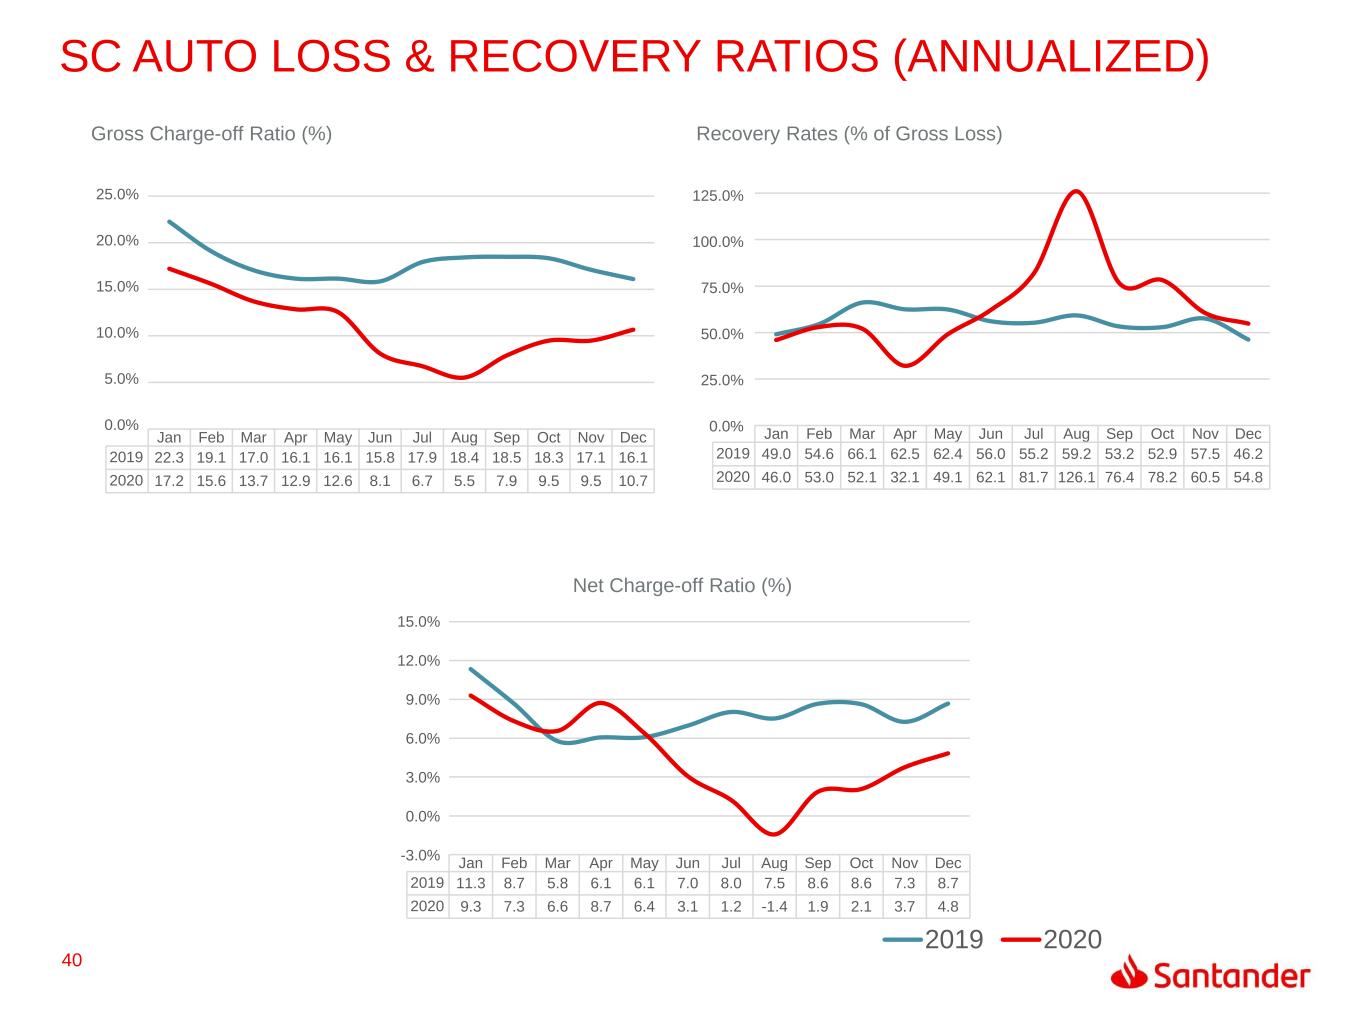
40 SC AUTO LOSS & RECOVERY RATIOS (ANNUALIZED) -3.0% 0.0% 3.0% 6.0% 9.0% 12.0% 15.0% Jan Feb Mar Apr May Jun Jul Aug Sep Oct Nov Dec 2019 11.3 8.7 5.8 6.1 6.1 7.0 8.0 7.5 8.6 8.6 7.3 8.7 2020 9.3 7.3 6.6 8.7 6.4 3.1 1.2 -1.4 1.9 2.1 3.7 4.8 Jan Feb Mar Apr May Jun Jul Aug Sep Oct Nov Dec 2019 49.0 54.6 66.1 62.5 62.4 56.0 55.2 59.2 53.2 52.9 57.5 46.2 2020 46.0 53.0 52.1 32.1 49.1 62.1 81.7 126.1 76.4 78.2 60.5 54.8 Jan Feb Mar Apr May Jun Jul Aug Sep Oct Nov Dec 2019 22.3 19.1 17.0 16.1 16.1 15.8 17.9 18.4 18.5 18.3 17.1 16.1 2020 17.2 15.6 13.7 12.9 12.6 8.1 6.7 5.5 7.9 9.5 9.5 10.7 Gross Charge-off Ratio (%) Recovery Rates (% of Gross Loss) Net Charge-off Ratio (%) 0.0% 5.0% 10.0% 15.0% 20.0% 25.0% 0.0% 25.0% 50.0% 75.0% 100.0% 125.0% 2019 2020
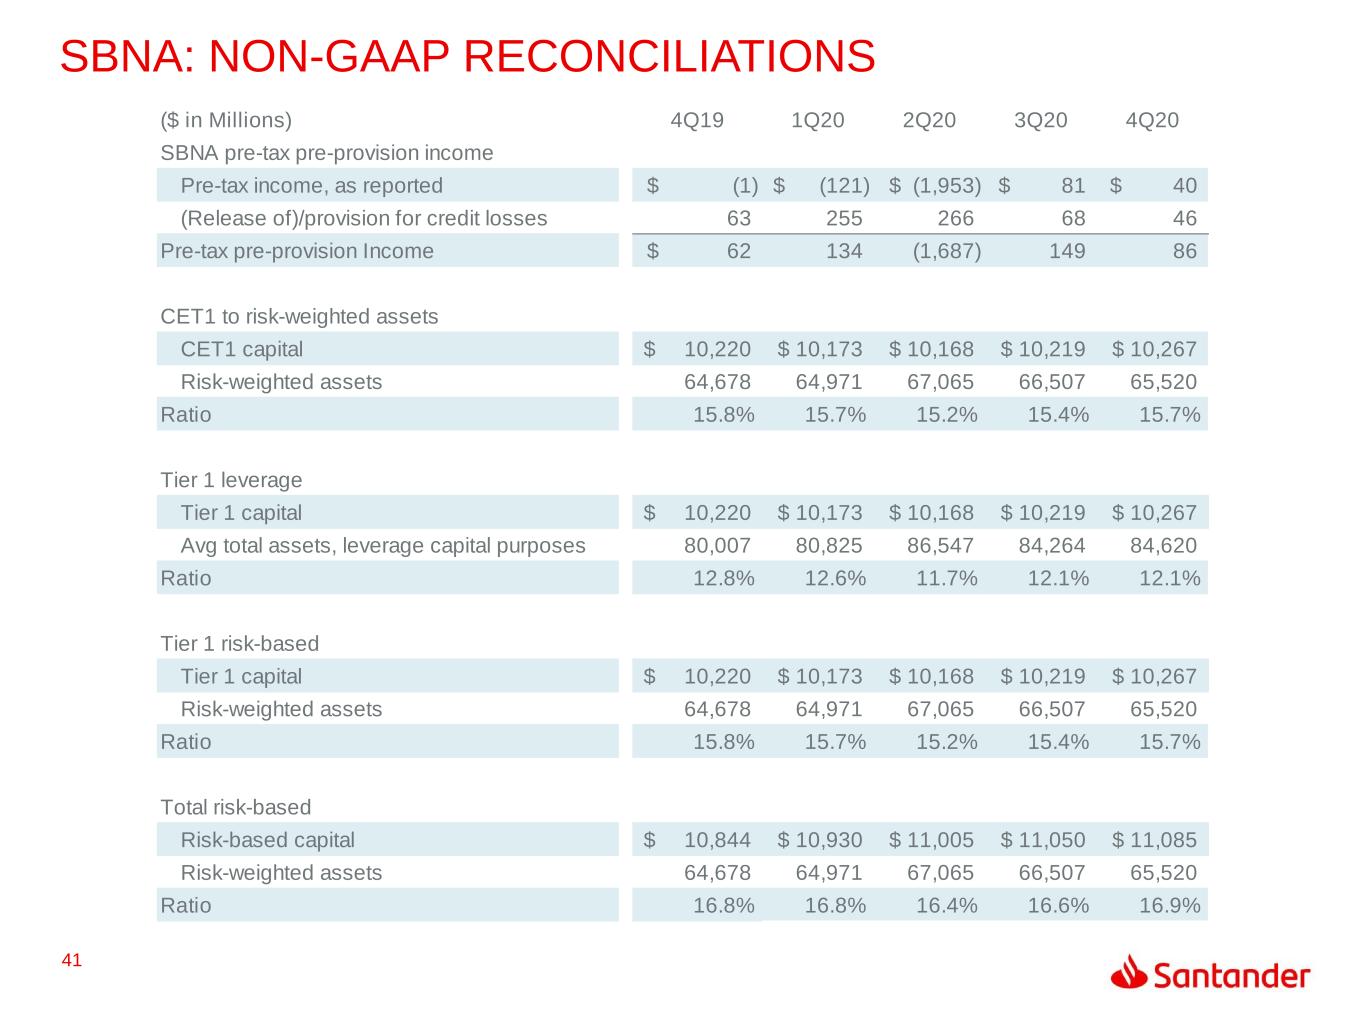
41 SBNA: NON-GAAP RECONCILIATIONS ($ in Millions) 4Q19 1Q20 2Q20 3Q20 4Q20 SBNA pre-tax pre-provision income Pre-tax income, as reported (1)$ (121)$ (1,953)$ 81$ 40$ (Release of)/provision for credit losses 63 255 266 68 46 Pre-tax pre-provision Income 62$ 134 (1,687) 149 86 CET1 to risk-weighted assets CET1 capital 10,220$ 10,173$ 10,168$ 10,219$ 10,267$ Risk-weighted assets 64,678 64,971 67,065 66,507 65,520 Ratio 15.8% 15.7% 15.2% 15.4% 15.7% Tier 1 leverage Tier 1 capital 10,220$ 10,173$ 10,168$ 10,219$ 10,267$ Avg total assets, leverage capital purposes 80,007 80,825 86,547 84,264 84,620 Ratio 12.8% 12.6% 11.7% 12.1% 12.1% Tier 1 risk-based Tier 1 capital 10,220$ 10,173$ 10,168$ 10,219$ 10,267$ Risk-weighted assets 64,678 64,971 67,065 66,507 65,520 Ratio 15.8% 15.7% 15.2% 15.4% 15.7% Total risk-based Risk-based capital 10,844$ 10,930$ 11,005$ 11,050$ 11,085$ Risk-weighted assets 64,678 64,971 67,065 66,507 65,520 Ratio 16.8% 16.8% 16.4% 16.6% 16.9%
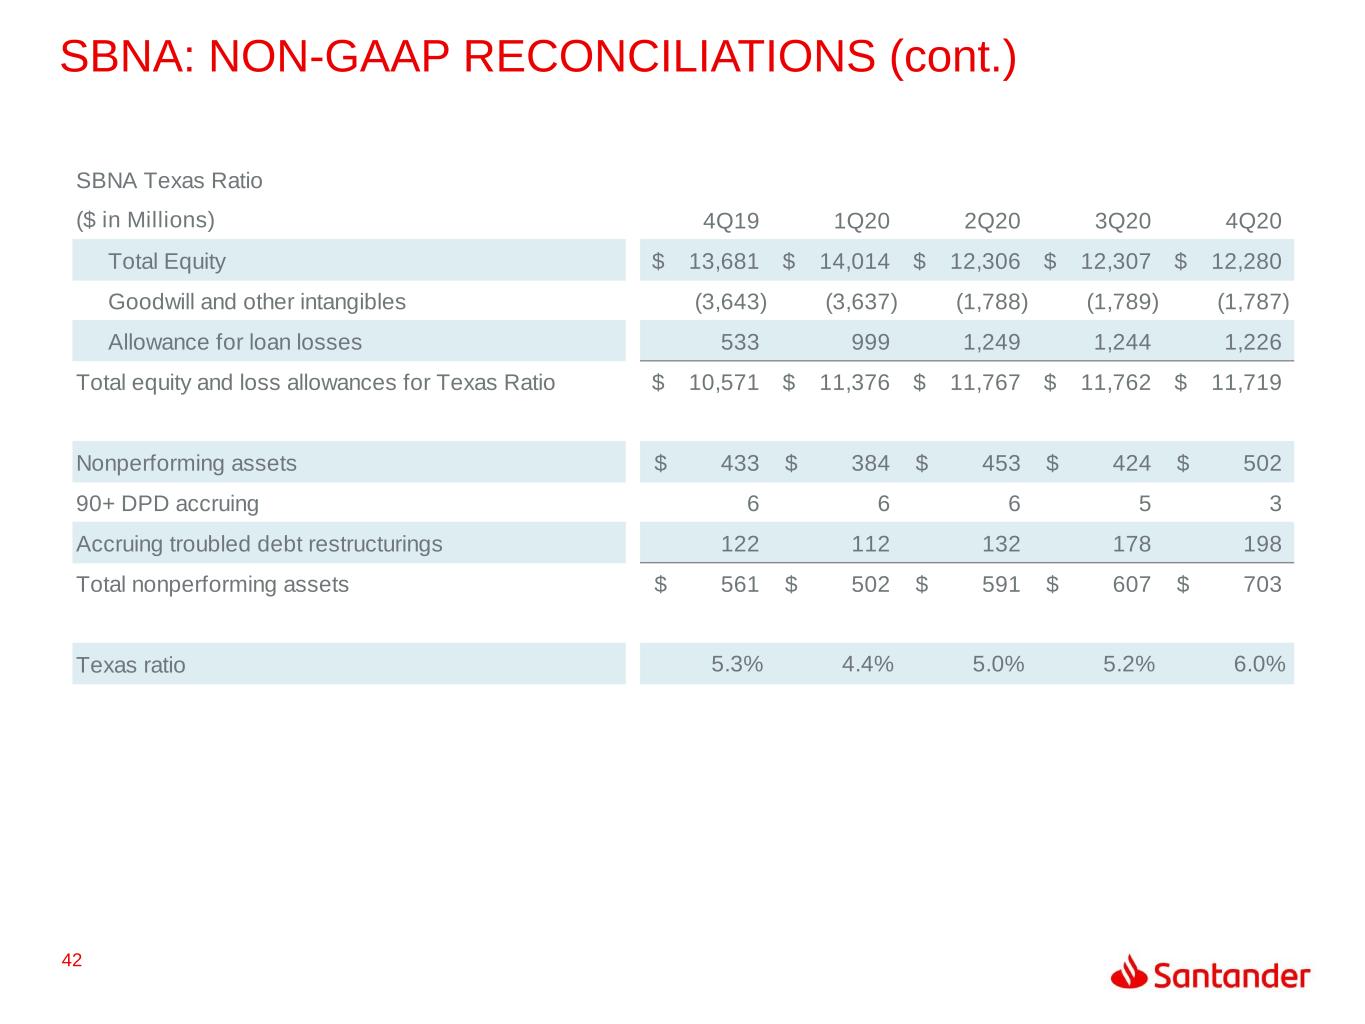
42 SBNA Texas Ratio ($ in Millions) 4Q19 1Q20 2Q20 3Q20 4Q20 Total Equity 13,681$ 14,014$ 12,306$ 12,307$ 12,280$ Goodwill and other intangibles (3,643) (3,637) (1,788) (1,789) (1,787) Allowance for loan losses 533 999 1,249 1,244 1,226 Total equity and loss allowances for Texas Ratio 10,571$ 11,376$ 11,767$ 11,762$ 11,719$ Nonperforming assets 433$ 384$ 453$ 424$ 502$ 90+ DPD accruing 6 6 6 5 3 Accruing troubled debt restructurings 122 112 132 178 198 Total nonperforming assets 561$ 502$ 591$ 607$ 703$ Texas ratio 5.3% 4.4% 5.0% 5.2% 6.0% RECONCILIATIONS (cont.) SBNA: NON-GAAP RECONCILIATIONS (cont.)
Our purpose is to help people and businesses prosper. Our culture is based on believing that everything we do should be: THANK YOU
