Attached files
| file | filename |
|---|---|
| EX-32.2 - EX-32.2 - Horizon Technology Finance Corp | tmb-20201231xex32d2.htm |
| EX-32.1 - EX-32.1 - Horizon Technology Finance Corp | tmb-20201231xex32d1.htm |
| EX-31.2 - EX-31.2 - Horizon Technology Finance Corp | tmb-20201231xex31d2.htm |
| EX-31.1 - EX-31.1 - Horizon Technology Finance Corp | tmb-20201231xex31d1.htm |
| EX-21 - EX-21 - Horizon Technology Finance Corp | tmb-20201231xex21.htm |
UNITED STATES SECURITIES AND EXCHANGE COMMISSION
Washington, D.C. 20549
Form 10-K
(Mark One) | |
⌧ | ANNUAL REPORT PURSUANT TO SECTION 13 OR 15(d) OF THE SECURITIES EXCHANGE ACT OF 1934 |
FOR THE FISCAL YEAR ENDED DECEMBER 31, 2020 | |
OR | |
◻ | TRANSITION REPORT PURSUANT TO SECTION 13 OR 15(d) OF THE SECURITIES EXCHANGE ACT OF 1934 |
FOR THE TRANSITION PERIOD FROM TO | |
COMMISSION FILE NUMBER: 814-00802
HORIZON TECHNOLOGY FINANCE CORPORATION
(Exact name of registrant as specified in its charter)
DELAWARE | 27-2114934 |
(State or other jurisdiction of | (I.R.S. Employer |
312 Farmington Avenue, | |
Farmington, CT | 06032 |
(Address of principal executive offices) | (Zip Code) |
Registrant’s telephone number, including area code (860) 676-8654
Securities registered pursuant to Section 12(b) of the Act:
Title of each class |
| Ticker symbol(s) |
| Name of each exchange on which registered |
Common Stock, par value $0.001 per share | HRZN | The Nasdaq Stock Market LLC | ||
6.25% Notes due 2022 | HTFA | The New York Stock Exchange |
Securities registered pursuant to Section 12(g) of the Act:
None
Indicate by check mark if the registrant is a well-known seasoned issuer, as defined in Rule 405 of the Securities Act. Yes ◻ No ⌧.
Indicate by check mark if the registrant is not required to file reports pursuant to Section 13 or Section 15(d) of the Act. Yes ◻ No ⌧.
Indicate by check mark whether the registrant (1) has filed all reports required to be filed by Section 13 or 15(d) of the Securities Exchange Act of 1934 during the preceding 12 months (or for such shorter period that the registrant was required to file such reports), and (2) has been subject to such filing requirements for the past 90 days. Yes ⌧ No ◻.
Indicate by check mark whether the registrant has submitted electronically every Interactive Data File required to be submitted pursuant to Rule 405 of Regulation S-T (§ 232.405 of this chapter) during the preceding 12 months (or for such shorter period that the registrant was required to submit such files). Yes ◻ No ◻
Indicate by check mark whether the registrant is a large accelerated filer, an accelerated filer, a non-accelerated filer, a smaller reporting company or an emerging growth company. See the definitions of “accelerated filer,” “large accelerated filer,” “smaller reporting company,” and “emerging growth company” in Rule 12b-2 of the Exchange Act.
Large accelerated filer ◻ | Accelerated filer ◻ | Non-accelerated filer ⌧ | Smaller Reporting Company ◻ |
Emerging Growth Company ◻ | |||
If an emerging growth company, indicate by check mark if the registrant has elected not to use the extended transition period for complying with any new or revised financial accounting standards provided pursuant to Section 13(a) of the Exchange Act. ◻
Indicate by check mark whether the registrant has filed a report on and attestation to its management’s assessment of the effectiveness of its internal control over financial reporting under Section 404(b) of the Sarbanes-Oxley Act (15 U.S.C. 7262(b)) by the registered public accounting firm that prepared or issued its audit report. ◻
Indicate by check mark whether the registrant is a shell company (as defined in Rule 12b-2 of the Exchange Act). Yes ◻ No ⌧.
The aggregate market value of common stock held by non-affiliates of the Registrant on June 30, 2020 based on the closing price on that date of $10.90 on the Nasdaq Global Select Market was $185.2 million. For the purposes of calculating this amount only, all directors and executive officers of the Registrant have been treated as affiliates. There were 19,289,946 shares of the Registrant’s common stock outstanding as of February 26, 2021.
Documents Incorporated by Reference: Portions of the Registrant’s Proxy Statement relating to the Registrant’s 2020 Annual Meeting of Stockholders to be filed not later than 120 days after the end of the fiscal year covered by this Annual Report on Form 10-K are incorporated by reference into Part III of this Annual Report on Form 10-K.
HORIZON TECHNOLOGY FINANCE CORPORATION
FORM 10-K
FOR THE YEAR ENDED DECEMBER 31, 2020
| Page | ||
| | ||
| 3 | ||
| 28 | ||
| 64 | ||
| 64 | ||
| 64 | ||
| 64 | ||
| |||
| |||
| 65 | ||
| 67 | ||
| Management’s Discussion and Analysis of Financial Condition and Results of Operations | 69 | |
| 89 | ||
| 91 | ||
| Changes in and Disagreements with Accountants on Accounting and Financial Disclosure | 140 | |
| 140 | ||
| 140 | ||
| |||
| |||
| 140 | ||
| 140 | ||
| Security Ownership of Certain Beneficial Owners and Management and Related Stockholder Matters | 141 | |
| Certain Relationships and Related Transactions, and Director Independence | 141 | |
| 141 | ||
| |||
| |||
| 141 | ||
| 145 |
2
In this annual report on Form 10-K, except where the context suggests otherwise, the terms:
| ● | “we,” “us,” “our,” “the Company” and “Horizon Technology Finance” refer to Horizon Technology Finance Corporation, a Delaware corporation, and its consolidated subsidiaries; |
| ● | The “Advisor” and the “Administrator” refer to Horizon Technology Finance Management LLC, a Delaware limited liability company; |
| ● | “Credit II” refers to Horizon Credit II LLC, a Delaware limited liability company, which is a special purpose bankruptcy remote entity and our direct subsidiary; |
| ● | “HSLFI” refers to Horizon Secured Loan Fund I, a joint venture formed with Arena Sunset SPV, LLC, or “Arena”. On April 21, 2020, the Company purchased all of the limited liability company interests of Arena in HSLFI, including, without limitation, undistributed amounts owed to Arena and interest accrued and unpaid on the debt investments of HSLFI through the date of purchase. As of April 21, 2020, HSLFI and its subsidiary are consolidated by the Company; |
| ● | “HFI” refers to Horizon Funding I, LLC, a Delaware limited liability company, which is a special purpose bankruptcy remote entity and a wholly-owned subsidiary of HSLFI, our wholly-owned subsidiary; |
| ● | “Key” refers to KeyBank National Association and “Key Facility” refers to the revolving credit facility with Key; |
| ● | “NYL Noteholders” refers to several entities owned or affiliated with New York Life Insurance Company and “NYL Facility” refers to the the credit facility where the notes are issued to the NYL Noteholders; |
| ● | “Credit Facilities” refers to collectively the Key Facility and the NYL Facility; |
| ● | “2022 Notes” or “Debt Securities” refers to the $37.4 million aggregate principal amount of our 6.25% unsecured notes due 2022, which were issued by us in September and October 2017; |
| ● | “2019-1 Securitization” refers to the $160.0 million securitization of secured loans we completed on August 13, 2019; |
| ● | “Asset-Backed Notes” refers to $100.0 million in aggregate principal amount of fixed rate asset-backed notes that were issued in conjunction with the 2019-1 Securitization; and |
| ● | The “2019-1 Trust” refers to Horizon Funding Trust 2019-1, a Delaware trust. |
Some of the statements in this annual report on Form 10-K constitute forward-looking statements which apply to both us and our consolidated subsidiaries and relate to future events, future performance or financial condition. The forward-looking statements involve risks and uncertainties for both us and our consolidated subsidiaries and actual results could differ materially from those projected in the forward-looking statements for any reason, including those factors described in “Item 1A.—Risk Factors” and elsewhere in this annual report on Form 10-K.
General
We are a specialty finance company that lends to and invests in development-stage companies in the technology, life science, healthcare information and services and sustainability industries, which we refer to as our “Target Industries.” Our investment objective is to maximize our investment portfolio’s total return by generating current income from the debt investments we make and capital appreciation from the warrants we receive when making such debt investments. We are focused on making secured debt investments, which we refer to as “Venture Loans,” to venture capital and private
3
equity backed companies and publicly traded companies in our Target Industries, which we refer to as “Venture Lending.” Our debt investments are typically secured by first liens or first liens behind a secured revolving line of credit, or collectively, “Senior Term Loans.” Venture Lending is typically characterized by (1) the making of a secured debt investment after a venture capital or equity investment in the portfolio company has been made, which investment provides a source of cash to fund the portfolio company’s debt service obligations under the Venture Loan, (2) the senior priority of the Venture Loan which requires repayment of the Venture Loan prior to the equity investors realizing a return on their capital, (3) the amortization of the Venture Loan and (4) the lender’s receipt of warrants or other success fees with the making of the Venture Loan.
We are an externally managed, closed-end, non-diversified management investment company that has elected to be regulated as a business development company, or BDC, under the Investment Company Act of 1940, as amended, or the 1940 Act. In addition, for U.S. federal income tax purposes, we have elected to be treated as a regulated investment company, or RIC, under Subchapter M of the Internal Revenue Code of 1986, as amended, or the Code. As a BDC, we are required to comply with regulatory requirements, including limitations on our use of debt. We are permitted to, and expect to, finance our investments through borrowings. Section 61(a)(2) of the 1940 Act enables BDCs to reduce their asset coverage requirements from 200% to 150%, as a result of the enactment of the Small Business Credit Availability Act, or SBCAA, in March 2018. This provision permits a BDC to double the maximum amount of leverage that it is permitted to incur. As defined in the 1940 Act, asset coverage of 150% means that for every $100 of net assets a BDC holds, it may raise up to $200 from borrowing and issuing senior securities. We received approval from our stockholders to reduce our asset coverage requirement from 200% to 150% on October 30, 2018. The amount of leverage that we may employ will depend on our assessment of market conditions and other factors at the time of any proposed borrowing. As a RIC, we generally are not subject to pay corporate-level income taxes on our investment company taxable income, determined without regard to any deductions for dividends paid, and our net capital gain that we distribute as dividends for U.S. federal income tax purposes to our stockholders as long as we meet certain source-of-income, distribution, asset diversification and other requirements.
Compass Horizon Funding Company LLC, or Compass Horizon, our predecessor company, commenced operations in March 2008. We are a Delaware corporation organized in March 2010 for the purpose of acquiring Compass Horizon and continuing its business as a public entity.
From the commencement of operations of Compass Horizon on March 4, 2008 through December 31, 2020, we funded 197 portfolio companies and invested $1.5 billion in debt investments. As of December 31, 2020, our debt investment portfolio consisted of 34 debt investments with an aggregate fair value of $333.5 million. As of December 31, 2020, 100%, or $333.5 million, of our debt investment portfolio at fair value consisted of Senior Term Loans. As of December 31, 2020, 43.5%, or $145.0 million, of our total debt investment portfolio at fair value was held through our 2019-1 Securitization. As of December 31, 2020, our net assets were $212.6 million, and all of our debt investments were secured by all or a portion of the tangible and intangible assets of the applicable portfolio company. The debt investments in our portfolio are generally not rated by any rating agency. If the individual debt investments in our portfolio were rated, they would be rated below “investment grade”. Debt investments that are unrated or rated below investment grade are sometimes referred to as “junk bonds” and have predominantly speculative characteristics with respect to the issuer’s capacity to pay interest and repay principal.
For the year ended December 31, 2020, our dollar-weighted annualized yield on average debt investments (excluding any yield from HSLFI through April 21, 2020, warrants, equity and other investments) was 14.6%. We calculate the dollar-weighted yield on average debt investments for any period as (1) total investment income (excluding income from HSLFI) during the period divided by (2) the average of the fair value of debt investments outstanding on (a) the last day of the calendar month immediately preceding the first day of the period and (b) the last day of each calendar month during the period. The dollar-weighted annualized yield on average debt investments is higher than what investors will realize because it does not reflect our expenses or any sales load paid by investors.
For the year ended December 31, 2020, our investment portfolio (including any yield from HSLFI through April 21, 2020, warrants, equity and other investments) had an overall total yield of 13.9%. We calculate the dollar-weighted yield on average investments for any period as (1) total investment income during the period divided by (2) the average of the fair value of investments outstanding on (a) the last day of the calendar month immediately preceding the first day of the period and (b) the last day of each calendar month during the period. The dollar-weighted annualized yield on average
4
investments is higher than what investors will realize because it does not reflect our expenses or any sales load paid by investors.
As of December 31, 2020, our debt investments had a dollar-weighted average term of 50 months from inception and a dollar-weighted average remaining term of 40 months. As of December 31, 2020, substantially all of our debt investments had an original committed principal amount of between $4 million and $25 million, repayment terms of between 15 and 60 months and bore current pay interest at annual interest rates of between 8% and 13%.
For the year ended December 31, 2020, our total return based on market value was 12.1%. Total return based on market value is calculated as (x) the sum of (i) the closing sales price of our common stock on the last day of the period plus (ii) the aggregate amount of distributions paid per share during the period, less (iii) the closing sales price of our common stock on the first day of the period, divided by (y) the closing sales price of our common stock on the first day of the period.
In addition to our debt investments, as of December 31, 2020, we held warrants to purchase stock, predominantly preferred stock, in 60 portfolio companies, equity positions in eight portfolio companies and success fee arrangements in five portfolio companies.
Our investment activities, and our day-to-day operations, are managed by our Advisor and supervised by our board of directors, or the Board, of which a majority of the members are independent of us. Under an investment management agreement dated March 7, 2019, or the Investment Management Agreement, we have agreed to pay our Advisor a base management fee and an incentive fee for its advisory services to us. The Investment Management Agreement was considered and reapproved by our Board, including a majority of our independent directors, on October 26, 2020. We have also entered into an administration agreement, or the Administration Agreement, with our Advisor under which we have agreed to reimburse our Advisor for our allocable portion of overhead and other expenses incurred by our Advisor in performing its obligations under the Administration Agreement.
Our common stock began trading October 29, 2010 and is currently traded on the Nasdaq Global Select Market, or Nasdaq, under the symbol “HRZN”.
Information available
Our principal executive office is located at 312 Farmington Avenue, Farmington, Connecticut 06032, our telephone number is (860) 676-8654, and our internet address is www.horizontechfinance.com. We make available, free of charge, on our website our annual report on Form 10-K, quarterly reports on Form 10-Q, current reports on Form 8-K and amendments to those reports as soon as reasonably practicable after we electronically file such material with, or furnish it to, the U.S. Securities and Exchange Commission, or the SEC. Information contained on our website is not incorporated by reference into this annual report on Form 10-K and you should not consider information contained on our website to be part of this annual report on Form 10-K or any other report we file with the SEC.
The SEC also maintains a website that contains reports, proxy and information statements and other information we file with the SEC at www.sec.gov. Copies of these reports, proxy and information statements and other information may also be obtained, after paying a duplicating fee, by electronic request at publicinfo@sec.gov.
Our advisor
Our investment activities are managed by our Advisor, and we expect to continue to benefit from our Advisor’s ability to identify attractive investment opportunities, conduct diligence on and value prospective investments, negotiate investments and manage our portfolio of investments. In addition to the experience gained from the years that they have worked together both at our Advisor and prior to the formation of our Advisor, the members of our investment team have broad lending backgrounds, with substantial experience at a variety of commercial finance companies, technology banks and private debt funds, and have developed a broad network of contacts within the venture capital and private equity community. This network of contacts provides a principal source of investment opportunities.
Our Advisor is led by six senior managers including Robert D. Pomeroy, Jr., our Chief Executive Officer, Gerald A. Michaud, our President, Daniel R. Trolio, our Senior Vice President and Chief Financial Officer, John C. Bombara, our
5
Senior Vice President, General Counsel and Chief Compliance Officer, Daniel S. Devorsetz, our Senior Vice President and Chief Investment Officer and Diane Earle, our Senior Vice President and Chief Credit Officer.
Our strategy
Our investment objective is to maximize our investment portfolio’s total return by generating current income from the loans we make and capital appreciation from the warrants we receive when making such loans. To further implement our business strategy, we expect our Advisor to continue to employ the following core strategies:
| ● | Structured investments in the venture capital and private and public equity markets. We make loans to development-stage companies within our Target Industries typically in the form of secured loans. The secured debt structure provides a lower risk strategy, as compared to equity or unsecured debt investments, to participate in the emerging technology markets because the debt structures we typically utilize provide collateral against the downside risk of loss, provide return of capital in a much shorter timeframe through current-pay interest and amortization of principal and have a senior position to equity in the borrower’s capital structure in the case of insolvency, wind down or bankruptcy. Unlike venture capital and private equity investments, our investment returns and return of our capital do not require equity investment exits such as mergers and acquisitions or initial public offerings. Instead, we receive returns on our debt investments primarily through regularly scheduled payments of principal and interest and, if necessary, liquidation of the collateral supporting the debt investment upon a default. Only the potential gains from warrants depend upon equity investment exits. |
| ● | “Enterprise value” lending. We and our Advisor take an enterprise value approach to structuring and underwriting loans. Enterprise value includes the implied valuation based upon recent equity capital invested as well as the intrinsic value of the applicable portfolio company’s particular technology, service or customer base. We secure our lien position against the enterprise value of each portfolio company. |
| ● | Creative products with attractive risk-adjusted pricing. Each of our existing and prospective portfolio companies has its own unique funding needs for the capital provided from the proceeds of our Venture Loans. These funding needs include funds for additional development “runways”, funds to hire or retain sales staff or funds to invest in research and development in order to reach important technical milestones in advance of raising additional equity. Our loans include current-pay interest, commitment fees, end-of-term payments, or ETPs, pre-payment fees, success fees and non-utilization fees. We believe we have developed pricing tools, structuring techniques and valuation metrics that satisfy our portfolio companies’ financing requirements while mitigating risk and maximizing returns on our investments. |
| ● | Opportunity for enhanced returns. To enhance our debt investment portfolio returns, in addition to interest and fees, we frequently obtain warrants to purchase the equity of our portfolio companies as additional consideration for making debt investments. The warrants we obtain generally include a “cashless exercise” provision to allow us to exercise these rights without requiring us to make any additional cash investment. Obtaining warrants in our portfolio companies has allowed us to participate in the equity appreciation of our portfolio companies, which we expect will enable us to generate higher returns for our investors. |
| ● | Direct origination. We originate transactions directly with technology, life science, healthcare information and services and sustainability companies. These transactions are referred to our Advisor from a number of sources, including referrals from, or direct solicitation of, venture capital and private equity firms, portfolio company management teams, legal firms, accounting firms, investment banks, portfolio company advisors and other lenders that represent companies within our Target Industries. Our Advisor has been the sole or lead originator in substantially all transactions in which the funds it manages have invested. |
| ● | Disciplined and balanced underwriting and portfolio management. We use a disciplined underwriting process that includes obtaining information validation from multiple sources, extensive knowledge of our Target Industries, comparable industry valuation metrics and sophisticated financial analysis related to development-stage companies. Our Advisor’s due diligence on investment prospects includes obtaining and evaluating information on the prospective portfolio company’s technology, market opportunity, management team, fund raising history, investor support, valuation considerations, financial condition and projections. We seek to balance |
6
| our investment portfolio to reduce the risk of down market cycles associated with any particular industry or sector, development-stage or geographic area by quarterly reviewing each criteria and, in the event there is an overconcentration, seeking investment opportunities to reduce such overconcentration. Our Advisor employs a “hands on” approach to portfolio management, requiring private portfolio companies to provide monthly financial information and to participate in regular updates on performance and future plans. For public companies, our Advisor typically relies on publicly reported quarterly financials. |
| ● | Use of leverage. We use leverage to increase returns on equity through our Credit Facilities, through our 2022 Notes and through our 2019-1 Securitization. See “Item 7 — Management’s Discussion and Analysis of Financial Condition and Results of Operations — Liquidity and capital resources” for additional information about our use of leverage. In addition, we may issue additional debt securities or preferred stock in one or more series in the future. |
Market opportunity
We focus our investments primarily in our Target Industries. The technology sectors we focus on include communications, networking, data storage, software, cloud computing, semiconductor, internet and media and consumer-related technologies. The life science sectors we focus on include biotechnology, drug discovery, drug delivery, bioinformatics and medical devices. The healthcare information and services sectors we focus on include diagnostics, electronic medical record services and software and other healthcare related services and technologies that improve efficiency and quality of administered healthcare. The sustainability sectors we focus on include alternative energy, power management, energy efficiency, green building materials and waste recycling. We refer to all of these companies as “technology-related” companies because the companies are developing or offering goods and services to businesses and consumers which utilize scientific knowledge, including techniques, skills, methods, devices and processes, to solve problems. We intend, under normal market conditions, to invest at least 80% of the value of our total assets in such companies.
We believe that Venture Lending has the potential to achieve enhanced returns that are attractive notwithstanding the high degree of risk associated with lending to development-stage companies. Potential benefits include:
| ● | interest rates that typically exceed rates that would be available to portfolio companies if they could borrow in traditional commercial financing transactions; |
| ● | the debt investment support provided by cash proceeds from equity capital invested by venture capital and private equity firms or access to public equity markets to access capital; |
| ● | amortization of principal; |
| ● | senior ranking to equity and collateralization of debt investments to minimize potential loss of capital; and |
| ● | potential equity appreciation through warrants. |
We believe that Venture Lending also provides an attractive financing source for portfolio companies, their management teams and their equity capital investors, as it:
| ● | is typically less dilutive to the equity holders than additional equity financing; |
| ● | extends the time period during which a portfolio company can operate before seeking additional equity capital or pursuing a sale transaction or other liquidity event; and |
| ● | allows portfolio companies to better match cash sources with uses. |
7
Competitive strengths
We believe that we, together with our Advisor, possess significant competitive strengths, which include the following:
Consistently execute commitments and close transactions. Our Advisor and its senior management and investment professionals have an extensive track record of originating, underwriting and managing Venture Loans. Our Advisor and its predecessor have directly originated, underwritten and managed Venture Loans with an aggregate original principal amount over $1.9 billion to more than 260 companies since operations commenced in 2004.
Robust direct origination capabilities. Our Advisor has significant experience originating Venture Loans in our Target Industries. This experience has given our Advisor a deep knowledge of our Target Industries and an extensive base of transaction sources and references.
Highly experienced and cohesive management team. Most of our Advisor’s senior management team of experienced professionals has been together since our inception. This consistency allows companies, their management teams and their investors to rely on consistent and predictable service, loan products and terms and underwriting standards.
Relationships with venture capital and private equity investors. Our Advisor has developed strong relationships with venture capital and private equity firms and their partners.
Well-known brand name. Our Advisor has originated Venture Loans to more than 260 companies in our Target Industries under the “Horizon Technology Finance” brand.
Competition
We compete to provide financing to development-stage companies in our Target Industries with a number of investment funds and other BDCs, as well as traditional financial services companies such as commercial banks and other financing sources. Some of our competitors are larger and have greater financial and other resources than we do. We believe we compete effectively with these entities primarily on the basis of the experience, industry knowledge and contacts of our Advisor’s investment professionals, our Advisor’s responsiveness, efficient investment analysis and decision-making processes, its creative financing products and its customized investment terms. We do not intend to compete primarily on the interest rates we offer and believe that some competitors make loans with rates that are comparable to or lower than our rates. For additional information concerning our competitive position and competitive risks, see “Item 1A — Risk Factors — General Risk Factors — We operate in a highly competitive market for investment opportunities, and if we are not able to compete effectively, our business, results of operations and financial condition may be adversely affected and the value of your investment in us could decline.”
Investment criteria
We seek to invest in companies that vary by their stage of development, their Target Industries and sectors of Target Industries and their geographical location, as well as by the venture capital and private equity sponsors that support our portfolio companies. While we invest in companies at various stages of development, we require that prospective portfolio companies be beyond the seed stage of development and have received at least their first round of venture capital or private equity financing before we will consider making an investment. We expect a prospective portfolio company to demonstrate its ability to advance technology and increase its value over time.
We have identified several criteria that we believe have proven, and will continue to prove, important in achieving our investment objective. These criteria provide general guidelines for our investment decisions. However, we caution you that not all of these criteria are met by each portfolio company in which we choose to invest.
Management. Our portfolio companies are generally led by experienced management that has in-market expertise in the Target Industry in which the company operates, as well as extensive experience with development-stage companies. The adequacy and completeness of the management team is assessed relative to the stage of development and the challenges facing the potential portfolio company.
8
Continuing support from one or more venture capital and private equity investors. We typically invest in companies in which one or more established venture capital and private equity investors have previously invested and continue to make a contribution to the management of the business. We believe that established venture capital and private equity investors can serve as committed partners and will assist their portfolio companies and their management teams in creating value. We take into consideration the total amount raised by the company, the valuation history, investor reserves for future investment and the expected timing and milestones to the next equity round financing.
Operating plan and cash resources. We generally require that a prospective portfolio company, in addition to having sufficient access to capital to support leverage, demonstrate an operating plan capable of generating cash flows or the ability to raise the additional capital necessary to cover its operating expenses and service its debt. Our review of the operating plan will take into consideration existing cash, cash burn, cash runway and the milestones necessary for the company to achieve cash flow positive operations or to access additional equity from its investors.
Enterprise and technology value. We expect that the enterprise value of a prospective portfolio company should substantially exceed the principal balance of debt borrowed by the company. Enterprise value includes the implied valuation based upon recent equity capital invested as well as the intrinsic value of the company’s particular technology, service or customer base.
Market opportunity and exit strategy. We seek portfolio companies that are addressing market opportunities that capitalize on their competitive advantages. Competitive advantages may include unique technology, legally protected intellectual property, superior clinical results or significant market traction. As part of our investment analysis, we typically also consider potential realization of our warrants through merger, acquisition or initial public offering based upon comparable exits in the company’s Target Industry.
Investment process
Our Board has delegated authority for all investment decisions to our Advisor. Our Advisor, in turn, has created an integrated approach to the loan origination, underwriting, approval and documentation process that we believe effectively combines the skills of our Advisor’s professionals. This process allows our Advisor to achieve an efficient and timely closing of an investment from the initial contact with a prospective portfolio company through the investment decision, close of documentation and funding of the investment, while ensuring that our Advisor’s rigorous underwriting standards are consistently maintained. We believe that the high level of involvement by our Advisor’s staff in the various phases of the investment process allows us to minimize the credit risk while delivering superior service to our portfolio companies.
Origination. Our Advisor’s loan origination process begins with its industry-focused regional managing directors who are responsible for identifying, contacting and screening prospects. These managing directors meet with key decision makers and deal referral sources such as venture capital and private equity firms and management teams, legal firms, accounting firms, investment banks, portfolio company advisors and other lenders to source prospective portfolio companies. We believe our brand name and management team are well known within the Venture Lending community, as well as by many repeat entrepreneurs and board members of prospective portfolio companies. These broad relationships, which reach across the Venture Lending industry, give rise to a significant portion of our Advisor’s deal origination.
The responsible managing director of our Advisor obtains materials from the prospective portfolio company and from those materials, as well as other available information, determines whether it is appropriate for our Advisor to issue a non-binding term sheet. The managing director bases this decision to proceed on his or her experience, the competitive environment and the prospective portfolio company’s needs and also seeks the counsel of our Advisor’s senior management and investment team.
Term sheet. If the managing director determines, after review and consultation with senior management, that the potential transaction meets our Advisor’s initial credit standards, our Advisor will issue a non-binding term sheet to the prospective portfolio company.
9
The terms of the transaction are tailored to a prospective portfolio company’s specific funding needs while taking into consideration market dynamics, the quality of the management team, the venture capital and private equity investors involved or the ability of the prospective portfolio company to access public equity and applicable credit criteria, which may include the prospective portfolio company’s existing cash resources, the development of its technology and the anticipated timing for the next round of equity financing.
Underwriting. Once the term sheet has been negotiated and executed and the prospective portfolio company has remitted a good faith deposit, we request additional due diligence materials from the prospective portfolio company and arrange for a due diligence visit.
Due diligence. The due diligence process includes a formal visit to the prospective portfolio company’s location and interviews with the prospective portfolio company’s senior management team. The process includes obtaining and analyzing publicly available information from independent third parties that have knowledge of the prospective portfolio company’s business, including, to the extent available, analysts that follow the technology market, thought leaders in our Target Industries and important customers or partners, if any. Outside sources of information are reviewed, including industry publications, scientific and market articles, internet publications, publicly available information on competitors or competing technologies and information known to our Advisor’s investment team from their experience in the technology markets.
A primary element of the due diligence process is interviewing key existing investors of the prospective portfolio company, who are often also members of the prospective portfolio company’s board of directors. While these board members and/or investors are not independent sources of information, their support for management and willingness to support the prospective portfolio company’s further development are critical elements of our decision making process.
Investment memorandum. Upon completion of the due diligence process and review and analysis of all of the information provided by the prospective portfolio company and obtained externally, our Advisor’s assigned credit officer prepares an investment memorandum for review and approval. The investment memorandum is reviewed by our Advisor’s Chief Investment Officer and then submitted to our Advisor’s investment committee for approval.
Investment committee. Our Advisor’s investment committee is responsible for overall credit policy, portfolio management, approval of all investments, portfolio monitoring and reporting and managing of problem accounts. The committee interacts with the entire staff of our Advisor to review potential transactions and deal flow. This interaction of cross-functional members of our Advisor’s staff assures efficient transaction sourcing, negotiating and underwriting throughout the transaction process. Portfolio performance and current market conditions are reviewed and discussed by the investment committee on a regular basis to assure that transaction structures and terms are consistent and current.
Loan closing and funding. Approved investments are documented and closed by our Advisor’s in-house legal and loan administration staff. Loan documentation is based upon standard templates created by our Advisor and is customized for each transaction to reflect the specific deal terms. The transaction documents typically include a loan and security agreement, warrant agreement and applicable perfection documents, including applicable Uniform Commercial Code financing statements and, as applicable, may also include a landlord agreement, patent and trademark security grants, a subordination agreement, an intercreditor agreement and other standard agreements for commercial loans in the Venture Lending industry. Funding requires final approval by our Advisor’s General Counsel, Chief Executive Officer or President, Chief Financial Officer and Chief Investment Officer or Chief Credit Officer.
Portfolio management and reporting. Our Advisor maintains a “hands on” approach to maintain communication with our portfolio companies. At least quarterly, our Advisor contacts our portfolio companies for operational and financial updates by phone and performs reviews. Our Advisor may contact portfolio companies deemed to have greater credit risk on a monthly or more frequent basis. Our Advisor requires all private companies to provide financial statements, typically monthly. For public companies, our Advisor typically relies on publicly reported quarterly financials. This allows our Advisor to identify any unexpected developments in the financial performance or condition of our portfolio company.
10
Our Advisor has developed a proprietary internal credit rating system to analyze the quality of our debt investments. Using this system, our Advisor analyzes and then rates the credit risk within the portfolio on a quarterly basis. Each portfolio company is rated on a 1 through 4 scale, with 3 representing the rating for a standard level of risk. A rating of 4 represents an improved and better credit quality than existed at the time of its original underwriting. A rating of 2 or 1 represents a deteriorating credit quality and an increased risk of loss of principal. Newly funded investments are typically assigned a rating of 3, unless extraordinary circumstances require otherwise. These investment ratings are generated internally by our Advisor, and we cannot guarantee that others would assign the same ratings to our portfolio investments or similar portfolio investments.
Our Advisor closely monitors portfolio companies rated a 1 or 2 for adverse developments. In addition, our Advisor maintains regular contact with the management, board of directors and major equity holders of these portfolio companies in order to discuss strategic initiatives to correct the deterioration of the portfolio company.
The following table describes each rating level:
Rating |
| |
|---|---|---|
4 | The portfolio company has performed in excess of our expectations as demonstrated by exceeding revenue milestones, clinical milestones or other operating metrics or as a result of raising capital well in excess of our underwriting assumptions. Generally the portfolio company displays one or more of the following: its enterprise value greatly exceeds our loan balance; it has achieved cash flow positive operations or has sufficient cash resources to cover the remaining balance of the loan; there is strong potential for warrant gains from our warrants; and there is a high likelihood that the borrower will receive favorable future financing to support operations. Loans rated 4 are the lowest risk profile in our portfolio and have no expected risk of principal loss. | |
3 | The portfolio company has performed to our expectations as demonstrated by meeting revenue milestones, clinical milestones or other operating metrics. It has raised, or is expected to raise, capital consistent with our underwriting assumptions. Generally the portfolio company displays one or more of the following: its enterprise value comfortably exceeds our loan balance; it has sufficient cash resources to operate according to its plan; it is expected to raise additional capital as needed; and there continues to be potential for warrant gains from our warrants. New loans are typically rated 3 when approved and thereafter 3-rated loans represent a standard risk profile, with no principal loss currently expected. | |
2 | The portfolio company has performed below our expectations as demonstrated by missing revenue milestones, delayed clinical progress or otherwise failing to meet projected operating metrics. It may have raised capital in support of the poorer performance but generally on less favorable terms than originally contemplated at the time of underwriting. Generally the portfolio company displays one or more of the following: its enterprise value exceeds our loan balance but at a lower multiple than originally expected; it has sufficient cash to operate according to its plan but liquidity may be tight; and it is planning to raise additional capital but there is uncertainty and the potential for warrant gains from our warrants are possible, but unlikely. Loans rated 2 represent an increased level of risk of loss of principal. While no loss is currently anticipated for a 2-rated loan, there is potential for future loss of principal. | |
1 | The portfolio company has performed well below plan as demonstrated by materially missing revenue milestones, delayed or failed clinical progress or otherwise failing to meet operating metrics. The portfolio company has not raised sufficient capital to operate effectively or retire its debt obligation to us. Generally the portfolio company displays one or more of the following: its enterprise value may not exceed our loan balance; it has insufficient cash to operate according to its plan and liquidity may be tight; and there are uncertain plans to raise additional capital or the portfolio company is being sold under distressed conditions. There is no potential for warrant gains from our warrants. Loans rated 1 are generally put on non-accrual status and represent a high degree of risk of loss of principal. |
For a discussion of the ratings of our existing portfolio, see “Item 7 — Management’s Discussion and Analysis of Financial Condition and Results of Operations — Debt investment asset quality.”
11
Managerial assistance
As a BDC, we offer, through our Advisor, and must provide upon request, managerial assistance to certain of our portfolio companies. This assistance may involve monitoring the operations of the portfolio companies, participating in board of directors and management meetings, consulting with and advising officers of portfolio companies and providing other organizational and financial guidance.
Although we may receive fees for these services, pursuant to the Administration Agreement, we will reimburse our Advisor for its expenses related to providing such services on our behalf.
Employees
We do not have any employees. Each of our executive officers is an employee of our Advisor. Our day-to-day investment operations are managed by our Advisor. We reimburse our Advisor for our allocable portion of expenses incurred by it in performing its obligations under the Administration Agreement, as our Administrator, including our allocable portion of the cost of our Chief Financial Officer and Chief Compliance Officer and their respective staffs.
Investment Management Agreement
Under the terms of the Investment Management Agreement, our Advisor:
| ● | determines the composition of our portfolio, the nature and timing of the changes to our portfolio and the manner of implementing such changes; |
| ● | identifies, evaluates and negotiates the structure of the investments we make (including performing due diligence on our prospective portfolio companies); and |
| ● | closes, monitors and administers the investments we make, including the exercise of any voting or consent rights. |
Our Advisor’s services under the Investment Management Agreement are not exclusive, and it is free to furnish similar services to other entities so long as its services to us are not impaired.
Investment advisory fees
Pursuant to our Investment Management Agreement, we pay our Advisor a fee for investment advisory and management services consisting of a base management fee and an incentive fee.
Base management fee. Through October 30, 2018, the base management fee, payable monthly in arrears, was calculated at an annual rate of 2.00% of (i) our gross assets less (ii) cash and cash equivalents. For purposes of calculating the base management fee, the term “gross assets” includes any assets acquired with the proceeds of leverage. From and after October 31, 2018, the first date on which the reduced asset coverage requirements in Section 61(a)(2) of the 1940 Act applied to the Company, the base management fee was and will be calculated at an annual rate of 2.00% of the Company’s gross assets (less cash and cash equivalents) including any assets acquired with the proceeds of leverage; provided, that, to the extent the Company’s gross assets (less cash and cash equivalents) exceed $250 million, the base management fee on the amount of such excess over $250 million is calculated at an annual rate of 1.60% of the Company’s gross assets (less cash and cash equivalents) including any assets acquired with the proceeds of leverage.
Incentive fee. The incentive fee has two parts, as follows:
The first part, which is subject to the Incentive Fee Cap and Deferral Mechanism, as defined below, is calculated and payable quarterly in arrears based on our Pre-Incentive Fee Net Investment Income for the immediately preceding calendar quarter. For this purpose, “Pre-Incentive Fee Net Investment Income” means interest income, dividend income and any other income (including any other fees (other than fees for providing managerial assistance), such as commitment, origination, structuring, diligence and consulting fees or other fees received from portfolio companies) accrued during the calendar quarter, minus expenses for the quarter (including the base management fee, expenses payable under the Administration Agreement, and any interest expense and any dividends paid on any issued and outstanding preferred stock,
12
but excluding the incentive fee). Pre-Incentive Fee Net Investment Income includes, in the case of investments with a deferred interest feature (such as original issue discount, debt instruments with payment-in-kind interest, or PIK, and zero coupon securities), accrued income we have not yet received in cash. The incentive fee with respect to the Pre-Incentive Fee Net Investment Income is 20.00% of the amount, if any, by which the Pre-Incentive Fee Net Investment Income for the immediately preceding calendar quarter exceeds a hurdle rate of 1.75% (which is 7.00% annualized) of our net assets at the end of the immediately preceding calendar quarter, subject to a “catch-up” provision measured as of the end of each calendar quarter. Under this provision, in any calendar quarter, the Advisor receives no incentive fee until the Pre-Incentive Fee Net Investment Income equals the hurdle rate of 1.75%, but then receives, as a “catch-up,” 100.00% of the Pre-Incentive Fee Net Investment Income with respect to that portion of such Pre-Incentive Fee Net Investment Income, if any, that exceeds the hurdle rate but is less than 2.1875% quarterly (which is 8.75% annualized). The effect of this “catch-up” provision is that, if Pre-Incentive Fee Net Investment Income exceeds 2.1875% in any calendar quarter, the Advisor will receive 20.00% of the Pre-Incentive Fee Net Investment Income as if the hurdle rate did not apply.
Pre-Incentive Fee Net Investment Income does not include any realized capital gains, realized capital losses or unrealized capital appreciation or depreciation. Because of the structure of the incentive fee, it is possible that we may pay an incentive fee in a quarter in which we incur a loss. For example, if we receive Pre-Incentive Fee Net Investment Income in excess of the quarterly minimum hurdle rate, we will pay the applicable incentive fee up to the Incentive Fee Cap, defined below, even if we have incurred a loss in that quarter due to realized and unrealized capital losses. Our net investment income used to calculate this part of the incentive fee is also included in the amount of our gross assets used to calculate the 2.00% base management fee. These calculations are appropriately prorated for any period of less than three months and adjusted for any share issuances or repurchases during the applicable quarter.
The incentive fee on Pre-Incentive Fee Net Investment Income is subject to a fee cap and deferral mechanism which is determined based upon a look-back period of up to three years and is expensed when incurred. For this purpose, the look-back period for the incentive fee based on Pre-Incentive Fee Net Investment Income, or the Incentive Fee Look-back Period, the Incentive Fee Look-back Period includes the most recently completed calendar quarter and the 11 preceding full calendar quarters. Each quarterly incentive fee payable on Pre-Incentive Fee Net Investment Income is subject to a cap, or the Incentive Fee Cap, and a deferral mechanism through which the Advisor may recoup a portion of such deferred incentive fees (collectively, the Incentive Fee Cap and Deferral Mechanism). The Incentive Fee Cap is equal to (a) 20.00% of Cumulative Pre-Incentive Fee Net Return (as defined below) during the Incentive Fee Look-back Period less (b) cumulative incentive fees of any kind paid to the Advisor during the Incentive Fee Look-back Period. To the extent the Incentive Fee Cap is zero or a negative value in any calendar quarter, we will not pay an incentive fee on Pre-Incentive Fee Net Investment Income to the Advisor in that quarter. To the extent that the payment of incentive fees on Pre-Incentive Fee Net Investment Income is limited by the Incentive Fee Cap, the payment of such fees will be deferred and paid in subsequent calendar quarters up to three years after their date of deferment, subject to certain limitations, which are set forth in the Investment Management Agreement. We only pay incentive fees on Pre-Incentive Fee Net Investment Income to the extent allowed by the Incentive Fee Cap and Deferral Mechanism. “Cumulative Pre-Incentive Fee Net Return” during any Incentive Fee Look-back Period means the sum of (a) Pre-Incentive Fee Net Investment Income and the base management fee for each calendar quarter during the Incentive Fee Look-back Period and (b) the sum of cumulative realized capital gains and losses, cumulative unrealized capital appreciation and cumulative unrealized capital depreciation during the applicable Incentive Fee Look-back Period.
On March 5, 2019, the Advisor irrevocably waived the receipt of incentive fees related to the amounts previously deferred that it may be entitled to receive under the Investment Management Agreement for the period commencing on January 1, 2019 and ending on December 31, 2019. Such waived incentive fees will not be subject to recoupment.
On March 6, 2018, the Advisor irrevocably waived the receipt of incentive fees related to the amounts previously deferred that it may be entitled to receive under the Investment Management Agreement for the period commencing on January 1, 2018 and ending on December 31, 2018. Such waived incentive fees are not subject to recoupment.
13
The following is a graphical representation of the calculation of the income-related portion of the incentive fee:
Quarterly incentive fee based on Net Investment Income
Pre-Incentive Fee Net Investment Income (expressed as a percentage of the value of net assets)
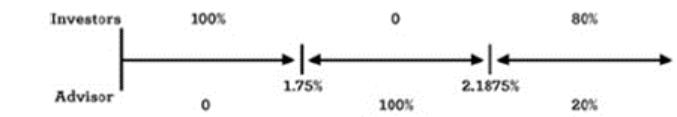
Percentage of Pre-Incentive Fee Net Investment Income allocated to first part of incentive fee
The second part of the incentive fee is determined and payable in arrears as of the end of each calendar year (or upon termination of the Investment Management Agreement, as of the termination date) and equals 20.00% of our realized capital gains, if any, on a cumulative basis from the date of our election to be a BDC through the end of each calendar year, computed net of all realized capital losses and unrealized capital depreciation on a cumulative basis through the end of such year, less all previous amounts paid in respect of the capital gain incentive fee.
Examples of incentive fee calculation
Example 1: Income related portion of incentive fee before total return requirement calculation for each fiscal quarter
Alternative 1
Assumptions:
Investment income (including interest, distributions, fees, etc.) = 1.25%
Hurdle rate(1) = 1.75%
Management fee(2) = 0.50%
Other expenses (legal, accounting, custodian, transfer agent, etc.)(3) = 0.20%
Pre-Incentive Fee Net Investment Income (investment income - (management fee + other expenses)) = 0.55%
Pre-Incentive Fee Net Investment Income does not exceed hurdle rate; therefore, there is no income-related incentive fee.
Alternative 2
Assumptions:
Investment income (including interest, distributions, fees, etc.) = 2.80%
Hurdle rate(1) = 1.75%
Management fee(2) = 0.50%
Other expenses (legal, accounting, custodian, transfer agent, etc.)(3) = 0.20%
Pre-Incentive Fee Net Investment Income (investment income - (management fee + other expenses)) = 2.10%
14
Incentive fee = 100.00% × Pre-Incentive Fee Net Investment Income (subject to “catch-up”)(4)
= 100.00% × (2.10% - 1.75%)
= 0.35%
Pre-Incentive Fee Net Investment Income exceeds the hurdle rate, but does not fully satisfy the “catch-up” provision; therefore, the income related portion of the incentive fee is 0.35%.
Alternative 3
Assumptions:
Investment income (including interest, distributions, fees, etc.) = 3.00%
Hurdle rate(1) = 1.75%
Management fee(2) = 0.50%
Other expenses (legal, accounting, custodian, transfer agent, etc.)(3) = 0.20%
Pre-Incentive Fee Net Investment Income (investment income - (management fee + other expenses)) = 2.30%
Incentive fee = 100.00% × Pre-Incentive Fee Net Investment Income (subject to “catch-up”)(4)
Incentive fee = 100.00% × “catch-up” + (20.00% × (Pre-Incentive Fee Net Investment Income - 2.1875%))
Catch up = 2.1875% - 1.75%
= 0.4375%
Incentive fee = (100.00% × 0.4375%) + (20.00% × (2.30% - 2.1875%))
= 0.4375% + (20.00% × 0.1125%)
= 0.4375% + 0.0225%
= 0.46%
Pre-Incentive Fee Net Investment Income exceeds the hurdle rate and fully satisfies the “catch-up” provision; therefore, the income related portion of the incentive fee is 0.46%.
| (1) | Represents 7.00% annualized hurdle rate. |
| (2) | Represents 2.00% annualized base management fee. |
| (3) | Excludes organizational and offering expenses. |
| (4) | The “catch-up” provision is intended to provide our Advisor with an incentive fee of 20.00% on all Pre-Incentive Fee Net Investment Income as if a hurdle rate did not apply when our Pre-Incentive Fee Net Investment Income exceeds 2.1875% in any fiscal quarter. |
15
Example 2: Income related portion of incentive fee after total return requirement calculation for each fiscal quarter
Alternative 1
Assumptions:
Investment income (including interest, distributions, fees, etc.) = 2.80%
Hurdle rate(1) = 1.75%
Management fee(2) = 0.50%
Other expenses (legal, accounting, custodian, transfer agent, etc.)(3) = 0.20%
Pre-Incentive Fee Net Investment Income (investment income - (management fee + other expenses)) = 2.10%
Incentive fee = 100.00% × Pre-Incentive Fee Net Investment Income (subject to ‘‘catch-up’’)(4)
=100.00% × (2.10% - 1.75%)
= 0.35%
Cumulative incentive compensation accrued and/or paid since July 1, 2014 = $9,000,000
20.0% of cumulative net increase in net assets resulting from operations since July 1, 2014 = $8,000,000
Although our Pre-Incentive Fee Net Investment Income exceeds the hurdle rate of 1.75%, no incentive fee is payable because 20.0% of the cumulative net increase in net assets resulting from operations since July 1, 2014 did not exceed the cumulative income and capital gains incentive fees accrued and/or paid since July 1, 2014.
Alternative 2
Assumptions:
Investment income (including interest, distributions, fees, etc.) = 2.80%
Hurdle rate(1) = 1.75%
Management fee(2) = 0.50%
Other expenses (legal, accounting, custodian, transfer agent, etc.)(3) = 0.20%
Pre-Incentive Fee Net Investment Income (investment income - (management fee + other expenses)) = 2.10%
Incentive fee = 100.00% × Pre-Incentive Fee Net Investment Income (subject to ‘‘catch-up’’)(4)
=100.00% × (2.10% - 1.75%)
= 0.35%
Pre-Incentive Fee Net Investment Income exceeds the hurdle rate, but does not fully satisfy the ‘‘catch-up’’ provision; therefore, the income related portion of the incentive fee is 0.35%.
Cumulative incentive compensation accrued and/or paid since July 1, 2014 = $9,000,000
20.0% of cumulative net increase in net assets resulting from operations since July 1, 2014 = $10,000,000
16
Because our Pre-Incentive Fee Net Investment Income exceeds the hurdle rate of 1.75% and because 20.0% of the cumulative net increase in net assets resulting from operations since July 1, 2014 exceeds the cumulative income and capital gains incentive fees accrued and/or paid since July 1, 2014, an incentive fee would be payable, as shown in Alternative 3 of Example 1 above.
| (1) | Represents 7.00% annualized hurdle rate. |
| (2) | Represents 2.00% annualized base management fee. |
| (3) | Excludes organizational and offering expenses. |
| (4) | The “catch-up” provision is intended to provide our Advisor with an incentive fee of 20.00% on all Pre-Incentive Fee Net Investment Income as if a hurdle rate did not apply when our Pre-Incentive Fee Net Investment Income exceeds 2.1875% in any fiscal quarter. |
Example 3: Capital gains portion of incentive fee
Alternative 1
Assumptions:
Year 1: $20 million investment made in Company A, or Investment A, and $30 million investment made in Company B, or Investment B
Year 2: Investment A sold for $50 million and fair market value, or FMV, of Investment B determined to be $32 million
Year 3: FMV of Investment B determined to be $25 million
Year 4: Investment B sold for $31 million
The capital gains portion of the incentive fee, if any, would be:
Year 1: None (No sales transaction)
Year 2: Capital gains incentive fee of $6 million ($30 million realized capital gains on sale of Investment A multiplied by 20%)
Year 3: None; $5 million ((20% multiplied by ($30 million cumulative capital gains less $5 million cumulative capital depreciation)) less $6 million (previous capital gains fee paid in Year 2))
Year 4: Capital gains incentive fee of $200,000; $6.2 million (($31 million cumulative realized capital gains multiplied by 20%) less $6 million (capital gains incentive fee taken in Year 2))
Alternative 2
Assumptions:
Year 1: $20 million investment made in Company A, or Investment A, $30 million investment made in Company B, or Investment B and $25 million investment made in Company C, or Investment C
Year 2: Investment A sold for $50 million, FMV of Investment B determined to be $25 million and FMV of Investment C determined to be $25 million
Year 3: FMV of Investment B determined to be $27 million and Investment C sold for $30 million
17
Year 4: FMV of Investment B determined to be $35 million
Year 5: Investment B sold for $20 million
The capital gains incentive fee, if any, would be:
Year 1: None (no sales transaction)
Year 2: $5 million capital gains incentive fee (20% multiplied by $25 million ($30 million realized capital gains on Investment A less unrealized capital depreciation on Investment B))
Year 3: $1.4 million capital gains incentive fee(1) ($6.4 million (20% multiplied by $32 million ($35 million cumulative realized capital gains less $3 million unrealized capital depreciation)) less $5 million capital gains incentive fee received in Year 2
Year 4: None (no sales transaction)
Year 5: None ($5 million (20% multiplied by $25 million (cumulative realized capital gains of $35 million less realized capital losses of $10 million)) less $6.4 million cumulative capital gains incentive fee paid in Year 2 and Year 3(2)
The hypothetical amounts of returns shown are based on a percentage of our total net assets and assume no leverage. There is no guarantee that positive returns will be realized and actual returns may vary from those shown in this example.
| (1) | As illustrated in Year 3 of Alternative 1 above, if the Investment Management Agreement were terminated on a date other than our fiscal year end of any year, we may have paid aggregate capital gains incentive fees that are more than the amount of such fees that would be payable if the Investment Management Agreement were terminated on the fiscal year end of such year. |
| (2) | As noted above, it is possible that the cumulative aggregate capital gains fee received by the Advisor ($6.4 million) is effectively greater than $5 million (20.00% of cumulative aggregate realized capital gains less net realized capital losses or net unrealized depreciation ($25 million)). |
Payment of our expenses
All investment professionals and staff of our Advisor, when and to the extent engaged in providing investment advisory and management services, and the compensation and routine overhead expenses of its personnel allocable to such services, are provided and paid for by our Advisor. We bear all other costs and expenses of our operations and transactions, including those relating to:
| ● | our organization; |
| ● | calculating our net asset value, or NAV (including the cost and expenses of any independent valuation firms); |
| ● | expenses, including travel expense, incurred by our Advisor or payable to third parties performing due diligence on prospective portfolio companies, monitoring our investments and, if necessary, enforcing our rights; |
| ● | interest payable on debt, if any, incurred to finance our investments; |
| ● | the costs of all future offerings and repurchases of our common stock and other securities, if any; |
| ● | the base management fee and any incentive fee; |
| ● | distributions on our shares; |
18
| ● | administration fees payable under the Administration Agreement; |
| ● | the allocated costs incurred by our Advisor as our Administrator in providing managerial assistance to those portfolio companies that request it; |
| ● | amounts payable to third parties relating to, or associated with, making investments; |
| ● | transfer agent and custodial fees; |
| ● | registration fees; |
| ● | listing fees; |
| ● | fees and expenses associated with marketing efforts; |
| ● | taxes; |
| ● | independent director fees and expenses; |
| ● | brokerage commissions; |
| ● | costs of preparing and filing reports or other documents with the SEC; |
| ● | the costs of any reports, proxy statements or other notices to our stockholders, including printing costs; |
| ● | the fidelity bond; |
| ● | directors and officers/errors and omissions liability insurance, and any other insurance premiums; |
| ● | indemnification payments; |
| ● | direct costs and expenses of administration, including audit and legal costs; and |
| ● | all other expenses incurred by us or the Administrator in connection with administering our business, such as the allocable portion of overhead under the Administration Agreement, including rent, the fees and expenses associated with performing compliance functions and our allocable portion of the costs of compensation and related expenses of our Chief Financial Officer and Chief Compliance Officer and their respective staffs. |
From time to time, our Advisor may pay amounts owed by us to third party providers of goods or services. We subsequently reimburse our Advisor for such amounts paid on our behalf. Generally, our expenses are expensed as incurred in accordance with U.S. generally accepted accounting principles, or GAAP. To the extent we incur costs that should be capitalized and amortized into expense we also do so in accordance with GAAP, which may include amortizing such amount on a straight line basis over the life of the asset or the life of the services or product being performed or provided.
Limitation of liability and indemnification
The Investment Management Agreement provides that our Advisor and its officers, managers, partners, agents, employees, controlling persons and any other person or entity affiliated with our Advisor are not liable to us for any act or omission by it in the supervision or management of our investment activities or for any loss sustained by us except for acts or omissions constituting willful misfeasance, bad faith, gross negligence or reckless disregard of its obligations under the Investment Management Agreement. The Investment Management Agreement also provides, subject to certain conditions, for indemnification by us of our Advisor and its officers, managers, partners, agents, employees, controlling persons and any other person or entity affiliated with our Advisor for liabilities incurred by them in connection with their services to us (including any liabilities associated with an action or suit by or in the right of us or our stockholders), but excluding liabilities for acts or omissions constituting willful misfeasance, bad faith or gross negligence or reckless disregard of their duties under the Investment Management Agreement.
19
Board Recommendation and Approval of the Investment Management Agreement
At a special meeting of the stockholders on October 30, 2018, the stockholders, upon the recommendation of the Board, approved a new Investment Management Agreement which became effective on March 7, 2019. The Investment Management Agreement was effective for two years from the date of approval and then must be annually reapproved by our Board for a one-year period. The Investment Management Agreement was considered and reapproved by our Board, including a majority of our independent directors, on October 26, 2020. When it considered recommending the approval of the Investment Management Agreement, our Board held a meeting at which it focused on information it received relating to (a) the nature, quality and extent of the advisory and other services to be provided to us by our Advisor; (b) comparative data with respect to advisory fees or similar expenses paid by other BDCs with similar investment objectives; (c) our projected expenses and expense ratio compared to BDCs with similar investment objectives; (d) any existing and potential sources of indirect income to our Advisor or the Administrator from their relationships with us and the profitability of those relationships; (e) information about the services to be performed and the personnel performing such services under the Investment Management Agreement; (f) the organizational capability and financial condition of our Advisor and its affiliates; (g) our Advisor’s practices regarding the selection and compensation of brokers that may execute our portfolio transactions and the brokers’ provision of brokerage and research services to our Advisor; and (h) the possibility of obtaining similar services from other third party service providers or through an internally managed structure.
Based on the information reviewed and its discussions related thereto, our Board, including a majority of the directors who are not interested persons of us, determined that the investment management fee rates payable pursuant to the terms of the Investment Management Agreement were reasonable in relation to the services to be provided.
Duration and termination
Unless terminated earlier as described below, it will continue in effect from year to year after the initial two-year term if approved annually by our Board including a majority of our directors who are not interested persons or by the affirmative vote of the holders of a majority of our outstanding voting securities and a majority of our directors who are not interested persons. The Investment Management Agreement will automatically terminate in the event of its assignment. The Investment Management Agreement may be terminated by either party without penalty by delivering notice of termination upon not more than 60 days’ written notice to the other party. See “Item 1A — Risk Factors — Risks Related to Our Advisor and Affiliates — Our Advisor can resign on 60 days’ notice, and we may not be able to find a suitable replacement within that time, resulting in a disruption in our operations that could adversely affect our business, results of operations or financial condition.”
Administration Agreement
The Administration Agreement was considered and reapproved by our Board, including a majority of our independent directors, on October 26, 2020. Under the Administration Agreement, the Administrator furnishes us with office facilities and equipment, provides us clerical, bookkeeping and record keeping services at such facilities and provides us with other administrative services necessary to conduct our day-to-day operations. We reimburse the Administrator for our allocable portion of overhead and other expenses incurred by the Administrator in performing its obligations under the Administration Agreement, including rent, the fees and expenses associated with performing compliance functions and our allocable portion of the costs of compensation and related expenses of our Chief Financial Officer and Chief Compliance Officer and their respective staffs. The Board reviews the allocation of expenses shared with the Advisor or other clients of the Advisor, if any, on a periodic basis to confirm that the allocations are reasonable and appropriate in light of the provisions of the Investment Management Agreement and Administration Agreement and then-current circumstances.
License agreement
We have entered into a license agreement with Horizon Technology Finance Principals, LLC fka Horizon Technology Finance, LLC, or HTF, pursuant to which we were granted a non-exclusive, royalty-free right and license to use the service mark “Horizon Technology Finance.” Under this agreement, we have a right to use the “Horizon Technology Finance” service mark for so long as the Investment Management Agreement with our Advisor is in effect. Other than with respect to this limited license, we have no legal right to the “Horizon Technology Finance” service mark.
20
Regulation
We have elected to be regulated as a BDC under the 1940 Act and elected to be treated as a RIC under Subchapter M of the Code. As with other companies regulated by the 1940 Act, a BDC must adhere to certain substantive regulatory requirements. The 1940 Act contains prohibitions and restrictions relating to transactions between BDCs and their affiliates (including any investment advisers or sub-advisers), principal underwriters and affiliates of those affiliates or underwriters and requires that a majority of the directors be persons other than “interested persons,” as that term is defined in the 1940 Act. In addition, the 1940 Act provides that we may not change the nature of our business so as to cease to be, or to withdraw our election as, a BDC unless approved by “a majority of our outstanding voting securities” as defined in the 1940 Act. A majority of the outstanding voting securities of a company is defined under the 1940 Act as the lesser of: (1) 67% or more of such company’s shares present at a meeting if more than 50% of the outstanding shares of such company are present or represented by proxy or (2) more than 50% of the outstanding shares of such company. Our bylaws provide for the calling of a special meeting of stockholders at which such action could be considered upon written notice of not less than ten or more than sixty days before the date of such meeting.
We may invest up to 100% of our assets in securities acquired directly from issuers in privately negotiated transactions. With respect to such securities, we may, for the purpose of public resale, be deemed an “underwriter” as that term is defined in the Securities Act of 1933, as amended, or the Securities Act. We do not intend to acquire securities issued by any investment company that exceed the limits imposed by the 1940 Act. Under these limits, except for registered money market funds, we generally cannot acquire more than 3% of the voting stock of any investment company, invest more than 5% of the value of our total assets in the securities of one investment company or invest more than 10% of the value of our total assets in the securities of more than one investment company. With regard to that portion of our portfolio invested in securities issued by investment companies, it should be noted that such investments might subject our stockholders to additional expenses. None of our investment policies are fundamental and any may be changed without stockholder approval.
We may also be prohibited under the 1940 Act from knowingly participating in certain transactions with our affiliates without the prior approval of our directors who are not interested persons and, in some cases, prior approval by the SEC. For example, under the 1940 Act, absent receipt of exemptive relief from the SEC, we and our affiliates may be precluded from co-investing in transactions for which terms other than price are negotiated by our affiliates. As a result of one or more of these situations, we may not be able to invest as much as we otherwise would in certain investments or may not be able to liquidate a position as quickly. On November 27, 2017, the SEC granted us, our Advisor and certain of our affiliates an exemptive relief order permitting us to co-invest with certain affiliated funds in negotiated investments, subject to the terms and conditions of the order.
We expect to be periodically examined by the SEC for compliance with the 1940 Act.
We are required to provide and maintain a bond issued by a reputable fidelity insurance company to protect us against larceny and embezzlement. Furthermore, as a BDC, we are prohibited from protecting any director or officer against any liability to us or our stockholders arising from willful misfeasance, bad faith, gross negligence or reckless disregard of the duties involved in the conduct of such person’s office.
We and our Advisor have adopted and implemented written policies and procedures reasonably designed to prevent violation of the federal securities laws and review these policies and procedures annually for their adequacy and the effectiveness of their implementation. We and our Advisor have designated a chief compliance officer to be responsible for administering the policies and procedures.
Qualifying assets
Under the 1940 Act, a BDC may not acquire any asset other than assets of the type listed in section 55(a) of the 1940 Act, which are referred to as qualifying assets, unless, at the time the acquisition is made, qualifying assets represent at
21
least 70% of the company’s total assets. The principal categories of qualifying assets relevant to our proposed business are the following:
| ● | Securities purchased in transactions not involving any public offering from the issuer of such securities, which issuer (subject to certain limited exceptions) is an eligible portfolio company, or from any person who is, or has been during the preceding 13 months, an affiliated person of an eligible portfolio company, or from any other person, subject to such rules as may be prescribed by the SEC. An eligible portfolio company is defined in the 1940 Act as any issuer which: |
| ● | is organized under the laws of, and has its principal place of business in, the United States; |
| ● | is not an investment company (other than a small business investment company wholly owned by the BDC) or a company that would be an investment company but for certain exclusions under the 1940 Act; and |
| ● | satisfies any of the following: |
| ● | has a market capitalization of less than $250 million or does not have any class of securities listed on a national securities exchange; |
| ● | is controlled by a BDC or a group of companies including a BDC, the BDC actually exercises a controlling influence over the management or policies of the eligible portfolio company, and, as a result thereof, the BDC has an affiliated person who is a director of the eligible portfolio company; or |
| ● | is a small and solvent company having total assets of not more than $4 million and capital and surplus of not less than $2 million. |
| ● | Securities of any eligible portfolio company which we control. |
| ● | Securities purchased in a private transaction from a U.S. issuer that is not an investment company or from an affiliated person of the issuer, or in transactions incident thereto, if the issuer is in bankruptcy and subject to reorganization or if the issuer, immediately prior to the purchase of its securities was unable to meet its obligations as they came due without material assistance other than conventional lending or financing arrangements. |
| ● | Securities of an eligible portfolio company purchased from any person in a private transaction if there is no ready market for such securities and we already own 60% of the outstanding equity of the eligible portfolio company. |
| ● | Securities received in exchange for or distributed on or with respect to securities described above, or pursuant to the exercise of warrants or rights relating to such securities. |
| ● | Cash, cash equivalents, U.S. Government securities or high-quality debt securities maturing in one year or less from the time of investment. |
The regulations defining qualifying assets may change over time. We may adjust our investment focus as needed to comply with and/or take advantage of any regulatory, legislative, administrative or judicial actions in this area.
Managerial assistance to portfolio companies
A BDC must have been organized and have its principal place of business in the United States and must be operated for the purpose of making investments in the types of securities described in “Qualifying assets.” However, in order to count portfolio securities as qualifying assets for the purpose of the 70% test, the BDC must either control the issuer of the securities or must offer to make available to the issuer of the securities (other than small and solvent companies described above) significant managerial assistance. Where the BDC purchases such securities in conjunction with one or more other persons acting together, the BDC will satisfy this test if one of the other persons in the group makes available such managerial assistance. Making available managerial assistance means, among other things, any arrangement whereby the
22
BDC, through its directors, officers or employees, offers to provide, and, if accepted, does so provide, significant guidance and counsel concerning the management, operations or business objectives and policies of a portfolio company.
Issuance of additional shares
We are not generally able to issue and sell our common stock at a price below NAV per share. We may, however, issue and sell our common stock, at a price below the current NAV of the common stock, or issue and sell warrants, options or rights to acquire such common stock, at a price below the current NAV of the common stock if our Board determines that such sale is in our best interest and in the best interests of our stockholders, and our stockholders have approved our policy and practice of making such sales within the preceding 12 months. In any such case, the price at which our securities are to be issued and sold may not be less than a price which, in the determination of our Board, closely approximates the market value of such securities. We have not sought the approval of our stockholders in the preceding 12 months but we may seek approval from our stockholders to offer shares of our common stock below its NAV in the future.
Temporary investments
Pending investment in other types of “qualifying assets,” as described above, our investments may consist of cash, cash equivalents, U.S. Government securities or high-quality debt securities maturing in one year or less from the time of investment, which we refer to, collectively, as temporary investments, so that 70% of our assets are qualifying assets. Typically, we invest in highly rated commercial paper, U.S. Government agency notes, U.S. Treasury bills or in repurchase agreements relating to such securities that are fully collateralized by cash or securities issued by the U.S. Government or its agencies. A repurchase agreement involves the purchase by an investor, such as us, of a specified security and the simultaneous agreement by the seller to repurchase it at an agreed-upon future date and at a price which is greater than the purchase price by an amount that reflects an agreed-upon interest rate. There is no percentage restriction on the proportion of our assets that may be invested in such repurchase agreements. However, subject to certain exceptions, if more than 25% of our total assets constitute repurchase agreements from a single counterparty, we generally would not meet the diversification tests in order to qualify as a RIC for federal income tax purposes. Thus, we do not intend to enter into repurchase agreements with a single counterparty in excess of this limit. Our Advisor monitors the creditworthiness of the counterparties with which we enter into repurchase agreement transactions.
Senior securities; derivative securities
We are permitted, under specified conditions, to issue multiple classes of indebtedness and one class of stock senior to our common stock if our asset coverage, as defined in the 1940 Act, is at least equal to 150% immediately after each such issuance. In addition, while any senior securities are outstanding, we must make provisions to prohibit any distribution to our stockholders or the repurchase of such securities or shares unless we meet the applicable asset coverage requirements at the time of the distribution or repurchase. We may also borrow amounts up to 5% of the value of our total assets for temporary purposes without regard to asset coverage. For a discussion of the risks associated with leverage, see “Item 1A — Risk Factors — General Risk Factors — We borrow money, which magnifies the potential for gain or loss on amounts invested and may increase the risk of investing in us.”
The 1940 Act also limits the amount of warrants, options and rights to common stock that we may issue and the terms of such securities.
Code of ethics
We and our Advisor have each adopted a code of ethics pursuant to Rule 17j-1 under the 1940 Act and Rule 204A-1 under the Investment Advisers Act of 1940, as amended, or the Advisers Act, respectively, that establishes procedures for personal investments and restricts certain personal securities transactions. Personnel subject to each code may invest in securities for their personal investment accounts, including securities that may be purchased or held by us, so long as such investments are made in accordance with the relevant code of ethics’ requirements. Each code of ethics is published on our website at www.horizontechfinance.com. We intend to disclose any substantive amendments to, or waivers from, the codes of conduct within four business days of the waiver or amendment through a web site posting.
23
Proxy voting policies and procedures
We have delegated our proxy voting responsibility to our Advisor. The proxy voting policies and procedures of our Advisor are set forth below. The guidelines are reviewed periodically by our Advisor and our independent directors and, accordingly, are subject to change.
Introduction
Our Advisor is registered with the SEC as an investment adviser under the Advisers Act. As an investment adviser registered under the Advisers Act, our Advisor has fiduciary duties to us. As part of this duty, our Advisor recognizes that it must vote client securities in a timely manner free of conflicts of interest and in our best interests and the best interests of our stockholders. Our Advisor’s proxy voting policies and procedures have been formulated to ensure decision-making is consistent with these fiduciary duties.
These policies and procedures for voting proxies are intended to comply with Section 206 of, and Rule 206(4)-6 under, the Advisers Act.
Proxy policies
Our Advisor votes proxies relating to our portfolio securities in what our Advisor perceives to be the best interest of our stockholders. Our Advisor reviews on a case-by-case basis each proposal submitted to a stockholder vote to determine its effect on the portfolio securities held by us. Although our Advisor generally votes against proposals that may have a negative effect on our portfolio securities, our Advisor may vote for such a proposal if there exist compelling long-term reasons to do so.
Our Advisor’s proxy voting decisions are made by those senior officers who are responsible for monitoring each of our investments. To ensure that a vote is not the product of a conflict of interest, our Advisor requires that (1) anyone involved in the decision-making process disclose to our Chief Compliance Officer any potential conflict that he or she is aware of and any contact that he or she has had with any interested party regarding a proxy vote and (2) employees involved in the decision-making process or vote administration are prohibited from revealing how we intend to vote on a proposal in order to reduce any attempted influence from interested parties.
Proxy voting records
You may obtain information about how we voted proxies by making a written request for proxy voting information to: Chief Compliance Officer, Horizon Technology Finance Corporation, 312 Farmington Avenue, Farmington, Connecticut 06032 or by calling (860) 676-8654.
Sarbanes-Oxley Act of 2002
The Sarbanes-Oxley Act of 2002, as amended, or the Sarbanes-Oxley Act, imposes a wide variety of regulatory requirements on publicly held companies and their insiders. Many of these requirements affect us. For example:
| ● | pursuant to Rule 13a-14 under the Securities Exchange Act of 1934, as amended, or the Exchange Act, our principal executive officer and principal financial officer must certify the accuracy of the financial statements contained in our periodic reports; |
| ● | pursuant to Item 307 of Regulation S-K under the Securities Act, our periodic reports must disclose our conclusions about the effectiveness of our disclosure controls and procedures; |
| ● | pursuant to Rule 13a-15 under the Exchange Act, our management must prepare an annual report regarding its assessment of our internal control over financial reporting, which must be audited by our independent registered public accounting firm; and |
| ● | pursuant to Item 308 of Regulation S-K under the Securities Act and Rule 13a-15 under the Exchange Act, our periodic reports must disclose whether there were significant changes in our internal controls over financial |
24
| reporting or in other factors that could significantly affect these controls subsequent to the date of their evaluation, including any corrective actions with regard to significant deficiencies and material weaknesses. |
The Sarbanes-Oxley Act requires us to review our current policies and procedures to determine whether we comply with the Sarbanes-Oxley Act and the regulations promulgated thereunder. We will continue to monitor our compliance with all regulations under the Sarbanes-Oxley Act and intend to take actions necessary to ensure that we are in compliance therewith.
Nasdaq corporate governance regulations
Nasdaq has adopted corporate governance regulations with which listed companies must comply. We intend to be in compliance with these corporate governance listing standards. We intend to monitor our compliance with all future listing standards and to take all necessary actions to ensure that we are in compliance therewith.
Privacy principles
We are committed to maintaining the privacy of stockholders and to safeguarding our non-public personal information. The following information is provided to help you understand what personal information we collect, how we protect that information and why, in certain cases, we may share information with select other parties.
Generally, we do not receive any nonpublic personal information relating to our stockholders, although certain nonpublic personal information of our stockholders may become available to us. We do not disclose any nonpublic personal information about our stockholders or former stockholders, except as permitted by law or as is necessary in order to service stockholder accounts (for example, to a transfer agent or third party administrator).
We restrict access to nonpublic personal information about our stockholders to our Advisor’s employees with a legitimate business need for the information. We maintain physical, electronic and procedural safeguards designed to protect the nonpublic personal information of our stockholders. For a discussion of the risks associated with cyber incidents, see “Item 1A — Risk Factors — General Risk Factors — We are highly dependent on information systems and systems failures could significantly disrupt our business, which may, in turn, negatively affect the market price of our common stock and our ability to pay distributions.”
Election to be taxed as a RIC
We have elected to be subject to tax, and intend to qualify annually to maintain our election to be subject to tax, as a RIC under Subchapter M of the Code. To maintain our RIC status, we must, among other requirements, meet certain source-of-income and quarterly asset diversification requirements (as described below). We also must distribute dividends each tax year of an amount generally at least equal to 90% of the sum of our ordinary income and our realized net short-term capital gains (i.e., net short-term capital gains in excess of net long term losses), or investment company taxable income, if any, out of the assets legally available for distribution, which we refer to as the “Annual Distribution Requirement.” Although not required for us to maintain our RIC tax status, in order to preclude the imposition of a 4% nondeductible federal excise tax imposed on RICs, we are required to distribute dividends in respect of each calendar year of an amount generally at least equal to the sum of (1) 98% of our ordinary income (taking into account certain deferrals and elections) for the calendar year, (2) 98.2% of the excess of our capital gains over our capital losses, or capital gain net income (adjusted for certain ordinary losses) for the one-year period ending on October 31 of the calendar year and (3) any ordinary income or net capital gains for preceding years that was not distributed during such years and on which we previously did not incur any U.S. federal corporate income tax, or the Excise Tax Avoidance Requirement. In addition, although we may distribute realized net capital gains (i.e., net long-term capital gains in excess of short-term capital losses), if any, at least annually out of the assets legally available for such distributions, we may decide to retain such net capital gains or ordinary income to provide us with additional liquidity. In order to qualify as a RIC, we must:
| ● | maintain an election to be treated as a BDC under the 1940 Act at all times during each tax year; |
| ● | meet any applicable securities law requirements, including capital structure requirements; |
25
| ● | derive in each tax year at least 90% of our gross income from dividends, interest, payments with respect to certain securities loans, gains from the sale of stock or other securities, net income from certain qualified publicly traded partnerships or other income derived with respect to our business of investing in such stock or securities, or the Qualifying Income Test; and |
| ● | diversify our holdings so that at the end of each quarter of the tax year: |
| ● | at least 50% of the value of our assets consists of cash, cash equivalents, U.S. government securities, securities of other RICs, and other securities if such other securities of any one issuer neither represents more than 5% of the value of our assets nor more than 10% of the outstanding voting securities of the issuer; and |
| ● | no more than 25% of the value of our assets is invested in the securities, other than U.S. government securities or securities of other RICs, of one issuer or of two or more issuers that are controlled, as determined under applicable tax rules, by us and that are engaged in the same or similar or related trades or businesses or in certain qualified publicly traded partnerships, or the Diversification Tests. |
Taxation as a RIC
If we qualify as a RIC, and satisfy the Annual Distribution Requirement, then we will not be subject to entity-level income taxes on the portion of our investment company taxable income as well as any net capital gain (i.e., realized net long-term capital gains in excess of realized net short-term capital losses) we distribute as dividends to stockholders. We may retain for investment all or a portion of our net capital gain. However, if we retain any investment company taxable income or net capital gains, and fail to satisfy the Annual Distribution Requirement, we will be subject to entity-level taxation at regular corporate rates on any amounts retained. If we fail to qualify as a RIC for a period greater than two consecutive tax years, to qualify as a RIC in a subsequent tax year, we may be subject to regular corporate rates on any net built-in gains with respect to certain of our assets (that is, the excess of the aggregate gains, including items of income, over aggregate losses that would have been realized with respect to such assets if we had sold the property at fair market value at the end of the tax year) that we elect to recognize on requalification or when recognized over the next five tax years.
We may be required to recognize taxable income in circumstances in which we do not receive cash. For example, if we hold debt securities that are treated under applicable tax rules as having original issue discount (such as debt instruments with PIK interest or, in certain cases, increasing interest rates or issued with warrants), we must include in income each tax year a portion of the original issue discount that accrues over the life of the debt security, regardless of whether cash representing such income is received by us in the same tax year. Because any original issue discount accrued will be included in our investment company taxable income for the tax year of accrual, we may be required to make a distribution to our stockholders in order to satisfy the Annual Distribution Requirement or the Excise Tax Avoidance Requirement, even though we will not have received any corresponding cash amount.
Gain or loss realized by us from warrants acquired by us, as well as any loss attributable to the lapse of such warrants, generally will be treated as capital gain or loss. Such gain or loss generally will be long-term or short-term, depending on how long we held a particular warrant.
Although we do not presently expect to do so, we are authorized to borrow funds and to sell assets in order to satisfy distribution requirements. However, under the 1940 Act, we are generally not permitted to make distributions to our stockholders while our debt obligations and other senior securities are outstanding unless certain “asset coverage” tests are met. Moreover, our ability to dispose of assets to meet our distribution requirements may be limited by (1) the illiquid nature of our portfolio and/or (2) other requirements relating to our status as a RIC, including the Diversification Tests. If we dispose of assets in order to meet the Annual Distribution Requirement or the Excise Tax Avoidance Requirement, we may make such dispositions at times that, from an investment standpoint, are not advantageous.
Failure to qualify as a RIC
If we fail to satisfy the Annual Distribution Requirement or fail to qualify as a RIC in any tax year, assuming we do not qualify for or take advantage of certain remedial provisions, we will be subject to tax in that year on all of our taxable
26
income, regardless of whether we make any distributions to our stockholders. In that case, all of our income will be subject to corporate-level federal income tax, reducing the amount available to be distributed to our stockholders. In contrast, assuming we qualify as a RIC, our corporate-level federal income tax liability should be substantially reduced or eliminated. See “—Election to be taxed as a RIC” above.
If we are unable to maintain our status as a RIC, we would be subject to tax on all of our taxable income at regular corporate rates. We would not be able to deduct distributions to stockholders, nor would they be required to be made. Distributions would generally be taxable to our stockholders as ordinary distribution income eligible for the 15% or 20% maximum rate to the extent of our current and accumulated earnings and profits. Subject to certain limitations under the Code, dividends paid by us to certain corporate stockholders would be eligible for the dividends received deduction. Distributions in excess of our current and accumulated earnings and profits would be treated first as a return of capital to the extent of the stockholder’s tax basis in our common stock, and any remaining distributions would be treated as a capital gain.
27
Investing in our securities involves a high degree of risk. In addition to the other information contained in this annual report on Form 10-K, you should consider carefully the following information before making an investment in our securities. The risks set out below are not the only risks we face. If any of the following events occur, our business, financial condition and results of operations could be materially and adversely affected. In such case, our NAV per share and the trading price of our common stock could decline, and you may lose part or all of your investment.
Summary Risk Factors
Investing in our securities involves a high degree of risk. The following is a summary of certain of the principal risks that should be carefully considered before investing in our securities:
| ● | Political, social and economic uncertainty, including uncertainty related to the COVID-19 pandemic, creates and exacerbates risks. |
| ● | The capital markets are currently in a period of disruption and economic uncertainty. Such market conditions have materially and adversely affected debt and equity capital markets, which have had, and may continue to have, a negative impact on our business and operations. |
| ● | Our operation as a BDC imposes numerous constraints on us and significantly reduces our operating flexibility. In addition, if we fail to maintain our status as a BDC, we might be regulated as a closed-end investment company, which would subject us to additional regulatory restrictions. |
| ● | We will be subject to corporate-level U.S. federal income tax on all of our income if we are unable to maintain our qualification for tax treatment as a RIC under Subchapter M of the Code, which would have a material adverse effect on our financial performance. |
| ● | We are dependent upon management personnel of our Investment Adviser for our future success. |
| ● | Our ability to grow depends on our ability to raise additional capital. |
| ● | We borrow money, which may magnify the potential for gain or loss and may increase the risk of investing in us. |
| ● | We operate in a highly competitive market for investment opportunities. |
| ● | Our Board of Directors may change our investment objective, operating policies and strategies without prior notice or stockholder approval. |
| ● | Our Investment Adviser can resign on 60 days’ notice. We may not be able to find a suitable replacement within that time, resulting in a disruption in our operations that could adversely affect our financial condition, business and results of operations. |
| ● | Our ability to enter into transactions with our affiliates is restricted. |
| ● | We are exposed to risks associated with changes in interest rates. |
| ● | Our investment strategy focuses on investments in development-stage companies in our Target Industries, which are subject to many risks, including volatility, intense competition, shortened product life cycles and periodic downturns, and would be rated below “investment grade.” |
| ● | The lack of liquidity in our investments may adversely affect our business. |
| ● | Declines in market prices and liquidity in the corporate debt markets can result in significant net unrealized depreciation of our portfolio, which in turn would affect our results of operations. |
28
| ● | Investing in our common stock involves an above average degree of risk |
Risks Related to our Adviser and Affiliates
We are dependent upon key personnel of our Advisor and our Advisor’s ability to hire and retain qualified personnel.
We do not have any employees and are dependent upon the members of our Advisor’s senior management, as well as other key personnel for the identification, evaluation, final selection, structuring, closing and monitoring of our investments. These employees have critical industry experience and relationships that we rely on to implement our business plan to originate Venture Loans in our Target Industries. Our future success depends on the continued service of the senior members of our Advisor’s management team. If our Advisor were to lose the services of any of the senior members of our Advisor’s management team, we may not be able to operate our business as we expect, and our ability to compete could be harmed, either of which could cause our business, results of operations or financial condition to suffer.
In addition, if any two of the three of Mr. Pomeroy, our Chief Executive Officer, Mr. Michaud, our President, or Mr. Trolio, our Chief Financial Officer, ceases to be actively involved with us or our Advisor, and is not replaced by an individual satisfactory to Key within 90 days, Key could, absent a waiver or cure, demand repayment of any outstanding obligations under the Key Facility. If any two of the four of Mr. Pomeroy, Mr. Michaud, Mr. Trolio or Mr. Devorsetz, our Chief Investment Officer, ceases to be actively involved with us, the NYL Noteholders could, absent a waiver or cure, redeem any outstanding obligations under the NYL Facility. In such an event, if we do not have sufficient cash to repay our outstanding obligations, we may be required to sell investments which, due to their illiquidity, may be difficult to sell on favorable terms or at all. We may also be unable to make new investments, cover our existing obligations to extend credit or meet other obligations as they come due, which could adversely impact our results of operations.
Our future success also depends, in part, on our Advisor’s ability to identify, attract and retain sufficient numbers of highly skilled employees. If our Advisor is not successful in identifying, attracting and retaining such employees, we may not be able to operate our business as we expect. In addition, our Advisor may in the future manage investment funds with investment objectives similar to ours thereby diverting the time and attention of its investment professionals that we rely on to implement our business plan.
Our Advisor may change or be restructured.
We cannot assure you that the Advisor will remain our investment adviser or that we will continue to have access to our Advisor’s investment professionals or its relationships. We would be required to obtain shareholder approval for a new investment management agreement in the event that (1) the Advisor resigns as our investment adviser or (2) a change of control or deemed change of control of the Advisor occurs. We cannot provide assurance that a new investment management agreement or new investment adviser would provide the same or equivalent services on the same or on as favorable of terms as the Investment Management Agreement or the Advisor.
Our Advisor may, from time to time, possess material non-public information regarding our portfolio companies, limiting our investment discretion.
Officers and employees of our Advisor may serve as directors of, or in a similar capacity with, our portfolio companies, the securities of which are purchased or sold on our behalf. If we obtain material non-public information with respect to such portfolio companies, or we become subject to trading restrictions under the internal trading policies of those portfolio companies or as a result of applicable law or regulations, we could be prohibited for a period of time from purchasing or disposing of the securities of such portfolio companies, and this prohibition may have an adverse effect on us.
Our Advisor has significant potential conflicts of interest with us and our stockholders.
As a result of our arrangements with our Advisor, there may be times when our Advisor has interests that differ from those of our stockholders, giving rise to a potential conflict of interest. Our executive officers and directors, as well as the current and future executives and employees of our Advisor, serve or may serve as officers, directors or principals of entities that operate in the same or a related line of business as we do. Accordingly, they may have obligations to investors in those entities, the fulfillment of which might not be in the best interests of our stockholders. In addition, obligations to
29
these other entities may cause our executive officers and directors and those of our Advisor to divert their time and attention away from us or otherwise cause them not to dedicate a significant portion of their time to our businesses which could slow our rate of investment.
In addition, our Advisor manages other funds, and may manage additional funds in the future, that have investment objectives that are similar, in whole or in part, to ours. Our Advisor may determine that an investment is appropriate for us and for one or more of those other funds. In such an event, depending on the availability of the investment and other appropriate factors, our Advisor will endeavor to allocate investment opportunities in a fair and equitable manner and act in accordance with its written allocation policy to address and, if necessary, resolve any conflict of interests. It is also possible that we may not be given the opportunity to participate in these other investment opportunities.
We pay management and incentive fees to our Advisor and reimburse our Advisor for certain expenses it incurs. As a result, investors in our common stock invest on a “gross” basis and receive distributions on a “net” basis after expenses, resulting in a lower rate of return than an investor might achieve through direct investments. Also, the incentive fee payable by us to our Advisor may create an incentive for our Advisor to pursue investments on our behalf that are riskier or more speculative than would be the case in the absence of such compensation arrangements. In addition, if any of the other funds managed by our Advisor have a different fee structure than we do, our Advisor may, in certain circumstances, have an incentive to devote more time and resources, and/or recommend the allocation of investment opportunities, to such fund. For example, to the extent our Advisor’s incentive compensation is not subject to a total return requirement with respect to another fund, it may have an incentive to devote time and resources to such fund.
We have entered into a license agreement with HTF pursuant to which it has agreed to grant us a non-exclusive, royalty-free right and license to use the service mark “Horizon Technology Finance.” Under this agreement, we have a right to use the “Horizon Technology Finance” service mark for so long as the Investment Management Agreement is in effect between us and our Advisor. In addition, we pay our Advisor, our allocable portion of overhead and other expenses incurred by our Advisor in performing its obligations under the Administration Agreement, including rent, the fees and expenses associated with performing compliance functions, and our allocable portion of the compensation of our Chief Financial Officer and Chief Compliance Officer and their respective staffs. Any potential conflict of interest arising as a result of our arrangements with our Advisor could have a material adverse effect on our business, results of operations and financial condition.
Our incentive fee may impact our Advisor’s structuring of our investments, including by causing our Advisor to pursue speculative investments.
The incentive fee payable by us to our Advisor may create an incentive for our Advisor to pursue investments on our behalf that are riskier or more speculative than would be the case in the absence of such compensation arrangement. The incentive fee payable to our Advisor is calculated based on a percentage of our return on invested capital. This may encourage our Advisor to use leverage to increase the return on our investments. Under certain circumstances, the use of leverage may increase the likelihood of default, which would impair the value of our common stock. In addition, our Advisor receives the incentive fee based, in part, upon net capital gains realized on our investments. Unlike that portion of the incentive fee based on income, there is no hurdle rate applicable to the portion of the incentive fee based on net capital gains. As a result, our Advisor may have an incentive to invest more capital in investments that are likely to result in capital gains as compared to income-producing securities. Such a practice could result in our investing in more speculative investments than would otherwise be the case, which could result in higher investment losses, particularly during economic downturns. In addition, the incentive fee may encourage our Advisor to pursue different types of investments or structure investments in ways that are more likely to result in warrant gains or gains on equity investments, including upon exercise of equity participation rights, which are inconsistent with our investment strategy and disciplined underwriting process.
The incentive fee payable by us to our Advisor may also induce our Advisor to pursue investments on our behalf that have a deferred interest feature, even if such deferred payments would not provide cash necessary to enable us to pay current distributions to our stockholders. Under these investments, we would accrue interest over the life of the investment but would not receive the cash income from the investment until the end of the term. Our net investment income used to calculate the income portion of our investment fee, however, includes accrued interest. Thus, a portion of this incentive fee would be based on income that we have not yet received in cash. In addition, the “catch-up” portion of the incentive fee may encourage our Advisor to accelerate or defer interest payable by portfolio companies from one calendar quarter
30
to another, potentially resulting in fluctuations in the timing and amounts of distributions. Our governing documents do not limit the number of debt investments we may make with deferred interest features or the proportion of our income we derive from such debt investments.
Our ability to enter into transactions with our affiliates is restricted, which may limit the scope of investments available to us.
We are prohibited under the 1940 Act from participating in certain transactions with our affiliates without the prior approval of our independent directors and, in some cases, of the SEC. Any person that owns, directly or indirectly, 5% or more of our outstanding voting securities is our affiliate for purposes of the 1940 Act, and we are generally prohibited from buying or selling any security from or to, or entering into certain “joint” transactions (which could include investments in the same portfolio company) with, such affiliates, absent the prior approval of our independent directors or, in certain cases, the SEC.
Our Advisor is considered to be our affiliate under the 1940 Act, as is any person that controls, or is under common control with us or our Advisor. We are generally prohibited from buying or selling any security from or to, or entering into “joint” transactions with, such affiliates without prior approval of our independent directors and, in some cases, exemptive relief from the SEC.
We may, however, invest alongside other clients of our Advisor in certain circumstances where doing so is consistent with applicable law, SEC staff interpretations and/or exemptive relief issued by the SEC. For example, we may invest alongside such accounts consistent with guidance promulgated by the staff of the SEC permitting us and such other accounts to purchase interests in a single class of privately placed securities so long as certain conditions are met, including that our Advisor, acting on our behalf and on behalf of other clients, negotiates no term other than price. We may also invest alongside our Advisor’s other clients as otherwise permissible under regulatory guidance and applicable regulations. Such investments will be allocated in accordance with our Advisor’s allocation policy, and this allocation policy is periodically approved by our Advisor and reviewed by our independent directors. We expect that allocation determinations will be made similarly for other accounts sponsored or managed by our Advisor. If sufficient securities or loan amounts are available to satisfy our and each such account’s proposed demand, we expect that the opportunity will be allocated in accordance with our Advisor’s pre-transaction determination; however, if insufficient securities or loan amounts are available, the opportunity will generally be allocated pro rata based on each affiliate’s initial allocation in the asset class being allocated. We cannot assure you that investment opportunities will be allocated to us fairly or equitably in the short-term or over time.
On November 27, 2017, we were granted exemptive relief from the SEC that permits greater flexibility to negotiate the terms of co-investments if our Board determines in advance that it would be advantageous for us to co-invest with other accounts sponsored or managed by our Advisor in a manner consistent with our investment objective, positions, policies, strategies and restrictions, as well as regulatory requirements and other relevant factors. We cannot assure you, however, that we will develop opportunities that comply with such limitations.
In situations where co-investment with other accounts managed by our Advisor is not permitted or appropriate, our Advisor will need to decide which client will proceed with the investment. Our Advisor’s allocation policy provides, in such circumstances, for investments to be allocated to assure that all clients have fair and equitable access to such investment opportunities over time. Moreover, except in certain circumstances, we will be unable to invest in any issuer in which a fund managed by our Advisor has previously invested. Similar restrictions limit our ability to transact business with our officers or directors or their affiliates. These restrictions may limit the scope of investment opportunities that would otherwise be available to us.
The valuation process for certain of our portfolio holdings creates a conflict of interest.
The majority of our portfolio investments are expected to be made in the form of securities that are not publicly traded. As a result, the Board will determine the fair value of these securities in good faith as described above in “— Because many of our investments typically are not and will not be in publicly traded securities, the value of our investments may not be readily determinable, which could adversely affect the determination of our NAV.” In connection with that determination, investment professionals from the Advisor may provide the Board with portfolio company valuations based
31
upon the most recent portfolio company financial statements available and projected financial results of each portfolio company. The participation of the Advisor’s investment professionals in our valuation process could result in a conflict of interest as the Advisor’s management fee is based, in part, on our gross assets less cash and cash equivalents, and our incentive fees will be based, in part, on unrealized appreciation and depreciation on our investments.
Our Advisor’s liability is limited, and we have agreed to indemnify our Advisor against certain liabilities, which may lead our Advisor to act in a riskier manner on our behalf than it would when acting for its own account.
Under the Investment Management Agreement, our Advisor does not assume any responsibility to us other than to render the services called for under that agreement, and it is not responsible for any action of our Board in following or declining to follow our Advisor’s advice or recommendations. Under the terms of the Investment Management Agreement, our Advisor, its officers, members, personnel and any person controlling or controlled by our Advisor are not liable to us, any subsidiary of ours, our directors, our stockholders or any subsidiary’s stockholders or partners for acts or omissions performed in accordance with and pursuant to the Investment Management Agreement, except those resulting from acts constituting gross negligence, willful misconduct, bad faith or reckless disregard of our Advisor’s duties under the Investment Management Agreement. In addition, we have agreed to indemnify our Advisor and each of its officers, directors, members, managers and employees from and against any claims or liabilities, including reasonable legal fees and other expenses reasonably incurred, arising out of or in connection with our business and operations or any action taken or omitted on our behalf pursuant to authority granted by the Investment Management Agreement, except where attributable to gross negligence, willful misconduct, bad faith or reckless disregard of such person’s duties under the Investment Management Agreement. These protections may lead our Advisor to act in a riskier manner when acting on our behalf than it would when acting for its own account.
If we are unable to manage our future growth effectively, we may be unable to achieve our investment objective, which could adversely affect our business, results of operations and financial condition and cause the value of your investment in us to decline.
Our ability to achieve our investment objective depends on our ability to achieve and sustain growth, which depends, in turn, on our Advisor’s direct origination capabilities and disciplined underwriting process in identifying, evaluating, financing, investing in and monitoring suitable companies that meet our investment criteria. Accomplishing this result on a cost-effective basis is largely a function of our Advisor’s marketing capabilities, management of the investment process, ability to provide efficient services and access to financing sources on acceptable terms. In addition to monitoring the performance of our existing investments, our Advisor may also be called upon to provide managerial assistance to our portfolio companies. These demands on their time may distract them or slow the rate of investment. If we fail to manage our future growth effectively, our business, results of operations and financial condition could be materially adversely affected and the value of your investment in us could decrease.
Our business plan and growth strategy depend to a significant extent upon our Advisor’s referral relationships. If our Advisor is unable to develop new or maintain existing relationships, or if these relationships fail to generate investment opportunities, our business could be materially adversely affected.
We have historically depended on our Advisor’s referral relationships to generate investment opportunities. For us to achieve our future business objectives, members of our Advisor need to maintain these relationships with venture capital and private equity firms and management teams and legal firms, accounting firms, investment banks and other lenders, and we rely to a significant extent upon these relationships to provide us with investment opportunities. If they fail to maintain their existing relationships or develop new relationships with other firms or sources of investment opportunities, we may not be able to grow our investment portfolio. In addition, persons with whom our Advisor has relationships are not obligated to provide us with investment opportunities, and, therefore, there is no assurance that such relationships will lead to the origination of debt or other investments.
32
Our Advisor can resign on 60 days’ notice, and we may not be able to find a suitable replacement within that time, resulting in a disruption in our operations that could adversely affect our business, results of operations or financial condition.
Under our Investment Management Agreement and our Administration Agreement, our Advisor has the right to resign at any time, upon not more than 60 days’ written notice, whether we have found a replacement or not. If our Advisor resigns, we may not be able to find a new investment adviser or administrator or hire internal management with similar expertise and ability to provide the same or equivalent services on acceptable terms within 60 days, or at all. If we are unable to do so, our operations are likely to be disrupted, our business, results of operations and financial condition and our ability to pay distributions may be adversely affected and the market price of our shares may decline. In addition, the coordination of our internal management and investment activities is likely to suffer if we are unable to identify and reach an agreement with a single institution or group of executives having the expertise possessed by our Advisor and its affiliates. Even if we are able to retain comparable management, whether internal or external, the integration of new management and their lack of familiarity with our investment objective may result in additional costs and time delays that may adversely affect our business, results of operations or financial condition.
Risks Related to Our Investments
Our stockholders are not able to evaluate our future investments.
Our future investments will be selected by our Advisor, subject to the approval of its investment committee. Our stockholders do not have input into our Advisor’s investment decisions. As a result, our stockholders are unable to evaluate any of our future portfolio company investments. These factors increase the uncertainty, and thus the risk, of investing in our securities.
We are a non-diversified investment company within the meaning of the 1940 Act, and therefore we generally are not limited with respect to the proportion of our assets that may be invested in securities of a single issuer.
We are classified as a non-diversified investment company within the meaning of the 1940 Act, which means that we are not limited by the 1940 Act with respect to the proportion of our assets that we may invest in securities of a single issuer, excluding limitations on stake holdings in investment companies. Beyond our income tax diversification requirements, we do not have fixed guidelines for diversification, and our investments could be focused on relatively few portfolio companies. Although we are classified as a non-diversified investment company within the meaning of the 1940 Act, we maintain the flexibility to operate as a diversified investment company and have done so for an extended period of time. To the extent that we operate as a non-diversified investment company in the future, we may be subject to greater risk.
To the extent that we assume large positions in the securities of a small number of issuers, our NAV may fluctuate to a greater extent than that of a diversified investment company as a result of changes in the financial condition or the market’s assessment of the issuer. If a significant investment in one or more portfolio companies fails to perform as expected, our financial results could be more negatively affected and the magnitude of the loss could be more significant than if we had made smaller investments in more portfolio companies. We may also be more susceptible to any single economic or regulatory occurrence than a diversified investment company.
Our portfolio may be focused on a limited number of industries, which will subject us to a risk of significant loss if there is a downturn in a particular industry.
Our portfolio may be focused on a limited number of industries. As a result, a downturn in any particular industry in which we are invested could also significantly impact the aggregate returns we realize. Our Target Industries are susceptible to changes in government policy and economic assistance, which could adversely affect the returns we receive.
If our investments do not meet our performance expectations, you may not receive distributions.
We intend to make distributions of income on a monthly basis to our stockholders. We may not be able to achieve operating results that will allow us to make distributions at a specific level or increase the amount of these distributions from time to time. In addition, due to the asset coverage test applicable to us as a BDC, we may be limited in our ability
33
to make distributions. Also, restrictions and provisions in any existing or future credit facilities may limit our ability to make distributions. If we do not distribute a certain percentage of our income each tax year as dividends to stockholders, we will suffer adverse tax consequences, including the possible loss of our ability to be subject to tax as a RIC.
Most of our portfolio companies will need additional capital, which may not be readily available.
Our portfolio companies typically require substantial additional financing to satisfy their continuing working capital and other capital requirements and service the interest and principal payments on our investments. We cannot predict the circumstances or market conditions under which our portfolio companies will seek additional capital. Each round of institutional equity financing is typically intended to provide a company with only enough capital to reach the next stage of development. It is possible that one or more of our portfolio companies will not be able to raise additional financing or may be able to do so only at a price or on terms that are unfavorable to the portfolio company, either of which would negatively impact our investment returns. Some of these companies may be unable to obtain sufficient financing from private investors, public capital markets or lenders, thereby requiring these companies to cease or curtail business operations. Accordingly, investing in these types of companies generally entails a higher risk of loss than investing in companies that do not have significant incremental capital raising requirements.
Our failure to make follow-on investments in our portfolio companies could impair the value of our portfolio.
Following an initial investment in a portfolio company, we may have opportunities to make additional investments in that portfolio company as “follow-on” investments, in seeking to:
| ● | increase or maintain in whole or in part our position as a creditor or equity ownership percentage in a portfolio company; |
| ● | exercise warrants, options or convertible securities that were acquired in the original or subsequent financing; or |
| ● | preserve or enhance the value of our investment. |
We have discretion to make follow-on investments, subject to the availability of capital resources. Failure on our part to make follow-on investments may, in some circumstances, jeopardize the continued viability of a portfolio company and our initial investment, or may result in a missed opportunity for us to increase our participation in a successful portfolio company. Even if we have sufficient capital to make a desired follow-on investment, we may elect not to make a follow-on investment because we may not want to increase our level of risk, because we prefer other opportunities or because of regulatory or other considerations. Our ability to make follow-on investments may also be limited by our Advisors’ allocation policy.
Economic recessions or downturns could adversely affect our business and that of our portfolio companies which may have an adverse effect on our business, results of operations and financial condition.
General economic conditions may affect our activities and the operation and value of our portfolio companies. Economic slowdowns or recessions may result in a decrease of institutional equity investment, which would limit our lending opportunities. Furthermore, many of our portfolio companies are susceptible to economic or industry centric slowdowns or recessions and may be unable to repay our debt investments during these periods. Therefore, our non-performing assets are likely to increase and the value of our portfolio is likely to decrease during these periods. Adverse economic conditions may also decrease the value of collateral securing some of our debt investments and the value of our equity investments. Economic slowdowns or recessions could lead to financial losses in our portfolio and a material decrease in revenues, net income and assets. Unfavorable economic conditions could also increase our funding costs, limit our access to the capital markets or result in a decision by lenders not to extend credit to us.
A portfolio company’s failure to satisfy financial or operating covenants imposed by us or other lenders could lead to defaults and, potentially, termination of its loans and foreclosure on its secured assets, which could trigger cross-defaults under other agreements and jeopardize the portfolio company’s ability to meet its obligations under the loans that we hold. We may incur expenses to the extent necessary to recover our investment upon default or to negotiate new terms with a defaulting portfolio company. These events could harm our financial condition and operating results.
34
A period of market disruption may have a material adverse effect on our business, financial condition, results of operations and cash flows. In addition, unfavorable economic conditions, including rising interest rates, may also increase our funding costs, limit our access to capital markets or negatively impact our ability to obtain financing, particularly from the debt markets.
Our investment strategy focuses on investments in development-stage companies in our Target Industries, which are subject to many risks, including volatility, intense competition, shortened product life cycles and periodic downturns, and would be rated below “investment grade.”
We intend to invest, under normal circumstances, most of the value of our total assets (including the amount of any borrowings for investment purposes) in development-stage companies, which may have relatively limited operating histories, in our Target Industries. Many of these companies may have narrow product lines and small market shares, compared to larger established, publicly owned firms, which tend to render them more vulnerable to competitors’ actions and market conditions, as well as general economic downturns. The revenues, income (or losses) and valuations of development-stage companies in our Target Industries can and often do fluctuate suddenly and dramatically. For these reasons, investments in our portfolio companies, if rated by one or more ratings agency, would typically be rated below “investment grade,” which refers to securities rated by ratings agencies below the four highest rating categories. These companies may also have more limited access to capital and higher funding costs. In addition, development-stage technology markets are generally characterized by abrupt business cycles and intense competition, and the competitive environment can change abruptly due to rapidly evolving technology. Therefore, our portfolio companies may face considerably more risk than companies in other industry sectors. Accordingly, these factors could impair their cash flow or result in other events, such as bankruptcy, which could limit their ability to repay their obligations to us and may materially adversely affect the return on, or the recovery of, our investments in these businesses.
Because of rapid technological change, the average selling prices of products and some services provided by development-stage companies in our Target Industries have historically decreased over their productive lives. These decreases could adversely affect their operating results and cash flow, their ability to meet obligations under their debt securities and the value of their equity securities. This could, in turn, materially adversely affect our business, financial condition and results of operations.
Any unrealized depreciation we experience on our debt investments may be an indication of future realized losses, which could reduce our income available for distribution.
As a BDC, we are required to carry our investments at fair value, which is the market value of our investments or, if no market value is ascertainable, at the fair value as determined in good faith pursuant to procedures approved by our Board in accordance with our valuation policy. We are not permitted to maintain a reserve for debt investment losses. Decreases in the fair values of our investments, which can occur rapidly based upon developments affecting our portfolio companies, are recorded as unrealized depreciation. Any unrealized depreciation in our debt investments could be an indication of a portfolio company’s inability to meet its repayment obligations to us with respect to the affected debt investments. This could result in realized losses in the future and ultimately reduces our income available for distribution in future periods.
If the assets securing the debt investments we make decrease in value, we may not have sufficient collateral to cover losses and may experience losses upon foreclosure.
We believe our portfolio companies generally are and will be able to repay our debt investments from their available capital, from future capital-raising transactions or from cash flow from operations. However, to mitigate our credit risks, we typically take a security interest in all or a portion of the assets of our portfolio companies. There is a risk that the collateral securing our debt investments may decrease in value over time, may be difficult to appraise or sell in a timely manner and may fluctuate in value based upon the business and market conditions, including as a result of an inability of the portfolio company to raise additional capital, and, in some circumstances, our lien could be subordinated to claims of other creditors. In addition, deterioration of a portfolio company’s financial condition and prospects, including its inability to raise additional capital, may be accompanied by deterioration of the value of the collateral for the debt investment. Consequently, although such debt investment is secured, we may not receive principal and interest payments according to
35
the debt investment’s terms and the value of the collateral may not be sufficient to recover our investment should we be forced to enforce our remedies.
In addition, because we invest in development-stage companies in our Target Industries, a substantial portion of the assets securing our investment may be in the form of intellectual property, if any, inventory, equipment, cash and accounts receivables. Intellectual property, if any, which secures a debt investment could lose value if the company’s rights to the intellectual property are challenged or if the company’s license to the intellectual property is revoked or expires. In addition, in lieu of a security interest in a portfolio company’s intellectual property we may sometimes obtain a security interest in all assets of the portfolio company other than intellectual property and also obtain a commitment by the portfolio company not to grant liens to any other creditor on the company’s intellectual property. In these cases, we may have additional difficulty recovering our principal in the event of a foreclosure. Similarly, any equipment securing our debt investments may not provide us with the anticipated security if there are changes in technology or advances in new equipment that render the particular equipment obsolete or of limited value or if the company fails to adequately maintain or repair the equipment. Any one or more of the preceding factors could materially impair our ability to recover principal in a foreclosure, which may adversely affect our ability to pay distributions in the future.
We may choose to waive or defer enforcement of covenants in the debt securities held in our portfolio, which may cause us to lose all or part of our investment in these companies.
We structure the debt investments in our portfolio companies to include business and financial covenants placing affirmative and negative obligations on the operation of such companies’ business and financial condition. However, from time to time we may elect to waive breaches of these covenants, including our right to payment, or waive or defer enforcement of remedies, such as acceleration of obligations or foreclosure on collateral, depending upon the financial condition and prospects of the particular portfolio company. These actions may reduce the likelihood of our receiving the full amount of future payments of interest or principal and be accompanied by a deterioration in the value of the underlying collateral as many of these companies may have limited financial resources, may be unable to meet future obligations and may go bankrupt. These events could harm our financial condition and operating results.
The lack of liquidity in our investments may adversely affect our business, and if we need to sell any of our investments, we may not be able to do so at a favorable price. As a result, we may suffer losses.
We plan to generally invest in debt investments with terms of up to four years and hold such investments until maturity, unless earlier prepaid, and we do not expect that our related holdings of equity securities will provide us with liquidity opportunities in the near-term. We expect to primarily invest in companies whose securities are not publicly-traded, and whose securities are subject to legal and other restrictions on resale or are otherwise less liquid than publicly traded securities. The illiquidity of these investments may make it difficult for us to sell these investments when desired. We may also face other restrictions on our ability to liquidate an investment in a public portfolio company to the extent that we possess material non-public information regarding the portfolio company. In addition, if we are required to liquidate all or a portion of our portfolio quickly, we may realize significantly less than the value at which we had previously recorded these investments. As a result, we do not expect to dispose of our investments in the near term. However, we may be required to do so in order to maintain our qualification as a BDC and as a RIC if we do not satisfy one or more of the applicable criteria under the respective regulatory frameworks. Because most of our investments are illiquid, we may be unable to dispose of them, in which case we could fail to qualify as a RIC and/or BDC, or we may not be able to dispose of them at favorable prices, and as a result, we may suffer losses.
The disposition of our debt investments may result in contingent liabilities.
In connection with the disposition of a debt investment, we may be required to make representations about the business and financial affairs of the portfolio company typical of those made in connection with the sale of a business. We may also be required to indemnify the purchasers of such debt investment to the extent that any such representations turn out to be inaccurate or with respect to potential liabilities. These arrangements may result in contingent liabilities that ultimately result in funding obligations that we must satisfy through our return of distributions previously made to us.
36
Our portfolio companies may incur debt that ranks equally with, or senior to, our investments in such companies.
We plan to invest primarily in debt investments issued by our portfolio companies. Some of our portfolio companies are permitted to have other debt that ranks equally with, or senior to, our debt investments in the portfolio company. By their terms, these debt instruments may provide that the holders thereof are entitled to receive payment of interest or principal on or before the dates on which we are entitled to receive payments in respect of our debt investments. These debt instruments may prohibit the portfolio companies from paying interest on or repaying our investments in the event of, and during, the continuance of a default under the debt instruments. In addition, in the event of insolvency, liquidation, dissolution, reorganization or bankruptcy of a portfolio company, holders of debt instruments ranking senior to our investment in that portfolio company would typically be entitled to receive payment in full before we receive any payment in respect of our investment. After repaying senior creditors, a portfolio company may not have any remaining assets to use for repaying its obligation to us. In the case of debt ranking equally with our debt investments, we would have to share on a pro rata basis any distributions with other creditors holding such debt in the event of an insolvency, liquidation, dissolution, reorganization or bankruptcy.
There may be circumstances where our debt investments could be subordinated to claims of other creditors, or we could be subject to lender liability claims.
Even though certain of our investments are structured as senior debt investments, if one of our portfolio companies were to go bankrupt, depending on the facts and circumstances, including the extent to which we actually provided managerial assistance to that portfolio company, a bankruptcy court might recharacterize our debt investment and subordinate all or a portion of our claim to that of other creditors or an out-of-court restructuring might enable other lenders to become effectively senior to our claims. We may also be subject to lender liability claims for actions taken by us with respect to a portfolio company’s business, including in rendering significant managerial assistance, or instances where we exercise control over the portfolio company.
An investment strategy that primarily includes investments in privately held companies presents certain challenges, including a lack of available information about these companies, a dependence on the talents and efforts of only a few key portfolio company personnel and a greater vulnerability to economic downturns.
We currently invest, and plan to invest, in privately held companies. Generally, very little public information exists about these companies, and we are required to rely on the ability of our Advisor to obtain adequate information to evaluate the potential returns from investing in these companies. If we are unable to uncover all material information about these companies, we may not make a fully informed investment decision, and we may lose money on our investments. Also, privately held companies frequently have less diverse product lines and a smaller market presence than larger competitors. Thus, they are generally more vulnerable to economic downturns and may experience substantial variations in operating results. These factors could affect our investment returns.
In addition, our success depends, in large part, upon the abilities of the key management personnel of our portfolio companies, who are responsible for the day-to-day operations of our portfolio companies. Competition for qualified personnel is intense at any stage of a company’s development. The loss of one or more key managers can hinder or delay a company’s implementation of its business plan and harm its financial condition. Our portfolio companies may not be able to attract and retain qualified managers and personnel. Any inability to do so may negatively affect our investment returns.
The borrowing needs of our portfolio companies are unpredictable, especially during a challenging economic environment. We may not be able to meet our unfunded commitments to extend credit, which could have a material adverse effect on our reputation in the market and our ability to generate incremental lending activity and may subject us to lender liability claims.
A commitment to extend credit is an agreement to lend funds to our portfolio companies as long as there is no violation of any condition established under the agreement. Because of the credit profile of our portfolio companies, we typically have a substantial amount of total unfunded credit commitments, which amount is not reflected on our balance sheet. The actual borrowing needs of our portfolio companies may exceed our expected funding requirements, especially during a challenging economic environment when our portfolio companies may be more dependent on our credit commitments due
37
to the lack of available credit elsewhere, an increasing cost of credit or the limited availability of equity financing from venture capital firms or otherwise. In addition, limited partner investors of some of our portfolio companies may fail to meet their underlying investment commitments due to liquidity or other financing issues, which may increase our portfolio companies’ borrowing needs. Any failure to meet our unfunded credit commitments in accordance with the actual borrowing needs of our portfolio companies may have a material adverse effect on our reputation in the market and our ability to generate incremental lending activity and may subject us to lender liability claims.
We may hold the debt securities of leveraged companies that may, due to the significant volatility of such companies, experience bankruptcy or similar financial distress.
Leveraged companies may experience bankruptcy, receivership or similar financial distress. The debt investments of distressed companies may not produce income, may require us to bear certain expenses or to make additional advances in order to protect our investment and may subject us to uncertainty as to when, in what manner (e.g., through liquidation, reorganization, receivership or bankruptcy) and for what value such distressed debt will eventually be satisfied. Proceeds received from such proceedings may not be income that satisfies the Qualifying Income Test for RICs and may not be in an amount sufficient to repay such expenses or advances. In the event that a plan of reorganization is adopted or a receivership is established, in exchange for the debt investment we currently hold, we may receive non-cash proceeds, including equity securities or license or royalty agreements with contingent payments, which may require significantly more of our management’s time and attention. In addition, if we take control of a distressed company in connection with a reorganization, it could require additional costs and significant amounts of our management’s time and attention.
If a portfolio company enters a bankruptcy process, we will be subject to a number of significant inherent risks. Many events in a bankruptcy proceeding are the product of contested matters and adversarial proceedings and are beyond the control of the creditors. A bankruptcy filing by an issuer may adversely and permanently affect the issuer. If the proceeding is converted to a liquidation, the value of the issuer may not equal the liquidation value that was believed to exist at the time of the investment. The duration of a bankruptcy proceeding is also difficult to predict, and a creditor’s return on investment can be adversely affected by delays until the plan of reorganization or liquidation ultimately becomes effective. The administrative costs of a bankruptcy proceeding are frequently high and would be paid out of the debtor’s estate prior to any return to creditors. Because the standards for classification of claims under bankruptcy law are vague, our influence with respect to the class of securities or other obligations we own may be lost by increases in the number and amount of claims in the same class or by different classification and treatment. In the early stages of the bankruptcy process, it is often difficult to estimate the extent of, or even to identify, any contingent claims that might be made. In addition, certain claims that have priority by law (for example, claims for taxes) may be substantial.
Prepayments of our debt investments by our portfolio companies could adversely impact our results of operations and reduce our return on equity.
We are subject to the risk that the investments we make in our portfolio companies may be repaid prior to maturity. For example, most of our debt investments have historically been repaid prior to maturity by our portfolio companies. At the time of a liquidity event, such as a sale of the business, refinancing or public offering, many of our portfolio companies have availed themselves of the opportunity to repay our debt investments prior to maturity. Our investments generally allow for repayment at any time subject to certain penalties. When this occurs, we generally reinvest these proceeds in temporary investments, pending their future investment in new portfolio companies. These temporary investments have substantially lower yields than the debt being prepaid, and we could experience significant delays in reinvesting these amounts. Any future investment in a new portfolio company may also be at lower yields than the debt that was repaid. As a result, our results of operations could be materially adversely affected if one or more of our portfolio companies elects to prepay amounts owed to us. Additionally, prepayments could negatively impact our return on equity, which could result in a decline in the market price of our common stock.
Our business and growth strategy could be adversely affected if government regulations, priorities and resources impacting the industries in which our portfolio companies operate change.
Some of our portfolio companies operate in industries that are highly regulated by federal, state and/or local agencies. Changes in existing laws, rules or regulations, or judicial or administrative interpretations thereof, or uncertainty regarding such changes or new laws, rules or regulations could have an adverse impact on the business and industries of our portfolio
38
companies. In addition, changes in government priorities or limitations on government resources could also adversely impact our portfolio companies. We are unable to predict whether any such changes in laws, rules or regulations will occur and, if they do occur, the impact of these changes on our portfolio companies and our investment returns.
Our portfolio companies operating in the technology industry are subject to risks particular to that industry.
As part of our investment strategy, we have invested, and plan to invest in the future, in companies in the technology industry. Such portfolio companies face intense competition as their businesses are rapidly evolving and intensely competitive, and are subject to changing technology, shifting user needs, and frequent introductions of new products and services. The growth of certain technology sectors in which we focus (such as communications, networking, data storage, software, cloud computing, and internet and media) into a variety of new fields implicates new regulatory issues and may result in our portfolio companies in such sectors being subject to new regulations.
Portfolio companies in the technology industry may also have a limited number of suppliers of necessary components or a limited number of manufacturers for their products, and therefore face a risk of disruption to their manufacturing process if they are unable to find alternative suppliers when needed. In addition, litigation regarding intellectual property rights is common in the sectors of the technology industry in which we focus. See “–If our portfolio companies are unable to protect their intellectual property rights, our business and prospects could be harmed, and if portfolio companies are required to devote significant resources to protecting their intellectual property rights, the value of our investment could be reduced.” Any of these factors could materially and adversely affect the operations of a portfolio company in this industry and, in turn, impair our ability to timely collect principal and interest payments owed to us.
Our portfolio companies operating in the life science industry are subject to extensive government regulation and certain other risks particular to that industry.
As part of our investment strategy, we have invested, and plan to invest in the future, in companies in the life science industry.
Such portfolio companies are subject to extensive regulation by the Food and Drug Administration and to a lesser extent, other federal and state agencies. If any of these portfolio companies fail to comply with applicable regulations, they could be subject to significant penalties and claims that could materially and adversely affect their operations. In addition, new laws, regulations or judicial interpretations of existing laws and regulations might adversely affect a portfolio company in this industry.
The successful and timely implementation of the business model of life science companies depends on their ability to adapt to changing technologies and introduce new products. The success of new product offerings will depend, in turn, on many factors, including the ability to properly anticipate and satisfy customer needs, obtain regulatory approvals on a timely basis, develop and manufacture products in an economic and timely manner, obtain or maintain advantageous positions with respect to intellectual property, and differentiate products from those of competitors.
Further, the development of products (including medical devices or drugs) by life science companies requires significant research and development, clinical trials and regulatory approvals. The results of product development efforts may be affected by a number of factors, including the ability to innovate, develop and manufacture new products, complete clinical trials, obtain regulatory approvals and reimbursement by insurers in the United States (including Medicare and Medicaid) and abroad, or gain and maintain market approval of products. In addition, patents attained by others can preclude or delay the commercialization of a product. There can be no assurance that any products now in development will achieve technological feasibility, obtain regulatory approval, or gain market acceptance. Failure can occur at any point in the development process, including after significant funds have been invested. Products may fail to reach the market or may have only limited commercial success because of efficacy or safety concerns, failure to achieve positive clinical outcomes, inability to obtain necessary regulatory approvals, failure to achieve market adoption, limited scope of approved uses, excessive costs to manufacture, failure to establish or maintain intellectual property rights, infringement by others of a company’s intellectual property rights, or infringement by a company of intellectual property rights of others.
Portfolio companies in the life science industry may also have a limited number of suppliers of necessary components or a limited number of manufacturers for their products, and therefore face a risk of disruption to their manufacturing
39
process if they are unable to find alternative suppliers when needed. Any of these factors could materially and adversely affect the operations of a portfolio company in this industry and, in turn, impair our ability to timely collect principal and interest payments owed to us.
Our portfolio companies operating in the healthcare information and services industry are subject to extensive government regulation and certain other risks particular to that industry.
As part of our investment strategy, we have invested, and plan to invest in the future, in companies in the healthcare information and services industry. Such portfolio companies provide technology to companies that are subject to extensive regulation, including Medicare and Medicaid payment rules and regulation, the False Claims Act and federal and state laws regarding the collection, use and disclosure of patient health information and the storage, handling and administration of pharmaceuticals. If any of our portfolio companies or the companies to which they provide such technology fail to comply with applicable regulations, they could be subject to significant penalties and claims that could materially and adversely affect their operations. Portfolio companies in the healthcare information or services industry are also subject to the risk that changes in applicable regulations will render their technology obsolete or less desirable in the marketplace.
Portfolio companies in the healthcare information and services industry may also have a limited number of suppliers of necessary components or a limited number of manufacturers for their products, and therefore face a risk of disruption to their manufacturing process if they are unable to find alternative suppliers when needed. Any of these factors could materially and adversely affect the operations of a portfolio company in this industry and, in turn, impair our ability to timely collect principal and interest payments owed to us.
Our investments in the sustainability industry are subject to many risks, including volatility, intense competition, unproven technologies, periodic downturns and potential litigation.
Our investments in sustainability companies are subject to substantial operational risks, such as underestimated cost projections, unanticipated operation and maintenance expenses, loss of government subsidies, and inability to deliver cost-effective alternative energy solutions compared to traditional energy products. In addition, energy companies employ a variety of means of increasing cash flow, including increasing utilization of existing facilities, expanding operations through new construction or acquisitions, or securing additional long-term contracts. Thus, some energy companies may be subject to construction risk, acquisition risk or other risks arising from their specific business strategies. Furthermore, production levels for solar, wind and other renewable energies may be dependent upon adequate sunlight, wind, or biogas production, which can vary from market to market and period to period, resulting in volatility in production levels and profitability. In addition, our sustainability companies may have narrow product lines and small market shares, which tend to render them more vulnerable to competitors’ actions and market conditions, as well as to general economic downturns. The revenues, income (or losses) and valuations of sustainability companies can and often do fluctuate suddenly and dramatically and the markets in which sustainability companies operate are generally characterized by abrupt business cycles and intense competition. Demand for sustainability and renewable energy is also influenced by the available supply and prices for other energy products, such as coal, oil and natural gas. A decrease in prices in these energy products could reduce demand for alternative energy. Sustainability companies face potential litigation, including significant warranty and product liability claims, as well as class action and government claims. Such litigation could adversely affect the business and results of operations of our sustainability portfolio companies.
Sustainability companies are subject to extensive government regulation and certain other risks particular to the sectors in which they operate and our business and growth strategy could be adversely affected if government regulations, priorities and resources impacting such sectors change or if our portfolio companies fail to comply with such regulations.
As part of our investment strategy we invest in portfolio companies in sustainability sectors that may be subject to extensive regulation by foreign, U.S. federal, state and/or local agencies. Changes in existing laws, rules or regulations, or judicial or administrative interpretations thereof, uncertainty regarding such changes or new laws, rules or regulations could have an adverse impact on the business and industries of our portfolio companies. In addition, changes in government priorities or limitations on government resources could also adversely impact our portfolio companies. We are unable to predict whether any such changes in laws, rules or regulations will occur and, if they do occur, the impact of these changes on our portfolio companies and our investment returns. Furthermore, if any of our portfolio companies fail to comply with
40
applicable regulations, they could be subject to significant penalties and claims that could materially and adversely affect their operations. Our portfolio companies may be subject to the expense, delay and uncertainty of the regulatory approval process for their products and, even if approved, these products may not be accepted in the marketplace.
In particular, there is considerable uncertainty about whether foreign, U.S., state and/or local governmental entities will enact or maintain legislation or regulatory programs that mandate reductions in greenhouse gas emissions or provide incentives for sustainability companies. Without such regulatory policies, investments in sustainability companies may not be economical and financing for sustainability companies may become unavailable, which could materially adversely affect the ability of our portfolio companies to repay the debt they owe to us. Any of these factors could materially and adversely affect the operations and financial condition of a portfolio company and, in turn, the ability of the portfolio company to repay the debt they owe to us.
If our portfolio companies are unable to commercialize their technologies, products, business concepts or services, the returns on our investments could be adversely affected.
The value of our investments in our portfolio companies may decline if our portfolio companies are not able to commercialize their technology, products, business concepts or services. Additionally, although some of our portfolio companies may already have a commercially successful product or product line at the time of our investment, technology-related products and services often have a more limited market or life span than products in other industries. Thus, the ultimate success of these companies often depends on their ability to innovate continually in increasingly competitive markets. If they are unable to do so, our investment returns could be adversely affected and their ability to service their debt obligations to us over the life of a loan could be impaired. Our portfolio companies may be unable to acquire or develop successful new technologies and the intellectual property they currently hold may not remain viable. Even if our portfolio companies are able to develop commercially viable products, the market for new products and services is highly competitive and rapidly changing. Neither our portfolio companies nor we have any control over the pace of technology development. Commercial success is difficult to predict, and the marketing efforts of our portfolio companies may not be successful.
Our portfolio companies may rely upon licenses for all or part of their intellectual property.
A portfolio company may license all or part of its intellectual property from another unrelated party. While the portfolio company may continue development on that licensed intellectual property, it can be difficult to ascertain who has title to the intellectual property. We may also rely upon the portfolio company’s management team’s representations as to the nature of the licensing agreement. There are implications in workouts and in bankruptcy where intellectual property is not wholly owned by a portfolio company. Further, the licensor may have an actual or contingent claim on the intellectual property (for instance, a payment due upon change in control) that would supersede other claims in that asset in certain situations.
If our portfolio companies are unable to protect their intellectual property rights, our business and prospects could be harmed, and if portfolio companies are required to devote significant resources to protecting their intellectual property rights, the value of our investment could be reduced.
Our future success and competitive position depends in part upon the ability of our portfolio companies to obtain, maintain and protect proprietary technology used in their products and services. The intellectual property held by our portfolio companies often represents a substantial portion of the collateral securing our investments and/or constitutes a significant portion of the portfolio companies’ value that may be available in a downside scenario to repay our debt investments. Our portfolio companies rely, in part, on patent, trade secret and trademark law to protect that technology, but competitors may misappropriate their intellectual property, and disputes as to ownership of intellectual property may arise. Portfolio companies may, from time to time, be required to institute litigation to enforce their patents, copyrights or other intellectual property rights, protect their trade secrets, determine the validity and scope of the proprietary rights of others or defend against claims of infringement.
Such litigation could result in substantial costs and diversion of resources. Similarly, if a portfolio company is found to infringe or misappropriate a third party’s patent or other proprietary rights, it could be required to pay damages to the third party, alter its products or processes, obtain a license from the third party and/or cease activities utilizing the
41
proprietary rights, including making or selling products utilizing the proprietary rights. Any of the foregoing events could negatively affect both the portfolio company’s ability to service our debt investment and the value of any related debt and equity securities that we own, as well as the value of any collateral securing our investment.
In some cases, we collateralize our debt investments with a secured collateral position in a portfolio company’s assets, which may include a negative pledge or, to a lesser extent, no security interest on their intellectual property. In the event of a default on a debt investment, the intellectual property of the portfolio company would most likely be liquidated to provide proceeds to pay the creditors of the portfolio company. There can be no assurance that our security interest, if any, in the proceeds of the intellectual property will be enforceable in a court of law or bankruptcy court or that there will not be others with senior or pari passu credit interests.
We do not expect to control any of our portfolio companies.
We do not control, or expect to control in the future, any of our portfolio companies, even though our debt agreements may contain certain restrictive covenants that limit the business and operations of our portfolio companies. We also do not maintain, or intend to maintain in the future, a control position to the extent we own equity interests in any portfolio company. As a result, we are subject to the risk that a portfolio company in which we invest may make business decisions with which we disagree and the management of such company, as representatives of the holders of their common equity, may take risks or otherwise act in ways that do not serve our interests as debt investors. Due to the lack of liquidity of the investments that we typically hold in our portfolio companies, we may not be able to dispose of our investments in the event we disagree with the actions of a portfolio company and we may therefore, suffer a decrease in the value of our investments.
We may invest in foreign portfolio companies or secure our investments with the assets of our portfolio companies’ foreign subsidiaries.
We may invest in securities of foreign companies. Additionally, certain debt investments consisting of secured loans to portfolio companies with headquarters and primary operations located within the United States may be secured by the assets of a portfolio company’s foreign subsidiary. Investments involving foreign companies may involve greater risks. These risks include: (i) less publicly available information; (ii) varying levels of governmental regulation and supervision; and (iii) the difficulty of enforcing legal rights in a foreign jurisdiction and uncertainties as to the status, interpretation and application of laws. Moreover, foreign companies are generally not subject to uniform accounting, auditing and financial reporting standards, practices and requirements comparable to those applicable to United States companies. Debt investments secured by the assets of a portfolio company’s foreign subsidiary may be subject to various laws enacted in their home countries for the protection of debtors or creditors, which could adversely affect our ability to recover amounts owed. These insolvency considerations will differ depending on the country in which each foreign subsidiary is located and may differ depending on whether the foreign subsidiary is a non-sovereign or a sovereign entity. The economies of individual non-U.S. countries may also differ from the U.S. economy in such respects as growth of gross domestic product, rate of inflation, volatility of currency exchange rates, depreciation, capital reinvestment, resources self-sufficiency and balance of payments position. Accordingly, debt investments secured by the assets of a portfolio company’s foreign subsidiary could face risks which would not pertain to debt investments solely in U.S. portfolio companies.
We may not realize expected returns on warrants received in connection with our debt investments.
As discussed above, we generally receive warrants in connection with our debt investments. If we do not receive the returns that are anticipated on the warrants, our investment returns on our portfolio companies, and the value of your investment in us, may be lower than expected.
We currently invest a portion of our capital in high-quality short-term investments, which generate lower rates of return than those expected from investments made in accordance with our investment objective.
We currently invest a portion of our capital in cash, cash equivalents, U.S. government securities, money market funds and other high-quality short-term investments. These securities may earn yields substantially lower than the income that we anticipate receiving once these proceeds are fully invested in accordance with our investment objective.
42
Federal Income Tax Risks
If we are unable to satisfy the requirements under the Code for qualification as a RIC, we will be subject to corporate-level income taxes.
To qualify as a RIC under the Code, we must meet certain source-of-income and asset diversification requirements contained in Subchapter M of the Code, as well as maintain our election to be regulated as a BDC under the 1940 Act. We must also meet the Annual Distribution Requirement in order to avoid the imposition of corporate-level income taxes on all of our taxable income, regardless of whether we make any distributions to our stockholders.
The Qualifying Income Test is satisfied if we derive in each tax year at least 90% of our gross income from dividends, interest (including tax-exempt interest), payments with respect to certain securities loans, gains from the sale or other disposition of stock, securities or foreign currencies, other income (including but not limited to gain from options, futures or forward contracts) derived with respect to our business of investing in stock, securities or currencies, or net income derived from interests in “qualified publicly traded partnerships.” The status of certain forms of income we receive could be subject to different interpretations under the Code and might be characterized as non-qualifying income that could cause us to fail to qualify as a RIC, assuming we do not qualify for or take advantage of certain remedial provisions, and, thus, may cause us to be subject to corporate-level federal income taxes.
To qualify as a RIC, we must also meet the Diversification Tests at the end of each quarter of our tax year. Failure to meet these tests may result in our having to (1) dispose of certain investments quickly; (2) raise additional capital to prevent the loss of RIC status; or (3) engage in certain remedial actions that may entail the disposition of certain investments at disadvantageous prices that could result in substantial losses, and the payment of penalties, if we qualify to take such actions. Because most of our investments are and will be in development-stage companies within our Target Industries, any such dispositions could be made at disadvantageous prices and may result in substantial losses. If we raise additional capital to satisfy the asset diversification requirements, it could take a longer time to invest such capital. During this period, we will invest in temporary investments, such as money market funds, which we expect will earn yields substantially lower than the interest income that we anticipate receiving in respect of our investments in secured and amortizing debt investments.
The Annual Distribution Requirement is satisfied if we distribute dividends to our stockholders in each tax year of an amount generally equal to at least 90% of our investment company taxable income, determined without regard to any deductions for dividends paid. If we borrow money, we may be subject to certain asset coverage requirements under the 1940 Act and loan covenants that could, under certain circumstances, restrict us from making distributions necessary to qualify as a RIC. If we are unable to obtain cash from other sources, we may fail to be eligible to be subject to taxation as a RIC, assuming we do not qualify for or take advantage of certain remedial provisions, and, thus, may be subject to corporate-level income taxes.
If we were to fail to qualify as a RIC for any reason and become subject to a corporate-level income taxes, the resulting taxes could substantially reduce our net assets, the amount of income available for distribution to our stockholders, and the actual amount of our distributions. Such a failure would have a material adverse effect on us, the NAV of our common stock and the total return, if any, obtainable from your investment in our common stock. In addition, we could be required to recognize unrealized gains, incur substantial taxes and interest and make substantial distributions before requalifying as a RIC. See “Item 1. Business—Regulation.”
Because we distribute all or substantially all of our investment company taxable income to our stockholders, we will need additional capital to finance our growth. If additional funds are unavailable or not available on favorable terms, our ability to grow will be impaired.
To satisfy the requirements applicable to a RIC, to avoid incurring excise taxes and to minimize or to avoid incurring corporate-level federal income taxes, we intend to distribute to our stockholders all or substantially all of our investment company taxable income and net capital gains. However, we may retain all or a portion of our net capital gains, incur any applicable income taxes with respect thereto, and elect to treat such retained net capital gains as deemed distributions to our stockholders. As a BDC, we generally are required to maintain coverage of total assets to total senior securities, which includes all of our borrowings and any preferred stock we may issue in the future, of at least 150%, subject to certain
43
disclosures. This requirement limits the amount that we may borrow. Because we continue to need capital to grow our debt investment portfolio, this limitation may prevent us from incurring debt and require us to raise additional equity at a time when it may be disadvantageous to do so. We cannot assure you that debt and equity financing will be available to us on favorable terms, or at all, and debt financings may be restricted by the terms of any of our outstanding borrowings. In addition, as a BDC, we are limited in our ability to issue equity securities at a price below the then-current NAV per share. If additional funds are not available to us, we could be forced to curtail or cease new lending and investment activities, and our NAV could decline.
Because we intend to distribute substantially all of our income to our stockholders to maintain our ability to be subject to tax as a RIC, we will need to raise additional capital to finance our growth. If funds are not available to us, we may need to curtail new investments, and our common stock value could decline.
In order to satisfy the requirements to be treated as a RIC for federal income tax purposes, we intend to distribute to our stockholders substantially all of our investment company taxable income and net capital gains each taxable year. However, we may retain all or a portion of our net capital gains and pay applicable income taxes with respect thereto and elect to treat such retained net capital gains as deemed dividend distributions to our stockholders.
As a BDC, we are required to meet a 150% asset coverage ratio, subject to certain disclosure requirements of total assets to total senior securities, which includes all of our borrowings, and any preferred stock we may issue in the future. This requirement limits the amount we may borrow. If the value of our assets declines, we may be unable to satisfy this test. If that happens, we may be required to sell a portion of our investments or sell additional common stock and, depending on the nature of our leverage, to repay a portion of our indebtedness at a time when such sales and repayments may be disadvantageous. In addition, the issuance of additional securities could dilute the percentage ownership of our current stockholders in us.
We may have difficulty paying our required distributions if we recognize taxable income before or without receiving cash.
We may be required to recognize taxable income in circumstances in which we do not receive cash. For example, if we hold debt instruments that are treated under applicable tax rules as having original issue discount (such as debt instruments with PIK, or, in certain cases, increasing interest rates or issued with warrants), we must include in taxable income each tax year a portion of the original issue discount that accrues over the life of the debt instrument, regardless of whether cash representing such income is received by us in the same tax year. We do not have a policy limiting our ability to invest in original issue discount instruments, including PIK debt investments. Because in certain cases we may recognize taxable income before or without receiving cash representing such income, we may have difficulty meeting the Annual Distribution Requirement.
Accordingly, we may need to sell some of our assets at times that we would not consider advantageous, raise additional debt or equity capital or forego new investment opportunities or otherwise take actions that are disadvantageous to our business (or be unable to take actions that we believe are necessary or advantageous to our business) in order to satisfy the Annual Distribution Requirement. If we are unable to obtain cash from other sources to satisfy the Annual Distribution Requirement, we may become subject to a corporate-level income taxes on all of our income. The proportion of our income, consisting of interest and fee income that resulted from the portion of original issue discount classified as such in accordance with GAAP not received in cash for the years ended December 31, 2020, 2019 and 2018 was 10.4%, 10.2% and 10.4%, respectively.
If we make loans to borrowers or acquire loans that contain deferred payment features, such as loans providing for the payment of portions of principal and/or interest at maturity, this could increase the risk of default by our borrowers.
Our investments with deferred payment features, such as debt investments providing for ETPs, may represent a higher credit risk than debt investments requiring payments of all principal and accrued interest at regular intervals over the life of the debt investment. For example, even if the accounting conditions for income accrual were met during the period when the obligation was outstanding, the borrower could still default when our actual collection is scheduled to occur upon maturity of the obligation. The amount of ETPs due under our investments having such a feature currently represents a small portion of the applicable borrowers’ total repayment obligations under such investments. However, deferred payment
44
arrangements increase the incremental risk that we will not receive a portion of the amount due at maturity. Additionally, because investments with a deferred payment feature may have the effect of deferring a portion of the borrower’s payment obligation until maturity of the debt investment, it may be difficult for us to identify and address developing problems with borrowers in terms of their ability to repay us. Any such developments may increase the risk of default on our debt investments by borrowers.
In addition, debt investments providing for ETPs are subject to the risks associated with debt investments having original issue discount (such as debt instruments with PIK interest or, in certain cases, increasing interest rates or issued with warrants). See “—We may have difficulty paying our required distributions if we recognize taxable income before or without receiving cash.”
Risks Related to Business Development Companies
As a BDC, we generally are not able to issue our common stock at a price below the then-current NAV per share without first obtaining the approval of our stockholders and our independent directors. If our common stock trades at a price below NAV per share and we do not receive such approval, our business could be materially adversely affected.
As a BDC, we generally are not able to issue our common stock at a price below the then-current NAV per share without first obtaining the approval of our stockholders and our independent directors. Stockholder approval to offer our common stock at a price below NAV per share expired in January 2016, but we may seek such approval again in the future. If our common stock trades at a price below NAV per share and we do not receive approval from our stockholders and our independent directors to issue common stock at a price below NAV per share, we cannot raise capital through the issuance of common stock. This may limit our ability: to grow and make new investments; to attract and retain top investment professionals; to maintain deal flow and relations with top companies in our Target Industries and related entities such as venture capital and private equity sponsors; and to sustain a minimum efficient scale for a public company.
Regulations governing our operation as a BDC affect our ability to, and the way in which, we raise additional capital, which may expose us to additional risks.
Our business plans contemplate a need for a substantial amount of capital in addition to our current amount of capital. We may obtain additional capital through the issuance of debt securities or preferred stock, and we may borrow money from banks or other financial institutions, which we refer to collectively as “senior securities,” up to the maximum amount permitted by the 1940 Act. If we issue senior securities, we would be exposed to typical risks associated with leverage, including an increased risk of loss. In addition, if we issue preferred stock, it would rank senior to common stock in our capital structure and preferred stockholders would have separate voting rights and may have rights, preferences or privileges more favorable than those of holders of our common stock.
The 1940 Act permits us to issue senior securities in amounts such that our asset coverage, as defined in the 1940 Act, equals at least 150% after each issuance of senior securities, subject to certain disclosure requirements. If our asset coverage is not at least 150%, we are not permitted to pay distributions or issue additional senior securities. As a result, we may have difficulty meeting the Annual Distribution Requirement necessary to maintain RIC tax treatment. Moreover, if the value of our assets declines, we may be unable to satisfy this asset coverage test. If that happens, we may be required to liquidate a portion of our investments and repay a portion of our indebtedness at a time when we may be unable to do so or unable to do so on favorable terms.
As a BDC, we generally are not able to issue our common stock at a price below NAV per share without first obtaining the approval of our stockholders and our independent directors. Our stockholder approval expired in January 2016, but we may seek such approval again in the future. If our common stock trades at a price below NAV per share and we do not receive approval from our stockholders and our independent directors to issue common stock at a price below NAV per share, we cannot raise capital through the issuance of equity securities. This may limit our ability: to grow and make new investments; to attract and retain top investment professionals; to maintain deal flow and relations with top companies in our Target Industries and related entities such as venture capital and private equity sponsors; and to sustain a minimum efficient scale for a public company. The stockholder approval requirement does not apply to stock issued upon the exercise of options, warrants or rights that we may issue from time to time. If we raise additional funds by issuing more common
45
stock or senior securities convertible into, or exchangeable for, our common stock, the percentage ownership of our stockholders at that time would decrease, and you may experience dilution.
If we do not invest a sufficient portion of our assets in qualifying assets, we could fail to qualify as a BDC or be precluded from investing according to our current business strategy.
As a BDC, we are prohibited from acquiring any assets other than qualifying assets (as defined under the 1940 Act) unless, at the time of and after giving effect to such acquisition, at least 70% of our total assets are qualifying assets. Subject to certain exceptions for follow-on investments and distressed companies, an investment in an issuer that has outstanding securities listed on a national securities exchange may be treated as a qualifying asset only if such issuer has a market capitalization that is less than $250 million at the time of such investment and meets the other specified requirements. We may decide to make other investments that are not qualifying assets to the extent permitted by the 1940 Act.
If we acquire debt or equity securities from an issuer that has outstanding marginable securities at the time we make an investment, these acquired assets may not be treated as qualifying assets. This result is dictated by the definition of “eligible portfolio company” under the 1940 Act, which in part looks to whether a company has outstanding marginable securities. See Item 1 above, “Regulation — Qualifying assets.”
If we do not invest a sufficient portion of our assets in qualifying assets, we could lose our status as a BDC. If we do not maintain our status as a BDC, we would be subject to regulation as a registered closed-end investment company under the 1940 Act. As a registered closed-end investment company, we would be subject to substantially more regulatory restrictions under the 1940 Act, which would significantly decrease our operating flexibility.
New or modified laws or regulations governing our operations may adversely affect our business.
We and our portfolio companies are subject to regulation at the U.S. local, state and federal level. We are also subject to federal, state and local laws and are subject to judicial and administrative decisions that affect our operations, including maximum interest rates, fees and other charges, disclosures to portfolio companies, the terms of secured transactions, collection and foreclosure proceedings and other trade practices. If these laws, regulations or decisions change, or if we expand our business into additional jurisdictions, we may have to incur significant expenses in order to comply or we might have to restrict our operations. New legislation may be enacted or new interpretations, rulings or regulations could be adopted, including those governing the types of investments we or our portfolio companies are permitted to make, any of which could harm us and our stockholders, potentially with retroactive effect. In particular, the impact of the Dodd-Frank Act, and any amendments thereto that may be enacted, on us and our portfolio companies is subject to continuing uncertainty. The Dodd-Frank Act, including future rules implementing its provisions and the interpretation of those rules, along with other legislative and regulatory proposals directed at the financial services industry or affecting taxation that are proposed or pending in the U.S. Congress, may negatively impact the operations, cash flows or financial condition of us or our portfolio companies, impose additional costs on us or our portfolio companies, intensify the regulatory supervision of us or our portfolio companies or otherwise adversely affect our business or the business of our portfolio companies. Certain members of Congress have indicated they will seek to amend or repeal portions of the Dodd-Frank Act, among other federal laws. We cannot predict the ultimate effect on us or our portfolio companies that changes in the laws and regulations would have as a result of the Dodd-Frank Act, or whether and the extent to which the Dodd-Frank Act may remain in its current form. In addition, uncertainty regarding legislation and regulations affecting the financial services industry or taxation could also adversely impact our business or the business of our portfolio companies. If we do not comply with applicable laws and regulations, we could lose any licenses that we then hold for the conduct of our business and may be subject to civil fines and criminal penalties.
Changes to or repeal of the laws and regulations governing our operations related to permitted investments may cause us to alter our investment strategy in order to avail ourselves of new or different opportunities. Such changes could result in material differences to our strategies and plans and may shift our investment focus from the areas of expertise of our Advisor to other types of investments in which our Advisor may have little or no expertise or experience. Any such changes, if they occur, could have a material adverse effect on our results of operations and the value of your investment.
46
On May 24, 2018, the Economic Growth, Regulatory Relief, and Consumer Protection Act was signed into law, which increased from $50 billion to $250 billion the asset threshold for designation of "systemically important financial institutions" or "SIFIs" subject to enhanced prudential standards set by the Federal Reserve Board, staggering application of this change based on the size and risk of the covered bank holding company. On January 30, 2020, the Federal Reserve Board released proposed changes to the Volcker Rule that would loosen compliance requirements for all banks. The effect of these change and any further rules or regulations are and could be complex and far-reaching, and the change and any future laws or regulations or changes thereto could negatively impact our operations, cash flows or financial condition, impose additional costs on us, intensify the regulatory supervision of us or otherwise adversely affect our business, financial condition and results of operations.
Over the last several years, there also has been an increase in regulatory attention to the extension of credit outside of the traditional banking sector, raising the possibility that some portion of the non-bank financial sector will be subject to new regulation. While it cannot be known at this time whether any regulation will be implemented or what form it will take, increased regulation of non-bank credit extension could negatively impact our operations, cash flows or financial condition, impose additional costs on us, intensify the regulatory supervision of us or otherwise adversely affect our business, financial condition and results of operations.
Our Board may change our operating policies and strategies, including our investment objective, without prior notice or stockholder approval, the effects of which may adversely affect our business.
Our Board may modify or waive our current operating policies and strategies, including our investment objectives, without prior notice and without stockholder approval (provided that no such modification or waiver may change the nature of our business so as to cease to be, or withdraw our election as a BDC as provided by the 1940 Act without stockholder approval at a special meeting called upon written notice of not less than ten or more than sixty days before the date of such meeting). We cannot predict the effect any changes to our current operating policies and strategies would have on our business, results of operations or financial condition or on the value of our stock. However, the effects of any changes might adversely affect our business, any or all of which could negatively impact our ability to pay distributions or cause you to lose all or part of your investment in us.
Our quarterly and annual operating results may fluctuate due to the nature of our business.
We could experience fluctuations in our quarterly and annual operating results due to a number of factors, some of which are beyond our control, including: our ability to make investments in companies that meet our investment criteria, the interest rate payable on our debt investments, the default rate on these investments, the level of our expenses, variations in, and the timing of, the recognition of realized and unrealized gains or losses, the degree to which we encounter competition in our markets and general economic conditions. For example, we have historically experienced greater investment activity during the second and fourth quarters relative to other periods. As a result of these factors, you should not rely on the results for any prior period as being indicative of our performance in future periods.
Risks Related to our Securities
We borrow money, which magnifies the potential for gain or loss on amounts invested and may increase the risk of investing in us.
Leverage is generally considered a speculative investment technique, and we intend to continue to borrow money as part of our business plan. The use of leverage magnifies the potential for gain or loss on amounts invested and, therefore, increases the risks associated with investing in us. See “Item 7 — Management’s Discussion and Analysis of Financial Condition and Results of Operation — Liquidity and capital resources.” Lenders of senior debt securities have fixed dollar claims on our assets that are superior to the claims of our common stockholders. If the value of our assets increases, then leveraging would cause the NAV attributable to our common stock to increase more sharply than it would have had we not leveraged. However, any decrease in our income would cause net income to decline more sharply than it would have had we not leveraged. This decline could adversely affect our ability to make common stock distribution payments. In addition, because our investments may be illiquid, we may be unable to dispose of them or unable to do so at a favorable price in the event we need to do so, if we are unable to refinance any indebtedness upon maturity, and, as a result, we may suffer losses.
47
Our ability to service any debt that we incur depends largely on our financial performance and is subject to prevailing economic conditions and competitive pressures. Moreover, as our Advisor’s management fee is payable to our Advisor based on our gross assets less cash and cash equivalents, including those assets acquired through the use of leverage, our Advisor may have a financial incentive to incur leverage which may not be consistent with our stockholders’ interests. As leverage magnifies gains, if any, on our portfolio, as discussed above, our Pre-Incentive Fee Net Investment Income may exceed the quarterly hurdle rate for the incentive fee on income payable. Thus, if we incur additional leverage, the incentive fees payable to the Advisor may increase without any corresponding increase in our performance. Holders of our common stock bear the burden of any increase in our expenses, as a result of leverage, including any increase in the management fee or incentive fee payable to our Advisor.
In addition to the leverage described above, in the past, we have securitized a large portion of our debt investments to generate cash for funding new investments and may seek to securitize additional debt investments in the future to the extent permitted by the 1940 Act and the risk retention rules adopted pursuant to Section 941 of the Dodd-Frank Wall Street Reform and Consumer Protection Act, or the Dodd-Frank Act. To securitize additional debt investments in the future, we may create a wholly-owned subsidiary and sell and/or contribute a pool of debt investments to such subsidiary. This could include the sale of interests in the subsidiary on a non-recourse basis to purchasers, who we would expect to be willing to accept a lower interest rate to invest in investment grade loan pools. We would retain all or a portion of the equity in any such securitized pool of loans. An inability to securitize part of our debt investments in the future could limit our ability to grow our business, fully execute our business strategy and increase our earnings. Moreover, certain types of securitization transactions may expose us to greater risk of loss than would other types of financing.
On June 7, 2018, a “required majority” (as defined in Section 57(o) of the 1940 Act) of our Board approved the reduced asset coverage requirements and separately recommended that our stockholders approve the reduced asset coverage requirements at a special meeting of our stockholders. The Company held a special meeting on October 30, 2018 during which the reduced asset coverage requirements were approved by stockholders. The reduced asset coverage requirements took effect October 31, 2018.
Illustration: The following table illustrates the effect of leverage on returns from an investment in our common stock assuming that we employ leverage such that our asset coverage equals (1) our actual asset coverage as of December 31, 2020 and (2) 150% at various annual returns, net of expenses. The calculations in the table below are hypothetical and actual returns may be higher or lower than those appearing in the table below:
| | Assumed Return on Portfolio |
| ||||||||
| | (Net of Expenses) | | ||||||||
|
| -10% |
| -5% |
| 0% |
| 5% |
| 10% | |
Corresponding return to common stockholder assuming actual asset coverage as of December 31, 2020(1) |
| (23.36) | % | (13.80) | % | (4.25) | % | 5.31 | % | 14.86 | % |
Corresponding return to common stockholder assuming 150% asset coverage(2) |
| (39.91) | % | (24.77) | % | (9.63) | % | 5.52 | % | 20.66 | % |
| (1) | Assumes $407 million in total assets, $188 million in outstanding debt, $213 million in net assets, and an average cost of borrowed funds of 4.81% at December 31, 2020. |
| (2) | Assumes $645 million in total assets, $426 million in outstanding debt, $213 million in net assets, and an average cost of borrowed funds of 4.81% at December 31, 2020. |
Based on our outstanding indebtedness of $188 million as of December 31, 2020 and the average cost of borrowed funds of 4.81% as of that date, our investment portfolio would have needed to experience an annual return of at least 2.66% to cover annual interest payments on the outstanding debt. Actual interest payments may be different.
Based on an outstanding indebtedness of $426 million on an assumed 150% asset coverage ratio and an average cost of borrowed funds of 4.81%, our investment portfolio would need to experience an annual return of at least 3.55% to cover annual interest payments on the outstanding debt. Actual interest payments may be different.
48
If we are unable to comply with the covenants or restrictions in our Credit Facilities or make payments when due thereunder, our business could be materially adversely affected.
Our Credit Facilities are secured by a lien on the assets of our wholly owned subsidiaries, Credit II and HFI. The breach of certain of the covenants or restrictions or our failure to make payments when due under the Credit Facilities, unless cured within the applicable grace period, would result in a default under the Credit Facilities that would permit the lender thereunder to declare all amounts outstanding to be due and payable. In such an event, we may not have sufficient assets to repay such indebtedness and the lender may exercise rights available to them, including to the extent permitted under applicable law, the seizure of such assets without adjudication.
The Key Facility also requires Credit II, HFI and our Advisor to comply with various financial covenants, including maintenance by our Advisor of a minimum tangible net worth and limitations on the value of, and modifications to, the loan collateral that secures the Credit Facilities. Complying with these restrictions may prevent us from taking actions that we believe would help us to grow our business or are otherwise consistent with our investment objective. These restrictions could also limit our ability to plan for or react to market conditions, meet extraordinary capital needs or otherwise restrict corporate activities, and could result in our failing to qualify as a RIC resulting in our becoming subject to corporate-level income tax. See “Item 7 — Management’s Discussion and Analysis of Financial Condition and Results of Operations — Liquidity and capital resources” for additional information regarding our credit arrangements.
An event of default or acceleration under the Credit Facilities could also cause a cross-default or cross-acceleration of other debt instruments or contractual obligations, which would adversely impact our liquidity. We may not be granted waivers or amendments to the Credit Facilities, if for any reason we are unable to comply with the terms of the Credit Facilities and we may not be able to refinance the Credit Facilities on terms acceptable to us, or at all.
If we are unable to obtain additional debt financing, our business could be materially adversely affected.
We may want to obtain additional debt financing, or need to do so upon maturity of the Key Facility, NYL Facility, 2022 Notes or the Asset-Backed Notes, in order to obtain funds which may be made available for investments. We may borrow under the Key Facility until September 30, 2021. After such date, we must repay the outstanding advances under the Key Facility in accordance with its terms and conditions. All outstanding advances under the Key Facility are due and payable on April 6, 2023, unless such date is extended in accordance with the terms of the Key Facility. We may borrow under the NYL Facility until June 5, 2022. After such date, we must repay the outstanding advances under the NYL Facility in accordance with its terms and conditions. All outstanding advances under the NYL Facility are due and payable on June 15, 2027, unless such date is extended in accordance with the terms of the NYL Facility. All outstanding amounts on our 2022 Notes are due and payable on September 15, 2022 unless redeemed prior to that date. The Asset-Backed Notes have a stated maturity of September 15, 2027. If we are unable to increase, renew or replace the Credit Facilities or enter into other new debt financings on commercially reasonable terms, our liquidity may be reduced significantly. In addition, if we are unable to repay amounts outstanding under any such debt financings and are declared in default or are unable to renew or refinance these debt financings, we may not be able to make new investments or operate our business in the normal course. These situations may arise due to circumstances that we may be unable to control, such as lack of access to the credit markets, a severe decline in the value of the U.S. dollar, an economic downturn or an operational problem that affects third parties or us, and could materially damage our business.
We are subject to certain risks as a result of our interests in connection with the 2019-1 Securitization and our equity interest in the 2019-1 Trust.
On August 13, 2019, in connection with the 2019-1 Securitization and the offering of the Asset-Backed Notes by the 2019-1 Trust, we sold and/or contributed to Horizon Funding 2019-1, LLC or the Trust Depositor, certain loans, or the Trust Loans, which the Trust Depositor in turn sold and/or contributed to the 2019-1 Trust in exchange for 100% of the equity interest in the 2019-1 Trust, cash proceeds and other consideration. Following these transfers, the 2019-1 Trust, and not the Trust Depositor or us, holds all of the ownership interest in the Trust Loans.
As a result of the 2019-1 Securitization, we hold, indirectly through the Trust Depositor, 100% of the equity interest of the 2019-1 Trust. As a result, we consolidate the financial statements of the Trust Depositor and the 2019-1 Trust, as well as our other subsidiaries, in our consolidated financial statements. Because each of the Trust Depositor and the 2019-1
49
Trust is disregarded as an entity separate from its owner for U.S. federal income tax purposes, the sale or contribution by us to the Trust Depositor, and by the Trust Depositor to the 2019-1 Trust, did not constitute a taxable event for U.S. federal income tax purposes. If the U.S. Internal Revenue Service were to take a contrary position, there could be a material adverse effect on our business, financial condition, results of operations or cash flows. Further, a failure of the 2019-1 Trust to be treated as a disregarded entity for U.S. federal income tax purposes would constitute an event of default pursuant to the indenture under the 2019-1 Securitization, upon which the trustee under the 2019-1 Securitization, or the Trustee, may, and will at the direction of a supermajority of the holders of the Asset-Backed Notes (collectively, the “Noteholders”), declare the Asset-Backed Notes to be immediately due and payable and exercise remedies under the indenture, including (i) institute proceedings for the collection of all amounts then payable on the Asset-Backed Notes or under the indenture, enforce any judgment obtained, and collect from the 2019-1 Trust and any other obligor upon the Asset-Backed Notes monies adjudged due; (ii) institute proceedings from time to time for the complete or partial foreclosure of the indenture with respect to the property of the 2019-1 Trust; (iii) exercise any remedies as a secured party under the relevant provisions of the applicable jurisdiction’s UCC and take other appropriate action under applicable law to protect and enforce the rights and remedies of the Trustee and the Noteholders; or (iv) sell the property of the 2019-1 Trust or any portion thereof or rights or interest therein at one or more public or private sales called and conducted in any matter permitted by law. Any such exercise of remedies could have a material adverse effect on our business, financial condition, results of operations or cash flows.
An event of default in connection with the 2019-1 Securitization could give rise to a cross-default under our other material indebtedness.
The documents governing our other material indebtedness contain customary cross-default provisions that could be triggered if an event of default occurs in connection with the 2019-1 Securitization. An event of default with respect to our other indebtedness could lead to the acceleration of such indebtedness and the exercise of other remedies as provided in the documents governing such other indebtedness. This could have a material adverse effect on our business, financial condition, results of operations and cash flows and may result in our inability to make distributions sufficient to maintain our status as a RIC.
We may not receive cash distributions in respect of our indirect ownership interest in the 2019-1 Trust.
Apart from fees payable to us in connection with our role as servicer of the Trust Loans and the reimbursement of related amounts under the 2019-1 Securitization documents, we receive cash in connection with the 2019-1 Securitization only to the extent that the Trust Depositor receives payments in respect of its equity interest in the 2019-1 Trust. The holder of the equity interest in the 2019-1 Trust is the residual claimant on distributions, if any, made by the 2019-1 Trust after the Noteholders and other claimants have been paid in full on each payment date or upon maturity of the Asset-Backed Notes, subject to the priority of payment provisions under the 2019-1 Securitization documents. To the extent that the value of the 2019-1 Trust’s portfolio of Trust Loans is reduced as a result of conditions in the credit markets (relevant in the event of a liquidation event), other macroeconomic factors, distressed or defaulted Trust Loans or the failure of individual portfolio companies to otherwise meet their obligations in respect of the Trust Loans, or for any other reason, the ability of the 2019-1 Trust to make cash distributions in respect of the Trust Depositor’s equity interest would be negatively affected and, consequently, the value of the equity interest in the 2019-1 Trust would also be reduced. In the event that we fail to receive cash indirectly from the 2019-1 Trust, we could be unable to make distributions in amounts sufficient to maintain our status as a RIC or at all.
The interests of the Noteholders may not be aligned with our interests.
The Asset-Backed Notes are debt obligations ranking senior in right of payment to the rights of the holder of the equity interest in the 2019-1 Trust (currently the Trust Depositor, our wholly owned subsidiary), as residual claimant in respect of distributions, if any, made by the 2019-1 Trust. As such, there are circumstances in which the interests of the Noteholders may not be aligned with the interests of the holder of the equity interest in the 2019-1 Trust. For example, under the terms of the documents governing the 2019-1 Securitization, the Noteholders have the right to receive payments of principal and interest prior to the holder of the equity interest in the 2019-1 Trust.
For as long as the Asset-Backed Notes remain outstanding, the Noteholders have the right to act in certain circumstances with respect to the Trust Loans in ways that may benefit their interests but not the interests of holder of the
50
equity interest in the 2019-1 Trust, including by exercising remedies under the documents governing the 2019-1 Securitization.
If an event of default occurs, the Noteholders will be entitled to determine the remedies to be exercised, subject to the terms of the documents governing the 2019-1 Securitization. For example, upon the occurrence of an event of default with respect to the Asset-Backed Notes, the Trustee may, and will at the direction of the holders of a supermajority of the Asset-Backed Notes, declare the principal, together with any accrued interest, of the Asset-Backed Note to be immediately due and payable. This would have the effect of accelerating the principal on such Asset-Backed Note, triggering a repayment obligation on the part of the 2019-1 Trust. The Asset-Backed Notes then outstanding will be paid in full before any further payment or distribution is made to the holder of the equity interest in 2019-1 Trust. There can be no assurance that there will be sufficient funds through collections on the Trust Loans or through the proceeds of the sale of the Trust Loans in the event of a bankruptcy or insolvency to repay in full the obligations under the Asset-Backed Notes, or to make any distribution payment to holder of the equity interest in the 2019-1 Trust.
Remedies pursued by the Noteholders could be adverse to our interests as the indirect holder of the equity interest in the 2019-1 Trust. The Noteholders have no obligation to consider any possible adverse effect on such other interests. Thus, there can be no assurance that any remedies pursued by the Noteholders will be consistent with the best interests of the Trust Depositor or that we will receive, indirectly through the Trust Depositor, any payments or distributions upon an acceleration of the Asset-Backed Notes. Any failure of the 2019-1 Trust to make distributions in respect of the equity interest that we indirectly hold through the Trust Depositor, whether as a result of an event of default and the acceleration of payments on the Asset-Backed Notes or otherwise, could have a material adverse effect on our business, financial condition, results of operations and cash flows and may result in our inability to make distributions sufficient to maintain our status as a RIC.
Certain events related to the performance of Trust Loans could lead to the acceleration of principal payments on the Asset-Backed Notes.
The following constitute rapid amortization events, or Rapid Amortization Events, under the documents governing the 2019-1 Securitization: (i) the aggregate outstanding principal balance of all delinquent Trust Loans exceeds twenty percent (20%) of the aggregate outstanding principal balance of the Trust Loans; (ii) the aggregate outstanding principal balance of defaulted Trust Loans plus the aggregate outstanding principal balance of all liquidated Trust Loans exceeds fifteen percent (15%) of the aggregate outstanding principal balance of the Trust Loans; (iii) the aggregate outstanding principal balance of the Asset-Backed Notes exceeds the borrowing base (which is a percentage of the outstanding principal balance of the Trust Loans less delinquent Trust Loans and Trust Loans to issuers that exceed given thresholds) for a period of sixty consecutive days; (iv) the 2019-1 Trust’s pool of Trust Loans contains Trust Loans to nine or fewer obligors during the amortization period; (v) the occurrence of an event of default under the documents governing the 2019-1 Securitization; (vi) the downgrade of the rating of the Asset-Backed Notes by the rating agency to below “BB”; and the downgrade of the rating of the Asset-Backed Notes by the rating agency to below investment-grade and failure to cure such downgrade within 180 days of such downgrade. After a Rapid Amortization Event has occurred, subject to the priority of payment provisions under the documents governing the 2019-1 Securitization, principal collections on the Trust Loans will be used to make accelerated payments of principal on the Asset-Backed Notes until the payment of principal balance of the Asset-Backed Notes is reduced to zero. Such an event could delay, reduce or eliminate the ability of the 2019-1 Trust to make payments or distributions in respect of the equity interest that we indirectly hold, which could have a material adverse effect on our business, financial condition, results of operations and cash flows and may result in our inability to make distributions sufficient to maintain our status as a RIC.
We have certain repurchase obligations with respect to the Trust Loans transferred in connection with the 2019-1 Securitization.
As part of the 2019-1 Securitization, we entered into a sale and contribution agreement and a sale and servicing agreement under which we would be required to repurchase any Trust Loan (or participation interest therein) which was sold to the 2019-1 Trust in breach of certain customary representations and warranties made by us or by the Trust Depositor with respect to such Trust Loan or the legal structure of the 2019-1 Securitization. To the extent that there is such a breach of such representations and warranties and we fail to satisfy any such repurchase obligation, the Trustee may, on behalf of the 2019-1 Trust, bring an action against us to enforce these repurchase obligations.
51
There is a risk that investors in our equity securities may not receive distributions, that our distributions may not grow over time or that a portion of distributions paid to you may be a return of capital.
We intend to make distributions on a monthly basis to our stockholders out of assets legally available for distribution. We cannot assure you that we will achieve investment results that will allow us to make a specified level of cash distributions or year-to-year increases in cash distributions. Our ability to pay distributions might be adversely affected by the impact of one or more risk factors described in this report. In addition, due to the asset coverage test applicable to us as a BDC, we may be limited in our ability to make distributions. All distributions will be paid at the discretion of our Board and will depend on our earnings, our financial condition, maintenance of our ability to be subject to tax as a RIC, compliance with BDC regulation and such other factors as our Board may deem relevant from time to time. We cannot assure you that we will pay distributions to our stockholders in the future. Further, if we invest a greater amount of assets in equity securities that do not pay current dividends, the amount available for distribution could be reduced.
On an annual basis, we must determine the extent to which any distributions we made were paid out of current or accumulated earnings, recognized capital gains or capital. Distributions that represent a return of capital (which is the return of your original investment in us, after subtracting sales load, fees and expenses directly or indirectly paid by you) rather than a distribution from earnings or profits, reduce your basis in our stock for U.S. federal income tax purposes, which may result in higher tax liability when the shares are sold, even if they have not increased in value or have lost value.
Our common stock price may be volatile and may decrease substantially.
The trading price of our common stock may fluctuate substantially and the liquidity of our common stock may be limited, in each case depending on many factors, some of which are beyond our control and may not be directly related to our operating performance. These factors include the following:
| ● | actual or anticipated changes in our earnings or fluctuations in our operating results; |
| ● | changes in the value of our portfolio of investments; |
| ● | price and volume fluctuations in the overall stock market or in the market for BDCs from time to time; |
| ● | investor demand for our shares of common stock; |
| ● | significant volatility in the market price and trading volume of securities of registered closed-end management investment companies, BDCs or other financial services companies; |
| ● | our inability to raise capital, borrow money or deploy or invest our capital; |
| ● | fluctuations in interest rates; |
| ● | any shortfall in revenue or net income or any increase in losses from levels expected by investors or securities analysts; |
| ● | operating performance of companies comparable to us; |
| ● | changes in regulatory policies or tax guidelines with respect to RICs or BDCs; |
| ● | losing RIC status; |
| ● | general economic conditions, trends and other external factors; |
| ● | departures of key personnel; or |
| ● | loss of a major source of funding. |
52
We and our Advisor could be the target of litigation.
We or our Advisor could become the target of securities class action litigation or other similar claims if our stock price fluctuates significantly or for other reasons. The outcome of any such proceedings could materially adversely affect our business, financial condition and/or operating results and could continue without resolution for long periods of time. Any litigation or other similar claims could consume substantial amounts of our management’s time and attention, and that time and attention and the devotion of associated resources could, at times, be disproportionate to the amounts at stake. Litigation and other claims are subject to inherent uncertainties, and a material adverse impact on our financial statements could occur for the period in which the effect of an unfavorable final outcome in litigation or other similar claims becomes probable and reasonably estimable. In addition, we could incur expenses associated with defending ourselves against litigation and other similar claims, and these expenses could be material to our earnings in future periods.
Shares of closed-end investment companies, including BDCs, frequently trade at a discount to their NAV, which is separate and distinct from the risk that our NAV per share may decline.
We cannot predict the price at which our common stock will trade. Shares of closed-end investment companies, including BDCs, frequently trade at a discount to their NAV and our stock may also be discounted in the market. This characteristic of closed-end investment companies is separate and distinct from the risk that our NAV per share may decline. We cannot predict whether shares of our common stock will trade above, at or below our NAV. In addition, if our common stock trades below its NAV, we will generally not be able to issue additional shares of our common stock at its market price without first obtaining the approval of our stockholders and our independent directors.
Investing in shares of our common stock may involve an above average degree of risk.
The investments we make in accordance with our investment objective may result in a higher amount of risk, volatility or loss of principal than alternative investment options. Our investments in portfolio companies may be highly speculative and aggressive, and therefore, an investment in our common stock may not be suitable for investors with lower risk tolerance.
Anti-takeover provisions in our charter documents and other agreements and certain provisions of the Delaware General Corporation Law, or DGCL, could deter takeover attempts and have an adverse impact on the price of our common stock.
The DGCL, our certificate of incorporation and our bylaws contain provisions that may have the effect of discouraging a third party from making an acquisition proposal for us. Among other things, our certificate of incorporation and bylaws:
| ● | provide for a classified board of directors, which may delay the ability of our stockholders to change the membership of a majority of our Board; |
| ● | authorize the issuance of “blank check” preferred stock that could be issued by our Board to thwart a takeover attempt; |
| ● | do not provide for cumulative voting; |
| ● | provide that vacancies on the Board, including newly created directorships, may be filled only by a majority vote of directors then in office; |
| ● | limit the calling of special meetings of stockholders; |
| ● | provide that our directors may be removed only for cause; |
| ● | require supermajority voting to effect certain amendments to our certificate of incorporation and our bylaws; and |
| ● | require stockholders to provide advance notice of new business proposals and director nominations under specific procedures. |
53
These anti-takeover provisions may inhibit a change in control in circumstances that could give the holders of our common stock the opportunity to realize a premium over the market price of our common stock. It is a default under our Credit Facilities if (i) a person or group of persons (within the meaning of the Exchange Act) acquires beneficial ownership of 20% or more of our issued and outstanding common stock or (ii) during any twelve-month period, individuals who at the beginning of such period constituted our Board cease for any reason, other than death or disability, to constitute a majority of the directors in office. If either event were to occur, Key and/or the NYL Noteholders could accelerate our repayment obligations under, and/or terminate, the related Credit Facility.
If we elect to issue preferred stock, holders of any such preferred stock will have the right to elect members of our Board and have class voting rights on certain matters.
The 1940 Act requires that holders of shares of preferred stock must be entitled as a class to elect two directors at all times and to elect a majority of the directors if distributions on such preferred stock are in arrears by two years or more, until such arrearage is eliminated. In addition, certain matters under the 1940 Act require the separate vote of the holders of any issued and outstanding preferred stock, including changes in fundamental investment restrictions and conversion to open-end status and, accordingly, preferred stockholders could veto any such changes. Restrictions imposed on the declarations and payment of distributions to the holders of our common stock and preferred stock, both by the 1940 Act and by requirements imposed by rating agencies, might impair our ability to maintain our ability to be subject to tax as a RIC.
Your interest in us may be diluted if you do not fully exercise your subscription rights in any rights offering. In addition, if the subscription price is less than our NAV per share, then you will experience an immediate dilution of the aggregate NAV of your shares.
In the event we issue subscription rights, stockholders who do not fully exercise their rights should expect that they will, at the completion of a rights offering, own a smaller proportional interest in us than would otherwise be the case if they fully exercised their rights. Such dilution is not currently determinable because it is not known what proportion of the shares will be purchased as a result of such rights offering. Any such dilution will disproportionately affect nonexercising stockholders. If the subscription price per share is substantially less than the current NAV per share, this dilution could be substantial.
In addition, if the subscription price is less than our NAV per share, our stockholders would experience an immediate dilution of the aggregate NAV of their shares as a result of such rights offering. The amount of any decrease in NAV is not predictable because it is not known at this time what the subscription price and NAV per share will be on the expiration date of the rights offering or what proportion of the shares will be purchased as a result of such rights offering. Such dilution could be substantial.
Investors in offerings of our common stock may incur immediate dilution upon the closing of an offering.
If the public offering price for any offering of shares of our common stock is higher than the book value per share of our outstanding common stock, investors purchasing shares of common stock in any offering will pay a price per share that exceeds the tangible book value per share after such offering.
If we sell common stock at a discount to our NAV per share, stockholders who do not participate in such sale will experience immediate dilution in an amount that may be material.
The issuance or sale by us of shares of our common stock at a discount to NAV poses a risk of dilution to our current stockholders. In particular, stockholders who do not purchase additional shares at or below the discounted price in proportion to their current ownership will experience an immediate decrease in NAV per share (as well as in the aggregate NAV of their shares if they do not participate at all). These stockholders will also experience a disproportionately greater decrease in their participation in our earnings and assets and their voting power than the increase we experience in our assets, potential earning power and voting interests from such issuance or sale. In addition, such sales may adversely affect the price at which our common stock trades.
54
Stockholders experience dilution in their ownership percentage if they do not participate in our dividend reinvestment plan.
All distributions payable to stockholders that are participants in our dividend reinvestment plan, or DRIP, are automatically reinvested in shares of our common stock. As a result, stockholders that do not participate in the DRIP will experience dilution in their ownership interest over time.
Stockholders may receive shares of our common stock as dividends, which could result in adverse tax consequences to them.
In order to satisfy the Annual Distribution Requirement, we have the ability to declare a large portion of a dividend in shares of our common stock instead of in cash. As long as a portion of such dividend is paid in cash (which portion may be as low as 20% of such dividend) and certain requirements are met, the entire distribution will be treated as a dividend for U.S. federal income tax purposes. As a result, a stockholder generally would be subject to tax on 100% of the fair market value of the dividend on the date the dividend is received by the stockholder in the same manner as a cash dividend, even though most of the dividend was paid in shares of our common stock. We currently do not intend to pay dividends in shares of our common stock.
The trading market or market value of our publicly issued Debt Securities that we may issue may fluctuate.
Upon issuance, any publicly issued debt securities that we may issue will not have an established trading market. We cannot assure you that a trading market for our publicly issued Debt Securities will ever develop or, if developed, will be maintained. In addition to our creditworthiness, many factors may materially adversely affect the trading market for, and market value of, our publicly issued Debt Securities. These factors include:
| ● | the time remaining to the maturity of these Debt Securities; |
| ● | the outstanding principal amount of debt securities with terms identical to our Debt Securities; |
| ● | the supply of debt securities trading in the secondary market, if any; |
| ● | the redemption or repayment features, if any, of our Debt Securities; |
| ● | the level, direction and volatility of market interest rates generally; and |
| ● | market rate of interest higher or lower than the rate borne by our Debt Securities. |
You should also be aware that there may be a limited number of buyers when you decide to sell your debt securities. This too may materially adversely affect the market value of our Debt Securities or the trading market for our Debt Securities.
Terms relating to redemption may materially adversely affect your return on the debt securities that we may issue.
If we issue debt securities that are redeemable at our option, we may choose to redeem the debt securities at times when prevailing interest rates are lower than the interest rate paid on our Debt Securities. In addition, if such debt securities are subject to mandatory redemption, we may be required to redeem our Debt Securities at times when prevailing interest rates are lower than the interest rate paid on our Debt Securities. In this circumstance, you may not be able to reinvest the redemption proceeds in a comparable security at an effective interest rate as high as your debt securities being redeemed.
Credit ratings provided by third party credit rating agencies may not reflect all risks of an investment in Debt Securities that we may issue.
Credit ratings provided by third party credit rating agencies are an assessment by third parties of our ability to pay our obligations. Consequently, real or anticipated changes in our credit ratings will generally affect the market value of Debt Securities that we may issue. Credit ratings provided by third party credit rating agencies, however, may not reflect the potential impact of risks related to market conditions generally or other factors discussed above on the market value of or
55
trading market for any publicly issued debt securities that we may issue. Because we approved increasing the amount we are permitted to borrow under the 1940 Act, our credit rating may decline and we may incur additional costs in borrowing.
Sales in the public market of substantial amounts of our common stock may have an adverse effect on the market price of our common stock, and the registration of a substantial amount of insider shares, whether or not actually sold, may have a negative impact on the market price of our common stock.
Sales of substantial amounts of our common stock, or the availability of such common stock for sale, whether or not actually sold, could adversely affect the prevailing market price of our common stock. If this occurs and continues, it could impair our ability to raise additional capital through the sale of equity securities should we desire to do so.
Our Debt Securities are unsecured and therefore are effectively subordinated to any secured indebtedness we have currently incurred or may incur in the future.
Our Debt Securities are not secured by any of our assets or any of the assets of our subsidiaries. As a result, our Debt Securities are effectively subordinated to any secured indebtedness we or our subsidiaries have currently incurred and may incur in the future (or any indebtedness that is initially unsecured to which we subsequently grant security) to the extent of the value of the assets securing such indebtedness. In any liquidation, dissolution, bankruptcy or other similar proceeding, the holders of any of our existing or future secured indebtedness and the secured indebtedness of our subsidiaries may assert rights against the assets pledged to secure that indebtedness in order to receive full payment of their indebtedness before the assets may be used to pay other creditors, including the holders of our Debt Securities.
Our Debt Securities are structurally subordinated to the indebtedness and other liabilities of our subsidiaries.
Our Debt Securities are obligations exclusively of Horizon Technology Finance Corporation, and not of any of our subsidiaries. None of our subsidiaries is a guarantor of our Debt Securities and our Debt Securities are not required to be guaranteed by any subsidiaries we may acquire or create in the future. The assets of such subsidiaries are not directly available to satisfy the claims of our creditors, including holders of our Debt Securities.
Except to the extent we are a creditor with recognized claims against our subsidiaries, all claims of creditors (including trade creditors) and holders of preferred stock, if any, of our subsidiaries have priority over our equity interests in such subsidiaries (and therefore the claims of our creditors, including holders of our Debt Securities) with respect to the assets of such subsidiaries. Even if we are recognized as a creditor of one or more of our subsidiaries, our claims are effectively subordinated to any security interests in the assets of any such subsidiary and to any indebtedness or other liabilities of any such subsidiary senior to our claims. Consequently, our Debt Securities are structurally subordinated to all indebtedness and other liabilities (including trade payables) of any of our subsidiaries and any subsidiaries that we may in the future acquire or establish as financing vehicles or otherwise.
In addition, our subsidiaries may incur substantial additional indebtedness in the future, all of which would be structurally senior to our Debt Securities.
The indenture governing our Debt Securities contains limited protection for holders of our Debt Securities.
The indenture governing our Debt Securities offers limited protection to holders of our Debt Securities. The terms of the indenture do not restrict our or any of our subsidiaries’ ability to engage in, or otherwise be a party to, a variety of corporate transactions, circumstances or events that could have a material adverse impact on investments in our Debt Securities. In particular, the terms of the indenture do not place any restrictions on our or our subsidiaries’ ability to:
| ● | issue securities or otherwise incur additional indebtedness or other obligations, including (1) any indebtedness or other obligations that would be equal in right of payment to our Debt Securities, (2) any indebtedness or other obligations that would be secured and therefore rank effectively senior in right of payment to our Debt Securities to the extent of the values of the assets securing such debt, (3) indebtedness of ours that is guaranteed by one or more of our subsidiaries and which therefore is structurally senior to our Debt Securities and (4) securities, indebtedness or obligations issued or incurred by our subsidiaries that would be senior to our equity interests in our subsidiaries and therefore rank structurally senior to our Debt Securities with respect to the assets of our subsidiaries, in each case other than an incurrence of indebtedness |
56
| or other obligation that would cause a violation of Section 18(a)(1)(A) of the 1940 Act as modified by Section 61(a)(l) of the 1940 Act or any successor provisions, whether or not we continue to be subject to such provisions of the 1940 Act, (these provisions generally prohibit us from making additional borrowings, including through the issuance of additional debt or the sale of additional debt securities, unless our asset coverage, as defined in the 1940 Act, equals at least 150% after such borrowings); |
| ● | pay dividends on, or purchase or redeem or make any payments in respect of capital stock or other securities ranking junior in right of payment to our Debt Securities, including subordinated indebtedness, in each case other than dividends, purchases, redemptions or payments that would cause a violation of Section 18(a)(1)(B) of the 1940 Act as modified by Section 61(a)(l) of the 1940 Act or any successor provisions giving effect to any exemptive relief granted to us by the SEC (these provisions generally prohibit us from declaring any cash dividend or distribution upon any class of our capital stock, or purchasing any such capital stock unless our asset coverage, as defined in the 1940 Act, equals at least 150% at the time of the declaration of the dividend or distribution or the purchase and after deducting the amount of such dividend, distribution or purchase); |
| ● | sell assets (other than certain limited restrictions on our ability to consolidate, merge or sell all or substantially all of our assets); |
| ● | enter into transactions with affiliates; |
| ● | create liens (including liens on the shares of our subsidiaries) or enter into sale and leaseback transactions; |
| ● | make investments; or |
| ● | create restrictions on the payment of dividends or other amounts to us from our subsidiaries. |
In addition, the indenture does not require us to offer to purchase our Debt Securities in connection with a change of control or any other event.
Furthermore, the terms of the indenture do not protect holders of our Debt Securities in the event that we experience changes (including significant adverse changes) in our financial condition, results of operations or credit ratings, as they do not require that we or our subsidiaries adhere to any financial tests or ratios or specified levels of net worth, revenues, income, cash flow, or liquidity.
Our ability to recapitalize, incur additional debt and take a number of other actions that are not limited by the terms of our Debt Securities may have important consequences for holders of our Debt Securities, including making it more difficult for us to satisfy our obligations with respect to our Debt Securities or negatively affecting the trading value of our Debt Securities.
Certain of our current debt instruments include more protections for their holders than the indenture. In addition, other debt we issue or incur in the future could contain more protections for its holders than the indenture, including additional covenants and events of default. The issuance or incurrence of any such debt with incremental protections could affect the market for and trading levels and prices of our Debt Securities.
An active trading market for our Debt Securities may not exist, which could limit holders’ ability to sell our Debt Securities or affect the market price of our Debt Securities.
We cannot provide any assurances that an active trading market for our Debt Securities will exist in the future or that you will be able to sell our Debt Securities. Even if an active trading market does exist, our Debt Securities may trade at a discount from their initial offering price depending on prevailing interest rates, the market for similar securities, our credit ratings, if any, general economic conditions, our financial condition, performance and prospects and other factors. To the extent an active trading market does not exist, the liquidity and trading price for our Debt Securities may be harmed. Accordingly, you may be required to bear the financial risk of an investment in our Debt Securities for an indefinite period of time.
57
The optional redemption provision may materially adversely affect the return on our Debt Securities.
Our Debt Securities may provide that such securities are redeemable in whole or in part prior to their maturity date at our sole option. We may choose to redeem our Debt Securities at times when prevailing interest rates are lower than the interest rate paid on our Debt Securities. In this circumstance, the holders of our Debt Securities may not be able to reinvest the redemption proceeds in a comparable security at an effective interest rate as high as our Debt Securities being redeemed.
If we default on our obligations to pay our other indebtedness, we may not be able to make payments on our Debt Securities.
Any default under the agreements governing our indebtedness, including a default under the Credit Facilities or the 2019-1 Securitization, or other indebtedness to which we may be a party that is not waived by the required lenders or holders thereunder, and the remedies sought by the holders of such indebtedness could make us unable to pay principal, premium, if any, and interest on our Debt Securities and substantially decrease the market value of our Debt Securities. If we are unable to generate sufficient cash flow and are otherwise unable to obtain funds necessary to meet required payments of principal, premium, if any, and interest on our indebtedness, or if we otherwise fail to comply with the various covenants, including financial and operating covenants, in the instruments governing our indebtedness, we could be in default under the terms of the agreements governing such indebtedness. In the event of such default, the holders of such indebtedness could elect to declare all the funds borrowed thereunder to be due and payable, together with accrued and unpaid interest, the lenders under the Credit Facilities and the 2019-1 Securitization or other debt we may incur in the future could elect to terminate their commitments, cease making further loans and institute foreclosure proceedings against our assets, and we could be forced into bankruptcy or liquidation. If our operating performance declines, we may in the future need to seek to obtain waivers from the required lenders under the Credit Facilities and the 2019-1 Securitization or other debt that we may incur in the future to avoid being in default. If we breach our covenants under the Credit Facilities or the 2019-1 Securitization or other debt and seek a waiver, we may not be able to obtain a waiver from the required lenders or holders. If this occurs, we would be in default and our lenders or debt holders could exercise their rights as described above, and we could be forced into bankruptcy or liquidation. If we are unable to repay debt, lenders having secured obligations, including the lenders under the Credit Facilities and the 2019-1 Securitization, could proceed against the collateral securing the debt. Because the Credit Facilities and the 2019-1 Securitization have, and any future credit facilities will likely have, customary cross-default provisions, if the indebtedness thereunder or under any future credit facility is accelerated, we may be unable to repay or finance the amounts due.
FATCA withholding may apply to payments to certain foreign entities.
Payments made under our Debt Securities to a foreign financial institution, or “FFI,” or non-financial foreign entity, or “NFFE” (including such an institution or entity acting as an intermediary), may be subject to a U.S. withholding tax of 30% under U.S. Foreign Account Tax Compliance Act provisions of the Code (commonly referred to as “FATCA”). This withholding tax may apply to payments of interest on our Debt Securities, unless the FFI or NFFE complies with certain information reporting, withholding, identification, certification and related requirements imposed by FATCA. Depending upon the status of a holder and the status of an intermediary through which any Debt Securities are held, the holder could be subject to this 30% withholding tax in respect of any interest paid on our Debt Securities. Holders of our Debt Securities should consult their own tax advisors regarding FATCA and how it may affect their investment in our Debt Securities.
General Risk Factors
Political, social and economic uncertainty, including uncertainty related to the COVID-19 pandemic, creates and exacerbates risks.
Social, political, economic and other conditions and events will occur that create uncertainty and have significant impacts on issuers, industries, governments and other systems, including the financial markets, to which the Company and its investments are exposed. In addition, global economies and financial markets are increasingly interconnected, and political, economic and other conditions and events in one country, region, or financial market may adversely impact issuers in a different country, region or financial market. Furthermore, the occurrence of, among other events, natural or man-made disasters, severe weather or geological events, fires, floods, earthquakes, outbreaks of disease (such as COVID-19, avian influenza or H1N1/09), epidemics, pandemics, malicious acts, cyber-attacks, terrorist acts or the occurrence of
58
climate change, also adversely impact our performance from time to time. Such events may result in, and have resulted in, closing borders, securities exchange closures, health screenings, healthcare service delays, quarantines, cancellations, supply chain disruptions, lower consumer demand, market volatility and general uncertainty. Such events have adversely impacted, and may continue to adversely impact our portfolio companies and markets and economies over the short- and long-term, including in ways that cannot necessarily be foreseen. We have been, and may continue to be negatively impacted if the value of our portfolio company holdings were harmed by such political or economic conditions or events. Moreover, such negative political and economic conditions and events have disrupted, and could continue to disrupt the processes necessary for our operations. This has created, and may continue to create widespread business continuity issues for us and our portfolio companies and heightened cybersecurity, information security and operational risks as a result of, among other things, remote work arrangements.
For example, in December 2019, COVID-19 emerged in China and has since spread rapidly to other countries, including the United States. This outbreak has led, and for an unknown period of time will continue to lead, to disruptions in local, regional, national and global markets and economies affected thereby. The global impact of the outbreak is rapidly evolving, and many countries have reacted by instituting quarantines, prohibitions on travel and the closure of offices, businesses, schools, retail stores and other public venues. While several countries, as well as certain states in the United States, have liberalized public health restrictions as to further reopen their economies, recurring COVID-19 outbreaks have led to the re-introduction of such restrictions in certain states in the United States and globally and could continue to lead to the re-introduction of such restrictions elsewhere. Even after the COVID-19 pandemic subsides, the U.S. economy and most other major global economies may continue to experience a recession, and we anticipate our business and operations could be materially adversely affected by a prolonged recession in the U.S. and other major markets. With respect to the U.S. credit markets (in particular for middle market loans), this outbreak has resulted in, and until fully resolved is likely to continue to result in, the following, among other things: (i) government imposition and/or re-imposition of various forms of shelter-in-place orders and the closing of "non-essential" businesses, resulting in significant disruption to the businesses of many middle-market loan borrowers including supply chains, demand and practical aspects of their operations, as well as furloughs or lay-offs of employees (while such measures are hoped to be temporary, their impact may persist or become permanent); (ii) increased draws by borrowers on revolving lines of credit; (iii) increased requests by borrowers for amendments, forbearance agreements and waivers of provisions of their credit agreements in order to avoid default, increased defaults by such borrowers and/or increased difficulty in obtaining refinancing at the maturity dates of their loans; (iv) volatility and disruption of these markets including greater volatility in pricing and spreads and difficulty in valuing loans during periods of increased volatility, and liquidity issues; and (v) rapidly evolving proposals and/or actions by state and federal governments to address problems in functioning of the markets and by businesses and the economy in general which will not necessarily adequately address the problems facing the loan market and middle market businesses. The COVID-19 outbreak is having, and any future outbreaks could have, an adverse impact on the markets and the economy in general, which could have a material adverse impact on, among other things, the ability of lenders to originate loans, the volume and type of loans originated, and the volume and type of amendments and waivers granted to borrowers and remedial actions taken in the event of a borrower default, each of which could negatively impact the amount and quality of loans available for investment by us and returns to us, among other things. As of the date of this annual report on Form 10-K, it is impossible to determine the scope of this outbreak, or any future outbreaks, how long any such outbreak, market disruption or uncertainties may last, the effect any governmental actions will have or the full potential impact on us and our portfolio companies. Further, even after the pandemic subsides, the U.S. economy, as well as most other major global economies may continue to experience a recession, and we anticipate our business could be materially and adversely affected by a prolonged recession in the U.S. and other major markets.
Although it is impossible to predict the precise nature and consequences of these events, or of any political or policy decisions and regulatory changes occasioned by emerging events or uncertainty on applicable laws or regulations that impact us, our portfolio companies and our investments, it is clear that these types of events are impacting and will, for at least some time, continue to impact us and our portfolio companies. In many instances, the impact will be adverse and profound. For example, middle market companies in which we may invest are being significantly impacted by these emerging events and the uncertainty caused by these events. The effects of a public health emergency may materially and adversely impact (i) the value and performance of us and our portfolio companies, (ii) the ability of our borrowers to continue to meet loan covenants or repay loans provided by us on a timely basis or at all, which may require us to restructure our investments or write down the value of our investments, (iii) our ability to comply with the covenants and other terms of our debt obligations and to repay such obligations, on a timely basis or at all, (iv) our ability to comply with certain regulatory requirements, such as asset coverage requirements under the Investment Company Act, (v) our ability
59
to maintain our distributions at their current level or to pay them at all or (vi) our ability to source, manage and divest investments and achieve our investment objectives, all of which could result in significant losses to us. We will also be negatively affected if the operations and effectiveness of any of our portfolio companies (or any of the key personnel or service providers of the foregoing) is compromised or if necessary or beneficial systems and processes are disrupted.
Disruptions in the capital markets caused by the COVID-19 pandemic have increased the spread between the yields realized on risk-free and higher risk securities, resulting in illiquidity in parts of the capital markets. These and future market disruptions and/or illiquidity can be expected to have an adverse effect on our business, financial condition, results of operations and cash flows. Unfavorable economic conditions also would be expected to increase our funding costs, limit our access to the capital markets or result in a decision by lenders not to extend credit to us. These events have limited and could continue to limit our investment originations, limit our ability to grow and have a material negative impact on our and our portfolio companies’ operating results and the fair values of our debt and equity investments.
We operate in a highly competitive market for investment opportunities, and if we are not able to compete effectively, our business, results of operations and financial condition may be adversely affected and the value of your investment in us could decline.
We compete for investments with a number of investment funds and other BDCs, as well as traditional financial services companies such as commercial banks and other financing sources. Some of our competitors are larger and have greater financial, technical, marketing and other resources than we have. For example, some competitors may have a lower cost of funds and access to funding sources that are not available to us. This may enable these competitors to make commercial loans with interest rates that are comparable to, or lower than, the rates we typically offer. We may lose prospective portfolio companies if we do not match our competitors’ pricing, terms and structure. If we do match our competitors’ pricing, terms or structure, we may experience decreased net interest income and increased risk of credit losses. In addition, some of our competitors may have higher risk tolerances or different risk assessments, which could allow them to consider a wider variety of investments, establish more relationships than us and build their market shares. Furthermore, many of our competitors are not subject to the regulatory restrictions that the 1940 Act imposes on us as a BDC or that the Code imposes on us as a RIC. If we are not able to compete effectively, we may not be able to identify and take advantage of attractive investment opportunities that we identify and may not be able to fully invest our available capital. If this occurs, our business, financial condition and results of operations could be materially adversely affected.
The capital markets are currently in a period of disruption and economic uncertainty. Such market conditions have materially and adversely affected debt and equity capital markets, which have had, and may continue to have, a negative impact on our business and operations.
The U.S. capital markets have experienced extreme disruption following the global outbreak of COVID-19. Such disruptions have been evidenced by volatility in global stock markets as a result of, among other things, uncertainty regarding the COVID-19 pandemic and the fluctuating price of commodities such as oil. Despite actions of the U.S. federal government and foreign governments, these events have contributed to worsening general economic conditions that are materially and adversely impacting broader financial and credit markets and reducing the availability of debt and equity capital for the market as a whole. These conditions could continue for a prolonged period of time or worsen in the future.
Significant changes or volatility in the capital markets have negatively affected, and may continue to negatively affect, the valuations of our investments. While most of our investments are not publicly traded, applicable accounting standards require us to assume as part of our valuation process that our investments are sold in a principal market to market participants (even if we plan to hold an investment to maturity). Our valuations, and particularly valuations of private investments and private companies, are inherently uncertain, fluctuate over short periods of time and are often based on estimates, comparisons and qualitative evaluations of private information that may not reflect the full impact of the COVID-19 pandemic and measures taken in response thereto. Any public health emergency, including the COVID-19 pandemic or an outbreak of other existing or new epidemic diseases, or the threat thereof, and the resulting financial and economic market uncertainty could have a significant adverse impact on us and the fair value of our investments and our portfolio companies.
Significant changes in the capital markets, such as the disruption in economic activity caused by the COVID-19 pandemic, have limited and could continue to limit our investment originations, limit our ability to grow and have a
60
material negative impact on our and our portfolio companies’ operating results and the fair values of our debt and equity investments. Additionally, the recent disruption in economic activity caused by the COVID-19 pandemic has had, and may continue to have, a negative effect on the potential for liquidity events involving our investments. The illiquidity of our investments may make it difficult for us to sell such investments to access capital, if required. As a result, we could realize significantly less than the value at which we have recorded our investments if we were required to sell them to increase our liquidity. An inability on our part to raise incremental capital, and any required sale of all or a portion of our investments as a result, could have a material adverse effect on our business, financial condition or results of operations.
Further, current market conditions may make it difficult to raise equity capital, extend the maturity of or refinance our existing indebtedness or obtain new indebtedness with similar terms and any failure to do so could have a material adverse effect on our business. The debt capital available to us in the future, if available at all, may bear a higher interest rate and may be available only on terms and conditions less favorable than those of our existing debt and such debt may need to be incurred in a rising interest rate environment. If we are unable to raise new debt or refinance our existing debt, then our equity investors will not benefit from the potential for increased returns on equity resulting from leverage, and we may be unable to make new commitments or to fund existing commitments to our portfolio companies. Any inability to extend the maturity of or refinance our existing debt, or to obtain new debt, could have a material adverse effect on our business, financial condition or results of operations.
Terrorist attacks, acts of war, natural disasters, disease outbreaks or pandemics may impact our portfolio companies and harm our business, operating results and financial condition.
Terrorist acts, acts of war, natural disasters, disease outbreaks, pandemics, or other similar events may disrupt our operations, as well as the operations of our portfolio companies. Such acts have created, and continue to create, economic and political uncertainties and have contributed to recent global economic instability. Future terrorist activities, military or security operations, natural disasters, disease outbreaks, pandemics, or other similar events could further weaken the domestic/global economies and create additional uncertainties, which may negatively impact our portfolio companies and, in turn, could have a material adverse impact on our business, operating results, and financial condition. Losses from terrorist attacks and natural disasters are generally uninsurable.
We incur significant costs as a result of being a publicly traded company.
As a publicly traded company, we incur legal, accounting and other expenses, including costs associated with the periodic reporting requirements applicable to a company whose securities are registered under the Exchange Act as well as additional corporate governance requirements, including requirements under the Sarbanes-Oxley Act, and other rules implemented by the SEC.
Compliance with Section 404 of the Sarbanes-Oxley Act involves significant expenditures, and non-compliance with Section 404 of the Sarbanes-Oxley Act would adversely affect us and the market price of our common stock.
Under current SEC rules, we are required to report on our internal control over financial reporting pursuant to Section 404 of the Sarbanes-Oxley Act and related rules and regulations of the SEC. As a result, we incur additional expenses that negatively impact our financial performance and our ability to make distributions. This process also results in a diversion of management’s time and attention. We cannot be certain as to the timing of completion of our annual re-evaluation, testing and remediation actions or the impact of the same on our operations, and we cannot assure you that our internal control over financial reporting is or will be effective. In the event that we are unable to maintain compliance with Section 404 of the Sarbanes-Oxley Act and related rules, we and the market price of our securities may be adversely affected.
We are highly dependent on information systems and systems failures could significantly disrupt our business, which may, in turn, negatively affect the market price of our common stock and our ability to pay distributions.
Our business is highly dependent on the Advisor and its affiliates’ communications and information systems. Any failure or interruption of those systems, including as a result of the termination of an agreement with any third-party service providers, could cause delays or other problems in our activities. Our financial, accounting, data processing, backup or other operating systems and facilities may fail to operate properly or become disabled or damaged as a result of a number
61
of factors including events that are wholly or partially beyond our control and adversely affect our business. There could be:
| ● | sudden electrical or telecommunications outages; |
| ● | natural disasters such as earthquakes, floods, tornadoes and hurricanes; |
| ● | disease pandemics; and |
| ● | events arising from local or larger scale political or social matters, including terrorist acts. |
Any of these events, could have a material adverse effect on our operating results and negatively affect the market price of our common stock and our ability to pay distributions to our stockholders.
In addition, these communications and information systems are subject to potential attacks, including through adverse events that threaten the confidentiality, integrity or availability of our information resources (i.e., cyber incidents). These attacks could involve gaining unauthorized access to our information systems for purposes of misappropriating assets, stealing confidential information, corrupting data or causing operational disruption and result in disrupted operations, misstated or unreliable financial data, liability for stolen assets or information, increased cybersecurity protection and insurance costs, litigation and damage to our business relationships, any of which could have a material adverse effect on our business, financial condition and results of operations. As our reliance on technology has increased, so have the risks posed to our information systems, both internal and those provided by the Advisor and third-party service providers. We, along with our Advisor, have implemented processes, procedures and internal controls to help mitigate cybersecurity risks and cyber intrusions, but these measures, as well as our increased awareness of the nature and extent of the risk of a cyber incident, may be ineffective and do not guarantee that a cyber incident will not occur or that our financial results, operations or confidential information will not be negatively impacted by such an incident. In addition, the costs related to cyber or other security threats or disruptions may not be fully insured or indemnified by other means. Furthermore, cybersecurity has become a top priority for regulators around the world, and some jurisdictions have enacted laws requiring companies to notify individuals of data security breaches involving certain types of personal data. If we fail to comply with the relevant laws and regulations, we could suffer financial losses, a disruption of our businesses, liability to investors, regulatory intervention or reputational damage.
We are subject to risks associated with a rising interest rate environment that may affect our cost of capital and net investment income.
While interest rates remain relatively low, due to several factors, including longer-term inflationary pressure that may result from the U.S. government’s fiscal policies, the end of the Federal Reserve quantitative easing program and recent increases in the Federal Funds rate, we expect to experience rising interest rates, rather than falling rates in the future.
Because we currently incur indebtedness to fund our investments, a portion of our income depends upon the difference between the interest rate at which we borrow funds and the interest rate at which we invest these funds.To the extent our investments have fixed interest rates or have interest rate floors that are higher than the floor on, or interest rates that “reset” less frequently than, the Credit Facilities, increases in interest rates can lead to interest rate compression and have a material adverse effect on our net investment income. In addition to increasing the cost of borrowed funds, which may materially reduce our net investment income, rising interest rates may also adversely affect our ability to obtain additional debt financing on terms as favorable as under our current debt financings, or at all. See “—If we are unable to obtain additional debt financing, our business could be materially adversely affected.”
In a rising interest rate environment, there is a risk that the portfolio companies in which we hold floating rate securities will be unable to pay escalating interest amounts, which could result in a default under their loan documents with us. Rising interests rates could also cause portfolio companies to shift cash from other productive uses to the payment of interest, which may have a material adverse effect on their business and operations and could, over time, lead to increased defaults on our investments in such portfolio companies. In addition, increasing payment obligations under floating rate loans may cause borrowers to refinance or otherwise repay our loans earlier than they otherwise would, requiring us to incur management time and expense to re-deploy such proceeds, including on terms that may not be as favorable as our
62
existing loans. In addition, rising interest rates may increase pressure on us to provide fixed rate loans to our portfolio companies, which could adversely affect our net investment income, as increases in our cost of borrowed funds would not be accompanied by increased interest income from such fixed-rate investments.
We may hedge against interest rate fluctuations by using hedging instruments such as caps, swaps, futures, options and forward contracts, subject to applicable legal requirements, including all necessary registrations (or exemptions from registration) with the Commodity Futures Trading Commission. See Item 7A. Quantitative and Qualitative Disclosures About Market Risk. These activities may limit our ability to benefit from lower interest rates with respect to the hedged portfolio. Adverse developments resulting from changes in interest rates or hedging transactions or any adverse developments from our use of hedging instruments could have a material adverse effect on our business, financial condition and results of operations. In addition, we may be unable to enter into appropriate hedging transactions when desired and any hedging transactions we enter into may not be effective.
As a rise in the general level of interest rates can be expected to lead to higher interest rates applicable to our debt investments, an increase in interest rates would make it easier for us to meet or exceed the hurdle rate applicable to the incentive fee and may result in a substantial increase in the amount of incentive fees payable to the Advisor with respect to Pre-Incentive Fee Net Investment Income.
Also, an increase in interest rates on investments available to investors could make investment in our common stock less attractive if we are not able to increase our distributions, which could materially reduce the value of our common stock.
The U.K. Financial Conduct Authority (the “FCA”), which regulates LIBOR, has announced that it intends not to compel panel banks to contribute to LIBOR after 2021. The E.U. Benchmarks Regulation imposed conditions under which only compliant benchmarks may be used in new contracts after 2021. To identify a successor rate for U.S. dollar LIBOR, the Alternative Reference Rates Committee (“ARRC”), a U.S.-based group convened by the Federal Reserve and the Federal Reserve Bank of New York, was formed. The ARRC has identified the Secured Overnight Financing Rate (“SOFR”) as its preferred alternative rate for LIBOR. SOFR is a measure of the cost of borrowing cash overnight, collateralized by the U.S. Treasury securities, and is based on directly observable U.S. Treasury-backed repurchase transactions. In addition, on March 25, 2020, the FCA reaffirmed the central assumption that firms cannot rely on LIBOR being published after the end of 2021. However, the outbreak of COVID-19 may adversely impact the timing of many firms’ transition planning, and we continue to assess the potential impact of the COVID-19 outbreak on our transition plans. Although SOFR appears to be the preferred replacement rate for U.S. dollar LIBOR, at this time, it is not possible to predict the effect of any such changes, any establishment of alternative reference rates, whether the COVID-19 outbreak will have further effect on LIBOR transition timelines or plans, or other reforms to LIBOR that may be enacted in the United States, United Kingdom or elsewhere. Furthermore, on November 30, 2020, Intercontinental Exchange, Inc. (“ICE”) announced that the ICE Benchmark Administration Limited (“IBA”), a wholly-owned subsidiary of ICE and the administrator of LIBOR, will consider extending the LIBOR transition deadline to June 30, 2023. The announcement was supported by the FCA and the Federal Reserve. Despite the announcement, regulators continue to emphasize the importance of LIBOR transition planning.
The expected discontinuation of LIBOR could have a significant impact on our business. The dollar amount of our outstanding debt investments and borrowings that are linked to LIBOR with maturity dates after the anticipated discontinuation date of 2023 is material. We anticipate significant operational challenges for the transition away from LIBOR including, but not limited to, amending existing loan agreements with borrowers on investments that may have not been modified with fallback language and adding effective fallback language to new agreements in the event that LIBOR is discontinued before maturity. Beyond these challenges, we anticipate there may be additional risks to our current processes and information systems that will need to be identified and evaluated by us. Due to the uncertainty of the replacement for LIBOR, the potential effect of any such event on our cost of capital and net investment income cannot yet be determined. In addition, any further changes or reforms to the determination or supervision of LIBOR may result in a sudden or prolonged increase or decrease in reported LIBOR, which could have an adverse impact on the market value for or value of any LIBOR-linked securities, loans, and other financial obligations or extensions of credit held by or due to us and could have a material adverse effect on our business, financial condition and results of operations.
63
Because many of our investments are not and typically will not be in publicly traded securities, the value of our investments may not be readily determinable, which could adversely affect the determination of our NAV.
Our investments consist, and we expect our future investments to consist, primarily of debt investments or securities issued by privately held companies. As these investments are not publicly traded, their fair value may not be readily determinable. In addition, we are not permitted to maintain a general reserve for anticipated debt investment losses. Instead, we are required by the 1940 Act to specifically value each investment and record an unrealized gain or loss for any asset that we believe has increased or decreased in value. We value these investments on a quarterly basis, or more frequently as circumstances require, in accordance with our valuation policy and consistent with GAAP. Our Board employs independent third-party valuation firms to assist it in arriving at the fair value of our investments. Our Board discusses valuations and determines the fair value in good faith based on the input of our Advisor and the third-party valuation firms. The factors that may be considered in fair value pricing our investments include the nature and realizable value of any collateral, the portfolio company’s earnings and its ability to make payments on its indebtedness, the markets in which the portfolio company does business, comparisons to publicly traded companies, discounted cash flow and other relevant factors. Because such valuations are inherently uncertain and may be based on estimates, our determinations of fair value may differ materially from the values that would be assessed if a ready market for these securities existed. Our NAV could be adversely affected if our determinations regarding the fair value of our investments are materially higher than the values that we ultimately realize upon the disposal of these investments.
Changes to U.S. tariff and import/export regulations may have a negative effect on our portfolio companies and, in turn, harm us.
There has been ongoing discussion and commentary regarding potential significant changes to U.S. trade policies, treaties and tariffs. The current U.S. presidential administration, along with the U.S. Congress, has created significant uncertainty about the future relationship between the United States and other countries with respect to trade policies, treaties and tariffs. These developments, or the perception that any of them could occur, may have a material adverse effect on global economic conditions and the stability of global financial markets, and may significantly reduce global trade and, in particular, trade between the impacted nations and the United States. Any of these factors could depress economic activity and restrict our portfolio companies’ access to suppliers or customers and have a material adverse effect on their business, financial condition and results of operations, which in turn would negatively impact us.
Item 1B. Unresolved Staff Comments
None
We do not own any real estate or other physical properties materially important to our operation. Our headquarters and our Advisor’s headquarters are currently located at 312 Farmington Avenue, Farmington, Connecticut 06032. We believe that our office facilities are suitable and adequate to our business.
Neither we nor our Advisor is currently subject to any material legal proceedings.
Item 4. Mine Safety Disclosures
Not applicable
64
Item 5. Market for Registrant’s Common Equity, Related Stockholder Matters and Issuer Purchases of Equity Securities
Common stock
Our common stock is traded on Nasdaq, under the symbol “HRZN.” The last reported price for our common stock on March 1, 2021 was $14.85 per share, which represented a 35% premium to NAV per share. As of March 1, 2021 we had 18 stockholders of record, which did not include stockholders for whom shares are held in nominee or “street” name.
Shares of BDCs may trade at a market price that is less than the NAV that is attributable to those shares. The possibility that our shares of common stock will trade at a discount from NAV or at a premium that is unsustainable over the long term is separate and distinct from the risk that our NAV will decrease. It is not possible to predict whether our shares will trade at, above or below NAV in the future.
Sales of unregistered securities
We did not engage in any sales of unregistered equity securities during the years ended December 31, 2020, 2019 and 2018.
Issuer Purchases of Equity Securities
On April 24, 2020, our Board extended a previously authorized stock repurchase plan which allows us to repurchase up to $5.0 million of our outstanding common stock. Unless extended by our Board, the repurchase program will expire on the earlier of June 30, 2021 and the repurchase of $5.0 million of common stock. During the quarter ended December 31, 2020, we did not repurchase any shares of our common stock. During the years ended December 31, 2020, 2019 and 2018, we did not repurchase any shares of our common stock. From the inception of the stock repurchase program through December 31, 2020, we repurchased 167,465 shares of our common stock at an average price of $11.22 on the open market at a total cost of $1.9 million.
Any shares repurchased by us may have the effect of maintaining the market price of our common stock or retarding a decline in the market price of the common stock, and, as a result, the price of our common stock may be higher than the price that otherwise might exist in the open market. In addition, as any shares repurchased pursuant to the stock repurchase plan will be purchased at a price below the NAV per share as reported in our most recent financial statements, share repurchases may have the effect of increasing our NAV per share.
Distributions
We intend to continue making monthly distributions to our stockholders. The timing and amount of our monthly distributions, if any, is determined by our Board. Any distributions to our stockholders are declared out of assets legally available for distribution. We monitor available net investment income to determine if a tax return of capital may occur for the fiscal year. To the extent our taxable earnings fall below the total amount of our distributions for any given fiscal year, a portion of those distributions may be considered a return of capital to our common stockholders for U.S. federal income tax purposes. Thus, the source of distribution to our stockholders may be the original capital invested by the stockholder rather than our income or gains. Stockholders should read any written disclosure accompanying a distribution payment carefully and should not assume that the source of any distribution is our ordinary income or gains.
In order to qualify to be subject to tax as a RIC, we must meet certain source-of-income, asset diversification and annual distribution requirements. Generally, in order to qualify as a RIC, we must derive at least 90% of our gross income during each tax year from dividends, interest, payments with respect to certain securities, loans, gains from the sale or other disposition of stock, securities or foreign currencies, or other income derived with respect to our business of investing in stock or other securities. We must also meet certain asset diversification requirements at the end of each quarter of each tax year. Failure to meet these diversification requirements on the last day of a quarter may result in us having to dispose of certain investments quickly in order to prevent the loss of RIC status. Any such dispositions could be made at disadvantageous prices or times, and may cause us to incur substantial losses.
65
In addition, in order to be eligible for the special tax treatment accorded to RICs and to avoid the imposition of corporate level tax on the income and gains we distribute to our stockholders, each tax year we are required under the Code to distribute as dividends of an amount generally at least 90% of our investment company taxable income, determined without regard to any deduction for dividends paid to our stockholders. We refer to such amount as the Annual Distribution Requirement in this annual report on Form 10-K. Additionally, we must distribute, in respect of each calendar year, dividends of an amount generally at least equal to the sum of 98% of our calendar year net ordinary income (taking into account certain deferrals and elections); 98.2% of our capital gain net income (adjusted for certain ordinary losses) for the one year period ending on October 31 of such calendar year; and any net ordinary income or capital gain net income for preceding years that was not distributed during such years and on which we previously did not incur any U.S. federal income tax in order to avoid the imposition of a 4% U.S. federal excise tax. If we fail to qualify as a RIC for any reason and become subject to corporate income tax, the resulting corporate income taxes could substantially reduce our net assets, the amount of income available for distribution and the amount of our distributions. Such a failure would have a material adverse effect on us and our stockholders. In addition, we could be required to recognize unrealized gains, incur substantial taxes and interest and make substantial distributions in order to re-qualify as a RIC. We cannot assure stockholders that they will receive any distributions.
Depending on the level of taxable income earned in a tax year, we may choose to carry forward taxable income in excess of current year distributions into the next tax year and pay a 4% U.S. federal excise tax on such undistributed income. Distributions of any such carryover taxable income must be made through a distribution declared as of the earlier of the filing date of the corporate income tax return related to the tax year in which such taxable income was generated or the 15th day of the ninth month following the end of such tax year, in order to count towards the satisfaction of the Annual Distribution Requirement for the tax year in which such taxable income was generated. We can offer no assurance that we will achieve results that will permit the payment of any cash distributions and, if we issue senior securities, we may be prohibited from making distributions if doing so causes us to fail to maintain the asset coverage stipulated by the 1940 Act or if distributions are limited by the terms of any of our borrowings. See “Item 1. Business — Regulation — Taxation as a RIC.”
We have adopted an “opt out” DRIP for our common stockholders. As a result, if we make a distribution, then stockholders’ cash distributions are automatically reinvested in additional shares of our common stock, unless they specifically opt out of the DRIP. If a stockholder opts out, that stockholder receives cash distributions. Although distributions paid in the form of additional shares of common stock are generally subject to U.S. federal, state and local taxes, stockholders participating in our DRIP do not receive any corresponding cash distributions with which to pay any such applicable taxes. We may use newly issued shares to implement the DRIP, or we may purchase shares in the open market in connection with our obligations under the DRIP.
66
Stock performance graph
The following graph compares the return on our common stock with that of the Standard & Poor’s 500 Stock Index and the Wells Fargo BDC Index, for the period from December 31, 2015 through December 31, 2020. The graph assumes that, on December 31, 2015, a person invested $100 in each of our common stock, the S&P 500 Index and the Wells Fargo BDC Index. The graph measures total stockholder return, which takes into account both changes in stock price and distributions. It assumes that distributions paid are invested in like securities. The graph and other information furnished under this Part II Item 5 of our annual report on Form 10-K shall not be deemed to be “soliciting material” or to be “filed” with the SEC or subject to Regulation 14A or 14C, or to the liabilities of Section 18 of the Exchange Act. The stock price performance included in this graph is not necessarily indicative of future stock price performance.
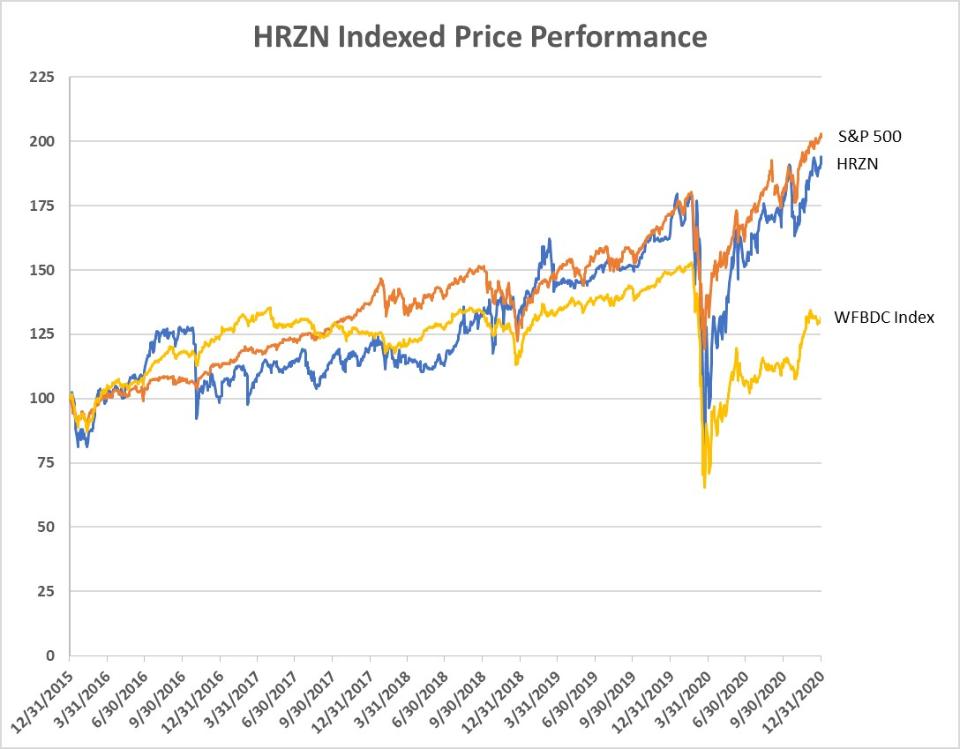
Item 6. Selected Financial Data
The following selected consolidated financial data of the Company as of December 31, 2020, 2019, 2018, 2017 and 2016, and for the years ended December 31, 2020, 2019, 2018, 2017 and 2016 are derived from the consolidated financial statements that have been audited by RSM US LLP, an independent registered public accounting firm. These selected financial data should be read in conjunction with our financial statements and related notes thereto and “Management’s Discussion and Analysis of Financial Condition and Results of Operations.”
67
| | As of and for the years ended December 31, |
| |||||||||||||
(Dollars in thousands, except per share data and portfolio company counts) |
| 2020 |
| 2019 |
| 2018 |
| 2017 |
| 2016 | | |||||
Statement of Operations Data: |
| |
|
| |
|
| |
|
| |
|
| |
| |
Total investment income | | $ | 46,035 | | $ | 43,125 | | $ | 31,090 | | $ | 25,777 | | $ | 32,984 | |
Base management fee | |
| 6,458 | |
| 5,556 | |
| 4,578 | |
| 3,786 | |
| 4,727 | |
Performance based incentive fee | |
| 5,187 | |
| 6,966 | |
| 4,393 | |
| 1,714 | |
| 2,126 | |
All other expenses | |
| 13,419 | |
| 11,742 | |
| 9,403 | |
| 8,034 | |
| 9,119 | |
Base management and performance based incentive fees waived | |
| — | |
| (1,848) | |
| (1,184) | |
| (79) | |
| — | |
Net investment income before excise tax | |
| 20,971 | |
| 20,709 | |
| 13,900 | |
| 12,322 | |
| 17,012 | |
Provision (credit) for excise tax | |
| 222 | |
| 239 | |
| 34 | |
| 25 | |
| (87) | |
Net investment income | |
| 20,749 | |
| 20,470 | |
| 13,866 | |
| 12,297 | |
| 17,099 | |
Net realized (loss) gain on investments | |
| (14,698) | |
| (4,173) | |
| 645 | |
| (21,191) | |
| (7,776) | |
Net unrealized appreciation (depreciation) on investments | |
| 313 | |
| 3,201 | |
| (1,501) | |
| 18,485 | |
| (14,236) | |
Net increase (decrease) in net assets resulting from operations | | $ | 6,364 | | $ | 19,498 | | $ | 13,010 | | $ | 9,591 | | $ | (4,913) | |
Dollar amount of distributions declared | | $ | 22,674 | | $ | 16,987 | | $ | 13,837 | | $ | 13,823 | | $ | 15,403 | |
Per Share Data: | |
|
| |
|
| |
|
| |
|
| |
|
| |
Net asset value | | $ | 11.02 | | $ | 11.83 | | $ | 11.64 | | $ | 11.72 | | $ | 12.09 | |
Net investment income | |
| 1.18 | |
| 1.52 | |
| 1.20 | |
| 1.07 | |
| 1.48 | |
Net realized (loss) gain on investments | |
| (0.84) | |
| (0.31) | |
| 0.06 | |
| (1.84) | |
| (0.67) | |
Net change in unrealized appreciation (depreciation) on investments | |
| 0.02 | |
| 0.24 | |
| (0.13) | |
| 1.60 | |
| (1.24) | |
Net increase (decrease) in net assets resulting from operations | |
| 0.36 | |
| 1.45 | |
| 1.13 | |
| 0.83 | |
| (0.43) | |
Per share distributions declared | |
| 1.25 | |
| 1.20 | |
| 1.20 | |
| 1.20 | |
| 1.335 | |
Statement of Assets and Liabilities Data: | |
|
| |
|
| |
|
| |
|
| |
|
| |
Investments, at fair value | | $ | 352,545 | | $ | 319,551 | | $ | 248,441 | | $ | 222,099 | | $ | 194,003 | |
Other assets | |
| 54,612 | |
| 24,450 | |
| 18,308 | |
| 12,047 | |
| 45,249 | |
Total assets | |
| 407,157 | |
| 344,001 | |
| 266,749 | |
| 234,146 | |
| 239,252 | |
Borrowings | |
| 185,819 | |
| 152,050 | |
| 126,853 | |
| 94,075 | |
| 95,597 | |
Total liabilities | |
| 194,560 | |
| 159,946 | |
| 132,492 | |
| 99,071 | |
| 100,060 | |
Total net assets | | $ | 212,597 | | $ | 184,055 | | $ | 134,257 | | $ | 135,075 | | $ | 139,192 | |
Other data: | |
|
| |
|
| |
|
| |
|
| |
|
| |
Weighted yield on debt investments at fair value | |
| 14.6 | % |
| 16.7 | % |
| 15.3 | % |
| 15.1 | % |
| 14.9 | % |
Weighted yield on all investments at fair value | |
| 13.9 | % |
| 15.7 | % |
| 13.9 | % |
| 14.0 | % |
| 14.4 | % |
Number of portfolio companies at period end: | |
|
| |
|
| |
|
| |
|
| |
|
| |
Debt investments | |
| 34 | |
| 35 | |
| 34 | |
| 33 | |
| 44 | |
Warrants investments | |
| 60 | |
| 66 | |
| 67 | |
| 72 | |
| 78 | |
Equity investments | |
| 8 | |
| 9 | |
| 9 | |
| 6 | |
| 5 | |
Other investments | |
| 2 | |
| 1 | |
| 4 | |
| 4 | |
| 2 | |
68
Item 7. Management’s Discussion and Analysis of Financial Condition and Results of Operations
The information contained in this section should be read in conjunction with our consolidated financial statements and related notes thereto appearing elsewhere in this annual report on Form 10-K.
COVID-19
Governments around the world remain highly focused on mitigating the risk of further spread of COVID-19 and continue to manage their response to the crisis, which has included measures such as quarantines, travel restrictions and business curtailments. COVID-19 has created economic and financial disruptions that have adversely affected, and are likely to continue to adversely affect, our business, financial condition, liquidity and our portfolio companies’ results of operations and by extension our operating results. The extent to which the COVID-19 pandemic will continue to affect our business, financial condition, liquidity, our portfolio companies’ results of operations and by extension our operating results will depend on future developments, which are highly uncertain and cannot be predicteds as of the filing of this Form 10-K.
Forward-looking statements
This annual report on Form 10-K, including the Management’s Discussion and Analysis of Financial Condition and Results of Operations, contains statements that constitute forward-looking statements, which relate to future events or our future performance or financial condition. These forward-looking statements are not historical facts, but rather are based on current expectations, estimates and projections about our industry, our beliefs and our assumptions. The forward-looking statements contained in this annual report on Form 10-K involve risks and uncertainties, including statements as to:
| ● | our future operating results, including the performance of our existing debt investments, warrants and other investments; |
| ● | the introduction, withdrawal, success and timing of business initiatives and strategies; |
| ● | general economic and political trends and other external factors, including the current COVID-19 pandemic; |
| ● | the relative and absolute investment performance and operations of our Advisor; |
| ● | the impact of increased competition; |
| ● | the impact of investments we intend to make and future acquisitions and divestitures; |
| ● | the unfavorable resolution of legal proceedings; |
| ● | our business prospects and the prospects of our portfolio companies, including our and their ability to achieve our respective objectives as a result of the current COVID-19 pandemic; |
| ● | the impact, extent and timing of technological changes and the adequacy of intellectual property protection; |
| ● | our regulatory structure and tax status; |
| ● | our ability to qualify and maintain qualification as a RIC and as a BDC; |
| ● | the adequacy of our cash resources and working capital; |
| ● | the timing of cash flows, if any, from the operations of our portfolio companies; |
| ● | the impact of interest rate volatility on our results, particularly if we use leverage as part of our investment strategy; |
69
| ● | the ability of our portfolio companies to achieve their objective; |
| ● | the impact of legislative and regulatory actions and reforms and regulatory supervisory or enforcement actions of government agencies relating to us or our Advisor; |
| ● | our contractual arrangements and relationships with third parties; |
| ● | our ability to access capital and any future financings by us; |
| ● | the ability of our Advisor to attract and retain highly talented professionals; |
| ● | the impact of changes to tax legislation and, generally, our tax position; and |
| ● | our ability to fund unfunded commitments. |
We use words such as “anticipates,” “believes,” “expects,” “intends,” “seeks” and similar expressions to identify forward-looking statements. Undue influence should not be placed on the forward looking statements as our actual results could differ materially from those projected in the forward-looking statements for any reason, including the factors in “Item 1A – Risk Factors” and elsewhere in our annual report on Form 10-K.
We have based the forward-looking statements included in this report on information available to us on the date of this report, and we assume no obligation to update any such forward-looking statements. Although we undertake no obligation to revise or update any forward-looking statements in this annual report on Form 10-K, whether as a result of new information, future events or otherwise, you are advised to consult any additional disclosures that we may make directly to you or through reports that we in the future may file with the SEC, including periodic reports on Form 10-Q and current reports on Form 8-K.
You should understand that under Sections 27A(b)(2)(B) and (D) of the Securities Act and Sections 21E(b)(2)(B) and (D) of the Exchange Act, the “safe harbor” provisions of the Private Securities Litigation Reform Act of 1995 do not apply to statements made in connection with this annual report on Form 10-K or any quarterly reports we file under the Exchange Act.
Overview
We are a specialty finance company that lends to and invests in development-stage companies in our Target Industries. Our investment objective is to maximize our investment portfolio’s total return by generating current income from the debt investments we make and capital appreciation from the warrants we receive when making such debt investments. We are focused on making Venture Loans to venture capital and private equity backed companies and publicly traded companies in our Target Industries, which we refer to as “Venture Lending.” Our debt investments are typically secured by first liens or first liens behind a secured revolving line of credit, or Senior Term Loans. As of December 31, 2020, 100%, or $333.5 million, of our debt investment portfolio at fair value consisted of Senior Term Loans. Venture Lending is typically characterized by (1) the making of a secured debt investment after a venture capital or equity investment in the portfolio company has been made, which investment provides a source of cash to fund the portfolio company’s debt service obligations under the Venture Loan, (2) the senior priority of the Venture Loan which requires repayment of the Venture Loan prior to the equity investors realizing a return on their capital, (3) the relatively rapid amortization of the Venture Loan and (4) the lender’s receipt of warrants or other success fees with the making of the Venture Loan.
We are an externally managed, closed-end, non-diversified management investment company that has elected to be regulated as a BDC under the 1940 Act. In addition, for U.S. federal income tax purposes, we have elected to be treated as a RIC under Subchapter M of the Code. As a BDC, we are required to comply with regulatory requirements, including limitations on our use of debt. We are permitted to, and expect to, finance our investments through borrowings. Section 61(a) of the 1940 Act added to Section 61(a)(2) of the 1940 Act enables BDCs to reduce their asset coverage requirements from 200% to 150% as a result of the enactment of the SBCAA. This provision permits a BDC to double the maximum amount of leverage that it is permitted to incur. As defined in the 1940 Act, asset coverage of 150% means that for every $100 of net assets a BDC holds, it may raise up to $200 from borrowing and issuing senior securities. We received approval
70
from our stockholders to reduce our asset coverage requirement from 200% to 150% on October 30, 2018. The amount of leverage that we may employ will depend on our assessment of market conditions and other factors at the time of any proposed borrowing. As a RIC, we generally are not subject to corporate-level income taxes on our investment company taxable income, determined without regard to any deductions for dividends paid, and our net capital gain that we distribute as dividends for U.S. federal income tax purposes to our stockholders as long as we meet certain source-of-income, distribution, asset diversification and other requirements.
Compass Horizon, our predecessor company, commenced operations in March 2008. We were formed in March 2010 for the purpose of acquiring Compass Horizon and continuing its business as a public entity.
Our investment activities, and our day-to-day operations, are managed by our Advisor and supervised by our Board, of which a majority of the members are independent of us. Under the Investment Management Agreement, we have agreed to pay our Advisor a base management fee and an incentive fee for its advisory services to us. We have also entered into the Administration Agreement with our Advisor under which we have agreed to reimburse our Advisor for our allocable portion of overhead and other expenses incurred by our Advisor in performing its obligations under the Administration Agreement.
Portfolio composition and investment activity
The following table shows our portfolio by type of investment as of December 31, 2020 and 2019:
| | December 31, 2020 | | December 31, 2019 |
| ||||||||||
| | | | | | Percentage of | | | | | | Percentage of |
| ||
| | Number of | | Fair | | Total | | Number of | | Fair | | Total |
| ||
|
| Investments |
| Value |
| Portfolio |
| Investments |
| Value |
| Portfolio |
| ||
| | (Dollars in thousands) |
| ||||||||||||
Debt investments | | 34 | | $ | 333,495 | | 94.6 | % | 35 | | $ | 288,355 | | 90.2 | % |
Warrants |
| 60 | |
| 14,031 |
| 4.0 |
| 66 | |
| 10,829 |
| 3.4 | |
Other investments |
| 2 | |
| 1,700 |
| 0.5 |
| 1 | |
| 500 |
| 0.2 | |
Equity |
| 8 | |
| 3,319 |
| 0.9 |
| 9 | |
| 3,217 |
| 1.0 | |
Equity interest in HSLFI |
| — | |
| — |
| — |
| 1 | |
| 16,650 |
| 5.2 | |
Total | | | | $ | 352,545 |
| 100.0 | % | | | $ | 319,551 |
| 100.0 | % |
71
The following table shows total portfolio investment activity as of and for the years ended December 31, 2020 and 2019:
| | For the year ended | ||||
| | December 31, | ||||
|
| 2020 |
| 2019 | ||
| | | | | | |
Beginning portfolio | | $ | 319,551 | | $ | 248,441 |
New debt investments | |
| 198,561 | |
| 200,832 |
Less refinanced debt investments | |
| — | |
| (17,500) |
Net new debt investments | |
| 198,561 | |
| 183,332 |
Investment in controlled affiliate investment | | | — | | | 1,900 |
Principal payments received on investments | |
| (24,829) | |
| (17,369) |
Early pay-offs | |
| (121,429) | |
| (94,321) |
Accretion of debt investment fees | |
| 3,895 | |
| 3,865 |
New debt investment fees | |
| (2,353) | |
| (2,669) |
New equity | | | — | | | 240 |
Warrants received in settlement of fee income | | | 978 | | | — |
Proceeds from sale of investments | |
| (8,335) | |
| (4,548) |
Dividend income from controlled affiliate investment | |
| 118 | |
| 2,236 |
Distributions from controlled affiliate investment | |
| — | |
| (715) |
Net realized loss on investments | |
| (13,727) | |
| (4,192) |
Net unrealized appreciation on investments | |
| 313 | |
| 3,201 |
Other | |
| (198) | |
| 150 |
Ending portfolio | | $ | 352,545 | | $ | 319,551 |
We receive payments on our debt investments based on scheduled amortization of the outstanding balances. In addition, we receive repayments of some of our debt investments prior to their scheduled maturity date. The frequency or volume of these repayments may fluctuate significantly from period to period.
72
The following table shows our debt investments by industry sector as of December 31, 2020 and 2019:
| | December 31, 2020 | | December 31, 2019 |
| ||||||
| | Debt | | Percentage of | | Debt | | Percentage of |
| ||
| | Investments at | | Total | | Investments at | | Total |
| ||
|
| Fair Value |
| Portfolio |
| Fair Value |
| Portfolio |
| ||
| | (Dollars in thousands) |
| ||||||||
Life Science | | | | | | | | | | | |
Biotechnology | | $ | 44,121 |
| 13.2 | % | $ | 41,789 |
| 14.5 | % |
Drug Delivery | |
| — |
| — | |
| 1,533 |
| 0.6 | |
Medical Device | |
| 107,726 |
| 32.3 | |
| 59,477 |
| 20.6 | |
Technology | |
| |
| | |
| |
| | |
Communications | |
| — |
| — | |
| 1,500 |
| 0.5 | |
Consumer-Related | |
| 59,022 |
| 17.7 | |
| 42,779 |
| 14.8 | |
Data Storage | |
| 22,953 |
| 7.0 | |
| 24,452 |
| 8.5 | |
Internet and Media | |
| 7,089 |
| 2.1 | |
| 22,504 |
| 7.8 | |
Materials | |
| 1,737 |
| 0.5 | |
| 8,410 |
| 2.9 | |
Networking | | | 9,738 | | 2.9 | | | — | | — | |
Power Management | |
| — |
| — | |
| 11,207 |
| 3.9 | |
Software | |
| 56,535 |
| 17.0 | |
| 51,069 |
| 17.7 | |
Healthcare Information and Services | |
| |
| | |
|
|
|
| |
Diagnostics | | | 9,760 | | 2.9 | | | — | | — | |
Other Healthcare | |
| 14,814 |
| 4.4 | |
| 9,771 |
| 3.4 | |
Software | |
| — |
| — | |
| 13,864 |
| 4.8 | |
Total | | $ | 333,495 |
| 100.0 | % | $ | 288,355 |
| 100.0 | % |
The largest debt investments in our portfolio may vary from year to year as new debt investments are originated and existing debt investments are repaid. Our five largest debt investments represented 28% of total debt investments outstanding as of December 31, 2020 and 2019. No single debt investment represented more than 10% of our total debt investments as of December 31, 2020 or 2019.
Debt investment asset quality
We use an internal credit rating system which rates each debt investment on a scale of 4 to 1, with 4 being the highest credit quality rating and 3 being the rating for a standard level of risk. A rating of 2 represents an increased level of risk and, while no loss is currently anticipated for a 2-rated debt investment, there is potential for future loss of principal. A rating of 1 represents a deteriorating credit quality and a high degree of risk of loss of principal. Our internal credit rating system is not a national credit rating system. See “Item 1 – Business” for a more detailed description of the internal credit rating system. As of December 31, 2020 and 2019, our debt investments had a weighted average credit rating of 3.2 and 3.1, respectively. The following table shows the classification of our debt investment portfolio by credit rating as of December 31, 2020 and 2019:
| | December 31, 2020 | | December 31, 2019 |
| ||||||||||
| | | | Debt | | Percentage | | | | Debt | | Percentage |
| ||
| | Number of | | Investments at | | of Debt | | Number of | | Investments at | | of Debt |
| ||
|
| Investments |
| Fair Value |
| Investments |
| Investments |
| Fair Value |
| Investments |
| ||
|
| (Dollars in thousands) | | ||||||||||||
Credit Rating | | | | | | | | | | | | | | | |
4 |
| 6 | | $ | 77,950 |
| 23.4 | % | 4 | | $ | 45,339 |
| 15.7 | % |
3 |
| 24 | |
| 240,933 |
| 72.2 |
| 26 | |
| 216,128 |
| 75.0 | |
2 |
| 3 | |
| 12,875 |
| 3.9 |
| 3 | |
| 24,888 |
| 8.6 | |
1 |
| 1 | |
| 1,737 |
| 0.5 |
| 2 | |
| 2,000 |
| 0.7 | |
Total |
| 34 | | $ | 333,495 |
| 100.0 | % | 35 | | $ | 288,355 |
| 100.0 | % |
73
As of December 31, 2020, there was one debt investment with an internal credit rating of 1, with an aggregate cost of $6.8 million and an aggregate fair value of $1.7 million. As of December 31, 2019, there were two debt investments with an internal credit rating of 1, with an aggregate cost of $5.7 million and an aggregate fair value of $2.0 million.
Horizon Secured Loan Fund I LLC
On June 1, 2018, we and Arena Sunset SPV, LLC, or Arena, formed a joint venture, Horizon Secured Loan Fund I, or HSLFI, to make investments, either directly or indirectly through subsidiaries, primarily in the form of secured loans to development-stage companies in the technology, life science, healthcare information and services and sustainability industries. HSLFI was formed as a Delaware limited liability company and was not consolidated by either us or Arena for financial reporting purposes. On April 21, 2020, we purchased all of the limited liability company interests of Arena in HSLFI, including, without limitation, undistributed amounts owed to Arena and interest accrued and unpaid on the debt investments of HSLFI through the date of purchase, for $17.1 million. In addition, Arena received 50% of the warrants held by HSLFI or Horizon Funding I, LLC, or HFI, at closing. As of April 21, 2020, HSLFI is wholly-owned by us and the assets and liabilities of HSLFI and HFI is consolidated with the assets and liabilities by us.
Investments held by HSLFI were measured at fair value. As of December 31, 2019, HSLFI had total assets of $48.3 million. HSLFI’s portfolio consisted of debt investments in eight portfolio companies as of December 31, 2019. As of December 31, 2019, the largest investment in a single portfolio company in the HSLFI’s portfolio in aggregate principal amount was $11.3 million and the five largest investments in portfolio companies in the HSLFI totaled $30.3 million. As of December 31, 2019, HSLFI had no investments on non-accrual status. HSLFI invested in portfolio companies in the same industries in which we may directly invest.
We invested cash or securities in portfolio companies in HSLFI in exchange for limited liability company equity interests in HSLFI. As of December 31, 2019, we and Arena each owned 50.0% of the equity interests of HSLFI. We had an original commitment to fund $25.0 million of equity interests in HSLFI. As of December 31, 2019, $9.8 million was unfunded. Our investment in HSLFI consisted of an equity contribution of $15.2 million as of December 31, 2019. During the period January 1, 2020 through April 21, 2020, there were no distributions from HSLFI. For the year ended December 31, 2019, HSLFI distributed $1.4 million.
In addition, on June 1, 2018, HSLFI entered into the Sale and Servicing Agreement. HFI entered into the NYL Facility with several entities owned or affiliated with the NYL Noteholders for an aggregate purchase price of up to $100.0 million, with an accordion feature of up to $200.0 million at the mutual discretion and agreement of HSLFI and the NYL Noteholders. The notes issued by HFI were collateralized by all investments held by HFI and permitted an advance rate of up to 67% of the aggregate principal amount of eligible debt investments. The notes were issued pursuant to the Indenture. Prior to June 5, 2020, the interest rate on the notes issued under the NYL Facility was based on the three year USD mid-market swap rate plus a margin of between 2.75% and 3.25% depending on the rating of such notes at the time of issuance. There were $15.0 million in advances made by the NYL Noteholders as of December 31, 2019 at an interest rate of 4.98%.
74
The following table shows a summary of HSLFI’s investment portfolio for the period January 1, 2020 through April 21, 2020, for the year ended December 31, 2019 and for the period June 1, 2018 through December 31, 2018:
| | For the period |
| | | | | For the period | | |||
| | January 1, 2020 | | | For the year | | | June 1, 2018 | | |||
| | through |
| | ended | | | through | | |||
|
| April 21, 2020 |
| | December 31, 2019 |
| | December 31, 2018 |
| |||
| | (Dollars in thousands) | | |||||||||
Total investments at fair value | | $ | — | | | $ | 34,829 | | | $ | 24,734 | |
Dollar-weighted annualized yield on average debt investments(1) | |
| 14.3 | % | |
| 15.8 | % | |
| 12.9 | % |
Number of portfolio companies in HSLFI | |
| — | | |
| 10 | | |
| 4 | |
Largest portfolio company investment at fair value | | $ | — | | | $ | 11,186 | | | $ | 8,154 | |
| (1) | HSLFI calculates the yield on dollar-weighted average debt investments for any period measured as (1) total investment income during the period divided by (2) the average of the fair value of debt investments outstanding on (a) the last day of the calendar month immediately preceding the first day of the period and (b) the last day of each calendar month during the period. The yield on dollar-weighted average debt investments represents the portfolio yield and does not reflect HSLFI’s expenses. |
The following table shows HSLFI’s total portfolio investment activity as of and for the year ended December 31, 2019:
| | For the year ended | | |
| | December 31, | | |
|
| 2019 |
| |
| | (In thousands) | | |
Beginning portfolio | | $ | 24,734 | |
New debt investments | |
| 19,727 | |
Early pay-offs | |
| (9,727) | |
Accretion of debt investment fees | |
| 311 | |
New debt investment fees | |
| (188) | |
Net unrealized depreciation on investments | |
| (28) | |
Ending portfolio | | $ | 34,829 | |
The following table shows HSLFI’s investments as of December 31, 2019:
|
| |
| |
| Principal |
| Cost of |
| Fair | |||
Portfolio Company (1) | | Sector | | Type of Investment (2)(3)(4) | | Amount | | Investments(5) | | Value | |||
(Dollars in thousands) | |||||||||||||
Debt Investments — Life science | | | | | | | | | | | | | |
Celsion Corporation (6)(7)(8) |
| Biotechnology |
| Term Loan (9.63% cash (Libor + 7.63%; Floor 9.63%), 4.00% ETP, Due 7/1/22) | | $ | 2,500 | | $ | 2,464 | | $ | 2,464 |
|
| |
| Term Loan (9.63% cash (Libor + 7.63%; Floor 9.63%), 4.00% ETP, Due 7/1/22) | | | 2,500 | | | 2,464 | | | 2,464 |
Encore Dermatology, Inc. (6)(7) |
| Biotechnology |
| Term Loan (10.00% cash (Libor + 7.50%; Floor 10.00%), 3.00% ETP, Due 4/1/23) | |
| 5,000 | |
| 4,929 | |
| 4,929 |
Mustang Bio, Inc. (6)(7)(8) |
| Biotechnology |
| Term Loan (9.00% cash (Libor + 6.50%; Floor 9.00%), 5.00% ETP, Due 10/1/22) | |
| 5,000 | |
| 4,924 | |
| 4,924 |
Total Debt Investments — Life science |
| |
| | |
|
| |
| 14,781 | |
| 14,781 |
Debt Investments — Technology |
|
|
|
| |
|
| |
|
| |
|
|
Bridge2 Solutions, LLC (6)(7) |
| Software |
| Term Loan (11.00% cash (Libor + 8.4%; Floor 11.00%), 2.00% ETP, Due 9/1/23) | |
| 500 | |
| 481 | | | 481 |
New Signature US, Inc. (6)(7)(9) |
| Software |
| Term Loan (10.50% cash (Libor + 8.50%; Floor 10.50%), 3.50% ETP, Due 7/1/22) | |
| 8,250 | |
| 8,163 | | | 8,163 |
|
| |
| Term Loan (10.50% cash (Libor + 8.50%; Floor 10.50%), 3.50% ETP, Due 2/1/23) | |
| 3,000 | |
| 2,961 | |
| 2,961 |
OutboundEngine, Inc. (6)(7) |
| Software |
| Term Loan (11.15% cash (Libor + 8.40%; Floor 11.15%), 3.00% ETP, Due 7/1/23) | |
| 500 | |
| 491 | | | 491 |
Revinate, Inc. (6)(7) |
| Software |
| Term Loan (9.50% cash (Libor + 7.00%; Floor 9.50%), 3.00% ETP, Due 6/1/23) | |
| 4,000 | |
| 3,952 | |
| 3,952 |
Total Debt Investments — Technology |
| |
| | |
|
| |
| 16,048 | |
| 16,048 |
Debt Investments — Healthcare information and services |
|
| |
|
| |
|
| |
|
| ||
75
HealthEdge Software, Inc. (6)(7) |
| Software |
| Term Loan (9.94% cash (Libor + 8.25%; Floor 9.25%), 3.00% ETP, Due 10/1/23) | |
| 3,750 | |
| 3,709 | |
| 3,709 |
Total Debt Investments — Healthcare information and services |
| | |
|
| |
| 3,709 | |
| 3,709 | ||
Total Debt Investments |
| |
| | |
|
| |
| 34,538 | |
| 34,538 |
| | | | | | | | | | | | | |
Warrant Investments — Life science |
|
|
|
| |
|
| |
|
| |
|
|
Celsion Corporation (6)(7)(8) |
| Biotechnology |
| 95,057 Common Stock Warrants | | | | |
| 58 | |
| 6 |
Encore Dermatology, Inc. (6)(7) |
| Biotechnology |
| 503,626 Preferred Stock Warrants | | | | |
| 38 | |
| — |
Mustang Bio, Inc. (6)(7)(8) |
| Biotechnology |
| 72,046 Common Stock Warrants | | | | |
| 45 | |
| 74 |
CSA Medical, Inc. (6)(7) |
| Medical Device |
| 17,751 Preferred Stock Warrants | | | | |
| 2 | |
| 2 |
Total Warrant Investments — Life science |
| |
| | | | | |
| 143 | |
| 82 |
Warrant Investments — Technology |
|
|
|
| | | | |
|
| |
|
|
Intelepeer Holdings, Inc. (6)(7) |
| Communications |
| 2,081,934 Preferred Stock Warrants | | | | |
| 82 | |
| 72 |
Bridge2 Solutions, LLC (6)(7) | | Software | | 2,500 Common Stock Warrants | | | | | | 18 | | | 34 |
BSI Platform Holdings, LLC (6)(7)(9) |
| Software |
| 562,500 Preferred Stock Warrants | | | | |
| 77 | |
| 62 |
OutboundEngine, Inc. (6)(7) | | Software | | 40,000 Preferred Stock Warrants | | | | | | 5 | | | 6 |
Revinate Inc. (6)(7) |
| Software |
| 216,362 Preferred Stock Warrants | | | | |
| 16 | |
| 18 |
Total Warrant Investments — Technology |
| |
| | | | | |
| 198 | |
| 192 |
Warrant Investments — Healthcare information and services |
|
| | | | |
|
| |
|
| ||
HealthEdge Software, Inc. (6)(7) |
| Software |
| 47,418 Preferred Stock Warrants | | | | |
| 16 | |
| 17 |
Total Warrant Investments — Healthcare information and services |
| | |
|
| |
| 16 | |
| 17 | ||
Total Warrant Investments |
| |
| | |
|
| |
| 357 | |
| 291 |
| | | | | | | | | | | | | |
Total Portfolio Investment Assets |
| |
| | |
|
| | $ | 34,895 | | $ | 34,829 |
| | | | | | | | | | | | | |
Short Term Investments — Unrestricted Investments |
| | |
|
| |
|
| |
|
| ||
US Bank Money Market Deposit Account (6) |
| | |
|
| | $ | 11,201 | | $ | 11,201 | ||
Total Short Term Investments — Unrestricted Investments |
| | |
|
| | $ | 11,201 | | $ | 11,201 | ||
| | | | | | | | | | | | | |
Short Term Investments — Restricted Money Market Funds |
| | |
|
| |
|
| |
|
| ||
US Bank Money Market Deposit Account (6) |
| | |
|
| | $ | 138 | | $ | 138 | ||
Total Short Term Investments — Restricted Money Market Funds |
| | |
|
| | $ | 138 | | $ | 138 | ||
| (1) | All investments of HSLFI are in entities which are organized under the laws of the United States and have a principal place of business in the United States. |
| (2) | All interest is payable in cash due monthly in arrears, unless otherwise indicated, and applies only to HSLFI’s debt investments. Interest rate is the annual interest rate on the debt investment and does not include end-of-term payments, or ETPs, and any additional fees related to the investments, such as deferred interest, commitment fees or prepayment fees. Debt investments are at variable rates for the term of the debt investment, unless otherwise indicated. All debt investments based on the London InterBank Offered Rate, or LIBOR, are based on one-month LIBOR. For each debt investment, the current interest rate in effect as of December 31, 2019 is provided. |
| (3) | ETPs are contractual fixed-interest payments due in cash at the maturity date of the applicable debt investment, including upon any prepayment, and are a fixed percentage of the original principal balance of the debt investments unless otherwise noted. Interest will accrue during the life of the debt investment on each ETP and will be recognized as non-cash income until it is actually paid. |
| (4) | Warrants are non-income producing. |
| (5) | For debt investments, represents principal balance less unearned income. |
| (6) | Has been pledged as collateral under the NYL Facility. |
| (7) | The fair value of the investment was valued using significant unobservable inputs. |
| (8) | Portfolio company is a public company. |
| (9) | New Signature US, Inc. is a subsidiary of BSI Platform Holdings, LLC. |
76
The following tables show certain summarized financial information for HSLFI as of December 31, 2019 and for the period January 1, 2020 through April 21, 2010, for the year ended December 31, 2019 and for the period June 1, 2018 through December 31, 2018:
| | December 31, | |
|
| 2019 | |
| | (In thousands) | |
Selected Statement of Assets and Liabilities Information |
| |
|
Total investments at fair value (cost of $34,895) | | $ | 34,829 |
Cash and cash equivalents | |
| 503 |
Investments in money market funds | |
| 11,201 |
Restricted investments in money market funds | | | 138 |
Interest receivable | |
| 477 |
Other assets | |
| 1,109 |
Total assets | | $ | 48,257 |
| | | |
Borrowings | | $ | 14,955 |
Other liabilities | |
| 126 |
Total liabilities | |
| 15,081 |
Members’ equity | |
| 33,176 |
Total liabilities and members’ equity | | $ | 48,257 |
| | For the period | | | | For the period | |||
| | January 1, 2020 | | For the year | | June 1, 2018 | |||
| | through | | ended | | through | |||
|
| April 21, 2020 |
| December 31, 2019 |
| December 31, 2018 | |||
| | (In thousands) | |||||||
Selected Statements of Operations Information | |
| | |
| | |
| |
Interest income on investments | | $ | 1,353 | | $ | 5,291 | | $ | 689 |
Total investment income | | $ | 1,465 | | $ | 5,699 | | $ | 689 |
Total expenses | | $ | 1,229 | | $ | 1,227 | | $ | 180 |
Net investment income | | $ | 236 | | $ | 4,472 | | $ | 509 |
Net realized gain on investments | | $ | 120 | | | — | | $ | — |
Net unrealized depreciation on investments | | $ | (392) | | $ | (28) | | $ | (37) |
Net (decrease) increase in net assets resulting from operations | | $ | (36) | | $ | 4,444 | | $ | 472 |
77
Consolidated results of operations of Horizon Technology Finance Corporation
As a BDC and a RIC, we are subject to certain constraints on our operations, including limitations imposed by the 1940 Act and the Code. The consolidated results of operations described below may not be indicative of the results we report in future periods.
The following table shows consolidated results of operations for the years ended December 31, 2020, 2019 and 2018:
| | For the year ended | |||||||
| | December 31, | |||||||
|
| 2020 |
| 2019 |
| 2018 | |||
| | (In thousands) | |||||||
Total investment income | | | 46,035 | | $ | 43,125 | | $ | 31,090 |
Total expenses | |
| 25,064 | |
| 24,264 | |
| 18,374 |
Performance based incentive fee waived | |
| — | |
| (1,848) | |
| (1,184) |
Net expenses | |
| 25,064 | |
| 22,416 | |
| 17,190 |
Net investment income before excise tax | |
| 20,971 | |
| 20,709 | |
| 13,900 |
Provision for excise tax | |
| 222 | |
| 239 | |
| 34 |
Net investment income | |
| 20,749 | |
| 20,470 | |
| 13,866 |
Net realized (loss) gain on investments | |
| (14,698) | |
| (4,173) | |
| 645 |
Net unrealized appreciation (depreciation) on investments | |
| 313 | |
| 3,201 | |
| (1,501) |
Net increase in net assets resulting from operations | | $ | 6,364 | | $ | 19,498 | | $ | 13,010 |
Average debt investments, at fair value | | $ | 313,478 | | $ | 244,940 | | $ | 200,911 |
Average borrowings outstanding | | $ | 174,876 | | $ | 135,419 | | $ | 99,415 |
Net increase in net assets resulting from operations can vary substantially from period to period for various reasons, including the recognition of realized gains and losses and unrealized appreciation and depreciation on investments. As a result, annual comparisons of net increase in net assets resulting from operations may not be meaningful.
Investment income
Total investment income increased by $2.9 million, or 6.7%, to $46.0 million for the year ended December 31, 2020 as compared to the year ended December 31, 2019. For the year ended December 31, 2020, total investment income consisted primarily of $42.2 million in interest income from investments, which included $10.3 million in income from the accretion of origination fees and ETP, $3.7 million in fee income and $0.1 million in dividend income. Interest income on debt investments increased by $5.1 million, or 13.8%, to $42.2 million for the year ended December 31, 2020 as compared to the year ended December 31, 2019. Interest income on investments for the year ended December 31, 2020 as compared to the year ended December 31, 2019 increased primarily due to an increase of $68.5 million, or 28.0%, in the average size of our debt investment portfolio partially offset by a decrease in one-month LIBOR which is the base rate for many of our variable rate debt investments. Fee income, which includes success fee, other fee and prepayment fee income on debt investments, decreased by $0.1 million, or 2.1%, to $3.7 million for the year ended December 31, 2020 compared to the year ended December 31, 2019 primarily due to a decrease in fees earned on principal prepayments received.
Total investment income increased by $12.0 million, or 38.7%, to $43.1 million for the year ended December 31, 2019 as compared to the year ended December 31, 2018. For the year ended December 31, 2019, total investment income consisted primarily of $37.1 million in interest income from investments, which included $10.4 million in income from the accretion of origination fees and ETP, $3.8 million in fee income and $2.2 million in dividend income. Interest income on debt investments increased by $8.3 million, or 28.8%, to $37.1 million for the year ended December 31, 2019 as compared to the year ended December 31, 2018. Interest income on investments for the year ended December 31, 2019 as compared to the year ended December 31, 2018 increased primarily due to an increase of $44.0 million, or 21.9%, in the average size of our debt investment portfolio and an increase in accelerated fees earned on higher principal prepayments received. Fee income, which includes success fee, other fee and prepayment fee income on debt investments, increased by $1.8 million, or 85.6%, to $3.8 million for the year ended December 31, 2019 compared to the year ended December 31, 2018 primarily due to an increase in fees earned on higher principal prepayments received.
78
The following table shows our dollar-weighted annualized yield for the years ended December 31, 2020, 2019 and 2018:
| | For the year ended | | ||||
| | December 31, |
| ||||
Investment type: |
| 2020 |
| 2019 |
| 2018 |
|
Debt investments(1)(2) |
| 14.6 | % | 16.7 | % | 15.3 | % |
Equity interest in HSLFI and debt investments(1)(3) |
| 14.5 | % | 16.7 | % | 15.2 | % |
Equity interest in HSLFI(1)(4) |
| — | % | 16.2 | % | 9.0 | |
All investments(1)(5) |
| 13.9 | % | 15.7 | % | 13.9 | % |
| (1) | We calculate the dollar-weighted annualized yield on average investment type for any period as (1) total related investment income during the period divided by (2) the average of the fair value of the investment type outstanding on (a) the last day of the calendar month immediately preceding the first day of the period and (b) the last day of each calendar month during the period. The dollar-weighted annualized yield on average investment type is higher than what investors will realize because it does not reflect our expenses or any sales load paid by investors. |
| (2) | Excludes any yield from equity interest in HSLFI through April 21, 2020, warrants, equity and other investments. Related investment income includes interest income and fee income from debt investments. |
| (3) | Excludes any yield from warrants, equity and other investments. Related investment income includes dividend income from equity interest in HSLFI through April 21, 2020, interest income and fee income from debt investments. |
| (4) | Excludes any yield from debt investments, warrants, equity and other investments. Related investment income includes dividend income from equity interest in HSLFI through April 21, 2020. |
| (5) | Includes any yield from equity interest in HSFLI through April 21, 2020, debt investments, warrants, equity and other investments. Related investment income includes interest income, fee income and dividend income. |
Investment income, consisting of interest income and fees on debt investments, can fluctuate significantly upon repayment of large debt investments. Interest income from the five largest debt investments in the aggregate accounted for 23%, 17% and 25% of investment income for the years ended December 31, 2020, 2019 and 2018, respectively.
Expenses
Net expenses increased by $2.6 million, or 11.8%, to $25.1 million for the year ended December 31, 2020 as compared to the year ended December 31, 2019. Net expenses increased by $5.2 million, or 30.4%, to $22.4 million for the year ended December 31, 2019 as compared to the year ended December 31, 2018. Total expenses for each period consisted of interest expense, base management fee, incentive and administrative fees, professional fees and general and administrative expenses.
Interest expense increased by $1.3 million, or 16.1%, to $9.7 million for the year ended December 31, 2020 as compared to the year ended December 31, 2019. Interest expense, which includes the amortization of debt issuance costs, increased primarily due to an increase in average borrowings of $39.5 million, or 29.1%, offset by a reduction in our effective cost of debt. Interest expense increased by $2.0 million, or 30.9%, to $8.3 million for the year ended December 31, 2019 as compared to the year ended December 31, 2018. Interest expense, which includes the amortization of debt issuance costs, increased primarily due to an increase in average borrowings of $36.0 million, or 36.2%, which was partially offset by a decrease in LIBOR.
Base management fee expense increased by $0.9 million, or 16.2%, to $6.5 million for the December 31, 2020 as compared to the year ended December 31, 2019 primarily due to an increase of $56.4 million, or 19.8%, in average gross assets less cash for the year ended December 31, 2020 as compared to the year ended December 31, 2019. Base management fee expense increased by $1.0 million, or 21.4%, to $5.6 million for the year ended December 31, 2019 as compared to the year ended December 31, 2018 primarily due to an increase of $44.0 million, or 21.9%, in the average size of our investment portfolio for the year ended December 31, 2019 as compared to the year ended December 31, 2018.
79
On March 5, 2019, our Advisor irrevocably waived the receipt of incentive fees related to the amounts previously deferred that it may be entitled to receive under the Investment Management Agreement for the period commencing on January 1, 2019 and ending on December 31, 2019. Such waived incentive fees will not be subject to recoupment. During the year ended December 31, 2019, our Advisor waived performance based incentive fees of $1.8 million which our Advisor would have otherwise been paid. This resulted in $1.8 million of reduced expense and additional net investment income for the year ended December 31, 2019.
On March 6, 2018, our Advisor irrevocably waived the receipt of incentive fees related to the amounts previously deferred that it may be entitled to receive under the Investment Management Agreement for the period commencing on January 1, 2018 and ending on December 31, 2018. Such waived incentive fees will not be subject to recoupment. During the year ended December 31, 2018, our Advisor waived performance based incentive fees of $1.2 million which our Advisor would have otherwise earned. This resulted in $1.2 million of reduced expense and additional net investment income for the year ended December 31, 2018.
Performance based incentive fee expense increased by $0.1 million, or 1.3%, to $5.2 million for the year ended December 31, 2020 as compared to the year ended December 31, 2019. This increase was due to an increase of $0.3 million, or 1.3%, in Pre-Incentive Fee Net Investment Income for the year ended December 31, 2020 compared to the year ended December 31, 2019. Performance based incentive fee expense, net of the waiver above, increased by $1.9 million, or 59.5%, to $5.1 million for the year ended December 31, 2019 as compared to the year ended December 31, 2018. This increase was due to (i) an increase of $8.5 million, or 49.9%, in Pre-Incentive Fee Net Investment Income for the year ended December 31, 2019 compared to the year ended December 31, 2018 and (ii) an increase in the Incentive Fee Cap calculated based on the incentive fee cap and deferral mechanism in our Investment Management Agreement for the year ended December 31, 2019 compared to the year ended December 31, 2018. The incentive fee on pre-incentive fee net investment income was subject to the Incentive Fee Cap for the year ended December 31, 2018 due to the cumulative incentive fees paid exceeding 20% of cumulative pre-incentive fee net return during the applicable quarter and the 11 preceding full calendar quarters.
In 2020 and 2019, we elected to carry forward taxable income in excess of current year distributions into the next tax year and pay a 4% excise tax on such income. For the years ended December 31, 2020 and 2019, we elected to carry forward taxable income in excess of current year distributions of $6.2 million and $6.5 million, respectively. At December 31, 2020 and 2019, excise tax payable of $0.2 million was recorded.
Administrative fee expense, professional fees and general and administrative expenses were $3.7 million, $3.4 million and $3.0 million for the years ended December 31, 2020, 2019 and 2018, respectively.
Net realized gains and losses and net unrealized appreciation and depreciation
Realized gains or losses on investments are measured by the difference between the net proceeds from the repayment or sale and the cost basis of our investments without regard to unrealized appreciation or depreciation previously recognized. Realized gains or losses on investments include investments charged off during the period, net of recoveries. The net change in unrealized appreciation or depreciation on investments primarily reflects the change in portfolio investment fair values during the reporting period, including the reversal of previously recorded unrealized appreciation or depreciation when gains or losses are realized.
During the year ended December 31, 2020, we realized net losses totaling $14.7 million primarily due to the realized loss on the settlement of five of our debt investments partially offset by the realized gain from the consideration we received from the exercise and sale of warrants in six portfolio companies. During the year ended December 31, 2019, we realized net losses totaling $4.2 million primarily due to the expiration of one of our royalty agreements and the sale of one of our license agreements, which were included in other investments, which was partially offset by a gain on the sale of our equity investment in one portfolio company and from the consideration we received from the termination of warrants upon the sale of three portfolio companies. During the year ended December 31, 2018, we realized net gains totaling $0.6 million primarily due to gains realized on the sale of equity received upon the exercise of warrants.
During the year ended December 31, 2020, we recorded net unrealized appreciation on investments totaling $0.3 million due to the unrealized appreciation on our warrant investments offset by the unrealized depreciation on our debt
80
and equity investments. During the year ended December 31, 2019, we recorded net unrealized appreciation on investments totaling $3.2 million due to the unrealized appreciation on one of our equity investments and the reversal of previously recorded unrealized depreciation from the expiration of one of our royalty agreements, which was included in other investments, partially offset by the unrealized depreciation on one of our debt investments. During the year ended December 31, 2018, we recorded net unrealized depreciation on investments totaling $1.5 million due to the unrealized depreciation on our warrant and equity investments in public companies.
Liquidity and capital resources
As of December 31, 2020 and 2019, we had cash and investments in money market funds of $46.7 million and $16.3 million, respectively. Cash and investments in money market funds are available to fund new investments, reduce borrowings, pay expenses, repurchase common stock and pay distributions. In addition, as of December 31, 2020 and 2019, we had $1.1 million of restricted investments in money market funds. Restricted investments in money market funds may be used to make monthly interest and principal payments on our Asset-Backed Notes or our NYL Facility. Our primary sources of capital have been from our public and private equity offerings, use of our Credit Facilities and issuance of our public debt offerings.
On March 26, 2019, we completed a follow-on public offering of 2,000,000 shares of our common stock at a public offering price of $12.14 per share, for total net proceeds to us of $23.1 million, after deducting underwriting commission and discounts and other offering expenses.
On August 2, 2019 we entered into an At-The-Market (“ATM”), sales agreement (the “Prior Equity Distribution Agreement”), with Goldman Sachs & Co. LLC and B. Riley FBR, Inc (each a “Sales Agent” and, collectively, the “Sales Agents”). The Prior Equity Distribution Agreement provided that we may offer and sell shares of common stock from time to time through the Sales Agents representing up to $50.0 million worth of our common stock, in amounts and at times to be determined by us.
On July 30, 2020, we terminated the Prior Equity Distribution Agreement and entered into a new ATM sales agreement (the “Equity Distribution Agreement”) with the Sales Agents. The remaining shares available under the Prior Equity Distribution Agreement are no longer available for issuance. The Equity Distribution Agreement provides that we may offer and sell our shares from time to time through the Sales Agents up to $100.0 million worth of our common stock, in amounts and at times to be determined by us. Sales of our common stock, if any, may be made in negotiated transactions or transactions that are deemed to be “at-the-market,” as defined in Rule 415 under the Securities Act, including sales made directly on the NASDAQ or similar securities exchange or sales made to or through a market maker other than on an exchange, at prices related to the prevailing market prices or at negotiated prices
During the year ended December 31, 2020, we sold 3,702,500 shares of common stock under the Prior Equity Distribution Agreement and the Equity Distribution Agreement. For the same period, we received total accumulated net proceeds of approximately $44.6 million, including $1.0 million of offering expenses, from these sales. During the year ended December 31, 2019, we sold 2,012,844 shares of common stock under the Prior Equity Distribution Agreement. For the same period, we received total accumulated net proceeds of approximately $24.0 million, including $0.6 million of offering expenses, from these sales.
On April 24, 2020, our Board extended a previously authorized stock repurchase program which allows us to repurchase up to $5.0 million of our common stock at prices below our NAV per share as reported in our most recent consolidated financial statements. Under the repurchase program, we may, but are not obligated to, repurchase shares of our outstanding common stock in the open market or in privately negotiated transactions from time to time. Any repurchases by us will comply with the requirements of Rule 10b-18 under the Exchange Act and any applicable requirements of the 1940 Act. Unless extended by our Board, the repurchase program will terminate on the earlier of June 30, 2021 or the repurchase of $5.0 million of our common stock. During the years ended December 31, 2020, 2019 and 2018, we did not make any repurchases of our common stock. From the inception of the stock repurchase program through December 31, 2020, we repurchased 167,465 shares of our common stock at an average price of $11.22 on the open market at a total cost of $1.9 million.
81
At December 31, 2020 and 2019, the outstanding principal balance under the Key Facility was $28.0 million and $17.0 million, respectively. As of December 31, 2020 and 2019, we had borrowing capacity under the Key Facility of $97.0 million and $108.0 million, respectively. At December 31, 2020 and 2019, $24.8 million and $24.2 million, respectively, were available for borrowing, subject to existing terms and advance rates.
At December 31, 2020, the outstanding principal balance under the NYL Facility was $22.3 million. As of December 31, 2020, we had borrowing capacity under the NYL Facility of $77.7 million. At December 31, 2020, $0.9 million was available for borrowing, subject to existing terms and advance rates.
Our operating activities used cash of $25.3 million for the year ended December 31, 2020, and our financing activities provided cash of $55.7 million for the same period. Our operating activities used cash primarily to purchase investments in portfolio companies partially offset by principal payments received on our debt investments. Our financing activities provided cash primarily from advances on our credit facilities and the sale of shares through our ATM for net proceeds of $44.6 million, after deducting underwriting commission and discounts and other offering expenses, partially offset by the use of cash to repay our Key Facility and to pay distributions to our stockholders.
Our operating activities used cash of $51.4 million for the year ended December 31, 2019, and our financing activities provided cash of $56.2 million for the same period. Our operating activities used cash primarily to purchase investments in portfolio companies partially offset by principal payments received on our debt investments. Our financing activities provided cash primarily from the sale of shares through a follow-on public offering and our ATM for net proceeds of $47.1 million, after deducting underwriting commission and discounts and other offering expenses and the completion of our Asset-Backed Notes, partially offset by the use of cash to pay distributions to our stockholders.
Our operating activities used cash of $12.1 million for the year ended December 31, 2018, and our financing activities provided cash of $18.1 million for the same period. Our operating activities used cash primarily for investments made in portfolio companies and HSLFI, partially offset by principal payments received on our debt investments. Our financing activities provided cash primarily from advances on our Key Facility partially offset by repayment of our Key Facility and payment of distributions to our stockholders.
Our primary use of available funds is to make debt investments in portfolio companies and for general corporate purposes. We expect to raise additional equity and debt capital opportunistically, as needed, and subject to market conditions, to support our future growth to the extent permitted by the 1940 Act.
In order to remain subject to taxation as a RIC, we intend to distribute to our stockholders all or substantially all of our investment company taxable income. In addition, as a BDC, we are required to maintain asset coverage of at least 150%. This requirement limits the amount that we may borrow.
We believe that our current cash, cash generated from operations, and funds available from our Credit Facilities will be sufficient to meet our working capital and capital expenditure commitments for at least the next 12 months.
82
Current borrowings
The following table shows our borrowings as of December 31, 2020 and 2019:
| | December 31, 2020 | | December 31, 2019 | ||||||||||||||
|
| Total |
| Balance |
| Unused |
| Total |
| Balance |
| Unused | ||||||
| | Commitment | | Outstanding | | Commitment | | Commitment | | Outstanding | | Commitment | ||||||
| | (In thousands) | ||||||||||||||||
Key Facility | | $ | 125,000 | | $ | 28,000 | | $ | 97,000 | | $ | 125,000 | | $ | 17,000 | | $ | 108,000 |
NYL Facility | | | 100,000 | | | 22,250 | | | 77,750 | | | — | | | — | | | — |
Asset-Backed Notes |
| | 100,000 |
| | 100,000 |
| | — |
| | 100,000 |
| | 100,000 |
| | — |
2022 Notes |
| | 37,375 |
| | 37,375 |
| | — |
| | 37,375 |
| | 37,375 |
| | — |
Total before debt issuance costs |
| | 362,375 |
| | 187,625 |
| | 174,750 |
| | 262,375 |
| | 154,375 |
| | 108,000 |
Unamortized debt issuance costs attributable to term borrowings |
| | — |
| | (1,806) |
| | — |
| | — |
| | (2,325) |
| | — |
Total borrowings outstanding, net | | $ | 362,375 | | $ | 185,819 | | $ | 174,750 | | $ | 262,375 | | $ | 152,050 | | $ | 108,000 |
We entered into the Key Facility effective November 4, 2013. The interest rate on the Key Facility is based upon the one-month LIBOR plus a spread of 3.25%, with a LIBOR floor of 1.00%. The LIBOR rate was 0.14% and 1.76% as of December 31, 2020 and 2019, respectively. The interest rates in effect were 4.25% and 4.94% as of December 31, 2020 and 2019, respectively. The Key Facility requires the payment of an unused line fee in an amount equal to 0.50% of any unborrowed amount available under the facility annually.
The Key Facility has an accordion feature which allows for an increase in the total loan commitment to $150 million. On June 29, 2020, we amended the Key Facility, among other things, to amend the LIBOR floor from 0.75% to 1.00% and to extend the period during which we may request advances under the Key Facility (the “Revolving Period”) to September 30, 2021. The Key Facility is collateralized by debt investments held by Credit II and permits an advance rate of up to fifty percent (50%) of eligible debt investments held by Credit II. The Key Facility contains covenants that, among other things, require us to maintain a minimum net worth, to restrict the debt investments securing the Key Facility to certain criteria for qualified debt investments and to comply with portfolio company concentration limits as defined in the related loan agreement. After the Revolving Period, we may not request new advances, and we must repay the outstanding advances under the Key Facility as of such date, at such times and in such amounts as are necessary to maintain compliance with the terms and conditions of the Key Facility, particularly the condition that the principal balance of the Key Facility not exceed fifty percent (50%) of the aggregate principal balance of our eligible debt investments to our portfolio companies. The maturity of the Key Facility, the date on which all outstanding advances under the Key Facility are due and payable, is on April 6, 2023.
On September 29, 2017, we issued and sold an aggregate principal amount of $32.5 million 2022 Notes, and on October 11, 2017, pursuant to the underwriters’ 30-day option to purchase additional notes, we sold an additional $4.9 million of the 2022 Notes. The 2022 Notes have a stated maturity of September 15, 2022 and may be redeemed in whole or in part at our option at any time or from time to time on or after September 15, 2019 at a redemption price of $25 per security plus accrued and unpaid interest. The 2022 Notes bear interest at a rate of 6.25% per year payable quarterly on March 15, June 15, September 15 and December 15 of each year. The 2022 Notes are our direct, unsecured obligations and (1) rank equally in right of payment with our current and future unsecured indebtedness; (2) are senior in right of payment to any of our future indebtedness that expressly provides it is subordinated to the 2022 Notes; (3) are effectively subordinated to all of our existing and future secured indebtedness (including indebtedness that is initially unsecured to which we subsequently grant security), to the extent of the value of the assets securing such indebtedness and (4) are structurally subordinated to all existing and future indebtedness and other obligations of any of our subsidiaries. As of December 31, 2020, we were in material compliance with the terms of the 2022 Notes. The 2022 Notes are listed on the New York Stock Exchange under the symbol “HTFA”.
On August 13, 2019, the Asset-Backed Notes were issued by the 2019-1 Trust pursuant to a note purchase agreement, dated as of August 13, 2019, by and among us and Keybanc Capital Markets Inc. as Initial Purchaser, and are backed by a pool of loans made to certain portfolio companies of ours and secured by certain assets of those portfolio companies and are to be serviced by us. Interest on the Asset-Backed Notes will be paid, to the extent of funds available, at a fixed rate of
83
4.21% per annum. The Asset-Backed Notes have a two-year reinvestment period and a stated maturity of September 15, 2027. The Asset-Backed Notes were rated A+(sf) by Morningstar Credit Ratings, LLC on August 13, 2019. There has been no change in the rating since August 13, 2019.
At December 31, 2020 and 2019, the Asset-Backed Notes had an outstanding principal balance of $100.0 million.
Under the terms of the Asset-Backed Notes, we are required to maintain a reserve cash balance, funded through proceeds from the sale of the Asset-Backed Notes, which may be used to pay monthly interest and principal payments on the Asset-Backed Notes. The Company has segregated these funds and classified them as restricted investments in money market funds. At December 31, 2020 and 2019, there was approximately $1.0 million and $1.1 million, respectively, of restricted investments.
On April 21, 2020, we purchased all of the limited liability company interests of Arena in HSLFI. HFI is a wholly-owned subsidiary of HSLFI. HFI entered into the NYL Facility with the NYL Noteholders for an aggregate purchase price of up to $100.0 million, with an accordion feature of up to $200.0 million at the mutual discretion and agreement of HSLFI and the NYL Noteholders. On June 1, 2018, HSLFI sold or contributed to HFI certain secured loans made to certain portfolio companies pursuant to the Sale and Servicing Agreement. Any notes issued by HFI are collateralized by all investments held by HFI and permit an advance rate of up to 67% of the aggregate principal amount of eligible debt investments.
On June 5, 2020, HFI amended the NYL Facility to extend the investment period to June 5, 2022. The investment period will be followed by a five year amortization period. The stated final payment date was extended to June 15, 2027, subject to any extension of the investment period. The interest rate on the notes issued under the NYL Facility is based on the three year USD mid-market swap rate plus a margin of between 3.55% and 5.15% with an interest rate floor, depending on the rating of such notes at the time of issuance. Any obligation to make additional advances was conditioned on the occurrence of certain conditions, which were satisfied June 26, 2020. There were $22.3 million in notes issued to the Noteholders as of December 31, 2020 at an interest rate of 4.60%.
Other assets
As of December 31, 2020 and 2019, other assets were $1.9 million and $1.5 million, respectively, which is primarily comprised of debt issuance costs and prepaid expenses.
Contractual obligations and off-balance sheet arrangements
The following table shows our significant contractual payment obligations and off-balance sheet arrangements as of December 31, 2020:
| | Payments due by period | |||||||||||||
|
| | |
| Less than |
| 1 – 3 |
| 3 – 5 |
| After 5 | ||||
| | Total | | 1 year | | Years | | Years | | years | |||||
| | (In thousands) | |||||||||||||
Borrowings | | $ | 187,625 | | $ | 9,716 | | $ | 142,097 | | $ | 35,812 | | $ | — |
Unfunded commitments | |
| 91,500 | |
| 68,000 | |
| 23,500 | |
| — | |
| — |
Total | | $ | 279,125 | | $ | 77,716 | | $ | 165,597 | | $ | 35,812 | | $ | — |
In the normal course of business, we are party to financial instruments with off-balance sheet risk. These consist primarily of unfunded commitments to extend credit, in the form of loans, to our portfolio companies. Unfunded commitments to provide funds to portfolio companies are not reflected on our balance sheet. Our unfunded commitments may be significant from time to time. As of December 31, 2020, we had such unfunded commitments of $91.5 million. This includes no undrawn revolver commitments. These commitments are subject to the same underwriting and ongoing portfolio maintenance requirements as are the financial instruments that we hold on our balance sheet. In addition, these commitments are often subject to financial or non-financial milestones and other conditions to borrowing that must be achieved before the commitment can be drawn. Since these commitments may expire without being drawn upon, the total commitment amount does not necessarily represent future cash requirements. We regularly monitor our unfunded commitments and anticipated refinancings, maturities and capital raising, to ensure that we have sufficient liquidity to
84
fund such unfunded commitments. As of December 31, 2020, we reasonably believed that our assets would provide adequate financial resources to satisfy all of our unfunded commitments.
In addition to the Credit Facilities, we have certain commitments pursuant to our Investment Management Agreement entered into with our Advisor. We have agreed to pay a fee for investment advisory and management services consisting of two components (1) a base management fee equal to a percentage of the value of our gross assets less cash or cash equivalents, and (2) a two-part incentive fee. We have also entered into a contract with our Advisor to serve as our administrator. Payments under the Administration Agreement are equal to an amount based upon our allocable portion of our Advisor’s overhead in performing its obligations under the agreement, including rent, fees and other expenses inclusive of our allocable portion of the compensation of our Chief Financial Officer and Chief Compliance Officer and their respective staffs. See Note 3 to our consolidated financial statements for additional information regarding our Investment Management Agreement and our Administration Agreement.
Distributions
In order to qualify and be subject to tax as a RIC, we must meet certain source-of-income, asset diversification and annual distribution requirements. Generally, in order to qualify as a RIC, we must derive at least 90% of our gross income for each tax year from dividends, interest, payments with respect to certain securities, loans, gains from the sale or other disposition of stock, securities or foreign currencies, income derived from certain publicly traded partnerships, or other income derived with respect to its business of investing in stock or other securities. We must also meet certain asset diversification requirements at the end of each quarter of each tax year. Failure to meet these diversification requirements on the last day of a quarter may result in us having to dispose of certain investments quickly in order to prevent the loss of RIC status. Any such dispositions could be made at disadvantageous prices or times, and may cause us to incur substantial losses.
In addition, in order to be subject to tax as a RIC and to avoid the imposition of corporate-level tax on the income and gains we distribute to our stockholders in respect of any tax year, we are required under the Code to distribute as dividends to our stockholders out of assets legally available for distribution each tax year an amount generally at least equal to 90% of the sum of our net ordinary income and net short-term capital gains in excess of net long-term capital losses, if any. Additionally, in order to avoid the imposition of a U.S. federal excise tax, we are required to distribute, in respect of each calendar year, dividends to our stockholders of an amount at least equal to the sum of 98% of our calendar year net ordinary income (taking into account certain deferrals and elections); 98.2% of our capital gain net income (adjusted for certain ordinary losses) for the one year period ending on October 31 of such calendar year; and any net ordinary income and capital gain net income for preceding calendar years that were not distributed during such calendar years and on which we previously did not incur any U.S. federal income tax. If we fail to qualify as a RIC for any reason and become subject to corporate tax, the resulting corporate taxes could substantially reduce our net assets, the amount of income available for distribution and the amount of our distributions. Such a failure would have a material adverse effect on us and our stockholders. In addition, we could be required to recognize unrealized gains, incur substantial taxes and interest and make substantial distributions in order to re-qualify as a RIC. We cannot assure stockholders that they will receive any distributions.
To the extent our taxable earnings in a tax year fall below the total amount of our distributions made to stockholders in respect of such tax year, a portion of those distributions may be deemed a return of capital to our stockholders for U.S. federal income tax purposes. Thus, the source of a distribution to our stockholders may be the original capital invested by the stockholder rather than our income or gains. Stockholders should review any written disclosure accompanying a distribution payment carefully and should not assume that the source of any distribution is our ordinary income or gains.
We have adopted an “opt out” DRIP for our common stockholders. As a result, if we declare a distribution, then stockholders’ cash distributions will be automatically reinvested in additional shares of our common stock unless a stockholder specifically “opts out” of our DRIP. If a stockholder opts out, that stockholder will receive cash distributions. Although distributions paid in the form of additional shares of our common stock will generally be subject to U.S. federal, state and local taxes, stockholders participating in our DRIP will not receive any corresponding cash distributions with which to pay any such applicable taxes. If our common stock is trading above NAV, a stockholder receiving distributions in the form of additional shares of our common stock will be treated as receiving a distribution of an amount equal to the
85
fair market value of such shares of our common stock. We may use newly issued shares to implement the DRIP, or we may purchase shares in the open market in connection with our obligations under the DRIP.
Related party transactions
We have entered into the Investment Management Agreement with the Advisor. The Advisor is registered as an investment adviser under the Investment Advisers Act of 1940, as amended. Our investment activities are managed by the Advisor and supervised by the Board, the majority of whom are independent directors. Under the Investment Management Agreement, we have agreed to pay the Advisor a base management fee as well as an incentive fee. During the years ended December 31, 2020, 2019 and 2018, the Advisor earned $11.6 million, $10.7 million and $7.8 million, respectively, pursuant to the Investment Management Agreement.
Horizon Technology Finance Principals LLC f/k/a Horizon Technology Finance, LLC (“HTF Principals”) owns more than seventy percent (70%) of the Advisor. Our Chief Executive Officer, Robert D. Pomeroy, Jr. and our President, Gerald A. Michaud own one hundred percent (100%) of HTF Principals. By virtue of their ownership interest in HTF Principals, Mr. Pomeroy and Mr. Michaud control our Advisor.
We have also entered into the Administration Agreement with the Advisor. Under the Administration Agreement, we have agreed to reimburse the Advisor for our allocable portion of overhead and other expenses incurred by the Advisor in performing its obligations under the Administration Agreement, including rent and our allocable portion of the costs of compensation and related expenses of our Chief Financial Officer and Chief Compliance Officer and their respective staffs. In addition, pursuant to the terms of the Administration Agreement the Advisor provides us with the office facilities and administrative services necessary to conduct our day-to-day operations. During the years ended December 31, 2020, 2019 and 2018, the Advisor earned $1.0 million, $0.9 million and $0.7 million, respectively, pursuant to the Administration Agreement.
HTF Principals has granted the Company a non-exclusive, royalty-free license to use the name “Horizon Technology Finance.”
We believe that we derive substantial benefits from our relationship with our Advisor. Our Advisor may manage other investment vehicles, or Advisor Funds, with the same investment strategy as us. The Advisor may provide us an opportunity to co-invest with the Advisor Funds. Under the 1940 Act, absent receipt of exemptive relief from the SEC, we and our affiliates are precluded from co-investing in negotiated investments. On November 27, 2017, we were granted exemptive relief from the SEC which permits us to co-invest with Advisor Funds, subject to certain conditions.
Critical accounting policies
The discussion of our financial condition and results of operation is based upon our financial statements, which have been prepared in accordance with GAAP. The preparation of these consolidated financial statements requires management to make estimates and assumptions that affect the reported amounts of assets, liabilities, revenues and expenses. Changes in the economic environment, financial markets and any other parameters used in determining such estimates could cause actual results to differ. In addition to the discussion below, we describe our significant accounting policies in the notes to our consolidated financial statements.
We have identified the following items as critical accounting policies.
Valuation of investments
Investments are recorded at fair value. Our Board determines the fair value of our portfolio investments. We apply fair value to substantially all of our investments in accordance with Topic 820, Fair Value Measurement, of the Financial Accounting Standards Board’s, or FASB’s, Accounting Standards Codification as amended, or ASC, which establishes a framework used to measure fair value and requires disclosures for fair value measurements. We have categorized our investments carried at fair value, based on the priority of the valuation technique, into a three-level fair value hierarchy. Fair value is a market-based measure considered from the perspective of the market participant who holds the financial instrument rather than an entity specific measure. Therefore, when market assumptions are not readily available, our own
86
assumptions are set to reflect those that management believes market participants would use in pricing the financial instrument at the measurement date.
The availability of observable inputs can vary depending on the financial instrument and is affected by a wide variety of factors, including, for example, the type of product, whether the product is new, whether the product is traded on an active exchange or in the secondary market and the current market conditions. To the extent that the valuation is based on models or inputs that are less observable or unobservable in the market, the determination of fair value requires more judgment. The three categories within the hierarchy are as follows:
Level 1 | Quoted prices in active markets for identical assets and liabilities. |
Level 2 | Observable inputs other than Level 1 prices such as quoted prices for similar assets or liabilities in active markets, quoted prices in markets that are not active and model-based valuation techniques for which all significant inputs are observable or can be corroborated by observable market data for substantially the full term of the assets or liabilities. |
Level 3 | Unobservable inputs that are supported by little or no market activity and that are significant to the fair value of the assets or liabilities. Level 3 assets and liabilities include financial instruments whose value is determined using pricing models, discounted cash flow methodologies or similar techniques, as well as instruments for which the determination of fair value requires significant management judgment or estimation. |
Our Board determines the fair value of investments in good faith, based on the input of management, the audit committee and independent valuation firms that have been engaged at the direction of our Board to assist in the valuation of each portfolio investment without a readily available market quotation at least once during a trailing twelve-month period under our valuation policy and a consistently applied valuation process. The Board conducts this valuation process at the end of each fiscal quarter, with 25% (based on fair value) of our valuation of portfolio companies that do not have a readily available market quotations subject to review by an independent valuation firm.
Income recognition
Interest on debt investments is accrued and included in income based on contractual rates applied to principal amounts outstanding. Interest income is determined using a method that results in a level rate of return on principal amounts outstanding. Generally, when a debt investment becomes 90 days or more past due, or if we otherwise do not expect to receive interest and principal repayments, the debt investment is placed on non-accrual status and the recognition of interest income may be discontinued. Interest payments received on non-accrual debt investments may be recognized as income, on a cash basis, or applied to principal depending upon management’s judgment at the time the debt investment is placed on non-accrual status. For the year ended December 31, 2020, we recognized as interest income interest payments of $0.03 million received from one portfolio company whose debt investment was on non-accrual status. For the year ended December 31, 2019 and 2018, we did not recognize any interest income from debt investments on non-accrual status.
We receive a variety of fees from borrowers in the ordinary course of conducting our business, including advisory fees, commitment fees, amendment fees, non-utilization fees, success fees and prepayment fees. In a limited number of cases, we may also receive a non-refundable deposit earned upon the termination of a transaction. Debt investment origination fees, net of certain direct origination costs, are deferred, and along with unearned income, are amortized as a level yield adjustment over the respective term of the debt investment. All other income is recorded into income when earned. Fees for counterparty debt investment commitments with multiple debt investments are allocated to each debt investment based upon each debt investment’s relative fair value. When a debt investment is placed on non-accrual status, the amortization of the related fees and unearned income is discontinued until the debt investment is returned to accrual status.
Certain debt investment agreements also require the borrower to make an ETP that is accrued into income over the life of the debt investment to the extent such amounts are expected to be collected. We will generally cease accruing the income if there is insufficient value to support the accrual or if we do not expect the borrower to be able to pay all principal and interest due.
87
In connection with substantially all lending arrangements, we receive warrants to purchase shares of stock from the borrower. We record the warrants as assets at estimated fair value on the grant date using the Black-Scholes valuation model. We consider the warrants as loan fees and record them as unearned income on the grant date. The unearned income is recognized as interest income over the contractual life of the related debt investment in accordance with our income recognition policy. Subsequent to origination, the warrants are also measured at fair value using the Black-Scholes valuation model. Any adjustment to fair value is recorded through earnings as net unrealized gain or loss on investments. Gains and losses from the disposition of the warrants or stock acquired from the exercise of warrants are recognized as realized gains and losses on investments.
Prior to consolidating the investment of HSLFI on and after April 21, 2020, distributions from HSLFI were evaluated at the time of distribution to determine if the distribution should be recorded as dividend income or a return of capital. Generally, we did not record distributions from HSLFI as dividend income unless there were sufficient accumulated tax-basis earnings and profit in HSLFI prior to distribution. Distributions that were classified as a return of capital were recorded as a reduction in the cost basis of the investment. For the period January 1, 2020 through April 21, 2020, there were no distributions from HSLFI. For the year ended December 31, 2019, HSLFI distributed $0.7 million classified as dividend income to us. For the period June 1, 2018 (the commencement of HSLFI’s operations) through December 31, 2018, HSLFI distributed $0.3 million classified as dividend income to us.
Realized gains or losses on the sale of investments, or upon the determination that an investment balance, or portion thereof, is not recoverable, are calculated using the specific identification method. We measure realized gains or losses by calculating the difference between the net proceeds from the repayment or sale and the amortized cost basis of the investment. Net change in unrealized appreciation or depreciation reflects the change in the fair values of our portfolio investments during the reporting period, including any reversal of previously recorded unrealized appreciation or depreciation, when gains or losses are realized.
Income taxes
We have elected to be treated as a RIC under Subchapter M of the Code and operate in a manner so as to qualify for the tax treatment applicable to RICs. In order to qualify as a RIC and to avoid the imposition of corporate-level U.S. federal income tax on the amounts we distribute to our stockholders, among other things, we are required to meet certain source of income and asset diversification requirements, and we must timely distribute dividends to our stockholders out of assets legally available for distribution each tax year of an amount generally at least equal to 90% of our investment company taxable income, as defined by the Code and determined without regard to any deduction for dividends paid. We, among other things, have made and intend to continue to make the requisite distributions to our stockholders, which will generally relieve us from incurring any material liability for U.S. federal income taxes.
Depending on the level of taxable income earned in a tax year, we may choose to carry forward taxable income in excess of current year distributions into the next tax year and incur a 4% excise tax on such income, as required. To the extent that we determine that our estimated current year annual taxable income will be in excess of estimated current year distributions, we will accrue excise tax, if any, on estimated excess taxable income as taxable income is earned.
We evaluate tax positions taken in the course of preparing our tax returns to determine whether the tax positions are “more-likely-than-not” to be sustained by the applicable tax authority in accordance with ASC Topic 740, Income Taxes, as modified by ASC Topic 946, Financial Services – Investment Companies. Tax benefits of positions not deemed to meet the more-likely-than-not threshold, or uncertain tax positions, are recorded as a tax expense in the current year. It is our policy to recognize accrued interest and penalties related to uncertain tax benefits in income tax expense. We had no material uncertain tax positions at December 31, 2020 and 2019.
Recently issued accounting pronouncement
In March 2020, the Financial Accounting Standards Board issued Accounting Standards Update No. 2020-04, Reference Rate Reform (Topic 848): Facilitation of the Effects of Reference Rate Reform on Financial Reporting, or ASU 2020-04. ASU 2020-04 provides optional expedients and exceptions for applying GAAP to contract modifications and hedging relationships, subject to meeting certain criteria, that reference LIBOR or another rate that is expected to be discontinued. The amendments in ASU 2020-04 are effective for all entities as of March 12, 2020 through December 31,
88
2022. We are currently assessing the impact of ASU 2020-04 and the LIBOR transition on our consolidated financial statements.
Recent developments
Subsequent to December 31, 2020 pursuant to private foreclosure sales, we received net proceeds of approximately $1.7 million from the sale of substantially all of the assets of The NanoSteel Company, Inc. (“NanoSteel”), which assets collateralized our debt investment in NanoSteel. We do not expect to receive any additional material proceeds from the sale of additional assets of NanoSteel.
On January 14, 2021, we funded a $5.0 million debt investment to a new portfolio company, Clara Foods Co.
On January 15, 2021, we funded a $7.0 million debt investment to a new portfolio company, Supply Network Visibility Holdings LLC.
On February 23, 2021, we funded a $7.0 million debt investment to an existing portfolio company, Getaround, Inc.
On February 25, 2021, we funded a $6.0 million debt investment to a new portfolio company, Primary Kids, Inc.
Item 7A. Quantitative and Qualitative Disclosures About Market Risk
We are subject to financial market risks, including changes in interest rates. During the periods covered by our financial statements, the interest rates on the debt investments within our portfolio were primarily at floating rates. We expect that our debt investments in the future will primarily have floating interest rates. As of December 31, 2020 and 2019, 100% and 99%, respectively, of the outstanding principal amount of our debt investments bore interest at floating rates. The initial commitments to lend to our portfolio companies are usually based on a floating LIBOR index or the Prime Rate as published in the Wall Street Journal.
Based on our December 31, 2020 consolidated statement of assets and liabilities (without adjustment for potential changes in the credit market, credit quality, size and composition of assets on the consolidated statement of assets and liabilities or other business developments that could affect net income) and the base index rates at December 31, 2020, the following table shows the annual impact on the change in net assets resulting from operations of changes in interest rates, which assumes no changes in our investments and borrowings:
|
| Investment |
| Interest |
| Change in Net | |||
Change in basis points | | Income | | Expense | | Assets(1) | |||
| | (In thousands) | |||||||
Up 300 basis points | | $ | 5,685 | | $ | 610 | | $ | 5,075 |
Up 200 basis points | | $ | 2,670 | | $ | 326 | | $ | 2,344 |
Up 100 basis points | | $ | 1,046 | | $ | 43 | | $ | 1,003 |
Down 300 basis points | | $ | — | | $ | — | | $ | — |
Down 200 basis points | | $ | — | | $ | — | | $ | — |
Down 100 basis points | | $ | — | | $ | — | | $ | — |
| (1) | Excludes the impact of incentive fees based on pre-incentive fee net investment income. |
While our 2022 Notes and our Asset-Backed Notes bear interest at a fixed rate, our Credit Facilities have a floating interest rate provision. The Key Facility is subject to a floor of 1.00% per annum, based on a LIBOR index which resets monthly and the NYL Facility is based on the three year USD mid-market swap rate plus a margin of between 3.55% and 5.15% with an interest rate floor, depending on the rating of such notes at the time of issuance. Any other credit facilities into which we enter in the future may have floating interest rate provisions. We have used hedging instruments in the past to protect us against interest rate fluctuations, and we may use them in the future. Such instruments may include caps, swaps, futures, options and forward contracts. While hedging activities may insulate us against adverse changes in interest rates, they may also limit our ability to participate in the benefits of lower interest rates with respect to the investments in our portfolio with fixed interest rates. Engaging in commodity interest transactions such as swap transactions or futures contracts for the Company may cause the Investment Adviser to fall within the definition of “commodity pool operator”
89
under the Commodity Exchange Act (the “CEA”) and related Commodity Futures Trading Commission (the “CFTC”) regulations. On January 31, 2020, the Investment Adviser claimed an exclusion from the definition of the term “commodity pool operator” under the CEA and the CFTC regulations in connection with its management of the Company and, therefore, is not subject to CFTC registration or regulation under the CEA as a commodity pool operator with respect to its management of the Company.
Because we currently fund, and expect to continue to fund, our investments with borrowings, our net income is dependent upon the difference between the rate at which we borrow funds and the rate at which we invest the funds borrowed. Accordingly, there can be no assurance that a significant change in market interest rates will not have a material adverse effect on our net income. In periods of rising interest rates, our cost of funds could increase, which would reduce our net investment income.
90
Item 8. Consolidated Financial Statements and Supplementary Data
Index to Consolidated Financial Statements
91
Management’s Report on Internal Control over Financial Reporting
Management of Horizon Technology Finance Corporation (the “Company”) is responsible for establishing and maintaining adequate internal control over the Company’s financial reporting. The Company’s internal control system is a process designed to provide reasonable assurance to management and the board of directors regarding the preparation and fair presentation of published financial statements.
The Company’s internal control over financial reporting includes policies and procedures that pertain to the maintenance of records that, in reasonable detail, accurately and fairly reflect transactions recorded necessary to permit the preparation of financial statements in accordance with U.S. generally accepted accounting principles. The Company’s policies and procedures also provide reasonable assurance that receipts and expenditures are being made only in accordance with authorizations of management and the directors of the Company, and provide reasonable assurance regarding prevention or timely detection of unauthorized acquisition, use or disposition of the Company’s assets that could have a material effect on the Company’s financial statements.
All internal control systems, no matter how well designed, have inherent limitations. Therefore, even those systems determined to be effective can provide only reasonable assurance with respect to financial statement preparation and presentation. Also, projections of any evaluation of effectiveness as to future periods are subject to the risk that controls may become inadequate because of changes in conditions, or that the degree of compliance with the policies or procedures may deteriorate.
Management assessed the effectiveness of the Company’s internal control over financial reporting as of December 31, 2020. In making this assessment, we used the criteria set forth by the Committee of Sponsoring Organizations of the Treadway Commission in Internal Control — Integrated Framework issued in 2013. Based on the assessment, management believes that, as of December 31, 2020, the Company’s internal control over financial reporting is effective based on those criteria.
Pursuant to rules established by the SEC, this annual report does not include an attestation report of our independent registered public accounting firm regarding internal control over financial reporting.
92
Report of Independent Registered Public Accounting Firm
To the Stockholders and the Board of Directors of Horizon Technology Finance Corporation
Opinion on the Financial Statements
We have audited the accompanying consolidated statements of assets and liabilities of Horizon Technology Finance Corporation and its subsidiaries (the Company), including the consolidated schedules of investments, as of December 31, 2020 and 2019, the related consolidated statements of operations, changes in net assets, and cash flows for each of the three years in the period ended December 31, 2020, and the related notes to the consolidated financial statements (collectively, the financial statements). In our opinion, the financial statements present fairly, in all material respects, the financial position of the Company as of December 31, 2020 and 2019, and the results of its operations, changes in net assets, and cash flows for each of the three years in the period ended December 31, 2020, in conformity with accounting principles generally accepted in the United States of America.
Basis for Opinion
These financial statements are the responsibility of the Company’s management. Our responsibility is to express an opinion on the Company’s financial statements based on our audits. We are a public accounting firm registered with the Public Company Accounting Oversight Board (United States) (PCAOB) and are required to be independent with respect to the Company in accordance with U.S. federal securities laws and the applicable rules and regulations of the Securities and Exchange Commission and the PCAOB.
We conducted our audits in accordance with the standards of the PCAOB. Those standards require that we plan and perform the audit to obtain reasonable assurance about whether the financial statements are free of material misstatement, whether due to error or fraud. The Company is not required to have, nor were we engaged to perform, an audit of its internal control over financial reporting. As part of our audits we are required to obtain an understanding of internal control over financial reporting but not for the purpose of expressing an opinion on the effectiveness of the Company’s internal control over financial reporting. Accordingly, we express no such opinion.
Our audits included performing procedures to assess the risks of material misstatement of the financial statements, whether due to error or fraud, and performing procedures that respond to those risks. Such procedures included examining, on a test basis, evidence regarding the amounts and disclosures in the financial statements. Our procedures included confirmation of investments owned as of December 31, 2020 and 2019, by correspondence with the custodian and/or brokers or the underlying investee. Our audits also included evaluating the accounting principles used and significant estimates made by management, as well as evaluating the overall presentation of the financial statements. We believe that our audits provide a reasonable basis for our opinion.
Critical Audit Matters
The critical audit matter communicated below is a matter arising from the current period audit of the financial statements that was communicated or required to be communicated to the audit committee and that: (1) relates to accounts or disclosures that are material to the financial statements and (2) involved our especially challenging, subjective, or complex judgments. The communication of critical audit matters does not alter in any way our opinion on the financial statements, taken as a whole, and we are not, by communicating the critical audit matter below, providing separate opinions on the critical audit matter or on the accounts or disclosures to which it relates.
Valuation of Level 3 investments
The fair value of the Company’s Level 3 investments was $350.0 million as of December 31, 2020. As described in Notes 2 and 6 to the consolidated financial statements, there is not a readily available market value for most of the investments in the Company’s portfolio. Such investments include debt, warrant, equity, and other investments in venture capital and private equity backed companies. The valuation techniques used in estimating the fair value of these investments may vary based on the specific characteristics of the investments and require the use of certain significant unobservable inputs, such as the Company’s internally developed credit risk ratings, discounted expected future cash flows, hypothetical market
93
yields, multiple probability weighted expected cash flow scenarios, and portfolio company financial performance, among others.
We identified the valuation of Level 3 investments as a critical audit matter due to the subjective nature of the judgments necessary for management to select valuation techniques and the use of significant unobservable inputs to estimate the fair value. Auditing the reasonableness of management’s selection of valuation technique and the related unobservable inputs required a high degree of auditor judgement and increased audit effort, including evaluation of the nature of audit evidence obtained and the use of internal valuation specialists.
The primary procedures we performed to address this critical audit matter included the following, among others:
We obtained an understanding of the relevant controls related to management’s internally developed credit risk ratings and tested such controls for design and operating effectiveness.
We assessed the reasonableness of a sample of management’s credit risk ratings by inspecting underlying source data and comparing to the Company’s credit risk policy.
We assessed the reasonableness of discounted expected future cash flows, multiple probability weighted scenarios, and portfolio management company performance used in the Company’s valuation models through comparison to internal and external data.
With the assistance of our internal valuation specialists, we evaluated the reasonableness of the hypothetical market yields used by the Company by comparing to market data for comparable companies.
With the assistance of our internal valuation specialists, we evaluated the appropriateness of the selected valuation techniques, and any changes to selected valuation techniques from prior periods, used for Level 3 investments.
We evaluated management’s historical ability to estimate fair value through comparison of previous estimates to the transaction price of available transactions occurring subsequent to the previous valuation date.
/s/ RSM US LLP | |
| |
We have served as the Company's auditor since 2008. | |
| |
New Haven, Connecticut | |
March 2, 2021 |
94
Horizon Technology Finance Corporation and Subsidiaries
Consolidated Statements of Assets and Liabilities
(In thousands, except share and per share data)
| | December 31, | ||||
|
| 2020 |
| 2019 | ||
Assets |
| (Unaudited) |
| |
| |
Non-affiliate investments at fair value (cost of $343,158 and $295,256, respectively) | | $ | 343,498 | | $ | 294,304 |
Non-controlled affiliate investments at fair value (cost of $6,854 and $6,891, respectively) (Note 5) | |
| 7,547 | |
| 8,597 |
Controlled affiliate investments at fair value (cost of $1,500 and $16,684, respectively) (Note 5) | |
| 1,500 | |
| 16,650 |
Total investments at fair value (cost of $351,512 and $318,831, respectively) (Note 4) | |
| 352,545 | |
| 319,551 |
Cash | |
| 19,502 | |
| 6,465 |
Investments in money market funds | |
| 27,199 | |
| 9,787 |
Restricted investments in money market funds | |
| 1,057 | |
| 1,133 |
Interest receivable | |
| 4,946 | |
| 5,530 |
Other assets | |
| 1,908 | |
| 1,535 |
Total assets | | $ | 407,157 | | $ | 344,001 |
| | | | | | |
Liabilities | |
|
| |
|
|
Borrowings (Note 7) | | $ | 185,819 | | $ | 152,050 |
Distributions payable | |
| 5,786 | |
| 4,669 |
Base management fee payable (Note 3) | |
| 563 | |
| 519 |
Incentive fee payable (Note 3) | |
| 975 | |
| 1,613 |
Other accrued expenses | |
| 1,417 | |
| 1,095 |
Total liabilities | |
| 194,560 | |
| 159,946 |
| | | | | | |
Commitments and contingencies (Note 8) | |
|
| |
|
|
| | | | | | |
Net assets | |
|
| |
|
|
Preferred stock, par value $0.001 per share, 1,000,000 shares authorized, zero shares issued and outstanding as of December 31, 2020 and 2019 | |
| — | |
| — |
Common stock, par value $0.001 per share, 100,000,000 shares authorized, 19,453,821 and 15,730,755 shares issued and 19,286,356 and 15,563,290 shares outstanding as of December 31, 2020 and 2019, respectively | |
| 19 | |
| 16 |
Paid-in capital in excess of par | |
| 271,287 | |
| 226,660 |
Distributable earnings | |
| (58,709) | |
| (42,621) |
Total net assets | |
| 212,597 | |
| 184,055 |
Total liabilities and net assets | | $ | 407,157 | | $ | 344,001 |
Net asset value per common share | | $ | 11.02 | | $ | 11.83 |
See Notes to Consolidated Financial Statements
95
Horizon Technology Finance Corporation and Subsidiaries
Consolidated Statements of Operations
(In thousands, except share and per share data)
| | | | | | | | | |
| | Year Ended December 31, | |||||||
|
| 2020 |
| 2019 |
| 2018 | |||
Investment income |
| |
|
| |
|
| |
|
Interest income on investments |
| |
|
| |
|
| |
|
Interest income on non-affiliate investments | | $ | 41,503 | | $ | 36,247 | | $ | 28,061 |
Interest income on affiliate investments | |
| 689 | |
| 839 | |
| 725 |
Total interest income on investments | |
| 42,192 | |
| 37,086 | |
| 28,786 |
Fee income | |
|
| |
|
| |
|
|
Prepayment fee income on non-affiliate investments | | | 2,345 | | | 2,296 | | | 1,159 |
Fee income on non-affiliate investments | |
| 1,335 | |
| 1,490 | |
| 867 |
Fee income on affiliate investments | |
| 45 | |
| 17 | |
| 23 |
Total fee income | |
| 3,725 | |
| 3,803 | |
| 2,049 |
Dividend income | |
|
| |
|
| |
|
|
Dividend income on controlled affiliate investments | |
| 118 | |
| 2,236 | |
| 255 |
Total dividend income | |
| 118 | |
| 2,236 | |
| 255 |
Total investment income | |
| 46,035 | |
| 43,125 | |
| 31,090 |
Expenses | |
|
| |
|
| |
|
|
Interest expense | |
| 9,673 | |
| 8,330 | |
| 6,363 |
Base management fee (Note 3) | |
| 6,458 | |
| 5,556 | |
| 4,578 |
Performance based incentive fee (Note 3) | |
| 5,187 | |
| 6,966 | |
| 4,393 |
Administrative fee (Note 3) | |
| 1,016 | |
| 907 | |
| 708 |
Professional fees | |
| 1,540 | |
| 1,537 | |
| 1,343 |
General and administrative | |
| 1,190 | |
| 968 | |
| 989 |
Total expenses | |
| 25,064 | |
| 24,264 | |
| 18,374 |
Performance based incentive fee waived (Note 3) | |
| — | |
| (1,848) | |
| (1,184) |
Net expenses | |
| 25,064 | |
| 22,416 | |
| 17,190 |
Net investment income before excise tax | |
| 20,971 | |
| 20,709 | |
| 13,900 |
Provision for excise tax (Note 8) | |
| 222 | |
| 239 | |
| 34 |
Net investment income | |
| 20,749 | |
| 20,470 | |
| 13,866 |
Net realized and unrealized loss on investments | |
|
| |
|
| |
|
|
Net realized (loss) gain on non-affiliate investments | |
| (14,686) | |
| (4,173) | |
| 645 |
Net realized loss on controlled affiliate investments | | | (12) | | | — | | | — |
Net realized (loss) gain on investments | |
| (14,698) | |
| (4,173) | |
| 645 |
Net unrealized appreciation (depreciation) on non-affiliate investments | |
| 1,585 | |
| 1,196 | |
| (1,445) |
Net unrealized (depreciation) appreciation on non-controlled affiliate investments | |
| (1,014) | |
| 2,019 | |
| (37) |
Net unrealized depreciation on controlled affiliate investments | |
| (258) | |
| (14) | |
| (19) |
Net unrealized appreciation (depreciation) on investments | |
| 313 | |
| 3,201 | |
| (1,501) |
Net realized and unrealized loss on investments | |
| (14,385) | |
| (972) | |
| (856) |
Net increase in net assets resulting from operations | | $ | 6,364 | | $ | 19,498 | | $ | 13,010 |
Net investment income per common share | | $ | 1.18 | | $ | 1.52 | | $ | 1.20 |
Net increase in net assets per common share | | $ | 0.36 | | $ | 1.45 | | $ | 1.13 |
Distributions declared per share | | $ | 1.25 | | $ | 1.20 | | $ | 1.20 |
Weighted average shares outstanding | |
| 17,534,528 | |
| 13,478,234 | |
| 11,527,777 |
See Notes to Consolidated Financial Statements
96
Horizon Technology Finance Corporation and Subsidiaries
Consolidated Statements of Changes in Net Assets
(In thousands, except share data)
| | | | | | | Paid-In Capital | | | | | | | |
| | Common Stock | | in Excess of | | Distributable | | Total Net | ||||||
|
| Shares |
| Amount |
| Par |
| Earnings |
| Assets | ||||
Balance at December 31, 2017 |
| 11,520,406 | | $ | 12 | | $ | 179,641 | | $ | (44,578) | | $ | 135,075 |
Net increase in net assets resulting from operations, net of excise tax: |
|
| |
|
| |
|
| |
|
| |
|
|
Net investment income, net of excise tax |
| — | |
| — | |
| — | |
| 13,866 | |
| 13,866 |
Net realized gain on investments |
| — | |
| — | |
| — | |
| 645 | |
| 645 |
Net unrealized depreciation on investments |
| — | |
| — | |
| — | |
| (1,501) | |
| (1,501) |
Financing costs |
| — | |
| — | |
| (155) | |
| — | |
| (155) |
Issuance of common stock under dividend reinvestment plan |
| 14,723 | |
| — | |
| 164 | |
| — | |
| 164 |
Distributions declared |
| — | |
| — | |
| — | |
| (13,837) | |
| (13,837) |
Reclassification of permanent tax differences (Note 2) |
| — | |
| — | |
| (34) | |
| 34 | |
| — |
Balance at December 31, 2018 |
| 11,535,129 | | $ | 12 | | $ | 179,616 | | $ | (45,371) | | $ | 134,257 |
Issuance of common stock, net of offering costs | | 4,012,844 | | $ | 4 | | $ | 47,097 | | $ | — | | $ | 47,101 |
Net increase in net assets resulting from operations, net of excise tax: |
| | | | | | | | | | | | | |
Net investment income, net of excise tax |
| — | | | — | | | — | | | 20,470 | | | 20,470 |
Net realized loss on investments |
| — | |
| — | |
| — | |
| (4,173) | |
| (4,173) |
Net unrealized appreciation on investments |
| — | |
| — | |
| — | |
| 3,201 | |
| 3,201 |
Issuance of common stock under dividend reinvestment plan |
| 15,317 | |
| — | |
| 186 | |
| — | |
| 186 |
Distributions declared |
| — | |
| — | |
| — | |
| (16,987) | |
| (16,987) |
Reclassification of permanent tax differences (Note 2) |
| — | |
| — | |
| (239) | |
| 239 | |
| — |
Balance at December 31, 2019 |
| 15,563,290 | | $ | 16 | | $ | 226,660 | | $ | (42,621) | | $ | 184,055 |
Issuance of common stock, net of offering costs |
| 3,702,500 | | $ | 3 | | $ | 44,608 | | $ | — | | $ | 44,611 |
Net increase in net assets resulting from operations, net of excise tax: |
|
| |
|
| |
|
| |
|
| |
|
|
Net investment income, net of excise tax |
| — | |
| — | |
| — | |
| 20,749 | |
| 20,749 |
Net realized loss on investments |
| — | |
| — | |
| — | |
| (14,698) | |
| (14,698) |
Net unrealized appreciation on investments |
| — | |
| — | |
| — | |
| 313 | |
| 313 |
Issuance of common stock under dividend reinvestment plan |
| 20,566 | |
| — | |
| 241 | |
| — | |
| 241 |
Distributions declared |
| — | |
| — | |
| — | |
| (22,674) | |
| (22,674) |
Reclassification of permanent tax differences (Note 2) |
| — | |
| — | |
| (222) | |
| 222 | |
| — |
Balance at December 31, 2020 |
| 19,286,356 | | $ | 19 | | $ | 271,287 | | $ | (58,709) | | $ | 212,597 |
See Notes to Consolidated Financial Statements
97
Horizon Technology Finance Corporation and Subsidiaries
Consolidated Statements of Cash Flow
(In thousands)
| | For the year ended December 31, | |||||||
|
| 2020 |
| 2019 | | 2018 | |||
Cash flows from operating activities: |
| |
|
| |
|
| |
|
Net increase in net assets resulting from operations | | $ | 6,364 | | $ | 19,498 | | $ | 13,010 |
Adjustments to reconcile net increase in net assets resulting from operations to net cash used in operating activities: | |
| | |
| | |
|
|
Amortization of debt issuance costs | |
| 1,018 | |
| 726 | |
| 554 |
Net realized loss (gain) on investments | |
| 14,698 | |
| 4,173 | |
| (645) |
Net unrealized (appreciation) depreciation on investments | |
| (313) | |
| (3,201) | |
| 1,501 |
Purchase of investments | |
| (198,561) | |
| (200,832) | |
| (101,257) |
Principal payments received on investments | |
| 146,258 | |
| 129,190 | |
| 84,439 |
Proceeds from sale of investments | | | 8,335 | | | 4,578 | | | 4,453 |
Investment in controlled affiliate investments | |
| — | |
| (1,900) | |
| (13,262) |
Distributions from controlled affiliate investment | |
| — | |
| 715 | |
| 255 |
Dividends from controlled affiliate investment | |
| (118) | |
| (2,236) | |
| (255) |
Equity received in settlement of fee income | |
| (45) | |
| — | |
| (299) |
Warrants received in settlement of fee income | |
| (978) | |
| — | |
| (161) |
Changes in assets and liabilities: | |
|
| |
|
| |
|
|
Decrease (increase) in interest receivable | |
| 887 | |
| (679) | |
| 99 |
Increase in end-of-term payments | |
| (1,066) | |
| (885) | |
| (79) |
Decrease in unearned income | |
| (1,408) | |
| (1,586) | |
| (1,043) |
Increase in other assets | |
| (189) | |
| (16) | |
| (6) |
Increase in other accrued expenses | |
| 430 | |
| 330 | |
| 145 |
Increase in base management fee payable | |
| 44 | |
| 97 | |
| 43 |
(Decrease) increase in incentive fee payable | |
| (638) | |
| 622 | |
| 450 |
Net cash used in operating activities | |
| (25,282) | |
| (51,406) | |
| (12,058) |
Cash flows from financing activities: | |
|
| |
|
| |
|
|
Proceeds from issuance of common stock, net of offering costs | |
| 44,611 | |
| 47,101 | |
| — |
Proceeds from Asset-Backed Notes | |
| — | |
| 100,000 | |
| — |
Advances on credit facilities | |
| 80,250 | |
| 51,500 | |
| 52,500 |
Repayment of credit facilities | |
| (47,000) | |
| (125,000) | |
| (20,000) |
Debt issuance costs | | | (890) | | | (1,808) | | | (622) |
Distributions paid | |
| (21,316) | |
| (15,593) | |
| (13,668) |
Financing costs | |
| — | |
| — | |
| (155) |
Net cash provided by financing activities | |
| 55,655 | |
| 56,200 | |
| 18,055 |
Net increase in cash, cash equivalents and restricted cash | |
| 30,373 | |
| 4,794 | |
| 5,997 |
Cash, cash equivalents and restricted cash: | |
|
| |
|
| |
|
|
Beginning of period | |
| 17,385 | |
| 12,591 | |
| 6,594 |
End of period | | $ | 47,758 | | $ | 17,385 | | $ | 12,591 |
| | | | | | | | | |
Supplemental disclosure of cash flow information: |
| |
|
| |
|
| |
|
Cash paid for interest | | $ | 8,593 | | $ | 7,671 | | $ | 5,671 |
Supplemental non-cash investing and financing activities: | |
|
| |
|
| |
|
|
Warrant investments received and recorded as unearned income | | $ | 1,829 | | $ | 2,723 | | $ | 1,457 |
Distributions payable | | $ | 5,786 | | $ | 4,669 | | $ | 3,461 |
Acquisition of controlled affiliate investment | | $ | 16,498 | | $ | — | | $ | — |
End-of-term payments receivable | | $ | 4,203 | | $ | 3,900 | | $ | 3,015 |
Non-cash income | | $ | 5,124 | | $ | 3,584 | | | 3,124 |
| | | | | | | | | |
| | Year ended December 31, | |||||||
|
| 2020 |
| 2019 |
| 2018 | |||
Cash | | $ | 19,502 | | $ | 6,465 | | $ | 12,591 |
Investments in money market funds | |
| 27,199 | |
| 9,787 | |
| — |
Restricted investments in money market funds | |
| 1,057 | |
| 1,133 | |
| — |
Total cash, cash equivalents and restricted cash | | $ | 47,758 | | $ | 17,385 | | $ | 12,591 |
See Notes to Consolidated Financial Statements
98
Horizon Technology Finance Corporation and Subsidiaries
Consolidated Schedule of Investments
December 31, 2020
(In thousands)
|
| |
|
| | Principal |
| Cost of |
| Fair | |||
Portfolio Company (1)(3) | | Sector | | Type of Investment (4)(7)(9)(10) |
| Amount |
| Investments (6) |
| Value | |||
Non-Affiliate Investments — 161.6% (8) |
|
|
|
|
| |
|
| |
|
| |
|
Non-Affiliate Debt Investments — 154.2% (8) |
|
|
| |
|
| |
|
| |
| ||
Non-Affiliate Debt Investments — Life Science — 71.4% (8) |
|
|
| |
|
| |
|
| |
| ||
Castle Creek Pharmaceuticals Holdings, Inc.(2)(12) | | Biotechnology | | Term Loan (9.30% cash (Libor + 7.50%; Floor 9.30%), 5.00% ETP, Due 3/1/24) | | $ | 5,000 | | $ | 4,884 | | $ | 4,884 |
| | | | Term Loan (9.30% cash (Libor + 7.50%; Floor 9.30%), 5.00% ETP, Due 3/1/24) | | | 5,000 | | | 4,938 | | | 4,938 |
| | | | Term Loan (9.30% cash (Libor + 7.50%; Floor 9.30%), 5.00% ETP, Due 3/1/24) | | | 5,000 | | | 4,938 | | | 4,938 |
| | | | Term Loan (9.30% cash (Libor + 7.50%; Floor 9.30%), 5.00% ETP, Due 3/1/24) | | | 5,000 | | | 4,938 | | | 4,938 |
Celsion Corporation (2)(5)(12) |
| Biotechnology |
| Term Loan (9.63% cash (Libor + 7.63%; Floor 9.63%), 5.50% ETP, Due 4/1/23) | | | 2,500 | |
| 2,477 | | | 2,477 |
|
| |
| Term Loan (9.63% cash (Libor + 7.63%; Floor 9.63%), 5.50% ETP, Due 4/1/23) | |
| 2,500 | | | 2,525 | | | 2,483 |
Emalex Biosciences, Inc. (2)(12) | | Biotechnology | | Term Loan (9.75% cash (Libor + 7.90%; Floor 9.75%), 5.00% ETP, Due 12/1/23) | | | 2,500 | | | 2,354 | | | 2,354 |
| | | | Term Loan (9.75% cash (Libor + 7.90%; Floor 9.75%), 5.00% ETP, Due 12/1/23) | | | 2,500 | | | 2,457 | | | 2,457 |
LogicBio, Inc.(2)(5)(12) | | Biotechnology | | Term Loan (8.75% cash (Libor + 6.25%; Floor 8.75%), 4.50% ETP, Due 6/1/24) | | | 5,000 | | | 4,977 | | | 4,977 |
Provivi, Inc. (2)(12) | | Biotechnology | | Term Loan (9.50% cash (Libor + 8.50%; Floor 9.50%), 5.50% ETP, Due 12/1/24) | | | 5,000 | | | 4,763 | | | 4,763 |
| | | | Term Loan (9.50% cash (Libor + 8.50%; Floor 9.50%), 5.50% ETP, Due 12/1/24) | | | 5,000 | | | 4,912 | | | 4,912 |
Bardy Diagnostics, Inc. (2)(12) | | Medical Device | | Term Loan (8.90% cash (Libor + 7.00%; Floor 8.90%), 5.00% ETP, Due 9/1/24) | | | 5,000 | | | 4,943 | | | 4,943 |
| | | | Term Loan (8.90% cash (Libor + 7.00%; Floor 8.90%), 5.00% ETP, Due 9/1/24) | | | 5,000 | | | 4,943 | | | 4,943 |
| | | | Term Loan (8.90% cash (Libor + 7.00%; Floor 8.90%), 5.00% ETP, Due 9/1/24) | | | 1,000 | | | 989 | | | 989 |
| | | | Term Loan (8.90% cash (Libor + 7.00%; Floor 8.90%), 5.00% ETP, Due 9/1/24) | | | 1,000 | | | 989 | | | 989 |
| | | | Term Loan (8.90% cash (Libor + 7.00%; Floor 8.90%), 5.00% ETP, Due 9/1/24) | | | 1,000 | | | 989 | | | 989 |
| | | | Term Loan (8.90% cash (Libor + 7.00%; Floor 8.90%), 5.00% ETP, Due 9/1/24) | | | 1,000 | | | 989 | | | 989 |
| | | | Term Loan (8.90% cash (Libor + 7.00%; Floor 8.90%), 5.00% ETP, Due 9/1/24) | | | 1,000 | | | 989 | | | 989 |
Canary Medical Inc. (2)(12) | | Medical Device | | Term Loan (9.00% cash (Prime + 5.75%; Floor 9.00%), 7.00% ETP, Due 11/1/24) | | | 2,500 | | | 2,346 | | | 2,346 |
Ceribell, Inc. (2)(12) | | Medical Device | | Term Loan (8.25% cash (Libor + 6.70%; Floor 8.25%), 5.50% ETP, Due 10/1/24) | | | 5,000 | | | 4,878 | | | 4,878 |
| | | | Term Loan (8.25% cash (Libor + 6.70%; Floor 8.25%), 5.50% ETP, Due 10/1/24) | | | 5,000 | | | 4,942 | | | 4,942 |
Conventus Orthopaedics, Inc. (2)(12) |
| Medical Device |
| Term Loan (9.25% cash (Libor + 8.00%; Floor 9.25%), 10.36% ETP, Due 7/1/25) | |
| 5,086 | |
| 5,025 | |
| 5,025 |
|
| |
| Term Loan (9.25% cash (Libor + 8.00%; Floor 9.25%), 10.36% ETP, Due 7/1/25) | |
| 5,086 | |
| 5,025 | | | 5,025 |
Corinth Medtech, Inc. (2)(12) | | Medical Device | | Term Loan (8.50% cash (Prime + 5.25%; Floor 8.50%), 20.00% ETP, Due 4/1/22) | | | 2,500 | | | 2,475 | | | 2,475 |
| | | | Term Loan (8.50% cash (Prime + 5.25%; Floor 8.50%), 20.00% ETP, Due 4/1/22) | | | 2,500 | | | 2,475 | | | 2,475 |
CSA Medical, Inc. (2)(12) |
| Medical Device |
| Term Loan (10.00% cash (Libor + 8.20%; Floor 10.00%), 5.00% ETP, Due 1/1/24) | |
| 3,750 | |
| 3,704 | |
| 3,704 |
| | | | Term Loan (10.00% cash (Libor + 8.20%; Floor 10.00%), 5.00% ETP, Due 1/1/24) | | | 250 | | | 247 | | | 247 |
| | | | Term Loan (10.00% cash (Libor + 8.20%; Floor 10.00%), 5.00% ETP, Due 3/1/24) | | | 4,000 | | | 3,955 | | | 3,955 |
CVRx, Inc. (2)(12) | | Medical Device | | Term Loan (10.00% cash (Libor + 7.80%; Floor 10.00%), 3.50% ETP, Due 10/1/24) | | | 5,000 | | | 4,948 | | | 4,948 |
| | | | Term Loan (10.00% cash (Libor + 7.80%; Floor 10.00%), 3.50% ETP, Due 10/1/24) | | | 5,000 | | | 4,948 | | | 4,948 |
| | | | Term Loan (10.00% cash (Libor + 7.80%; Floor 10.00%), 3.50% ETP, Due 10/1/24) | | | 5,000 | | | 4,948 | | | 4,948 |
| | | | Term Loan (10.00% cash (Libor + 7.80%; Floor 10.00%), 3.50% ETP, Due 10/1/24) | | | 5,000 | | | 4,948 | | | 4,948 |
See Notes to Consolidated Financial Statements
99
Horizon Technology Finance Corporation and Subsidiaries
Consolidated Schedule of Investments
December 31, 2020
(In thousands)
|
| |
|
| | Principal |
| Cost of |
| Fair | |||
Portfolio Company (1)(3) | | Sector | | Type of Investment (4)(7)(9)(10) |
| Amount | | Investments (6) | | Value | |||
MacuLogix, Inc. (2)(12) |
| Medical Device |
| Term Loan (10.08% cash (Libor + 7.68%; Floor 10.08%), 5.50% ETP, Due 10/1/23) | |
| 7,500 | |
| 7,422 | |
| 7,147 |
|
| |
| Term Loan (10.08% cash (Libor + 7.68%; Floor 10.08%), 5.50% ETP, Due 10/1/23) | |
| 4,050 | |
| 4,008 | | | 3,859 |
Magnolia Medical Technologies, Inc. (2)(12) | | Medical Device | | Term Loan (9.75% cash (Prime + 5.00%; Floor 9.75%), 4.00% ETP, Due 3/1/25) | | | 5,000 | | | 4,937 | | | 4,937 |
| | | | Term Loan (9.75% cash (Prime + 5.00%; Floor 9.75%), 4.00% ETP, Due 3/1/25) | | | 5,000 | | | 4,937 | | | 4,937 |
| | | | Term Loan (9.75% cash (Prime + 5.00%; Floor 9.75%), 4.00% ETP, Due 3/1/25) | | | 5,000 | | | 4,926 | | | 4,926 |
| | | | Term Loan (9.75% cash (Prime + 5.00%; Floor 9.75%), 4.00% ETP, Due 3/1/25) | | | 5,000 | | | 4,926 | | | 4,926 |
Sonex Health, Inc. (2)(12) | | Medical Device | | Term Loan (9.25% cash (Prime + 6.00%; Floor 9.25%), 5.00% ETP, Due 6/1/24) | | | 2,500 | | | 2,379 | | | 2,379 |
| | | | Term Loan (9.25% cash (Prime + 6.00%; Floor 9.25%), 5.00% ETP, Due 6/1/24) | | | 2,500 | | | 2,460 | | | 2,460 |
| | | | Term Loan (9.25% cash (Prime + 6.00%; Floor 9.25%), 5.00% ETP, Due 6/1/24) | | | 2,500 | | | 2,460 | | | 2,460 |
Total Non-Affiliate Debt Investments — Life Science | | | |
|
| |
| 152,313 | |
| 151,847 | ||
Non-Affiliate Debt Investments — Technology — 71.2% (8) | | | | | | | | | | | | ||
Alula Holdings, Inc. (2)(12) | | Consumer-related Technologies | | Term Loan (10.00% cash (Prime + 6.75%; Floor 10.00%), 3.00% ETP, Due 1/1/25) | | | 5,000 | | | 4,904 | | | 4,904 |
| | | | Term Loan (10.00% cash (Prime + 6.75%; Floor 10.00%), 3.00% ETP, Due 1/1/25) | | | 5,000 | | | 4,932 | | | 4,932 |
| | | | Term Loan (10.00% cash (Prime + 6.75%; Floor 10.00%), 3.00% ETP, Due 1/1/25) | | | 3,000 | | | 2,959 | | | 2,959 |
Betabrand Corporation (2)(12) | | Consumer-related Technologies | | Term Loan (10.05% cash (Libor + 7.50%; Floor 10.05%), 5.75% ETP, Due 9/1/23) | | | 4,250 | | | 4,200 | | | 4,028 |
| | | | Term Loan (10.05% cash (Libor + 7.50%; Floor 10.05%), 5.75% ETP, Due 9/1/23) | | | 4,250 | | | 4,200 | | | 4,028 |
| | | | Term Loan (10.05% cash (Libor + 7.50%; Floor 10.05%), 5.75% ETP, Due 9/1/23) | | | 1,125 | | | 1,097 | | | 1,052 |
Getaround, Inc. (2)(12) | | Consumer-related Technologies | | Term Loan (10.50% cash (Prime + 7.25%; Floor 10.50%), 4.50% ETP, Due 12/1/24) | | | 10,000 | | | 9,625 | | | 9,625 |
| | | | Term Loan (10.50% cash (Prime + 7.25%; Floor 10.50%), 4.50% ETP, Due 12/1/24) | | | 4,000 | | | 3,851 | | | 3,851 |
| | | | Term Loan (10.50% cash (Prime + 7.25%; Floor 10.50%), 4.50% ETP, Due 12/1/24) | | | 4,000 | | | 3,851 | | | 3,851 |
Updater, Inc. (2)(12) | | Consumer-related Technologies | | Term Loan (11.50% cash (Prime + 5.75%; Floor 11.50%, Ceiling 14.00%),0.56% ETP, Due 12/20/24) | | | 5,000 | | | 4,948 | | | 4,948 |
| | | | Term Loan (11.50% cash (Prime + 5.75%; Floor 11.50%, Ceiling 14.00%), 0.56% ETP, Due 12/20/24) | | | 5,000 | | | 4,948 | | | 4,948 |
| | | | Term Loan (11.50% cash (Prime + 5.75%; Floor 11.50%, Ceiling 14.00%), 0.56% ETP, Due 12/20/24) | | | 10,000 | | | 9,896 | | | 9,896 |
CPG Beyond, Inc. (2)(12) | | Data Storage | | Term Loan (11.00% cash (Libor + 8.60%; Floor 11.00%), 2.00% ETP, Due 8/1/23) | | | 5,000 | | | 4,909 | | | 4,909 |
| | | | Term Loan (11.00% cash (Libor + 8.60%; Floor 11.00%), 2.00% ETP, Due 8/1/23) | | | 5,000 | | | 4,908 | | | 4,908 |
Silk, Inc. (2)(12) |
| Data Storage |
| Term Loan (10.65% cash (Libor + 8.40%; Floor 10.65%), 4.00% ETP, Due 1/1/23) |
| | 4,166 |
| | 4,125 |
| | 4,125 |
|
| |
| Term Loan (10.65% cash (Libor + 8.40%; Floor 10.65%), 4.00% ETP, Due 1/1/23) |
| | 4,166 |
| | 4,125 | | | 4,125 |
| | | | Term Loan (10.65% cash (Libor + 8.40%; Floor 10.65%), 4.00% ETP, Due 7/1/23) | | | 5,000 | | | 4,886 | | | 4,886 |
IgnitionOne, Inc. (2)(12)(13) |
| Internet and Media |
| Term Loan (10.38% cash (Libor + 10.23%; Floor 10.23%), 6.00% ETP, Due 4/1/22) |
| | 1,874 |
| | 1,789 |
| | 1,789 |
|
| |
| Term Loan (10.38% cash (Libor + 10.23%; Floor 10.23%), 6.00% ETP, Due 4/1/22) |
| | 1,874 |
| | 1,789 |
| | 1,789 |
See Notes to Consolidated Financial Statements
100
Horizon Technology Finance Corporation and Subsidiaries
Consolidated Schedule of Investments
December 31, 2020
(In thousands)
|
| |
|
| | Principal |
| Cost of |
| Fair | |||
Portfolio Company (1)(3) | | Sector | | Type of Investment (4)(7)(9)(10) |
| Amount | | Investments (6) | | Value | |||
|
| |
| Term Loan (10.38% cash (Libor + 10.23%; Floor 10.23%), 6.00% ETP, Due 4/1/22) |
| | 1,874 |
| | 1,722 |
| | 1,722 |
|
| |
| Term Loan (10.38% cash (Libor + 10.23%; Floor 10.23%), 6.00% ETP, Due 4/1/22) |
| | 1,874 |
| | 1,789 |
| | 1,789 |
The NanoSteel Company, Inc. (2)(12)(13) |
| Materials |
| Term Loan (11.00% cash (Libor + 8.50%; Floor 11.00%), 14.88% ETP, Due 6/1/22) |
| | 3,345 |
| | 3,303 |
| | 846 |
|
| |
| Term Loan (11.00% cash (Libor + 8.50%; Floor 11.00%), 14.88% ETP, Due 6/1/22) |
| | 3,345 |
| | 3,479 | | | 891 |
Liqid, Inc.(2)(12) | | Networking | | Term Loan (9.50% cash (Prime + 6.25%; Floor 9.50%), 4.00% ETP, Due 9/1/24) | | | 5,000 | | | 4,842 | | | 4,842 |
| | | | Term Loan (9.50% cash (Prime + 6.25%; Floor 9.50%), 4.00% ETP, Due 9/1/24) | | | 5,000 | | | 4,896 | | | 4,896 |
BriteCore Holdings, Inc. (2)(12) | | Software | | Term Loan (10.50% cash (Prime + 7.25%; Floor 10.50%), 4.00% ETP, Due 10/1/24) | | | 2,500 | | | 2,474 | | | 2,474 |
| | | | Term Loan (10.50% cash (Prime + 7.25%; Floor 10.50%), 4.00% ETP, Due 10/1/24) | | | 2,500 | | | 2,474 | | | 2,474 |
Keypath Education, LLC (2)(12) | | Software | | Term Loan (10.50% cash (Libor + 8.50%; Floor 10.50%), 2.50% ETP, Due 10/1/24) | | | 3,750 | | | 3,583 | | | 3,583 |
| | | | Term Loan (10.50% cash (Libor + 8.50%; Floor 10.50%), 2.50% ETP, Due 10/1/24) | | | 3,750 | | | 3,686 | | | 3,686 |
| | | | Term Loan (10.50% cash (Libor + 8.50%; Floor 10.50%), 2.50% ETP, Due 10/1/24) | | | 2,500 | | | 2,457 | | | 2,457 |
OutboundEngine, Inc. (2)(12) | | Software | | Term Loan (11.15% cash (Libor + 8.40%; Floor 11.15%), 3.63% ETP, Due 7/1/23) | | | 4,000 | | | 3,949 | | | 3,949 |
| | | | Term Loan (11.15% cash (Libor + 8.40%; Floor 11.15%), 3.63% ETP, Due 7/1/23) | | | 3,500 | | | 3,456 | | | 3,456 |
| | | | Term Loan (11.15% cash (Libor + 8.40%; Floor 11.15%), 3.63% ETP, Due 7/1/23) | | | 500 | | | 501 | | | 493 |
Revinate, Inc. (2)(12) | | Software | | Term Loan (9.50% cash (Libor + 7.00%; Floor 9.50%), 4.00% ETP, Due 11/1/23) | | | 4,000 | | | 4,034 | | | 3,819 |
| | | | Term Loan (9.50% cash (Libor + 7.00%; Floor 9.50%), 4.00% ETP, Due 11/1/23) | | | 1,000 | | | 930 | | | 895 |
| | | | Term Loan (9.50% cash (Libor + 7.00%; Floor 9.50%), 4.00% ETP, Due 11/1/23) | | | 5,000 | | | 4,946 | | | 4,761 |
Topia Mobility, Inc. (2)(12) | | Software | | Term Loan (10.00% cash (Prime + 6.75%; Floor 10.00%), 4.00% ETP, Due 9/1/24) | | | 5,000 | | | 4,824 | | | 4,824 |
| | | | Term Loan (10.00% cash (Prime + 6.75%; Floor 10.00%), 4.00% ETP, Due 9/1/24) | | | 5,000 | | | 4,902 | | | 4,902 |
xAd, Inc. (2)(12) |
| Software |
| Term Loan (10.00% cash (Libor + 8.70%; Floor 10.00%), 5.0% ETP, Due 1/1/22) |
| | 3,021 |
| | 2,991 |
| | 2,991 |
|
| |
| Term Loan (10.00% cash (Libor + 8.70%; Floor 10.00%), 5.0% ETP, Due 1/1/22) |
| | 3,021 |
| | 2,991 | | | 2,991 |
| | | | Term Loan (10.00% cash (Libor + 8.70%; Floor 10.00%), 5.0% ETP, Due 1/1/22) | | | 1,813 | | | 1,795 | | | 1,795 |
| | | | Term Loan (10.00% cash (Libor + 8.70%; Floor 10.00%), 5.0% ETP, Due 1/1/22) |
| | 1,208 |
| | 1,197 | | | 1,197 |
Total Non-Affiliate Debt Investments — Technology |
| |
| | |
| | 157,163 | | | 151,286 | ||
Non-Affiliate Debt Investments — Healthcare information and services — 11.6% (8) |
| |
|
| |
|
| |
| ||||
IDbyDNA, Inc.(2)(12) | | Diagnostics | | Term Loan (9.00% cash (Prime + 5.75%; Floor 9.00%), 5.50% ETP, Due 1/1/25) | | | 5,000 | | | 4,846 | | | 4,846 |
| | | | Term Loan (9.00% cash (Prime + 5.75%; Floor 9.00%), 5.50% ETP, Due 1/1/25) | | | 5,000 | | | 4,914 | | | 4,914 |
Kate Farms, Inc. (2)(12) |
| Other Healthcare |
| Term Loan (9.75% cash (Libor + 7.45%; Floor 9.75%), 5.00% ETP, Due 10/1/23) |
| | 5,000 |
| | 4,941 |
| | 4,941 |
| | | | Term Loan (9.75% cash (Libor + 7.45%; Floor 9.75%), 5.00% ETP, Due 10/1/23) | | | 5,000 | | | 4,941 | | | 4,941 |
| | | | Term Loan (9.75% cash (Libor + 7.45%; Floor 9.75%), 5.00% ETP, Due 10/1/23) | | | 2,500 | | | 2,466 | | | 2,466 |
|
| |
| Term Loan (9.75% cash (Libor + 7.45%; Floor 9.75%), 5.00% ETP, Due 10/1/23) |
| | 2,500 |
| | 2,466 | | | 2,466 |
Total Non-Affiliate Debt Investments — Healthcare information and services |
| |
|
| | 24,574 |
| | 24,574 | ||||
Total Non- Affiliate Debt Investments |
| | | |
| |
|
| | 334,050 |
| | 327,707 |
Non-Affiliate Warrant Investments — 6.6% (8) |
|
|
| |
|
| |
|
| |
| ||
Non-Affiliate Warrants — Life Science — 1.8% (8) |
|
|
| |
|
| |
|
| |
| ||
Alpine Immune Sciences, Inc. (5)(12) |
| Biotechnology |
| 4,632 Common Stock Warrants |
| | |
| | 122 |
| | — |
Castle Creek Pharmaceuticals, Inc. (2)(12) | | Biotechnology | | 2,428 Preferred Stock Warrants | | | | | | 144 | | | 180 |
Celsion Corporation (2)(5)(12) |
| Biotechnology |
| 295,053 Common Stock Warrants |
| | |
| | 65 |
| | 14 |
Corvium, Inc. (2)(12) | | Biotechnology | | 661,956 Preferred Stock Warrants | | | | | | 52 | | | 25 |
Emalex Biosciences, Inc. (2)(12) | | Biotechnology | | 73,602 Preferred Stock Warrants | | | | | | 107 | | | 135 |
LogicBio, Inc. (2)(5)(12) | | Biotechnology | | 7,843 Common Stock Warrants | | | | | | 7 | | | 3 |
Mustang Bio, Inc. (2)(5)(12) | | Biotechnology | | 252,161 Common Stock Warrants | | | | | | 146 | | | 220 |
Provivi, Inc. (2)(12) | | Biotechnology | | 123,457 Preferred Stock Warrants | | | | | | 147 | | | 426 |
Rocket Pharmaceuticals Corporation (5)(12) |
| Biotechnology |
| 7,051 Common Stock Warrants |
| | |
| | 17 |
| | 211 |
Strongbridge U.S. Inc. (2)(5)(12) |
| Biotechnology |
| 160,714 Common Stock Warrants |
| | |
| | 72 |
| | 60 |
vTv Therapeutics Inc. (2)(5)(12) |
| Biotechnology |
| 95,293 Common Stock Warrants |
| | |
| | 44 |
| | — |
See Notes to Consolidated Financial Statements
101
Horizon Technology Finance Corporation and Subsidiaries
Consolidated Schedule of Investments
December 31, 2020
(In thousands)
|
| |
|
| | |
| Cost of |
| Fair | |||
Portfolio Company (1)(3) | | Sector | | Type of Investment (4)(7)(9)(10) |
| | | Investments (6) | | Value | |||
AccuVein Inc. (2)(12) |
| Medical Device |
| 1,175 Preferred Stock Warrants |
| | |
| | 24 |
| | — |
Aerin Medical, Inc. (2)(12) |
| Medical Device |
| 1,818,183 Preferred Stock Warrants |
| | |
| | 65 |
| | 463 |
Bardy Diagnostics, Inc. (2)(12) | | Medical Device | | 346,154 Preferred Stock Warrants | | | | | | 56 | | | 1,180 |
Canary Medical Inc. (2)(12) | | Medical Device | | 7,292 Preferred Stock Warrants | | | | | | 54 | | | 54 |
Ceribell, Inc. (2)(12) | | Medical Device | | 117,521 Preferred Stock Warrants | | | | | | 50 | | | 63 |
Conventus Orthopaedics, Inc. (2)(12) |
| Medical Device |
| 6,313,788 Preferred Stock Warrants |
| | |
| | 148 |
| | 175 |
CSA Medical, Inc. (2)(12) |
| Medical Device |
| 1,375,727 Preferred Stock Warrants |
| | |
| | 153 |
| | 152 |
CVRx, Inc.(2)(12) | | Medical Device | | 750,000 Preferred Stock Warrants | | | | | | 76 | | | 76 |
MacuLogix, Inc. (2)(12) |
| Medical Device |
| 454,460 Preferred Stock Warrants |
| | |
| | 237 |
| | 120 |
Magnolia Medical Technologies, Inc. (2)(12) | | Medical Device | | 378,363 Preferred Stock Warrants | | | | | | 91 | | | 108 |
Meditrina, Inc. (2)(12) | | Medical Device | | 221,510 Preferred Stock Warrants | | | | | | 82 | | | 122 |
Sonex Health, Inc. (2)(12) | | Medical Device | | 484,250 Preferred Stock Warrants | | | | | | 77 | | | 77 |
VERO Biotech LLC (2)(12) |
| Medical Device |
| 408 Common Stock Warrants |
| | |
| | 53 |
| | 51 |
Total Non-Affiliate Warrants — Life Science | | | | | | | | | | 2,089 | | | 3,915 |
Non-Affiliate Warrants — Technology — 3.9% (8) | | | | | | | | | | | | ||
Intelepeer Holdings, Inc. (2)(12) |
| Communications |
| 3,078,084 Preferred and Common Stock Warrants |
| | |
| | 177 |
| | 186 |
PebblePost, Inc. (2)(12) |
| Communications |
| 598,850 Preferred Stock Warrants |
| | |
| | 93 |
| | 165 |
Alula Holdings, Inc. (2)(12) | | Consumer-related Technologies | | 20,000 Preferred Stock Warrants | | | | | | 93 | | | 93 |
Betabrand Corporation (2)(12) | | Consumer-related Technologies | | 261,198 Preferred Stock Warrants | | | | | | 106 | | | 13 |
Caastle, Inc. (2)(12) | | Consumer-related Technologies | | 268,591 Preferred Stock Warrants | | | | | | 68 | | | 822 |
Getaround, Inc. (2)(12) | | Consumer-related Technologies | | 605,468 Preferred Stock Warrants | | | | | | 433 | | | 433 |
Mohawk Group Holdings, Inc. (2)(5)(12) |
| Consumer-related Technologies | | 76,923 Common Stock Warrants |
| | |
| | 195 |
| | 312 |
Updater, Inc.(2)(12) | | Consumer-related Technologies | | 108,333 Common Stock Warrants | | | | | | 34 | | | 70 |
CPG Beyond, Inc. (2)(12) | | Data Storage | | 500,000 Preferred Stock Warrants | | | | | | 242 | | | 706 |
Silk, Inc. (2)(12) |
| Data Storage |
| 44,211,003 Preferred and Common Stock Warrants |
| | |
| | 234 |
| | 165 |
Global Worldwide LLC (2)(12) | | Internet and Media | | 245,810 Preferred Stock Warrants | | | | | | 75 | | | 9 |
Rocket Lawyer Incorporated (2)(12) |
| Internet and Media |
| 261,721 Preferred Stock Warrants |
| | |
| | 91 |
| | 88 |
Skillshare, Inc. (2)(12) | | Internet and Media | | 139,073 Preferred Stock Warrants | | | | | | 162 | | | 2,407 |
Liqid, Inc.(2)(12) | | Networking | | 243,942 Preferred Stock Warrants | | | | | | 164 | | | 164 |
Kinestral, Inc. (2)(12) |
| Power Management |
| 5,002,574 Preferred Stock Warrants |
| | |
| | 1,585 |
| | 1,326 |
Avalanche Technology, Inc. (2)(12) |
| Semiconductors |
| 6,753 Preferred and Common Stock Warrants |
| | |
| | 101 |
| | — |
Soraa, Inc. (2)(12) |
| Semiconductors |
| 203,616 Preferred Stock Warrants |
| | |
| | 80 |
| | — |
BriteCore Holdings, Inc. (2)(12) | | Software | | 12,857 Preferred Stock Warrants | | | | | | 5 | | | 11 |
Education Elements, Inc. (2)(12) |
| Software |
| 238,121 Preferred Stock Warrants |
| | |
| | 28 |
| | 27 |
Keypath Education, Inc.(2)(12) | | Software | | 900,000 Preferred Stock Warrants | | | | | | 158 | | | 349 |
Lotame Solutions, Inc. (2)(12) |
| Software |
| 288,115 Preferred Stock Warrants |
| | |
| | 22 |
| | 279 |
OutboundEngine, Inc. (2)(12) |
| Software |
| 620,000 Preferred Stock Warrants |
| | |
| | 80 |
| | 33 |
Revinate, Inc. (2)(12) | | Software | | 615,475 Preferred Stock Warrants | | | | | | 46 | | | 51 |
Riv Data Corp. (2)(12) |
| Software |
| 321,428 Preferred Stock Warrants |
| | |
| | 12 |
| | 291 |
SIGNiX, Inc. (12) |
| Software |
| 186,045 Preferred Stock Warrants |
| | |
| | 225 |
| | — |
Skyword, Inc. (12) |
| Software |
| 301,055 Preferred and Common Stock Warrants |
| | |
| | 48 |
| | 8 |
Topia Mobility, Inc. (2)(12) | | Software | | 3,049,607 Preferred Stock Warrants | | | | | | 138 | | | 174 |
Weblinc Corporation (2)(12) |
| Software |
| 195,122 Preferred Stock Warrants |
| | |
| | 42 |
| | — |
xAd, Inc. (2)(12) |
| Software |
| 4,343,348 Preferred Stock Warrants |
| | |
| | 177 |
| | 3 |
Total Non-Affiliate Warrants — Technology |
| | | | | | |
| | 4,914 |
| | 8,185 |
Non-Affiliate Warrants — Sustainability — 0.0% (8) |
|
|
| | |
| |
|
| |
| ||
Tigo Energy, Inc. (2)(12) |
| Energy Efficiency |
| 804,604 Preferred Stock Warrants |
| | |
| | 100 |
| | — |
Total Non-Affiliate Warrants — Sustainability |
| | | |
| | |
| | 100 |
| | — |
Non-Affiliate Warrants — Healthcare information and services — 0.9% (8) | | | | | | | | | | ||||
IDbyDNA, Inc.(2)(12) | | Diagnostics | | 363,082 Preferred Stock Warrants | | | | | | 90 | |
| 90 |
Kate Farms, Inc. (2)(12) | | Other Healthcare | | 82,965 Preferred Stock Warrants | | | | | | 101 | | | 1,171 |
Watermark Medical, Inc. (2)(12) |
| Other Healthcare |
| 27,373 Preferred Stock Warrants |
| | |
| | 74 |
| | — |
Medsphere Systems Corporation (2)(12) |
| Software |
| 7,097,792 Preferred Stock Warrants |
| | |
| | 62 |
| | 196 |
Ontrak, Inc. (2)(5)(12) | | Software | | 10,906 Common Stock Warrants | | | | | | 44 | | | 474 |
Total Non-Affiliate Warrants — Healthcare information and services | | |
| | |
| | 371 |
| | 1,931 | ||
Total Non-Affiliate Warrants |
| | | |
| | |
| | 7,474 |
| | 14,031 |
| | | | | | | | | | | | | |
Non-Affiliate Other Investments — 0.1% (8) |
|
|
|
|
| | |
| |
|
| |
|
ZetrOZ, Inc. (12) |
| Medical Device |
| Royalty Agreement |
| | |
| | 14 |
| | 200 |
Total Non-Affiliate Other Investments |
| |
| |
| | |
| | 14 |
| | 200 |
See Notes to Consolidated Financial Statements
102
Horizon Technology Finance Corporation and Subsidiaries
Consolidated Schedule of Investments
December 31, 2020
(In thousands)
|
| |
|
| | Principal |
| Cost of |
| Fair | |||
Portfolio Company (1)(3) | | Sector | | Type of Investment (4)(7)(9)(10) |
| Amount | | Investments (6) | | Value | |||
Non-Affiliate Equity — 0.7% (8) |
|
|
|
|
| | |
| |
|
| |
|
Sunesis Pharmaceuticals, Inc. (5) |
| Biotechnology |
| 1,308 Common Stock |
| | |
| | 83 |
| | 3 |
SnagAJob.com, Inc. (12) |
| Consumer-related Technologies |
| 82,974 Common Stock |
| | |
| | 9 |
| | 82 |
Zeta Global Holdings Corp. (2)(12) | | Internet and Media | | 18,405 Common Stock | | | | | | 240 | | | 240 |
Formetrix, Inc. (2)(12) |
| Materials |
| 74,286 Common Stock |
| | |
| | 75 |
| | — |
Clarabridge, Inc. (12) |
| Software |
| 17,142 Preferred Stock |
| | |
| | 13 |
| | 35 |
Lightspeed POS Inc. (5) | | Software | | 17,037 Common Stock | | | | | | 1,200 | | | 1,200 |
Total Non-Affiliate Equity |
| | | |
| | |
| | 1,620 |
| | 1,560 |
Total Non-Affiliate Portfolio Investment Assets |
| | | |
| | |
| $ | 343,158 |
| $ | 343,498 |
Non-controlled Affiliate Investments — 3.5% (8) |
|
|
|
|
| |
|
| | |
| | |
Non-controlled Affiliate Debt Investments — Technology — 2.7% (8) |
| |
|
| |
|
| |
| ||||
Decisyon, Inc. (12) |
| Software |
| Term Loan (12.50% cash (Libor + 12.308%; Floor 12.50%), 12.00% ETP, Due 6/1/21) | | $ | 1,182 | | $ | 1,181 | | $ | 1,181 |
|
| |
| Term Loan (12.50% cash (Libor + 12.308%; Floor 12.50%), 12.00% ETP, Due 6/1/21) | |
| 646 | |
| 626 | | | 626 |
|
| | | Term Loan (12.02% cash, Due 6/1/21) | | | 239 | | | 227 | | | 227 |
|
| |
| Term Loan (12.03% cash, Due 6/1/21) | |
| 238 | |
| 228 | | | 228 |
|
| |
| Term Loan (12.24% cash, Due 6/1/21) | |
| 705 | |
| 685 | | | 685 |
|
| |
| Term Loan (13.08% cash, Due 6/1/21) | |
| 276 | |
| 276 | | | 276 |
|
| |
| Term Loan (13.10% cash, Due 6/1/21) | |
| 184 | |
| 183 | | | 183 |
StereoVision Imaging, Inc. (2)(12) |
| Software |
| Term Loan (8.50% Cash (Libor + 7.03%; Floor 8.50%), 15.63% ETP, Due 1/1/22) | |
| 2,783 | |
| 2,382 | |
| 2,382 |
Total Non-controlled Affiliate Debt Investments — Technology |
| | |
|
| |
| 5,788 | |
| 5,788 | ||
| | | | | | | | | | | | | |
Non-controlled Affiliate Warrants — Technology — 0.0% (8) |
|
| |
|
| |
|
| |
|
| ||
Decisyon, Inc. (12) |
| Software |
| 82,967 Common Stock Warrants | |
| | |
| 46 | |
| — |
Total Non-controlled Affiliate Warrants — Technology |
| | |
|
| |
| 46 | |
| — | ||
Non-controlled Affiliate Equity — Technology — 0.8% (8) | |
| | |
| | | | |
| | |
|
Decisyon, Inc. (12) |
| Software | | 72,638,663 Preferered and Common Stock | | | |
| | 229 |
| | 120 |
StereoVision Imaging, Inc. (2)(12) |
| Software | | 1,943,572 Preferred and Common Stock | | | |
| | 791 |
| | 1,639 |
Total Non-controlled Affiliate Equity |
| | |
| | | |
| | 1,020 |
| | 1,759 |
Total Non-controlled Affiliate Portfolio Investment Assets | | | | | | | |
| $ | 6,854 |
| $ | 7,547 |
| | | | | | | | | | | | | |
Controlled Affiliate Investments — 0.7% (8) | | | | | |
|
|
|
|
|
| ||
Controlled Affiliate Other Investments — Biotechnology — 0.7% (8) | | | | | |
|
|
|
|
|
| ||
HESP LLC (2)(12)(14) | | Biotechnology | | Other Investment | | | | | $ | 1,500 | | $ | 1,500 |
Total Controlled Affiliate Other Investments | | | | | | | |
|
| 1,500 |
|
| 1,500 |
Total Controlled Affiliate Portfolio Investment Assets | | | |
| $ | 1,500 |
| $ | 1,500 | ||||
| | | | | | | | | | | | | |
Total Portfolio Investment Assets — 165.8% (8) | | | | | | | |
| $ | 351,512 |
| $ | 352,545 |
| | | | | | | | | | | | | |
Short Term Investments — Unrestricted Investments — 12.8% (8) | | | | | | | | | | | | | |
US Bank Money Market Deposit Account | | | | | | | | | $ | 27,199 | | $ | 27,199 |
Total Short Term Investments —Unrestricted Investments | | | | | | | | | $ | 27,199 |
| $ | 27,199 |
| | | | | | | | | | | | | |
Short Term Investments — Restricted Investments—0.5% (8) | | | | | | | | | | | | | |
US Bank Money Market Deposit Account | | | | | | | | | $ | 1,057 | | $ | 1,057 |
Total Short Term Investments —Restricted Investments | | | | | | | | | $ | 1,057 |
| $ | 1,057 |
| (1) | All investments of the Company are in entities which are organized under the laws of the United States and have a principal place of business in the United States. |
| (2) | Has been pledged as collateral under the revolving credit facility (the “Key Facility”) with KeyBank National Association (“Key”), the Note Funding Agreement (the “NYL Facility”) with several entities owned or affiliated with New York Life Insurance Company (“NYL Noteholders”) and/or the term debt securitization in connection with which an affiliate of the Company made an offering of $100.0 million in aggregate principal amount of fixed rate asset-backed notes that were issued in conjunction with the $160.0 million securitization of secured loans the Company completed on August 13, 2019 (“the Asset-Backed Notes”). |
See Notes to Consolidated Financial Statements
103
| (3) | All non-affiliate investments are investments in which the Company owns less than 5% of the voting securities of the portfolio company. All non-controlled affiliate investments are investments in which the Company owns 5% or more of the voting securities of the portfolio company but not more than 25% of the voting securities of the portfolio company. All controlled affiliate investments are investments in which the Company owns more than 25% of the portfolio company’s outstanding voting securities or has the power to exercise control over management or policies of such portfolio company (including through a management agreement |
| (4) | All interest is payable in cash due monthly in arrears, unless otherwise indicated, and applies only to the Company’s debt investments. Interest rate is the annual interest rate on the debt investment and does not include end-of-term payments (“ETPs”), and any additional fees related to the investments, such as deferred interest, commitment fees or prepayment fees. Debt investments are at variable rates for the term of the debt investment, unless otherwise indicated. All debt investments based on the London InterBank Offered Rate (“LIBOR”) are based on one-month LIBOR. For each debt investment, the current interest rate in effect as of December 31, 2020 is provided. |
| (5) | Portfolio company is a public company. |
| (6) | For debt investments, represents principal balance less unearned income. |
| (7) | Warrants, Equity and Other Investments are non-income producing. |
| (8) | Value as a percent of net assets. |
| (9) | The Company did not have any non-qualifying assets under Section 55(a) of the Investment Company Act of 1940, as amended (the “1940 Act) as of December 31, 2020. Under the 1940 Act, the Company may not acquire any non-qualifying assets unless, at the time the acquisition is made, qualifying assets represent at least 70% of the Company’s total assets. |
| (10) | ETPs are contractual fixed-interest payments due in cash at the maturity date of the applicable debt investment, including upon any prepayment, and are a fixed percentage of the original principal balance of the debt investments unless otherwise noted. Interest will accrue during the life of the debt investment on each ETP and will be recognized as non-cash income until it is actually paid. Therefore, a portion of the incentive fee the Company may pay its Advisor will be based on income that the Company has not yet received in cash. |
| (11) | Debt investment has a payment-in-kind (“PIK”) feature. |
| (12) | The fair value of the investment was valued using significant unobservable inputs. |
| (13) | Debt investment is on non-accrual status as of December 31, 2020. |
| (14) | On July 8, 2020, Espero BioPharma, Inc. and its affiliates, Jacksonville Pharmaceuticals, Inc. and Espero Pharmaceuticals, Inc. (collectively, “Espero”) assigned substantially all of their assets to their respective assignment estates and respectively appointed PSE (ABC), LLC, PS PJAX (ABC), LLC, and PPSE (ABC), LLC (collectively, “Espero ABC”) to administer their respective estates and to facilitate the orderly sale and liquidation of their property and assets. On October 6, 2020, the Court of Chancery of the State of Delaware approved the transfer of the assets of Espero to the Company and Credit II or their designees in consideration for the Company and Credit II’s credit bid at auction of $7.0 million. On October 22, 2020, Espero ABC transferred the assets of Espero to HESP LLC, a Delaware limited liability company, wholly owned by the Company. |
See Notes to Consolidated Financial Statements
104
Horizon Technology Finance Corporation and Subsidiaries
Consolidated Schedule of Investments
December 31, 2019
(In thousands)
|
| |
| |
| Principal |
| | Cost of |
| Fair | ||
Portfolio Company (1)(3) |
| Sector |
| Type of Investment (4)(7)(9)(10) |
| Amount |
| | Investments (6) |
| Value | ||
Non-Affiliate Investments — 160.0% (8) |
|
|
|
|
| |
|
| |
|
| |
|
Non-Affiliate Debt Investments — 153.5% (8) |
|
|
|
|
| |
|
| |
|
| |
|
Non-Affiliate Debt Investments — Life Science — 55.9% (8) |
|
|
| |
|
| |
|
| |
| ||
Celsion Corporation (2)(5)(12) |
| Biotechnology |
| Term Loan (9.98% cash (Libor + 7.63%; Floor 9.63%), 4.00% ETP, Due 7/1/22) | | $ | 2,500 | | $ | 2,464 | | $ | 2,464 |
|
| |
| Term Loan (9.98% cash (Libor + 7.63%; Floor 9.63%), 4.00% ETP, Due 7/1/22) | |
| 2,500 | |
| 2,464 | | | 2,464 |
Encore Dermatology, Inc. (2)(12) | | Biotechnology | | Term Loan (10.00% cash (Libor + 7.50%; Floor 10.00%), 3.00% ETP, Due 4/1/23) | | | 5,000 | | | 4,929 | | | 4,929 |
| | | | Term Loan (10.00% cash (Libor + 7.50%; Floor 10.00%), 3.00% ETP, Due 4/1/23) | | | 5,000 | | | 4,929 | | | 4,929 |
Espero BioPharma, Inc. (2)(12) |
| Biotechnology |
| Term Loan (12.00% cash (Libor + 9.25%; Floor 12.00%), 5.10% ETP, Due 3/31/20) (11) | |
| 5,053 | |
| 5,053 | |
| 5,053 |
| | | | Term Loan (12.00% cash (Libor + 9.25%; Floor 12.00%), 5.10% ETP, Due 3/31/20) (11) | | | 4,802 | | | 4,802 | | | 4,802 |
LogicBio, Inc.(2)(5)(12) | | Biotechnology | | Term Loan (8.75 % cash (Libor + 6.25%; Floor 8.75%), 4.50% ETP, Due 6/1/24 | | | 5,000 | | | 4,970 | | | 4,970 |
Mustang Bio, Inc. (2)(5)(12) | | Biotechnology | | Term Loan (9.00% cash (Libor + 6.50%; Floor 9.00%), 5.00% ETP, Due 10/1/22) | | | 5,000 | | | 4,827 | | | 4,827 |
| | | | Term Loan (9.00% cash (Libor + 6.50%; Floor 9.00%), 5.00% ETP, Due 10/1/22) | | | 5,000 | | | 4,924 | | | 4,924 |
vTv Therapeutics Inc. (2)(5)(12) |
| Biotechnology |
| Term Loan (11.69% cash (Libor + 10.00%; Floor 10.50%), 6.00% ETP, Due 5/1/20) | |
| 1,042 | |
| 1,034 | |
| 1,034 |
|
| |
| Term Loan (11.69% cash (Libor + 10.00%; Floor 10.50%), 6.00% ETP, Due 10/1/20) | |
| 1,406 | |
| 1,393 | | | 1,393 |
Titan Pharmaceuticals, Inc. (2)(5)(12) |
| Drug Delivery |
| Term Loan (10.09% cash (Libor + 8.40%; Floor 9.50%), 5.00% ETP, Due 6/1/22) | |
| 1,600 | |
| 1,533 | |
| 1,533 |
Conventus Orthopaedics, Inc. (2)(12) |
| Medical Device |
| Term Loan (9.69% cash (Libor + 8.00%; Floor 9.25%), 8.33% ETP, Due 7/1/23) | |
| 5,311 | |
| 5,233 | |
| 5,233 |
|
| |
| Term Loan (9.69% cash (Libor + 8.00%; Floor 9.25%), 8.33% ETP, Due 7/1/23) | |
| 5,311 | |
| 5,233 | | | 5,233 |
CSA Medical, Inc. (2)(12) |
| Medical Device |
| Term Loan (10.00% cash (Libor + 8.20%; Floor 10.00%), 5.00% ETP, Due 1/1/24) | |
| 3,750 | |
| 3,637 | |
| 3,637 |
| | | | Term Loan (10.00% cash (Libor + 8.20%; Floor 10.00%), 5.00% ETP, Due 1/1/24) | | | 250 | | | 246 | | | 246 |
CVRx, Inc. (2)(12) | | Medical Device | | Term Loan (10.00% cash (Libor + 7.80%; Floor 10.00%), 3.50% ETP, Due 4/1/24) | | | 5,000 | | | 4,934 | | | 4,934 |
| | | | Term Loan (10.00% cash (Libor + 7.80%; Floor 10.00%), 3.50% ETP, Due 4/1/24) | | | 5,000 | | | 4,934 | | | 4,934 |
| | | | Term Loan (10.00% cash (Libor + 7.80%; Floor 10.00%), 3.50% ETP, Due 4/1/24) | | | 5,000 | | | 4,934 | | | 4,934 |
| | | | Term Loan (10.00% cash (Libor + 7.80%; Floor 10.00%), 3.50% ETP, Due 4/1/24) | | | 5,000 | | | 4,934 | | | 4,934 |
Lantos Technologies, Inc. (2)(12) |
| Medical Device |
| Term Loan (10.12% cash (Libor + 8.43%; Floor 10.00%), 10.00% ETP, Due 4/1/21) | |
| 3,433 | |
| 3,143 | |
| 3,143 |
MacuLogix, Inc. (2)(12) |
| Medical Device |
| Term Loan (10.08% cash (Libor + 7.68%; Floor 10.08%), 4.00% ETP, Due 10/1/23) | |
| 7,500 | |
| 7,356 | |
| 7,356 |
|
| |
| Term Loan (10.08% cash (Libor + 7.68%; Floor 10.08%), 4.00% ETP, Due 10/1/23) | |
| 4,050 | |
| 3,993 | | | 3,993 |
Meditrina, Inc. (2)(12) | | Medical Device | | Term Loan (9.70% cash (Libor + 7.10%; Floor 9.70%), 4.00% ETP, Due 5/1/20) | | | 3,000 | | | 2,966 | | | 2,966 |
VERO Biotech LLC (2)(12) |
| Medical Device |
| Term Loan (9.69% cash (Libor + 8.00%; Floor 9.25%), 5.00% ETP, Due 1/1/22) | |
| 4,000 | |
| 3,967 | |
| 3,967 |
|
| |
| Term Loan (10.35% cash (Libor + 8.00%; Floor 9.25%), 5.00% ETP, Due 1/1/22) | |
| 4,000 | |
| 3,967 | | | 3,967 |
Total Non-Affiliate Debt Investments — Life Science |
| | | | |
|
| |
| 102,799 | |
| 102,799 |
Non-Affiliate Debt Investments — Technology — 84.8% (8) | | | | | | | | | | | | ||
Audacy Corporation (2)(12)(15) |
| Communications |
| Term Loan (9.59% cash (Libor + 7.90%; Floor 9.50%), 5.00% ETP, Due 7/1/22) | |
| 3,641 | |
| 3,580 | |
| 1,300 |
| | | | Term Loan (9.59% cash (Libor + 7.90%; Floor 9.50%), Due 2/1/20) | | | 550 | | | 550 | | | 200 |
Betabrand Corporation (2)(12) | | Consumer-related Technologies | | Term Loan (10.05% cash (Libor + 7.50%; Floor 10.05%), 4.50% ETP, Due 9/1/23) | | | 4,250 | | | 4,115 | | | 4,115 |
| | | | Term Loan (10.05% cash (Libor + 7.50%; Floor 10.05%), 4.50% ETP, Due 9/1/23) | | | 4,250 | | | 4,182 | | | 4,182 |
Mohawk Group Holdings, Inc. (2)(5)(12) |
| Consumer-related Technologies |
| Term Loan (9.90% cash (Libor + 7.40%; Floor 9.90%), 4.00% ETP, Due 1/1/23) |
| | 5,000 |
| | 4,914 |
| | 4,914 |
| | | | Term Loan (9.90% cash (Libor + 7.40%; Floor 9.90%), 4.00% ETP, Due 1/1/23) | | | 5,000 | | | 4,914 | | | 4,914 |
|
| |
| Term Loan (9.90% cash (Libor + 7.40%; Floor 9.90%), 4.00% ETP, Due 1/1/23) |
| | 5,000 | | | 4,914 | | | 4,914 |
Updater, Inc.(2)(12) | | Consumer-related Technologies | | Term Loan (11.50% cash (Prime + 5.75%; Floor 11.50%, Ceiling 14.00%),0.56% ETP, Due 12/20/24) | | | 5,000 | | | 4,935 | | | 4,935 |
| | | | Term Loan (11.50% cash (Prime + 5.75%; Floor 11.50%, Ceiling 14.00%), 0.56% ETP, Due 12/20/24) | | | 5,000 | | | 4,935 | | | 4,935 |
See Notes to Consolidated Financial Statements
105
Horizon Technology Finance Corporation and Subsidiaries
Consolidated Schedule of Investments
December 31, 2019
(In thousands)
|
| |
|
| | Principal |
| Cost of |
| Fair | |||
Portfolio Company (1)(3) | | Sector | | Type of Investment (4)(7)(9)(10) |
| Amount | | Investments (6) | | Value | |||
| | | | Term Loan (11.50% cash (Prime + 5.75%; Floor 11.50%, Ceiling 14.00%), 0.56% ETP, Due 12/20/24) | | | 10,000 | | | 9,870 | | | 9,870 |
Canara, Inc. (2)(12) | | Data Storage | | Term Loan (11.00% cash (Libor + 8.60%; Floor 11.00%), 1.00% ETP, Due 2/1/23) | | | 5,000 | | | 4,868 | | | 4,868 |
| | | | Term Loan (11.00% cash (Libor + 8.60%; Floor 11.00%), 1.00% ETP, Due 2/1/23) | | | 5,000 | | | 4,868 | | | 4,868 |
Kaminario, Inc. (2)(12) |
| Data Storage |
| Term Loan (10.65% cash (Libor + 8.40%; Floor 10.65%), 3.00% ETP, Due 1/1/23) |
| | 5,000 |
| | 4,938 |
| | 4,938 |
|
| |
| Term Loan (10.65% cash (Libor + 8.40%; Floor 10.65%), 3.00% ETP, Due 1/1/23) |
| | 5,000 |
| | 4,938 | | | 4,938 |
| | | | Term Loan (10.65% cash (Libor + 8.40%; Floor 10.65%), 3.00% ETP, Due 1/1/23) | | | 5,000 | | | 4,840 | | | 4,840 |
IgnitionOne, Inc. (2)(12) |
| Internet and Media |
| Term Loan (11.92% cash (Libor + 10.23%; Floor 10.23%), 2.00% ETP, Due 4/1/22) |
| | 3,000 |
| | 2,911 |
| | 2,911 |
|
| |
| Term Loan (11.92% cash (Libor + 10.23%; Floor 10.23%), 2.00% ETP, Due 4/1/22) |
| | 3,000 |
| | 2,911 |
| | 2,911 |
|
| |
| Term Loan (11.92% cash (Libor + 10.23%; Floor 10.23%), 2.00% ETP, Due 4/1/22) |
| | 3,000 |
| | 2,812 |
| | 2,812 |
|
| |
| Term Loan (11.92% cash (Libor + 10.23%; Floor 10.23%), 2.00% ETP, Due 4/1/22) |
| | 3,000 |
| | 2,911 |
| | 2,911 |
Skillshare, Inc.(2)(12) | | Internet and Media | | Term Loan (9.50% cash (Libor + 7.50%; Floor 9.50%), 5.00% ETP, Due 1/1/25) | | | 3,000 | | | 2,747 | | | 2,747 |
| | | | Term Loan (9.50% cash (Libor + 7.50%; Floor 9.50%), 5.00% ETP, Due 1/1/25) | | | 3,000 | | | 2,946 | | | 2,946 |
| | | | Term Loan (9.50% cash (Libor + 7.50%; Floor 9.50%), 5.00% ETP, Due 1/1/25) | | | 3,000 | | | 2,946 | | | 2,946 |
Verve Wireless, Inc. (2)(12) |
| Internet and Media |
| Term Loan (15.80% cash (Libor + 8.80%; Floor 10.80%), 3.33% ETP, Due 9/1/21) |
| | 2,400 |
| | 2,320 |
| | 2,320 |
The NanoSteel Company, Inc. (2)(12) |
| Materials |
| Term Loan (11.00% cash (Libor + 8.50%; Floor 11.00%), 4.00% ETP, Due 6/1/22) |
| | 4,250 |
| | 4,205 |
| | 4,205 |
|
| |
| Term Loan (11.00% cash (Libor + 8.50%; Floor 11.00%), 4.00% ETP, Due 6/1/22) |
| | 4,250 |
| | 4,205 | | | 4,205 |
Kinestral Technologies, Inc.(2)(12) | | Power Management | | Term Loan (9.95% cash (Libor + 7.75%; Floor 9.95%), 5.00% ETP, Due 12/1/22) | | | 6,000 | | | 5,442 | | | 5,442 |
| | | | Term Loan (9.95% cash (Libor + 7.75%; Floor 9.95%), 5.00% ETP, Due 12/1/22) | | | 6,000 | | | 5,765 | | | 5,765 |
Bridge2 Solutions, LLC. (2)(12) |
| Software |
| Term Loan (11.00% cash (Libor + 8.40%; Floor 11.00%), 2.00% ETP, Due 6/1/23) |
| | 6,250 |
| | 6,120 |
| | 6,120 |
|
| |
| Term Loan (11.00% cash (Libor + 8.40%; Floor 11.00%), 2.00% ETP, Due 6/1/23) |
| | 6,250 |
| | 6,120 | | | 6,120 |
| | | | Term Loan (11.00% cash (Libor + 8.40%; Floor 11.00%), 2.00% ETP, Due 9/1/23) | | | 2,000 | | | 1,926 | | | 1,926 |
New Signature US, Inc. (2)(12)(13) |
| Software |
| Term Loan (10.50% cash (Libor + 8.50%; Floor 10.50%), 3.50% ETP, Due 7/1/22) |
| | 2,750 |
| | 2,721 |
| | 2,721 |
| | | | Term Loan (10.50% cash (Libor + 8.50%; Floor 10.50%), 3.50% ETP, Due 2/1/23) | | | 1,000 | | | 987 | | | 987 |
OutboundEngine, Inc. (2)(12) | | Software | | Term Loan (11.15% cash (Libor + 8.40%; Floor 11.15%), 3.00% ETP, Due 7/1/23) | | | 4,000 | | | 3,929 | | | 3,929 |
| | | | Term Loan (11.15% cash (Libor + 8.40%; Floor 11.15%), 3.00% ETP, Due 7/1/23) | | | 3,500 | | | 3,438 | | | 3,438 |
Revinate, Inc. (2)(12) | | Software | | Term Loan (9.50% cash (Libor + 7.00%; Floor 9.50%), 4.00% ETP, Due 6/1/23) | | | 1,000 | | | 928 | | | 928 |
| | | | Term Loan (9.50% cash (Libor + 7.00%; Floor 9.50%), 4.00% ETP, Due 11/1/23) | | | 5,000 | | | 4,932 | | | 4,932 |
SIGNiX, Inc. (12)(15) |
| Software |
| Term Loan (12.69% cash (Libor + 11.00%; Floor 11.50%), 8.67% ETP, Due 2/1/20) |
| | 1,571 |
| | 1,569 |
| | 500 |
xAd, Inc. (2)(12) |
| Software |
| Term Loan (10.39% cash (Libor + 8.70%; Floor 10.00%), 4.75% ETP, Due 11/1/21) |
| | 4,583 |
| | 4,533 |
| | 4,533 |
|
| |
| Term Loan (10.39% cash (Libor + 8.70%; Floor 10.00%), 4.75% ETP, Due 11/1/21) |
| | 4,583 |
| | 4,533 | | | 4,533 |
| | | | Term Loan (10.39% cash (Libor + 8.70%; Floor 10.00%), 4.75% ETP, Due 11/1/21) | | | 2,750 | | | 2,720 | | | 2,720 |
| | | | Term Loan (10.39% cash (Libor + 8.70%; Floor 10.00%), 4.75% ETP, Due 11/1/21) |
| | 1,833 |
| | 1,813 | | | 1,813 |
Total Non-Affiliate Debt Investments — Technology |
| |
| |
| | |
| | 159,751 | | | 156,052 |
Non-Affiliate Debt Investments — Healthcare information and services — 12.8% (8) |
| |
|
| |
|
| |
| ||||
Kate Farms, Inc. (2)(12) |
| Other Healthcare |
| Term Loan (9.75% cash (Libor + 7.45%; Floor 9.75%), 5.00% ETP, Due 10/1/23) |
| | 5,000 |
| | 4,852 |
| | 4,852 |
|
| |
| Term Loan (9.75% cash (Libor + 7.45%; Floor 9.75%), 5.00% ETP, Due 10/1/23) |
| | 5,000 |
| | 4,919 | | | 4,919 |
See Notes to Consolidated Financial Statements
106
Horizon Technology Finance Corporation and Subsidiaries
Consolidated Schedule of Investments
December 31, 2019
(In thousands)
|
| |
| |
| Principal |
| Cost of |
| Fair | |||
Portfolio Company (1)(3) | | Sector | | Type of Investment (4)(7)(9)(10) | | Amount | | Investments (6) | | Value | |||
HealthEdge Software, Inc. (2)(12) |
| Software |
| Term Loan (9.94% cash (Libor + 8.25%; Floor 9.25%), 3.00% ETP, Due 7/1/22) |
| | 3,571 |
| | 3,533 |
| | 3,533 |
|
| |
| Term Loan (9.94% cash (Libor + 8.25%; Floor 9.25%), 3.00% ETP, Due 1/1/23) |
| | 3,214 |
| | 3,180 | | | 3,180 |
|
| |
| Term Loan (9.94% cash (Libor + 8.25%; Floor 9.25%), 3.00% ETP, Due 4/1/23) |
| | 3,482 |
| | 3,444 | | | 3,444 |
|
| |
| Term Loan (9.94% cash (Libor + 8.25%; Floor 9.25%), 3.00% ETP, Due 1/1/24) |
| | 3,750 |
| | 3,707 | | | 3,707 |
Total Non-Affiliate Debt Investments — Healthcare information and services |
| |
|
| | 23,635 |
| | 23,635 | ||||
Total Non- Affiliate Debt Investments |
| | | |
| |
|
| | 286,185 |
| | 282,486 |
Non-Affiliate Warrant Investments — 5.9% (8) |
|
|
|
|
| |
|
| |
|
| |
|
Non-Affiliate Warrants — Life Science — 0.7% (8) |
|
|
|
|
| |
|
| |
|
| |
|
Alpine Immune Sciences, Inc. (5)(12) |
| Biotechnology |
| 4,632 Common Stock Warrants |
| | |
| | 122 |
| | — |
Celsion Corporation (2)(5)(12) |
| Biotechnology |
| 95,057 Common Stock Warrants |
| | |
| | 65 |
| | 6 |
Corvium, Inc. (2)(12) | | Biotechnology | | 661,956 Preferred Stock Warrants | | | | | | 52 | | | 20 |
Encore Dermatology, Inc. (2)(12) | | Biotechnology | | 1,510,878 Preferred Stock Warrants | | | | | | 113 | | | — |
Espero BioPharma, Inc. (2)(5)(12) |
| Biotechnology |
| 1,507,917 Common Stock Warrants |
| | |
| | 184 |
| | — |
LogicBio, Inc. (2)(5)(12) | | Biotechnology | | 7,843 Common Stock Warrants | | | | | | 8 | | | 3 |
Mustang Bio, Inc. (2)(5)(12) | | Biotechnology | | 216,138 Common Stock Warrants | | | | | | 140 | | | 222 |
Rocket Pharmaceuticals Corporation (5)(12) |
| Biotechnology |
| 7,051 Common Stock Warrants |
| | |
| | 17 |
| | 16 |
Palatin Technologies, Inc. (2)(5)(12) |
| Biotechnology |
| 274,725 Common Stock Warrants |
| | |
| | 20 |
| | 16 |
Revance Therapeutics, Inc. (5)(12) |
| Biotechnology |
| 34,113 Common Stock Warrants |
| | |
| | 68 |
| | 77 |
Strongbridge U.S. Inc. (2)(5)(12) |
| Biotechnology |
| 160,714 Common Stock Warrants |
| | |
| | 72 |
| | 25 |
Sunesis Pharmaceuticals, Inc. (5)(12) |
| Biotechnology |
| 2,050 Common Stock Warrants |
| | |
| | 5 |
| | — |
vTv Therapeutics Inc. (2)(5)(12) |
| Biotechnology |
| 95,293 Common Stock Warrants |
| | |
| | 44 |
| | — |
Titan Pharmaceuticals, Inc. (2)(5)(12) |
| Drug Delivery |
| 373,333 Common Stock Warrants |
| | |
| | 95 |
| | — |
AccuVein Inc. (2)(12) |
| Medical Device |
| 1,174,881 Preferred Stock Warrants |
| | |
| | 24 |
| | 29 |
Aerin Medical, Inc. (2)(12) |
| Medical Device |
| 1,818,183 Preferred Stock Warrants |
| | |
| | 66 |
| | 69 |
Conventus Orthopaedics, Inc. (2)(12) |
| Medical Device |
| 1,145,000 Preferred Stock Warrants |
| | |
| | 149 |
| | 158 |
CSA Medical, Inc. (12) |
| Medical Device |
| 1,260,345 Preferred Stock Warrants |
| | |
| | 147 |
| | 146 |
CVRx, Inc.(2)(12) | | Medical Device | | 750,000 Preferred Stock Warrants | | | | | | 76 | | | 84 |
Lantos Technologies, Inc. (2)(12) |
| Medical Device |
| 560,832 Preferred Stock Warrants |
| | |
| | 253 |
| | 44 |
MacuLogix, Inc. (2)(12) |
| Medical Device |
| 454,460 Preferred Stock Warrants |
| | |
| | 238 |
| | 154 |
Meditrina, Inc. (2)(12) | | Medical Device | | 221,510 Preferred Stock Warrants | | | | | | 83 | | | 85 |
NinePoint Medical, Inc. (2)(12) |
| Medical Device |
| 29,102 Preferred Stock Warrants |
| | |
| | 33 |
| | 6 |
VERO Biotech LLC (2)(12) |
| Medical Device |
| 408 Common Stock Warrants |
| | |
| | 53 |
| | 55 |
Total Non-Affiliate Warrants — Life Science | | | | | | | | | | 2,127 | | | 1,215 |
Non-Affiliate Warrants — Technology — 4.8% (8) | | | | | | | | | | | | | |
Audacy Corporation (2)(12) |
| Communications |
| 1,545,575 Preferred Stock Warrants |
| | |
| | 193 |
| | — |
Intelepeer Holdings, Inc. (2)(12) |
| Communications |
| 2,134,617 Preferred Stock Warrants |
| | |
| | 145 |
| | 75 |
PebblePost, Inc. (2)(12) |
| Communications |
| 598,850 Preferred Stock Warrants |
| | |
| | 93 |
| | 159 |
Betabrand Corporation (2)(12) | | Consumer-related Technologies | | 248,210 Preferred Stock Warrants | | | | | | 101 | | | 104 |
Caastle, Inc. (2)(12) | | Consumer-related Technologies | | 268,591 Preferred Stock Warrants | | | | | | 67 | | | 832 |
Le Tote, Inc. (2)(12) |
| Consumer-related Technologies | | 202,974 Preferred Stock Warrants |
| | |
| | 63 |
| | 361 |
Mohawk Group Holdings, Inc. (2)(12) |
| Consumer-related Technologies | | 76,923 Common Stock Warrants |
| | |
| | 195 |
| | 2 |
Rhapsody International Inc. (2)(12) |
| Consumer-related Technologies | | 852,273 Common Stock Warrants |
| | |
| | 164 |
| | — |
Updater, Inc.(2)(12) | | Consumer-related Technologies | | 108,333 Common Stock Warrants | | | | | | 34 | | | 34 |
Canara, Inc. (2)(12) | | Data Storage | | 500,000 Preferred Stock Warrants | | | | | | 242 | | | 288 |
Kaminario, Inc. (2)(12) |
| Data Storage |
| 18,616,925 Preferred Stock Warrants |
| | |
| | 234 |
| | 272 |
Global Worldwide LLC (2)(12) | | Internet and Media | | 245,810 Preferred Stock Warrants | | | | | | 75 | | | 9 |
IgnitionOne, Inc. (2)(12) |
| Internet and Media |
| 262,910 Preferred Stock Warrants |
| | |
| | 672 |
| | — |
Rocket Lawyer Incorporated (2)(12) |
| Internet and Media |
| 261,721 Preferred Stock Warrants |
| | |
| | 91 |
| | 77 |
Skillshare, Inc. (2)(12) | | Internet and Media | | 173,717 Preferred Stock Warrants | | | | | | 162 | | | 162 |
Verve Wireless, Inc. (2)(12) |
| Internet and Media |
| 112,805 Common Stock Warrants |
| | |
| | 121 |
| | — |
The NanoSteel Company, Inc. (2)(12) |
| Materials |
| 467,277 Preferred Stock Warrants |
| | |
| | 233 |
| | 7 |
Kinestral, Inc. (2)(12) |
| Power Management |
| 3,454,774 Preferred Stock Warrants |
| | |
| | 606 |
| | 606 |
Avalanche Technology, Inc. (2)(12) |
| Semiconductors |
| 202,602 Preferred Stock Warrants |
| | |
| | 101 |
| | 170 |
Soraa, Inc. (2)(12) |
| Semiconductors |
| 203,616 Preferred Stock Warrants |
| | |
| | 80 |
| | — |
Bridge2 Solutions, Inc. (2)(12) |
| Software |
| 172,958 Common Stock Warrants |
| | |
| | 768 |
| | 2,230 |
BSI Platform Holdings, LLC (2)(12)(13) |
| Software |
| 187,500 Preferred Stock Warrants |
| | |
| | 26 |
| | 20 |
Clarabridge, Inc. (12) |
| Software |
| 53,486 Preferred Stock Warrants |
| | |
| | 17 |
| | 106 |
Education Elements, Inc. (2)(12) |
| Software |
| 238,121 Preferred Stock Warrants |
| | |
| | 28 |
| | 23 |
Lotame Solutions, Inc. (2)(12) |
| Software |
| 288,115 Preferred Stock Warrants |
| | |
| | 22 |
| | 280 |
OutboundEngine, Inc. (2)(12) |
| Software |
| 600,000 Preferred Stock Warrants |
| | |
| | 77 |
| | 83 |
Revinate, Inc. (2)(12) | | Software | | 459,770 Preferred Stock Warrants | | | | | | 36 | | | 38 |
Riv Data Corp. (2)(12) |
| Software |
| 321,428 Preferred Stock Warrants |
| | |
| | 12 |
| | 253 |
See Notes to Consolidated Financial Statements
107
Horizon Technology Finance Corporation and Subsidiaries
Consolidated Schedule of Investments
December 31, 2019
(In thousands)
|
| |
| |
| Principal |
| Cost of |
| Fair | |||
Portfolio Company (1)(3) | | Sector | | Type of Investment (4)(7)(9)(10) | | Amount | | Investments (6) | | Value | |||
ShopKeep.com, Inc. (2)(12) |
| Software |
| 193,962 Preferred Stock Warrants |
| | |
| | 118 |
| | 116 |
SIGNiX, Inc. (12) |
| Software |
| 133,560 Preferred Stock Warrants |
| | |
| | 225 |
| | — |
Skyword, Inc. (12) |
| Software |
| 301,056 Preferred Stock Warrants |
| | |
| | 48 |
| | 4 |
Sys-Tech Solutions, Inc. (2)(12) |
| Software |
| 375,000 Preferred Stock Warrants |
| | |
| | 242 |
| | 2,331 |
Weblinc Corporation (2)(12) |
| Software |
| 195,122 Preferred Stock Warrants |
| | |
| | 42 |
| | — |
xAd, Inc. (2)(12) |
| Software |
| 4,343,348 Preferred Stock Warrants |
| | |
| | 177 |
| | 249 |
Total Non-Affiliate Warrants — Technology |
| | | | | | |
| | 5,510 |
| | 8,891 |
Non-Affiliate Warrants — Sustainability — 0.1% (8) |
|
|
| | |
| |
|
| |
| ||
Tigo Energy, Inc. (2)(12) |
| Energy Efficiency |
| 804,604 Preferred Stock Warrants |
| | |
| | 100 |
| | — |
Total Non-Affiliate Warrants — Sustainability |
| | | |
| | |
| | 100 |
| | — |
Non-Affiliate Warrants — Healthcare information and services — 0.4% (8) | | | | | | | | | | ||||
ProterixBio, Inc. (2)(12) | | Diagnostics | | 2,676 Common Stock Warrants | | | | | | 42 | |
| — |
Kate Farms, Inc. (2)(12) | | Other Healthcare | | 69,137 Preferred Stock Warrants | | | | | | 86 | | | 86 |
Watermark Medical, Inc. (2)(12) |
| Other Healthcare |
| 27,373 Preferred Stock Warrants |
| | |
| | 74 |
| | 63 |
Catasys, Inc. (2)(5)(12) | | Software | | 51,185 Common Stock Warrants | | | | | | 193 | | | 304 |
HealthEdge Software, Inc. (2)(12) |
| Software |
| 205,481 Preferred Stock Warrants |
| | |
| | 84 |
| | 73 |
Medsphere Systems Corporation (2)(12) |
| Software |
| 7,097,792 Preferred Stock Warrants |
| | |
| | 60 |
| | 197 |
Total Non-Affiliate Warrants — Healthcare information and services |
| | |
| | 539 |
| | 723 | ||||
Total Non-Affiliate Warrants |
| | | |
| | |
| | 8,276 |
| | 10,829 |
Non-Affiliate Other Investments — 0.3% (8) |
|
|
|
|
| | |
| |
|
| |
|
ZetrOZ, Inc. (12) |
| Medical Device |
| Royalty Agreement |
| | |
| | 61 |
| | 500 |
Total Non-Affiliate Other Investments |
| |
| |
| | |
| | 61 |
| | 500 |
| | | | | | | | | | | | | |
Non-Affiliate Equity — 0.3% (8) |
|
|
|
|
| | |
| |
|
| |
|
Palatin Technologies, Inc. (2)(5) |
| Biotechnology |
| 5,249 Common Stock |
| | |
| | 31 |
| | 4 |
Revance Therapeutics, Inc.(5) |
| Biotechnology |
| 5,125 Common Stock |
| | |
| | 73 |
| | 83 |
Sunesis Pharmaceuticals, Inc. (5) |
| Biotechnology |
| 13,082 Common Stock |
| | |
| | 83 |
| | 4 |
SnagAJob.com, Inc. (12) |
| Consumer-related Technologies |
| 82,974 Common Stock |
| | |
| | 9 |
| | 84 |
Verve Wireless, Inc. (2)(12) |
| Internet and Media |
| 100,598 Preferred Stock |
| | |
| | 224 |
| | — |
Zeta Global Holdings Corp. (2)(12) | | Internet and Media | | 18,405 Common Stock | | | | | | 240 | | | 240 |
Formetrix, Inc. (2)(12) |
| Materials |
| 74,286 Common Stock |
| | |
| | 74 |
| | 74 |
Total Non-Affiliate Equity |
| | | |
| | |
| | 734 |
| | 489 |
Total Non-Affiliate Portfolio Investment Assets |
| | | |
| | |
| $ | 295,256 |
| $ | 294,304 |
| | | | | | | | | | | | | |
Non-controlled Affiliate Investments — 4.7% (8) |
|
|
|
|
| |
|
| | |
| |
|
Non-controlled Affiliate Debt Investments — Technology — 3.2% (8) |
| |
|
| |
|
| |
| ||||
Decisyon, Inc. (12) |
| Software |
| Term Loan (13.998% cash (Libor + 12.31%; Floor 12.50%), 12.00% ETP, Due 6/1/21) | | $ | 1,206 | | $ | 1,206 | | $ | 1,206 |
|
| |
| Term Loan (14.41% cash (Libor + 12.31%; Floor 12.50%), 12.00% ETP, Due 6/1/21) | |
| 660 | |
| 639 | | | 639 |
|
| | | Term Loan (12.02% cash, Due 6/1/21) | | | 234 | | | 234 | | | 234 |
|
| |
| Term Loan (12.03% cash, Due 6/1/21) | |
| 234 | |
| 234 | | | 234 |
|
| |
| Term Loan (12.24% cash, Due 6/1/21) | |
| 704 | |
| 704 | | | 704 |
|
| |
| Term Loan (13.08% cash, Due 6/1/21) | |
| 283 | |
| 283 | | | 283 |
|
| |
| Term Loan (13.10% cash, Due 6/1/21) | |
| 187 | |
| 187 | | | 187 |
StereoVision Imaging, Inc. (12) |
| Software |
| Term Loan (8.72% Cash (Libor + 7.03%; Floor 8.50%), 8.50% ETP, Due 9/1/21) (11) | |
| 2,783 | |
| 2,382 | |
| 2,382 |
Total Non-controlled Affiliate Debt Investments — Technology |
| | |
|
| |
| 5,869 | |
| 5,869 | ||
| | | | | | | | | | | | | |
Non-controlled Affiliate Warrants — Technology — 0.0% (8) |
|
| |
|
| |
|
| |
|
| ||
Decisyon, Inc. (12) |
| Software |
| 82,967 Common Stock Warrants | |
| | |
| 46 | |
| — |
Total Non-controlled Affiliate Warrants — Technology |
| | |
|
| |
| 46 | |
| — | ||
Non-controlled Affiliate Equity — Technology — 1.5% (8) | | |
| | | | |
| | |
| ||
Decisyon, Inc. (12) |
| Software | | 45,365,936 Common Stock | | | |
| | 185 |
| | 75 |
StereoVision Imaging, Inc. (12) |
| Software | | 1,943,572 Common Stock | | | |
| | 791 |
| | 2,653 |
Total Non-controlled Affiliate Equity |
| | |
| | | |
| | 976 |
| | 2,728 |
Total Non-controlled Affiliate Portfolio Investment Assets | | | | | |
| $ | 6,891 |
| $ | 8,597 | ||
| | | | | | | | | | | | | |
Controlled Affiliate Investments — 9.0% (8) | | | | | |
|
|
|
|
|
| ||
Controlled Affiliate Equity — Financial — 9.0% (8) | | | | | |
|
|
|
|
|
| ||
Horizon Secured Loan Fund I LLC (12)(14) | | Investment funds | | | | | |
| $ | 16,684 |
| $ | 16,650 |
Total Controlled Affiliate Equity | | | | | | | |
|
| 16,684 |
|
| 16,650 |
Total Controlled Affiliate Portfolio Investment Assets | | | |
| $ | 16,684 |
| $ | 16,650 | ||||
| | | | | | | | | | | | | |
Total Portfolio Investment Assets — 173.7% (8) | | | | | | | |
| $ | 318,831 |
| $ | 319,551 |
See Notes to Consolidated Financial Statements
108
Horizon Technology Finance Corporation and Subsidiaries
Consolidated Schedule of Investments
December 31, 2019
(In thousands)
|
| |
| |
| |
| | Cost of |
| Fair | ||
Portfolio Company (1)(3) | | Sector | | Type of Investment (4)(7)(9)(10) | | | | | Investments (6) | | Value | ||
Short Term Investments — Unrestricted Investments — 5.3% (8) | | | | | | | | | | | | ||
US Bank Money Market Deposit Account | | | | | | | | | $ | 9,787 | | $ | 9,787 |
Total Short Term Investments —Unrestricted Investments | | | | | | | $ | 9,787 |
| $ | 9,787 | ||
| | | | | | | | | | | | | |
Short Term Investments — Restricted Investments—0.6% (8) | | | | | | | | | | | | ||
US Bank Money Market Deposit Account | | | | | | | | | $ | 1,133 | | $ | 1,133 |
Total Short Term Investments —Restricted Investments | | | | | | | $ | 1,133 |
| $ | 1,133 | ||
| | | | | | | | | | | | | |
| (1) | All investments of the Company are in entities which are organized under the laws of the United States and have a principal place of business in the United States. |
| (2) | Has been pledged as collateral under the Key Facility. |
| (3) | All non-affiliate investments are investments in which the Company owns less than 5% of the voting securities of the portfolio company. All non-controlled affiliate investments are investments in which the Company owns 5% or more of the voting securities of the portfolio company but not more than 25% of the voting securities of the portfolio company. All controlled affiliate investments are investments in which the Company owns more than 25% of the portfolio company’s outstanding voting securities or has the power to exercise control over management or policies of such portfolio company (including through a management agreement). |
| (4) | All interest is payable in cash due monthly in arrears, unless otherwise indicated, and applies only to the Company’s debt investments. Interest rate is the annual interest rate on the debt investment and does not include ETPs, and any additional fees related to the investments, such as deferred interest, commitment fees or prepayment fees. Debt investments are at variable rates for the term of the debt investment, unless otherwise indicated. All debt investments based on the LIBOR are based on one-month LIBOR. For each debt investment, the current interest rate in effect as of December 31, 2019 is provided. |
| (5) | Portfolio company is a public company. |
| (6) | For debt investments, represents principal balance less unearned income. |
| (7) | Warrants, Equity and Other Investments are non-income producing. |
| (8) | Value as a percent of net assets. |
| (9) | As of December 31, 2019, 4.9% and 4.8% of the Company’s total assets on a cost and fair value basis, respectively, are in non-qualifying assets. Under the 1940 Act, the Company may not acquire any non-qualifying assets unless, at the time the acquisition is made, qualifying assets represent at least 70% of the Company’s total assets. |
| (10) | ETPs are contractual fixed-interest payments due in cash at the maturity date of the applicable debt investment, including upon any prepayment, and are a fixed percentage of the original principal balance of the debt investments unless otherwise noted. Interest will accrue during the life of the debt investment on each ETP and will be recognized as non-cash income until it is actually paid. Therefore, a portion of the incentive fee the Company may pay its Advisor will be based on income that the Company has not yet received in cash. |
| (11) | Debt investment has a PIK feature. |
| (12) | The fair value of the investment was valued using significant unobservable inputs. |
See Notes to Consolidated Financial Statements
109
| (13) | New Signature US, Inc. is a subsidiary of BSI Platform Holdings, LLC. |
| (14) | On June 1, 2018, the Company entered into an agreement with Arena Sunset SPV, LLC (“Arena”) to co-invest through Horizon Secured Loan Fund I LLC (“HSLFI”), a joint venture, which is expected to make investments, either directly or indirectly through subsidiaries, primarily in the form of secured loans to development-stage companies in the technology, life science, healthcare information and services and sustainability industries. All HSLFI investment decisions require unanimous approval of a quorum of HSLFI’s board of managers, which consists of two representatives of the Company and Arena. Although the Company owns more than 25% of the voting securities of HSLFI, the Company does not have sole control over significant actions of HSLFI for purposes of the 1940 Act or otherwise. |
| (15) | Debt investment is on non-accrual status as of December 31, 2019. |
See Notes to Consolidated Financial Statements
110
Horizon Technology Finance Corporation and Subsidiaries
Notes to Consolidated Financial Statements
Note 1. Organization
Horizon Technology Finance Corporation (the “Company”) was organized as a Delaware corporation on March 16, 2010 and is an externally managed, non-diversified, closed-end investment company. The Company has elected to be regulated as a business development company (“BDC”) under the 1940 Act. In addition, for tax purposes, the Company has elected to be treated as a regulated investment company (“RIC”) as defined under Subchapter M of the Internal Revenue Code of 1986, as amended (the “Code”). As a RIC, the Company generally is not subject to corporate-level federal income tax on the portion of its taxable income (including net capital gains) the Company distributes to its stockholders. The Company primarily makes secured debt investments to development-stage companies in the technology, life science, healthcare information and services and sustainability industries. All of the Company’s debt investments consist of loans secured by all of, or a portion of, the applicable debtor company’s tangible and intangible assets.
On October 28, 2010, the Company completed an initial public offering (“IPO”) and its common stock trades on the Nasdaq Global Select Market under the symbol “HRZN”. The Company was formed to continue and expand the business of Compass Horizon Funding Company LLC, a Delaware limited liability company, which commenced operations in March 2008 and became the Company’s wholly owned subsidiary upon the completion of the Company’s IPO.
Horizon Credit II LLC (“Credit II”) was formed as a Delaware limited liability company on June 28, 2011, with the Company as its sole equity member. Credit II is a special purpose bankruptcy-remote entity and is a separate legal entity from the Company. Any assets conveyed to Credit II are not available to creditors of the Company or any other entity other than Credit II’s lenders.
The Company formed Horizon Funding 2019-1 LLC (“2019-1 LLC”) as a Delaware limited liability company on May 2, 2019 and Horizon Funding Trust 2019-1 on May 15, 2019 (“2019-1 Trust” and, together with the 2019-1 LLC, the “2019-1 Entities”). The 2019-1 Entities are special purpose bankruptcy remote entities and are separate legal entities from the Company. The Company formed the 2019-1 Entities for purposes of securitizing the Asset-Backed Notes.
The Company formed Horizon Funding I, LLC (“HFI”) as a Delaware limited liability company on May 9, 2018, with HSLFI as its sole member. HFI is a special purpose bankruptcy-remote entity and is a separate legal entity from HSLFI. Any assets conveyed to HFI are not available to creditors of HSLFI or any other entity other than HFI’s lenders.
On April 21, 2020, the Company purchased all of the limited liability company interests of Arena in HSLFI, including, without limitation, undistributed amounts owed to Arena and interest accrued and unpaid on the debt investments of HSLFI through the date of purchase. As of April 21, 2020, HSLFI and its subsidiary, HFI, are consolidated by the Company.
The Company has also established an additional wholly owned subsidiary, which is structured as a Delaware limited liability company, to hold the assets of a portfolio company acquired in connection with foreclosure or bankruptcy, which is a separate legal entity from the Company.
The Company’s investment strategy is to maximize the investment portfolio’s return by generating current income from the debt investments the Company makes and capital appreciation from the warrants the Company receives when making such debt investments. The Company has entered into an investment management agreement (the “Investment Management Agreement”) with Horizon Technology Finance Management LLC (the “Advisor”) under which the Advisor manages the day-to-day operations of, and provides investment advisory services to, the Company.
Note 2. Basis of presentation and significant accounting policies
The consolidated financial statements of the Company have been prepared in accordance with U.S. generally accepted accounting principles (“GAAP”) and pursuant to the requirements for reporting on Form 10-K and Articles 6 and 10 of Regulation S-X (“Regulation S-X”) under the Securities Act of 1933, as amended (the “Securities Act”). In the opinion of management, the consolidated financial statements reflect all adjustments and reclassifications, consisting solely of normal
111
recurring accruals, that are necessary for the fair presentation of financial results as of and for the periods presented. All intercompany balances and transactions have been eliminated.
Principles of consolidation
As required under GAAP and Regulation S-X, the Company will generally consolidate its investment in a company that is an investment company subsidiary or a controlled operating company whose business consists of providing services to the Company. Accordingly, the Company consolidated the results of the Company’s wholly-owned subsidiaries in its consolidated financial statements. Although the Company owned more than 25% of the voting securities of HSLFI through April 21, 2020, the Company did not have sole control over significant actions of HSLFI for purposes of the 1940 Act or otherwise, and thus did not consolidate its interest prior to April 21, 2020.
Assets related to transactions that do not meet Accounting Standards Codification (“ASC”) Topic 860, Transfers and Servicing requirements for accounting sale treatment are reflected in the Company’s Consolidated Statements of Assets and Liabilities as investments. Those assets are owned by special purpose entities, including 2019-1 Entities, that are consolidated in the Company’s consolidated financial statements. The creditors of the special purpose entities have received security interests in such assets and such assets are not intended to be available to the creditors of the Company (or any affiliate of the Company).
Use of estimates
In preparing the consolidated financial statements in accordance with GAAP, management is required to make estimates and assumptions that affect the reported amounts of assets and liabilities, and disclosures of contingent assets and liabilities, as of the date of the balance sheet and income and expenses for the period. Actual results could differ from those estimates. Material estimates that are particularly susceptible to significant change in the near term relate to the valuation of investments.
Fair value
The Company records all of its investments at fair value in accordance with relevant GAAP, which establishes a framework used to measure fair value and requires disclosures for fair value measurements. The Company has categorized its investments carried at fair value, based on the priority of the valuation technique, into a three-level fair value hierarchy as more fully described in Note 6. Fair value is a market-based measure considered from the perspective of the market participant who holds the financial instrument rather than an entity specific measure. Therefore, when market assumptions are not readily available, the Company’s own assumptions are set to reflect those that management believes market participants would use in pricing the financial instrument at the measurement date.
The availability of observable inputs can vary depending on the financial instrument and is affected by a wide variety of factors, including, for example, the type of product, whether the product is new, whether the product is traded on an active exchange or in the secondary market and the current market conditions. To the extent that the valuation is based on models or inputs that are less observable or unobservable in the market, the determination of fair value requires more judgment. Accordingly, the degree of judgment exercised by the Company in determining fair value is greatest for financial instruments classified as Level 3.
See Note 6 for additional information regarding fair value.
Segments
The Company has determined that it has a single reporting segment and operating unit structure. The Company lends to and invests in portfolio companies in various technology, life science, healthcare information and services and sustainability industries. The Company separately evaluates the performance of each of its lending and investment relationships. However, because each of these debt investments and investment relationships has similar business and economic characteristics, they have been aggregated into a single lending and investment segment.
112
Investments
Investments are recorded at fair value. The Company’s board of directors (the “Board”) determines the fair value of the Company’s portfolio investments. The Company has the intent to hold its debt investments for the foreseeable future or until maturity or payoff.
Interest on debt investments is accrued and included in income based on contractual rates applied to principal amounts outstanding. Interest income is determined using a method that results in a level rate of return on principal amounts outstanding. Generally, when a debt investment becomes 90 days or more past due, or if the Company otherwise does not expect to receive interest and principal repayments, the debt investment is placed on non-accrual status and the recognition of interest income may be discontinued. Interest payments received on non-accrual debt investments may be recognized as income, on a cash basis, or applied to principal depending upon management’s judgment at the time the debt investment is placed on non-accrual status. As of December 31, 2020, there were two investments on non-accrual status with a cost of $13.9 million and a fair value of $8.8 million. As of December 31, 2019, there were two investments on non-accrual status with a cost of $5.7 million and a fair value of $2.0 million. For the year ended December 31, 2020, the Company recognized, as interest income, payments of $0.03 million received from one portfolio company whose debt investment was on non-accrual status. For the years ended December 31, 2019 and 2018, the Company did not recognize any interest income from debt investments on non-accrual status.
The Company receives a variety of fees from borrowers in the ordinary course of conducting its business, including advisory fees, commitment fees, amendment fees, non-utilization fees, success fees and prepayment fees. In a limited number of cases, the Company may also receive a non-refundable deposit earned upon the termination of a transaction. Debt investment origination fees, net of certain direct origination costs, are deferred and, along with unearned income, are amortized as a level-yield adjustment over the respective term of the debt investment. All other income is recognized when earned. Fees for counterparty debt investment commitments with multiple debt investments are allocated to each debt investment based upon each debt investment’s relative fair value. When a debt investment is placed on non-accrual status, the amortization of the related fees and unearned income is discontinued until the debt investment is returned to accrual status.
Certain debt investment agreements also require the borrower to make an ETP, that is accrued into interest receivable and taken into income over the life of the debt investment to the extent such amounts are expected to be collected. The Company will generally cease accruing the income if there is insufficient value to support the accrual or the Company does not expect the borrower to be able to pay the ETP when due. The proportion of the Company’s total investment income that resulted from the portion of ETPs not received in cash for the years ended December 31, 2020, 2019 and 2018 was 5.8%, 5.3% and 6.5%, respectively.
In connection with substantially all lending arrangements, the Company receives warrants to purchase shares of stock from the borrower. The warrants are recorded as assets at estimated fair value on the grant date using the Black-Scholes valuation model. The warrants are considered loan fees and are recorded as unearned income on the grant date. The unearned income is recognized as interest income over the contractual life of the related debt investment in accordance with the Company’s income recognition policy. Subsequent to debt investment origination, the fair value of the warrants is determined using the Black-Scholes valuation model. Any adjustment to fair value is recorded through earnings as net unrealized appreciation or depreciation on investments. Gains and losses from the disposition of the warrants or stock acquired from the exercise of warrants are recognized as realized gains and losses on investments.
Prior to consolidating the investment in HSLFI on and after April 21, 2020, distributions from HSLFI were evaluated at the time of distribution to determine if the distribution should be recorded as dividend income or a return of capital. Generally, the Company did not record distributions from HSLFI as dividend income unless there was sufficient accumulated tax-basis earnings and profit in HSLFI prior to distribution. Distributions that were classified as a return of capital were recorded as a reduction in the cost basis of the investment. For the period January 1, 2020 through April 21, 2020, HSLFI made no distributions classified as dividend income or a return of capital to the Company. For the year ended December 31, 2019, HSLFI distributed $0.7 million classified as dividend income to the Company. For the period June 1, 2018 (the commencement of HSLFI’s operations) through December 31, 2018, HSLFI distributed $0.3 million classified as dividend income to the Company.
113
Realized gains or losses on the sale of investments, or upon the determination that an investment balance, or portion thereof, is not recoverable, are calculated using the specific identification method. The Company measures realized gains or losses by calculating the difference between the net proceeds from the repayment or sale and the amortized cost basis of the investment. Net change in unrealized appreciation or depreciation reflects the change in the fair values of the Company’s portfolio investments during the reporting period, including any reversal of previously recorded unrealized appreciation or depreciation when gains or losses are realized.
Debt issuance costs
Debt issuance costs are fees and other direct incremental costs incurred by the Company in obtaining debt financing from its lenders and issuing debt securities. The unamortized balance of debt issuance costs as of December 31, 2020 and 2019 was $3.2 million and $3.3 million, respectively. These amounts are amortized and included in interest expense in the consolidated statements of operations over the life of the borrowings. The accumulated amortization balances as of December 31, 2020 and 2019 were $4.1 million and $3.1 million, respectively. The amortization expense for the years ended December 31, 2020, 2019 and 2018 was $1.0 million, $0.7 million and $0.6 million, respectively.
Income taxes
As a BDC, the Company has elected to be treated as a RIC under Subchapter M of the Code and operates in a manner so as to qualify for the tax treatment applicable to RICs. In order to qualify as a RIC and to avoid the imposition of corporate-level income tax on the portion of its taxable income distributed to stockholders, among other things, the Company is required to meet certain source of income and asset diversification requirements and to timely distribute dividends out of assets legally available for distribution to its stockholders of an amount generally at least equal to 90% of its investment company taxable income, as defined by the Code and determined without regard to any deduction for dividends paid, for each tax year. The Company, among other things, has made and intends to continue to make the requisite distributions to its stockholders, which generally relieves the Company from corporate-level U.S. federal income taxes. Accordingly, no provision for federal income tax has been recorded in the financial statements. Differences between taxable income and net increase in net assets resulting from operations either can be temporary, meaning they will reverse in the future, or permanent. In accordance with ASC Topic 946, Financial Services—Investment Companies, as amended, of the Financial Accounting Standards Board’s (“FASB’s”), permanent tax differences, such as non-deductible excise taxes paid, are reclassified from distributions in excess of net investment income and net realized loss on investments to paid-in-capital at the end of each fiscal year. These permanent book-to-tax differences are reclassified on the consolidated statements of changes in net assets to reflect their tax character but have no impact on total net assets. For the years ended December 31, 2020, 2019 and 2018, the Company reclassified $0.2 million, $0.2 million and $0.03 million, respectively, to paid-in capital from distributions in excess of net investment income, which related to excise taxes payable.
Depending on the level of taxable income earned in a tax year, the Company may choose to carry forward taxable income in excess of current year distributions into the next tax year and incur a 4% U.S. federal excise tax on such income, as required. To the extent that the Company determines that its estimated current year annual taxable income will be in excess of estimated current year distributions, the Company accrues excise tax, if any, on estimated excess taxable income as taxable income is earned. For the years ended December 31, 2020, 2019 and 2018, $0.2 million, $0.2 million and $0.03 million, respectively, was recorded for U.S. federal excise tax.
The Company evaluates tax positions taken in the course of preparing the Company’s tax returns to determine whether the tax positions are “more-likely-than-not” to be sustained by the applicable tax authority in accordance with ASC Topic 740, Income Taxes, as modified by ASC Topic 946. Tax benefits of positions not deemed to meet the more-likely-than-not threshold, or uncertain tax positions, would be recorded as a tax expense in the current year. It is the Company’s policy to recognize accrued interest and penalties related to uncertain tax benefits in income tax expense. The Company had no material uncertain tax positions at December 31, 2020 and 2019. The Company’s income tax returns for the 2019, 2018 and 2017 tax years remain subject to examination by U.S. federal and state tax authorities.
114
Distributions
Distributions to common stockholders are recorded on the declaration date. The amount to be paid out as distributions is determined by the Board. Net realized capital gains, if any, may be distributed, although the Company may decide to retain such net realized gains for investment.
The Company has adopted a dividend reinvestment plan that provides for reinvestment of cash distributions on behalf of its stockholders, unless a stockholder elects to receive cash. As a result, if the Board declares a cash distribution, then stockholders who have not “opted out” of the dividend reinvestment plan will have their cash distributions automatically reinvested in additional shares of the Company’s common stock, rather than receiving the cash distribution. The Company may issue new shares or purchase shares in the open market to fulfill its obligations under the plan.
Stockholders’ Equity
On March 26, 2019, the Company completed a follow-on public offering of 2,000,000 shares of its common stock at a public offering price of $12.14 per share, for total net proceeds to the Company of $23.1 million, after deducting underwriting commission and discounts and other offering expenses.
On August 2, 2019, the Company entered into an At-The-Market (“ATM”) sales agreement (the “Prior Equity Distribution Agreement”), with Goldman Sachs & Co. LLC and B. Riley FBR, Inc. (each a “Sales Agent” and, collectively, the “Sales Agents”). The Prior Equity Distribution Agreement provided that the Company may offer and sell its shares from time to time through the Sales Agents up to $50.0 million worth of its common stock, in amounts and at times to be determined by the Company.
On July 30, 2020, the Company terminated the Prior Equity Distribution Agreement and entered into a new ATM sales agreement (the “Equity Distribution Agreement”), with the Sales Agents. The remaining shares available under the Prior Equity Distribution Agreement are no longer available for issuance. The Equity Distribution Agreement provides that the Company may offer and sell its shares from time to time through the Sales Agents up to $100.0 million worth of its common stock, in amounts and at times to be determined by the Company. Sales of the Company’s common stock, if any, may be made in negotiated transactions or transactions that are deemed to be “at-the-market,” as defined in Rule 415 under the Securities Act, including sales made directly on the NASDAQ or similar securities exchange or sales made to or through a market maker other than on an exchange, at prices related to the prevailing market prices or at negotiated prices.
During the year ended December 31, 2020, the Company sold 3,702,500 shares of common stock under the Prior Equity Distribution Agreement and the Equity Distribution Agreement. For the same period, the Company received total accumulated net proceeds of approximately $44.6 million, including $1.0 million of offering expenses, from these sales. During the year ended December 31, 2019, the Company sold 2,012,844 shares of common stock under the Prior Equity Distribution Agreement. For the same period, the Company received total accumulated net proceeds of approximately $24.0 million, including $0.6 million of offering expenses, from these sales.
The Company generally uses net proceeds from these offerings to make investments, to pay down liabilities and for general corporate purposes. As of December 31, 2020, shares representing approximately $76.0 million of its common stock remain available for issuance and sale under the Equity Distribution Agreement.
Stock Repurchase Program
On April 24, 2020, the Board extended a previously authorized stock repurchase program which allows the Company to repurchase up to $5.0 million of its common stock at prices below the Company’s net asset value per share as reported in its most recent consolidated financial statements. Under the repurchase program, the Company may, but is not obligated to, repurchase shares of its outstanding common stock in the open market or in privately negotiated transactions from time to time. Any repurchases by the Company will comply with the requirements of Rule 10b-18 under the Securities Exchange Act of 1934, as amended (the “Exchange Act”), and any applicable requirements of the 1940 Act. Unless extended by the Board, the repurchase program will terminate on the earlier of June 30, 2021 or the repurchase of $5.0 million of the Company’s common stock. During the years ended December 31, 2020, 2019 and 2018, the Company did not make any repurchases of its common stock. From the inception of the stock repurchase program through December 31, 2020, the
115
Company repurchased 167,465 shares of its common stock at an average price of $11.22 on the open market at a total cost of $1.9 million.
Transfers of financial assets
Assets related to transactions that do not meet the requirements under ASC Topic 860, Transfers and Servicing for sale treatment under GAAP are reflected in the Company’s consolidated statements of assets and liabilities as investments. Those assets are owned by special purpose entities that are consolidated in the Company’s financial statements. The creditors of the special purpose entities have received security interests in such assets and such assets are not intended to be available to the creditors of the Company (or any other affiliate of the Company).
Transfers of financial assets are accounted for as sales when control over the assets has been surrendered. Control over transferred assets is deemed to be surrendered when (1) the assets have been isolated from the Company — put presumptively beyond the reach of the transferor and its creditors, even in bankruptcy or other receivership, (2) the transferee obtains the right (free of conditions that constrain it from taking advantage of that right) to pledge or exchange the transferred assets and (3) the transferor does not maintain effective control over the transferred assets through either (a) an agreement that both entitles and obligates the transferor to repurchase or redeem the assets before maturity or (b) the ability to unilaterally cause the holder to return specific assets, other than through a cleanup call.
Recently issued accounting pronouncement
In March 2020, the FASB issued Accounting Standards Update No. 2020-04, Reference Rate Reform (Topic 848): Facilitation of the Effects of Reference Rate Reform on Financial Reporting (“ASU 2020-04”). ASU 2020-04 provides optional expedients and exceptions for applying GAAP to contract modifications and hedging relationships, subject to meeting certain criteria, that reference LIBOR or another rate that is expected to be discontinued. The amendments in ASU 2020-04 are effective for all entities as of March 12, 2020 through December 31, 2022. The Company is currently assessing the impact of ASU 2020-04 and the LIBOR transition on its consolidated financial statements.
Note 3. Related party transactions
Investment Management Agreement
At a special meeting of the stockholders on October 30, 2018, the stockholders approved a new Investment Management Agreement which became effective on March 7, 2019. The new Investment Management Agreement replaced the previously effective Amended and Restated Investment Management Agreement dated as of October 28, 2010 and amended effective July 1, 2014. On October 26, 2020, the Board unanimously approved the renewal of the Investment Management Agreement. Under the terms of the Investment Management Agreement, the Advisor determines the composition of the Company’s investment portfolio, the nature and timing of the changes to the investment portfolio and the manner of implementing such changes; identifies, evaluates and negotiates the structure of the investments the Company makes (including performing due diligence on the Company’s prospective portfolio companies); and closes, monitors and administers the investments the Company makes, including the exercise of any voting or consent rights.
The Advisor’s services under the Investment Management Agreement are not exclusive to the Company, and the Advisor is free to furnish similar services to other entities so long as its services to the Company are not impaired. The Advisor is a registered investment adviser with the SEC. The Advisor receives fees for providing services to the Company under the Investment Management Agreement, consisting of two components, a base management fee and an incentive fee.
Through October 30, 2018, the base management fee was calculated at an annual rate of 2.00% of the Company’s gross assets (less cash and cash equivalents) including any assets acquired with the proceeds of leverage. From and after October 31, 2018, the first date on which the reduced asset coverage requirements in Section 61(a)(2) of the 1940 Act applied to the Company, the base management fee was and will be calculated at an annual rate of 2.00% of the Company’s gross assets (less cash and cash equivalents) including any assets acquired with the proceeds of leverage; provided, that, to the extent the Company’s gross assets (less cash and cash equivalents) exceed $250 million, the base management fee on the amount of such excess over $250 million will be calculated at an annual rate of 1.60% of the Company’s gross
116
assets (less cash and cash equivalents) including any assets acquired with the proceeds of leverage. The base management fee is payable monthly in arrears and is prorated for any partial month.
The base management fee payable at December 31, 2020 and 2019 was $0.6 million and $0.5 million, respectively. The base management fee expense was $6.5 million, $5.6 million and $4.6 million for the years ended December 31, 2020, 2019 and 2018, respectively.
The incentive fee has two parts, as follows:
The first part, which is subject to the Incentive Fee Cap and Deferral Mechanism, as defined below, is calculated and payable quarterly in arrears based on the Company’s pre-incentive fee net investment income for the immediately preceding calendar quarter. For this purpose, “Pre-Incentive Fee Net Investment Income” means interest income, dividend income and any other income (including any other fees (other than fees for providing managerial assistance), such as commitment, origination, structuring, diligence and consulting fees or other fees received from portfolio companies) accrued during the calendar quarter, minus expenses for the quarter (including the base management fee, expenses payable under the Administration Agreement (as defined below), and any interest expense and any dividends paid on any issued and outstanding preferred stock, but excluding the incentive fee). Pre-Incentive Fee Net Investment Income includes, in the case of investments with a deferred interest feature (such as original issue discount, debt instruments with PIK interest and zero coupon securities), accrued income the Company has not yet received in cash. The incentive fee with respect to the Pre-Incentive Fee Net Investment Income is 20.00% of the amount, if any, by which the Pre-Incentive Fee Net Investment Income for the immediately preceding calendar quarter exceeds a hurdle rate of 1.75% (which is 7.00% annualized) of the Company’s net assets at the end of the immediately preceding calendar quarter, adjusted for any share issuances or repurchases during the relevant quarter, subject to a “catch-up” provision measured as of the end of each calendar quarter. Under this provision, in any calendar quarter, the Advisor receives no incentive fee until the Pre-Incentive Fee Net Investment Income equals the hurdle rate of 1.75%, but then receives, as a “catch-up,” 100.00% of the Pre-Incentive Fee Net Investment Income with respect to that portion of such Pre-Incentive Fee Net Investment Income, if any, that exceeds the hurdle rate but is less than 2.1875% quarterly (which is 8.75% annualized). The effect of this “catch-up” provision is that, if Pre-Incentive Fee Net Investment Income exceeds 2.1875% in any calendar quarter, the Advisor will receive 20.00% of the Pre-Incentive Fee Net Investment Income as if the hurdle rate did not apply.
Pre-Incentive Fee Net Investment Income does not include any realized capital gains, realized capital losses or unrealized capital appreciation or depreciation. Because of the structure of the incentive fee, it is possible that the Company may pay an incentive fee in a quarter in which the Company incurs a loss. For example, if the Company receives Pre-Incentive Fee Net Investment Income in excess of the quarterly minimum hurdle rate, the Company will pay the applicable incentive fee up to the Incentive Fee Cap, defined below, even if the Company has incurred a loss in that quarter due to realized and unrealized capital losses. The Company’s net investment income used to calculate this part of the incentive fee is also included in the amount of the Company’s gross assets used to calculate the 2.00% base management fee. These calculations are appropriately prorated for any period of less than three months and adjusted for any share issuances or repurchases during the current quarter.
The incentive fee on Pre-Incentive Fee Net Investment Income is subject to a fee cap and deferral mechanism which is determined based upon a look-back period of up to three years and is expensed when incurred. For this purpose, the look-back period for the incentive fee based on Pre-Incentive Fee Net Investment Income (the “Incentive Fee Look-back Period”) includes the relevant calendar quarter and the 11 preceding full calendar quarters. Each quarterly incentive fee payable on Pre-Incentive Fee Net Investment Income is subject to a cap (the “Incentive Fee Cap”) and a deferral mechanism through which the Advisor may recoup a portion of such deferred incentive fees (collectively, the “Incentive Fee Cap and Deferral Mechanism”). The Incentive Fee Cap is equal to (a) 20.00% of Cumulative Pre-Incentive Fee Net Return (as defined below) during the Incentive Fee Look-back Period less (b) cumulative incentive fees of any kind paid to the Advisor during the Incentive Fee Look-back Period. To the extent the Incentive Fee Cap is zero or a negative value in any calendar quarter, the Company will not pay an incentive fee on Pre-Incentive Fee Net Investment Income to the Advisor in that quarter. To the extent that the payment of incentive fees on Pre-Incentive Fee Net Investment Income is limited by the Incentive Fee Cap, the payment of such fees will be deferred and paid in subsequent calendar quarters up to three years after their date of deferment, subject to certain limitations, which are set forth in the Investment Management Agreement. The
117
Company only pays incentive fees on Pre-Incentive Fee Net Investment Income to the extent allowed by the Incentive Fee Cap and Deferral Mechanism. “Cumulative Pre-Incentive Fee Net Return” during any Incentive Fee Look-back Period means the sum of (a) Pre-Incentive Fee Net Investment Income and the base management fee for each calendar quarter during the Incentive Fee Look-back Period and (b) the sum of cumulative realized capital gains and losses, cumulative unrealized capital appreciation and cumulative unrealized capital depreciation during the applicable Incentive Fee Look-back Period.
The second part of the incentive fee is determined and payable in arrears as of the end of each calendar year (or, upon termination of the Investment Management Agreement, as of the termination date), and equals 20.00% of the Company’s realized capital gains, if any, on a cumulative basis from the date of the election to be a BDC through the end of each calendar year, computed net of all realized capital losses and unrealized capital depreciation on a cumulative basis through the end of such year, less all previous amounts paid in respect of the capital gain incentive fee. However, in accordance with GAAP, the Company is required to include the aggregate unrealized capital appreciation on investments in the calculation and accrue a capital gain incentive fee on a quarterly basis, as if such unrealized capital appreciation were realized, even though such unrealized capital appreciation is not permitted to be considered in calculating the fee actually payable under the Investment Management Agreement.
On March 5, 2019, the Advisor irrevocably waived the receipt of incentive fees related to the amounts previously deferred that it may be entitled to receive under the Investment Management Agreement for the period commencing on January 1, 2019 and ending on December 31, 2019. Such waived incentive fees will not be subject to recoupment. During the year ended December 31, 2019, the Advisor waived performance based incentive fees of $1.8 million which the Advisor would have otherwise been paid by the Company.
On March 6, 2018, the Advisor irrevocably waived the receipt of incentive fees related to the amounts previously deferred that it may be entitled to receive under the Investment Management Agreement for the period commencing on January 1, 2018 and ending on December 31, 2018. Such waived incentive fees are not subject to recoupment. During the years ended December 31, 2018, the Advisor waived performance based incentive fees of $1.2 million which the Advisor would have otherwise earned.
The net performance based incentive fee expense was $5.2 million, $5.1 million and $3.2 million for the years ended December 31, 2020, 2019 and 2018, respectively. The incentive fee on Pre-Incentive Fee Net Investment Income was not subject to the Incentive Fee Cap and Deferral Mechanism for the years ended December 31, 2020 and 2019. The incentive fee on Pre-Incentive Fee Net Investment Income was subject to the Incentive Fee Cap and Deferral Mechanism for the year ended December 31, 2018, which resulted in $0.2 million of reduced expense and additional net investment income. The performance based incentive fee payable at December 31, 2020 and 2019 was $1.0 million and $1.6 million, respectively. The entire incentive fee payable at December 31, 2020 and 2019 represented part one of the incentive fee.
Administration Agreement
The Company entered into an administration agreement (the “Administration Agreement”) with the Advisor to provide administrative services to the Company. For providing these services, facilities and personnel, the Company reimburses the Advisor for the Company’s allocable portion of overhead and other expenses incurred by the Advisor in performing its obligations under the Administration Agreement, including rent, the fees and expenses associated with performing compliance functions and the Company’s allocable portion of the costs of compensation and related expenses of the Company’s Chief Financial Officer and Chief Compliance Officer and their respective staffs. The administrative fee expense was $1.0 million, $0.9 million and $0.7 million for years ended December 31, 2020, 2019 and 2018, respectively.
118
Note 4. Investments
The following table shows the Company’s investments as of December 31, 2020 and 2019:
| | December 31, 2020 | | December 31, 2019 | ||||||||
|
| Cost |
| Fair Value |
| Cost |
| Fair Value | ||||
| | (In thousands) | ||||||||||
Investments |
| |
|
| |
|
| |
|
| |
|
Debt | | $ | 339,838 | | $ | 333,495 | | $ | 292,054 | | $ | 288,355 |
Warrants | |
| 7,520 | |
| 14,031 | |
| 8,322 | |
| 10,829 |
Other | |
| 1,514 | |
| 1,700 | |
| 61 | |
| 500 |
Equity | |
| 2,640 | |
| 3,319 | |
| 1,710 | |
| 3,217 |
Equity interest in HSLFI | |
| — | |
| — | |
| 16,684 | |
| 16,650 |
Total investments | | $ | 351,512 | | $ | 352,545 | | $ | 318,831 | | $ | 319,551 |
The following table shows the Company’s investments by industry sector as of December 31, 2020 and 2019:
| | December 31, 2020 | | December 31, 2019 | ||||||||
|
| Cost |
| Fair Value |
| Cost |
| Fair Value | ||||
| | (In thousands) | ||||||||||
Life Science |
| |
|
| |
|
| |
|
| |
|
Biotechnology | | $ | 46,669 | | $ | 46,898 | | $ | 42,886 | | $ | 42,265 |
Drug Delivery | |
| — | |
| — | |
| 1,628 | |
| 1,533 |
Medical Device | |
| 109,330 | |
| 110,567 | |
| 60,660 | |
| 60,807 |
Technology | |
| | |
| | |
| | |
|
|
Communications | |
| 270 | |
| 351 | |
| 4,561 | |
| 1,734 |
Consumer-Related | |
| 60,349 | |
| 60,847 | |
| 43,412 | |
| 44,196 |
Data Storage | |
| 23,429 | |
| 23,824 | |
| 24,928 | |
| 25,012 |
Internet and Media | |
| 7,657 | |
| 9,833 | |
| 24,089 | |
| 22,992 |
Materials | |
| 6,857 | |
| 1,737 | |
| 8,717 | |
| 8,491 |
Networking | | | 9,902 | | | 9,902 | | | — | | | — |
Power Management | |
| 1,585 | |
| 1,326 | |
| 11,813 | |
| 11,813 |
Semiconductors | |
| 181 | |
| — | |
| 181 | |
| 170 |
Software | |
| 60,238 | |
| 60,755 | |
| 54,998 | |
| 59,530 |
Sustainability | |
| | |
| | |
| | |
|
|
Energy Efficiency | |
| 100 | |
| — | |
| 100 | |
| — |
Healthcare Information and Services | |
| | |
| | |
| | |
|
|
Diagnostics | |
| 9,850 | |
| 9,850 | |
| 42 | |
| — |
Other | |
| 14,989 | |
| 15,985 | |
| 9,931 | |
| 9,920 |
Software | |
| 106 | |
| 670 | |
| 14,201 | |
| 14,438 |
Investment funds | |
| | |
| | |
| | |
|
|
HSLFI | |
| — | |
| — | |
| 16,684 | |
| 16,650 |
Total investments | | $ | 351,512 | | $ | 352,545 | | $ | 318,831 | | $ | 319,551 |
Horizon Secured Loan Fund I LLC
On June 1, 2018, the Company and Arena formed a joint venture, HSLFI, to make investments, either directly or indirectly through subsidiaries, primarily in secured loans to development-stage companies in the technology, life science, healthcare information and services and sustainability industries. HSLFI was formed as a Delaware limited liability company and was not consolidated by either the Company or Arena for financial reporting purposes. On April 21, 2020, the Company purchased all of the limited liability company interests of Arena in HSLFI, including, without limitation, undistributed amounts owed to Arena and interest accrued and unpaid on the debt investments of HSLFI through the date of purchase, for $17.1 million. In addition, Arena received 50% of the warrants held by HSLFI or HFI at closing. As of April 21, 2020, HSLFI is wholly-owned by the Company and the assets and liabilities of HSLFI and HFI will be
119
consolidated with the assets and liabilities of the Company. The transaction is accounted for as an asset acquisition under GAAP.
Investments held by HSLFI were measured at fair value using the same valuation methodology as described in Note 6. As of December 31, 2019, HSLFI had total assets of $48.3 million. HSLFI’s portfolio consisted of debt investments in eight portfolio companies as of December 31, 2019. As of December 31, 2019, the largest investment in a single portfolio company in the HSLFI’s portfolio in aggregate principal amount was $11.3 million and the five largest investments in portfolio companies in the HSLFI totaled $30.3 million. As of December 31, 2019, HSLFI had no investments on non-accrual status. HSLFI invested in portfolio companies in the same industries in which the Company may directly invest.
The Company invested cash or securities in portfolio companies in HSLFI in exchange for limited liability company equity interests in HSLFI. As of December 31, 2019, the Company and Arena each owned 50.0% of the equity interests of HSLFI. The Company had an original commitment to fund $25.0 million of equity interests in HSLFI. As of December 31, 2019, $9.8 million was unfunded. The Company’s investment in HSLFI consisted of an equity contribution of $15.2 million as of December 31, 2019. During the period January 1, 2020 through April 21, 2020, there were no distributions from HSLFI. During the year ended December 31, 2019, HSLFI distributed $1.4 million.
HFI entered into the NYL Facility with the NYL Noteholders for an aggregate purchase price of up to $100.0 million, with an accordion feature of up to $200.0 million at the mutual discretion and agreement of HSLFI and the NYL Noteholders. On June 1, 2018, HSLFI sold or contributed to HFI certain secured loans made to certain portfolio companies pursuant to a sale and servicing agreement with HFI, as Issuer, and the Company, as Servicer (the “Sale and Servicing Agreement”), as amended by that certain Amendment No. 1 to the Sale and Servicing Agreement, dated June 19, 2019 (the “Amendment No. 1”). Any notes issued by HFI were collateralized by all investments held by HFI and permitted an advance rate of up to 67% of the aggregate principal amount of eligible debt investments. The notes were issued pursuant to that certain indenture by and between HFI and U.S. Bank National Association, dated as of June 1, 2018 (the “Indenture”). Prior to June 5, 2020, the interest rate on the notes issued under the NYL Facility was based on the three year USD mid-market swap rate plus a margin of between 2.75% and 3.25% depending on the rating of such notes at the time of issuance. There were $15.0 million in advances made by the NYL Noteholders as of December 31, 2019 at an interest rate of 4.98%.
The following table shows HSLFI’s investments as of December 31, 2019:
|
| |
| |
| Principal |
| Cost of |
| Fair | |||
Portfolio Company (1) | | Sector | | Type of Investment (2)(3)(4) | | Amount | | Investments(5) | | Value | |||
(Dollars in thousands) | |||||||||||||
Debt Investments — Life science | | | | | | | | | | | | | |
Celsion Corporation (6)(7)(8) |
| Biotechnology |
| Term Loan (9.63% cash (Libor + 7.63%; Floor 9.63%), 4.00% ETP, Due 7/1/22) | | $ | 2,500 | | $ | 2,464 | | $ | 2,464 |
|
| |
| Term Loan (9.63% cash (Libor + 7.63%; Floor 9.63%), 4.00% ETP, Due 7/1/22) | | | 2,500 | | | 2,464 | | | 2,464 |
Encore Dermatology, Inc. (6)(7) |
| Biotechnology |
| Term Loan (10.00% cash (Libor + 7.50%; Floor 10.00%), 3.00% ETP, Due 4/1/23) | |
| 5,000 | |
| 4,929 | |
| 4,929 |
Mustang Bio, Inc. (6)(7)(8) |
| Biotechnology |
| Term Loan (9.00% cash (Libor + 6.50%; Floor 9.00%), 5.00% ETP, Due 10/1/22) | |
| 5,000 | |
| 4,924 | |
| 4,924 |
Total Debt Investments — Life science |
| |
| | |
|
| |
| 14,781 | |
| 14,781 |
Debt Investments — Technology |
|
|
|
| |
|
| |
|
| |
|
|
Bridge2 Solutions, LLC (6)(7) |
| Software |
| Term Loan (11.00% cash (Libor + 8.4%; Floor 11.00%), 2.00% ETP, Due 9/1/23) | |
| 500 | |
| 481 | | | 481 |
New Signature US, Inc. (6)(7)(9) |
| Software |
| Term Loan (10.50% cash (Libor + 8.50%; Floor 10.50%), 3.50% ETP, Due 7/1/22) | |
| 8,250 | |
| 8,163 | | | 8,163 |
|
| |
| Term Loan (10.50% cash (Libor + 8.50%; Floor 10.50%), 3.50% ETP, Due 2/1/23) | |
| 3,000 | |
| 2,961 | |
| 2,961 |
OutboundEngine, Inc. (6)(7) |
| Software |
| Term Loan (11.15% cash (Libor + 8.40%; Floor 11.15%), 3.00% ETP, Due 7/1/23) | |
| 500 | |
| 491 | | | 491 |
Revinate, Inc. (6)(7) |
| Software |
| Term Loan (9.50% cash (Libor + 7.00%; Floor 9.50%), 3.00% ETP, Due 6/1/23) | |
| 4,000 | |
| 3,952 | |
| 3,952 |
Total Debt Investments — Technology |
| |
| | |
|
| |
| 16,048 | |
| 16,048 |
Debt Investments — Healthcare information and services |
|
| |
|
| |
|
| |
|
| ||
HealthEdge Software, Inc. (6)(7) |
| Software |
| Term Loan (9.94% cash (Libor + 8.25%; Floor 9.25%), 3.00% ETP, Due 10/1/23) | |
| 3,750 | |
| 3,709 | |
| 3,709 |
Total Debt Investments — Healthcare information and services |
| | |
|
| |
| 3,709 | |
| 3,709 | ||
Total Debt Investments |
| |
| | |
|
| |
| 34,538 | |
| 34,538 |
| | | | | | | | | | | | | |
Warrant Investments — Life science |
|
|
|
| |
|
| |
|
| |
|
|
120
Celsion Corporation (6)(7)(8) |
| Biotechnology |
| 95,057 Common Stock Warrants | | | | |
| 58 | |
| 6 |
Encore Dermatology, Inc. (6)(7) |
| Biotechnology |
| 503,626 Preferred Stock Warrants | | | | |
| 38 | |
| — |
Mustang Bio, Inc. (6)(7)(8) |
| Biotechnology |
| 72,046 Common Stock Warrants | | | | |
| 45 | |
| 74 |
CSA Medical, Inc. (6)(7) |
| Medical Device |
| 17,751 Preferred Stock Warrants | | | | |
| 2 | |
| 2 |
Total Warrant Investments — Life science |
| |
| | | | | |
| 143 | |
| 82 |
Warrant Investments — Technology |
|
|
|
| | | | |
|
| |
|
|
Intelepeer Holdings, Inc. (6)(7) |
| Communications |
| 2,081,934 Preferred Stock Warrants | | | | |
| 82 | |
| 72 |
Bridge2 Solutions, LLC (6)(7) | | Software | | 2,500 Common Stock Warrants | | | | | | 18 | | | 34 |
BSI Platform Holdings, LLC (6)(7)(9) |
| Software |
| 562,500 Preferred Stock Warrants | | | | |
| 77 | |
| 62 |
OutboundEngine, Inc. (6)(7) | | Software | | 40,000 Preferred Stock Warrants | | | | | | 5 | | | 6 |
Revinate Inc. (6)(7) |
| Software |
| 216,362 Preferred Stock Warrants | | | | |
| 16 | |
| 18 |
Total Warrant Investments — Technology |
| |
| | | | | |
| 198 | |
| 192 |
Warrant Investments — Healthcare information and services |
|
| | | | |
|
| |
|
| ||
HealthEdge Software, Inc. (6)(7) |
| Software |
| 47,418 Preferred Stock Warrants | | | | |
| 16 | |
| 17 |
Total Warrant Investments — Healthcare information and services |
| | |
|
| |
| 16 | |
| 17 | ||
Total Warrant Investments |
| |
| | |
|
| |
| 357 | |
| 291 |
| | | | | | | | | | | | | |
Total Portfolio Investment Assets |
| |
| | |
|
| | $ | 34,895 | | $ | 34,829 |
| | | | | | | | | | | | | |
Short Term Investments — Unrestricted Investments |
| | |
|
| |
|
| |
|
| ||
US Bank Money Market Deposit Account (6) |
| | |
|
| | $ | 11,201 | | $ | 11,201 | ||
Total Short Term Investments — Unrestricted Investments |
| | |
|
| | $ | 11,201 | | $ | 11,201 | ||
| | | | | | | | | | | | | |
Short Term Investments — Restricted Money Market Funds |
| | |
|
| |
|
| |
|
| ||
US Bank Money Market Deposit Account (6) |
| | |
|
| | $ | 138 | | $ | 138 | ||
Total Short Term Investments — Restricted Money Market Funds |
| | |
|
| | $ | 138 | | $ | 138 | ||
| (1) | All investments of HSLFI are in entities which are organized under the laws of the United States and have a principal place of business in the United States. |
| (2) | All interest is payable in cash due monthly in arrears, unless otherwise indicated, and applies only to HSLFI’s debt investments. Interest rate is the annual interest rate on the debt investment and does not include ETPs and any additional fees related to the investments, such as deferred interest, commitment fees or prepayment fees. Debt investments are at variable rates for the term of the debt investment, unless otherwise indicated. All debt investments based on LIBOR are based on one-month LIBOR. For each debt investment, the current interest rate in effect as of December 31, 2019 is provided. |
| (3) | ETPs are contractual fixed-interest payments due in cash at the maturity date of the applicable debt investment, including upon any prepayment, and are a fixed percentage of the original principal balance of the debt investments unless otherwise noted. Interest will accrue during the life of the debt investment on each ETP and will be recognized as non-cash income until it is actually paid. |
| (4) | Warrants are non-income producing. |
| (5) | For debt investments, represents principal balance less unearned income. |
| (6) | Has been pledged as collateral under the NYL Facility. |
| (7) | The fair value of the investment was valued using significant unobservable inputs. |
| (8) | Portfolio company is a public company. |
| (9) | New Signature US, Inc. is a subsidiary of BSI Platform Holdings, LLC. |
121
The following tables show certain summarized financial information for HSLFI as of December 31, 2019, for the period January 1, 2020 through April 21, 2020, for the year ended December 31, 2019 and for the period June 1, 2018 through December 31, 2018:
| | December 31, | |
|
| 2019 | |
| | (In thousands) | |
Selected Statement of Assets and Liabilities Information |
| |
|
Total investments at fair value (cost of $34,895) | | $ | 34,829 |
Cash and cash equivalents | |
| 503 |
Investments in money market funds | |
| 11,201 |
Restricted investments in money market funds | | | 138 |
Interest receivable | |
| 477 |
Other assets | |
| 1,109 |
Total assets | | $ | 48,257 |
| | | |
Borrowings | | $ | 14,955 |
Other liabilities | |
| 126 |
Total liabilities | |
| 15,081 |
Members’ equity | |
| 33,176 |
Total liabilities and members’ equity | | $ | 48,257 |
| | For the period | | | | For the period | |||
| | January 1, 2020 | | For the year | | June 1, 2018 | |||
| | through | | ended | | through | |||
|
| April 21, 2020 |
| December 31, 2019 |
| December 31, 2018 | |||
| | (In thousands) | |||||||
Selected Statements of Operations Information | |
| | |
| | |
| |
Interest income on investments | | $ | 1,353 | | $ | 5,291 | | $ | 689 |
Total investment income | | $ | 1,465 | | $ | 5,699 | | $ | 689 |
Total expenses | | $ | 1,229 | | $ | 1,227 | | $ | 180 |
Net investment income | | $ | 236 | | $ | 4,472 | | $ | 509 |
Net realized gain on investments | | $ | 120 | | | — | | $ | — |
Net unrealized depreciation on investments | | $ | (392) | | $ | (28) | | $ | (37) |
Net (decrease) increase in net assets resulting from operations | | $ | (36) | | $ | 4,444 | | $ | 472 |
Note 5. Transactions with affiliated companies
A non-controlled affiliated company is generally a portfolio company in which the Company owns 5% or more of such portfolio company’s voting securities but not more than 25% of such portfolio company’s voting securities.
122
Transactions related to investments in non-controlled affiliated companies for the year ended December 31, 2020 were as follows:
| | | | |
| | | Year ended December 31, 2020 | |
| | |
| | |
| | ||||||||||
| | Fair value at | | | | | | | | Transfers | | | | | Net | | Fair value at | | | | | | |||||
Portfolio | | December 31, | | | | | Principal | | in/(out) at | | Discount | | unrealized | | December 31, | | Net realized | | Interest | ||||||||
Company |
| 2019 |
| Purchases |
| Payments |
| fair value |
| accretion |
| gain/(loss) |
| 2020 |
| gain/(loss) |
| income | |||||||||
| | (In thousands) | |||||||||||||||||||||||||
Decisyon, Inc. | | $ | 1,206 | | $ | — | | $ | (25) | | $ | — | | $ | — | | $ | — | | $ | 1,181 | | $ | — | | $ | 165 |
| |
| 639 | |
| (45) | |
| (14) | |
| — | |
| 46 | |
| — | |
| 626 | |
| — | |
| 87 |
| |
| 234 | |
| — | |
| (7) | |
| — | |
| — | |
| — | |
| 227 | |
| — | |
| 27 |
| |
| 234 | |
| — | |
| (6) | |
| — | |
| — | |
| — | |
| 228 | |
| — | |
| 27 |
| |
| 704 | |
| — | |
| (19) | |
| — | |
| — | |
| — | |
| 685 | |
| — | |
| 83 |
| |
| 283 | |
| — | |
| (7) | |
| — | |
| — | |
| — | |
| 276 | |
| — | |
| 35 |
| |
| 187 | |
| — | |
| (4) | |
| — | |
| — | |
| — | |
| 183 | |
| — | |
| 23 |
| |
| 75 | |
| 45 | |
| — | |
| — | |
| — | |
| — | |
| 120 | |
| — | |
| — |
StereoVision, Inc. | |
| 2,382 | |
| — | |
| — | |
| — | |
| — | |
| — | |
| 2,382 | |
| — | |
| 242 |
| |
| 2,653 | |
| — | |
| — | |
| — | |
| — | |
| (1,014) | |
| 1,639 | |
| — | |
| — |
Total non-controlled affiliates | | $ | 8,597 | | $ | — | | $ | (82) | | $ | — | | $ | 46 | | $ | (1,014) | | $ | 7,547 | | $ | — | | $ | 689 |
Transactions related to investments in non-controlled affiliated companies for the year ended December 31, 2019 were as follows:
| | | | |
| | | Year ended December 31, 2019 | |
| | |
| | |
| | ||||||||||
| | Fair value at | | | | | | | | Transfers | | | | | Net | | Fair value at | | | | | | | ||||
Portfolio | | December 31, | | | | | Principal | | in/(out) at | | Discount | | unrealized | | December 31, | | Net realized | | Interest | ||||||||
Company |
| 2018 |
| Purchases |
| Payments |
| fair value |
| accretion |
| gain/(loss) |
| 2019 |
| gain/(loss) |
| income | |||||||||
| | (In thousands) | |||||||||||||||||||||||||
Decisyon, Inc. | | $ | 1,464 | | $ | — | | $ | (316) | | $ | — | | $ | — | | $ | 58 | | $ | 1,206 | | $ | — | | $ | 212 |
| |
| 764 | |
| — | |
| (173) | |
| — | |
| 17 | |
| 31 | |
| 639 | |
| — | |
| 112 |
| |
| 240 | |
| — | |
| (16) | |
| — | |
| — | |
| 10 | |
| 234 | |
| — | |
| 31 |
| |
| 240 | |
| — | |
| (16) | |
| — | |
| — | |
| 10 | |
| 234 | |
| — | |
| 31 |
| |
| 721 | |
| — | |
| (46) | |
| — | |
| — | |
| 29 | |
| 704 | |
| — | |
| 93 |
| |
| 289 | |
| — | |
| (17) | |
| — | |
| — | |
| 11 | |
| 283 | |
| — | |
| 39 |
| |
| 192 | |
| — | |
| (13) | |
| — | |
| — | |
| 8 | |
| 187 | |
| — | |
| 26 |
| |
| 75 | |
| — | |
| — | |
| — | |
| — | |
| — | |
| 75 | |
| — | |
| — |
StereoVision, Inc. | |
| 2,798 | |
| — | |
| (416) | |
| — | |
| — | |
| — | |
| 2,382 | |
| — | |
| 295 |
| |
| 791 | |
| — | |
| — | |
| — | |
| — | |
| 1,862 | |
| 2,653 | |
| — | |
| — |
Total non-controlled affiliates | | $ | 7,574 | | $ | — | | $ | (1,013) | | $ | — | | $ | 17 | | $ | 2,019 | | $ | 8,597 | | $ | — | | $ | 839 |
123
A controlled affiliated company is generally a portfolio company in which the Company owns more than 25% of such portfolio company’s voting securities or has the power to exercise control over management or policies of such portfolio company (including through a management agreement). Transactions related to investments in controlled affiliated companies for the year ended December 31, 2020 were as follows:
| | | | |
| | | Year ended December 31, 2020 | | | | |
| | |
| | ||||||||||
| | | | | | | | | | | | | | | | | | | | | | | | | | | |
| | Fair value at | | | | | | | Transfers | | | | | Net | | | | | Fair value at | | | | |||||
Portfolio |
| December 31, | | | | | |
| in/(out) at | | Dividends |
| unrealized | | Net realized |
| December 31, | | Dividend | ||||||||
Company |
| 2019 |
| Purchases |
| Distributions |
| fair value |
| declared |
| gain/(loss) |
| gain/(loss) |
| 2020 |
| income | |||||||||
| | (In thousands) | |||||||||||||||||||||||||
HSLFI(1) | | $ | 16,650 | | $ | — | | $ | — | | $ | (16,498) | | $ | 118 | | $ | (12) | | $ | (258) | | $ | — | | $ | 118 |
HESP LLC | | | — | | | — | | | — | | | 1,500 | | | — | | | — | | | — | | | 1,500 | | | — |
Total controlled affiliates | | $ | 16,650 | | $ | — | | $ | — | | $ | (14,998) | | $ | 118 | | $ | (12) | | $ | (258) | | $ | 1,500 | | $ | 118 |
| (1) | The Company and Arena were the members of HSLFI, a joint venture formed as a Delaware limited liability company that was not consolidated by either member for financial reporting purposes. The members provided cash or securities in portfolio companies to HSLFI in exchange for limited liability company equity interests. All HSLFI investment decisions required unanimous approval of a quorum of HSLFI’s board of managers, which consisted of two representatives of the Company and Arena. Because management of HSLFI was shared equally between the Company and Arena, the Company did not have sole control over significant actions of HSLFI for purposes of the 1940 Act or otherwise. On April 21, 2020, the Company purchased all of the limited liability company interests of Arena in HSLFI. As of December 31, 2020, HLSFI is consolidated by the Company. |
Transactions related to investments in controlled affiliated companies for the year ended December 31, 2019 were as follows:
| | | | |
| | | Year ended December 31, 2019 | |
| | |
| | |
| | ||||||||||
| | | | | | | | | | | | | | | | | | | | | | | | | | | |
| | Fair value at | | | | | | | | Transfers | | | | | Net | | | | | Fair value at | | | | ||||
Portfolio |
| December 31, | | | | | | |
| in/(out) at | | Dividends |
| unrealized | | Net realized |
| December 31, | | Dividend | |||||||
Company |
| 2018 |
| Purchases |
| Distributions |
| fair value |
| declared |
| gain/(loss) |
| gain/(loss) |
| 2019 |
| income | |||||||||
| | (In thousands) | |||||||||||||||||||||||||
HSLFI(1) | | $ | 13,243 | | $ | 1,900 | | $ | (715) | | $ | — | | $ | 2,236 | | $ | (14) | | $ | — | | $ | 16,650 | | $ | 2,236 |
Total controlled affiliates | | $ | 13,243 | | $ | 1,900 | | $ | (715) | | $ | — | | $ | 2,236 | | $ | (14) | | $ | — | | $ | 16,650 | | $ | 2,236 |
| (1) | The Company and Arena were the members of HSLFI, a joint venture formed as a Delaware limited liability company that was not consolidated by either member for financial reporting purposes. The members provided cash or securities in portfolio companies to HSLFI in exchange for limited liability company equity interests. All HSLFI investment decisions required unanimous approval of a quorum of HSLFI’s board of managers, which consisted of two representatives of the Company and Arena. Because management of HSLFI was shared equally between the Company and Arena, the Company did not have sole control over significant actions of HSLFI for purposes of the 1940 Act or otherwise. |
Note 6. Fair value
The Company uses fair value measurements to record fair value adjustments to certain assets and liabilities and to determine fair value disclosures. Fair value is the price that would be received to sell an asset or paid to transfer a liability in an orderly transaction between market participants at the measurement date. Fair value is best determined based upon quoted market prices. However, in certain instances, there are no quoted market prices for certain assets or liabilities. In cases where quoted market prices are not available, fair values are based on estimates using present value or other valuation techniques. Those techniques are significantly affected by the assumptions used, including the discount rate and estimates
124
of future cash flows. Accordingly, the fair value estimates may not be realized in an immediate settlement of the asset or liability.
Fair value measurements focus on exit prices in an orderly transaction (that is, not a forced liquidation or distressed sale) between market participants at the measurement date under current market conditions. If there has been a significant decrease in the volume and level of activity for the asset or liability, a change in valuation technique or the use of multiple valuation techniques may be appropriate. In such instances, determining the price at which willing market participants would transact at the measurement date under current market conditions depends on the facts and circumstances and requires the use of significant judgment.
The Company’s fair value measurements are classified into a fair value hierarchy in accordance with ASC Topic 820, Fair Value Measurement, based on the markets in which the assets and liabilities are traded and the reliability of the assumptions used to determine fair value. The three categories within the hierarchy are as follows:
Level 1 | Quoted prices in active markets for identical assets and liabilities. |
Level 2 | Observable inputs other than Level 1 prices such as quoted prices for similar assets or liabilities in active markets, quoted prices in markets that are not active, and model-based valuation techniques for which all significant inputs are observable or can be corroborated by observable market data for substantially the full term of the assets or liabilities. |
Level 3 | Unobservable inputs that are supported by little or no market activity and that are significant to the fair value of the assets or liabilities. Level 3 assets and liabilities include financial instruments whose value is determined using pricing models, discounted cash flow methodologies or similar techniques, as well as instruments for which the determination of fair value requires significant management judgment or estimation. |
Investments are valued at fair value as determined in good faith by the Board, based on input of management, the audit committee and independent valuation firms which are engaged at the direction of the Board to assist in the valuation of each portfolio investment lacking a readily available market quotation at least once during a trailing twelve-month period under a valuation policy and a consistently applied valuation process. This valuation process is conducted at the end of each fiscal quarter, with at least 25% (based on fair value) of the Company’s valuation of portfolio companies lacking readily available market quotations subject to review by an independent valuation firm.
Because there is not a readily available market value for most of the investments in its portfolio, the Company values substantially all of its portfolio investments at fair value as determined in good faith by the Board, as described herein. Due to the inherent uncertainty of determining the fair value of investments that do not have a readily available market value, the fair value of the Company’s investments may fluctuate from period to period. Additionally, the fair value of the Company’s investments may differ significantly from the values that would have been used had a ready market existed for such investments and may differ materially from the values that the Company may ultimately realize. Further, such investments are generally subject to legal and other restrictions on resale or otherwise are less liquid than publicly traded securities. If the Company was required to liquidate a portfolio investment in a forced or liquidation sale, the Company could realize significantly less than the value at which the Company has recorded such portfolio investment.
Cash and interest receivable: The carrying amount is a reasonable estimate of fair value. These financial instruments are not recorded at fair value on a recurring basis and are categorized as Level 1 within the fair value hierarchy described above.
Money market funds: The carrying amounts are valued at their net asset value as of the close of business on the day of valuation. These financial instruments are recorded at fair value on a recurring basis and are categorized as Level 2 within the fair value hierarchy described above as these funds can be redeemed daily.
Debt investments: The fair value of debt investments is estimated by discounting the expected future cash flows using the year end rates at which similar debt investments would be made to borrowers with similar credit ratings and for the same remaining maturities. At December 31, 2020 and 2019, the hypothetical market yields used ranged from 10% to 23% and 10% to 16%, respectively. Significant increases (decreases) in this unobservable input would result in a significantly
125
lower (higher) fair value measurement. These assets are recorded at fair value on a recurring basis and are categorized as Level 3 within the fair value hierarchy described above.
Under certain circumstances, the Company may use an alternative technique to value debt investments that better reflects its fair value such as the use of multiple probability weighted cash flow models when the expected future cash flows contain elements of variability.
Warrant investments: The Company values its warrants using the Black-Scholes valuation model incorporating the following material assumptions:
| ● | Underlying asset value of the issuer is estimated based on information available, including any information regarding the most recent rounds of borrower funding. Significant increases (decreases) in this unobservable input would result in a significantly higher (lower) fair value measurement. |
| ● | Volatility, or the amount of uncertainty or risk about the size of the changes in the warrant price, is based on indices of publicly traded companies similar in nature to the underlying company issuing the warrant. A total of seven such indices are used. Significant increases (decreases) in this unobservable input would result in a significantly higher (lower) fair value measurement. |
| ● | The risk-free interest rates are derived from the U.S. Treasury yield curve. The risk-free interest rates are calculated based on a weighted average of the risk-free interest rates that correspond closest to the expected remaining life of the warrant. |
| ● | Other adjustments, including a marketability discount on private company warrants, are estimated based on management’s judgment about the general industry environment. |
| ● | Historical portfolio experience on cancellations and exercises of the Company’s warrants are utilized as the basis for determining the estimated time to exit of the warrants in each financial reporting period. Warrants may be exercised in the event of acquisitions, mergers or initial public offerings, and cancelled due to events such as bankruptcies, restructuring activities or additional financings. These events cause the expected remaining life assumption to be shorter than the contractual term of the warrants. Significant increases (decreases) in this unobservable input would result in significantly higher (lower) fair value measurement. |
Under certain circumstances the Company may use an alternative technique to value warrants that better reflects the warrants’ fair value, such as an expected settlement of a warrant in the near term or a model that incorporates a put feature associated with the warrant. The fair value may be determined based on the expected proceeds to be received from such settlement or based on the net present value of the expected proceeds from the put option.
The fair value of the Company’s warrants held in publicly traded companies is determined based on inputs that are readily available in public markets or can be derived from information available in public markets. Therefore, the Company has categorized these warrants as Level 2 within the fair value hierarchy described above. The fair value of the Company’s warrants held in private companies is determined using both observable and unobservable inputs and represents management’s best estimate of what market participants would use in pricing the warrants at the measurement date. Therefore, the Company has categorized these warrants as Level 3 within the fair value hierarchy described above. These assets are recorded at fair value on a recurring basis.
Equity investments: The fair value of an equity investment in a privately held company is initially the face value of the amount invested. The Company adjusts the fair value of equity investments in private companies upon the completion of a new third-party round of equity financing. The Company may make adjustments to fair value, absent a new equity financing event, based upon positive or negative changes in a portfolio company’s financial or operational performance. Significant increases (decreases) in this unobservable input would result in a significantly higher (lower) fair value measurement. The Company has categorized these equity investments as Level 3 within the fair value hierarchy described above. The fair value of an equity investment in a publicly traded company is based upon the closing public share price on the date of measurement. Therefore, the Company has categorized these equity investments as Level 1 within the fair value hierarchy described above. These assets are recorded at fair value on a recurring basis.
Other investments: Other investments are valued based on the facts and circumstances of the underlying contractual agreement. The Company currently values these contractual agreements using a multiple probability weighted cash flow model as the contractual future cash flows contain elements of variability. Significant changes in the estimated cash flows
126
and probability weightings would result in a significantly higher or lower fair value measurement. The Company has categorized these other investments as Level 3 within the fair value hierarchy described above. These other investments are recorded at fair value on a recurring basis.
The following tables provide a summary of quantitative information about the Company’s Level 3 fair value measurements of its investments as of December 31, 2020 and 2019. In addition to the techniques and inputs noted in the table below, according to the Company’s valuation policy, the Company may also use other valuation techniques and methodologies when determining its fair value measurements.
The following table is not intended to be all-inclusive, but rather provides information on the significant Level 3 inputs as they relate to the Company’s fair value measurements as of December 31, 2020:
December 31, 2020 |
| |||||||||||||
| | Fair | | Valuation Techniques/ | | Unobservable | | | | | Weighted |
| ||
Investment Type |
| Value |
| Methodologies |
| Input |
| Range |
| Average(1) |
| |||
| |
| | | (Dollars in thousands, except per share data) | | | | | | |
| ||
Debt investments | | $ | 324,670 |
| Discounted Expected Future Cash Flows |
| Hypothetical Market Yield |
|
| 10% – 23% | | | 12 | % |
| | | 8,825 | | Liquidation Scenario | | Probability Weighting | | | 100% | | | 100 | % |
| | | | | | | | | | | | | | |
Warrant investments | | | 11,556 |
| Black-Scholes Valuation Model |
| Price Per Share | | | $0.00 – $980.00 | | $ | 21.68 | |
| | | | | | | Average Industry Volatility | | | 28% | | | 28 | % |
| | | | | | | Marketability Discount | | | 20% | | | 20 | % |
| | | | | |
| Estimated Time to Exit |
|
| 1 to 4 years | | | 3 | years |
| | | | | | | | | | | | | | |
| | | 1,180 | | Estimated Proceeds | | Price Per Share | | | $3.41 | | $ | 3.41 | |
| | | | | |
| | | | | | | | |
Other investments | | | 200 |
| Multiple Probability Weighted Cash Flow Model |
| Discount Rate | | | 25% | | | 25 | % |
| | | | | | | Probability Weighting | | | 100% | | | 100 | % |
| | | | | | | | | | | | | | |
| | | 1,500 | | Liquidation Scenario | | Probability Weighting | | | 50% | | | 50 | % |
| | | | | | | | | | | | | | |
Equity investments | | | 2,117 |
| Last Equity Financing |
| Price Per Share | | | $0.00 – $13.04 | | $ | 2.49 | |
Total Level 3 investments | | $ | 350,048 | | | | | | |
| | |
| |
| (1) | Weighted average is calculated by multiplying (a) the unobservable input for each investment in the investment type by (b) (1) the fair value of the related investment in the investment type divided by (2) the total fair value of the investment type. |
The following table is not intended to be all-inclusive, but rather provides information on the significant Level 3 inputs as they relate to the Company’s fair value measurements as of December 31, 2019:
December 31, 2019 |
| |||||||||||||
| | Fair | | Valuation Techniques/ | | Unobservable | | | | | Weighted |
| ||
Investment Type |
| Value |
| Methodologies |
| Input |
| Range |
| Average(1) |
| |||
| | | | | (Dollars in thousands, except per share data) | | | | | | |
| ||
Debt investments | | $ | 262,635 |
| Discounted Expected Future Cash Flows |
| Hypothetical Market Yield |
|
| 10% – 16% | | | 12 | % |
| | | 13,864 | | Liquidation Scenario | | Probability Weighting | | | 13% – 100% | | | 50 | % |
| | | 11,856 | | Multiple Probability Weighted Cash Flow Model | | Probability Weighting | | | 10% – 60% | | | 38 | % |
| | | | | | | | | | | | | | |
Warrant investments | | | 5,598 |
| Black-Scholes Valuation Model |
| Price Per Share | | | $0.00 – $980.00 | | $ | 12.42 | |
| | | | | | | Average Industry Volatility | | | 22% | | | 22 | % |
| | | | | | | Marketability Discount | | | 20% | | | 20 | % |
| | | | | |
| Estimated Time to Exit |
|
| 1 to 4 years | | | 3 | years |
| | | | | |
| Price Per Share | | | $6.22 – $12.90 | | $ | 9.48 | |
| | | 4,561 |
| Estimated Proceeds |
| Discount Rate | | | 0% – 20% | | | 10 | % |
| | | | | | | | | | | | | | |
Other investments | | | 500 |
| Multiple Probability Weighted Cash Flow Model |
| Discount Rate | | | 25% | | | 25 | % |
| | | | | | | Probability Weighting | | | 100% | | | 100 | % |
| | | | | | | | | | | | | | |
Equity investments | | | 3,125 |
| Last Equity Financing |
| Price Per Share | | | $0.00 – $13.04 | | $ | 2.71 | |
Total Level 3 investments | | $ | 302,139 | | | | | | |
| | |
| |
| (1) | Weighted average is calculated by multiplying (a) the unobservable input for each investment in the investment type by (b) (1) the fair value of the related investment in the investment type divided by (2) the total fair value of the investment type. |
127
Borrowings: The Key Facility and the NYL Facility approximate fair value due to the variable interest rate of the facilities and are categorized as Level 2 within the fair value hierarchy described above. Additionally, the Company considers its creditworthiness in determining the fair value of such borrowings. The fair value of the fixed-rate 2022 Notes (as defined in Note 7) is based on the closing public share price on the date of measurement. On December 31, 2020, the closing price of the 2022 Notes on the New York Stock Exchange was $25.60 per note, or $38.3 million. Therefore, the Company has categorized this borrowing as Level 1 within the fair value hierarchy described above. Based on market quotations on December 31, 2020, the Asset-Backed Notes (as defined in Note 7) were trading at par value, or $100.0 million, and are categorized as Level 3 within the fair value hierarchy described above. These borrowings are not recorded at fair value on a recurring basis.
Off-balance-sheet instruments: Fair values for off-balance-sheet lending commitments are based on fees currently charged to enter into similar agreements, taking into account the remaining terms of the agreements and the counterparties’ credit standings. Therefore, the Company has categorized these instruments as Level 3 within the fair value hierarchy described above.
The following tables detail the assets that are carried at fair value and measured at fair value on a recurring basis as of December 31, 2020 and 2019 and indicate the fair value hierarchy of the valuation techniques utilized by the Company to determine the fair value:
|
| December 31, 2020 | ||||||||||
|
| Level 1 |
| Level 2 |
| Level 3 |
| Total | ||||
| | (In thousands) | ||||||||||
Investments in money market funds | | $ | — | | $ | 27,199 | | $ | — | | $ | 27,199 |
Restricted investments in money market funds | | $ | — | | $ | 1,057 | | $ | — | | $ | 1,057 |
Debt investments | | $ | — | | $ | — | | $ | 333,495 | | $ | 333,495 |
Warrant investments | |
| — | |
| 1,295 | |
| 12,736 | |
| 14,031 |
Other investments | |
| — | |
| — | |
| 1,700 | |
| 1,700 |
Equity investments | |
| 1,202 | |
| — | |
| 2,117 | |
| 3,319 |
Total investments | | $ | 1,202 | | $ | 1,295 | | $ | 350,048 | | $ | 352,545 |
| | December 31, 2019 | ||||||||||
|
| Level 1 |
| Level 2 |
| Level 3 |
| Total | ||||
| | (In thousands) | ||||||||||
Investments in money market funds | | $ | — | | $ | 9,787 | | $ | — | | $ | 9,787 |
Restricted investments in money market funds | | $ | — | | $ | 1,133 | | $ | — | | $ | 1,133 |
Debt investments | | $ | — | | $ | — | | $ | 288,355 | | $ | 288,355 |
Warrant investments | |
| — | |
| 670 | |
| 10,159 | |
| 10,829 |
Other investments | |
| — | |
| — | |
| 500 | |
| 500 |
Equity investments | |
| 92 | |
| — | |
| 3,125 | |
| 3,217 |
Equity interest in HSLFI(1) | |
| — | |
| — | |
| — | |
| 16,650 |
Total investments | | $ | 92 | | $ | 670 | | $ | 302,139 | | $ | 319,551 |
| (1) | The fair value of Company’s equity interest in HSLFI is determined using the net asset value of the Company’s ownership interest in member’s capital. |
128
The following table shows a reconciliation of the beginning and ending balances for Level 3 assets measured at fair value on a recurring basis for the year ended December 31, 2020:
| | Year ended December 31, 2020 | |||||||||||||
|
| Debt |
| Warrant |
| Equity |
| Other |
| | | ||||
| | Investments | | Investments | | Investments | | Investments | | Total | |||||
| | (In thousands) | |||||||||||||
Level 3 assets, beginning of period | | $ | 288,355 | | $ | 10,159 | | $ | 3,125 | | $ | 500 | | $ | 302,139 |
Purchase of investments |
| | 215,059 |
| | — |
| | — |
| | — |
| | 215,059 |
Warrants and equity received and classified as Level 3 |
| | — |
| | 2,809 |
| | 45 |
| | — |
| | 2,854 |
Principal payments received on investments |
| | (146,216) |
| | — |
| | — |
| | (42) |
| | (146,258) |
Proceeds from sale of investments |
| | (36) |
| | (7,995) |
| | — |
| | — |
| | (8,031) |
Net realized (loss) gain on investments |
| | (19,634) |
| | 4,656 |
| | (225) |
| | — |
| | (15,203) |
Unrealized (depreciation) appreciation included in earnings |
| | (2,347) |
| | 3,049 | | | (842) |
| | (258) |
| | (398) |
Transfer of investment |
| | (1,500) |
| | (14) |
| | 14 |
| | 1,500 |
| | — |
Other |
| | (186) |
| | 72 |
| | — |
| | — |
| | (114) |
Level 3 assets, end of period | | $ | 333,495 | | $ | 12,736 | | $ | 2,117 | | $ | 1,700 | | $ | 350,048 |
During the year ended December 31, 2020, there were no transfers in or out of Level 3.
The change in unrealized appreciation included in the consolidated statement of operations attributable to Level 3 investments still held at December 31, 2020 includes $6.5 million in unrealized depreciation on debt and other investments, $5.0 million in unrealized appreciation on warrant investments and $1.0 million in unrealized depreciation on equity investments.
The following table shows a reconciliation of the beginning and ending balances for Level 3 assets measured at fair value on a recurring basis for the year ended December 31, 2019:
| | Year ended December 31, 2019 | |||||||||||||
|
| Debt |
| Warrant |
| Equity |
| Other |
| | | ||||
| | Investments | | Investments | | Investments | | Investments | | Total | |||||
| | (In thousands) | |||||||||||||
Level 3 assets, beginning of period | | $ | 216,401 | | $ | 8,632 | | $ | 1,289 | | $ | 7,640 | | $ | 233,962 |
Purchase of investments |
| | 200,832 |
| | — |
| | — |
| | — |
| | 200,832 |
Warrants and equity received and classified as Level 3 |
| | — |
| | 2,336 |
| | 240 |
| | — |
| | 2,576 |
Principal payments received on investments |
| | (129,079) |
| | — |
| | — |
| | (111) |
| | (129,190) |
Proceeds from sale of investments |
| | — |
| | (3,369) |
| | (45) |
| | (150) |
| | (3,564) |
Net realized gain (loss) on investments |
| | — |
| | 2,382 |
| | 4 |
| | (6,994) |
| | (4,608) |
Unrealized (depreciation) appreciation included in earnings |
| | (3,004) |
| | 407 |
| | 1,637 |
| | 4,615 |
| | 3,655 |
Transfer out of Level 3 | | | — | | | (190) | | | — | | | — | | | (190) |
Transfer of investment | | | 4,500 | | | — | | | — | | | (4,500) | | | — |
Other |
| | (1,295) |
| | (39) |
| | — |
| | — |
| | (1,334) |
Level 3 assets, end of period | | $ | 288,355 | | $ | 10,159 | | $ | 3,125 | | $ | 500 | | $ | 302,139 |
During the year ended December 31, 2019, there was one transfer out of Level 3. The transfer out of Level 3 related to warrants held in one portfolio company with an aggregate fair value of $0.2 million that was transferred to Level 2 upon the portfolio company becoming a public company. During the year ended December 31, 2019, there were no transfers to Level 3.
The change in unrealized appreciation included in the consolidated statement of operations attributable to Level 3 investments still held at December 31, 2019 includes $3.1 million in unrealized depreciation on debt and other investments, $1.0 million in unrealized appreciation on warrant investments and $1.6 million in unrealized appreciation on equity investments.
129
The Company discloses fair value information about financial instruments, whether or not recognized in the consolidated statement of assets and liabilities, for which it is practicable to estimate that value. Certain financial instruments are excluded from the disclosure requirements. Accordingly, the aggregate fair value amounts presented do not represent the underlying value of the Company.
The fair value amounts have been measured as of the reporting date and have not been reevaluated or updated for purposes of these financial statements subsequent to that date. As such, the fair values of these financial instruments subsequent to the reporting date may be different than amounts reported.
As of December 31, 2020 and 2019, all of the balances of all the Company’s financial instruments were recorded at fair value, except for the Company’s borrowings, as previously described.
Market risk
The Company assumes interest rate risk (the risk that general interest rate levels will change) as a result of its normal operations. As a result, the fair values of the Company’s financial instruments will change when interest rate levels change, and that change may be either favorable or unfavorable to the Company. Management attempts to match maturities of assets and liabilities to the extent believed necessary to minimize interest rate risk. Management monitors rates and maturities of assets and liabilities and attempts to minimize interest rate risk by adjusting terms of new debt investments and by investing in securities with terms that mitigate the Company’s overall interest rate risk.
Note 7. Borrowings
The following table shows the Company’s borrowings as of December 31, 2020 and 2019:
| | December 31, 2020 | | December 31, 2019 | ||||||||||||||
|
| Total |
| Balance |
| Unused |
| Total |
| Balance |
| Unused | ||||||
| | Commitment | | Outstanding | | Commitment | | Commitment | | Outstanding | | Commitment | ||||||
| | (In thousands) | ||||||||||||||||
Key Facility | | $ | 125,000 | | $ | 28,000 | | $ | 97,000 | | $ | 125,000 | | $ | 17,000 | | $ | 108,000 |
NYL Facility | | | 100,000 | | | 22,250 | | | 77,750 | | | — | | | — | | | — |
Asset-Backed Notes |
| | 100,000 |
| | 100,000 |
| | — |
| | 100,000 |
| | 100,000 |
| | — |
2022 Notes |
| | 37,375 |
| | 37,375 |
| | — |
| | 37,375 |
| | 37,375 |
| | — |
Total before debt issuance costs |
| | 362,375 |
| | 187,625 |
| | 174,750 |
| | 262,375 |
| | 154,375 |
| | 108,000 |
Unamortized debt issuance costs attributable to term borrowings |
| | — |
| | (1,806) |
| | — |
| | — |
| | (2,325) |
| | — |
Total borrowings outstanding, net | | $ | 362,375 | | $ | 185,819 | | $ | 174,750 | | $ | 262,375 | | $ | 152,050 | | $ | 108,000 |
On March 23, 2018, the Small Business Credit Availability Act was signed into law as part of an omnibus spending bill, which, among other things, amends the 1940 Act to reduce the minimum required asset coverage applicable to BDCs under the 1940 Act from 200% to 150% if certain approval and disclosure requirements are met. Before such reduced asset coverage requirement can apply to the Company, such reduced asset coverage requirement must be approved by either (a) a “required majority” (as defined in Section 57(o) of the 1940 Act) of the Board, in which case such reduced asset coverage requirement would take effect on the first anniversary of the date of such Board approval, or (b) a majority of votes cast by the stockholders of the Company at a special or annual meeting at which a quorum is present, in which case such reduced asset coverage requirement shall take effect on the day after such approval. On June 7, 2018, a “required majority” of the Board approved the reduced asset coverage requirements and separately recommended that the Company’s stockholders approve the reduced asset coverage requirements at a special meeting of the Company’s stockholders. The Company held a special meeting on October 30, 2018 during which the reduced asset coverage requirements were approved by stockholders. The reduced asset coverage requirements took effect October 31, 2018.
As of December 31, 2020, with certain limited exceptions, as a BDC, the Company is only allowed to borrow amounts such that the Company’s asset coverage, as defined in the 1940 Act, is at least 150% after such borrowings. As of December 31, 2020, the asset coverage for borrowed amounts was 213%.
130
The Company entered into the Key Facility with Key effective November 4, 2013. On June 29, 2020, the Company amended the Key Facility, among other things, to amend the LIBOR floor from 0.75% to 1.00% and to extend the revolving period to September 30, 2021. The Key Facility has an accordion feature which allows for an increase in the total loan commitment to $150 million from the $125 million commitment. The Key Facility is collateralized by all debt investments and warrants held by Credit II and permits an advance rate of up to 50% of eligible debt investments held by Credit II. The Key Facility contains covenants that, among other things, require the Company to maintain a minimum net worth and to restrict the debt investments securing the Key Facility to certain criteria for qualified debt investments and includes portfolio company concentration limits as defined in the related loan agreement. The Key Facility is scheduled to mature on April 6, 2023. The interest rate is based upon the one-month LIBOR, plus a spread of 3.25%, with a LIBOR floor of 1.00%. The LIBOR rate was 0.14% and 1.76% on December 31, 2020 and 2019, respectively. The average interest rate for the years ended December 31, 2020 and 2019 was 4.38% and 5.51%, respectively. The Key Facility requires the payment of an unused line fee in an amount up to 0.50% on an annualized basis of any unborrowed amount available under the facility. As of December 31, 2020 and 2019, the Company had borrowing capacity under the Key Facility of $97.0 million and $108.0 million, respectively. At December 31, 2020 and 2019, $24.8 million and $24.2 million, respectively, was available for borrowing, subject to existing terms and advance rates.
On September 29, 2017, the Company issued and sold an aggregate principal amount of $32.5 million of 6.25% notes due in 2022 and on October 11, 2017, pursuant to the underwriters’ 30 day option to purchase additional notes, the Company sold an additional $4.9 million of such notes (collectively, the “2022 Notes”). The 2022 Notes have a stated maturity of September 15, 2022 and may be redeemed in whole or in part at the Company’s option at any time or from time to time on or after September 15, 2019 at a redemption price of $25 per security plus accrued and unpaid interest. The 2022 Notes bear interest at a rate of 6.25% per year, payable quarterly on March 15, June 15, September 15 and December 15 of each year. The 2022 Notes are the Company’s direct unsecured obligations and (i) rank equally in right of payment with the Company’s current and future unsecured indebtedness; (ii) are senior in right of payment to any of the Company’s future indebtedness that expressly provides it is subordinated to the 2022 Notes; (iii) are effectively subordinated to all of the Company’s existing and future secured indebtedness (including indebtedness that is initially unsecured to which the Company subsequently grants security), to the extent of the value of the assets securing such indebtedness, and (iv) are structurally subordinated to all existing and future indebtedness and other obligations of any of the Company’s subsidiaries. As of December 31, 2020, the Company was in material compliance with the terms of the 2022 Notes. The 2022 Notes are listed on the New York Stock Exchange under the symbol “HTFA”.
On August 13, 2019, the Company completed a term debt securitization in connection with which an affiliate of the Company made an offering of the Asset-Backed Notes. The Asset-Backed Notes were rated A+(sf) by Morningstar Credit Ratings, LLC. There has been no change in the rating since August 13, 2019.
The Asset-Backed Notes were issued by the 2019-1 Trust pursuant to a note purchase agreement, dated as of August 13, 2019, by and among the Company and Keybanc Capital Markets Inc. as Initial Purchaser, and are backed by a pool of loans made to certain portfolio companies of the Company and secured by certain assets of those portfolio companies and are to be serviced by the Company. Interest on the Asset-Backed Notes will be paid, to the extent of funds available, at a fixed rate of 4.21% per annum. The reinvestment period of the Asset-Backed Notes ends July 15, 2021 and the maturity is September 15, 2027.
As of December 31, 2020 and 2019, the Asset-Backed Notes had an outstanding principal balance of $100.0 million.
Under the terms of the Asset-Backed Notes, the Company is required to maintain a reserve cash balance, funded through proceeds from the sale of the Asset-Backed Notes, which may be used to pay monthly interest and principal payments on the Asset-Backed Notes. The Company has segregated these funds and classified them as restricted investments in money market funds. At December 31, 2020 and 2019, there was approximately $1.0 million and $1.1 million of restricted investments, respectively.
On April 21, 2020, the Company purchased all of the limited liability company interests of Arena in HSLFI, which is a party to the NYL Facility. HFI entered into the NYL Facility with the NYL Noteholders for an aggregate purchase price of up to $100.0 million, with an accordion feature of up to $200.0 million at the mutual discretion and agreement of HSLFI and the NYL Noteholders. On June 1, 2018, HSLFI sold or contributed to HFI certain secured loans made to certain portfolio companies pursuant to the Sale and Servicing Agreement. Any notes issued by HFI are collateralized by all
131
investments held by HFI and permit an advance rate of up to 67% of the aggregate principal amount of eligible debt investments. The notes were issued pursuant to the Indenture.
On June 5, 2020, the Company amended the NYL Facility to extend the investment period to June 5, 2022. The investment period will be followed by a five year amortization period. The stated final payment date was extended to June 15, 2027, subject to any extension of the investment period. The interest rate on the notes issued under the NYL Facility is based on the three year USD mid-market swap rate plus a margin of between 3.55% and 5.15% with an interest rate floor, depending on the rating of such notes at the time of issuance. Any obligation to make additional advances was conditioned on the occurrence of certain conditions, which were satisfied June 26, 2020. There were $22.3 million in advances made by the NYL Noteholders as of December 31, 2020 at an interest rate of 4.60%. As of December 31, 2020, the Company had borrowing capacity under the NYL Facility of $77.7 million. At December 31, 2020, $0.9 million was available for borrowing, subject to existing terms and advance rates.
The following table shows information about our senior securities as of December 31, 2020, 2019, 2018, 2017 and 2016:
|
| Total Amount |
| | |
| |
| | | |
| | Outstanding | | | | | Involuntary | | Average | ||
| | Exclusive of | | Asset | | Liquidation | | Market | |||
| | Treasury | | Coverage | | Preference | | Value per | |||
Class and Year | | Securities(1) | | per Unit(2) | | per Unit(3) | | Unit(4) | |||
| | (In thousands, except unit data) | |||||||||
Credit facilities | | | | | | | | | | | |
2020 | | $ | 50,250 | | $ | 7,965 |
| — |
| | N/A |
2019 | | $ | 17,000 | | $ | 19,908 |
| — |
| | N/A |
2018 | | $ | 90,500 | | $ | 2,896 |
| — |
| | N/A |
2017 | | $ | 58,000 | | $ | 3,973 |
| — |
| | N/A |
2016 | | $ | 63,000 | | $ | 3,733 |
| — |
| | N/A |
2022 Notes | | | | | | | | | | | |
2020 | | $ | 37,375 | | $ | 10,708 |
| — | | $ | 24.60 |
2019 | | $ | 37,375 | | $ | 9,055 |
| — | | $ | 25.53 |
2018 | | $ | 37,375 | | $ | 7,014 |
| — | | $ | 25.52 |
2017 | | $ | 37,375 | | $ | 6,166 |
| — | | $ | 25.66 |
2019 Notes | | | | | | | | | | | |
2020 | |
| — | |
| — |
| — | |
| — |
2019 | |
| — | |
| — |
| — | |
| — |
2018 | |
| — | |
| — |
| — | |
| — |
2017 | | | — | | | — |
| — | | | |
2016 | | $ | 33,000 | | $ | 7,127 |
| — | | $ | 25.42 |
2019-1 Securitization | | | | | | | | | | | |
2020 | | $ | 100,000 | | $ | 4,002 |
| — | |
| N/A |
2019 | | $ | 100,000 | | $ | 3,384 |
| — | |
| N/A |
Total senior securities | | | | | | | | | | | |
2020 | | $ | 187,625 | | $ | 2,133 |
| — | |
| N/A |
2019 | | $ | 154,375 | | $ | 2,192 |
| — | |
| N/A |
2018 | | $ | 127,875 | | $ | 2,050 |
| — | |
| N/A |
2017 | | $ | 95,375 | | $ | 2,416 |
| — | |
| N/A |
2016 | | $ | 96,000 | | $ | 2,450 |
| — | |
| N/A |
| (1) | Total amount of senior securities outstanding at the end of the period presented. |
| (2) | Asset coverage per unit is the ratio of the original cost less accumulated depreciation, amortization or impairment of the Company’s total consolidated assets, less all liabilities and indebtedness not represented by senior securities, to the aggregate amount of senior securities representing indebtedness. Asset coverage per unit is expressed in terms of dollar amounts per $1,000 of indebtedness. |
132
| (3) | The amount which the holder of such class of senior security would be entitled upon the voluntary liquidation of the applicable issuer in preference to any security junior to it. The “ — ” in this column indicates that the SEC expressly does not require this information to be disclosed for certain types of securities. |
| (4) | Not applicable to the Company’s credit facilities and 2019-1 Securitization because such securities are not registered for public trading. |
Note 8. Federal income tax
The Company has elected to be treated as a RIC under Subchapter M of the Code and to distribute substantially all of its taxable income. Accordingly, no provision for federal, state or local income tax has been recorded in the financial statements. Taxable income differs from net increase in net assets resulting from operations primarily due to unrealized appreciation on investments as investment gains and losses are not included in taxable income until they are realized.
The following table reconciles net increase in net assets resulting from operations to taxable income:
|
| Years Ended December 31, | |||||||
| | 2020 |
| 2019 |
| 2018 | |||
| | (In thousands) | |||||||
Net increase in net assets resulting from operations | | $ | 6,364 | | $ | 19,498 | | $ | 13,010 |
Net unrealized (appreciation) depreciation on investments | |
| (313) | |
| (3,201) | |
| 1,501 |
Other book-tax differences | |
| 782 | |
| 988 | |
| 199 |
Change in capital loss carry forward | |
| 14,698 | |
| 4,173 | |
| (645) |
Taxable income before deductions for distributions | | $ | 21,531 | | $ | 21,458 | | $ | 14,065 |
The tax characters of distributions paid are as follows:
|
| Years Ended December 31, | |||||||
|
| 2020 |
| 2019 |
| 2018 | |||
| | (In thousands) | |||||||
Ordinary income | | $ | 21,952 | | $ | 16,159 | | $ | 13,834 |
Total | | $ | 21,952 | | $ | 16,159 | | $ | 13,834 |
The components of undistributed ordinary income earnings on a tax basis were as follows:
|
| As of December 31, | |||||||
|
| 2020 |
| 2019 |
| 2018 | |||
| | (In thousands) | |||||||
Undistributed ordinary income | | $ | 6,242 | | $ | 6,536 | | $ | 1,269 |
Long term capital loss carry forward | |
| (59,928) | |
| (45,230) | |
| (41,057) |
Unrealized appreciation | |
| 9,578 | |
| 8,352 | |
| 5,237 |
Unrealized depreciation | |
| (8,545) | |
| (7,596) | |
| (7,717) |
Other temporary differences | |
| 5,983 | |
| 4,700 | |
| 3,123 |
Total | | $ | (46,670) | | $ | (33,238) | | $ | (39,145) |
Depending on the level of taxable income earned in a tax year, the Company may choose to carry forward taxable income in excess of current year distributions into the next tax year and incur a 4% excise tax on such income, as required. For the years ended December 31, 2020 and 2019, the Company elected to carry forward taxable income in excess of current year distributions of $6.2 million and $6.5 million, respectively. At December 31, 2020 and 2019, a provision for excise tax of $0.2 million was recorded.
Capital losses in excess of capital gains earned in a tax year may generally be carried forward, without expiration, and used to offset capital gains, subject to certain limitations. During the years ended December 31, 2020, 2019 and 2018, the Company did not use any of its capital loss carry forward to offset capital gains.
133
For federal income tax purposes, the tax cost of investments at December 31, 2020 and 2019 was $351.5 million and $318.8 million, respectively. The gross unrealized appreciation on investments at December 31, 2020 and 2019 was $9.6 million and $8.4 million, respectively. The gross unrealized depreciation on investments at December 31, 2020 and 2019 was $8.5 million and $7.6 million, respectively.
Note 9. Financial instruments with off-balance-sheet risk
In the normal course of business, the Company is party to financial instruments with off-balance-sheet risk to meet the financing needs of its borrowers. These financial instruments include commitments to extend credit and involve, to varying degrees, elements of credit risk in excess of the amount recognized in the consolidated statement of assets and liabilities. The Company attempts to limit its credit risk by conducting extensive due diligence and obtaining collateral where appropriate.
The balance of unfunded commitments to extend credit was $91.5 million and $49.5 million as of December 31, 2020 and 2019, respectively. Commitments to extend credit consist principally of the unused portions of commitments that obligate the Company to extend credit, such as revolving credit arrangements or similar transactions. These commitments are often subject to financial or non-financial milestones and other conditions to borrow that must be achieved before the commitment can be drawn. In addition, the commitments generally have fixed expiration dates or other termination clauses. Since commitments may expire without being drawn upon, the total commitment amounts do not necessarily represent future cash requirements. This includes the undrawn revolver commitments discussed in Note 4.
The following table provides the Company’s unfunded commitments by portfolio company as of December 31, 2020:
| | December 31, 2020 | ||||
|
| | |
| Fair Value of | |
| | | | | Unfunded | |
| | Principal |
| Commitment | ||
| | Balance |
| Liability | ||
|
| (In thousands) | ||||
Alula Holdings Inc. | | $ | 2,000 | | $ | 27 |
Canary Medical Inc. | | | 7,500 | | | 102 |
Castle Creek Biosciences, Inc. | | | 5,000 | | | 54 |
Ceribell, Inc. | | | 10,000 | | | 64 |
Emalex Biosciences, Inc. | | | 10,000 | | | 103 |
Getaround, Inc. | | | 7,000 | | | 168 |
IDbyDNA, Inc. | | | 5,000 | | | 68 |
Keypath Education Holdings, LLC | | | 5,000 | | | 103 |
Liqid, Inc. | | | 10,000 | | | 54 |
LogicBio, Inc. | | | 5,000 | | | — |
Provivi, Inc. | | | 10,000 | | | 149 |
Revinate, Inc. | |
| 5,000 | |
| 60 |
Sonex Health, Inc. | | | 5,000 | | | 81 |
Topia Mobility Inc. | | | 5,000 | | | 78 |
Total | | $ | 91,500 | | $ | 1,111 |
The table above also provides the fair value of the Company’s unfunded commitment liability as of December 31, 2020 which totaled $1.1 million. The fair value at inception of the delay draw credit agreements is equal to the fees and/or warrants received to enter into these agreements, taking into account the remaining terms of the agreements and the counterparties’ credit profile. The unfunded commitment liability reflects the fair value of these future funding commitments and is included in the Company’s consolidated statement of assets and liabilities.
Note 10. Concentrations of credit risk
The Company’s debt investments consist primarily of loans to development-stage companies at various stages of development in the technology, life science, healthcare information and services and sustainability industries. Many of these companies may have relatively limited operating histories and also may experience variation in operating results.
134
Many of these companies conduct business in regulated industries and could be affected by changes in government regulations. Most of the Company’s borrowers will need additional capital to satisfy their continuing working capital needs and other requirements, and in many instances, to service the interest and principal payments on the loans.
The Company’s largest debt investments may vary from year to year as new debt investments are recorded and existing debt investments are repaid. The Company’s five largest debt investments, at cost, represented 28% of total debt investments outstanding as of December 31, 2020 and 2019. No single debt investment represented more than 10% of the total debt investments as of December 31, 2020 or 2019. Investment income, consisting of interest and fees, can fluctuate significantly upon repayment of large debt investments. Interest income from the five largest debt investments accounted for 23%, 17% and 25% of total interest and fee income on investments for the years ended December 31, 2020, 2019 and 2018, respectively.
Note 11. Distributions
The Company’s distributions are recorded on the declaration date. The following table summarizes the Company’s distribution activity for the years ended December 31, 2020 and 2019:
|
| | |
| | |
| | |
| | |
| DRIP |
| DRIP | |
Date | | | | | | | | Amount | | Cash | | Shares | | Share | |||
Declared | | Record Date | | Payment Date | | Per Share | | Distribution |
| Issued |
| Value | |||||
| | | | | | |
| (In thousands, except share and per share data) | |||||||||
Year Ended December 31, 2020 | | | | | | | | | | | | | | | | | |
10/26/2020 |
| | 2/19/21 |
| | 3/16/21 | | $ | 0.10 | | $ | — |
| — | | $ | — |
10/26/2020 |
| | 1/20/21 |
| | 2/17/21 | |
| 0.10 | |
| 1,904 |
| 1,681 | |
| 25 |
10/26/2020 |
| | 12/17/20 |
| | 1/15/21 | |
| 0.10 | |
| 1,903 |
| 1,909 | |
| 26 |
7/24/20 |
| | 11/18/20 |
| | 12/15/20 | | | 0.10 | | | 1,862 | | 1,699 | | | 22 |
7/24/20 |
| | 10/20/20 |
| | 11/16/20 | |
| 0.10 | |
| 1,815 |
| 1,730 | |
| 21 |
7/24/20 |
| | 9/17/20 |
| | 10/16/20 | |
| 0.10 | |
| 1,813 |
| 1,674 | |
| 22 |
4/24/20 | | | 8/18/20 |
| | 9/15/20 | | | 0.10 | | | 1,745 |
| 1,588 | | | 19 |
4/24/20 | | | 7/17/20 |
| | 8/14/20 | |
| 0.10 | |
| 1,710 |
| 1,586 | |
| 20 |
4/24/20 | | | 6/18/20 |
| | 7/15/20 | |
| 0.10 | |
| 1,703 |
| 1,710 | |
| 20 |
2/28/20 |
| | 5/19/20 |
| | 6/16/20 | | | 0.10 | | | 1,667 |
| 1,646 | | | 18 |
2/28/20 |
| | 4/17/20 |
| | 5/15/20 | |
| 0.10 | |
| 1,667 |
| 1,879 | |
| 19 |
2/28/20 |
| | 3/18/20 |
| | 4/15/20 | |
| 0.15 | |
| 2,496 |
| 3,144 | |
| 30 |
| | | | | | | | $ | 1.25 | | $ | 20,285 | | 20,246 | | $ | 242 |
Year Ended December 31, 2019 | | | | | | | | | | | | | | | | | |
10/25/19 |
| | 2/19/20 |
| | 3/16/20 | | $ | 0.10 | | $ | 1,659 |
| 1,561 | | $ | 18 |
10/25/19 |
| | 1/17/20 |
| | 2/14/20 | |
| 0.10 | |
| 1,660 |
| 1,234 | |
| 17 |
10/25/19 |
| | 12/18/19 |
| | 1/15/20 | |
| 0.10 | |
| 1,519 |
| 1,115 | |
| 15 |
7/26/19 |
| | 11/19/19 |
| | 12/16/19 | | | 0.10 | | | 1,467 | | 1,215 | | | 15 |
7/26/19 |
| | 10/18/19 |
| | 11/15/19 | |
| 0.10 | |
| 1,442 |
| 1,226 | |
| 16 |
7/26/19 |
| | 9/19/19 |
| | 10/16/19 | |
| 0.10 | |
| 1,412 |
| 1,258 | |
| 15 |
4/26/19 |
| | 8/19/19 |
| | 9/17/19 | |
| 0.10 | |
| 1,366 |
| 1,274 | |
| 15 |
4/26/19 |
| | 7/18/19 |
| | 8/15/19 | |
| 0.10 | |
| 1,339 |
| 1,261 | |
| 15 |
4/26/19 |
| | 6/19/19 |
| | 7/16/19 | |
| 0.10 | |
| 1,338 |
| 1,339 | |
| 16 |
3/1/19 |
| | 5/17/19 |
| | 6/17/19 | |
| 0.10 | |
| 1,339 |
| 1,308 | |
| 15 |
3/1/19 |
| | 4/18/19 |
| | 5/15/19 | |
| 0.10 | |
| 1,332 |
| 1,885 | |
| 22 |
3/1/19 |
| | 3/19/19 |
| | 4/16/19 | |
| 0.10 | |
| 1,139 |
| 1,199 | |
| 15 |
| | | | | | | | $ | 1.20 | | $ | 17,012 | | 15,875 | | $ | 194 |
135
On February 26, 2021, the Board declared monthly distributions per share, payable as set forth in the following table:
Ex-Dividend Date |
| Record Date |
| Payment Date |
| Distributions Declared | |
March 17, 2021 | | March 18, 2021 | | April 16, 2021 | | $ | 0.10 |
April 19, 2021 | | April 20, 2021 | | May 14, 2021 | | $ | 0.10 |
May 17, 2021 | | May 18, 2021 | | June 15, 2021 | | $ | 0.10 |
After paying distributions of $1.25 per share deemed paid for tax purposes in 2020, declaring on October 26, 2020 a distribution of $0.10 per share payable January 15, 2021, and taxable earnings of $1.23 per share in 2020, the Company’s undistributed spillover income as of December 31, 2020 was $0.32 per share. Spillover income includes any ordinary income and net capital gains from the preceding tax years that were not distributed during such tax years.
Note 12. Subsequent events
Subsequent to December 31, 2020 pursuant to private foreclosure sales, the Company has received net proceeds of approximately $1.7 million from the sale of substantially all of the assets of The NanoSteel Company, Inc. (“NanoSteel”), which assets collateralized the Company’s debt investment in NanoSteel. The Company does not expect to receive any additional material proceeds from the sale of additional assets of NanoSteel.
On January 14, 2021, the Company funded a $5.0 million debt investment to a new portfolio company, Clara Foods Co.
On January 15, 2021, the Company funded a $7.0 million debt investment to a new portfolio company, Supply Network Visibility Holdings LLC.
On February 23, 2021, the Company funded a $7.0 million debt investment to an existing portfolio company, Getaround, Inc.
On February 25, 2021, the Company funded a $6.0 million debt investment to a new portfolio company, Primary Kids, Inc.
136
Note 13. Financial highlights
The following table shows financial highlights for the Company:
| | Year ended December 31, | | |||||||||||||
|
| 2020 |
| 2019 |
| 2018 |
| 2017 |
| 2016 |
| |||||
| | (In thousands, except share and per share data) | | |||||||||||||
Per share data: | | | | | | | | | | | | | | | | |
Net asset value at beginning of period |
| $ | 11.83 | | $ | 11.64 | | $ | 11.72 | | $ | 12.09 | | $ | 13.85 | |
Net investment income | |
| 1.18 | |
| 1.52 | |
| 1.20 | |
| 1.07 | |
| 1.48 | |
Realized (loss) gain on investments | |
| (0.84) | |
| (0.31) | |
| 0.06 | |
| (1.84) | |
| (0.67) | |
Unrealized appreciation (depreciation) on investments | |
| 0.02 | |
| 0.24 | |
| (0.13) | |
| 1.60 | |
| (1.24) | |
Net increase (decrease) in net assets resulting from operations | |
| 0.36 | |
| 1.45 | |
| 1.13 | |
| 0.83 | |
| (0.43) | |
Distributions declared(1) | |
| (1.25) | |
| (1.20) | |
| (1.20) | |
| (1.20) | |
| (1.34) | |
From net investment income | |
| (1.25) | |
| (1.20) | |
| (1.20) | |
| (1.20) | |
| (1.34) | |
From net realized gain on investments | |
| — | | | — | | | — | | | — | | | — | |
Return of capital | | | — | |
| — | |
| — | |
| — | |
| — | |
Net accretion from repurchase of common stock | |
| — | |
| — | |
| — | |
| — | |
| 0.01 | |
Other (2) | |
| 0.08 | |
| (0.06) | |
| (0.01) | |
| — | |
| — | |
Net asset value at end of period | | $ | 11.02 | | $ | 11.83 | | $ | 11.64 | | $ | 11.72 | | $ | 12.09 | |
Per share market value, beginning of period | | $ | 12.93 | | $ | 11.25 | | $ | 11.22 | | $ | 10.53 | | $ | 11.73 | |
Per share market value, end of period | | $ | 13.24 | | $ | 12.93 | |
| 11.25 | |
| 11.22 | |
| 10.53 | |
Total return based on a market value (3) | | | 12.1 | % |
| 25.6 | % |
| 11.0 | % |
| 17.9 | % |
| 1.5 | % |
Shares outstanding at end of period | | | 19,286,356 | |
| 15,563,290 | |
| 11,535,129 | |
| 11,520,406 | |
| 11,510,424 | |
Ratios, net of waivers, to average net assets: | |
|
| |
|
| |
|
| |
|
| |
|
| |
Expenses without incentive fees | | | 10.0 | % |
| 10.8 | % |
| 10.4 | % |
| 8.6 | % |
| 9.2 | % |
Incentive fees | |
| 2.6 | % |
| 3.2 | % |
| 2.4 | % |
| 1.2 | % |
| 1.4 | % |
Net expenses | |
| 12.6 | % |
| 14.0 | % |
| 12.8 | % |
| 9.8 | % |
| 10.6 | % |
Net investment income with incentive fees | |
| 10.4 | % |
| 12.8 | % |
| 10.3 | % |
| 9.0 | % |
| 11.4 | % |
Ratios, without waivers, to average net assets: | | |
| |
|
| |
|
| |
|
| |
|
| |
Expenses without incentive fees(4) | | | 10.0 | % |
| 10.8 | % |
| 10.4 | % |
| 8.6 | % |
| 9.2 | % |
Incentive fees(4) | |
| 2.6 | % |
| 4.4 | % |
| 3.3 | % |
| 1.3 | % |
| 1.4 | % |
Net expenses(4) | |
| 12.6 | % |
| 15.2 | % |
| 13.7 | % |
| 9.9 | % |
| 10.6 | % |
Net investment income with incentive fees(4) | | | 10.4 | % | | 11.6 | % | | 9.4 | % | | 8.9 | % | | 11.4 | % |
Net assets at the end of the period | | $ | 212,597 | | $ | 184,055 | | $ | 134,257 | | $ | 135,075 | | $ | 139,192 | |
Average net asset value | | $ | 199,302 | | $ | 160,008 | | $ | 134,364 | | $ | 137,293 | | $ | 150,612 | |
Average debt per share | | $ | 9.97 | | $ | 10.05 | | $ | 8.62 | | $ | 6.60 | | $ | 8.91 | |
Portfolio turnover ratio | |
| 38.7 | %(5) |
| 82.0 | %(6) |
| 50.4 | %(6) |
| 79.4 | %(6) |
| 27.1 | %(6) |
| (1) | Distributions are determined based on taxable income calculated in accordance with income tax regulations, which may differ from amounts determined under GAAP due to (i) changes in unrealized appreciation and depreciation, (ii) temporary and permanent differences in income and expense recognition, and (iii) the amount of spillover income carried over from a given tax year for distribution in the following tax year. The final determination of taxable income for each tax year, as well as the tax attributes for distributions in such tax year, will be made after the close of the tax year. |
| (2) | Includes the impact of the different share amounts as a result of calculating per share data based on the weighted average basic shares outstanding during the period and certain per share data based on the shares outstanding as of a period end or transaction date. |
| (3) | The total return equals the change in the ending market value over the beginning of period price per share plus distributions paid per share during the period, divided by the beginning price. |
| (4) | During the years ended December 31, 2019, 2018 and 2017, the Advisor waived $1.8 million, $1.2 million and $0.1 million, respectively, of incentive fee. |
| (5) | Calculated by dividing the lesser of purchases or the sum of (1) principal prepayments and (2) maturities by the monthly average debt investment balance |
| (6) | Calculated by dividing net debt investment purchases by the monthly average debt investment balance. |
137
Note 14. Summarized financial information for HSLFI
Horizon Secured Loan Fund I
Statements of Assets and Liabilities
(Dollars in thousands)
| | December 31, | |
|
| 2019 | |
Assets | | | |
Investments at fair value (cost of $34,895) | | $ | 34,829 |
Investments in money market funds | |
| 11,201 |
Cash and cash equivalents | |
| 503 |
Restricted investments in money market funds | |
| 138 |
Interest receivable | |
| 477 |
Other assets | |
| 1,109 |
Total assets | | $ | 48,257 |
Liabilities | |
|
|
Borrowings | | $ | 14,955 |
Other liabilities | |
| 126 |
Total liabilities | |
| 15,081 |
| | | |
Commitments and contingencies | | | |
| | | |
Members’ Capital | |
|
|
Members’ capital | |
| 33,176 |
Total members’ capital | |
| 33,176 |
Total liabilities and members’ capital | | $ | 48,257 |
138
Horizon Secured Loan Fund I
Statements of Operations
(Dollars in thousands)
|
| For the period |
| | |
| For the period | ||
|
| January 1, 2020 |
| For the year |
| June 1, 2018 | |||
|
| through |
| ended |
| through | |||
|
| April 21 |
| December 31 |
| December 31 | |||
| | 2020 |
| 2019 |
| 2018 | |||
Investment income |
| |
|
| |
|
| |
|
Interest income | | $ | 1,353 | | $ | 5,291 | | $ | 689 |
Prepayment fee income | |
| 112 | |
| 389 | |
| — |
Fee income | |
| — | |
| 19 | |
| — |
Total investment income | |
| 1,465 | |
| 5,699 | |
| 689 |
Expenses | |
|
| |
|
| |
|
|
Interest expense | |
| 1,165 | |
| 1,101 | |
| 140 |
General and administrative | |
| 64 | |
| 126 | |
| 40 |
Total expenses | |
| 1,229 | |
| 1,227 | |
| 180 |
Net investment income | |
| 236 | |
| 4,472 | |
| 509 |
Net realized and unrealized loss on investments | | | | | | | | | |
Net realized gain on investments | | | 120 | | | — | | | — |
Net realized gain on investments | |
| 120 | | | — | | | — |
Net unrealized depreciation on investments | |
| (392) | |
| (28) | |
| (37) |
Net unrealized depreciation on investments | | | (392) | |
| (28) | |
| (37) |
Net realized and unrealized loss on investments | | | (272) | | | (28) | | | (37) |
Net (decrease) increase in net assets resulting from operations | | $ | (36) | | $ | 4,444 | | $ | 472 |
Note 15. Selected quarterly financial data (unaudited)
| | December 31, | | September 30, | | June 30, | | March 31, | ||||
| | 2020 |
| 2020 | | 2020 | | 2020 | ||||
|
| (In thousands, except per share data) | ||||||||||
Total investment income | | $ | 10,066 |
| $ | 12,331 |
| $ | 13,524 |
| $ | 10,114 |
Net investment income | | $ | 3,901 | | $ | 5,860 | | $ | 6,706 |
| $ | 4,282 |
Net realized and unrealized (loss) gain | | $ | (1,504) | | $ | (9,110) | | $ | 1,219 |
| $ | (4,990) |
Net increase (decrease) in net asset resulting from operations | | $ | 2,397 | | $ | (3,250) | | $ | 7,925 |
| $ | (708) |
Net investment income per share (1) | | $ | 0.21 | | $ | 0.34 | | $ | 0.40 |
| $ | 0.26 |
Net increase (decrease) in net assets per share (1) | | $ | 0.13 | | $ | (0.19) | | $ | 0.47 |
| $ | (0.04) |
Net asset value per share at period end (2) | | $ | 11.02 | | $ | 11.17 | | $ | 11.64 |
| $ | 11.48 |
|
| |
| |
| |
| | ||||
| | December 31, | | September 30, | | June 30, | | March 31, | ||||
| | 2019 |
| 2019 | | 2019 | | 2019 | ||||
| | (In thousands, except per share data) | ||||||||||
Total investment income | | $ | 12,975 |
| $ | 11,375 |
| $ | 10,470 |
| $ | 8,306 |
Net investment income | | $ | 6,452 | | $ | 5,773 | | $ | 5,012 |
| $ | 3,233 |
Net realized and unrealized gain (loss) | | $ | 277 | | $ | (567) | | $ | (474) |
| $ | (208) |
Net increase in net asset resulting from operations | | $ | 6,729 | | $ | 5,206 | | $ | 4,538 |
| $ | 3,025 |
Net investment income per share (1) | | $ | 0.43 | | $ | 0.42 | | $ | 0.37 |
| $ | 0.28 |
Net increase in net assets per share (1) | | $ | 0.45 | | $ | 0.38 | | $ | 0.34 |
| $ | 0.26 |
Net asset value per share at period end (2) | | $ | 11.83 | | $ | 11.67 | | $ | 11.60 |
| $ | 11.55 |
| (1) | Based on weighted average shares outstanding for the respective period. |
| (2) | Based on shares outstanding at the end of the respective period. |
139
Item 9. Changes in and Disagreements with Accountants on Accounting and Financial Disclosure
None
Item 9A. Controls and Procedures
(a) | Evaluation of disclosure controls and procedures |
As of December 31, 2020, we, including our Chief Executive Officer and Chief Financial Officer, evaluated the effectiveness of the design and operation of our disclosure controls and procedures (as defined in Rule 13a-15(e) of the Exchange Act). Based on that evaluation, our management, including our Chief Executive Officer and Chief Financial Officer, concluded that our disclosure controls and procedures were effective and provided reasonable assurance that information required to be disclosed in our periodic SEC filings is recorded, processed, summarized and reported within the time periods specified in the SEC’s rules and forms, and that such information is accumulated and communicated to our management, including our Chief Executive Officer and Chief Financial Officer, as appropriate, to allow timely decisions regarding required disclosure. However, in evaluating the disclosure controls and procedures, management recognized that any controls and procedures, no matter how well designed and operated, can provide only reasonable assurance of achieving the desired control objectives, and management necessarily was required to apply its judgment in evaluating the cost-benefit relationship of such possible controls and procedures.
(b) | Management’s Report on Internal Control Over Financial Reporting |
Management’s Report on Internal Control Over Financial Reporting is included in “Item 8. Consolidated Financial Statements and Supplementary Data” of this Annual Report on Form 10-K.
(c) | Changes in internal controls over financial reporting. |
There have been no material changes in our internal control over financial reporting (as defined in Rules 13a-15(f) and 15d-15(f) of the Exchange Act) during our most recently completed fiscal quarter, that have materially affected, or are reasonably likely to materially affect, our internal control over financial reporting.
None
We will file a definitive Proxy Statement for our 2021 Annual Meeting of Stockholders with the SEC, pursuant to Regulation 14A, not later than 120 days after the end of our fiscal year. Accordingly, certain information required by Part III has been omitted under General Instruction G(3) to Form 10-K. Only those sections of our definitive Proxy Statement that specifically address the items set forth herein are incorporated by reference.
Item 10. Directors, Executive Officers and Corporate Governance
The information required by Item 10 is hereby incorporated by reference from our definitive Proxy Statement relating to our 2021 Annual Meeting of Stockholders, to be filed with the Securities and Exchange Commission not later than 120 days following the end of our fiscal year.
Item 11. Executive Compensation
The information required by Item 11 is hereby incorporated by reference from our definitive Proxy Statement relating to our 2021 Annual Meeting of Stockholders, to be filed with the Securities and Exchange Commission not later than 120 days following the end of our fiscal year.
140
Item 12. Security Ownership of Certain Beneficial Owners and Management and Related Stockholder Matters
The information required by Item 12 is hereby incorporated by reference from our definitive Proxy Statement relating to our 2021 Annual Meeting of Stockholders, to be filed with the Securities and Exchange Commission not later than 120 days following the end of our fiscal year.
Item 13. Certain Relationships and Related Transactions, and Director Independence
The information required by Item 13 is hereby incorporated by reference from our definitive Proxy Statement relating to our 2021 Annual Meeting of Stockholders, to be filed with the Securities and Exchange Commission not later than 120 days following the end of our fiscal year.
Item 14. Principal Accounting Fees and Services
The information required by Item 14 is hereby incorporated by reference from our definitive Proxy Statement relating to our 2021 Annual Meeting of Stockholders, to be filed with the Securities and Exchange Commission not later than 120 days following the end of our fiscal year.
Item 15. Exhibits, Financial Statement Schedules
(a)(1)Financial statements
| (1) | Financial statements — Refer to Item 8 starting on page 91. |
| (2) | Financial statement schedules — None |
| (3) | Exhibits |
Exhibit No. |
| Description |
|---|---|---|
| | |
| | |
| | |
| | |
| | |
Form of 6.25% 2022 Notes due 2022 (included as part of Exhibit 4.3) | ||
| | |
| | |
| | |
141
Exhibit No. |
| Description |
|---|---|---|
| | |
| | |
| | |
| | |
| | |
| | |
| | |
| | |
| | |
| | |
| | |
| | |
142
Exhibit No. |
| Description |
|---|---|---|
| | |
| | |
| | |
| | |
| | |
| | |
| | |
| ||
| | |
| ||
| | |
| ||
| | |
| ||
| | |
|
143
Exhibit No. |
| Description |
|---|---|---|
| | |
| ||
| | |
| ||
| | |
| ||
| | |
| | |
| | |
| | |
Certificate of the Principal Executive Officer Pursuant to Exchange Act Rule 13a-14(a) and 15d-14(a) | ||
| | |
| | |
| | |
| | |
* | Filed herewith |
144
Pursuant to the requirements of Section 13 or 15(d) of the Securities Exchange Act of 1934, the registrant has duly caused this Annual Report on Form 10-K to be signed on its behalf by the undersigned, thereunto duly authorized.
HORIZON TECHNOLOGY FINANCE CORPORATION | ||
Date: March 2, 2021 | By: | /s/ Robert D. Pomeroy, Jr. |
Name: | Robert D. Pomeroy, Jr. | |
Title: | Chief Executive Officer and Chairman of the Board of Directors | |
KNOW ALL MEN BY THESE PRESENTS, that each person whose signature appears below constitutes and appoints Robert D. Pomeroy, Jr., Daniel R. Trolio and Gerald A. Michaud as his true and lawful attorneys-in-fact, each with full power of substitution, for him in any and all capacities, to sign any amendments to this Annual Report on Form 10-K and to file the same, with exhibits thereto and other documents in connection therewith, with the Securities and Exchange Commission, hereby ratifying and confirming all that each of said attorneys-in-fact or their substitute or substitutes may do or cause to be done by virtue hereof.
Pursuant to the requirements of the Securities Exchange Act of 1934, this Annual Report on Form 10-K has been signed below by the following persons on behalf of the registrant and in the capacities and on the dates indicated.
Signature |
| Title |
| Date |
/s/ Robert D. Pomeroy, Jr. | Chairman of the Board of Directors and Chief | |||
Robert D. Pomeroy, Jr. | Executive Officer (Principal Executive Officer) | March 2, 2021 | ||
/s/ Daniel R. Trolio | Chief Financial Officer and | |||
Daniel R. Trolio | Treasurer (Principal Financial and Accounting Officer) | March 2, 2021 | ||
/s/ Gerald A. Michaud | ||||
Gerald A. Michaud | President and Director | March 2, 2021 | ||
/s/ James J. Bottiglieri | ||||
James J. Bottiglieri | Director | March 2, 2021 | ||
/s/ Edmund V. Mahoney | ||||
Edmund V. Mahoney | Director | March 2, 2021 | ||
/s/ Elaine A. Sarsynski | ||||
Elaine A. Sarsynski | Director | March 2, 2021 | ||
/s/ Joseph J. Savage | ||||
Joseph J. Savage | Director | March 2, 2021 |
145