Attached files
| file | filename |
|---|---|
| 8-K - 8-K - 3D SYSTEMS CORP | ddd-20210301.htm |
| EX-99.1 - EX-99.1 - 3D SYSTEMS CORP | ddd2020-12x31earningsrelea.htm |
©2021 3D Systems, Inc. | All Rights Reserved. Fourth Quarter and Full Year 2020 Financial Results (Unaudited) March 2, 2021 EXHIBIT 99.2

2 Welcome and Participants Dr. Jeffrey Graves President and Chief Executive Officer Jagtar Narula Executive VP and Chief Financial Officer Andrew Johnson Executive Vice President and Chief Legal Officer John Nypaver Vice President, Treasurer Melanie Solomon Investor Relations To participate via phone, please dial: 1-201-689-8345
3 Forward Looking Statements Certain statements made in this presentation that are not statements of historical or current facts are forward-looking statements within the meaning of the Private Securities Litigation Reform Act of 1995. Forward-looking statements include statements concerning plans, objectives, goals, strategies, expectations, intentions, projections, developments, future events, performance or products, underlying assumptions, and other statements which are other than statements of historical facts. In some cases, you can identify forward-looking statements by terms such as “believes,” “beliefs,” ''may,'' ''will,'' ''should,'' expects,'' ''intends,'' ''plans,'' ''anticipates,'' ''estimates,'' ''predicts,'' ''projects,'' ''potential,'' ''continue,'' and other similar terminology or the negative of these terms. From time to time, we may publish or otherwise make available forward-looking statements of this nature. All such forward- looking statements, whether written or oral, and whether made by us or on our behalf, are expressly qualified by the cautionary statements described in this message including those set forth below. Forward-looking statements are based upon management’s beliefs, assumptions and current expectations concerning future events and trends, using information currently available, and are necessarily subject to uncertainties, many of which are outside our control. In addition, we undertake no obligation to update or revise any forward-looking statements made by us or on our behalf, whether as a result of future developments, subsequent events or circumstances, or otherwise, or to reflect the occurrence or likelihood of unanticipated events, and we disclaim any such obligation. Forward-looking statements are only predictions that relate to future events or our future performance and are subject to known and unknown risks, uncertainties, assumptions, and other factors, many of which are beyond our control, that may cause actual results, outcomes, levels of activity, performance, developments, or achievements to be materially different from any future results, outcomes, levels of activity, performance, developments, or achievements expressed, anticipated, or implied by these forward-looking statements. Although we believe that the expectations reflected in the forward-looking statements are reasonable, forward-looking statements are not, and should not be relied upon as a guarantee of future performance or results, nor will they necessarily prove to be accurate indications of the times at or by which any such performance or results will be achieved. 3D Systems' actual results could differ materially from those stated or implied in forward-looking statements. Past performance is not necessarily indicative of future results. We do not undertake any obligation to and do not intend to update any forward-looking statements whether as a result of future developments, subsequent events or circumstances or otherwise. Further, we encourage you to review “Risk Factors” in Part 1 of our Annual Report on Form 10-K and Part II of our Quarterly Reports on Form 10-Q filed with the SEC as well as other information about us in our filings with the SEC. These are available at www.SEC.gov.

4 Dr. Jeffrey Graves President & Chief Executive Officer
5 3D Systems' Purpose Statement We are the leaders in enabling additive manufacturing solutions for applications in growing markets that demand high reliability products.
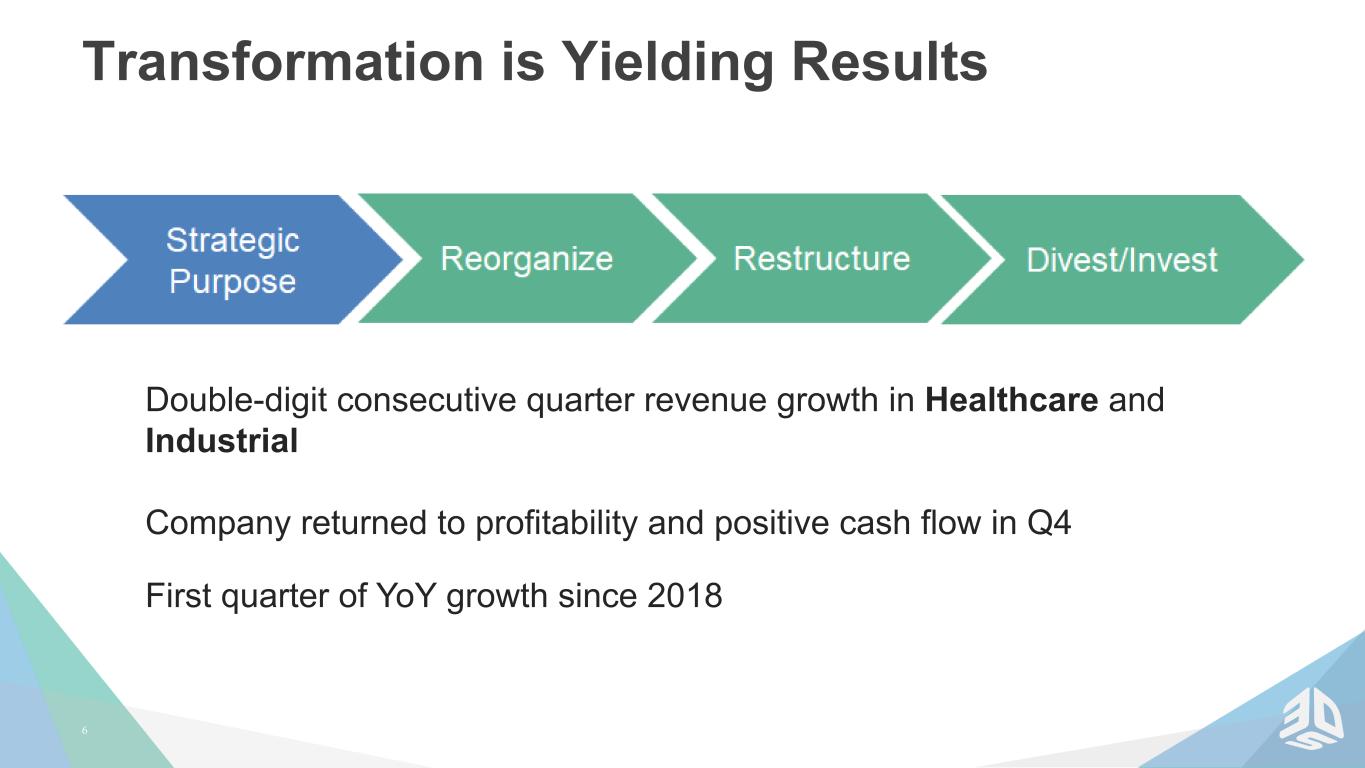
6 Transformation is Yielding Results Double-digit consecutive quarter revenue growth in Healthcare and Industrial Company returned to profitability and positive cash flow in Q4 First quarter of YoY growth since 2018
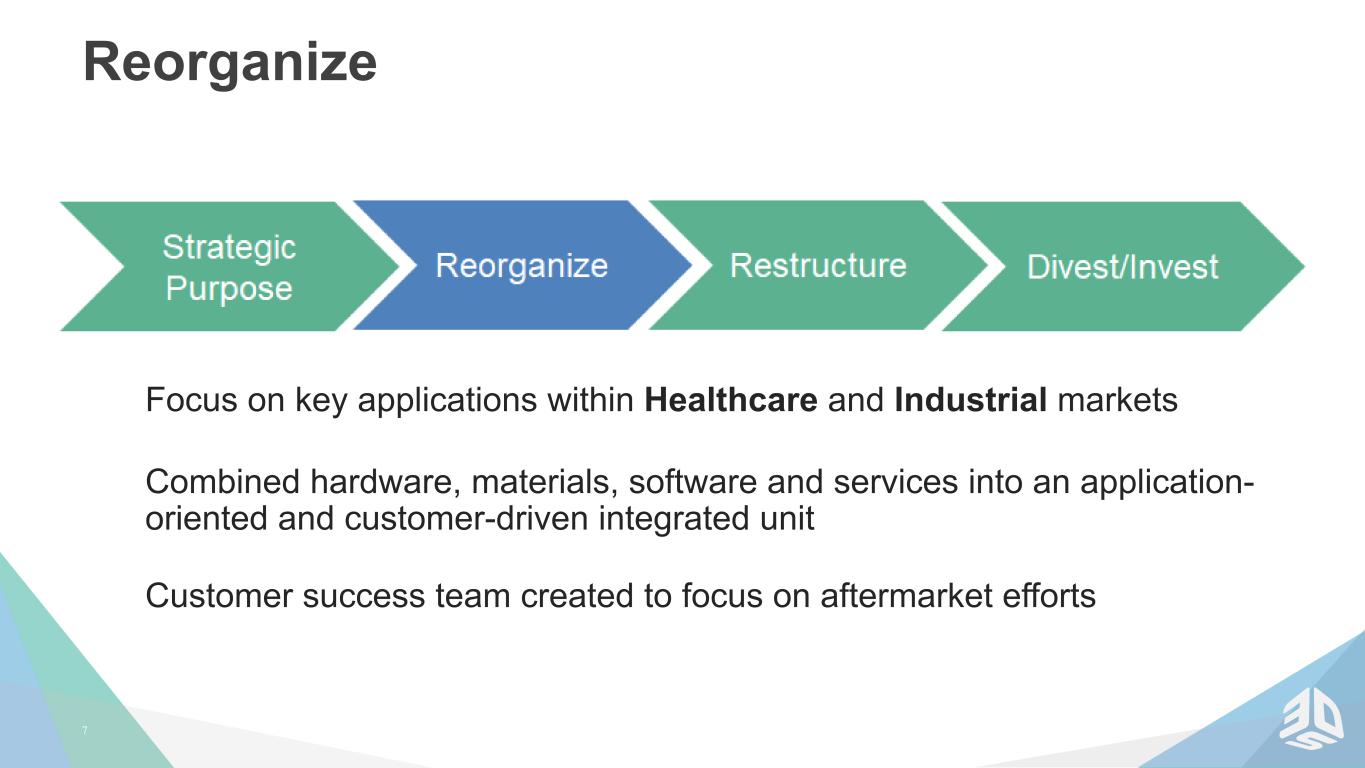
7 Reorganize Focus on key applications within Healthcare and Industrial markets Combined hardware, materials, software and services into an application- oriented and customer-driven integrated unit Customer success team created to focus on aftermarket efforts
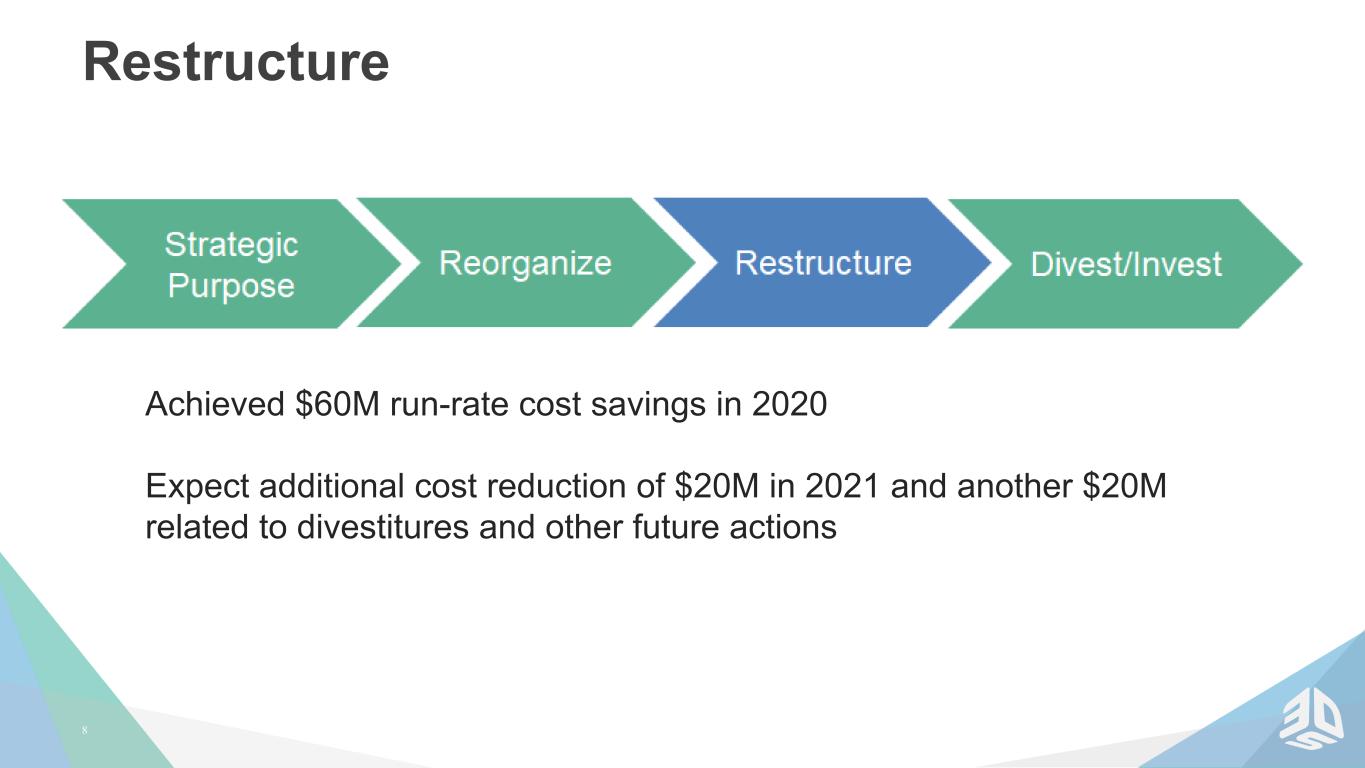
8 Restructure Achieved $60M run-rate cost savings in 2020 Expect additional cost reduction of $20M in 2021 and another $20M related to divestitures and other future actions
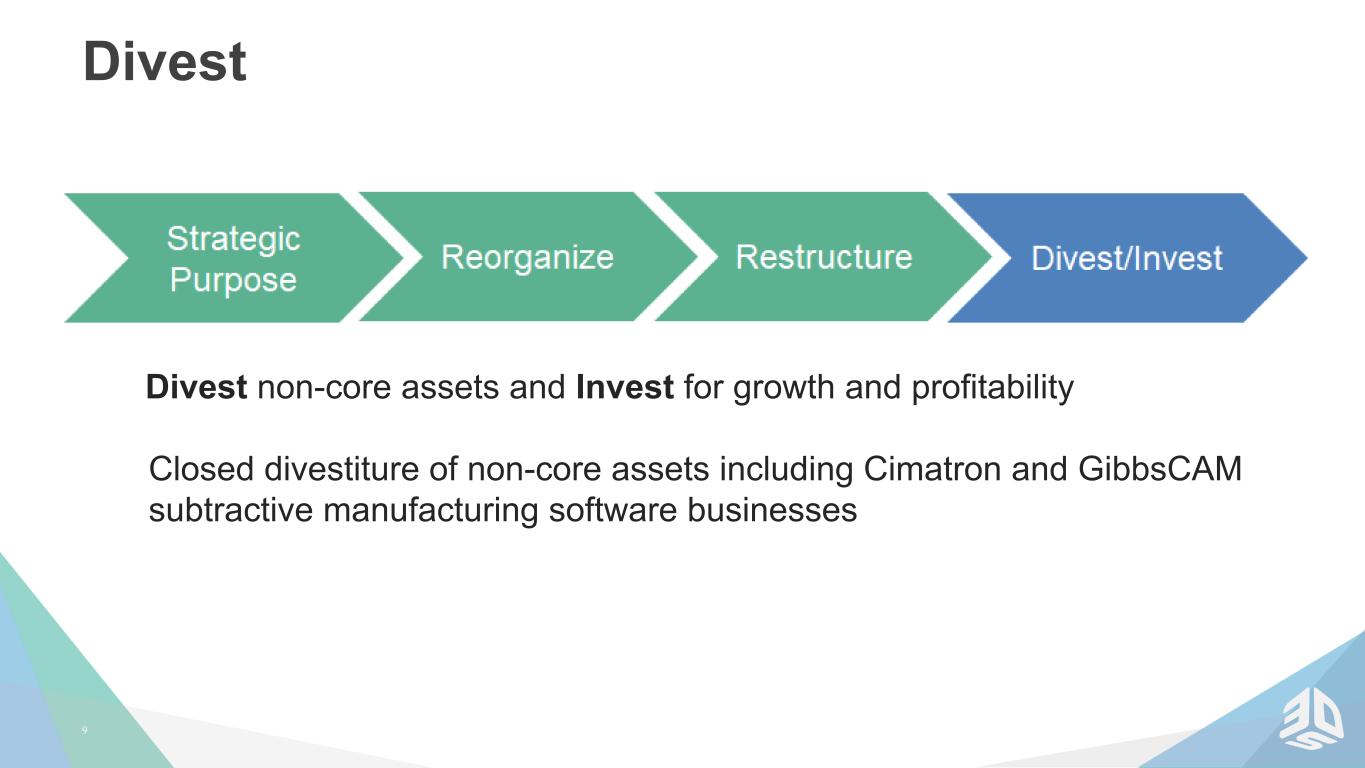
9 Divest Divest non-core assets and Invest for growth and profitability Closed divestiture of non-core assets including Cimatron and GibbsCAM subtractive manufacturing software businesses
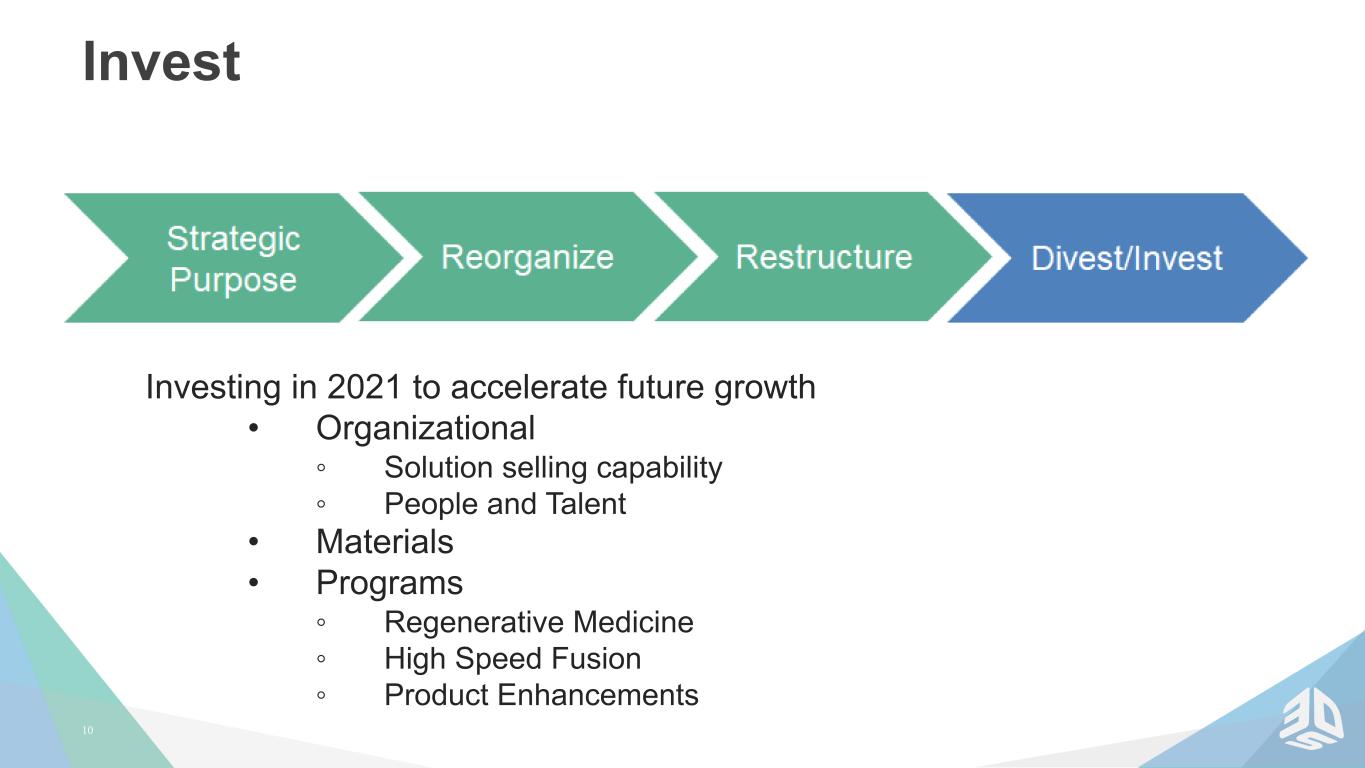
10 Invest Investing in 2021 to accelerate future growth • Organizational ◦ Solution selling capability ◦ People and Talent • Materials • Programs ◦ Regenerative Medicine ◦ High Speed Fusion ◦ Product Enhancements
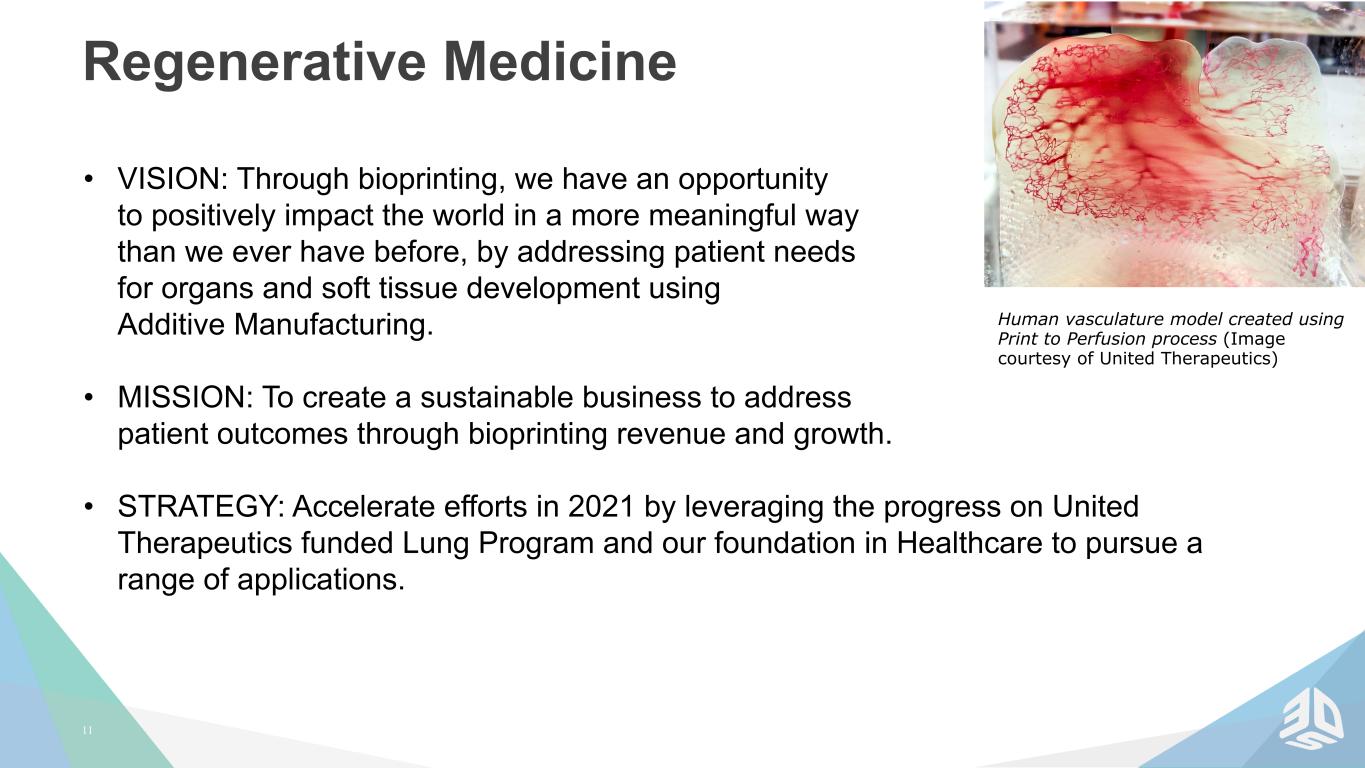
11 Regenerative Medicine Human vasculature model created using Print to Perfusion process (Image courtesy of United Therapeutics) • VISION: Through bioprinting, we have an opportunity to positively impact the world in a more meaningful way than we ever have before, by addressing patient needs for organs and soft tissue development using Additive Manufacturing. • MISSION: To create a sustainable business to address patient outcomes through bioprinting revenue and growth. • STRATEGY: Accelerate efforts in 2021 by leveraging the progress on United Therapeutics funded Lung Program and our foundation in Healthcare to pursue a range of applications.
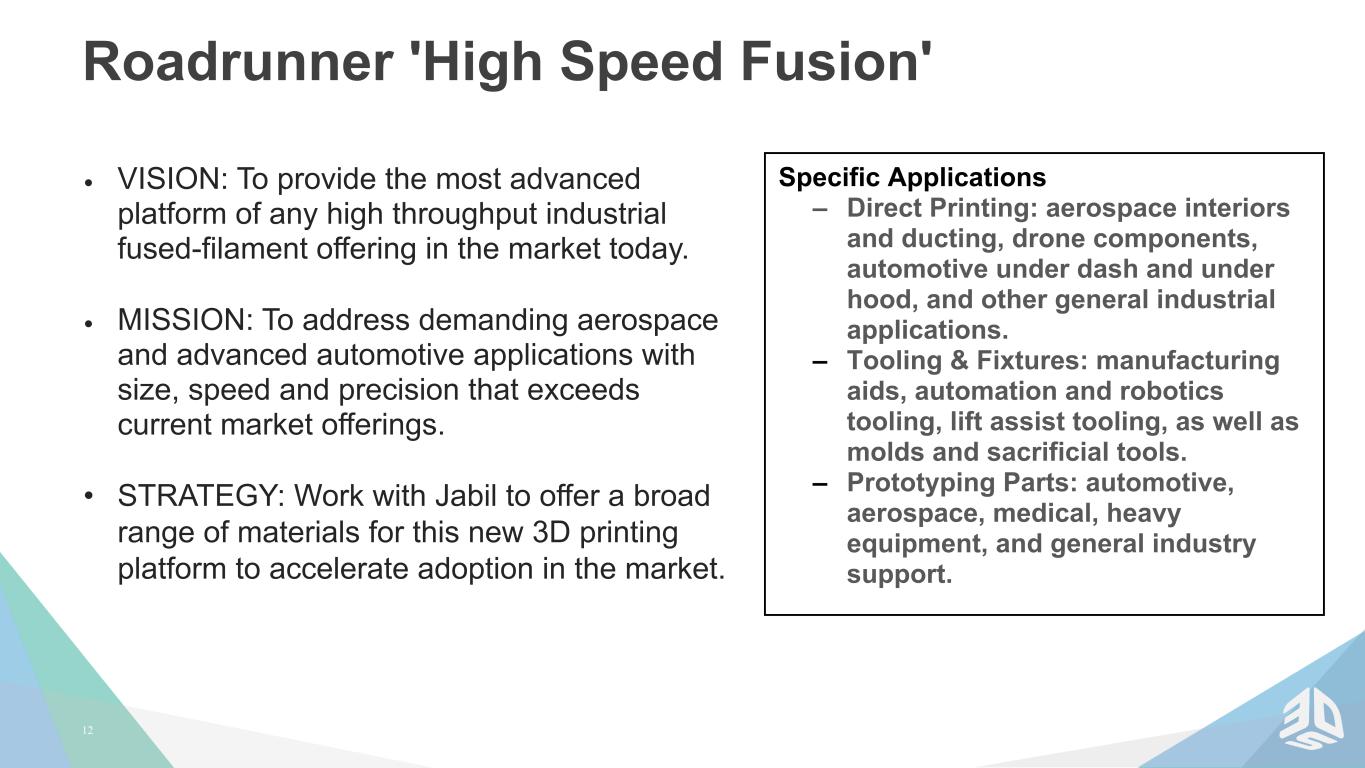
12 Roadrunner 'High Speed Fusion' Specific Applications – Direct Printing: aerospace interiors and ducting, drone components, automotive under dash and under hood, and other general industrial applications. – Tooling & Fixtures: manufacturing aids, automation and robotics tooling, lift assist tooling, as well as molds and sacrificial tools. – Prototyping Parts: automotive, aerospace, medical, heavy equipment, and general industry support. • VISION: To provide the most advanced platform of any high throughput industrial fused-filament offering in the market today. • MISSION: To address demanding aerospace and advanced automotive applications with size, speed and precision that exceeds current market offerings. • STRATEGY: Work with Jabil to offer a broad range of materials for this new 3D printing platform to accelerate adoption in the market.

13 Jagtar Narula Chief Financial Officer
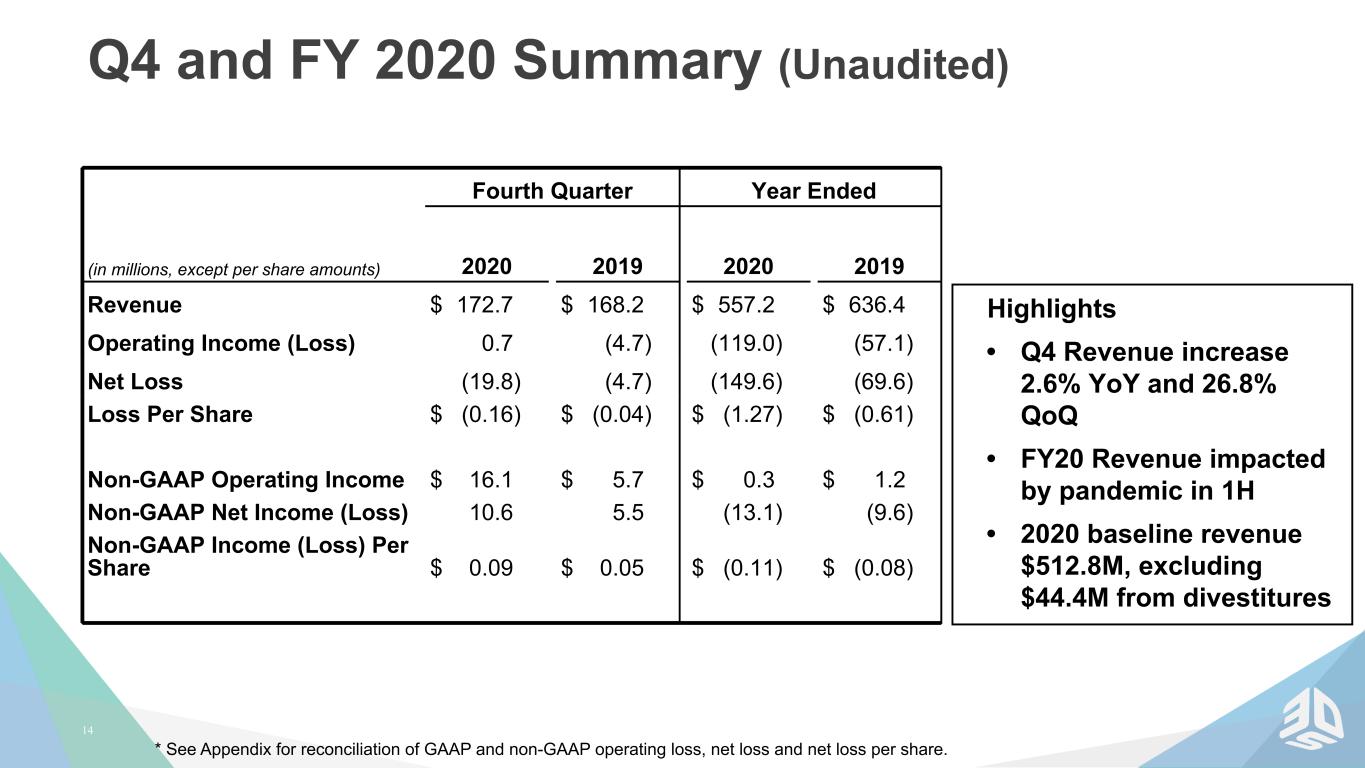
14 Q4 and FY 2020 Summary (Unaudited) Fourth Quarter Year Ended (in millions, except per share amounts) 2020 2019 2020 2019 Revenue $ 172.7 $ 168.2 $ 557.2 $ 636.4 Operating Income (Loss) 0.7 (4.7) (119.0) (57.1) Net Loss (19.8) (4.7) (149.6) (69.6) Loss Per Share $ (0.16) $ (0.04) $ (1.27) $ (0.61) Non-GAAP Operating Income $ 16.1 $ 5.7 $ 0.3 $ 1.2 Non-GAAP Net Income (Loss) 10.6 5.5 (13.1) (9.6) Non-GAAP Income (Loss) Per Share $ 0.09 $ 0.05 $ (0.11) $ (0.08) * See Appendix for reconciliation of GAAP and non-GAAP operating loss, net loss and net loss per share. Highlights • Q4 Revenue increase 2.6% YoY and 26.8% QoQ • FY20 Revenue impacted by pandemic in 1H • 2020 baseline revenue $512.8M, excluding $44.4M from divestitures
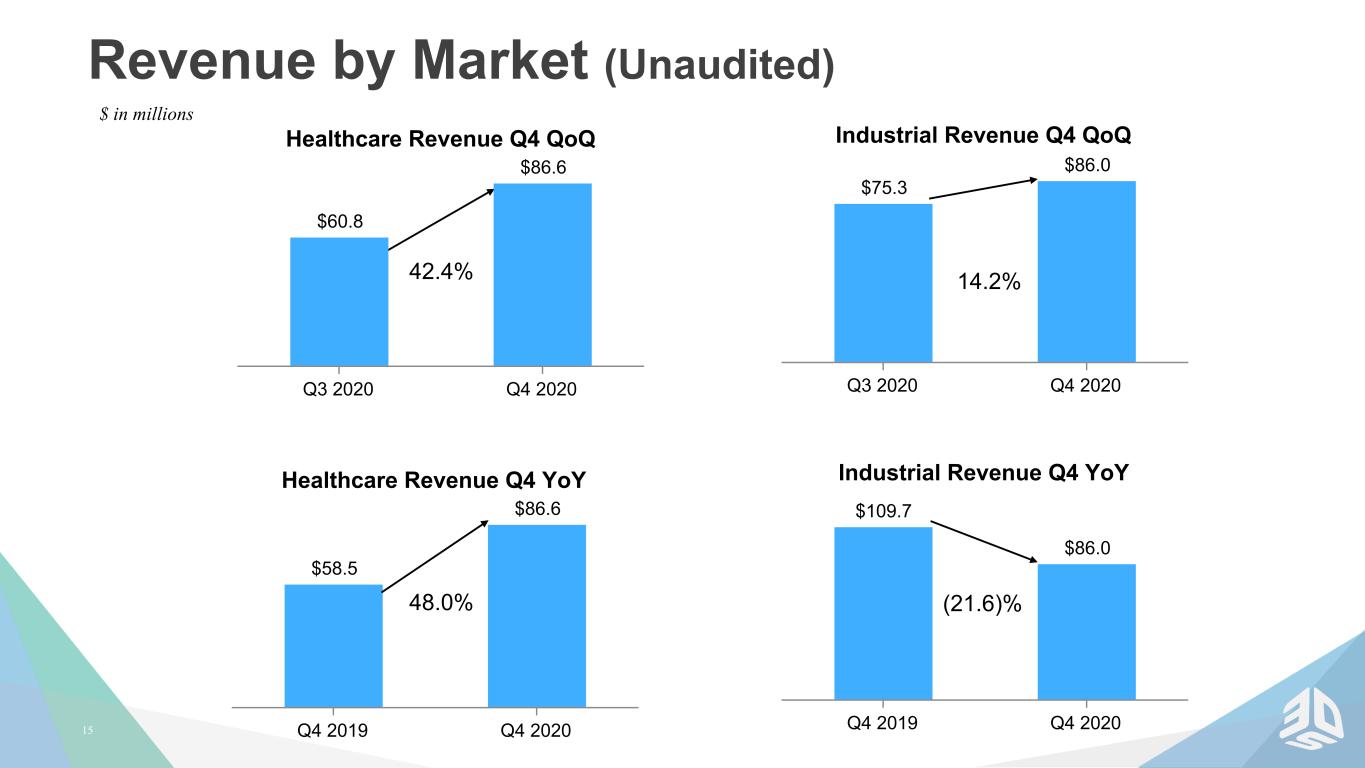
15 Revenue by Market (Unaudited) Industrial Revenue Q4 YoY $109.7 $86.0 Q4 2019 Q4 2020 Healthcare Revenue Q4 YoY $58.5 $86.6 Q4 2019 Q4 2020 48.0% (21.6)% 42.4% Industrial Revenue Q4 QoQ $75.3 $86.0 Q3 2020 Q4 2020 14.2% $ in millions Healthcare Revenue Q4 QoQ $60.8 $86.6 Q3 2020 Q4 2020
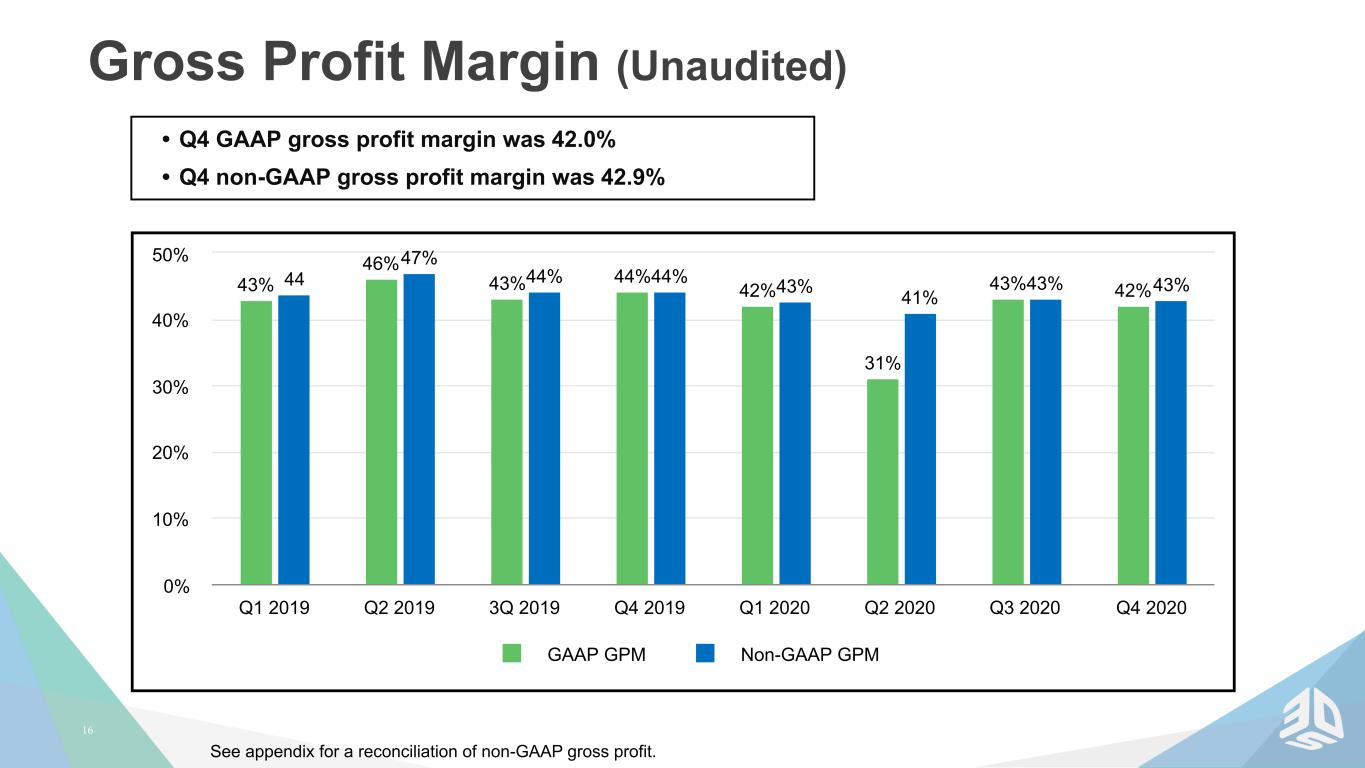
16 Gross Profit Margin (Unaudited) • Q4 GAAP gross profit margin was 42.0% • Q4 non-GAAP gross profit margin was 42.9% 43% 46% 43% 44% 42% 31% 43% 42% 44 47% 44% 44% 43% 41% 43% 43% GAAP GPM Non-GAAP GPM Q1 2019 Q2 2019 3Q 2019 Q4 2019 Q1 2020 Q2 2020 Q3 2020 Q4 2020 0% 10% 20% 30% 40% 50% See appendix for a reconciliation of non-GAAP gross profit.
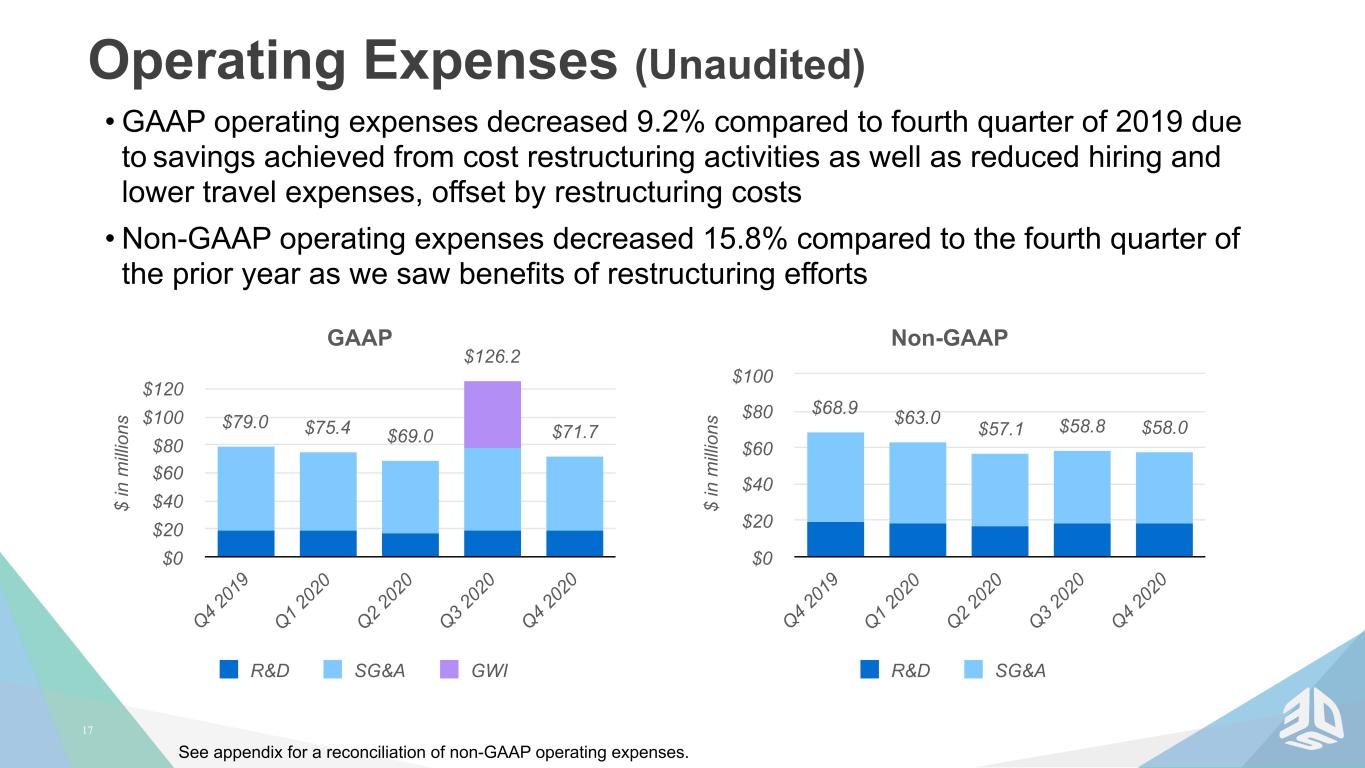
17 $ in m ill io ns GAAP $79.0 $75.4 $69.0 $126.2 $71.7 R&D SG&A GWI Q4 20 19 Q1 20 20 Q2 20 20 Q3 20 20 Q4 20 20 $0 $20 $40 $60 $80 $100 $120 Operating Expenses (Unaudited) • GAAP operating expenses decreased 9.2% compared to fourth quarter of 2019 due to savings achieved from cost restructuring activities as well as reduced hiring and lower travel expenses, offset by restructuring costs • Non-GAAP operating expenses decreased 15.8% compared to the fourth quarter of the prior year as we saw benefits of restructuring efforts See appendix for a reconciliation of non-GAAP operating expenses. $ in m ill io ns Non-GAAP $68.9 $63.0 $57.1 $58.8 $58.0 R&D SG&A Q4 20 19 Q1 20 20 Q2 20 20 Q3 20 20 Q4 20 20 $0 $20 $40 $60 $80 $100
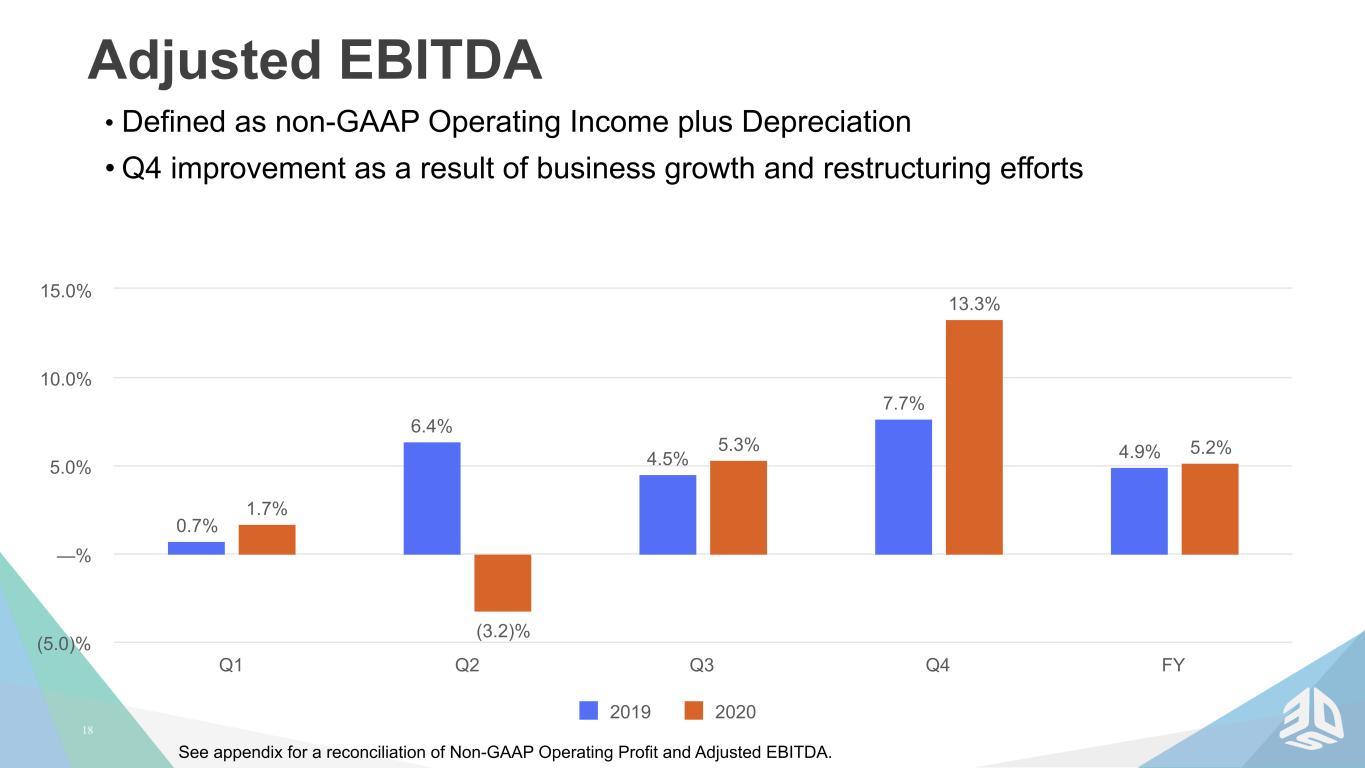
18 Adjusted EBITDA • Defined as non-GAAP Operating Income plus Depreciation • Q4 improvement as a result of business growth and restructuring efforts See appendix for a reconciliation of Non-GAAP Operating Profit and Adjusted EBITDA. 0.7% 6.4% 4.5% 7.7% 4.9% 1.7% (3.2)% 5.3% 13.3% 5.2% 2019 2020 Q1 Q2 Q3 Q4 FY (5.0)% —% 5.0% 10.0% 15.0%
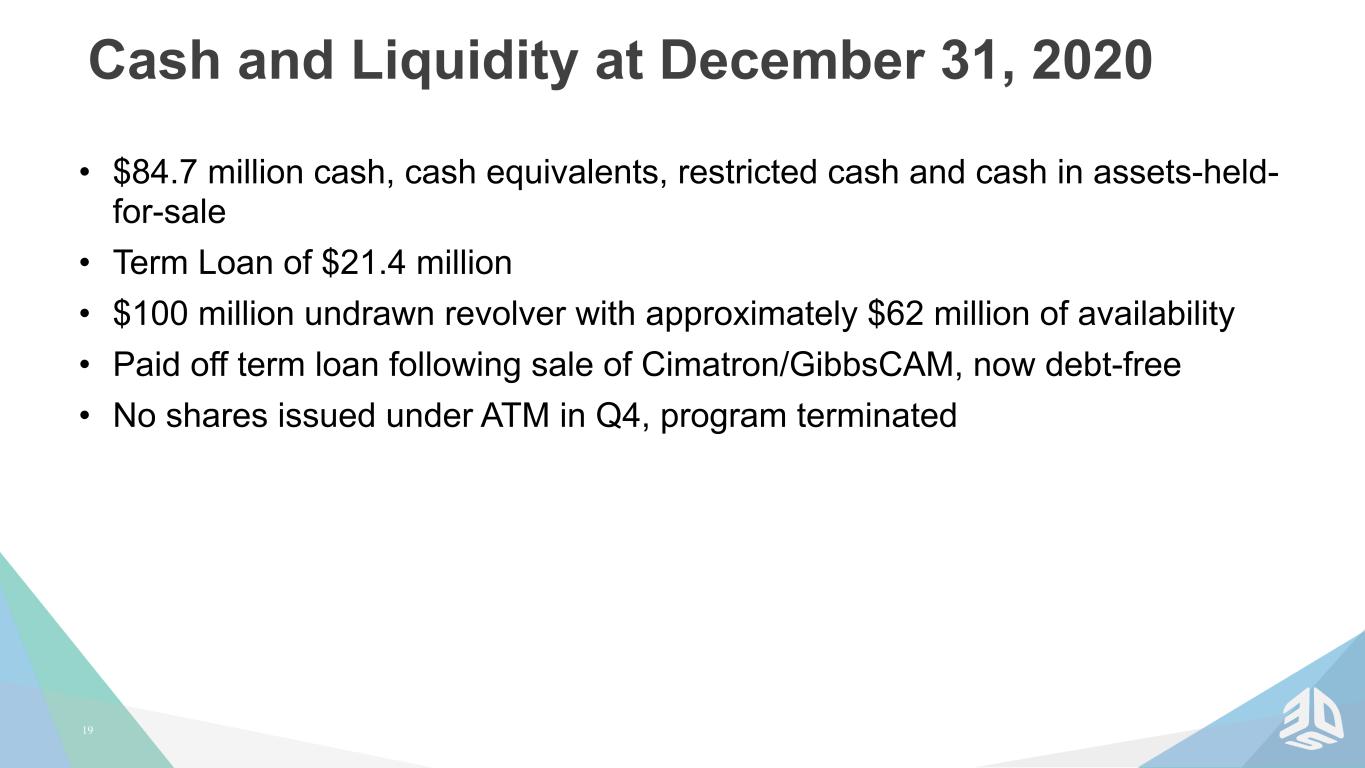
19 Cash and Liquidity at December 31, 2020 • $84.7 million cash, cash equivalents, restricted cash and cash in assets-held- for-sale • Term Loan of $21.4 million • $100 million undrawn revolver with approximately $62 million of availability • Paid off term loan following sale of Cimatron/GibbsCAM, now debt-free • No shares issued under ATM in Q4, program terminated

20 Dr. Jeffrey Graves President & Chief Executive Officer
21 Summary Our Transformation Journey Continues: • Reorganization and Restructuring complete • Exploring additional divestitures of non-core assets • Selectively investing for growth in regenerative medicine, materials development and product line improvement • Expect growth in core business of additive manufacturing • Focus on operational execution

22 Q&A Session 1-201-689-8345
2 323 ©2021 3D Systems, Inc. | All Rights Reserved. Thank You Find out more at: www.3dsystems.com
©2021 3D Systems, Inc. | All Rights Reserved. Appendix
25 Presentation of Information 3D Systems reports is financial results in accordance with GAAP. To facilitate a better understanding of the impact that strategic acquisitions, non-recurring charges and certain non-cash expenses had on its financial results, management reviews certain non-GAAP measures, including non-GAAP Operating Income, non-GAAP Net Income (Loss), non-GAAP Basic and Diluted Income (Loss) per Share, non-GAAP Gross Profit, non-GAAP Gross Profit Margin, non-GAAP SG&A Expenses and non-GAAP Operating Expenses, each of which exclude the impact of amortization of intangibles, acquisition and severance expenses, stock-based compensation expense, litigation settlements and charges related to strategic decisions and portfolio realignment, and Adjusted EBITDA, defined as non-GAAP Operating Income plus depreciation, and Adjusted EBITDA Margins to better evaluate period-over-period performance. A reconciliation of GAAP to non-GAAP results is provided in the accompanying schedule. 3D Systems does not provide forward-looking guidance on a GAAP basis. The company is unable to provide a quantitative reconciliation of these forward-looking non-GAAP measures to the most directly comparable forward- looking GAAP measures without unreasonable effort because 3D Systems cannot reliably forecast legal, acquisition and divestiture expenses, restructuring expenses, product end of life adjustments and goodwill impairment, which are difficult to predict and estimate. These items are inherently uncertain and depend on various factors, many of which are beyond the company’s control, and as such, any associated estimate and its impact on GAAP performance could vary materially.
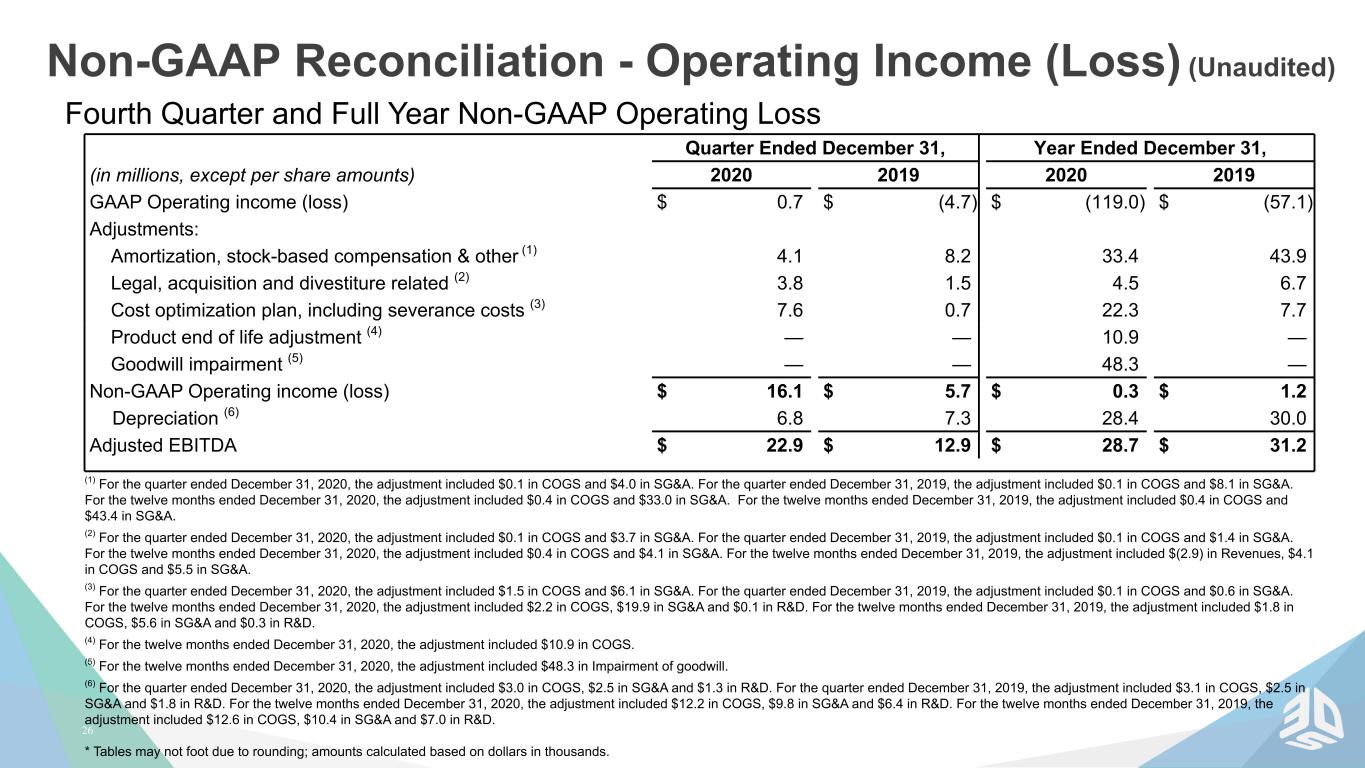
26 Non-GAAP Reconciliation - Operating Income (Loss) (Unaudited) Fourth Quarter and Full Year Non-GAAP Operating Loss Quarter Ended December 31, Year Ended December 31, (in millions, except per share amounts) 2020 2019 2020 2019 GAAP Operating income (loss) $ 0.7 $ (4.7) $ (119.0) $ (57.1) Adjustments: Amortization, stock-based compensation & other (1) 4.1 8.2 33.4 43.9 Legal, acquisition and divestiture related (2) 3.8 1.5 4.5 6.7 Cost optimization plan, including severance costs (3) 7.6 0.7 22.3 7.7 Product end of life adjustment (4) — — 10.9 — Goodwill impairment (5) — — 48.3 — Non-GAAP Operating income (loss) $ 16.1 $ 5.7 $ 0.3 $ 1.2 Depreciation (6) 6.8 7.3 28.4 30.0 Adjusted EBITDA $ 22.9 $ 12.9 $ 28.7 $ 31.2 (1) For the quarter ended December 31, 2020, the adjustment included $0.1 in COGS and $4.0 in SG&A. For the quarter ended December 31, 2019, the adjustment included $0.1 in COGS and $8.1 in SG&A. For the twelve months ended December 31, 2020, the adjustment included $0.4 in COGS and $33.0 in SG&A. For the twelve months ended December 31, 2019, the adjustment included $0.4 in COGS and $43.4 in SG&A. (2) For the quarter ended December 31, 2020, the adjustment included $0.1 in COGS and $3.7 in SG&A. For the quarter ended December 31, 2019, the adjustment included $0.1 in COGS and $1.4 in SG&A. For the twelve months ended December 31, 2020, the adjustment included $0.4 in COGS and $4.1 in SG&A. For the twelve months ended December 31, 2019, the adjustment included $(2.9) in Revenues, $4.1 in COGS and $5.5 in SG&A. (3) For the quarter ended December 31, 2020, the adjustment included $1.5 in COGS and $6.1 in SG&A. For the quarter ended December 31, 2019, the adjustment included $0.1 in COGS and $0.6 in SG&A. For the twelve months ended December 31, 2020, the adjustment included $2.2 in COGS, $19.9 in SG&A and $0.1 in R&D. For the twelve months ended December 31, 2019, the adjustment included $1.8 in COGS, $5.6 in SG&A and $0.3 in R&D. (4) For the twelve months ended December 31, 2020, the adjustment included $10.9 in COGS. (5) For the twelve months ended December 31, 2020, the adjustment included $48.3 in Impairment of goodwill. (6) For the quarter ended December 31, 2020, the adjustment included $3.0 in COGS, $2.5 in SG&A and $1.3 in R&D. For the quarter ended December 31, 2019, the adjustment included $3.1 in COGS, $2.5 in SG&A and $1.8 in R&D. For the twelve months ended December 31, 2020, the adjustment included $12.2 in COGS, $9.8 in SG&A and $6.4 in R&D. For the twelve months ended December 31, 2019, the adjustment included $12.6 in COGS, $10.4 in SG&A and $7.0 in R&D. * Tables may not foot due to rounding; amounts calculated based on dollars in thousands.
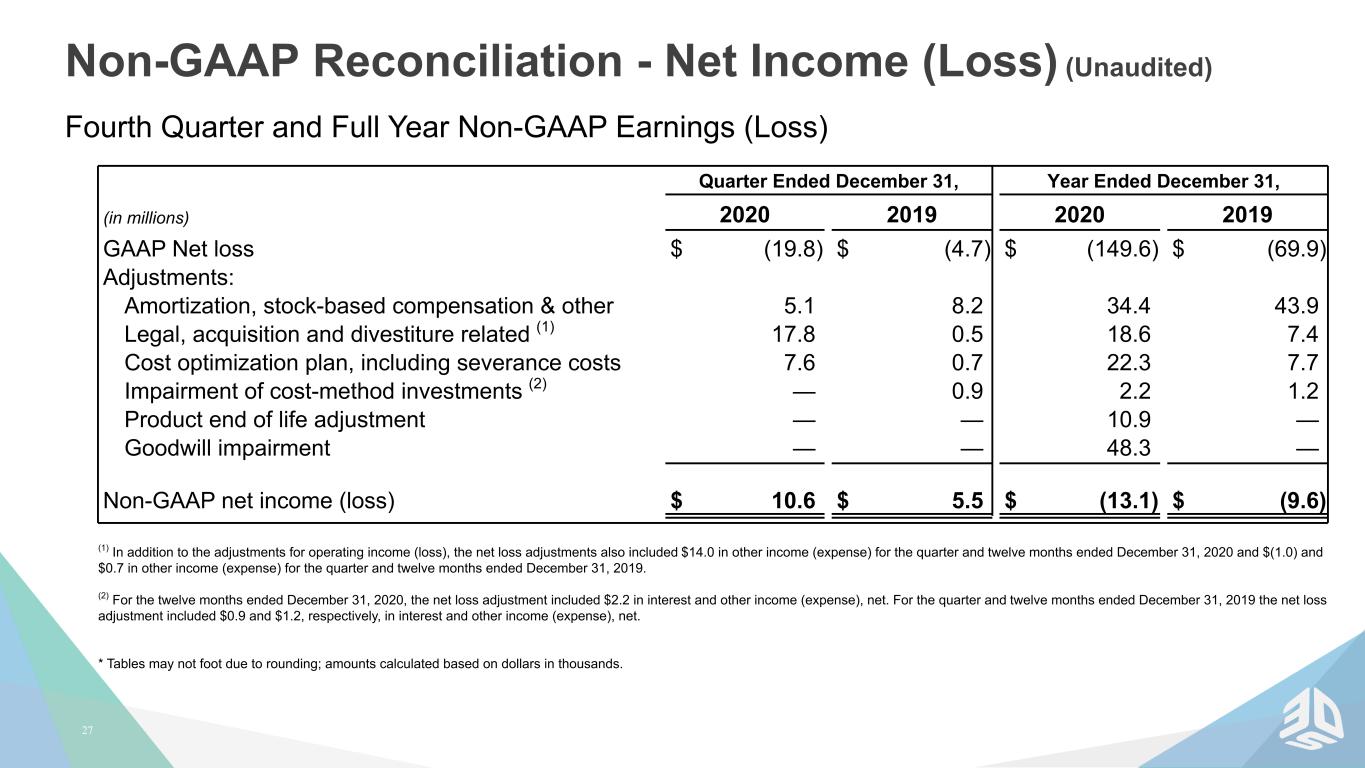
27 Non-GAAP Reconciliation - Net Income (Loss) (Unaudited) Fourth Quarter and Full Year Non-GAAP Earnings (Loss) Quarter Ended December 31, Year Ended December 31, (in millions) 2020 2019 2020 2019 GAAP Net loss $ (19.8) $ (4.7) $ (149.6) $ (69.9) Adjustments: Amortization, stock-based compensation & other 5.1 8.2 34.4 43.9 Legal, acquisition and divestiture related (1) 17.8 0.5 18.6 7.4 Cost optimization plan, including severance costs 7.6 0.7 22.3 7.7 Impairment of cost-method investments (2) — 0.9 2.2 1.2 Product end of life adjustment — — 10.9 — Goodwill impairment — — 48.3 — Non-GAAP net income (loss) $ 10.6 $ 5.5 $ (13.1) $ (9.6) (1) In addition to the adjustments for operating income (loss), the net loss adjustments also included $14.0 in other income (expense) for the quarter and twelve months ended December 31, 2020 and $(1.0) and $0.7 in other income (expense) for the quarter and twelve months ended December 31, 2019. (2) For the twelve months ended December 31, 2020, the net loss adjustment included $2.2 in interest and other income (expense), net. For the quarter and twelve months ended December 31, 2019 the net loss adjustment included $0.9 and $1.2, respectively, in interest and other income (expense), net. * Tables may not foot due to rounding; amounts calculated based on dollars in thousands.
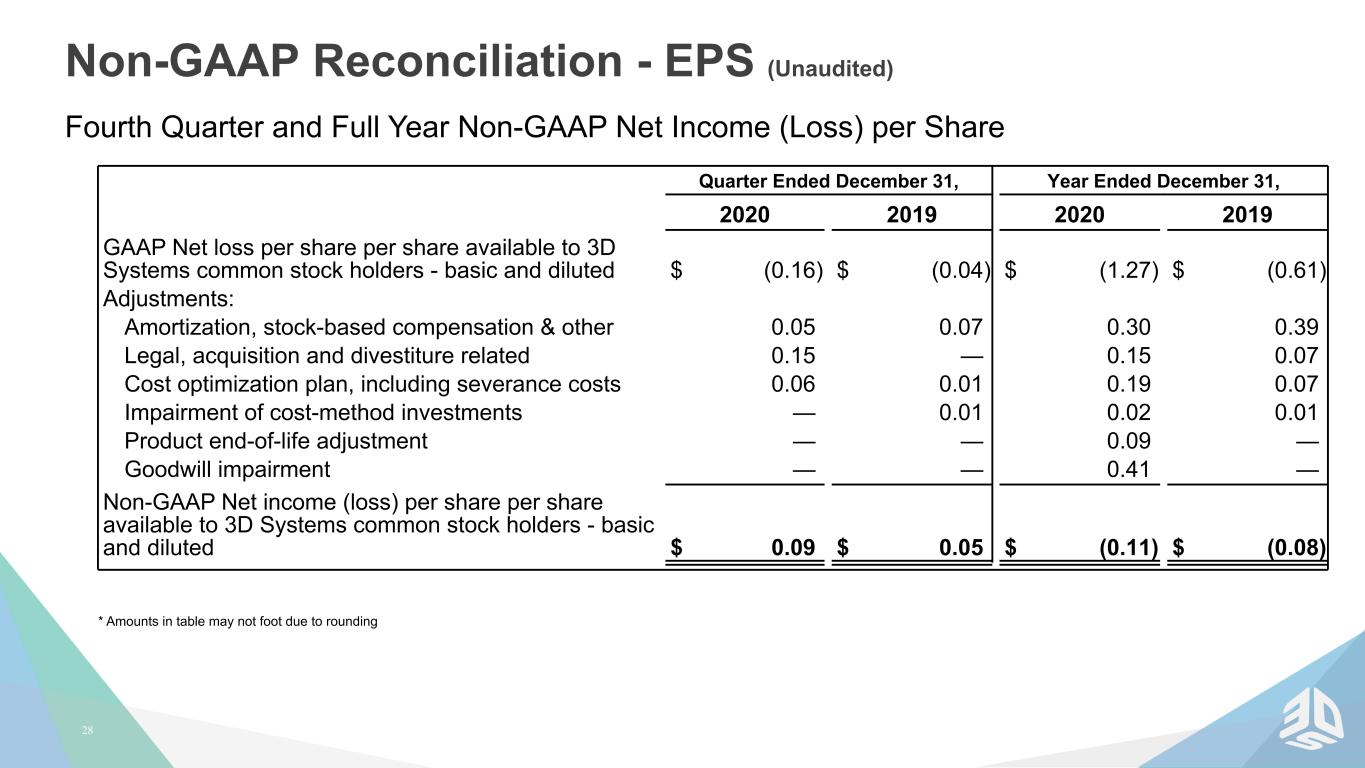
28 Non-GAAP Reconciliation - EPS (Unaudited) Fourth Quarter and Full Year Non-GAAP Net Income (Loss) per Share Quarter Ended December 31, Year Ended December 31, 2020 2019 2020 2019 GAAP Net loss per share per share available to 3D Systems common stock holders - basic and diluted $ (0.16) $ (0.04) $ (1.27) $ (0.61) Adjustments: Amortization, stock-based compensation & other 0.05 0.07 0.30 0.39 Legal, acquisition and divestiture related 0.15 — 0.15 0.07 Cost optimization plan, including severance costs 0.06 0.01 0.19 0.07 Impairment of cost-method investments — 0.01 0.02 0.01 Product end-of-life adjustment — — 0.09 — Goodwill impairment — — 0.41 — Non-GAAP Net income (loss) per share per share available to 3D Systems common stock holders - basic and diluted $ 0.09 $ 0.05 $ (0.11) $ (0.08) * Amounts in table may not foot due to rounding
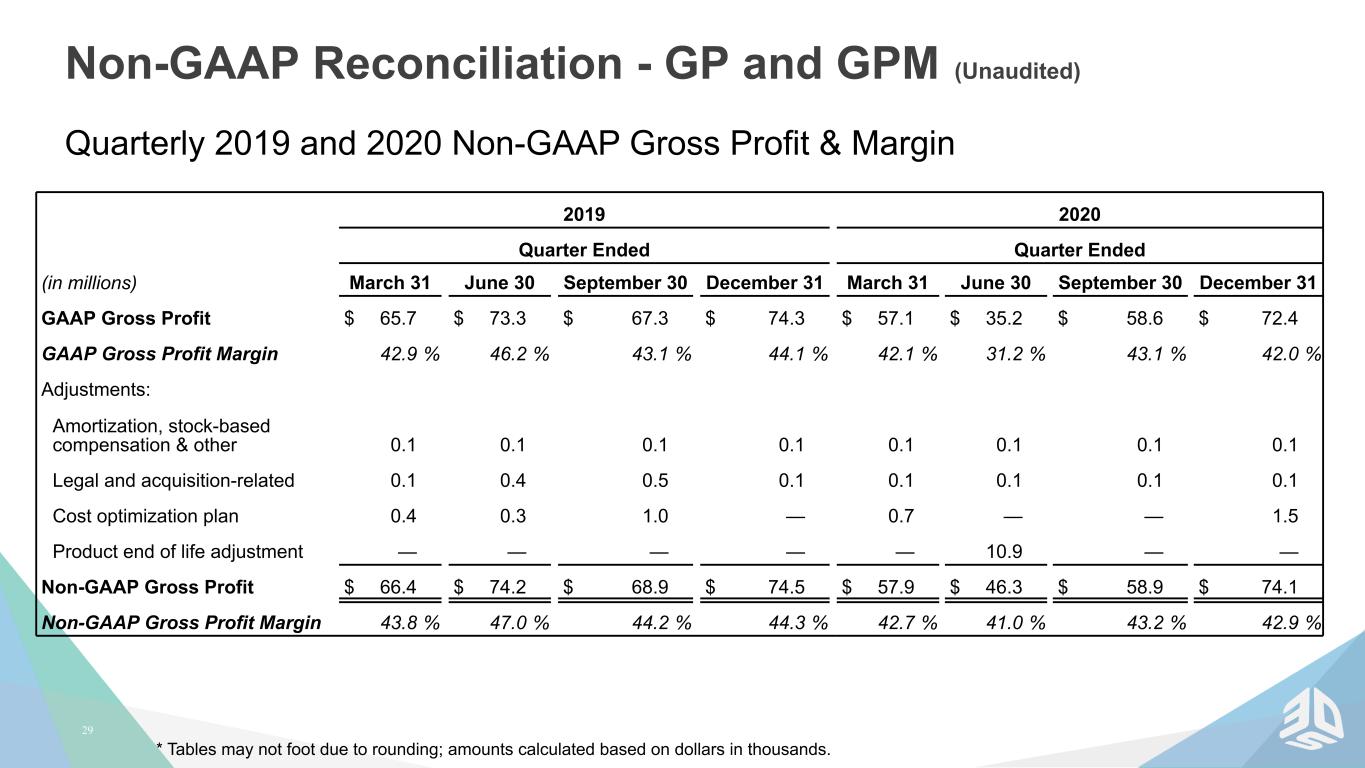
29 Non-GAAP Reconciliation - GP and GPM (Unaudited) Quarterly 2019 and 2020 Non-GAAP Gross Profit & Margin 2019 2020 Quarter Ended Quarter Ended (in millions) March 31 June 30 September 30 December 31 March 31 June 30 September 30 December 31 GAAP Gross Profit $ 65.7 $ 73.3 $ 67.3 $ 74.3 $ 57.1 $ 35.2 $ 58.6 $ 72.4 GAAP Gross Profit Margin 42.9 % 46.2 % 43.1 % 44.1 % 42.1 % 31.2 % 43.1 % 42.0 % Adjustments: Amortization, stock-based compensation & other 0.1 0.1 0.1 0.1 0.1 0.1 0.1 0.1 Legal and acquisition-related 0.1 0.4 0.5 0.1 0.1 0.1 0.1 0.1 Cost optimization plan 0.4 0.3 1.0 — 0.7 — — 1.5 Product end of life adjustment — — — — — 10.9 — — Non-GAAP Gross Profit $ 66.4 $ 74.2 $ 68.9 $ 74.5 $ 57.9 $ 46.3 $ 58.9 $ 74.1 Non-GAAP Gross Profit Margin 43.8 % 47.0 % 44.2 % 44.3 % 42.7 % 41.0 % 43.2 % 42.9 % * Tables may not foot due to rounding; amounts calculated based on dollars in thousands.
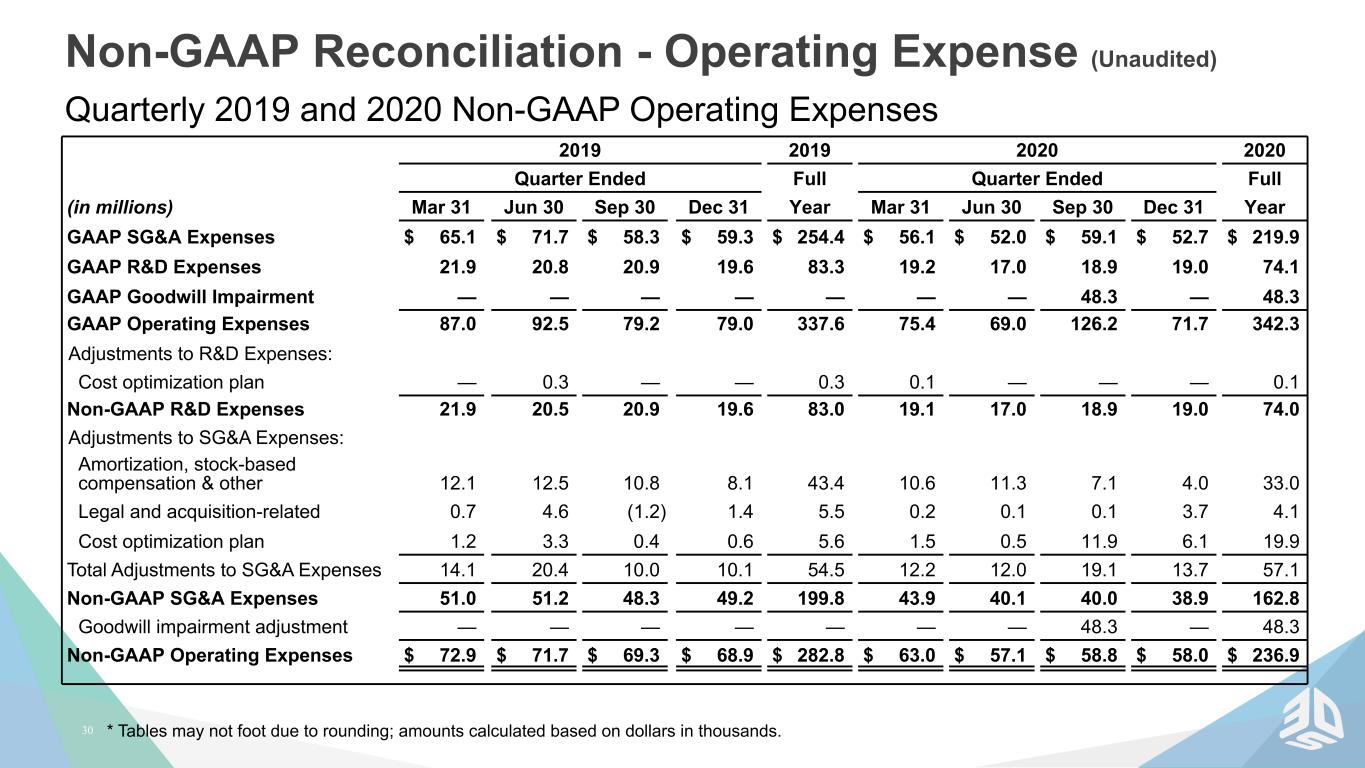
30 Non-GAAP Reconciliation - Operating Expense (Unaudited) Quarterly 2019 and 2020 Non-GAAP Operating Expenses 2019 2019 2020 2020 Quarter Ended Full Quarter Ended Full (in millions) Mar 31 Jun 30 Sep 30 Dec 31 Year Mar 31 Jun 30 Sep 30 Dec 31 Year GAAP SG&A Expenses $ 65.1 $ 71.7 $ 58.3 $ 59.3 $ 254.4 $ 56.1 $ 52.0 $ 59.1 $ 52.7 $ 219.9 GAAP R&D Expenses 21.9 20.8 20.9 19.6 83.3 19.2 17.0 18.9 19.0 74.1 GAAP Goodwill Impairment — — — — — — — 48.3 — 48.3 GAAP Operating Expenses 87.0 92.5 79.2 79.0 337.6 75.4 69.0 126.2 71.7 342.3 Adjustments to R&D Expenses: Cost optimization plan — 0.3 — — 0.3 0.1 — — — 0.1 Non-GAAP R&D Expenses 21.9 20.5 20.9 19.6 83.0 19.1 17.0 18.9 19.0 74.0 Adjustments to SG&A Expenses: Amortization, stock-based compensation & other 12.1 12.5 10.8 8.1 43.4 10.6 11.3 7.1 4.0 33.0 Legal and acquisition-related 0.7 4.6 (1.2) 1.4 5.5 0.2 0.1 0.1 3.7 4.1 Cost optimization plan 1.2 3.3 0.4 0.6 5.6 1.5 0.5 11.9 6.1 19.9 Total Adjustments to SG&A Expenses 14.1 20.4 10.0 10.1 54.5 12.2 12.0 19.1 13.7 57.1 Non-GAAP SG&A Expenses 51.0 51.2 48.3 49.2 199.8 43.9 40.1 40.0 38.9 162.8 Goodwill impairment adjustment — — — — — — — 48.3 — 48.3 Non-GAAP Operating Expenses $ 72.9 $ 71.7 $ 69.3 $ 68.9 $ 282.8 $ 63.0 $ 57.1 $ 58.8 $ 58.0 $ 236.9 * Tables may not foot due to rounding; amounts calculated based on dollars in thousands.
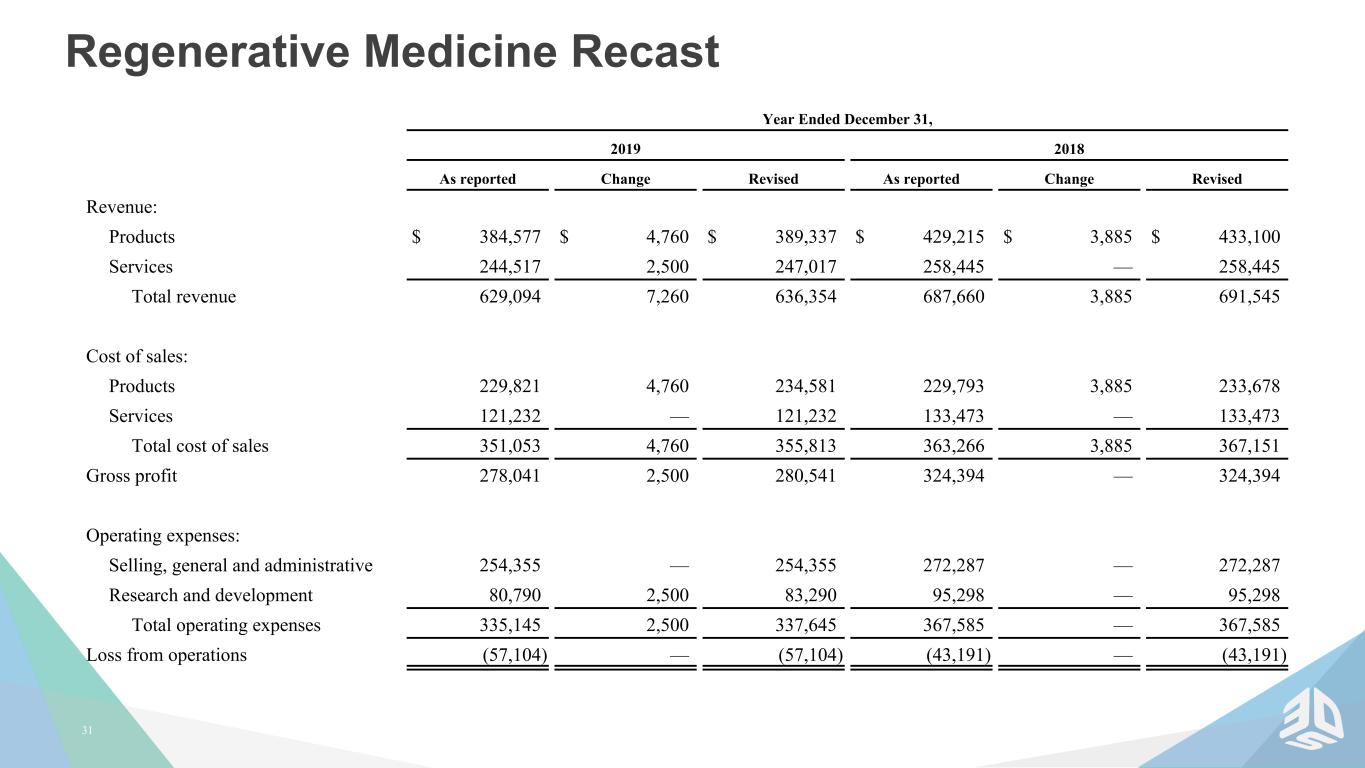
31 Regenerative Medicine Recast Year Ended December 31, 2019 2018 As reported Change Revised As reported Change Revised Revenue: Products $ 384,577 $ 4,760 $ 389,337 $ 429,215 $ 3,885 $ 433,100 Services 244,517 2,500 247,017 258,445 — 258,445 Total revenue 629,094 7,260 636,354 687,660 3,885 691,545 Cost of sales: Products 229,821 4,760 234,581 229,793 3,885 233,678 Services 121,232 — 121,232 133,473 — 133,473 Total cost of sales 351,053 4,760 355,813 363,266 3,885 367,151 Gross profit 278,041 2,500 280,541 324,394 — 324,394 Operating expenses: Selling, general and administrative 254,355 — 254,355 272,287 — 272,287 Research and development 80,790 2,500 83,290 95,298 — 95,298 Total operating expenses 335,145 2,500 337,645 367,585 — 367,585 Loss from operations (57,104) — (57,104) (43,191) — (43,191)
