Attached files
| file | filename |
|---|---|
| 8-K - 8-K - MidWestOne Financial Group, Inc. | mofg-20210226.htm |

Investor Presentation December 31, 2020
2 Forward-Looking Statements & Non-GAAP Measures Cautionary Note Regarding Forward-Looking Statements This investor presentation contains certain “forward-looking statements” within the meaning of such term in the Private Securities Litigation Reform Act of 1995. We and our representatives may, from time to time, make written or oral statements that are “forward-looking” and provide information other than historical information. These statements involve known and unknown risks, uncertainties and other factors that may cause actual results to be materially different from any results, levels of activity, performance or achievements expressed or implied by any forward-looking statement. These factors include, among other things, the factors listed below. Forward-looking statements, which may be based upon beliefs, expectations and assumptions of our management and on information currently available to management, are generally identifiable by the use of words such as “believe,” “expect,” “anticipate,” “should,” “could,” “would,” “plans,” “goals,” “intend,” “project,” “estimate,” “forecast,” “may” or similar expressions. These forward-looking statements are subject to certain risks and uncertainties that could cause actual results to differ materially from those expressed in, or implied by, these statements. Readers are cautioned not to place undue reliance on any such forward- looking statements, which speak only as of the date made. Additionally, we undertake no obligation to update any statement in light of new information or future events, except as required under federal securities law. Our ability to predict results or the actual effect of future plans or strategies is inherently uncertain. Factors that could have an impact on our ability to achieve operating results, growth plan goals and future prospects include, but are not limited to, the following: (1) effects of the COVID-19 pandemic, including its potential effects on the economic environment, our customers and our operations, as well as any changes to federal, state, or local government laws, regulations, or orders in connection with the pandemic; (2) government intervention in the U.S. financial system in response to the COVID-19 pandemic, including the effects of recent legislative, tax, accounting and regulatory actions and reforms, including the Coronavirus Aid, Relief, and Economic Security Act and the Consolidated Appropriations Act, 2021; (3) the impact of the COVID-19 pandemic on our financial results, including possible lost revenue and increased expenses (including the cost of capital), as well as possible goodwill impairment charges; (4) credit quality deterioration or pronounced and sustained reduction in real estate market values causing an increase in the allowance for credit losses, an increase in the credit loss expense, and a reduction in net earnings; (5) the effects of interest rates, including on our net income and the value of our securities portfolio; (6) changes in the economic environment, competition, or other factors that may affect our ability to acquire loans or influence the anticipated growth rate of loans and deposits and the quality of the loan portfolio and loan and deposit pricing; (7) fluctuations in the value of our investment securities; (8) governmental monetary and fiscal policies; (9) changes in and uncertainty related to benchmark interest rates used to price loans and deposits, including the expected elimination of LIBOR; (10) legislative and regulatory changes, including changes in banking, securities, trade, and tax laws and regulations and their application by our regulators; (11) the ability to attract and retain key executives and employees experienced in banking and financial services; (12) the sufficiency of the allowance for credit losses to absorb the amount of actual losses inherent in our existing loan portfolio; (13) our ability to adapt successfully to technological changes to compete effectively in the marketplace; (14) credit risks and risks from concentrations (by geographic area and by industry) within our loan portfolio; (15) the effects of competition from other commercial banks, thrifts, mortgage banking firms, consumer finance companies, credit unions, securities brokerage firms, insurance companies, money market and other mutual funds, financial technology companies, and other financial institutions operating in our markets or elsewhere or providing similar services; (16) the failure of assumptions underlying the establishment of allowances for credit losses and estimation of values of collateral and various financial assets and liabilities; (17) the risks of mergers, including, without limitation, the related time and costs of implementing such transactions, integrating operations as part of these transactions and possible failures to achieve expected gains, revenue growth and/or expense savings from such transactions; (18) volatility of rate-sensitive deposits; (19) operational risks, including data processing system failures or fraud; (20) asset/liability matching risks and liquidity risks; (21) the costs, effects and outcomes of existing or future litigation; (22) changes in general economic, political, or industry conditions, nationally, internationally or in the communities in which we conduct business; (23) changes in accounting policies and practices, as may be adopted by state and federal regulatory agencies and the Financial Accounting Standards Board; (24) war or terrorist activities, widespread disease or pandemic, or other adverse external events, which may cause deterioration in the economy or cause instability in credit markets; (25) the effects of cyber-attacks; (26) the imposition of tariffs or other domestic or international governmental policies impacting the value of the agricultural or other products of our borrowers; and (27) other risk factors detailed from time to time in Securities and Exchange Commission filings made by the Company. Non-GAAP Measures This investor presentation contains non-GAAP measures for tangible common equity, tangible book value per share, tangible common equity ratio, equity, loan yield (tax equivalent), adjusted return on average assets, return on average tangible, net interest income (tax equivalent), net interest margin (tax equivalent), efficiency ratio, overhead ratio, core earnings, and core noninterest expense. Management believes these measures provide investors with useful information regarding the Company’s profitability, financial condition and capital adequacy, consistent with how management evaluates the Company’s financial performance. A reconciliation of each non-GAAP measure to the most comparable GAAP measure is included, as necessary, in the Appendix.
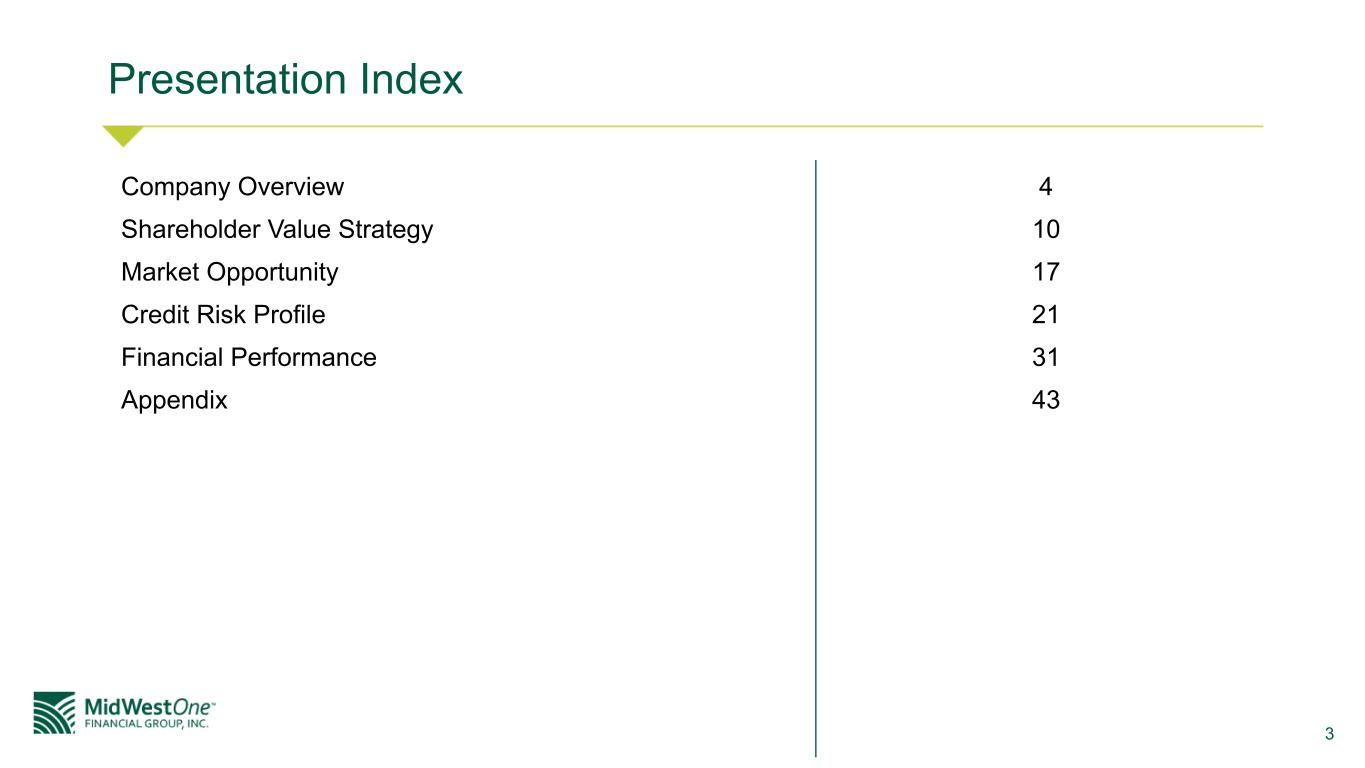
3 Company Overview 4 Shareholder Value Strategy 10 Market Opportunity 17 Credit Risk Profile 21 Financial Performance 31 Appendix 43 Presentation Index
4 Company Overview
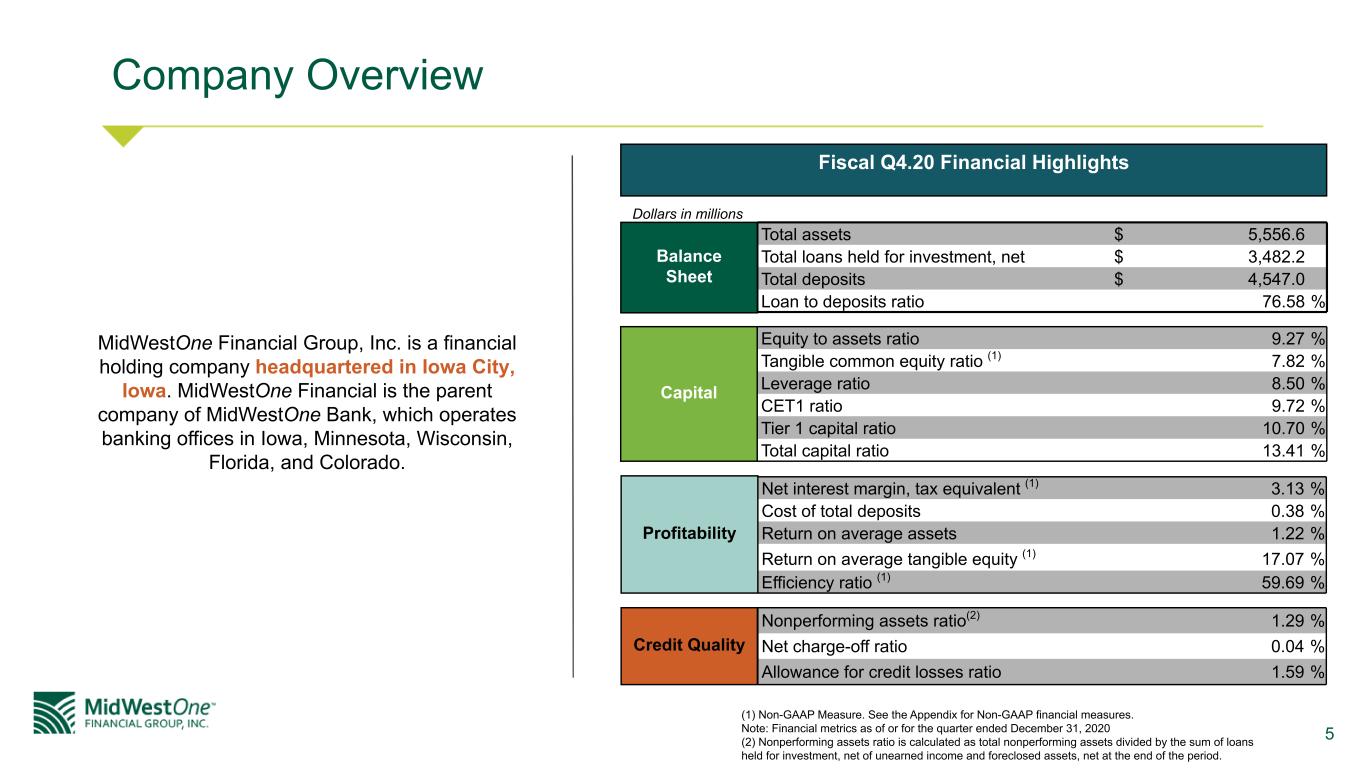
5 Company Overview MidWestOne Financial Group, Inc. is a financial holding company headquartered in Iowa City, Iowa. MidWestOne Financial is the parent company of MidWestOne Bank, which operates banking offices in Iowa, Minnesota, Wisconsin, Florida, and Colorado. Total assets $ 5,556.6 Total loans held for investment, net $ 3,482.2 Total deposits $ 4,547.0 Loan to deposits ratio 76.58 % Balance Sheet Equity to assets ratio 9.27 % Tangible common equity ratio (1) 7.82 % Leverage ratio 8.50 % CET1 ratio 9.72 % Tier 1 capital ratio 10.70 % Total capital ratio 13.41 % Capital Net interest margin, tax equivalent (1) 3.13 % Cost of total deposits 0.38 % Return on average assets 1.22 % Return on average tangible equity (1) 17.07 % Efficiency ratio (1) 59.69 % Profitability Nonperforming assets ratio(2) 1.29 % Net charge-off ratio 0.04 % Allowance for credit losses ratio 1.59 % Credit Quality Fiscal Q4.20 Financial Highlights Dollars in millions (1) Non-GAAP Measure. See the Appendix for Non-GAAP financial measures. Note: Financial metrics as of or for the quarter ended December 31, 2020 (2) Nonperforming assets ratio is calculated as total nonperforming assets divided by the sum of loans held for investment, net of unearned income and foreclosed assets, net at the end of the period.
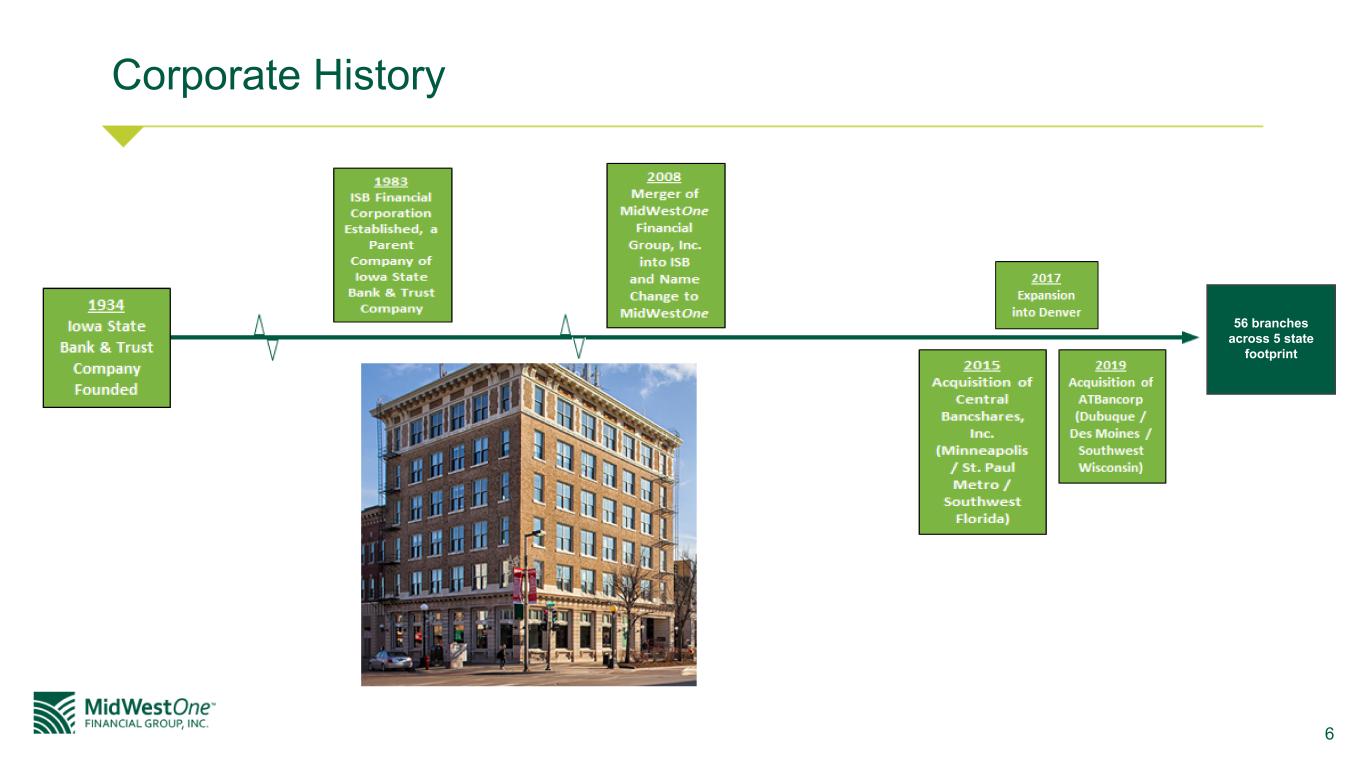
6 Corporate History 56 branches across 5 state footprint
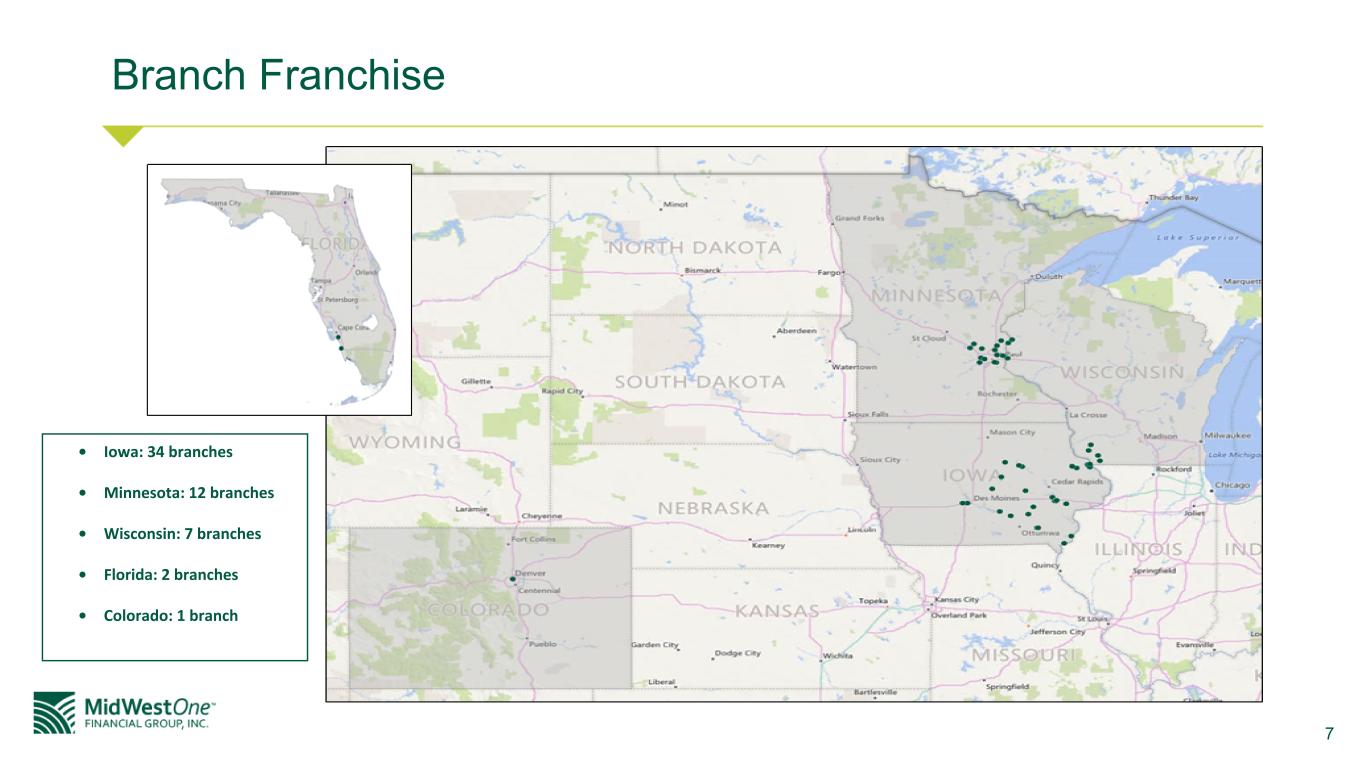
7 Branch Franchise • Iowa: 34 branches • Minnesota: 12 branches • Wisconsin: 7 branches • Florida: 2 branches • Colorado: 1 branch
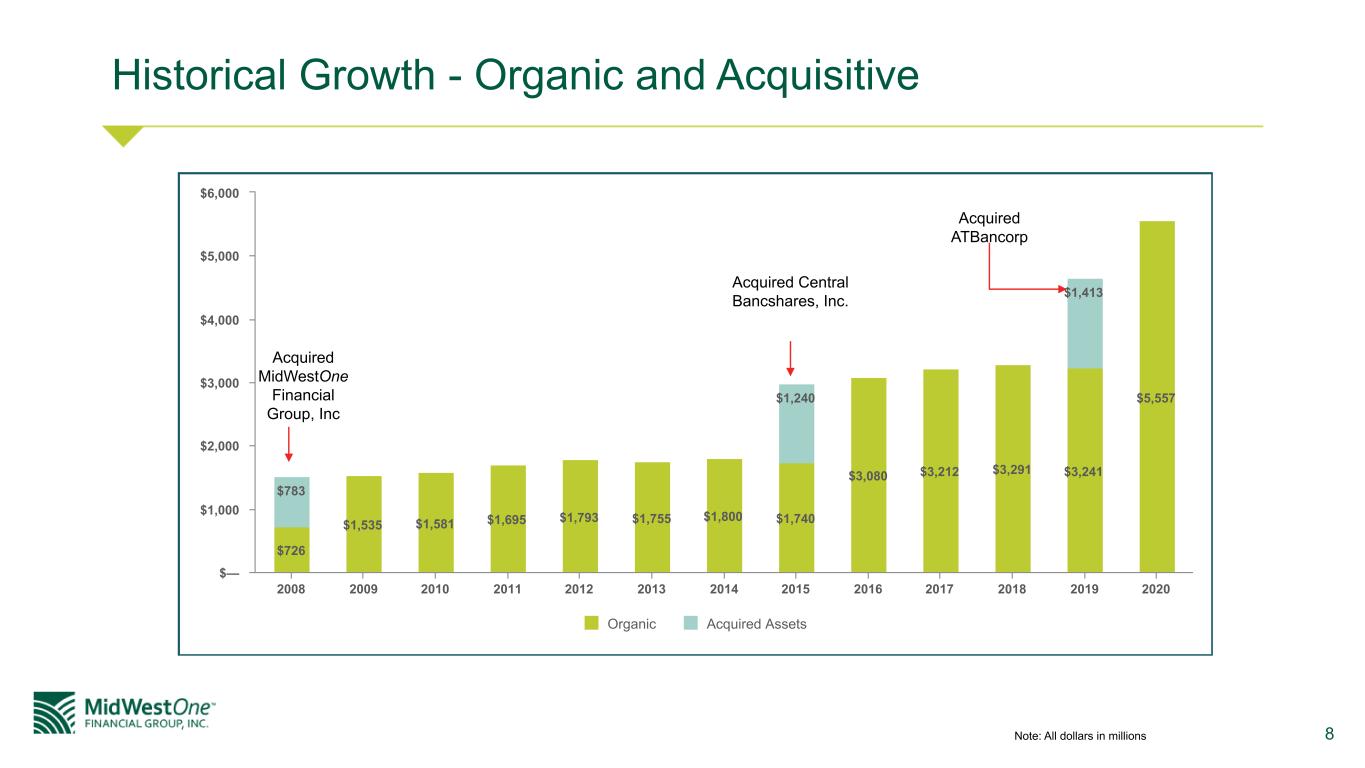
8 Historical Growth - Organic and Acquisitive $726 $1,535 $1,581 $1,695 $1,793 $1,755 $1,800 $1,740 $3,080 $3,212 $3,291 $3,241 $5,557 $783 $1,240 $1,413 Organic Acquired Assets 2008 2009 2010 2011 2012 2013 2014 2015 2016 2017 2018 2019 2020 $— $1,000 $2,000 $3,000 $4,000 $5,000 $6,000 Acquired ATBancorp Acquired Central Bancshares, Inc. Note: All dollars in millions Acquired MidWestOne Financial Group, Inc
9 Our Mission and Our Operating Principles Take care of our customers … and those that should be. Since our company was founded during the Great Depression, it has been our belief that the communities we serve are not only the inspiration of our organization, but the purpose behind our existence. Our history is their history. We passionately pursue success for our neighbors and we support organizations that create opportunities in our communities. Because we believe the positive actions of each one of us contributes to the success of us all. Our brand is built by the actions of our employees, supporting our mission statement, one relationship at a time. It's about caring. Our Operating Principles ◦ Take good care of our customers ◦ Hire and retain excellent employees ◦ Always conduct yourself with the utmost integrity ◦ Work as one team ◦ Learn constantly so we can continually improve
10 Shareholder Value Strategy
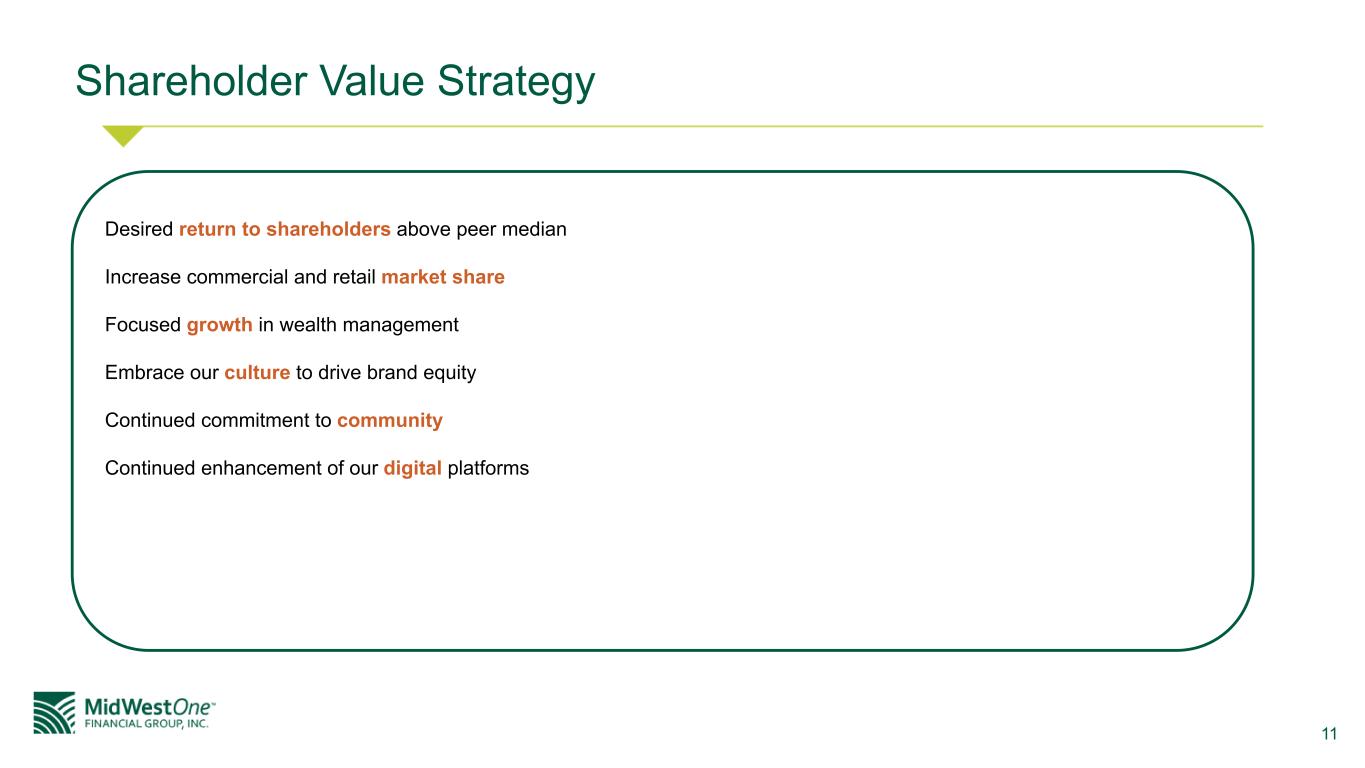
11 Shareholder Value Strategy Desired return to shareholders above peer median Increase commercial and retail market share Focused growth in wealth management Embrace our culture to drive brand equity Continued commitment to community Continued enhancement of our digital platforms
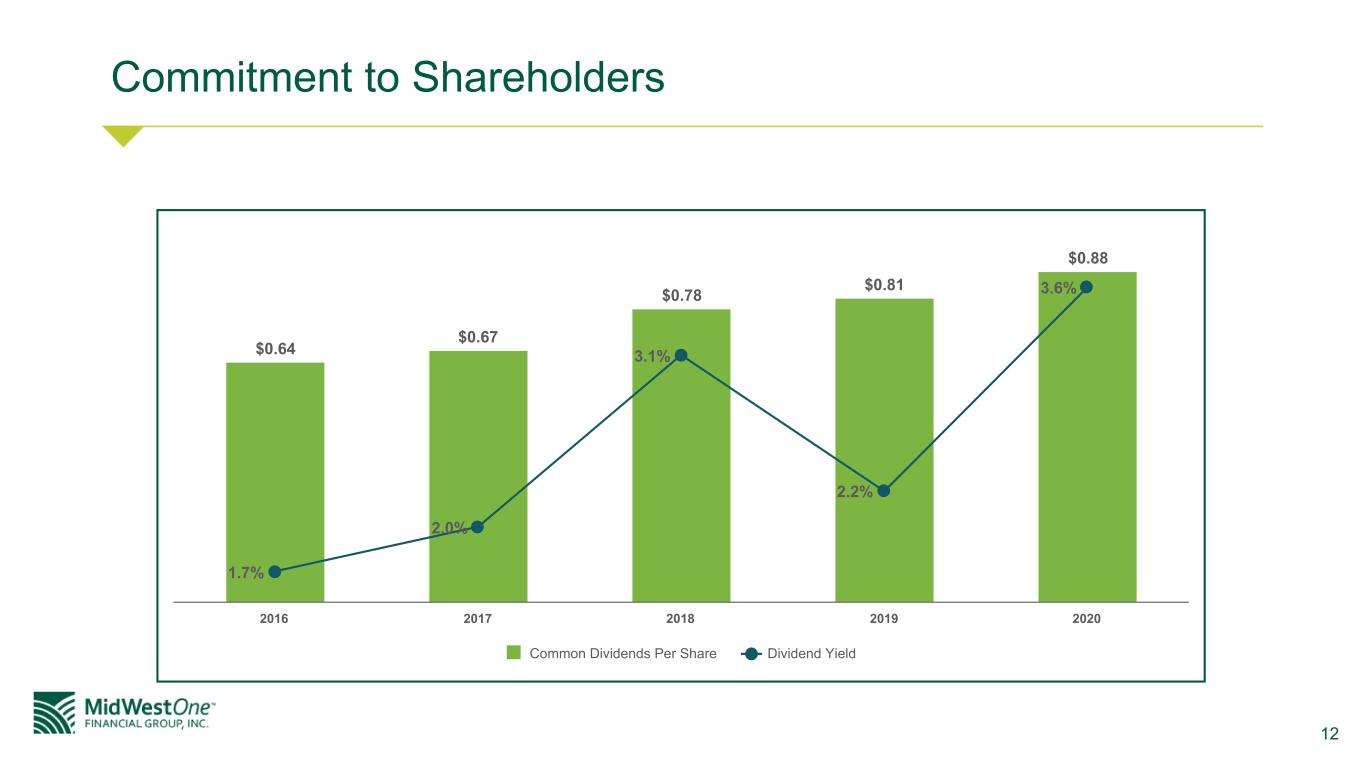
12 Commitment to Shareholders $0.64 $0.67 $0.78 $0.81 $0.88 1.7% 2.0% 3.1% 2.2% 3.6% Common Dividends Per Share Dividend Yield 2016 2017 2018 2019 2020
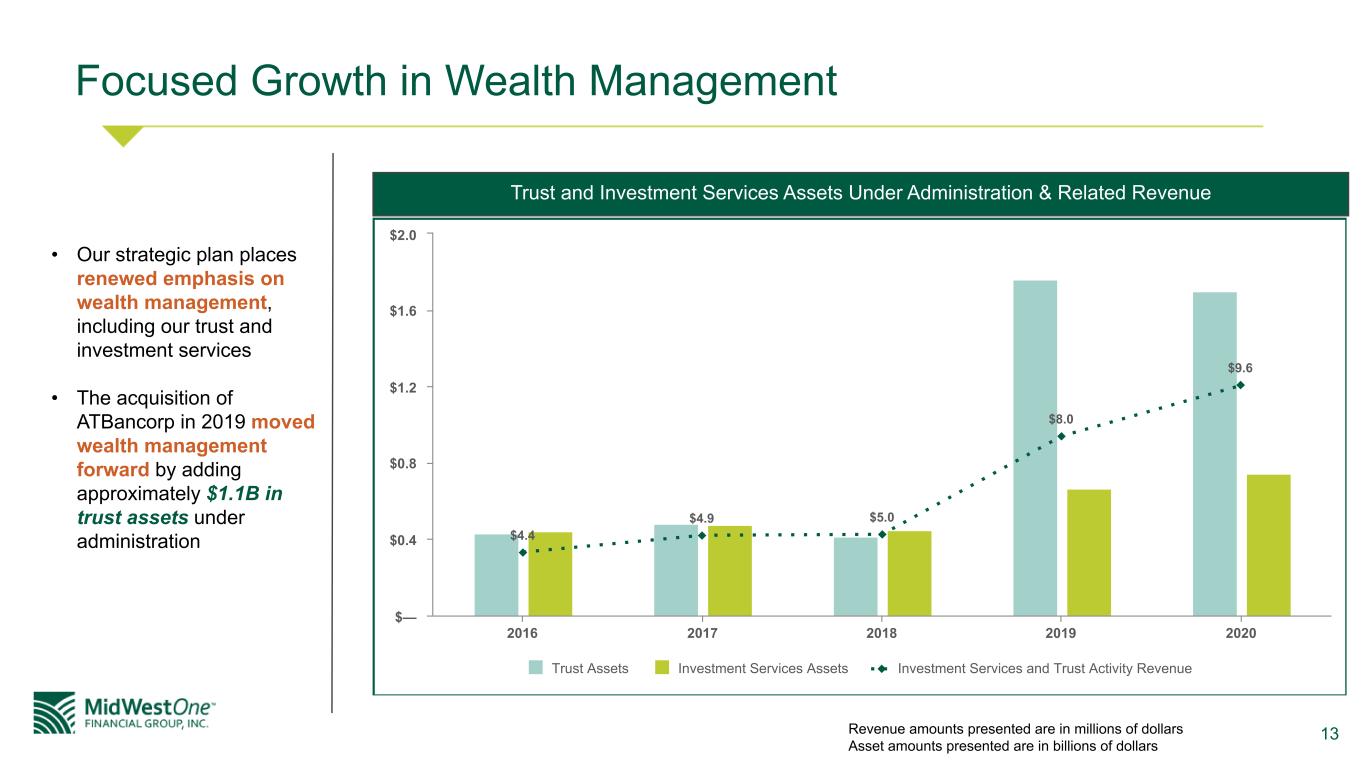
13 Focused Growth in Wealth Management $4.4 $4.9 $5.0 $8.0 $9.6 Trust Assets Investment Services Assets Investment Services and Trust Activity Revenue 2016 2017 2018 2019 2020 $— $0.4 $0.8 $1.2 $1.6 $2.0 • Our strategic plan places renewed emphasis on wealth management, including our trust and investment services • The acquisition of ATBancorp in 2019 moved wealth management forward by adding approximately $1.1B in trust assets under administration Trust and Investment Services Assets Under Administration & Related Revenue Revenue amounts presented are in millions of dollars Asset amounts presented are in billions of dollars

14 Embrace Our Culture to Drive Brand Equity Our brand is built on the foundation of our culture, which drives the behaviors and actions of our employees in support of our mission statement: To take good care of our customers and those that should be We do this one relationship at a time - it's about caring. "MidWestOne, while they're a local bank, they're a big local bank, and that's what we like about them." – Jeff Quint of Cedar Ridge Distillery Swisher, IA "It is an uncertain time for us all, but it is ever-comforting to know that you and your team are doing whatever you can to move our community, economy and lives forward." – Peter C. Ward of CWS SecurityWatch, LLC Osceola, WI "I love the fact that MidWestOne hangs onto our mortgage. It allows us to feel that we're banking locally.… MidWestOne Bank is definitely a part of the community. They truly are invested in the community." – Dr. Azeemuddin Ahmed, MD Iowa City, IA "I mean this is, this is a bank that, that cares about their community...MidWestOne Bank is absolutely a partner in our business." – Andrew Sherburne, Executive Director & CoFounder of FilmScene Iowa City, IA
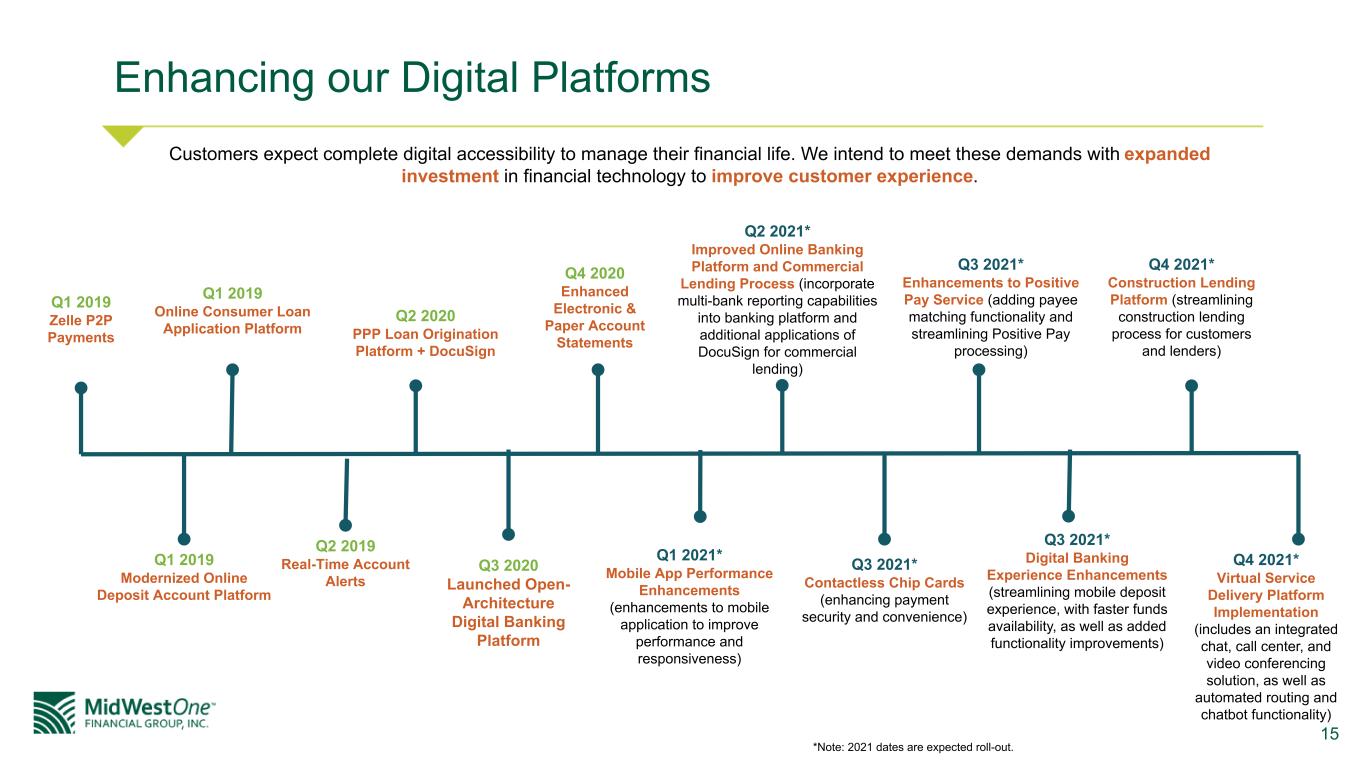
15 Enhancing our Digital Platforms Customers expect complete digital accessibility to manage their financial life. We intend to meet these demands with expanded investment in financial technology to improve customer experience. Q1 2019 Zelle P2P Payments Q1 2019 Online Consumer Loan Application Platform Q2 2020 PPP Loan Origination Platform + DocuSign Q4 2020 Enhanced Electronic & Paper Account Statements Q3 2021* Contactless Chip Cards (enhancing payment security and convenience) Q3 2021* Enhancements to Positive Pay Service (adding payee matching functionality and streamlining Positive Pay processing) Q1 2019 Modernized Online Deposit Account Platform Q2 2019 Real-Time Account Alerts Q3 2020 Launched Open- Architecture Digital Banking Platform Q3 2021* Digital Banking Experience Enhancements (streamlining mobile deposit experience, with faster funds availability, as well as added functionality improvements) Q4 2021* Virtual Service Delivery Platform Implementation (includes an integrated chat, call center, and video conferencing solution, as well as automated routing and chatbot functionality) Q4 2021* Construction Lending Platform (streamlining construction lending process for customers and lenders) *Note: 2021 dates are expected roll-out. Q1 2021* Mobile App Performance Enhancements (enhancements to mobile application to improve performance and responsiveness) Q2 2021* Improved Online Banking Platform and Commercial Lending Process (incorporate multi-bank reporting capabilities into banking platform and additional applications of DocuSign for commercial lending)
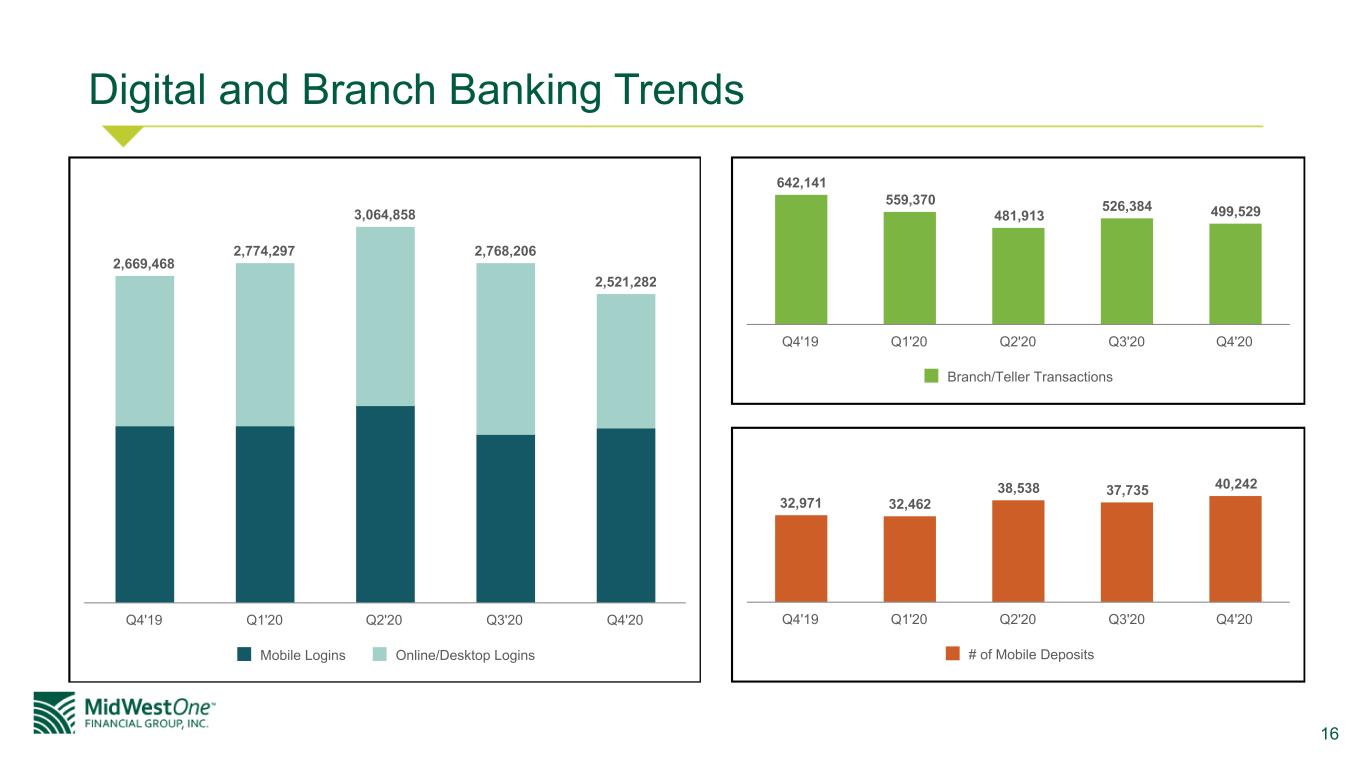
16 Digital and Branch Banking Trends 2,669,468 2,774,297 3,064,858 2,768,206 2,521,282 Mobile Logins Online/Desktop Logins Q4'19 Q1'20 Q2'20 Q3'20 Q4'20 642,141 559,370 481,913 526,384 499,529 Branch/Teller Transactions Q4'19 Q1'20 Q2'20 Q3'20 Q4'20 32,971 32,462 38,538 37,735 40,242 # of Mobile Deposits Q4'19 Q1'20 Q2'20 Q3'20 Q4'20
17 Market Opportunity
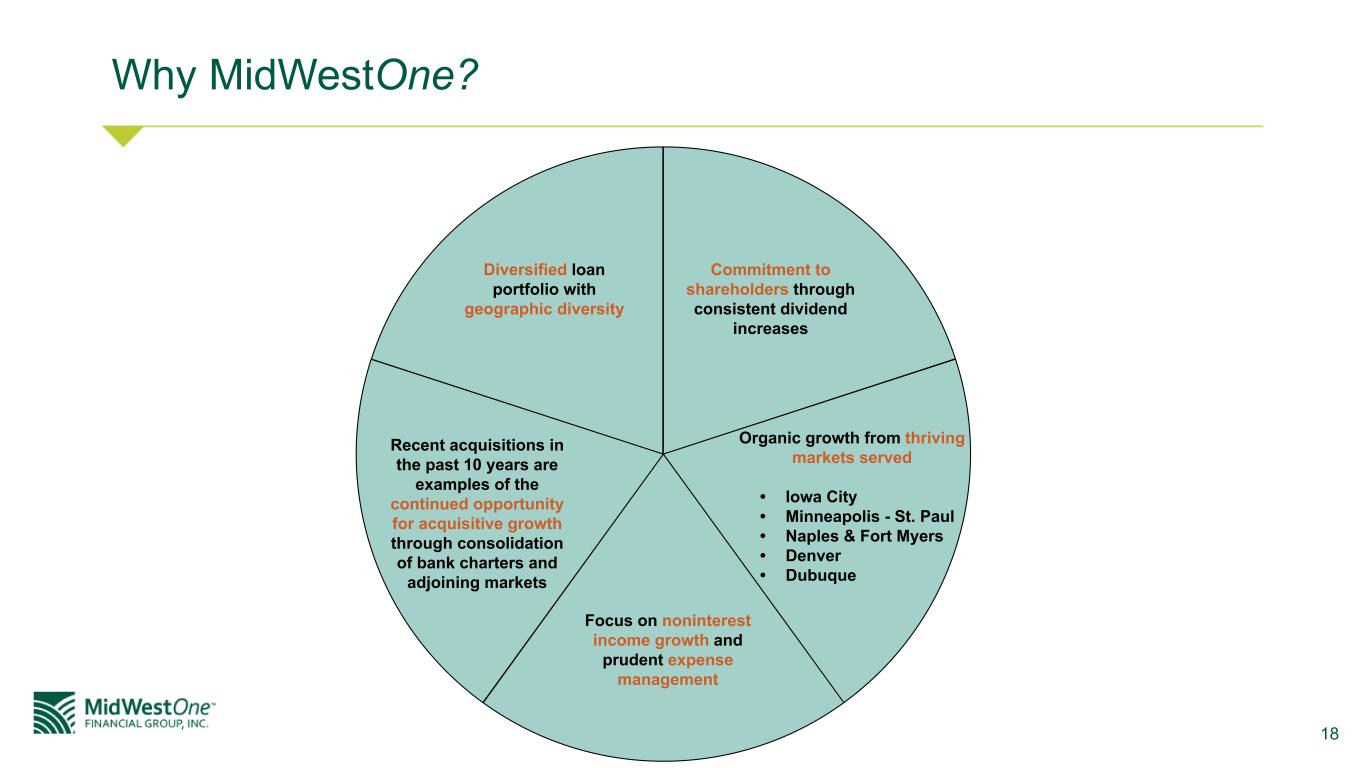
18 Why MidWestOne? Commitment to shareholders through consistent dividend increases Diversified loan portfolio with geographic diversity Focus on noninterest income growth and prudent expense management Recent acquisitions in the past 10 years are examples of the continued opportunity for acquisitive growth through consolidation of bank charters and adjoining markets Organic growth from thriving markets served • Iowa City • Minneapolis - St. Paul • Naples & Fort Myers • Denver • Dubuque
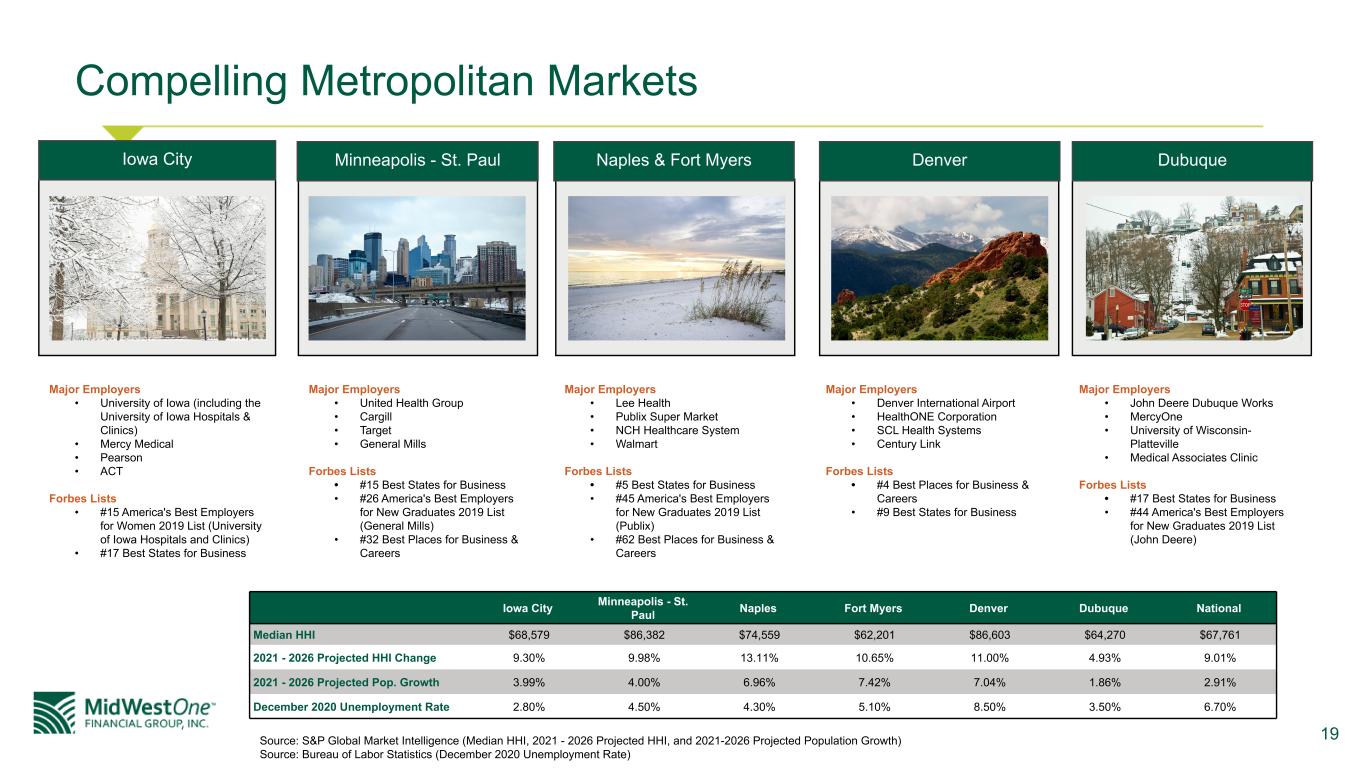
19 Compelling Metropolitan Markets Iowa City Minneapolis - St. Paul Naples Fort Myers Denver Dubuque National Median HHI $68,579 $86,382 $74,559 $62,201 $86,603 $64,270 $67,761 2021 - 2026 Projected HHI Change 9.30% 9.98% 13.11% 10.65% 11.00% 4.93% 9.01% 2021 - 2026 Projected Pop. Growth 3.99% 4.00% 6.96% 7.42% 7.04% 1.86% 2.91% December 2020 Unemployment Rate 2.80% 4.50% 4.30% 5.10% 8.50% 3.50% 6.70% Source: S&P Global Market Intelligence (Median HHI, 2021 - 2026 Projected HHI, and 2021-2026 Projected Population Growth) Source: Bureau of Labor Statistics (December 2020 Unemployment Rate) Major Employers • University of Iowa (including the University of Iowa Hospitals & Clinics) • Mercy Medical • Pearson • ACT Forbes Lists • #15 America's Best Employers for Women 2019 List (University of Iowa Hospitals and Clinics) • #17 Best States for Business Major Employers • United Health Group • Cargill • Target • General Mills Forbes Lists • #15 Best States for Business • #26 America's Best Employers for New Graduates 2019 List (General Mills) • #32 Best Places for Business & Careers Major Employers • Lee Health • Publix Super Market • NCH Healthcare System • Walmart Forbes Lists • #5 Best States for Business • #45 America's Best Employers for New Graduates 2019 List (Publix) • #62 Best Places for Business & Careers Major Employers • Denver International Airport • HealthONE Corporation • SCL Health Systems • Century Link Forbes Lists • #4 Best Places for Business & Careers • #9 Best States for Business Major Employers • John Deere Dubuque Works • MercyOne • University of Wisconsin- Platteville • Medical Associates Clinic Forbes Lists • #17 Best States for Business • #44 America's Best Employers for New Graduates 2019 List (John Deere) Iowa City Minneapolis - St. Paul Naples & Fort Myers Denver Dubuque
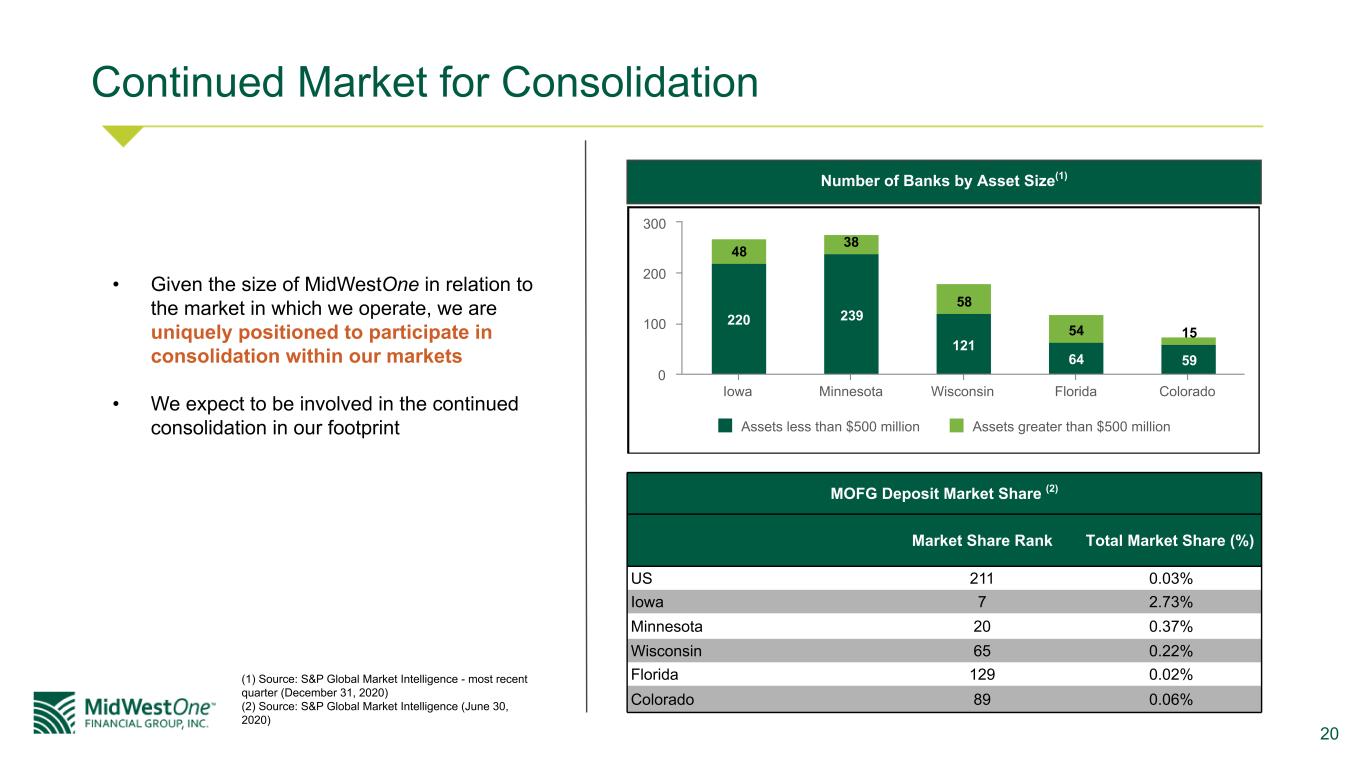
20 Continued Market for Consolidation (1) Source: S&P Global Market Intelligence - most recent quarter (December 31, 2020) (2) Source: S&P Global Market Intelligence (June 30, 2020) 220 239 121 64 59 48 38 58 54 15 Assets less than $500 million Assets greater than $500 million Iowa Minnesota Wisconsin Florida Colorado 0 100 200 300 MOFG Deposit Market Share (2) Market Share Rank Total Market Share (%) US 211 0.03% Iowa 7 2.73% Minnesota 20 0.37% Wisconsin 65 0.22% Florida 129 0.02% Colorado 89 0.06% • Given the size of MidWestOne in relation to the market in which we operate, we are uniquely positioned to participate in consolidation within our markets • We expect to be involved in the continued consolidation in our footprint Number of Banks by Asset Size(1)
21 Credit Risk Profile
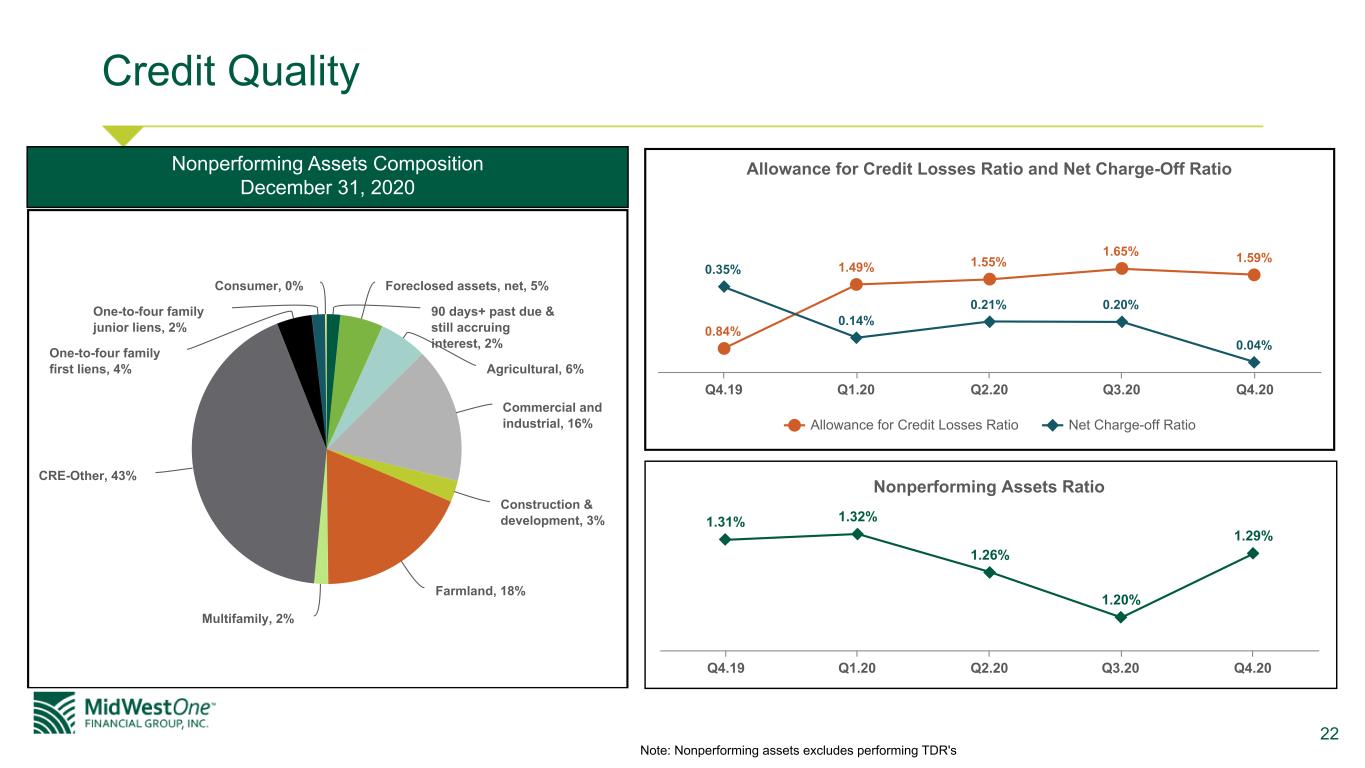
22 Credit Quality Note: Nonperforming assets excludes performing TDR's Allowance for Credit Losses Ratio and Net Charge-Off Ratio 0.84% 1.49% 1.55% 1.65% 1.59% 0.35% 0.14% 0.21% 0.20% 0.04% Allowance for Credit Losses Ratio Net Charge-off Ratio Q4.19 Q1.20 Q2.20 Q3.20 Q4.20 Nonperforming Assets Ratio 1.31% 1.32% 1.26% 1.20% 1.29% Q4.19 Q1.20 Q2.20 Q3.20 Q4.20 90 days+ past due & still accruing interest, 2% Foreclosed assets, net, 5% Agricultural, 6% Commercial and industrial, 16% Construction & development, 3% Farmland, 18% Multifamily, 2% CRE-Other, 43% One-to-four family first liens, 4% One-to-four family junior liens, 2% Consumer, 0% Nonperforming Assets Composition December 31, 2020
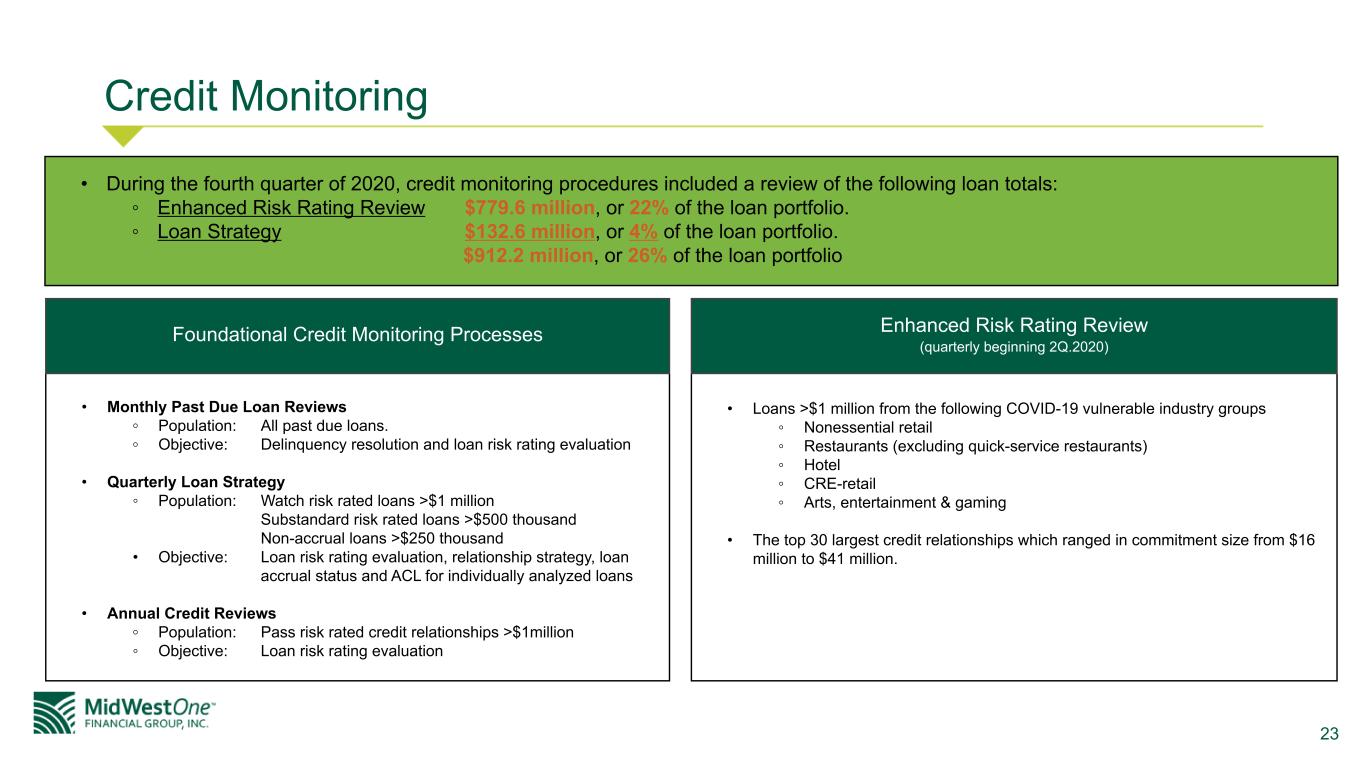
23 Credit Monitoring • Monthly Past Due Loan Reviews ◦ Population: All past due loans. ◦ Objective: Delinquency resolution and loan risk rating evaluation • Quarterly Loan Strategy ◦ Population: Watch risk rated loans >$1 million Substandard risk rated loans >$500 thousand Non-accrual loans >$250 thousand • Objective: Loan risk rating evaluation, relationship strategy, loan accrual status and ACL for individually analyzed loans • Annual Credit Reviews ◦ Population: Pass risk rated credit relationships >$1million ◦ Objective: Loan risk rating evaluation Foundational Credit Monitoring Processes • Loans >$1 million from the following COVID-19 vulnerable industry groups ◦ Nonessential retail ◦ Restaurants (excluding quick-service restaurants) ◦ Hotel ◦ CRE-retail ◦ Arts, entertainment & gaming • The top 30 largest credit relationships which ranged in commitment size from $16 million to $41 million. Enhanced Risk Rating Review (quarterly beginning 2Q.2020) • During the fourth quarter of 2020, credit monitoring procedures included a review of the following loan totals: ◦ Enhanced Risk Rating Review $779.6 million, or 22% of the loan portfolio. ◦ Loan Strategy $132.6 million, or 4% of the loan portfolio. $912.2 million, or 26% of the loan portfolio
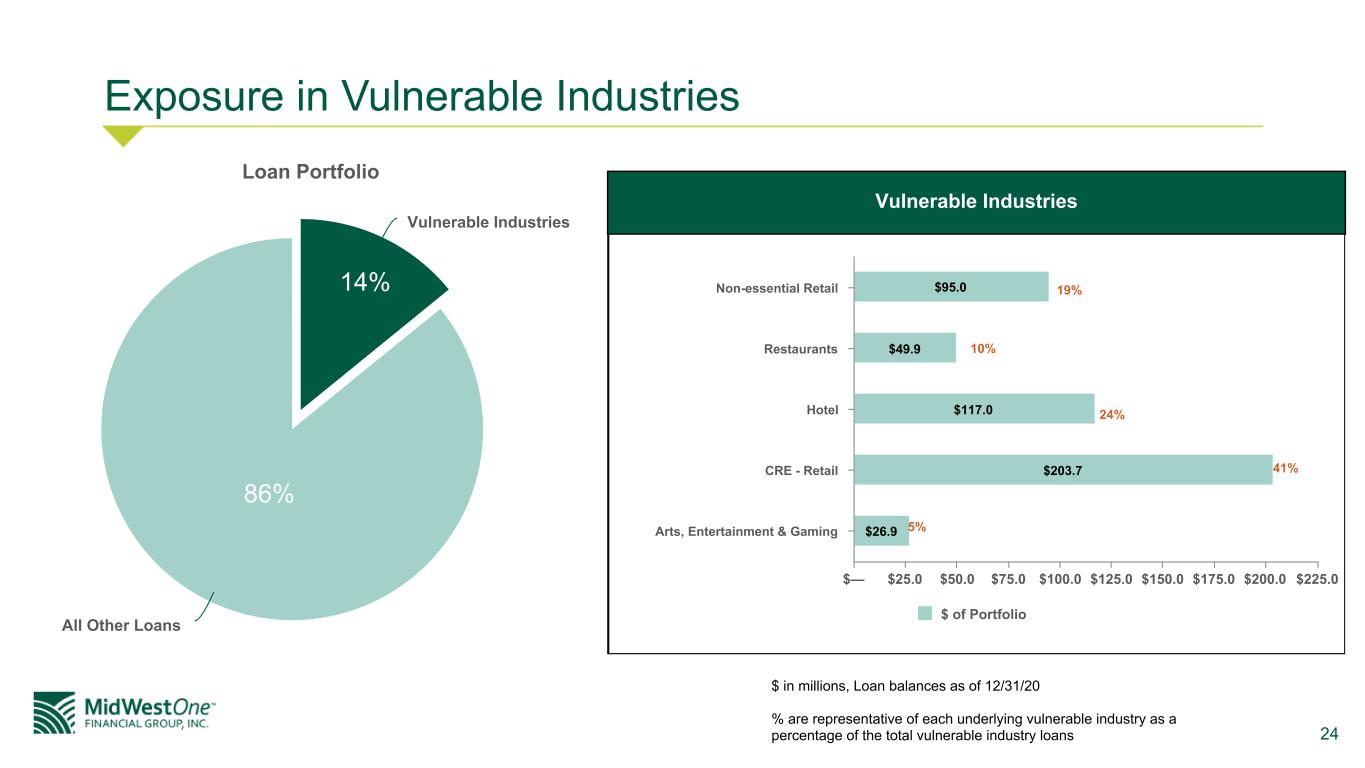
24 Exposure in Vulnerable Industries Loan Portfolio Vulnerable Industries All Other Loans $95.0 $49.9 $117.0 $203.7 $26.9 $ of Portfolio Non-essential Retail Restaurants Hotel CRE - Retail Arts, Entertainment & Gaming $— $25.0 $50.0 $75.0 $100.0 $125.0 $150.0 $175.0 $200.0 $225.0 19% 10% 24% 41% 5% 14% 86% Vulnerable Industries $ in millions, Loan balances as of 12/31/20 % are representative of each underlying vulnerable industry as a percentage of the total vulnerable industry loans
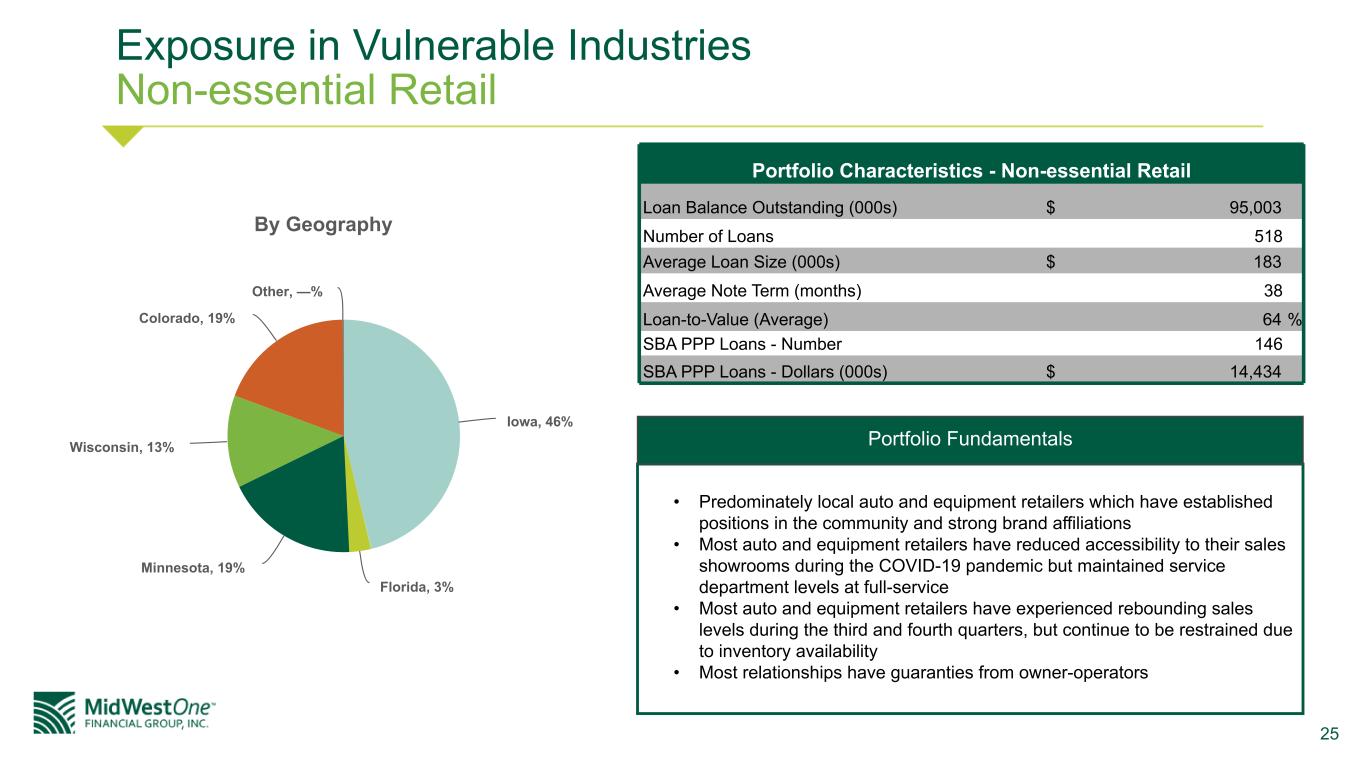
25 Exposure in Vulnerable Industries Non-essential Retail By Geography Iowa, 46% Florida, 3% Minnesota, 19% Wisconsin, 13% Colorado, 19% Other, —% Portfolio Characteristics - Non-essential Retail Loan Balance Outstanding (000s) $ 95,003 Number of Loans 518 Average Loan Size (000s) $ 183 Average Note Term (months) 38 Loan-to-Value (Average) 64 % SBA PPP Loans - Number 146 SBA PPP Loans - Dollars (000s) $ 14,434 • Predominately local auto and equipment retailers which have established positions in the community and strong brand affiliations • Most auto and equipment retailers have reduced accessibility to their sales showrooms during the COVID-19 pandemic but maintained service department levels at full-service • Most auto and equipment retailers have experienced rebounding sales levels during the third and fourth quarters, but continue to be restrained due to inventory availability • Most relationships have guaranties from owner-operators Portfolio Fundamentals
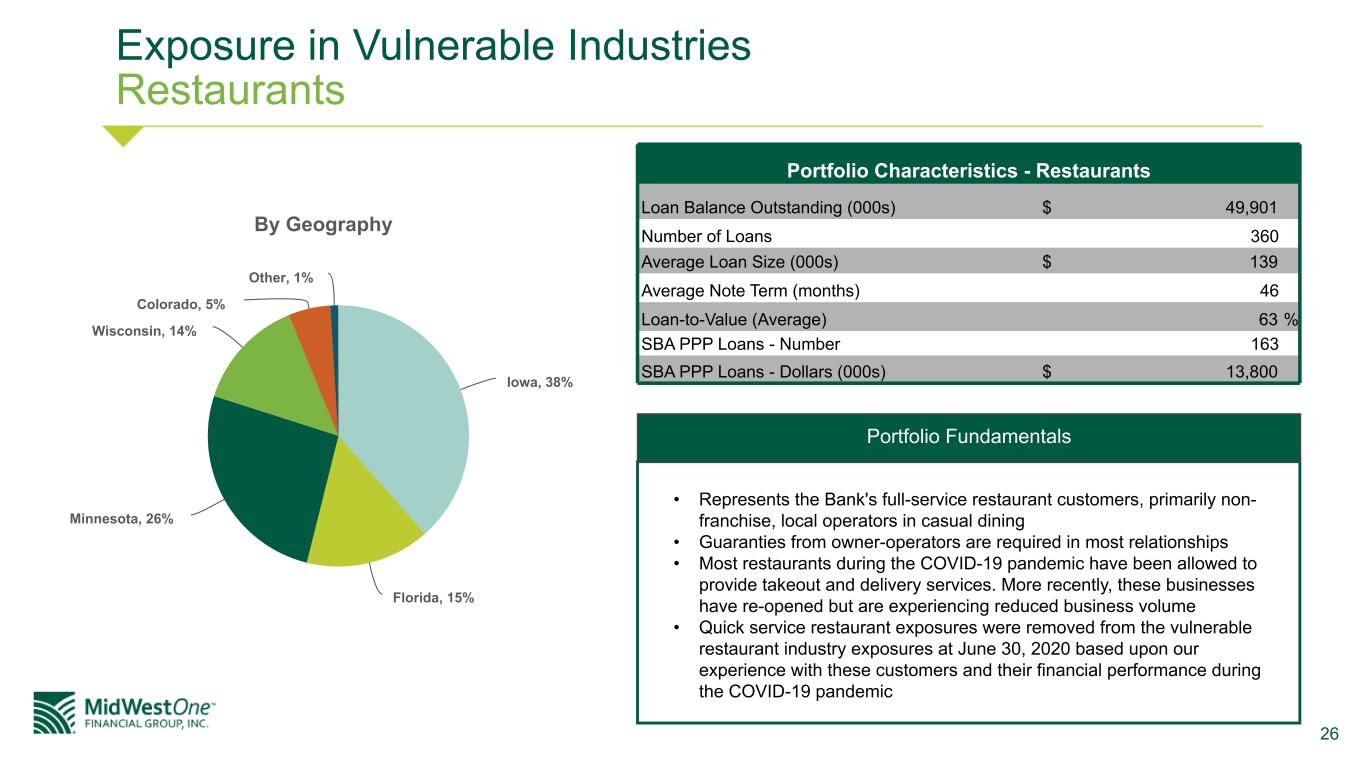
26 Exposure in Vulnerable Industries Restaurants By Geography Iowa, 38% Florida, 15% Minnesota, 26% Wisconsin, 14% Colorado, 5% Other, 1% Portfolio Characteristics - Restaurants Loan Balance Outstanding (000s) $ 49,901 Number of Loans 360 Average Loan Size (000s) $ 139 Average Note Term (months) 46 Loan-to-Value (Average) 63 % SBA PPP Loans - Number 163 SBA PPP Loans - Dollars (000s) $ 13,800 • Represents the Bank's full-service restaurant customers, primarily non- franchise, local operators in casual dining • Guaranties from owner-operators are required in most relationships • Most restaurants during the COVID-19 pandemic have been allowed to provide takeout and delivery services. More recently, these businesses have re-opened but are experiencing reduced business volume • Quick service restaurant exposures were removed from the vulnerable restaurant industry exposures at June 30, 2020 based upon our experience with these customers and their financial performance during the COVID-19 pandemic Portfolio Fundamentals
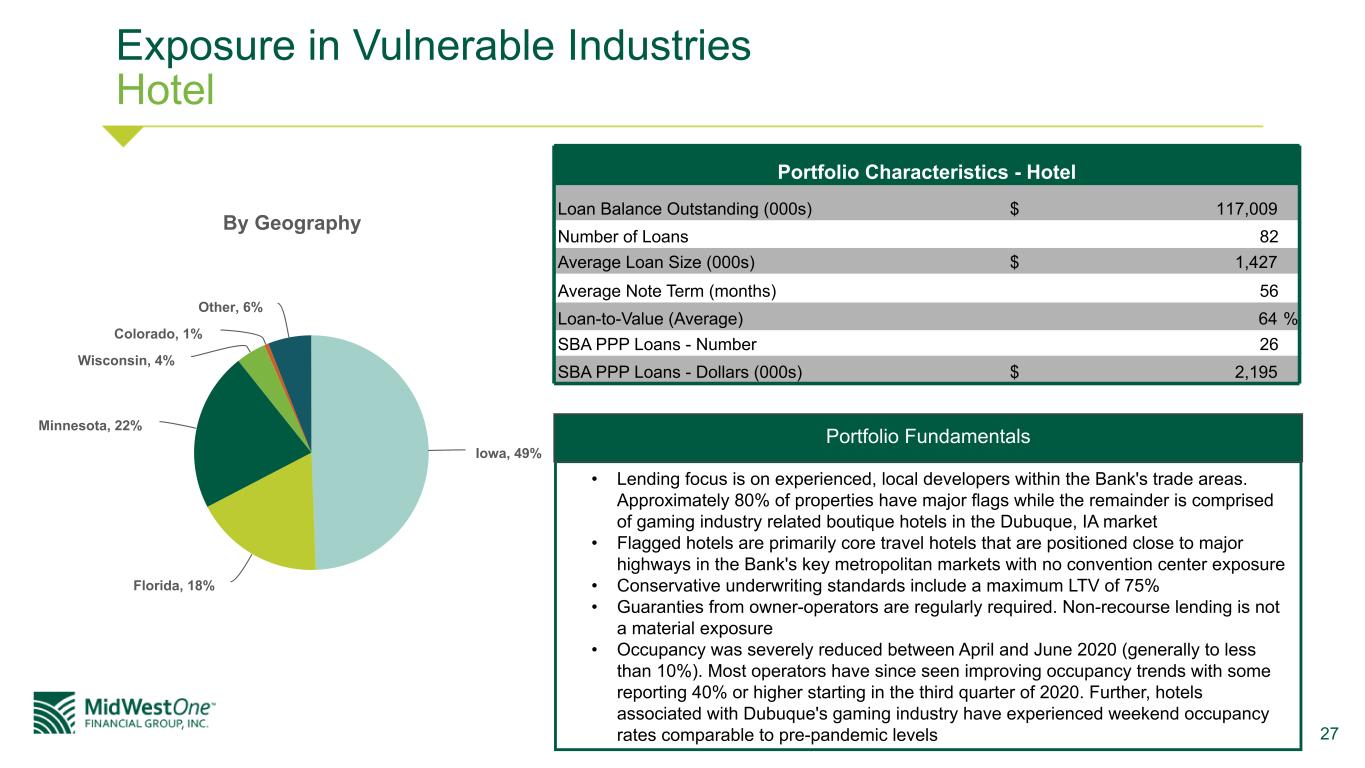
27 Exposure in Vulnerable Industries Hotel By Geography Iowa, 49% Florida, 18% Minnesota, 22% Wisconsin, 4% Colorado, 1% Other, 6% Portfolio Characteristics - Hotel Loan Balance Outstanding (000s) $ 117,009 Number of Loans 82 Average Loan Size (000s) $ 1,427 Average Note Term (months) 56 Loan-to-Value (Average) 64 % SBA PPP Loans - Number 26 SBA PPP Loans - Dollars (000s) $ 2,195 • Lending focus is on experienced, local developers within the Bank's trade areas. Approximately 80% of properties have major flags while the remainder is comprised of gaming industry related boutique hotels in the Dubuque, IA market • Flagged hotels are primarily core travel hotels that are positioned close to major highways in the Bank's key metropolitan markets with no convention center exposure • Conservative underwriting standards include a maximum LTV of 75% • Guaranties from owner-operators are regularly required. Non-recourse lending is not a material exposure • Occupancy was severely reduced between April and June 2020 (generally to less than 10%). Most operators have since seen improving occupancy trends with some reporting 40% or higher starting in the third quarter of 2020. Further, hotels associated with Dubuque's gaming industry have experienced weekend occupancy rates comparable to pre-pandemic levels Portfolio Fundamentals
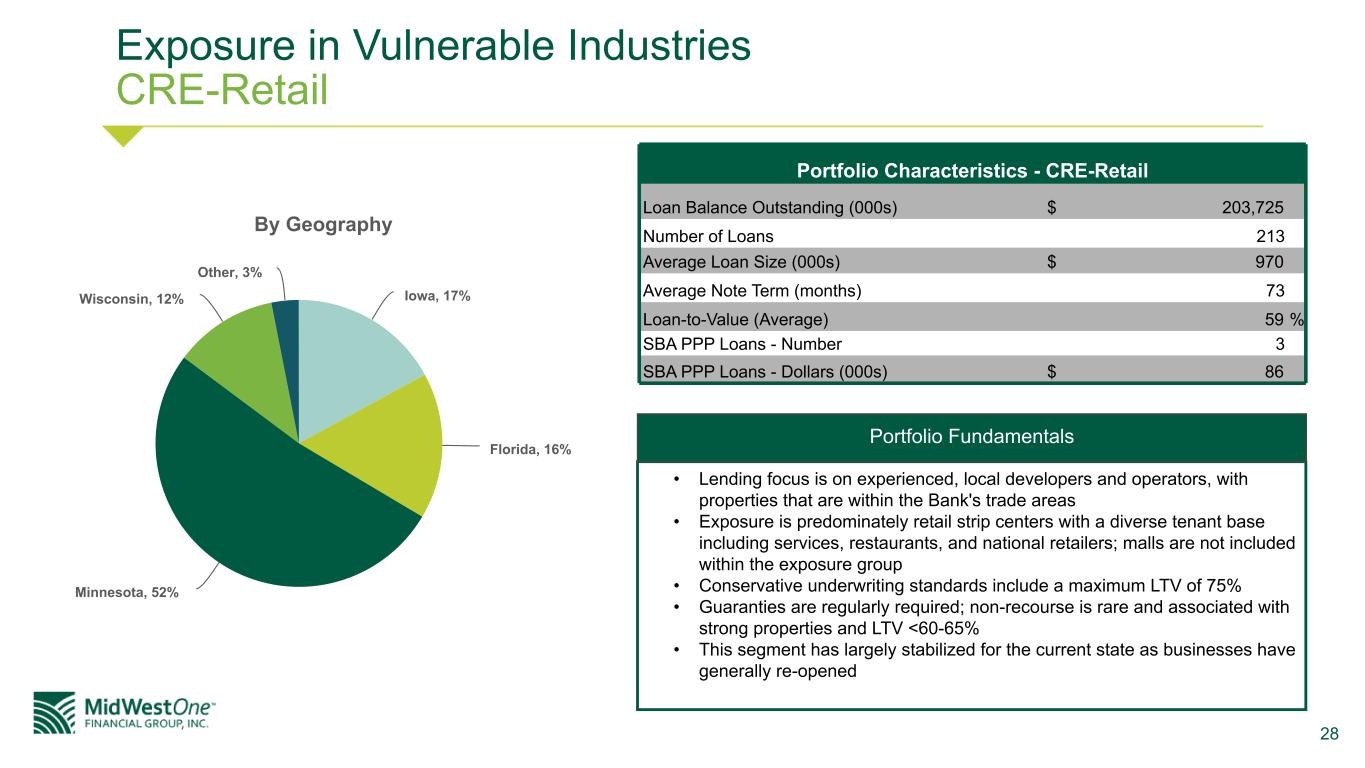
28 Exposure in Vulnerable Industries CRE-Retail By Geography Iowa, 17% Florida, 16% Minnesota, 52% Wisconsin, 12% Other, 3% Portfolio Characteristics - CRE-Retail Loan Balance Outstanding (000s) $ 203,725 Number of Loans 213 Average Loan Size (000s) $ 970 Average Note Term (months) 73 Loan-to-Value (Average) 59 % SBA PPP Loans - Number 3 SBA PPP Loans - Dollars (000s) $ 86 • Lending focus is on experienced, local developers and operators, with properties that are within the Bank's trade areas • Exposure is predominately retail strip centers with a diverse tenant base including services, restaurants, and national retailers; malls are not included within the exposure group • Conservative underwriting standards include a maximum LTV of 75% • Guaranties are regularly required; non-recourse is rare and associated with strong properties and LTV <60-65% • This segment has largely stabilized for the current state as businesses have generally re-opened Portfolio Fundamentals
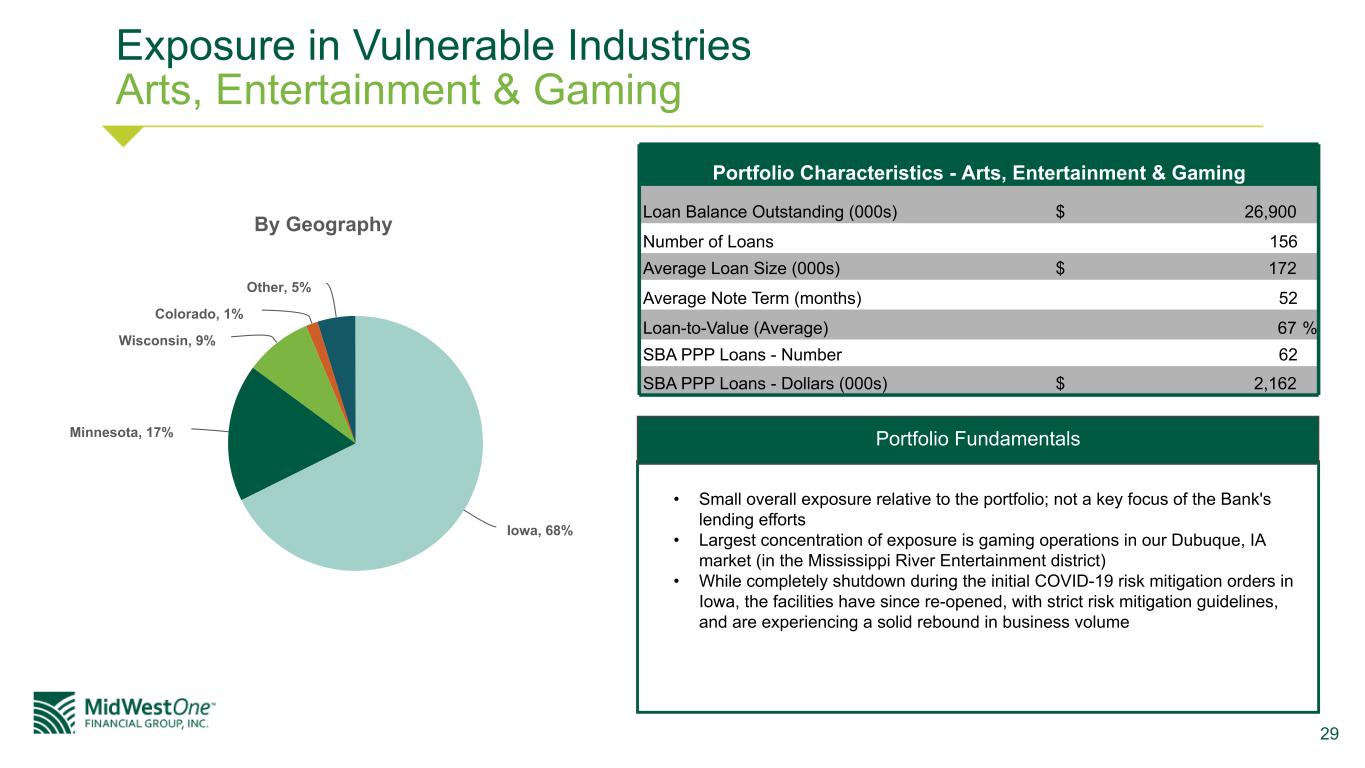
29 Exposure in Vulnerable Industries Arts, Entertainment & Gaming By Geography Iowa, 68% Minnesota, 17% Wisconsin, 9% Colorado, 1% Other, 5% Portfolio Characteristics - Arts, Entertainment & Gaming Loan Balance Outstanding (000s) $ 26,900 Number of Loans 156 Average Loan Size (000s) $ 172 Average Note Term (months) 52 Loan-to-Value (Average) 67 % SBA PPP Loans - Number 62 SBA PPP Loans - Dollars (000s) $ 2,162 • Small overall exposure relative to the portfolio; not a key focus of the Bank's lending efforts • Largest concentration of exposure is gaming operations in our Dubuque, IA market (in the Mississippi River Entertainment district) • While completely shutdown during the initial COVID-19 risk mitigation orders in Iowa, the facilities have since re-opened, with strict risk mitigation guidelines, and are experiencing a solid rebound in business volume Portfolio Fundamentals
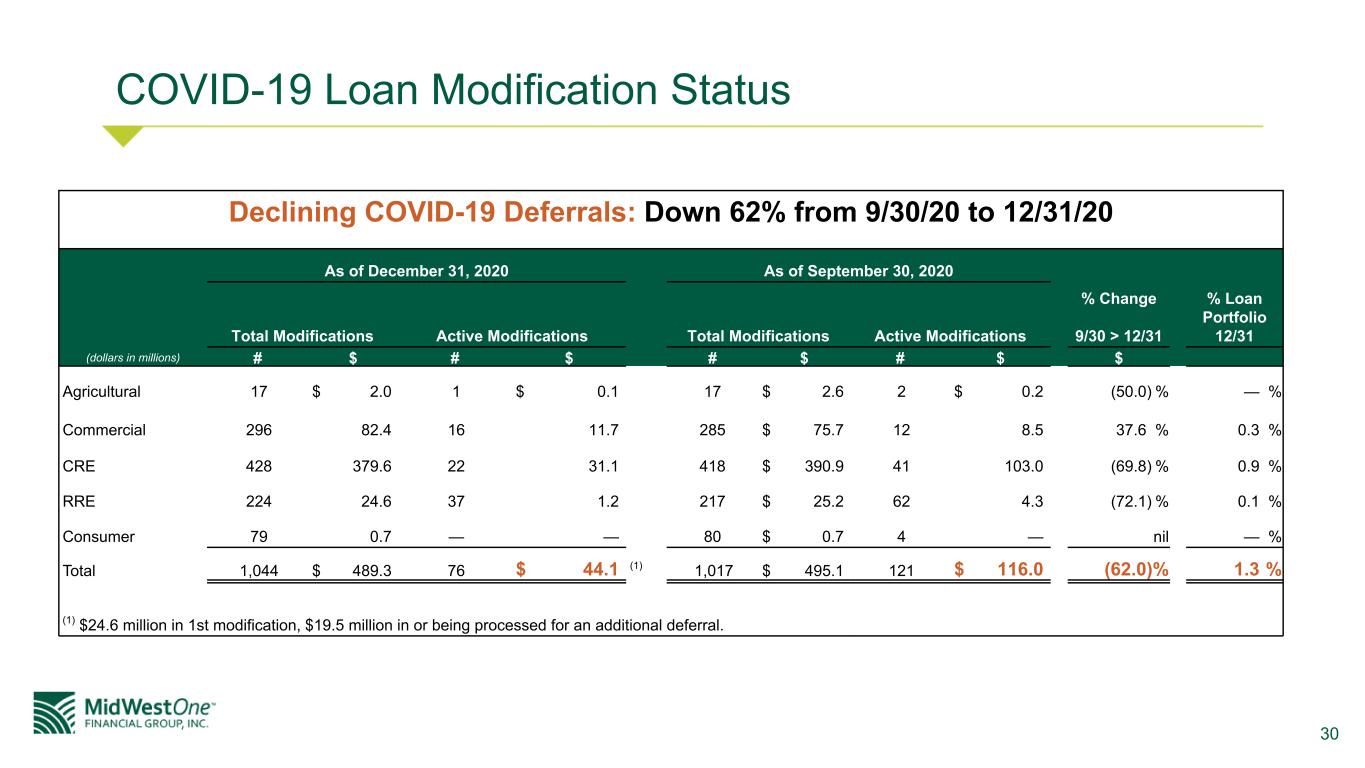
30 COVID-19 Loan Modification Status (dollars in millions) As of December 31, 2020 As of September 30, 2020 % Change 9/30 > 12/31 % Loan Portfolio 12/31Total Modifications Active Modifications Total Modifications Active Modifications # $ # $ # $ # $ $ Agricultural 17 $ 2.0 1 $ 0.1 17 $ 2.6 2 $ 0.2 (50.0) % — % Commercial 296 82.4 16 11.7 285 $ 75.7 12 8.5 37.6 % 0.3 % CRE 428 379.6 22 31.1 418 $ 390.9 41 103.0 (69.8) % 0.9 % RRE 224 24.6 37 1.2 217 $ 25.2 62 4.3 (72.1) % 0.1 % Consumer 79 0.7 — — 80 $ 0.7 4 — nil — % Total 1,044 $ 489.3 76 $ 44.1 (1) 1,017 $ 495.1 121 $ 116.0 (62.0) % 1.3 % (1) $24.6 million in 1st modification, $19.5 million in or being processed for an additional deferral. Declining COVID-19 Deferrals: Down 62% from 9/30/20 to 12/31/20
31 Financial Performance
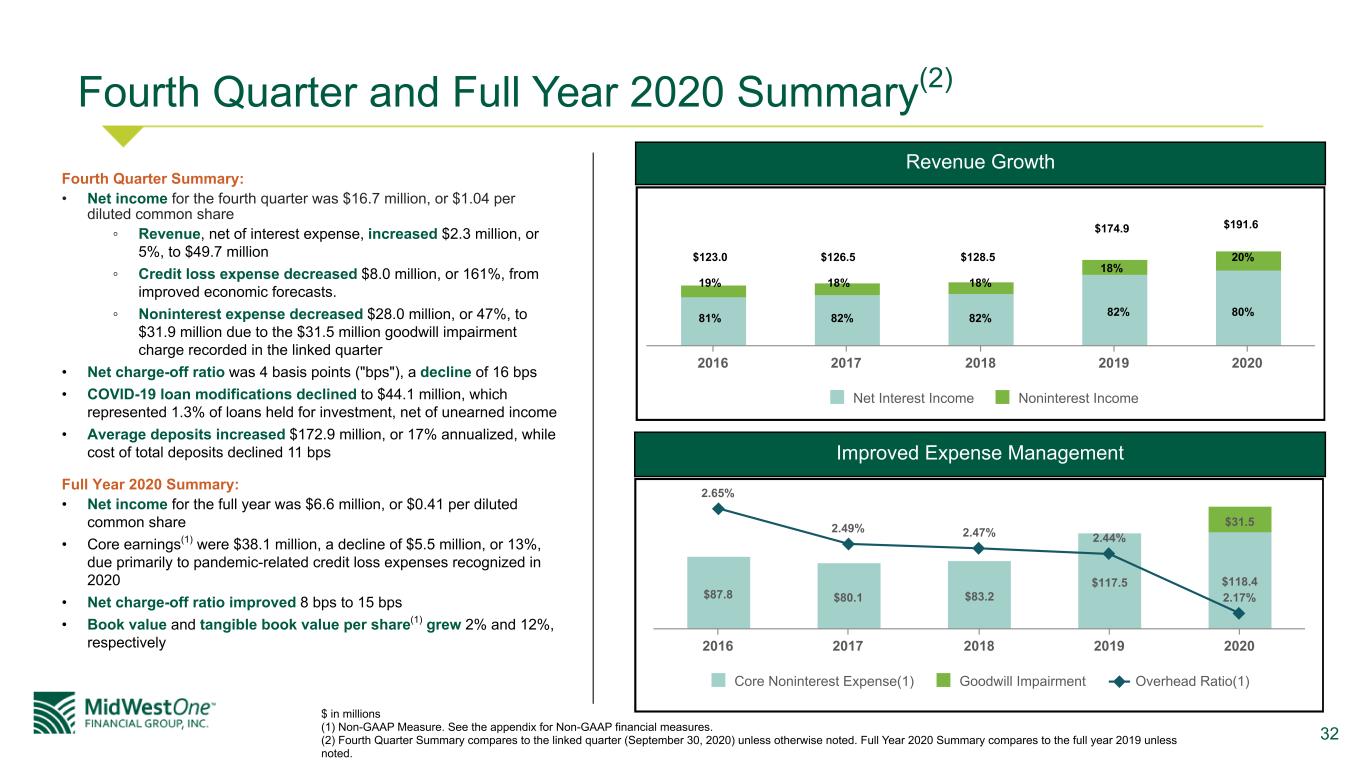
32 Fourth Quarter and Full Year 2020 Summary(2) Fourth Quarter Summary: • Net income for the fourth quarter was $16.7 million, or $1.04 per diluted common share ◦ Revenue, net of interest expense, increased $2.3 million, or 5%, to $49.7 million ◦ Credit loss expense decreased $8.0 million, or 161%, from improved economic forecasts. ◦ Noninterest expense decreased $28.0 million, or 47%, to $31.9 million due to the $31.5 million goodwill impairment charge recorded in the linked quarter • Net charge-off ratio was 4 basis points ("bps"), a decline of 16 bps • COVID-19 loan modifications declined to $44.1 million, which represented 1.3% of loans held for investment, net of unearned income • Average deposits increased $172.9 million, or 17% annualized, while cost of total deposits declined 11 bps Full Year 2020 Summary: • Net income for the full year was $6.6 million, or $0.41 per diluted common share • Core earnings(1) were $38.1 million, a decline of $5.5 million, or 13%, due primarily to pandemic-related credit loss expenses recognized in 2020 • Net charge-off ratio improved 8 bps to 15 bps • Book value and tangible book value per share(1) grew 2% and 12%, respectively $ in millions (1) Non-GAAP Measure. See the appendix for Non-GAAP financial measures. (2) Fourth Quarter Summary compares to the linked quarter (September 30, 2020) unless otherwise noted. Full Year 2020 Summary compares to the full year 2019 unless noted. Improved Expense Management $87.8 $80.1 $83.2 $117.5 $118.4 $31.5 2.65% 2.49% 2.47% 2.44% 2.17% Core Noninterest Expense(1) Goodwill Impairment Overhead Ratio(1) 2016 2017 2018 2019 2020 Revenue Growth Net Interest Income Noninterest Income 2016 2017 2018 2019 2020 $123.0 $126.5 $128.5 $174.9 $191.6 81% 82% 82% 82% 80% 19% 18% 18% 18% 20%
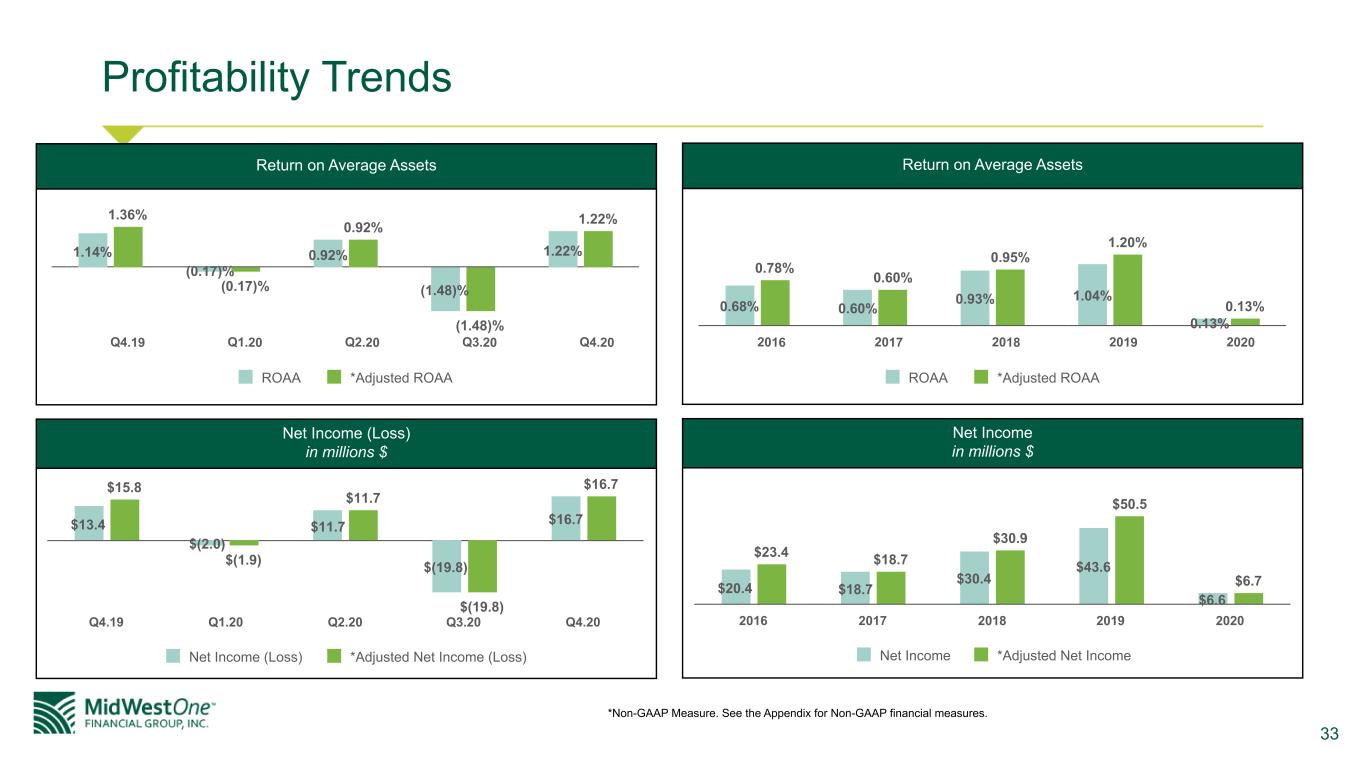
33 Profitability Trends *Non-GAAP Measure. See the Appendix for Non-GAAP financial measures. 1.14% (0.17)% 0.92% (1.48)% 1.22% 1.36% (0.17)% 0.92% (1.48)% 1.22% ROAA *Adjusted ROAA Q4.19 Q1.20 Q2.20 Q3.20 Q4.20 $13.4 $(2.0) $11.7 $(19.8) $16.7 $15.8 $(1.9) $11.7 $(19.8) $16.7 Net Income (Loss) *Adjusted Net Income (Loss) Q4.19 Q1.20 Q2.20 Q3.20 Q4.20 Return on Average Assets Net Income (Loss) in millions $ 0.68% 0.60% 0.93% 1.04% 0.13% 0.78% 0.60% 0.95% 1.20% 0.13% ROAA *Adjusted ROAA 2016 2017 2018 2019 2020 $20.4 $18.7 $30.4 $43.6 $6.6 $23.4 $18.7 $30.9 $50.5 $6.7 Net Income *Adjusted Net Income 2016 2017 2018 2019 2020 Return on Average Assets Net Income in millions $
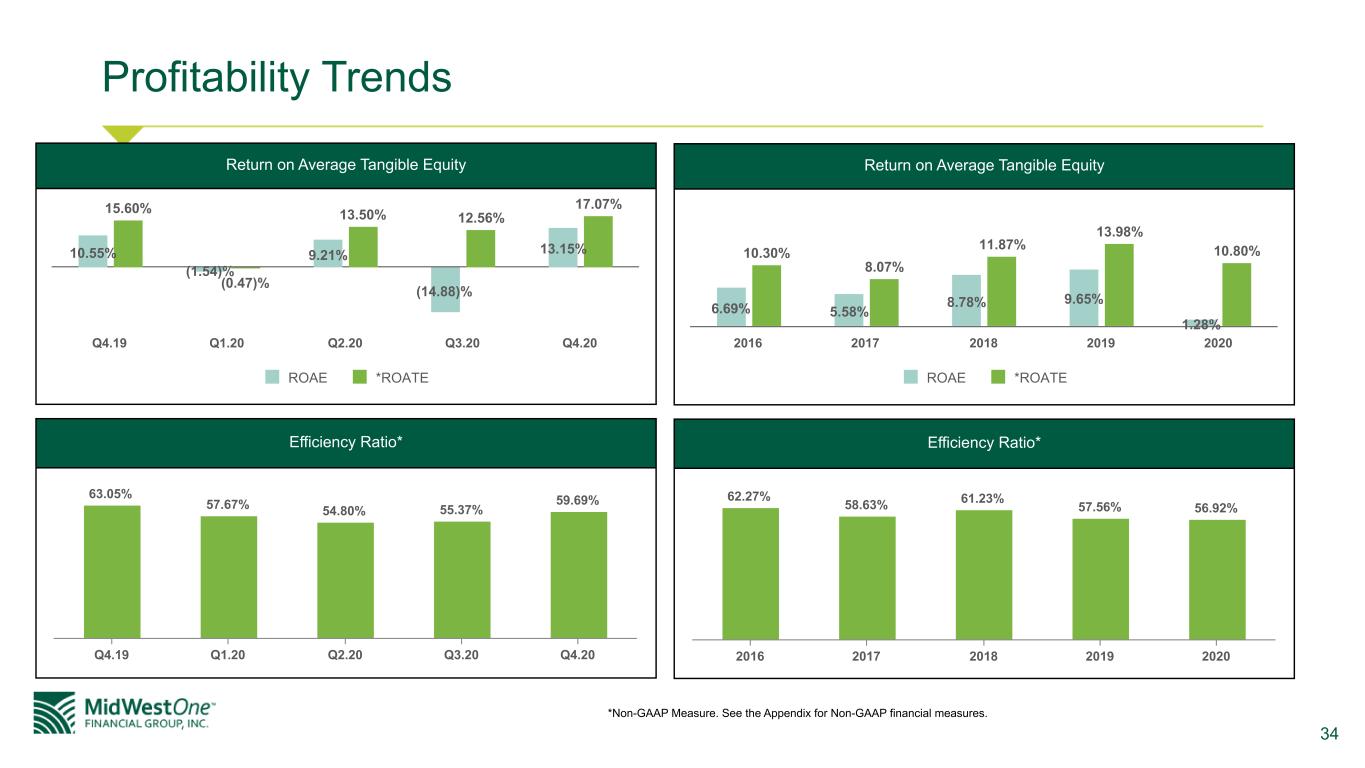
34 Profitability Trends *Non-GAAP Measure. See the Appendix for Non-GAAP financial measures. 62.27% 58.63% 61.23% 57.56% 56.92% 2016 2017 2018 2019 2020 6.69% 5.58% 8.78% 9.65% 1.28% 10.30% 8.07% 11.87% 13.98% 10.80% ROAE *ROATE 2016 2017 2018 2019 2020 Return on Average Tangible Equity Efficiency Ratio* 63.05% 57.67% 54.80% 55.37% 59.69% Q4.19 Q1.20 Q2.20 Q3.20 Q4.20 10.55% (1.54)% 9.21% (14.88)% 13.15% 15.60% (0.47)% 13.50% 12.56% 17.07% ROAE *ROATE Q4.19 Q1.20 Q2.20 Q3.20 Q4.20 Return on Average Tangible Equity Efficiency Ratio*
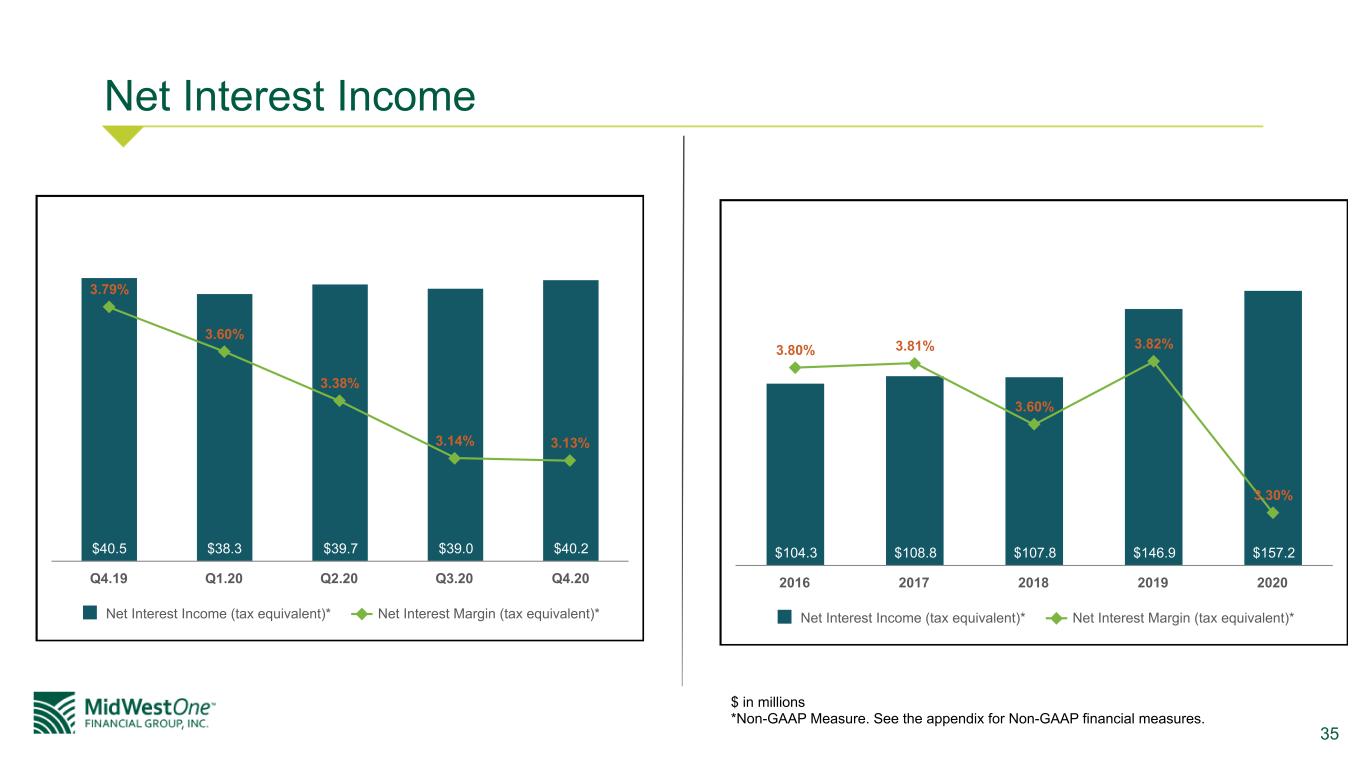
35 Net Interest Income $40.5 $38.3 $39.7 $39.0 $40.2 3.79% 3.60% 3.38% 3.14% 3.13% Net Interest Income (tax equivalent)* Net Interest Margin (tax equivalent)* Q4.19 Q1.20 Q2.20 Q3.20 Q4.20 $ in millions *Non-GAAP Measure. See the appendix for Non-GAAP financial measures. $104.3 $108.8 $107.8 $146.9 $157.2 3.80% 3.81% 3.60% 3.82% 3.30% Net Interest Income (tax equivalent)* Net Interest Margin (tax equivalent)* 2016 2017 2018 2019 2020
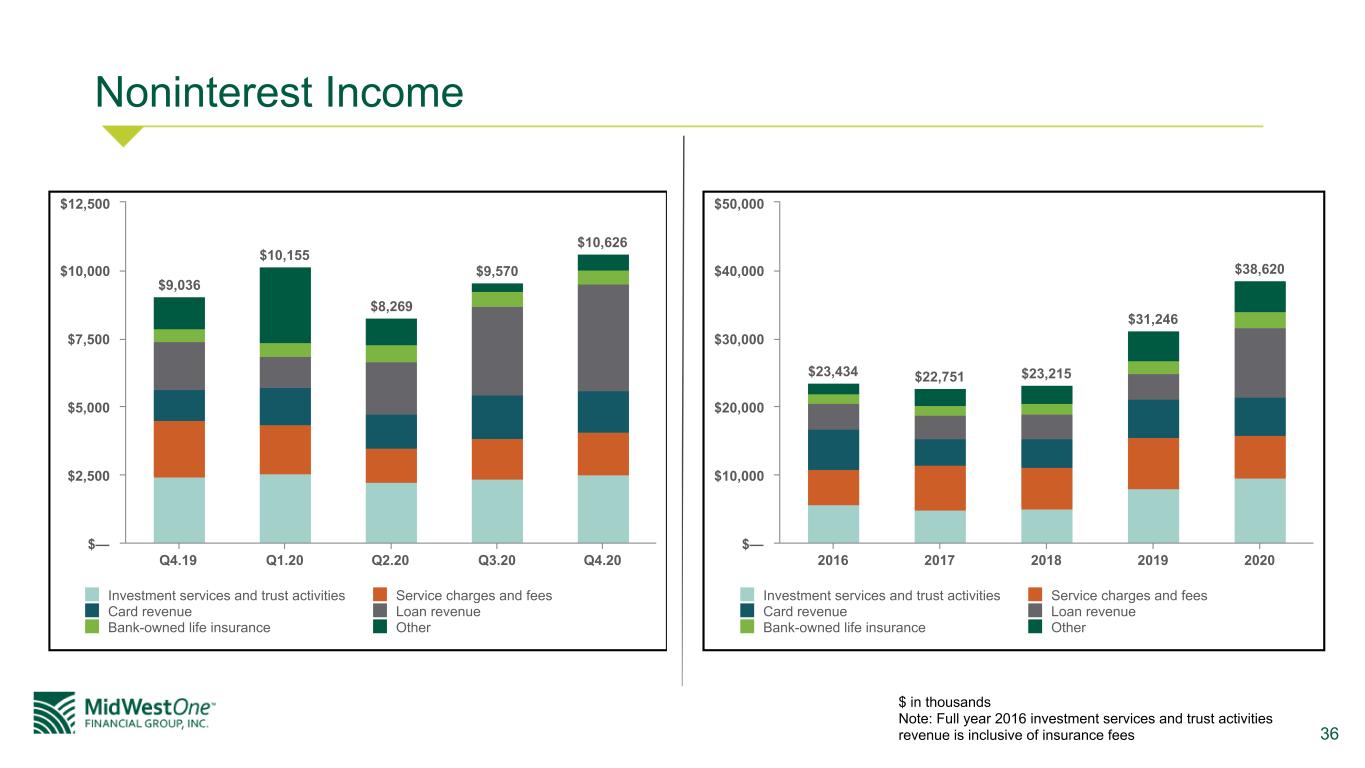
36 Noninterest Income $9,036 $10,155 $8,269 $9,570 $10,626 Investment services and trust activities Service charges and fees Card revenue Loan revenue Bank-owned life insurance Other Q4.19 Q1.20 Q2.20 Q3.20 Q4.20 $— $2,500 $5,000 $7,500 $10,000 $12,500 $ in thousands Note: Full year 2016 investment services and trust activities revenue is inclusive of insurance fees $23,434 $22,751 $23,215 $31,246 $38,620 Investment services and trust activities Service charges and fees Card revenue Loan revenue Bank-owned life insurance Other 2016 2017 2018 2019 2020 $— $10,000 $20,000 $30,000 $40,000 $50,000
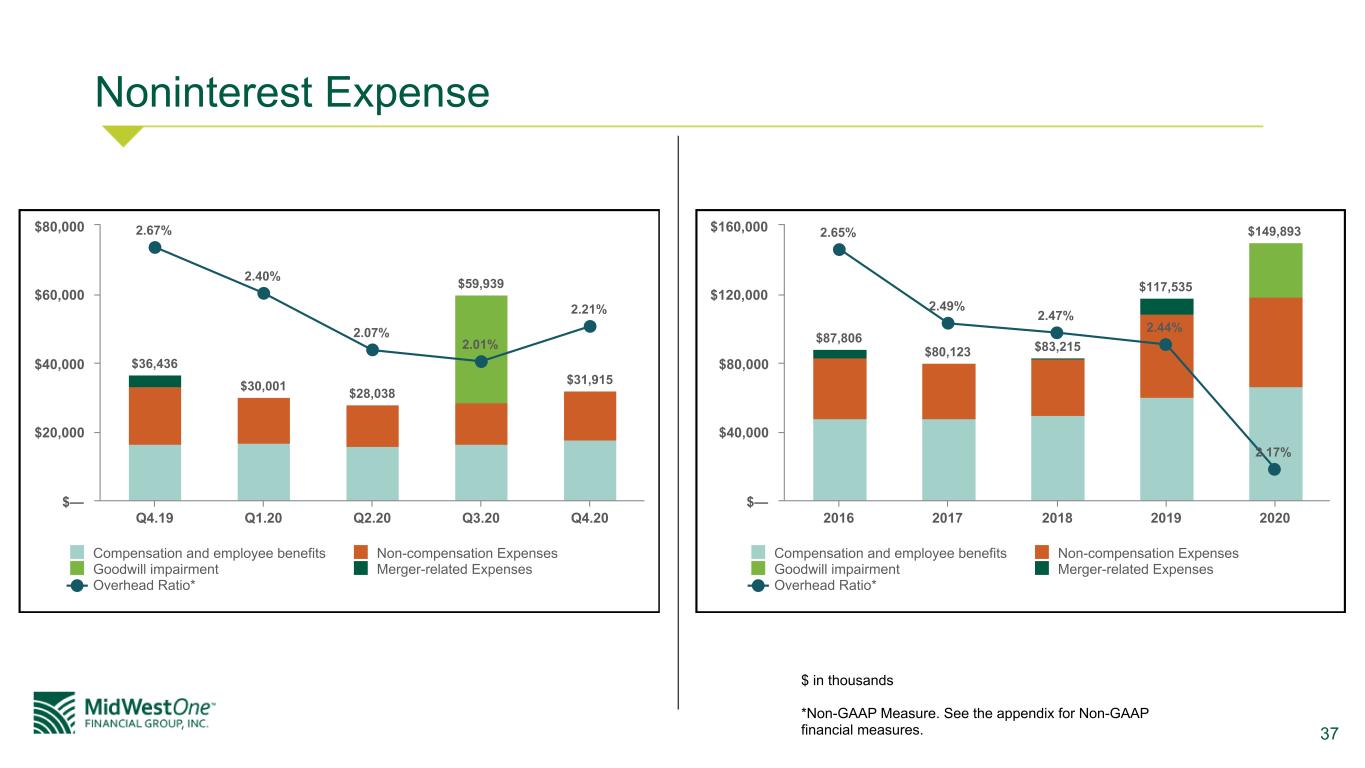
37 Noninterest Expense $ in thousands *Non-GAAP Measure. See the appendix for Non-GAAP financial measures. $36,436 $30,001 $28,038 $59,939 $31,915 2.67% 2.40% 2.07% 2.01% 2.21% Compensation and employee benefits Non-compensation Expenses Goodwill impairment Merger-related Expenses Overhead Ratio* Q4.19 Q1.20 Q2.20 Q3.20 Q4.20 $— $20,000 $40,000 $60,000 $80,000 $87,806 $80,123 $83,215 $117,535 $149,8932.65% 2.49% 2.47% 2.44% 2.17% Compensation and employee benefits Non-compensation Expenses Goodwill impairment Merger-related Expenses Overhead Ratio* 2016 2017 2018 2019 2020 $— $40,000 $80,000 $120,000 $160,000
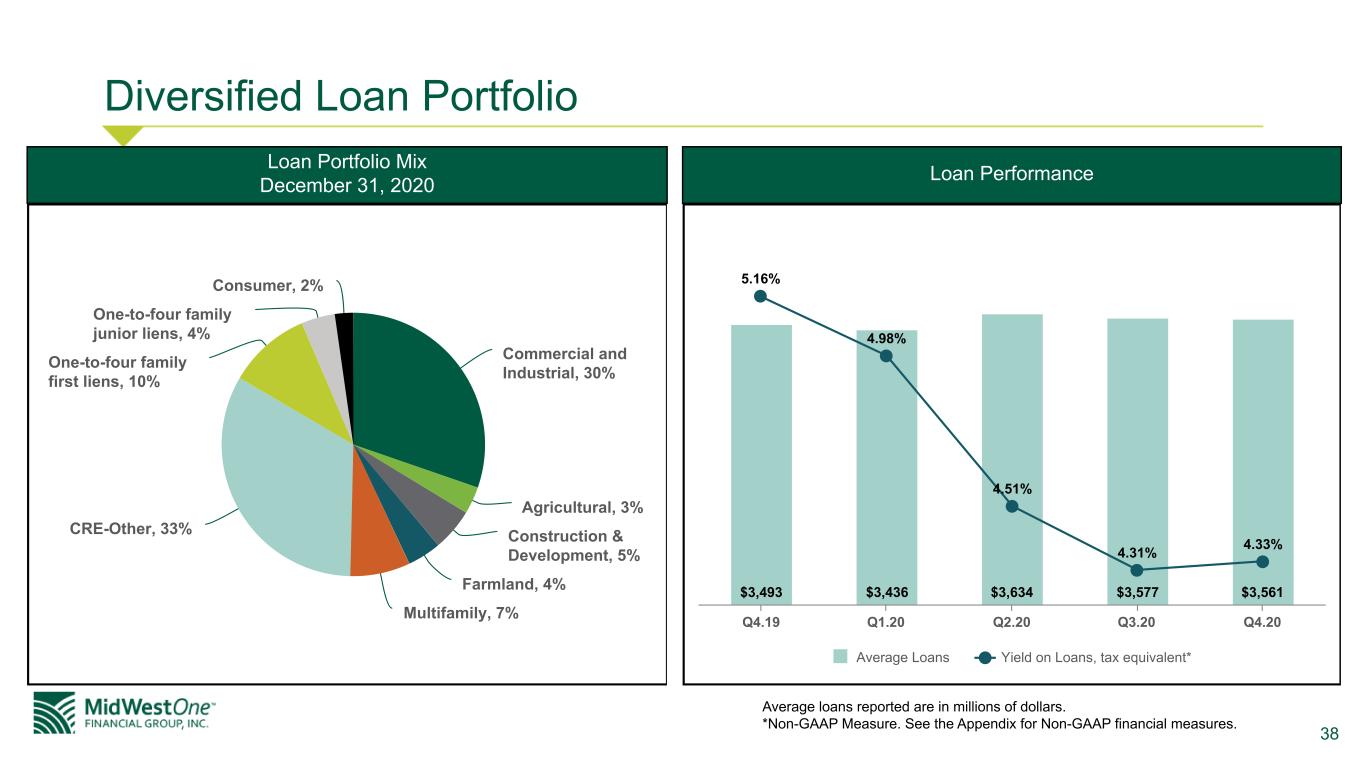
38 Diversified Loan Portfolio Commercial and Industrial, 30% Agricultural, 3% Construction & Development, 5% Farmland, 4% Multifamily, 7% CRE-Other, 33% One-to-four family first liens, 10% One-to-four family junior liens, 4% Consumer, 2% $3,493 $3,436 $3,634 $3,577 $3,561 5.16% 4.98% 4.51% 4.31% 4.33% Average Loans Yield on Loans, tax equivalent* Q4.19 Q1.20 Q2.20 Q3.20 Q4.20 Average loans reported are in millions of dollars. *Non-GAAP Measure. See the Appendix for Non-GAAP financial measures. Loan Performance Loan Portfolio Mix December 31, 2020
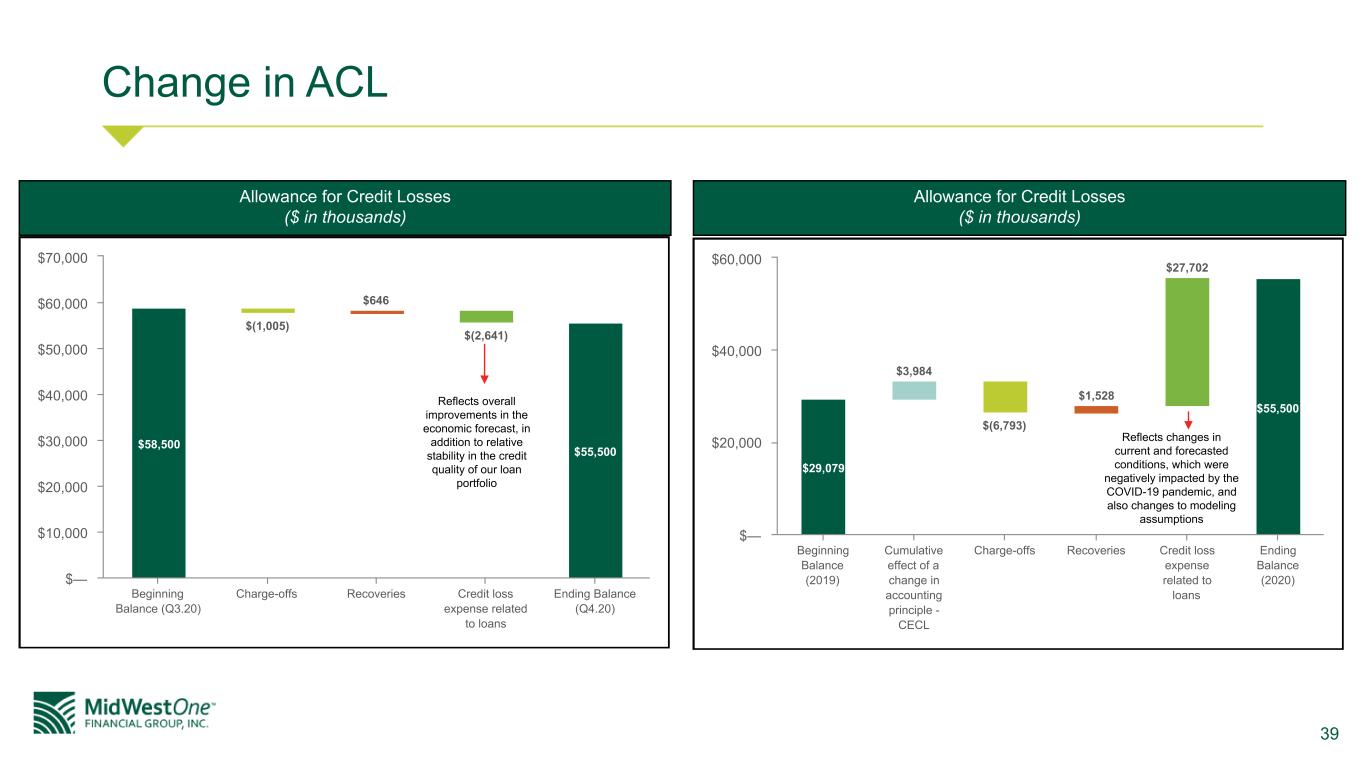
39 Change in ACL $58,500 $(1,005) $646 $(2,641) $55,500 Beginning Balance (Q3.20) Charge-offs Recoveries Credit loss expense related to loans Ending Balance (Q4.20) $— $10,000 $20,000 $30,000 $40,000 $50,000 $60,000 $70,000 Allowance for Credit Losses ($ in thousands) Reflects overall improvements in the economic forecast, in addition to relative stability in the credit quality of our loan portfolio $29,079 $3,984 $(6,793) $1,528 $27,702 $55,500 Beginning Balance (2019) Cumulative effect of a change in accounting principle - CECL Charge-offs Recoveries Credit loss expense related to loans Ending Balance (2020) $— $20,000 $40,000 $60,000 Allowance for Credit Losses ($ in thousands) Reflects changes in current and forecasted conditions, which were negatively impacted by the COVID-19 pandemic, and also changes to modeling assumptions
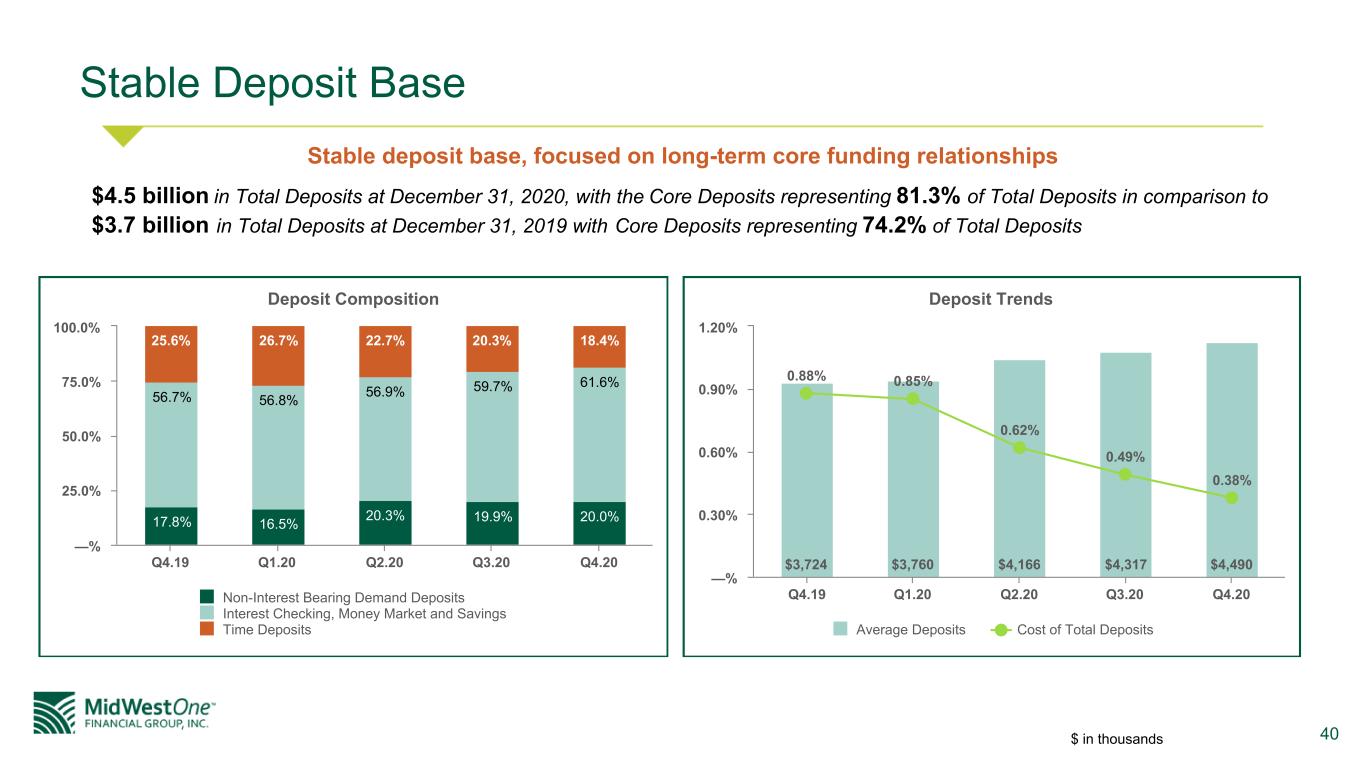
40 Stable Deposit Base $4.5 billion in Total Deposits at December 31, 2020, with the Core Deposits representing 81.3% of Total Deposits in comparison to $3.7 billion in Total Deposits at December 31, 2019 with Core Deposits representing 74.2% of Total Deposits Stable deposit base, focused on long-term core funding relationships Deposit Composition 17.8% 16.5% 20.3% 19.9% 20.0% 56.7% 56.8% 56.9% 59.7% 61.6% 25.6% 26.7% 22.7% 20.3% 18.4% Non-Interest Bearing Demand Deposits Interest Checking, Money Market and Savings Time Deposits Q4.19 Q1.20 Q2.20 Q3.20 Q4.20 —% 25.0% 50.0% 75.0% 100.0% Deposit Trends $3,724 $3,760 $4,166 $4,317 $4,490 0.88% 0.85% 0.62% 0.49% 0.38% Average Deposits Cost of Total Deposits Q4.19 Q1.20 Q2.20 Q3.20 Q4.20 —% 0.30% 0.60% 0.90% 1.20% $ in thousands
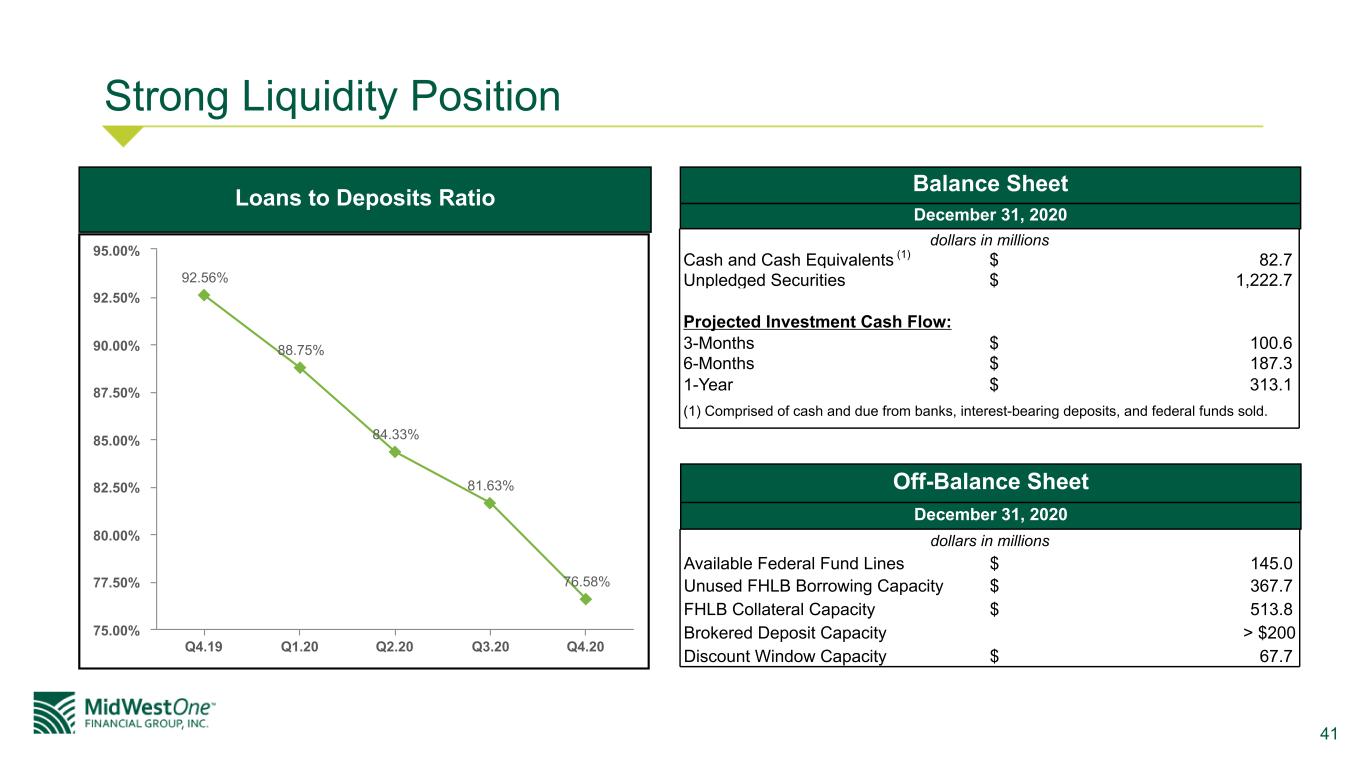
41 Strong Liquidity Position 92.56% 88.75% 84.33% 81.63% 76.58% Q4.19 Q1.20 Q2.20 Q3.20 Q4.20 75.00% 77.50% 80.00% 82.50% 85.00% 87.50% 90.00% 92.50% 95.00% Loans to Deposits Ratio Balance Sheet dollars in millions Cash and Cash Equivalents (1) $ 82.7 Unpledged Securities $ 1,222.7 Projected Investment Cash Flow: 3-Months $ 100.6 6-Months $ 187.3 1-Year $ 313.1 (1) Comprised of cash and due from banks, interest-bearing deposits, and federal funds sold. Off-Balance Sheet dollars in millions Available Federal Fund Lines $ 145.0 Unused FHLB Borrowing Capacity $ 367.7 FHLB Collateral Capacity $ 513.8 Brokered Deposit Capacity > $200 Discount Window Capacity $ 67.7 December 31, 2020 December 31, 2020
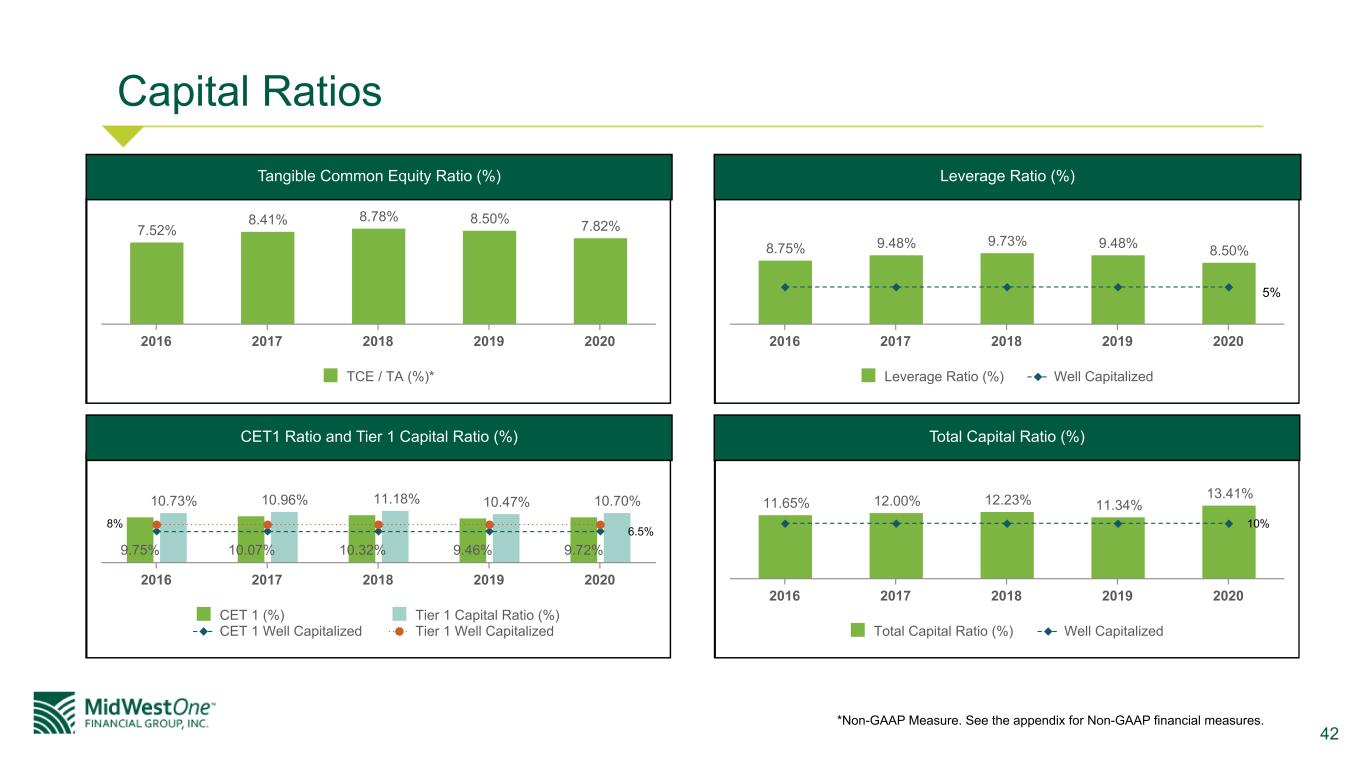
42 Capital Ratios 7.52% 8.41% 8.78% 8.50% 7.82% TCE / TA (%)* 2016 2017 2018 2019 2020 8.75% 9.48% 9.73% 9.48% 8.50% Leverage Ratio (%) Well Capitalized 2016 2017 2018 2019 2020 11.65% 12.00% 12.23% 11.34% 13.41% Total Capital Ratio (%) Well Capitalized 2016 2017 2018 2019 2020 9.75% 10.07% 10.32% 9.46% 9.72% 10.73% 10.96% 11.18% 10.47% 10.70% CET 1 (%) Tier 1 Capital Ratio (%) CET 1 Well Capitalized Tier 1 Well Capitalized 2016 2017 2018 2019 2020 *Non-GAAP Measure. See the appendix for Non-GAAP financial measures. Tangible Common Equity Ratio (%) Leverage Ratio (%) CET1 Ratio and Tier 1 Capital Ratio (%) Total Capital Ratio (%) 5% 6.5% 8% 10%
43 Appendix
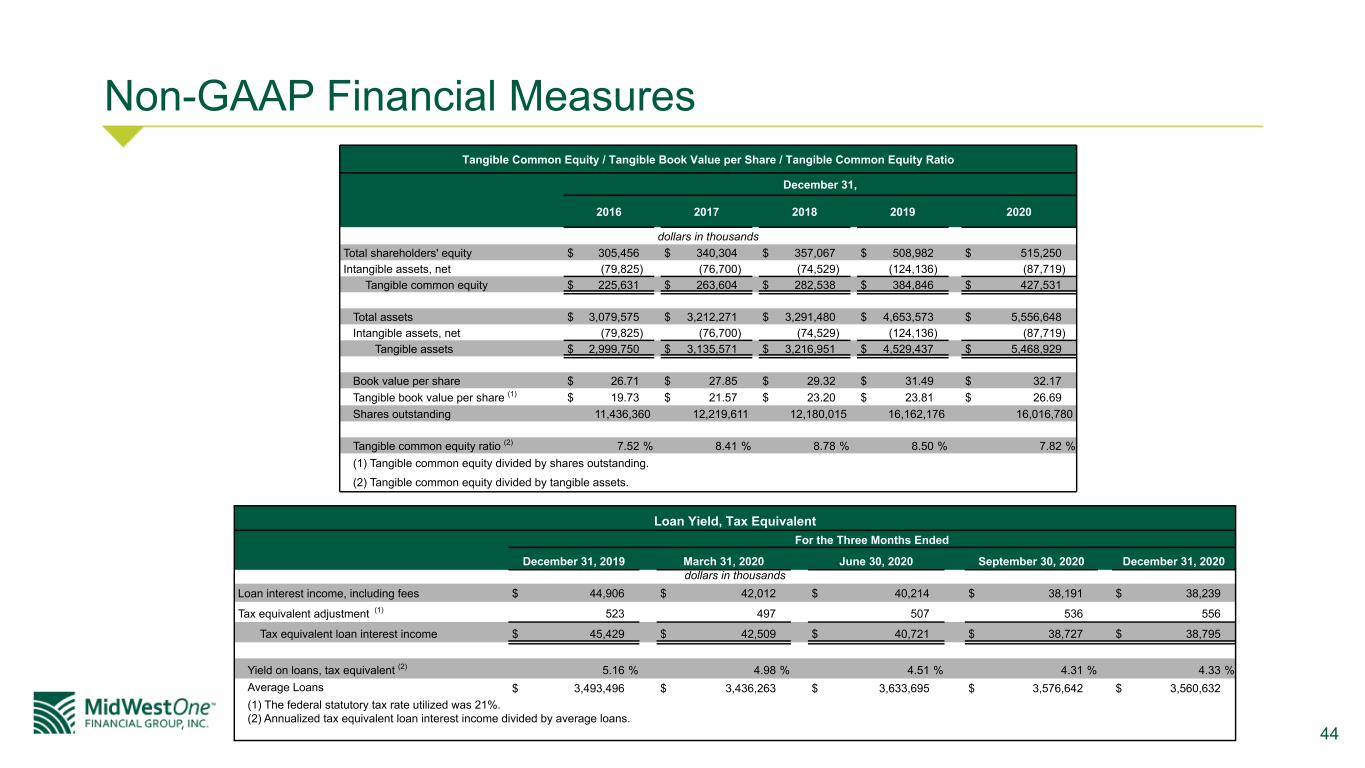
44 Non-GAAP Financial Measures Tangible Common Equity / Tangible Book Value per Share / Tangible Common Equity Ratio December 31, 2016 2017 2018 2019 2020 dollars in thousands Total shareholders' equity $ 305,456 $ 340,304 $ 357,067 $ 508,982 $ 515,250 Intangible assets, net (79,825) (76,700) (74,529) (124,136) (87,719) Tangible common equity $ 225,631 $ 263,604 $ 282,538 $ 384,846 $ 427,531 Total assets $ 3,079,575 $ 3,212,271 $ 3,291,480 $ 4,653,573 $ 5,556,648 Intangible assets, net (79,825) (76,700) (74,529) (124,136) (87,719) Tangible assets $ 2,999,750 $ 3,135,571 $ 3,216,951 $ 4,529,437 $ 5,468,929 Book value per share $ 26.71 $ 27.85 $ 29.32 $ 31.49 $ 32.17 Tangible book value per share (1) $ 19.73 $ 21.57 $ 23.20 $ 23.81 $ 26.69 Shares outstanding 11,436,360 12,219,611 12,180,015 16,162,176 16,016,780 Tangible common equity ratio (2) 7.52 % 8.41 % 8.78 % 8.50 % 7.82 % (1) Tangible common equity divided by shares outstanding. (2) Tangible common equity divided by tangible assets. Loan Yield, Tax Equivalent For the Three Months Ended December 31, 2019 March 31, 2020 June 30, 2020 September 30, 2020 December 31, 2020 dollars in thousands Loan interest income, including fees $ 44,906 $ 42,012 $ 40,214 $ 38,191 $ 38,239 Tax equivalent adjustment (1) 523 497 507 536 556 Tax equivalent loan interest income $ 45,429 $ 42,509 $ 40,721 $ 38,727 $ 38,795 Yield on loans, tax equivalent (2) 5.16 % 4.98 % 4.51 % 4.31 % 4.33 % Average Loans $ 3,493,496 $ 3,436,263 $ 3,633,695 $ 3,576,642 $ 3,560,632 (1) The federal statutory tax rate utilized was 21%. (2) Annualized tax equivalent loan interest income divided by average loans.
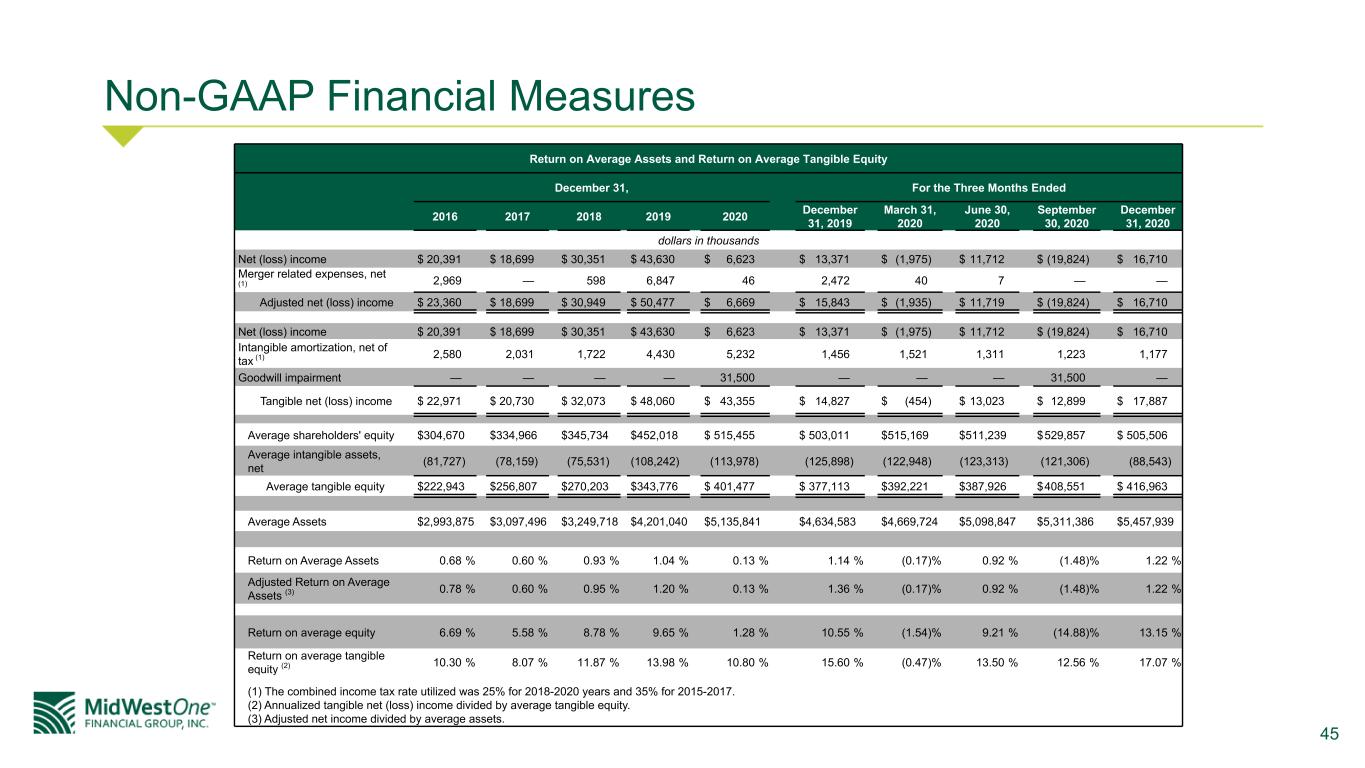
45 Non-GAAP Financial Measures Return on Average Assets and Return on Average Tangible Equity December 31, For the Three Months Ended 2016 2017 2018 2019 2020 December 31, 2019 March 31, 2020 June 30, 2020 September 30, 2020 December 31, 2020 dollars in thousands Net (loss) income $ 20,391 $ 18,699 $ 30,351 $ 43,630 $ 6,623 $ 13,371 $ (1,975) $ 11,712 $ (19,824) $ 16,710 Merger related expenses, net (1) 2,969 — 598 6,847 46 2,472 40 7 — — Adjusted net (loss) income $ 23,360 $ 18,699 $ 30,949 $ 50,477 $ 6,669 $ 15,843 $ (1,935) $ 11,719 $ (19,824) $ 16,710 Net (loss) income $ 20,391 $ 18,699 $ 30,351 $ 43,630 $ 6,623 $ 13,371 $ (1,975) $ 11,712 $ (19,824) $ 16,710 Intangible amortization, net of tax (1) 2,580 2,031 1,722 4,430 5,232 1,456 1,521 1,311 1,223 1,177 Goodwill impairment — — — — 31,500 — — — 31,500 — Tangible net (loss) income $ 22,971 $ 20,730 $ 32,073 $ 48,060 $ 43,355 $ 14,827 $ (454) $ 13,023 $ 12,899 $ 17,887 Average shareholders' equity $ 304,670 $ 334,966 $ 345,734 $ 452,018 $ 515,455 $ 503,011 $ 515,169 $ 511,239 $ 529,857 $ 505,506 Average intangible assets, net (81,727) (78,159) (75,531) (108,242) (113,978) (125,898) (122,948) (123,313) (121,306) (88,543) Average tangible equity $ 222,943 $ 256,807 $ 270,203 $ 343,776 $ 401,477 $ 377,113 $ 392,221 $ 387,926 $ 408,551 $ 416,963 Average Assets $ 2,993,875 $ 3,097,496 $ 3,249,718 $ 4,201,040 $ 5,135,841 $ 4,634,583 $ 4,669,724 $ 5,098,847 $ 5,311,386 $ 5,457,939 Return on Average Assets 0.68 % 0.60 % 0.93 % 1.04 % 0.13 % 1.14 % (0.17) % 0.92 % (1.48) % 1.22 % Adjusted Return on Average Assets (3) 0.78 % 0.60 % 0.95 % 1.20 % 0.13 % 1.36 % (0.17) % 0.92 % (1.48) % 1.22 % Return on average equity 6.69 % 5.58 % 8.78 % 9.65 % 1.28 % 10.55 % (1.54) % 9.21 % (14.88) % 13.15 % Return on average tangible equity (2) 10.30 % 8.07 % 11.87 % 13.98 % 10.80 % 15.60 % (0.47) % 13.50 % 12.56 % 17.07 % (1) The combined income tax rate utilized was 25% for 2018-2020 years and 35% for 2015-2017. (2) Annualized tangible net (loss) income divided by average tangible equity. (3) Adjusted net income divided by average assets.
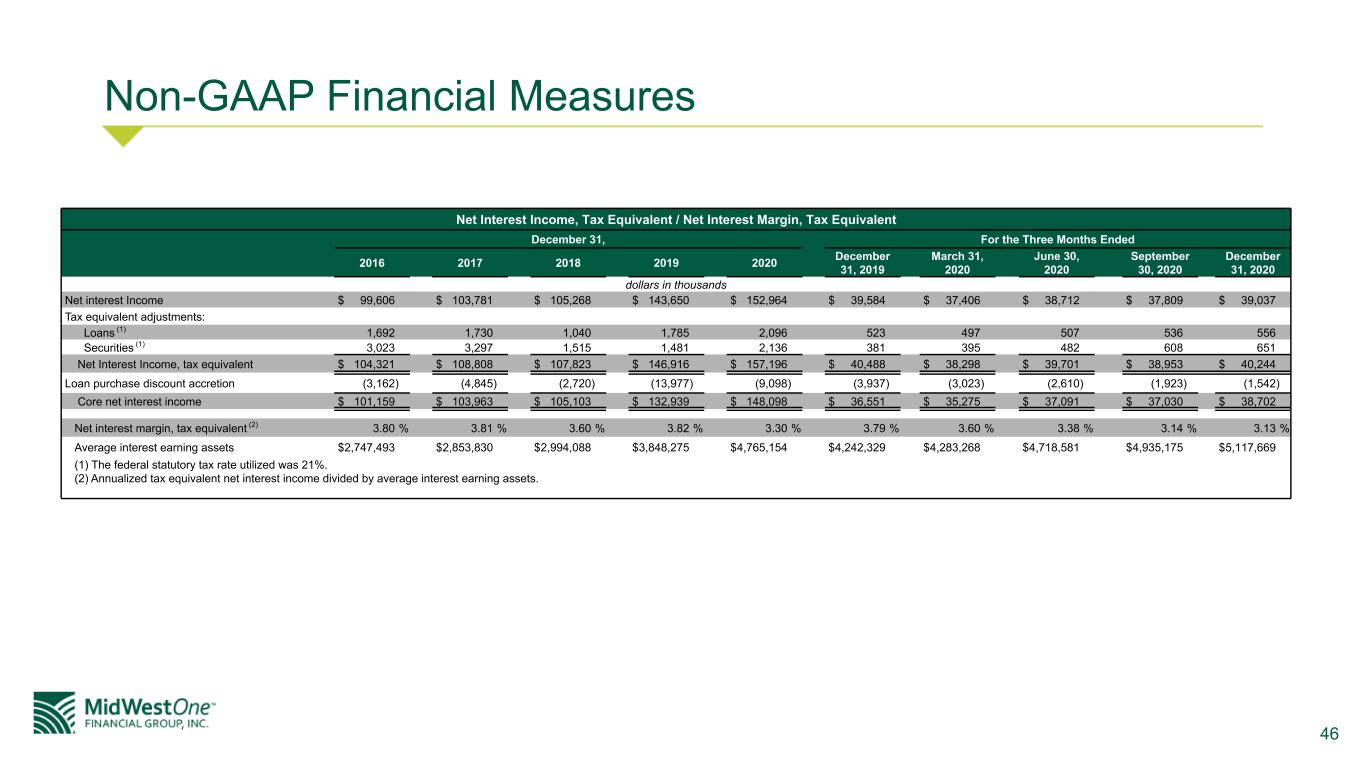
46 Non-GAAP Financial Measures Net Interest Income, Tax Equivalent / Net Interest Margin, Tax Equivalent December 31, For the Three Months Ended 2016 2017 2018 2019 2020 December 31, 2019 March 31, 2020 June 30, 2020 September 30, 2020 December 31, 2020 dollars in thousands Net interest Income $ 99,606 $ 103,781 $ 105,268 $ 143,650 $ 152,964 $ 39,584 $ 37,406 $ 38,712 $ 37,809 $ 39,037 Tax equivalent adjustments: Loans (1) 1,692 1,730 1,040 1,785 2,096 523 497 507 536 556 Securities (1) 3,023 3,297 1,515 1,481 2,136 381 395 482 608 651 Net Interest Income, tax equivalent $ 104,321 $ 108,808 $ 107,823 $ 146,916 $ 157,196 $ 40,488 $ 38,298 $ 39,701 $ 38,953 $ 40,244 Loan purchase discount accretion (3,162) (4,845) (2,720) (13,977) (9,098) (3,937) (3,023) (2,610) (1,923) (1,542) Core net interest income $ 101,159 $ 103,963 $ 105,103 $ 132,939 $ 148,098 $ 36,551 $ 35,275 $ 37,091 $ 37,030 $ 38,702 Net interest margin, tax equivalent (2) 3.80 % 3.81 % 3.60 % 3.82 % 3.30 % 3.79 % 3.60 % 3.38 % 3.14 % 3.13 % Average interest earning assets $ 2,747,493 $ 2,853,830 $ 2,994,088 $ 3,848,275 $ 4,765,154 $ 4,242,329 $ 4,283,268 $ 4,718,581 $ 4,935,175 $ 5,117,669 (1) The federal statutory tax rate utilized was 21%. (2) Annualized tax equivalent net interest income divided by average interest earning assets.
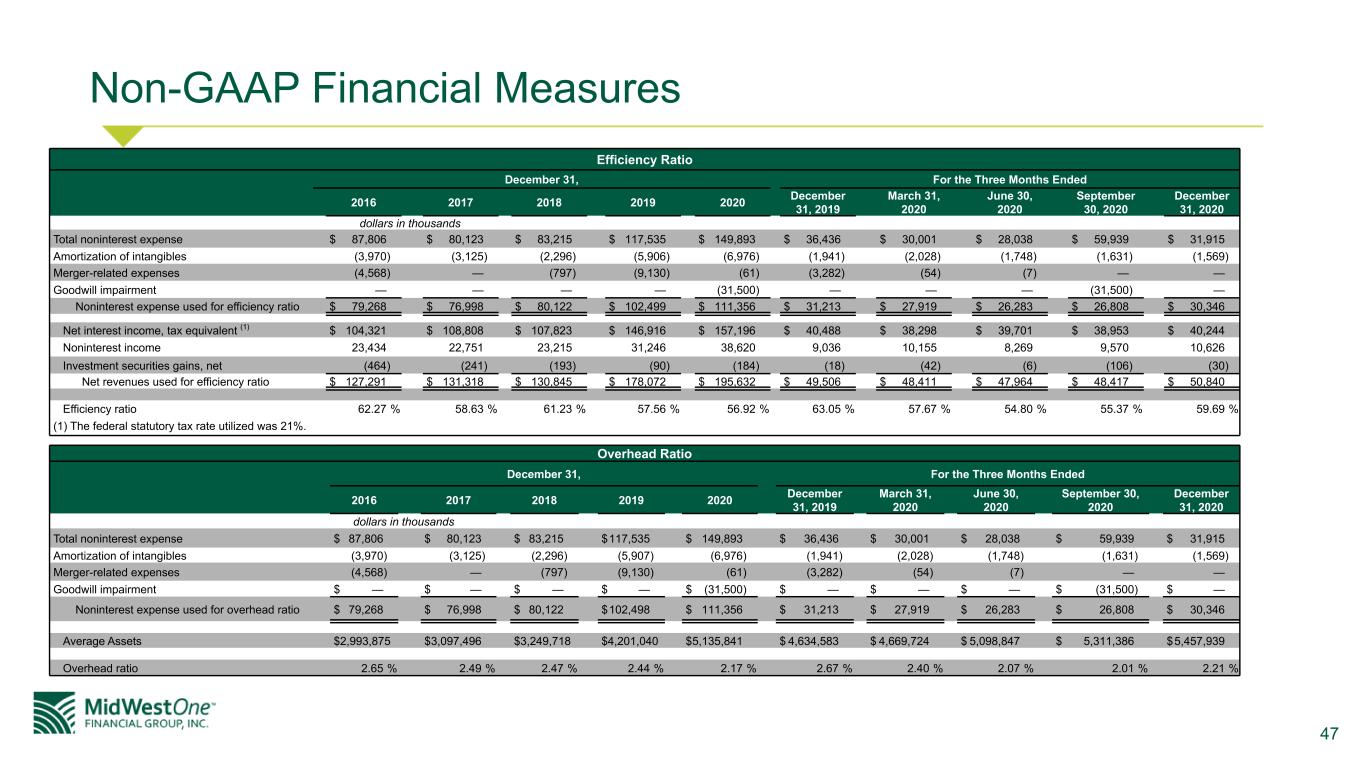
47 Non-GAAP Financial Measures Efficiency Ratio December 31, For the Three Months Ended 2016 2017 2018 2019 2020 December 31, 2019 March 31, 2020 June 30, 2020 September 30, 2020 December 31, 2020 dollars in thousands Total noninterest expense $ 87,806 $ 80,123 $ 83,215 $ 117,535 $ 149,893 $ 36,436 $ 30,001 $ 28,038 $ 59,939 $ 31,915 Amortization of intangibles (3,970) (3,125) (2,296) (5,906) (6,976) (1,941) (2,028) (1,748) (1,631) (1,569) Merger-related expenses (4,568) — (797) (9,130) (61) (3,282) (54) (7) — — Goodwill impairment — — — — (31,500) — — — (31,500) — Noninterest expense used for efficiency ratio $ 79,268 $ 76,998 $ 80,122 $ 102,499 $ 111,356 $ 31,213 $ 27,919 $ 26,283 $ 26,808 $ 30,346 Net interest income, tax equivalent (1) $ 104,321 $ 108,808 $ 107,823 $ 146,916 $ 157,196 $ 40,488 $ 38,298 $ 39,701 $ 38,953 $ 40,244 Noninterest income 23,434 22,751 23,215 31,246 38,620 9,036 10,155 8,269 9,570 10,626 Investment securities gains, net (464) (241) (193) (90) (184) (18) (42) (6) (106) (30) Net revenues used for efficiency ratio $ 127,291 $ 131,318 $ 130,845 $ 178,072 $ 195,632 $ 49,506 $ 48,411 $ 47,964 $ 48,417 $ 50,840 Efficiency ratio 62.27 % 58.63 % 61.23 % 57.56 % 56.92 % 63.05 % 57.67 % 54.80 % 55.37 % 59.69 % (1) The federal statutory tax rate utilized was 21%. Overhead Ratio December 31, For the Three Months Ended 2016 2017 2018 2019 2020 December 31, 2019 March 31, 2020 June 30, 2020 September 30, 2020 December 31, 2020 dollars in thousands Total noninterest expense $ 87,806 $ 80,123 $ 83,215 $ 117,535 $ 149,893 $ 36,436 $ 30,001 $ 28,038 $ 59,939 $ 31,915 Amortization of intangibles (3,970) (3,125) (2,296) (5,907) (6,976) (1,941) (2,028) (1,748) (1,631) (1,569) Merger-related expenses (4,568) — (797) (9,130) (61) (3,282) (54) (7) — — Goodwill impairment $ — $ — $ — $ — $ (31,500) $ — $ — $ — $ (31,500) $ — Noninterest expense used for overhead ratio $ 79,268 $ 76,998 $ 80,122 $ 102,498 $ 111,356 $ 31,213 $ 27,919 $ 26,283 $ 26,808 $ 30,346 Average Assets $ 2,993,875 $ 3,097,496 $ 3,249,718 $ 4,201,040 $ 5,135,841 $ 4,634,583 $ 4,669,724 $ 5,098,847 $ 5,311,386 $ 5,457,939 Overhead ratio 2.65 % 2.49 % 2.47 % 2.44 % 2.17 % 2.67 % 2.40 % 2.07 % 2.01 % 2.21 %
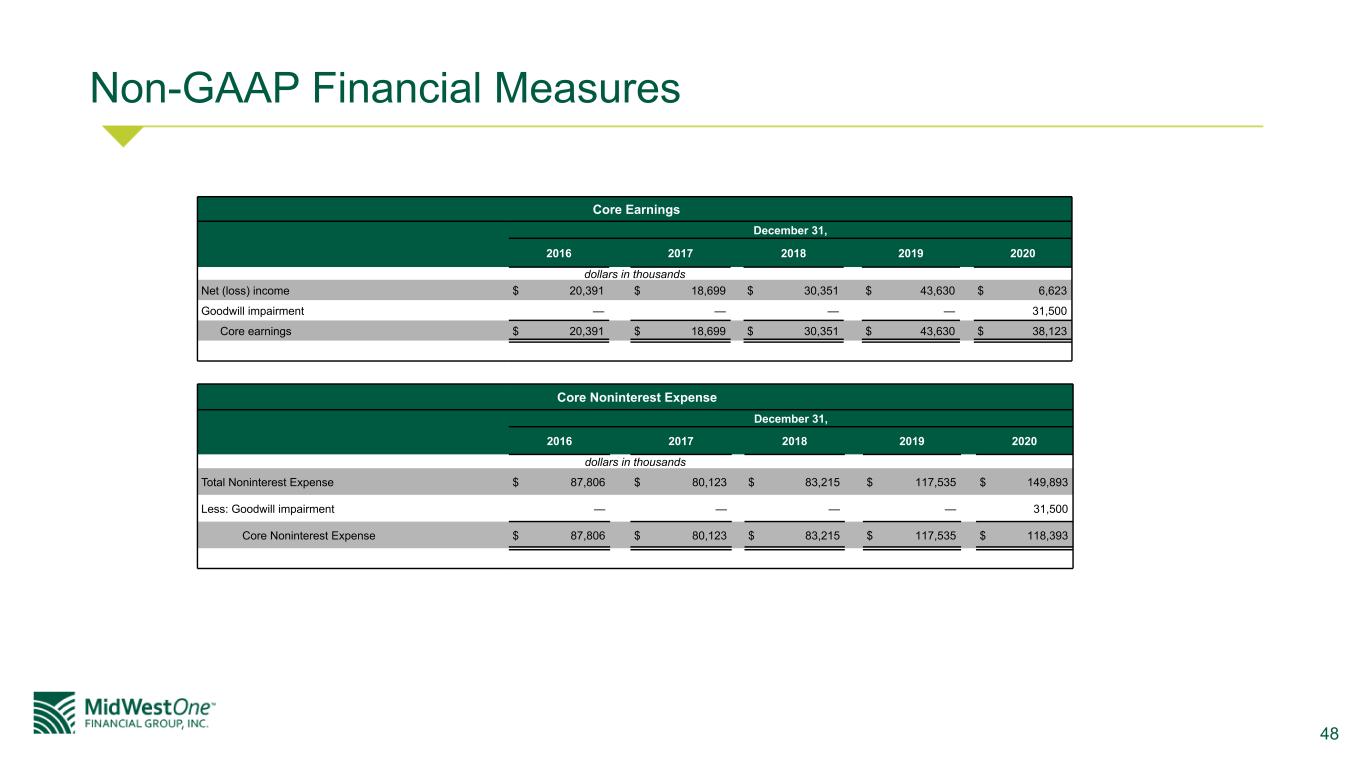
48 Non-GAAP Financial Measures Core Earnings December 31, 2016 2017 2018 2019 2020 dollars in thousands Net (loss) income $ 20,391 $ 18,699 $ 30,351 $ 43,630 $ 6,623 Goodwill impairment — — — — 31,500 Core earnings $ 20,391 $ 18,699 $ 30,351 $ 43,630 $ 38,123 Core Noninterest Expense December 31, 2016 2017 2018 2019 2020 dollars in thousands Total Noninterest Expense $ 87,806 $ 80,123 $ 83,215 $ 117,535 $ 149,893 Less: Goodwill impairment — — — — 31,500 Core Noninterest Expense $ 87,806 $ 80,123 $ 83,215 $ 117,535 $ 118,393
