Attached files
| file | filename |
|---|---|
| 8-K - 8-K - Nielsen Holdings plc | nlsnnv-8k_20210225.htm |
| EX-99.1 - EX-99.1 - Nielsen Holdings plc | nlsnnv-ex991_7.htm |

February 25, 2021 | 8:00 am ET NYSE: NLSN 4th QUARTER 2020 EARNINGS Copyright © 2021 The Nielsen Company (US), LLC. Confidential and proprietary. Do not distribute. EXHIBIT 99.2

This communication includes information that could constitute forward-looking statements made pursuant to the safe harbor provision of the Private Securities Litigation Reform Act of 1995. These statements include those set forth below relating to the proposed sale by Nielsen of our Global Connect business to affiliates of Advent International Corporation (the “proposed transaction”),“2021 Guidance”, those related to the impact of the recent coronavirus (COVID-19) pandemic on our business as well as those that may be identified by words such as “will,” “intend,” “expect,” “anticipate,” “should,” “could” and similar expressions. These statements are subject to risks and uncertainties, and actual results and events could differ materially from what presently is expected. Factors leading thereto may include, without limitation, the risks related to the COVID-19 pandemic on the global economy and financial markets, the uncertainties relating to the impact of the COVID-19 pandemic on Nielsen's business, the timing, receipt and terms and conditions of any required governmental or regulatory approvals of the proposed transaction that could reduce the anticipated benefits of or cause the parties to abandon the proposed transaction, the occurrence of any event, change or other circumstances that could give rise to the termination of the stock purchase agreement entered into pursuant to the proposed transaction (the “Agreement”), the risk that the parties to the Agreement may not be able to satisfy the conditions to the proposed transaction in a timely manner or at all, risks related to the disruption of management time from ongoing business operations due to the proposed transaction, the risk that any announcements relating to the proposed transaction could have adverse effects on the market price of Nielsen’s ordinary shares, the risk of any unexpected costs or expenses resulting from the proposed transaction, the risk of any litigation relating to the proposed transaction, the risk that the proposed transaction and its announcement could have an adverse effect on the ability of Nielsen to retain customers and retain and hire key personnel and maintain relationships with customers, suppliers, employees and other business relationships and on our operating results and business generally, the risk the pending proposed transaction could distract management of Nielsen, the failure of our new business strategy in accomplishing our objectives, conditions in the markets Nielsen is engaged in, behavior of customers, suppliers and competitors, technological developments, as well as legal and regulatory rules affecting Nielsen’s business and other specific risk factors that are outlined in our disclosure filings and materials, which you can find on http://www.nielsen.com/investors, such as our 10-K, 10-Q and 8-K reports that have been filed with the Securities and Exchange Commission. Please consult these documents for a more complete understanding of these risks and uncertainties. This list of factors is not intended to be exhaustive. Such forward-looking statements only speak as of the date of this communication, and we assume no obligation to update any written or oral forward-looking statement made by us or on our behalf as a result of new information, future events or other factors, except as required by law. FORWARD-LOOKING STATEMENTS
The New Nielsen New growth from new solutions New culture driven by growth mindset Compelling financial model Q4 and Full Year 2020 Results 2021 Guidance TODAY’S DISCUSSION
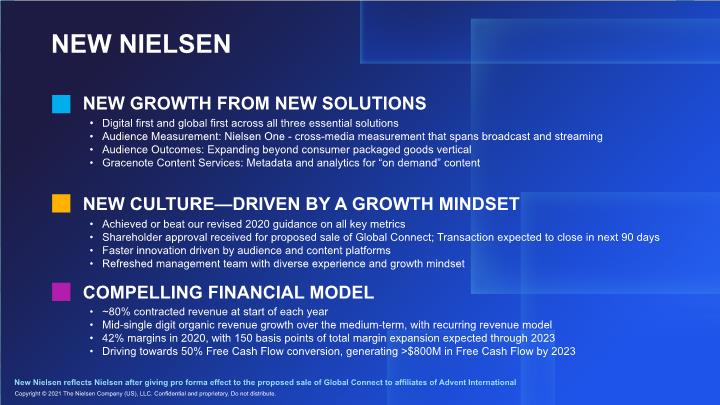
NEW GROWTH FROM NEW SOLUTIONS NEW CULTURE—DRIVEN BY A GROWTH MINDSET Achieved or beat our revised 2020 guidance on all key metrics Shareholder approval received for proposed sale of Global Connect; Transaction expected to close in next 90 days Faster innovation driven by audience and content platforms Refreshed management team with diverse experience and growth mindset COMPELLING FINANCIAL MODEL ~80% contracted revenue at start of each year Mid-single digit organic revenue growth over the medium-term, with recurring revenue model 42% margins in 2020, with 150 basis points of total margin expansion expected through 2023 Driving towards 50% Free Cash Flow conversion, generating >$800M in Free Cash Flow by 2023 NEW NIELSEN Digital first and global first across all three essential solutions Audience Measurement: Nielsen One - cross-media measurement that spans broadcast and streaming Audience Outcomes: Expanding beyond consumer packaged goods vertical Gracenote Content Services: Metadata and analytics for “on demand” content New Nielsen reflects Nielsen after giving pro forma effect to the proposed sale of Global Connect to affiliates of Advent International Copyright © 2021 The Nielsen Company (US), LLC. Confidential and proprietary. Do not distribute.

Q4 AND FULL YEAR 2020 RESULTS Copyright © 2020 The Nielsen Company (US), LLC. Confidential and proprietary. Do not distribute.
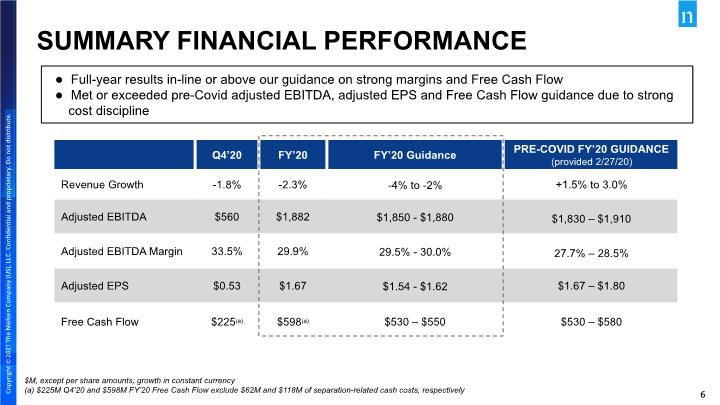
Full-year results in-line or above our guidance on strong margins and Free Cash Flow Met or exceeded pre-Covid adjusted EBITDA, adjusted EPS and Free Cash Flow guidance due to strong cost discipline SUMMARY FINANCIAL PERFORMANCE $M, except per share amounts; growth in constant currency (a) $225M Q4’20 and $598M FY’20 Free Cash Flow exclude $62M and $118M of separation-related cash costs, respectively
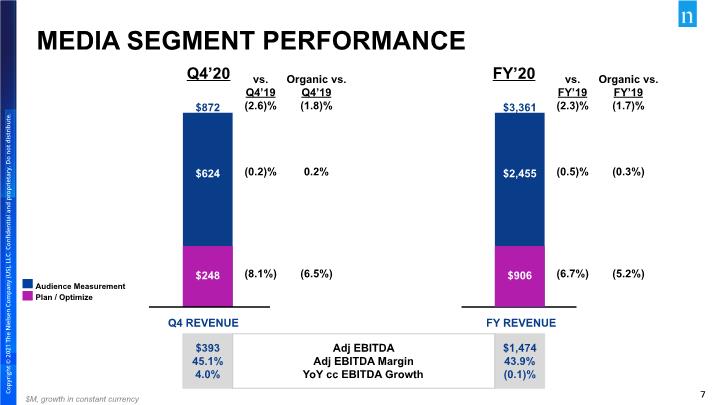
$3,361 Q4 REVENUE $872 $624 $248 FY REVENUE $393 45.1% 4.0% $1,474 43.9% (0.1)% MEDIA SEGMENT PERFORMANCE $2,455 $906 Adj EBITDA Adj EBITDA Margin YoY cc EBITDA Growth Q4’20 FY’20 vs. Q4’19 (2.6)% (0.2)% (8.1%) Organic vs. Q4’19 (1.8)% 0.2% (6.5%) vs. FY’19 (2.3)% (0.5)% (6.7%) Organic vs. FY’19 (1.7)% (0.3%) (5.2%) $M, growth in constant currency Audience Measurement Plan / Optimize
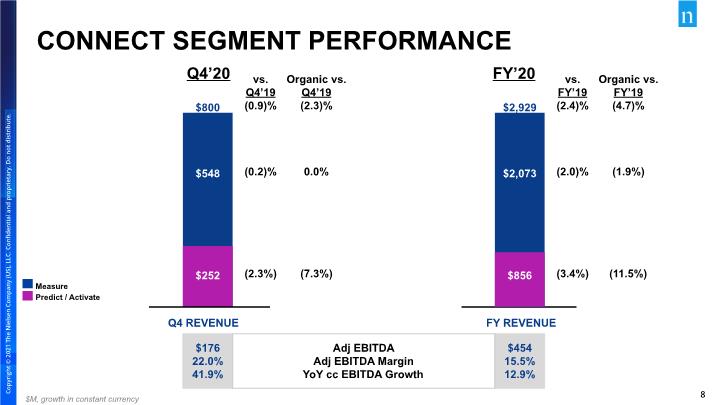
$2,929 Q4 REVENUE $800 $548 $252 FY REVENUE $176 22.0% 41.9% $454 15.5% 12.9% CONNECT SEGMENT PERFORMANCE $2,073 $856 Adj EBITDA Adj EBITDA Margin YoY cc EBITDA Growth Q4’20 FY’20 vs. Q4’19 (0.9)% (0.2)% (2.3%) Organic vs. Q4’19 (2.3)% 0.0% (7.3%) vs. FY’19 (2.4)% (2.0)% (3.4%) Organic vs. FY’19 (4.7)% (1.9%) (11.5%) $M, growth in constant currency Measure Predict / Activate

2021 GUIDANCE Copyright © 2020 The Nielsen Company (US), LLC. Confidential and proprietary. Do not distribute.
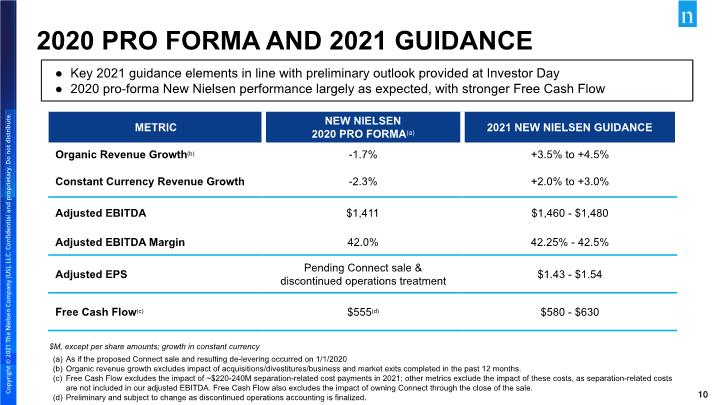
As if the proposed Connect sale and resulting de-levering occurred on 1/1/2020 Organic revenue growth excludes impact of acquisitions/divestitures/business and market exits completed in the past 12 months. Free Cash Flow excludes the impact of ~$220-240M separation-related cost payments in 2021; other metrics exclude the impact of these costs, as separation-related costs are not included in our adjusted EBITDA. Free Cash Flow also excludes the impact of owning Connect through the close of the sale. Preliminary and subject to change as discontinued operations accounting is finalized. Key 2021 guidance elements in line with preliminary outlook provided at Investor Day 2020 pro-forma New Nielsen performance largely as expected, with stronger Free Cash Flow 2020 PRO FORMA AND 2021 GUIDANCE $M, except per share amounts; growth in constant currency

Q&A Copyright © 2020 The Nielsen Company (US), LLC. Confidential and proprietary. Do not distribute.

APPENDIX Copyright © 2020 The Nielsen Company (US), LLC. Confidential and proprietary. Do not distribute.
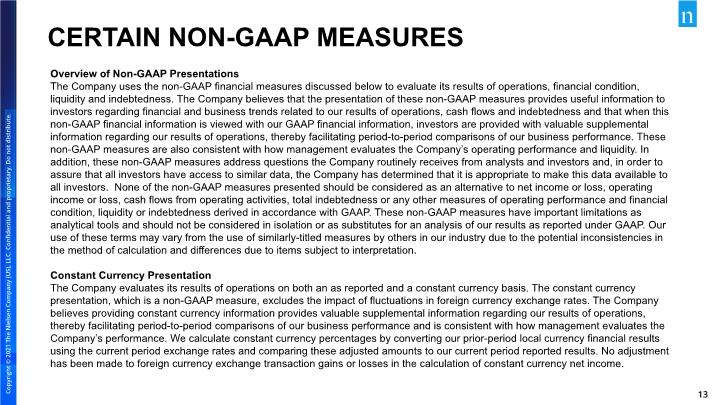
CERTAIN NON-GAAP MEASURES Overview of Non-GAAP Presentations The Company uses the non-GAAP financial measures discussed below to evaluate its results of operations, financial condition, liquidity and indebtedness. The Company believes that the presentation of these non-GAAP measures provides useful information to investors regarding financial and business trends related to our results of operations, cash flows and indebtedness and that when this non-GAAP financial information is viewed with our GAAP financial information, investors are provided with valuable supplemental information regarding our results of operations, thereby facilitating period-to-period comparisons of our business performance. These non-GAAP measures are also consistent with how management evaluates the Company’s operating performance and liquidity. In addition, these non-GAAP measures address questions the Company routinely receives from analysts and investors and, in order to assure that all investors have access to similar data, the Company has determined that it is appropriate to make this data available to all investors. None of the non-GAAP measures presented should be considered as an alternative to net income or loss, operating income or loss, cash flows from operating activities, total indebtedness or any other measures of operating performance and financial condition, liquidity or indebtedness derived in accordance with GAAP. These non-GAAP measures have important limitations as analytical tools and should not be considered in isolation or as substitutes for an analysis of our results as reported under GAAP. Our use of these terms may vary from the use of similarly-titled measures by others in our industry due to the potential inconsistencies in the method of calculation and differences due to items subject to interpretation. Constant Currency Presentation The Company evaluates its results of operations on both an as reported and a constant currency basis. The constant currency presentation, which is a non-GAAP measure, excludes the impact of fluctuations in foreign currency exchange rates. The Company believes providing constant currency information provides valuable supplemental information regarding our results of operations, thereby facilitating period-to-period comparisons of our business performance and is consistent with how management evaluates the Company’s performance. We calculate constant currency percentages by converting our prior-period local currency financial results using the current period exchange rates and comparing these adjusted amounts to our current period reported results. No adjustment has been made to foreign currency exchange transaction gains or losses in the calculation of constant currency net income.
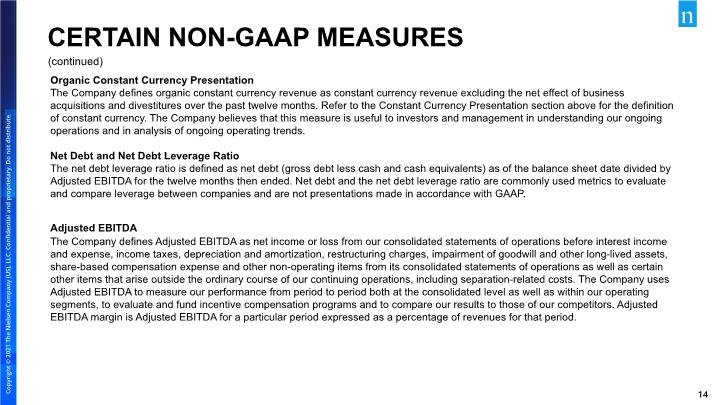
Organic Constant Currency Presentation The Company defines organic constant currency revenue as constant currency revenue excluding the net effect of business acquisitions and divestitures over the past twelve months. Refer to the Constant Currency Presentation section above for the definition of constant currency. The Company believes that this measure is useful to investors and management in understanding our ongoing operations and in analysis of ongoing operating trends. Net Debt and Net Debt Leverage Ratio The net debt leverage ratio is defined as net debt (gross debt less cash and cash equivalents) as of the balance sheet date divided by Adjusted EBITDA for the twelve months then ended. Net debt and the net debt leverage ratio are commonly used metrics to evaluate and compare leverage between companies and are not presentations made in accordance with GAAP. Adjusted EBITDA The Company defines Adjusted EBITDA as net income or loss from our consolidated statements of operations before interest income and expense, income taxes, depreciation and amortization, restructuring charges, impairment of goodwill and other long-lived assets, share-based compensation expense and other non-operating items from its consolidated statements of operations as well as certain other items that arise outside the ordinary course of our continuing operations, including separation-related costs. The Company uses Adjusted EBITDA to measure our performance from period to period both at the consolidated level as well as within our operating segments, to evaluate and fund incentive compensation programs and to compare our results to those of our competitors. Adjusted EBITDA margin is Adjusted EBITDA for a particular period expressed as a percentage of revenues for that period. (continued) CERTAIN NON-GAAP MEASURES
Adjusted EPS The Company defines Adjusted Earnings per Share as net income attributable to Nielsen shareholders per share (diluted) from continuing operations from our consolidated statements of operations, excluding depreciation and amortization associated with acquired tangible and intangible assets, restructuring charges, impairment of goodwill and other long-lived assets, share based compensation expense, other non-operating items from our consolidated statements of operations, certain other items considered unusual or non-recurring in nature and separation-related costs, adjusted for income taxes related to these items. Management believes that this non-GAAP measure is useful in providing period-to-period comparisons of the results of the Company’s ongoing operating performance. Free Cash Flow The Company defines free cash flow as net cash provided by operating activities, less capital expenditures, net. The Company believes providing free cash flow information provides valuable supplemental liquidity information regarding the cash flow that may be available for discretionary use by the Company in areas such as the distributions of dividends, repurchase of common stock, voluntary repayment of debt obligations or to fund our strategic initiatives, including acquisitions, if any. However, free cash flow does not represent residual cash flows entirely available for discretionary purposes; for example, the repayment of principal amounts borrowed is not deducted from free cash flow. Key limitations of the free cash flow measure include the assumptions that the Company will be able to refinance our existing debt when it matures and meet other cash flow obligations from financing activities, such as principal payments on debt. Free cash flow is not a presentation made in accordance with GAAP. (continued) CERTAIN NON-GAAP MEASURES
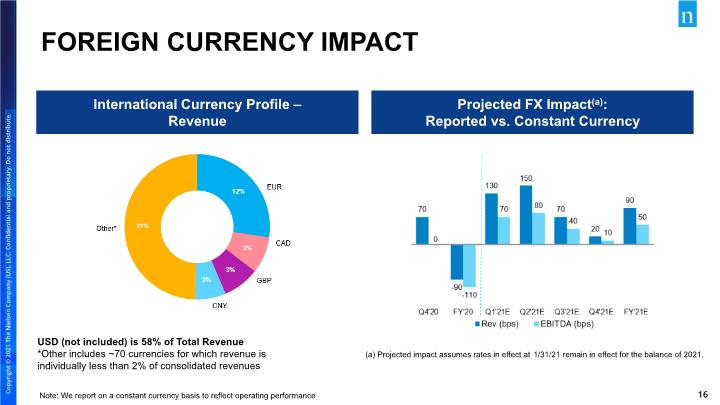
Projected FX Impact(a): Reported vs. Constant Currency Note: We report on a constant currency basis to reflect operating performance FOREIGN CURRENCY IMPACT (a) Projected impact assumes rates in effect at 1/31/21 remain in effect for the balance of 2021. International Currency Profile – Revenue USD (not included) is 58% of Total Revenue *Other includes ~70 currencies for which revenue is individually less than 2% of consolidated revenues Graphs did not copy over live, only as pictures.
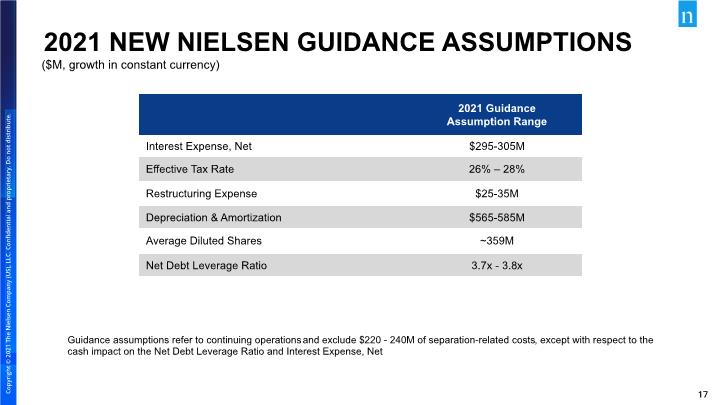
Guidance assumptions refer to continuing operations and exclude $220 - 240M of separation-related costs, except with respect to the cash impact on the Net Debt Leverage Ratio and Interest Expense, Net 2021 NEW NIELSEN GUIDANCE ASSUMPTIONS ($M, growth in constant currency)
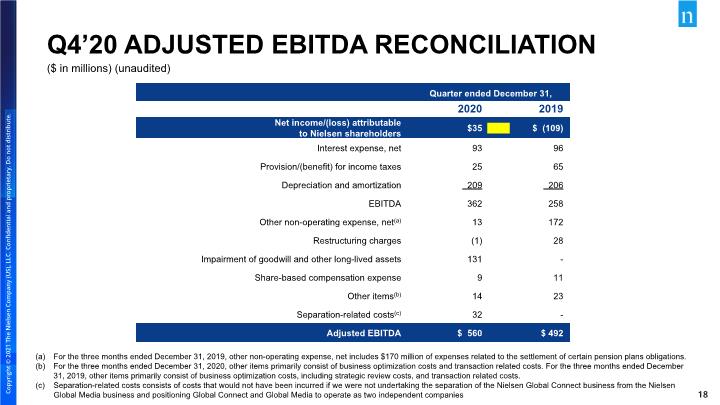
Q4’20 ADJUSTED EBITDA RECONCILIATION ($ in millions) (unaudited) For the three months ended December 31, 2019, other non-operating expense, net includes $170 million of expenses related to the settlement of certain pension plans obligations. For the three months ended December 31, 2020, other items primarily consist of business optimization costs and transaction related costs. For the three months ended December 31, 2019, other items primarily consist of business optimization costs, including strategic review costs, and transaction related costs. Separation-related costs consists of costs that would not have been incurred if we were not undertaking the separation of the Nielsen Global Connect business from the Nielsen Global Media business and positioning Global Connect and Global Media to operate as two independent companies
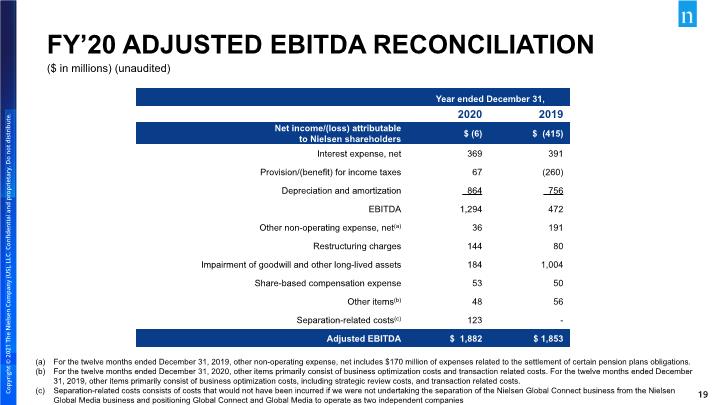
FY’20 ADJUSTED EBITDA RECONCILIATION ($ in millions) (unaudited) For the twelve months ended December 31, 2019, other non-operating expense, net includes $170 million of expenses related to the settlement of certain pension plans obligations. For the twelve months ended December 31, 2020, other items primarily consist of business optimization costs and transaction related costs. For the twelve months ended December 31, 2019, other items primarily consist of business optimization costs, including strategic review costs, and transaction related costs. Separation-related costs consists of costs that would not have been incurred if we were not undertaking the separation of the Nielsen Global Connect business from the Nielsen Global Media business and positioning Global Connect and Global Media to operate as two independent companies
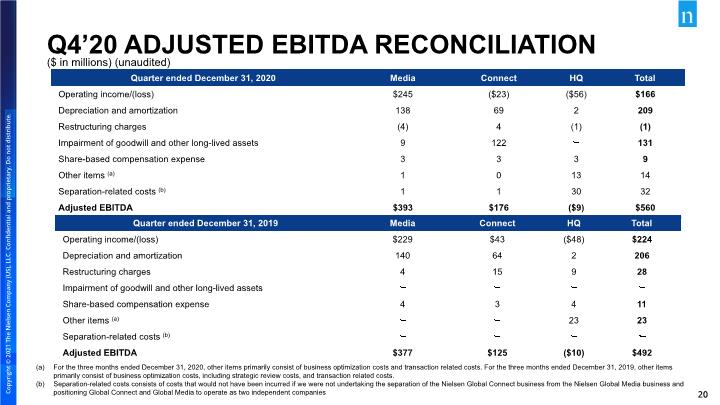
Q4’20 ADJUSTED EBITDA RECONCILIATION ($ in millions) (unaudited) For the three months ended December 31, 2020, other items primarily consist of business optimization costs and transaction related costs. For the three months ended December 31, 2019, other items primarily consist of business optimization costs, including strategic review costs, and transaction related costs. Separation-related costs consists of costs that would not have been incurred if we were not undertaking the separation of the Nielsen Global Connect business from the Nielsen Global Media business and positioning Global Connect and Global Media to operate as two independent companies
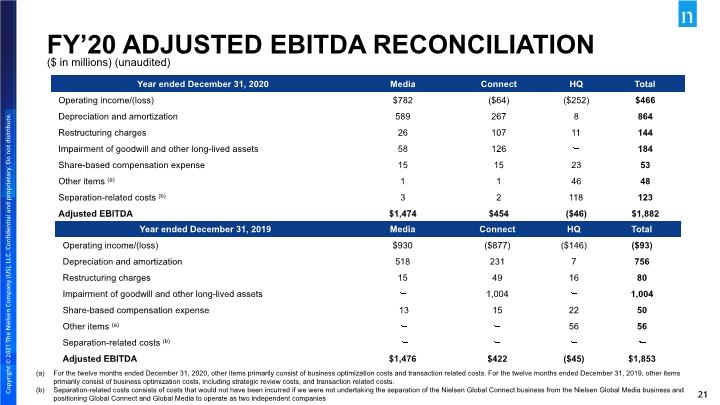
FY’20 ADJUSTED EBITDA RECONCILIATION ($ in millions) (unaudited) For the twelve months ended December 31, 2020, other items primarily consist of business optimization costs and transaction related costs. For the twelve months ended December 31, 2019, other items primarily consist of business optimization costs, including strategic review costs, and transaction related costs. Separation-related costs consists of costs that would not have been incurred if we were not undertaking the separation of the Nielsen Global Connect business from the Nielsen Global Media business and positioning Global Connect and Global Media to operate as two independent companies
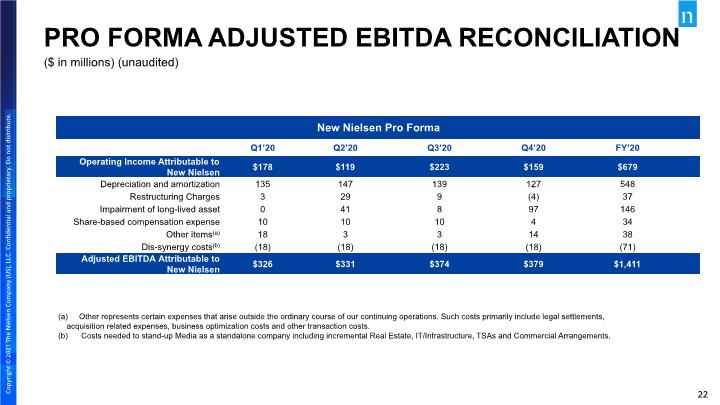
PRO FORMA ADJUSTED EBITDA RECONCILIATION ($ in millions) (unaudited) Other represents certain expenses that arise outside the ordinary course of our continuing operations. Such costs primarily include legal settlements, acquisition related expenses, business optimization costs and other transaction costs. Costs needed to stand-up Media as a standalone company including incremental Real Estate, IT/Infrastructure, TSAs and Commercial Arrangements.
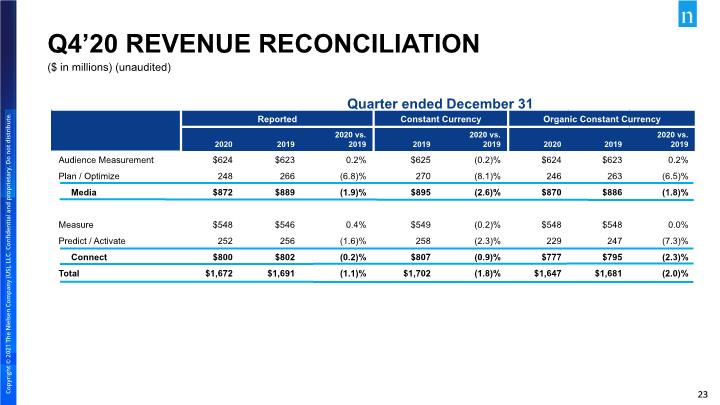
Q4’20 REVENUE RECONCILIATION Quarter ended December 31 ($ in millions) (unaudited)
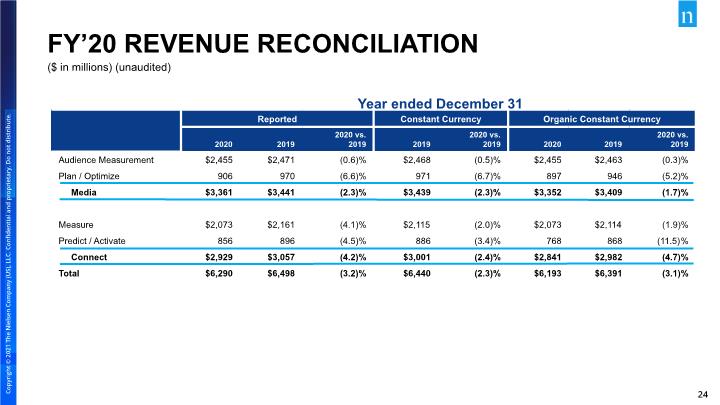
FY’20 REVENUE RECONCILIATION Year ended December 31 ($ in millions) (unaudited)
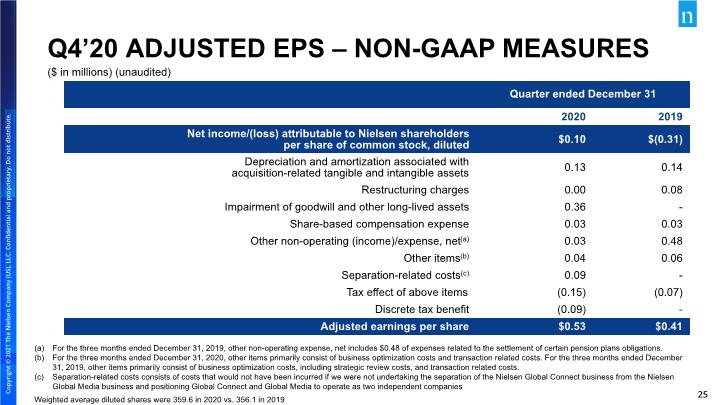
Q4’20 ADJUSTED EPS – NON-GAAP MEASURES ($ in millions) (unaudited) For the three months ended December 31, 2019, other non-operating expense, net includes $0.48 of expenses related to the settlement of certain pension plans obligations. For the three months ended December 31, 2020, other items primarily consist of business optimization costs and transaction related costs. For the three months ended December 31, 2019, other items primarily consist of business optimization costs, including strategic review costs, and transaction related costs. Separation-related costs consists of costs that would not have been incurred if we were not undertaking the separation of the Nielsen Global Connect business from the Nielsen Global Media business and positioning Global Connect and Global Media to operate as two independent companies Weighted average diluted shares were 359.6 in 2020 vs. 356.1 in 2019
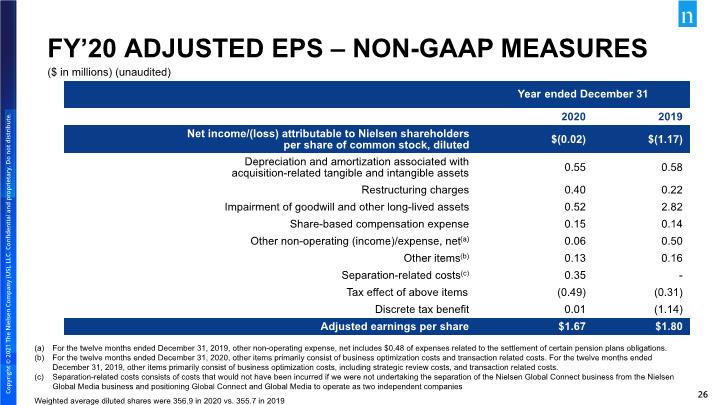
FY’20 ADJUSTED EPS – NON-GAAP MEASURES ($ in millions) (unaudited) For the twelve months ended December 31, 2019, other non-operating expense, net includes $0.48 of expenses related to the settlement of certain pension plans obligations. For the twelve months ended December 31, 2020, other items primarily consist of business optimization costs and transaction related costs. For the twelve months ended December 31, 2019, other items primarily consist of business optimization costs, including strategic review costs, and transaction related costs. Separation-related costs consists of costs that would not have been incurred if we were not undertaking the separation of the Nielsen Global Connect business from the Nielsen Global Media business and positioning Global Connect and Global Media to operate as two independent companies Weighted average diluted shares were 356.9 in 2020 vs. 355.7 in 2019
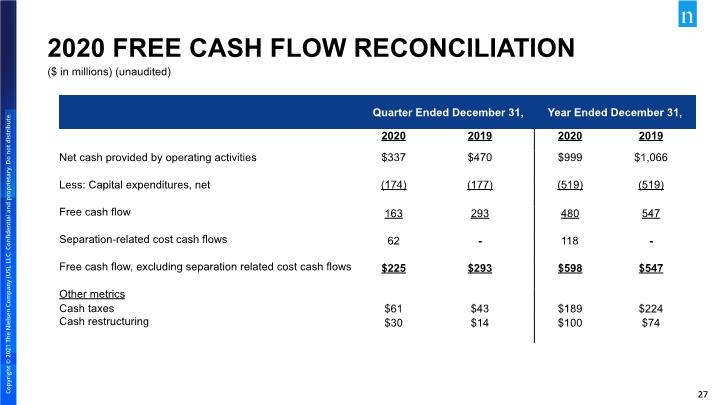
2020 FREE CASH FLOW RECONCILIATION ($ in millions) (unaudited)
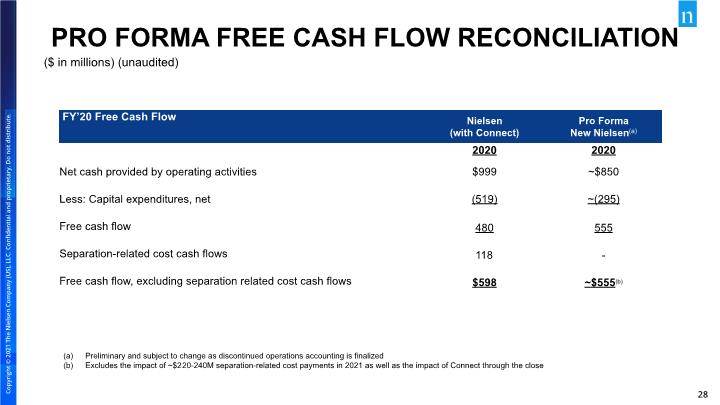
Preliminary and subject to change as discontinued operations accounting is finalized Excludes the impact of ~$220-240M separation-related cost payments in 2021 as well as the impact of Connect through the close PRO FORMA FREE CASH FLOW RECONCILIATION ($ in millions) (unaudited)
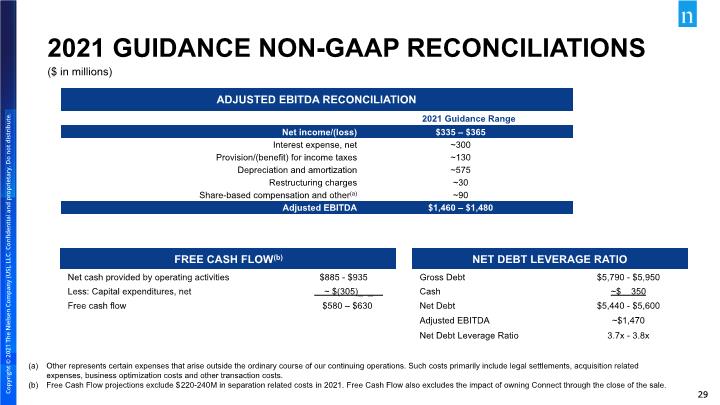
2021 GUIDANCE NON-GAAP RECONCILIATIONS ($ in millions) Other represents certain expenses that arise outside the ordinary course of our continuing operations. Such costs primarily include legal settlements, acquisition related expenses, business optimization costs and other transaction costs. Free Cash Flow projections exclude $220-240M in separation related costs in 2021. Free Cash Flow also excludes the impact of owning Connect through the close of the sale.
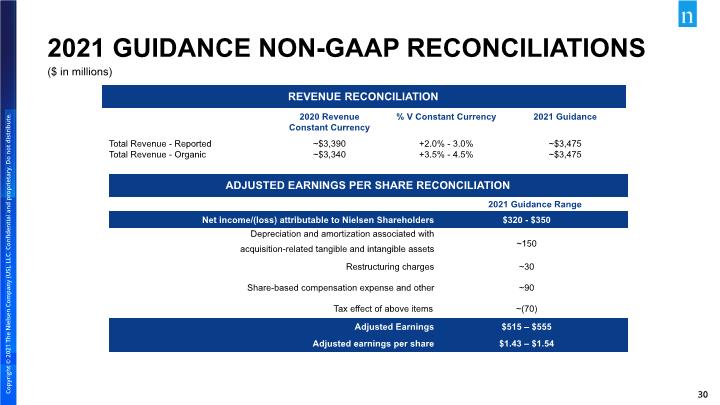
2021 GUIDANCE NON-GAAP RECONCILIATIONS ($ in millions)
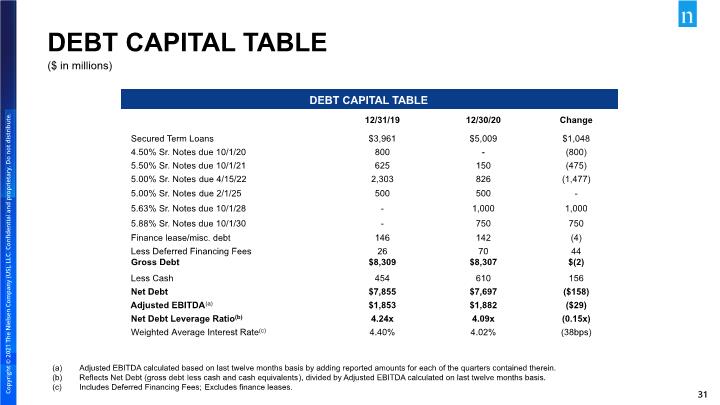
Adjusted EBITDA calculated based on last twelve months basis by adding reported amounts for each of the quarters contained therein. Reflects Net Debt (gross debt less cash and cash equivalents), divided by Adjusted EBITDA calculated on last twelve months basis. Includes Deferred Financing Fees; Excludes finance leases. DEBT CAPITAL TABLE ($ in millions)
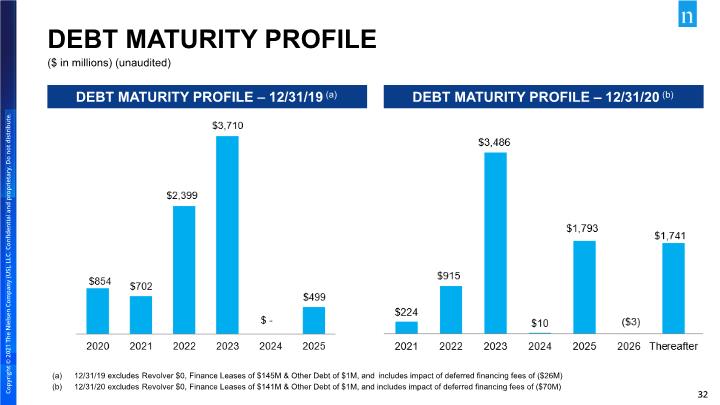
12/31/19 excludes Revolver $0, Finance Leases of $145M & Other Debt of $1M, and includes impact of deferred financing fees of ($26M) 12/31/20 excludes Revolver $0, Finance Leases of $141M & Other Debt of $1M, and includes impact of deferred financing fees of ($70M) DEBT MATURITY PROFILE DEBT MATURITY PROFILE – 12/31/20 (b) ($ in millions) (unaudited) DEBT MATURITY PROFILE – 12/31/19 (a)

NIELSEN INVESTOR RELATIONS ir@nielsen.com +1.646.654.8153 nielsen.com/investors

Copyright © 2021 The Nielsen Company (US), LLC. Confidential and proprietary. Do not distribute.
