Attached files
| file | filename |
|---|---|
| EX-99.1 - EX-99.1 - Consolidated Communications Holdings, Inc. | cnsl-20210225xex99d1.htm |
| 8-K - 8-K - Consolidated Communications Holdings, Inc. | cnsl-20210225x8k.htm |
Exhibit 99.2
| Q4 2020 Earnings February 25, 2021 |
| Safe Harbor The Securities and Exchange Commission (“SEC”) encourages companies to disclose forward-looking information so that investors can better understand a company’s future prospects and make informed investment decisions. Certain statements in this communication are forward-looking statements and are made pursuant to the safe harbor provisions of the Securities Litigation Reform Act of 1995. These forward-looking statements reflect, among other things, our current expectations, plans, strategies, and anticipated financial results. There are a number of risks, uncertainties, and conditions that may cause our actual results to differ materially from those expressed or implied by these forward-looking statements. These risks and uncertainties include a number of factors related to our business, including the uncertainties relating to the impact of the novel coronavirus (COVID-19) pandemic on the company’s business, results of operations, cash flows, stock price and employees; the ability to obtain regulatory approvals required for the Searchlight investment and meet other closing conditions to the investment on a timely basis or at all; economic and financial market conditions generally and economic conditions in our service areas; various risks to the price and volatility of our common stock; changes in the valuation of pension plan assets; the substantial amount of debt and our ability to repay or refinance it or incur additional debt in the future; our need for a significant amount of cash to service and repay the debt restrictions contained in our debt agreements that limit the discretion of management in operating the business; regulatory changes, including changes to subsidies, rapid development and introduction of new technologies and intense competition in the telecommunications industry; risks associated with our possible pursuit of acquisitions; system failures; cyber-attacks, information or security breaches or technology failure of ours or of a third party; losses of large customers or government contracts; risks associated with the rights-of-way for the network; disruptions in the relationship with third party vendors; losses of key management personnel and the inability to attract and retain highly qualified management and personnel in the future; changes in the extensive governmental legislation and regulations governing telecommunications providers and the provision of telecommunications services; new or changing tax laws or regulations; telecommunications carriers disputing and/or avoiding their obligations to pay network access charges for use of our network; high costs of regulatory compliance; the competitive impact of legislation and regulatory changes in the telecommunications industry; and liability and compliance costs regarding environmental regulations; and risks associated with discontinuing paying dividends on our common stock. A detailed discussion of these and other risks and uncertainties that could cause actual results and events to differ materially from such forward-looking statements are discussed in more detail in our filings with the SEC, including our reports on Form 10-K and Form 10-Q. Many of these circumstances are beyond our ability to control or predict. Moreover, forward-looking statements necessarily involve assumptions on our part. These forward- looking statements generally are identified by the words “believe,” “expect,” “anticipate,” “estimate,” “project,” “intend,” “plan,” “should,” “may,” “will,” “would,” “will be,” “will continue” or similar expressions. Such forward-looking statements involve known and unknown risks, uncertainties and other factors that may cause actual results, performance or achievements of Consolidated Communications Holdings, Inc. and its subsidiaries to be different from those expressed or implied in the forward-looking statements. All forward-looking statements attributable to us or persons acting on our behalf are expressly qualified in their entirety by the cautionary statements that appear throughout this communication. Furthermore, forward-looking statements speak only as of the date they are made. Except as required under the federal securities laws or the rules and regulations of the SEC, we disclaim any intention or obligation to update or revise publicly any forward- looking statements. You should not place undue reliance on forward-looking statements. 2 |
| Non-GAAP Measures 3 This presentation includes certain non-GAAP historical and forward-looking financial measures, including but not limited to “EBITDA,” “adjusted EBITDA,” “total net debt to last twelve month adjusted EBITDA ratio,” and “free cash flow.” In addition to providing key metrics for management to evaluate the Company’s performance, we believes these measurements assist investors in their understanding of operating performance and in identifying historical and prospective trends. A reconciliation of the differences between these non-GAAP financial measures and the most directly comparable financial measures presented in accordance with GAAP are available on the Company’s website at https://ir.consolidated.com. Non-GAAP measures are not presented to be replacements or alternatives to the GAAP measures, and investors are urged to consider these non-GAAP measures in addition to, and not in substitution for, measures prepared in accordance with GAAP. Consolidated may present or calculate its non-GAAP measures differently from other companies. Consolidated has filed a Form 8-K reporting the quarterly results for the fourth quarter of 2020. The 8-K and 10-K must be read in conjunction with this presentation and contains additional important details on the quarterly results. . |
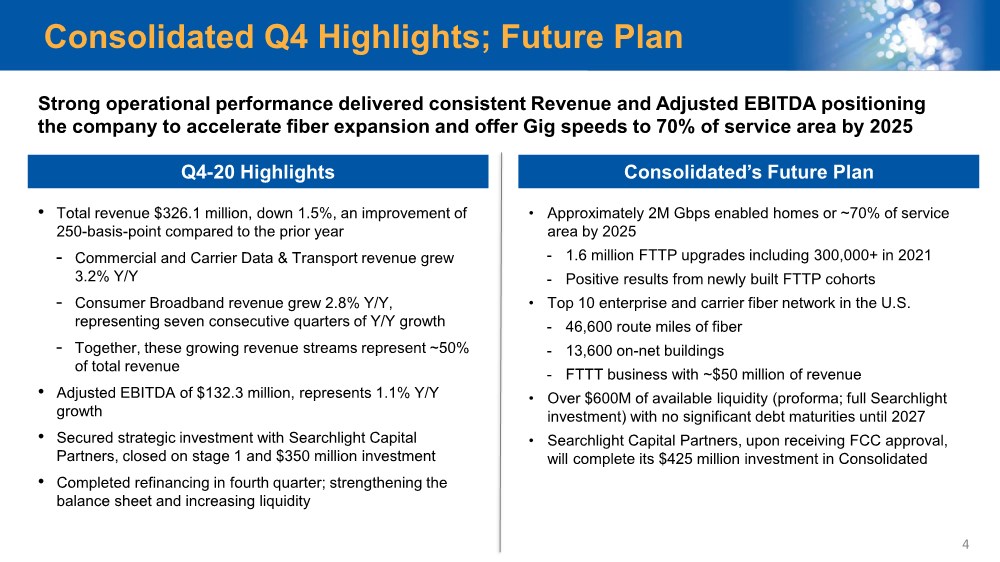
| Consolidated Q4 Highlights; Future Plan • Total revenue $326.1 million, down 1.5%, an improvement of 250-basis-point compared to the prior year - Commercial and Carrier Data & Transport revenue grew 3.2% Y/Y - Consumer Broadband revenue grew 2.8% Y/Y, representing seven consecutive quarters of Y/Y growth - Together, these growing revenue streams represent ~50% of total revenue • Adjusted EBITDA of $132.3 million, represents 1.1% Y/Y growth • Secured strategic investment with Searchlight Capital Partners, closed on stage 1 and $350 million investment • Completed refinancing in fourth quarter; strengthening the balance sheet and increasing liquidity Q4-20 Highlights Consolidated’s Future Plan • Approximately 2M Gbps enabled homes or ~70% of service area by 2025 - 1.6 million FTTP upgrades including 300,000+ in 2021 - Positive results from newly built FTTP cohorts • Top 10 enterprise and carrier fiber network in the U.S. - 46,600 route miles of fiber - 13,600 on-net buildings - FTTT business with ~$50 million of revenue • Over $600M of available liquidity (proforma; full Searchlight investment) with no significant debt maturities until 2027 • Searchlight Capital Partners, upon receiving FCC approval, will complete its $425 million investment in Consolidated 4 Strong operational performance delivered consistent Revenue and Adjusted EBITDA positioning the company to accelerate fiber expansion and offer Gig speeds to 70% of service area by 2025 |
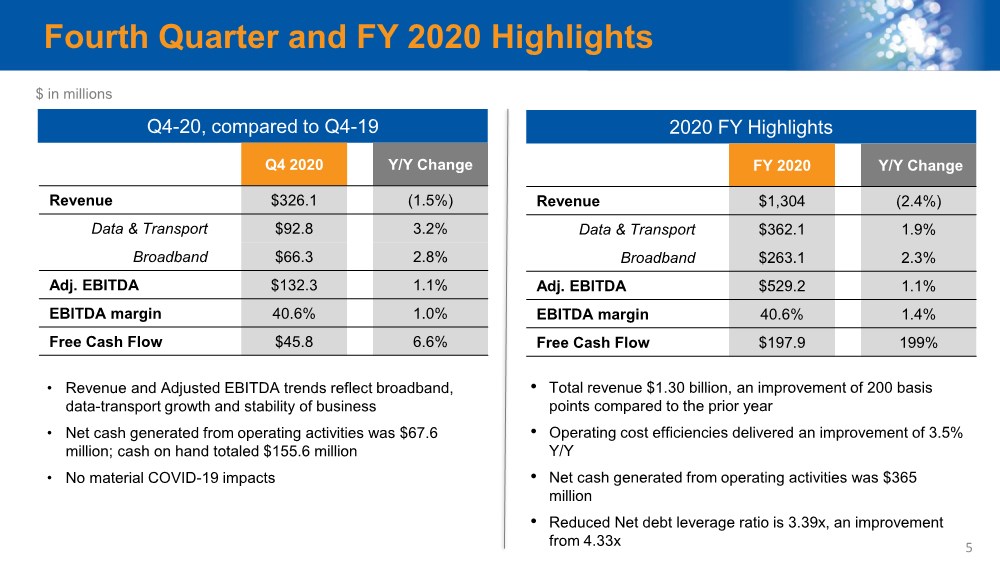
| Fourth Quarter and FY 2020 Highlights • Revenue and Adjusted EBITDA trends reflect broadband, data-transport growth and stability of business • Net cash generated from operating activities was $67.6 million; cash on hand totaled $155.6 million • No material COVID-19 impacts 5 Q4-20, compared to Q4-19 2020 FY Highlights • Total revenue $1.30 billion, an improvement of 200 basis points compared to the prior year • Operating cost efficiencies delivered an improvement of 3.5% Y/Y • Net cash generated from operating activities was $365 million • Reduced Net debt leverage ratio is 3.39x, an improvement from 4.33x Q4 2020 Y/Y Change Revenue $326.1 (1.5%) Data & Transport $92.8 3.2% Broadband $66.3 2.8% Adj. EBITDA $132.3 1.1% EBITDA margin 40.6% 1.0% Free Cash Flow $45.8 6.6% FY 2020 Y/Y Change Revenue $1,304 (2.4%) Data & Transport $362.1 1.9% Broadband $263.1 2.3% Adj. EBITDA $529.2 1.1% EBITDA margin 40.6% 1.4% Free Cash Flow $197.9 199% $ in millions |
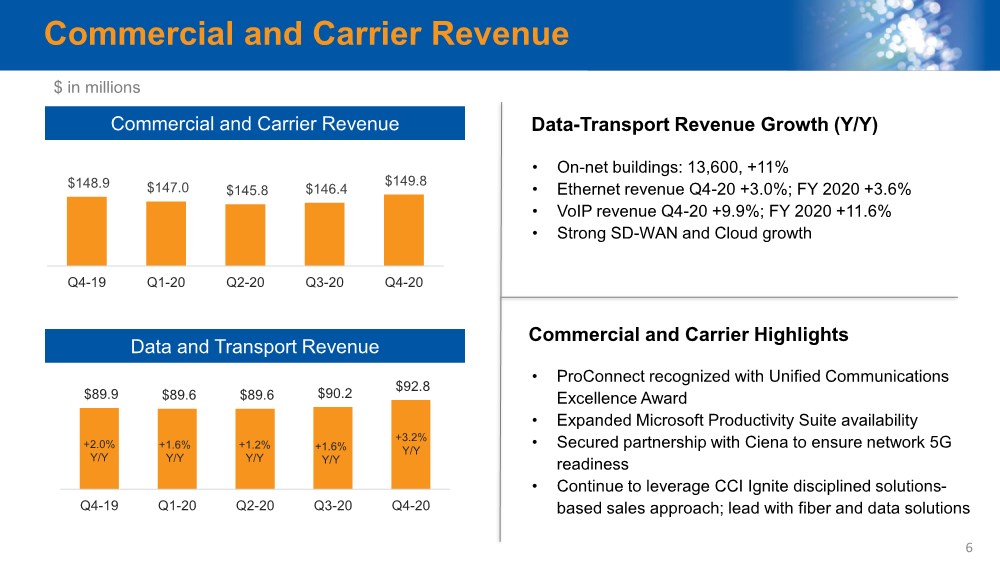
| $89.9 $89.6 $89.6 $90.2 $92.8 Q4-19 Q1-20 Q2-20 Q3-20 Q4-20 $148.9 $147.0 $145.8 $146.4 $149.8 Q4-19 Q1-20 Q2-20 Q3-20 Q4-20 Commercial and Carrier Revenue $ in millions • On-net buildings: 13,600, +11% • Ethernet revenue Q4-20 +3.0%; FY 2020 +3.6% • VoIP revenue Q4-20 +9.9%; FY 2020 +11.6% • Strong SD-WAN and Cloud growth • ProConnect recognized with Unified Communications Excellence Award • Expanded Microsoft Productivity Suite availability • Secured partnership with Ciena to ensure network 5G readiness • Continue to leverage CCI Ignite disciplined solutions- based sales approach; lead with fiber and data solutions Data-Transport Revenue Growth (Y/Y) Commercial and Carrier Highlights 6 Commercial and Carrier Revenue Data and Transport Revenue +3.2% Y/Y +1.6% Y/Y +1.2% Y/Y +1.6% Y/Y +2.0% Y/Y |
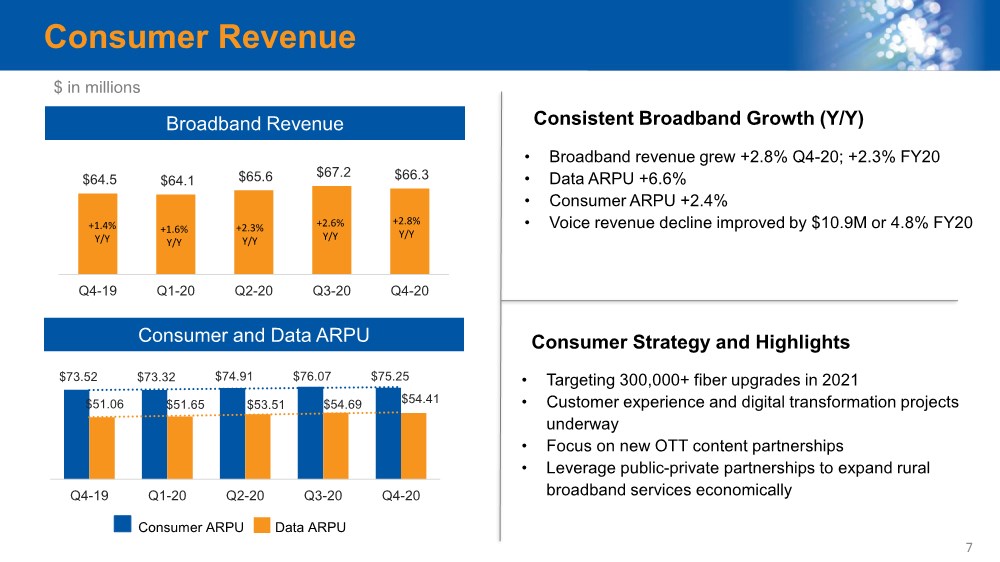
| $64.5 $64.1 $65.6 $67.2 $66.3 Q4-19 Q1-20 Q2-20 Q3-20 Q4-20 Consumer Revenue • Broadband revenue grew +2.8% Q4-20; +2.3% FY20 • Data ARPU +6.6% • Consumer ARPU +2.4% • Voice revenue decline improved by $10.9M or 4.8% FY20 • Targeting 300,000+ fiber upgrades in 2021 • Customer experience and digital transformation projects underway • Focus on new OTT content partnerships • Leverage public-private partnerships to expand rural broadband services economically Consistent Broadband Growth (Y/Y) Consumer Strategy and Highlights $ in millions 7 Broadband Revenue Consumer and Data ARPU Consumer ARPU Data ARPU +2.8% Y/Y +2.6% Y/Y +2.3% Y/Y +1.6% Y/Y +1.4% Y/Y $73.52 $73.32 $74.91 $76.07 $75.25 $51.06 $51.65 $53.51 $54.69 $54.41 Q4-19 Q1-20 Q2-20 Q3-20 Q4-20 |
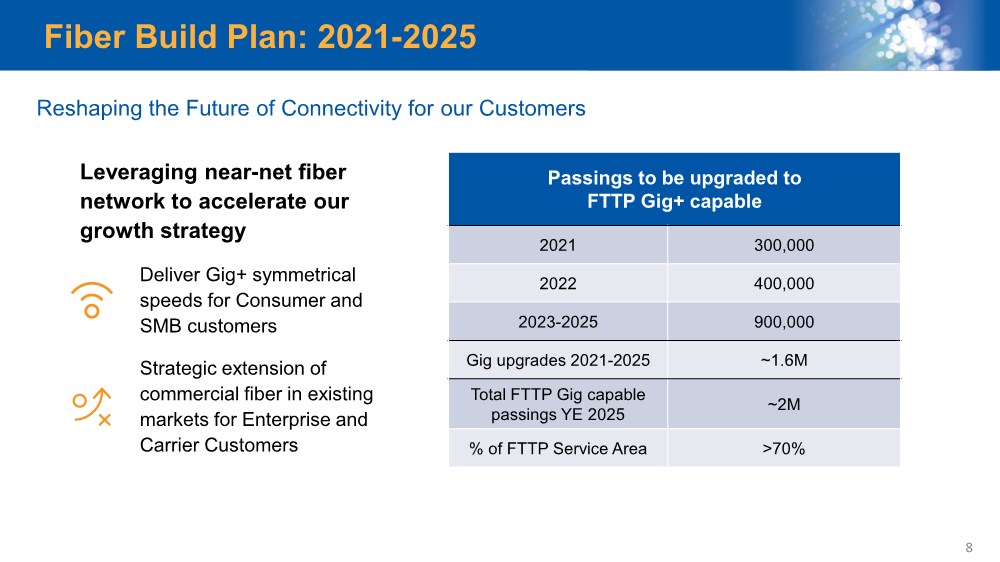
| Fiber Build Plan: 2021-2025 Reshaping the Future of Connectivity for our Customers Leveraging near-net fiber network to accelerate our growth strategy Deliver Gig+ symmetrical speeds for Consumer and SMB customers Strategic extension of commercial fiber in existing markets for Enterprise and Carrier Customers Passings to be upgraded to FTTP Gig+ capable 2021 300,000 2022 400,000 2023-2025 900,000 Gig upgrades 2021-2025 ~1.6M Total FTTP Gig capable passings YE 2025 ~2M % of FTTP Service Area >70% 8 |
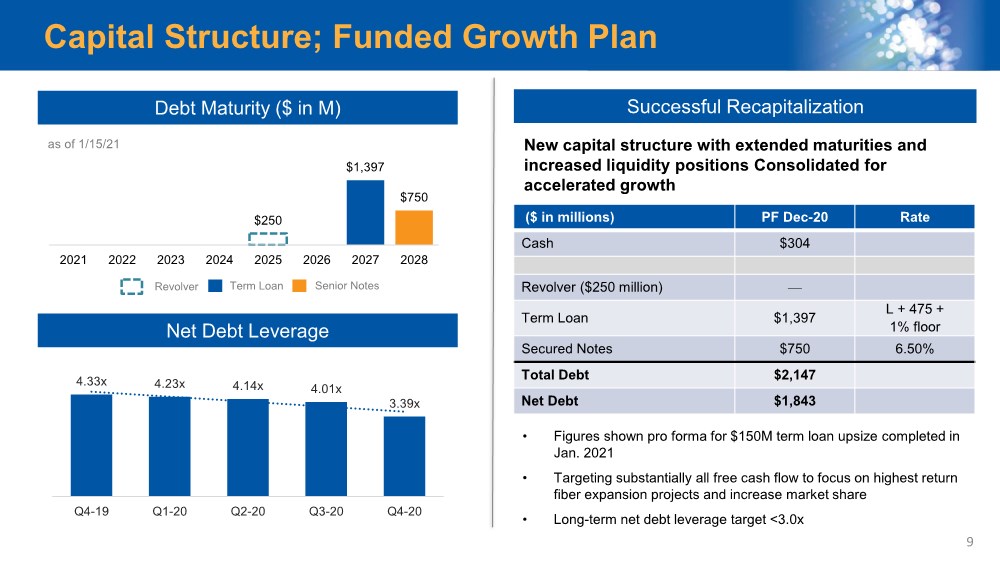
| $250 $1,397 $750 2021 2022 2023 2024 2025 2026 2027 2028 Senior Notes Term Loan Revolver Capital Structure; Funded Growth Plan Debt Maturity ($ in M) Net Debt Leverage • Figures shown pro forma for $150M term loan upsize completed in Jan. 2021 • Targeting substantially all free cash flow to focus on highest return fiber expansion projects and increase market share • Long-term net debt leverage target <3.0x Successful Recapitalization New capital structure with extended maturities and increased liquidity positions Consolidated for accelerated growth as of 1/15/21 4.33x 4.23x 4.14x 4.01x 3.39x Q4-19 Q1-20 Q2-20 Q3-20 Q4-20 9 ($ in millions) PF Dec-20 Rate Cash $304 Revolver ($250 million) ⸺ Term Loan $1,397 L + 475 + 1% floor Secured Notes $750 6.50% Total Debt $2,147 Net Debt $1,843 |
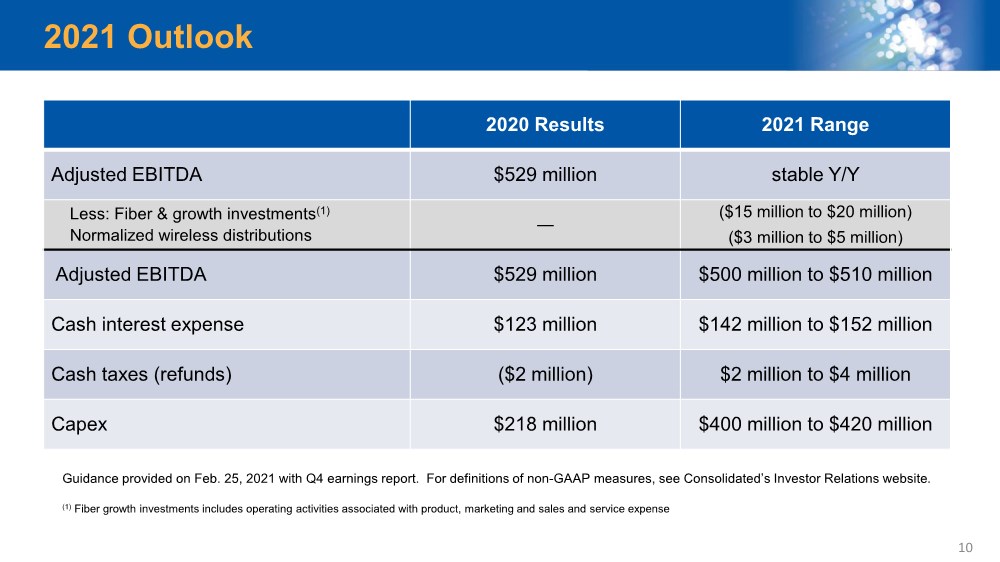
| 2021 Outlook 10 2020 Results 2021 Range Adjusted EBITDA $529 million stable Y/Y Less: Fiber & growth investments(1) Normalized wireless distributions —($15 million to $20 million) ($3 million to $5 million) Adjusted EBITDA $529 million $500 million to $510 million Cash interest expense $123 million $142 million to $152 million Cash taxes (refunds)($2 million) $2 million to $4 million Capex $218 million $400 million to $420 million Guidance provided on Feb. 25, 2021 with Q4 earnings report. For definitions of non-GAAP measures, see Consolidated’s Investor Relations website. (1) Fiber growth investments includes operating activities associated with product, marketing and sales and service expense |
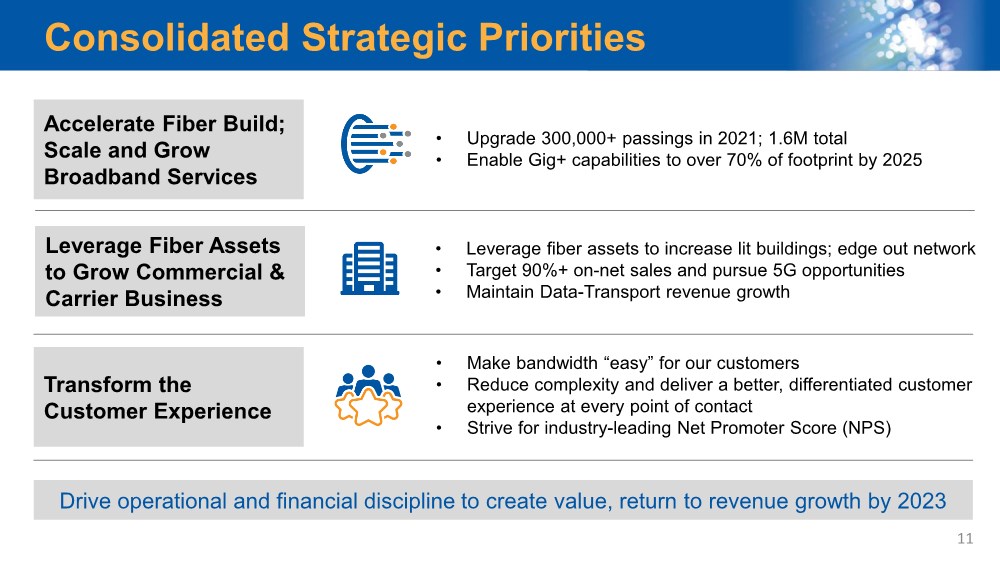
| Consolidated Strategic Priorities • Upgrade 300,000+ passings in 2021; 1.6M total • Enable Gig+ capabilities to over 70% of footprint by 2025 Accelerate Fiber Build; Scale and Grow Broadband Services Leverage Fiber Assets to Grow Commercial & Carrier Business • Leverage fiber assets to increase lit buildings; edge out network • Target 90%+ on-net sales and pursue 5G opportunities • Maintain Data-Transport revenue growth • Make bandwidth “easy” for our customers • Reduce complexity and deliver a better, differentiated customer experience at every point of contact • Strive for industry-leading Net Promoter Score (NPS) Transform the Customer Experience Drive operational and financial discipline to create value, return to revenue growth by 2023 11 |
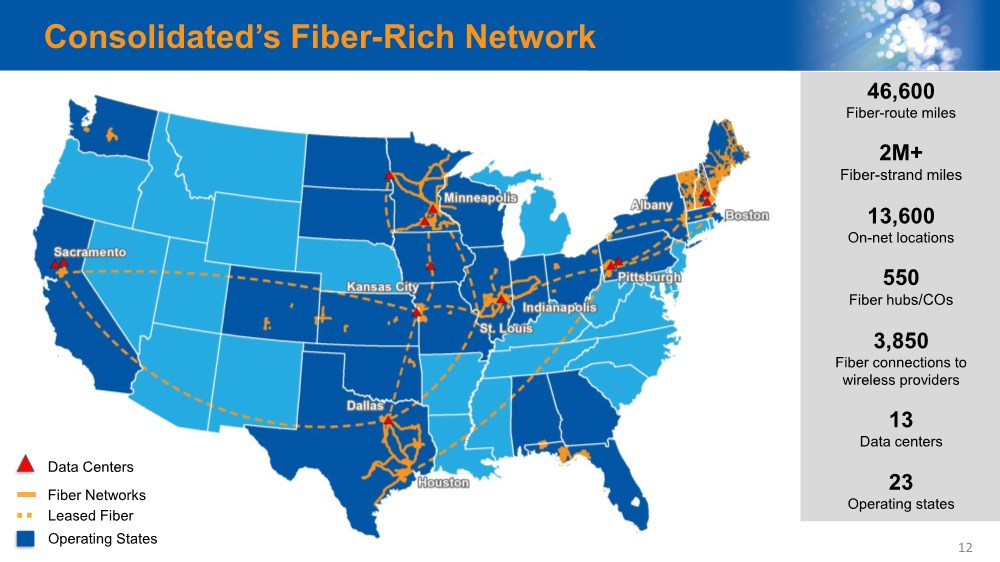
| Consolidated’s Fiber-Rich Network 46,600 Fiber-route miles 2M+ Fiber-strand miles 13,600 On-net locations 550 Fiber hubs/COs 3,850 Fiber connections to wireless providers 13 Data centers 23 Operating states Data Centers Operating States Fiber Networks Leased Fiber 12 |
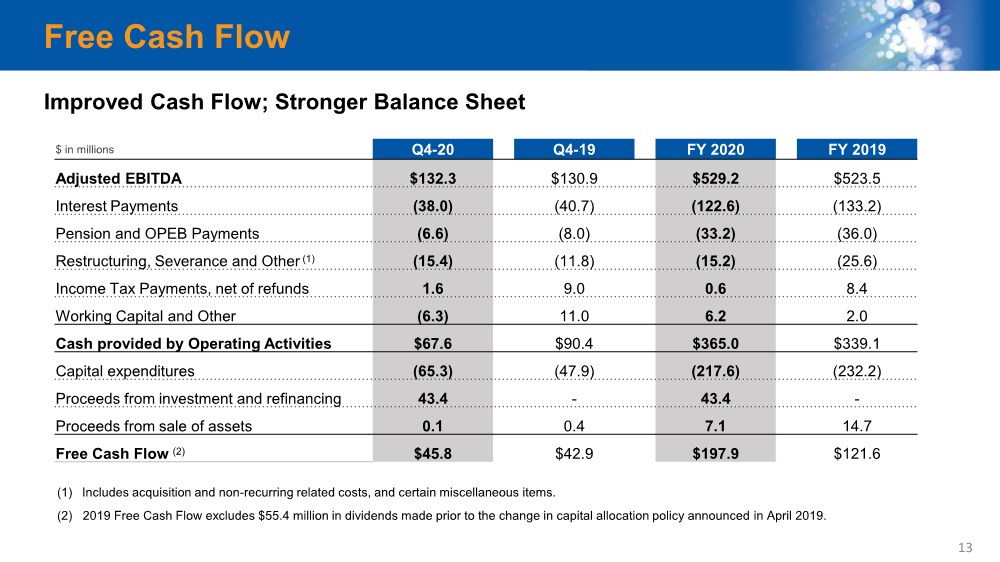
| Free Cash Flow 13 (1) Includes acquisition and non-recurring related costs, and certain miscellaneous items. (2) 2019 Free Cash Flow excludes $55.4 million in dividends made prior to the change in capital allocation policy announced in April 2019. Improved Cash Flow; Stronger Balance Sheet $ in millions Q4-20 Q4-19 FY 2020 FY 2019 Adjusted EBITDA $132.3 $130.9 $529.2 $523.5 Interest Payments (38.0)(40.7)(122.6)(133.2) Pension and OPEB Payments (6.6)(8.0)(33.2)(36.0) Restructuring, Severance and Other (1) (15.4)(11.8)(15.2)(25.6) Income Tax Payments, net of refunds 1.6 9.0 0.6 8.4 Working Capital and Other (6.3) 11.0 6.2 2.0 Cash provided by Operating Activities $67.6 $90.4 $365.0 $339.1 Capital expenditures (65.3)(47.9)(217.6)(232.2) Proceeds from investment and refinancing 43.4 - 43.4 - Proceeds from sale of assets 0.1 0.4 7.1 14.7 Free Cash Flow (2) $45.8 $42.9 $197.9 $121.6 |
| Q&A Q4 2020 Earnings |