Attached files
| file | filename |
|---|---|
| 8-K - 8-K - SOUTH JERSEY INDUSTRIES INC | sji-20210224.htm |

2020 Earnings Presentation February 25, 2021

Forward-Looking Statements Certain statements contained in this Presentation, and in our Annual Report on Form 10-K may qualify as “forward-looking statements” within the meaning of Section 27A of the Securities Act of 1933 and Section 21E of the Securities Exchange Act of 1934. All statements in this Report other than statements of historical fact, including statements regarding guidance, industry prospects, future results of operations or financial position, expected sources of incremental margin, strategy, financing needs, future capital expenditures and the outcome or effect of ongoing litigation, should be considered forward-looking statements made in good faith by South Jersey Industries (SJI or the Company) and South Jersey Gas Company (SJG), as applicable, and are intended to qualify for the safe harbor from liability established by the Private Securities Litigation Reform Act of 1995. When used in this Report, or any other documents, words such as “anticipate,” “believe,” "estimate," “expect,” “forecast,” “goal,” “intend,” “objective,” “plan,” “project,” “seek,” “strategy,” "target," "will" and similar expressions are intended to identify forward-looking statements. These forward-looking statements are based on the beliefs and assumptions of management at the time that these statements were made and are inherently uncertain. Such forward-looking statements are subject to risks and uncertainties that could cause actual results to differ materially from those expressed or implied in the forward-looking statements. These risks and uncertainties include, but are not limited to the risks set forth under “Risk Factors” in Part I, Item 1A of our 10-K. These cautionary statements should not be construed by you to be exhaustive and they are made only as of the date of this Report. While the Company believes these forward-looking statements to be reasonable, there can be no assurance that they will approximate actual experience or that the expectations derived from them will be realized. Further, neither SJI nor SJG undertakes no obligation to update or revise any of its forward-looking statements whether as a result of new information, future events or otherwise. Our business could be materially and adversely affected by a public health crisis or the widespread outbreak of contagious disease, such as the outbreak of respiratory illness caused by a novel coronavirus (COVID-19), which has been declared a pandemic by the World Health Organization in March 2020. The continued spread of COVID-19 across the world has led to disruption and volatility in the global capital markets, which increases the cost of capital and adversely impacts access to capital. Additionally, our reliance on third-party suppliers, contractors, service providers, and commodity markets exposes us to the possibility of delay or interruption of our operations. For the duration of the outbreak of COVID-19, legislative and government action limits our ability to collect on overdue accounts, and prohibits us from shutting off services, which may cause a decrease in our cash flows or net income. These suspensions of shut downs of service for non-payment will be in place through at least March 15, 2021 based on an executive order issued by the Governor of New Jersey, in which water, gas and electricity providers are barred from cutting services to New Jersey residents. We have been executing our business continuity plans since the outbreak of COVID-19 and are closely monitoring potential impacts due to COVID-19 pandemic responses at the state and federal level. As expected, we have incurred operating costs for emergency supplies, cleaning services, enabling technology and other specific needs during this crisis which have traditionally been recognized as prudent expenditures by our regulators. The effects of the pandemic also may have a material adverse impact on our ability to collect accounts receivable as customers face higher liquidity and solvency risks, and also considering the inability to shut down services as noted above. Currently, the impact of the pandemic to the collectability of our accounts receivable continues to be monitored, but such receivables have traditionally been included in rate recovery. Our infrastructure investment programs continue to move forward, and construction activity that was delayed in accordance with directives from the Governor of New Jersey have since continued; however, to the extent the pandemic worsens or a similar directive is put in place in the future for a long period of time, our capital projects could be significantly impacted. It is impossible to predict the effect of the continued spread of the coronavirus in the communities we service. Should the coronavirus continue to spread or not be contained, our business, financial condition and results of operations could be materially impacted, including resulting in an impairment of goodwill or reduced access to capital markets, which in turn may have a negative effect on the market price of our common stock. Forward-Looking Statements & Non-GAAP Measures 2020 Earnings Presentation Non-GAAP Measures We define Economic Earnings as: Income from Continuing Operations, (i) less the change in unrealized gains and plus the change in unrealized losses on non-utility derivative transactions; (ii) less income and plus losses attributable to noncontrolling interest; and (iii) less the impact of transactions, contractual arrangements or other events where management believes period to period comparisons of SJI's operations could be difficult or potentially confusing. With respect to part (iii) of the definition of Economic Earnings, several items are excluded from Economic Earnings for the years ended December 31, 2020, 2019 and 2018, including impairment charges; the impact of pricing disputes with third parties; costs to acquire ETG and ELK; costs incurred and gains recognized on the acquisitions of EnerConnex and Annadale (fuel cell projects); costs to prepare to exit the transaction service agreement (TSA); costs incurred and gains/losses recognized on sales of solar, MTF/ACB, ELK and SJE's retail gas business; costs incurred to cease operations at three landfill gas-to-energy production facilities; customer credits related to the acquisition of ETG and ELK; ERIP costs; severance and other employee separation costs; and a one- tax adjustment resulting from SJG's Stipulation of Settlement with the BPU. Economic Earnings is a significant financial measure used by our management to indicate the amount and timing of income from continuing operations that we expect to earn after taking into account the impact of derivative instruments on the related transactions, as well as the impact of contractual arrangements and other events that management believes make period to period comparisons of SJI's operations difficult or potentially confusing. Management uses Economic Earnings to manage its business and to determine such items as incentive/compensation arrangements and allocation of resources. Specifically regarding derivatives, we believe that this financial measure indicates to investors the profitability of the entire derivative-related transaction and not just the portion that is subject to mark-to-market valuation under GAAP. We believe that considering only the change in market value on the derivative side of the transaction can produce a false sense as to the ultimate profitability of the total transaction as no change in value is reflected for the non-derivative portion of the transaction. 2

2020 Financial Results PERFORMANCE ▪ GAAP earnings $1.62 per diluted share compared to $0.84 per diluted share in 2019 ▪ Economic Earnings $1.68 per diluted share compared to $1.12 per diluted share in 2019 ▪ Capital spending $600M; 80%+ allocated to growth, safety and reliability for SJG/ETG customers ▪ Dividend increased to indicated annual $1.21 per share – 22nd consecutive year of rising dividends REGULATORY INITIATIVES ▪ SJG Base Rate Case - $39.5M increase effective October 1, 2020 ▪ ETG Base Rate Case - $34M increase effective November 15, 2019 ▪ SJG Infrastructure Investment Program (IIP) proposal filed – Seeking $742.5M investment ▪ SJG/ETG Energy Efficiency proposals filed - Seeking $267M total investment over three years ▪ ETG Conservation Incentive Program (CIP) proposal filed ▪ SJG engineering/route proposal for Redundancy proceeding - Critical non-pipeline supply solution CUSTOMER GROWTH ▪ 12,000+ new customers added last 12 months; 70%+ converted from heating oil or propane INFRASTRUCTURE MODERNIZATION ▪ SJG/ETG infrastructure modernization programs - Annual rate adjustments effective October 1 BUSINESS TRANSFORMATION ▪ Catamaran renewables joint venture launched in August; Fuel Cell projects announced ▪ Completed sale of Elkton Gas to Chesapeake Utilities for approximately $15M ▪ Advanced integration of ETG, embedding best practices for people, processes and technology BALANCE SHEET ▪ Equity/Total Cap 32.2% in 2020 compared with 29.6% in 2019 ▪ Adjusted Equity/Total Cap 39.7% compared with 37.5% in 2019 ▪ Strengthened Liquidity, Eliminated Near-Term Debt Maturities and Ensured Funding of Capital Programs Highlights 3

2020 Financial Results Consolidated Earnings Note: Earnings and average shares outstanding are in millions. Amounts and/or EPS may not add due to rounding 4 GAAP GAAP Economic Economic GAAP GAAP Economic Economic Earnings EPS Earnings EPS Earnings EPS Earnings EPS Utility $156.1 $1.61 $157.3 $1.62 $122.2 $1.33 $122.2 $1.33 Non-Utility $45.9 $0.47 $45.9 $0.47 ($3.2) ($0.03) $13.8 $0.15 Other ($44.7) ($0.46) ($40.3) ($0.42) ($41.8) ($0.45) ($33.0) ($0.36) Total - Continuing Operations $157.3 $1.62 $163.0 $1.68 $77.2 $0.84 $103.0 $1.12 Average Diluted Shares 97.0 97.0 92.3 92.3 Twelve months ended December 31, 2020 Twelve months ended December 31, 2019

2020 Financial Results Economic Earnings Bridge | 2019 to 2020 • UTILITY: SJG $21.9M; ETG $13.5M; ELK $(0.3)M • NON-UTILITY: Energy Services $17.9M; Energy Group $14.3M • OTHER: Interest on Debt $(7.3)M 5

• MARGIN: SJG/ETG rate relief, customer growth, and infrastructure modernization investment • OPERATION EXPENSES: O&M, bad debt, business transformation, regulatory riders, and energy and other taxes • DEPRECIATION: Utility investment in property, plant and equipment • OTHER INCOME: Investment performance from pension/other postretirement benefit plans, and higher AFUDC • NET INTEREST: Variance in debt balances • INCOME TAX: Effective income tax rate * We define utility margin, a non-GAAP measure, as natural gas revenues less natural gas costs, regulatory rider expenses and volumetric and revenue-based energy taxes. 2020 Financial Results Utility Earnings Bridge | 2019 to 2020 6
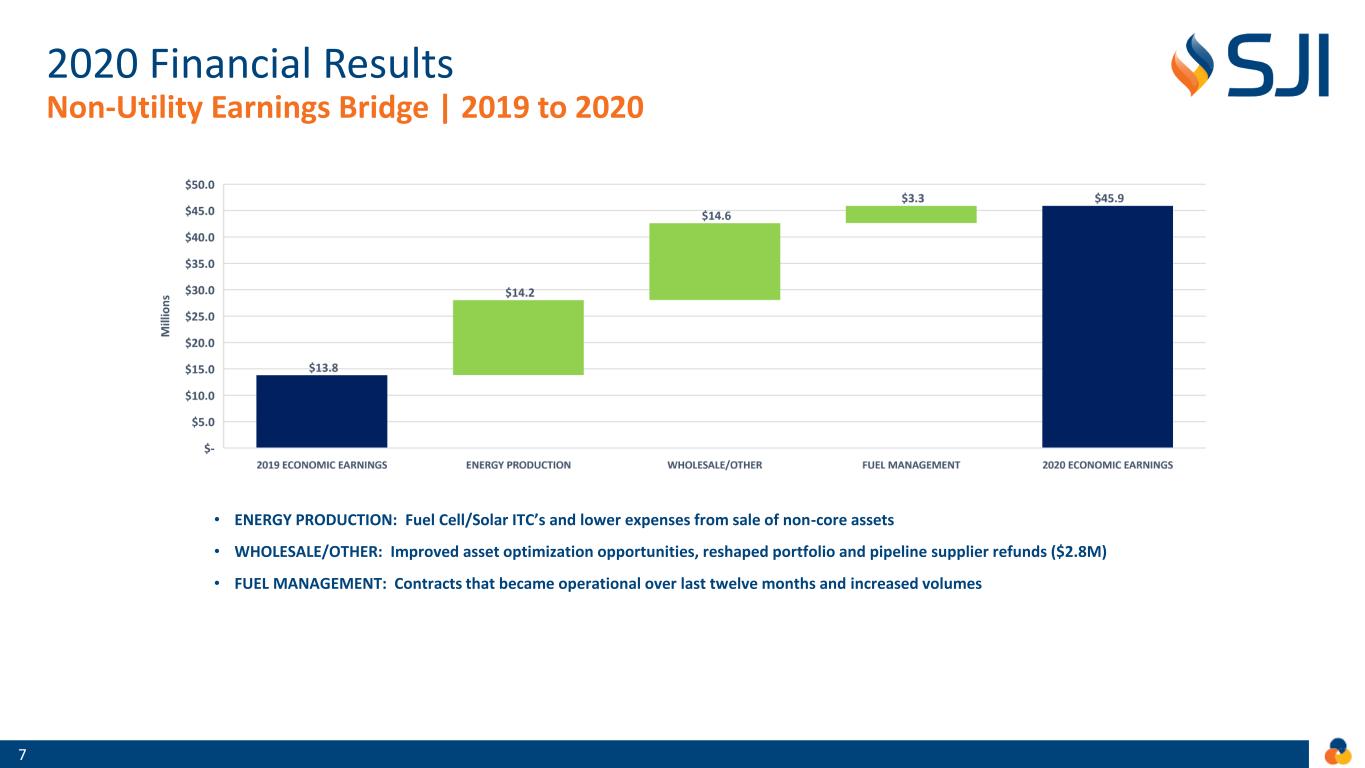
• ENERGY PRODUCTION: Fuel Cell/Solar ITC’s and lower expenses from sale of non-core assets • WHOLESALE/OTHER: Improved asset optimization opportunities, reshaped portfolio and pipeline supplier refunds ($2.8M) • FUEL MANAGEMENT: Contracts that became operational over last twelve months and increased volumes 2020 Financial Results Non-Utility Earnings Bridge | 2019 to 2020 7

2020 Financial Results Capital Expenditures More Than 80% of Capital Expenditures Supported Growth, Safety and Reliability for SJG/ETG Customers 8 61% 20% 19% Safety & Reliability New Business Clean Energy UTILITY $472 System Growth & Maintenance $204 Projects to enhance the safety and reliability of SJG/ETG systems Infrastructure Modernization $137 Replacement of aging pipeline for SJG (AIRP, SHARP) and ETG (IIP) New Business $119 Addition of customers to SJG/ETG systems Redundancy Projects $13 Critical supply/system reliability investments for SJG/ETG customers NON-UTILITY $114 Energy Services $105 Investments supporting goals of New Jersey Energy Master Plan (EMP) Energy Group $7 Investments supporting util ities, power generators and industrial customers Midstream $2 Long-term contracted energy infrastructure projects (PennEast Pipeline) OTHER $14 Allocations to SJI Parent Total Capital Expenditures $600 Capital Expenditures 2020 ($millions) Description

2020 Financial Results Capital Sources and Uses 9 CASH FLOW FROM INVESTING $0.6 CASH FLOW FROM OPERATIONS $0.3 DEBT ISSUANCE $1.0 DEBT REPAYMENT $0.9 DIVIDENDS, $0.1 EQUITY ISSUANCE $0.2 ASSET SALES $0.1 $0.0 $0.2 $0.4 $0.6 $0.8 $1.0 $1.2 $1.4 $1.6 $1.8 CAPITAL SOURCES CAPITAL USES B il li o n s
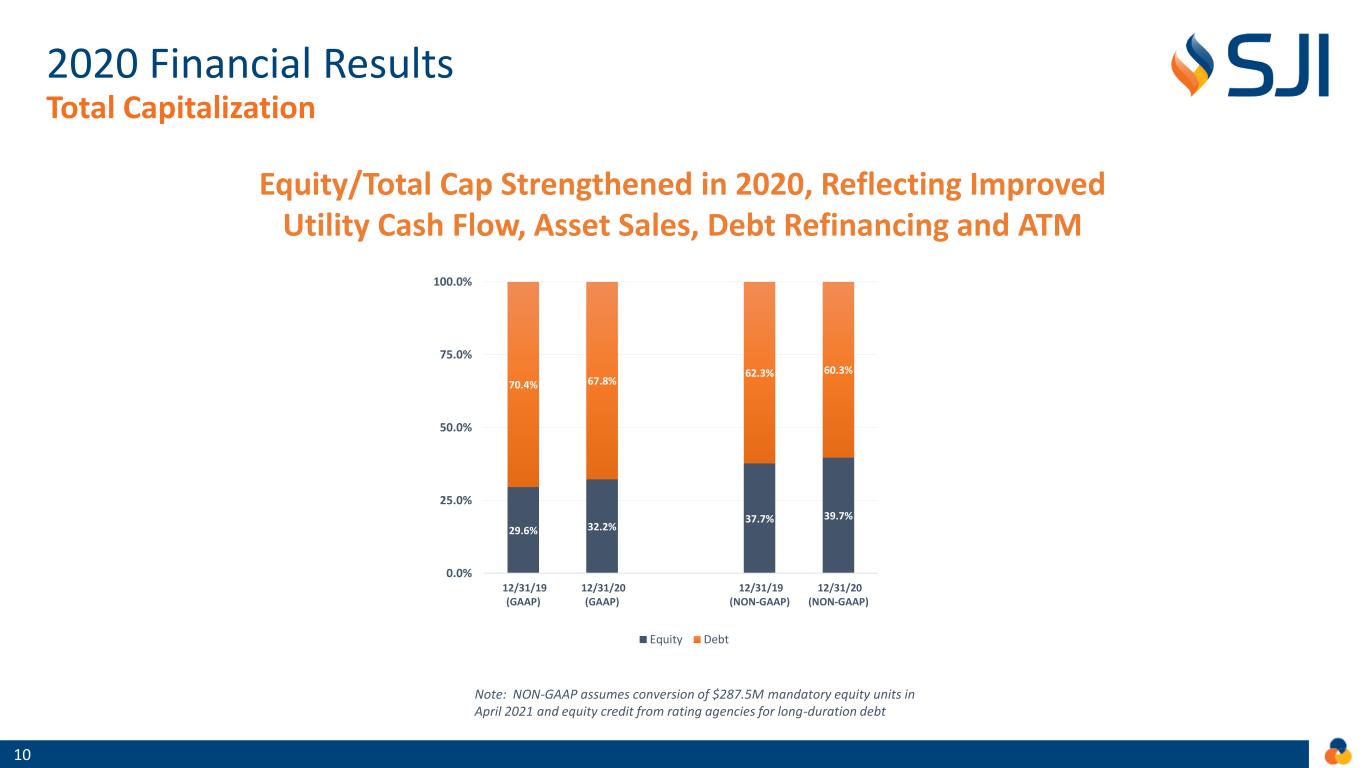
Note: NON-GAAP assumes conversion of $287.5M mandatory equity units in April 2021 and equity credit from rating agencies for long-duration debt 2020 Financial Results Total Capitalization Equity/Total Cap Strengthened in 2020, Reflecting Improved Utility Cash Flow, Asset Sales, Debt Refinancing and ATM 10 29.6% 32.2% 37.7% 39.7% 70.4% 67.8% 62.3% 60.3% 0.0% 25.0% 50.0% 75.0% 100.0% 12/31/19 (GAAP) 12/31/20 (GAAP) 12/31/19 (NON-GAAP) 12/31/20 (NON-GAAP) Equity Debt

2020 Financial Results Liquidity Solid Liquidity to Manage Through Impacts of COVID-19 11 $900 $442 $150 $10 $10 $0 $200 $400 $600 $800 $1,000 $1,200 CAPACITY AVAILABILITY M il li o n s AVAILABLE LIQUIDITY AS OF DECEMBER 31, 2020 REVOLVING CREDIT FACILITIES TERM LOANS CASH/OTHER

2020 Financial Results Debt Maturities No Significant Debt Maturities 2022 through 2026, Reflecting Proactive Refinancing Effort in 2020 * Includes SJI mandatory convertible equity units due April 2021 ($287.5 million) * 12 $0 $100 $200 $300 $400 $500 $600 M IL LI O N S SJI SJG ETG

Regulatory Initiatives 13
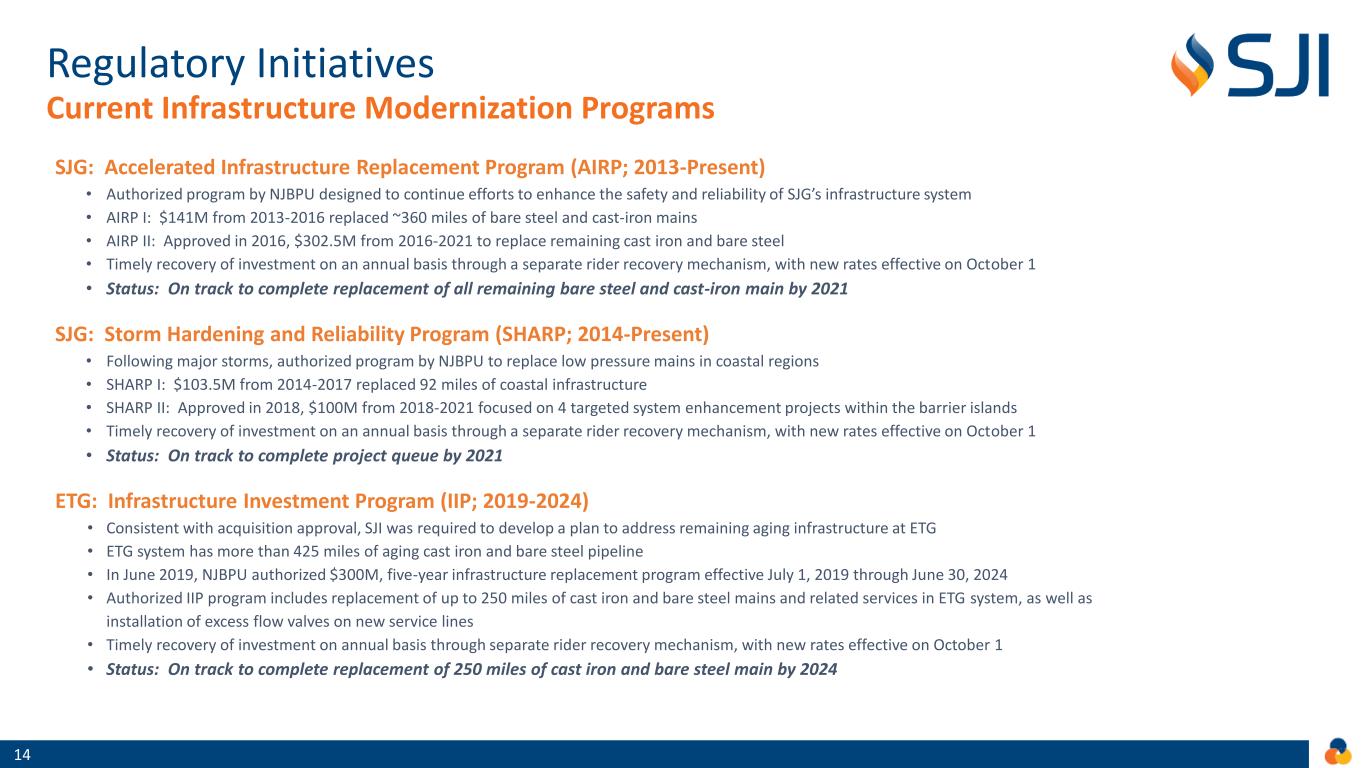
14 SJG: Accelerated Infrastructure Replacement Program (AIRP; 2013-Present) • Authorized program by NJBPU designed to continue efforts to enhance the safety and reliability of SJG’s infrastructure system • AIRP I: $141M from 2013-2016 replaced ~360 miles of bare steel and cast-iron mains • AIRP II: Approved in 2016, $302.5M from 2016-2021 to replace remaining cast iron and bare steel • Timely recovery of investment on an annual basis through a separate rider recovery mechanism, with new rates effective on October 1 • Status: On track to complete replacement of all remaining bare steel and cast-iron main by 2021 SJG: Storm Hardening and Reliability Program (SHARP; 2014-Present) • Following major storms, authorized program by NJBPU to replace low pressure mains in coastal regions • SHARP I: $103.5M from 2014-2017 replaced 92 miles of coastal infrastructure • SHARP II: Approved in 2018, $100M from 2018-2021 focused on 4 targeted system enhancement projects within the barrier islands • Timely recovery of investment on an annual basis through a separate rider recovery mechanism, with new rates effective on October 1 • Status: On track to complete project queue by 2021 ETG: Infrastructure Investment Program (IIP; 2019-2024) • Consistent with acquisition approval, SJI was required to develop a plan to address remaining aging infrastructure at ETG • ETG system has more than 425 miles of aging cast iron and bare steel pipeline • In June 2019, NJBPU authorized $300M, five-year infrastructure replacement program effective July 1, 2019 through June 30, 2024 • Authorized IIP program includes replacement of up to 250 miles of cast iron and bare steel mains and related services in ETG system, as well as installation of excess flow valves on new service lines • Timely recovery of investment on annual basis through separate rider recovery mechanism, with new rates effective on October 1 • Status: On track to complete replacement of 250 miles of cast iron and bare steel main by 2024 Current Infrastructure Modernization Programs Regulatory Initiatives

15 SJG: Infrastructure Investment Program (IIP) • SJG has made considerable investments over many years to modernize its natural gas system through its current infrastructure programs (AIRP/SHARP), which are expected to be completed in the first half of 2021 • In November, SJG filed a petition with the NJBPU seeking approval of an Infrastructure Investment Program (IIP) that would accelerate planned capital expenditures to enhance the delivery of safe, reliable, affordable natural gas, create jobs, and support the State’s environmental goals • Under the proposed five-year program, beginning in June 2021, SJG will invest approximately $742.5 million to replace 825 miles of aging steel mains and install Excess Flow Valves (EFVs) on new service lines • Status: Resolution of IIP proposal expected in 1H 2021 SJG: Energy Efficiency Program • Since 2009, SJG has invested more than $110 million in energy efficiency programs • In September, SJG filed a request with the NJBPU seeking to expand the company’s energy efficiency programs for three years, beginning in July 2021 • Proposed investments totaling approximately $167 million encouraging customers to reduce energy usage and save money • The implementation of the proposed program is expected to result in approximately $201 million in customer bill savings, 481,957 tons in avoided CO2 emissions and the creation of nearly 3,000 jobs over three years • Status: Resolution of energy efficiency program proposal expected in 1H 2021 ETG: Energy Efficiency Program / Conservation Incentive Program • In September, ETG filed a request with the NJBPU seeking to expand the company’s energy efficiency programs for three years, beginning in July 2021 • Proposed investments totaling approximately $100 million encouraging customers to reduce energy usage and save money • ETG also proposed a Conservation Incentive Program (CIP) that eliminates the link between usage and margin • Implementation of the proposed program is expected to result in approximately $185 million in customer bill savings, 576,670 tons in avoided CO2 emissions and the creation of over 2,000 jobs over 3-years • Status: Resolution of energy efficiency program and CIP program proposals expected in 1H 2021 Pending Regulatory Initiatives Regulatory Initiatives

Regulatory Initiatives Calendar 16 Company Filing Type Objective Filing/Submitted Date Expected Outcome Date SJG/ETG Energy Efficiency Programs Reduced Consumption/Decarbonization Q3 2020 Q2 2021 ETG Conservation Incentive Program Reduced Consumption/Decarbonization Q3 2020 Q2 2021 SJG Extension of Infrastructure Replacement Program Safety/Reliability/Decarbonization Q4 2020 Q2 2021 SJG Engineering/Route Approval For LNG Redundancy Project Supply Redundancy Q4 2019 1H 2021 SJG/ETG Annual Recovery of Infrastructure Programs Safety/Reliability/Decarbonization Q3 2021 Q4 2021

Clean Energy and Decarbonization 17

Clean Energy and Decarbonization New Jersey Energy Master Plan 18 ▪ The New Jersey Energy Master Plan (EMP) is intended to set forth a strategic vision for the production, distribution, consumption, and conservation of energy in the State of New Jersey ▪ The EMP is updated and revised periodically -- allows for improvements to reflect changes with technology, energy, and environmental developments and demands ▪ The updated EMP outlines Murphy administration’s goal of 100% clean energy by 2050 ▪ The updated EMP varies dramatically from the prior EMP in 2015 which was heavily supportive of natural gas as an abundant, clean and affordable commodity meriting aggressive expansion to homes and businesses in the state

Long and Continuing Record of Investment 19 Clean Energy and Decarbonization Historical Track Record Future Investment Opportunities Reducing Energy Consumption & Emissions • Replacement of aging infrastructure, improving safety and reliability for customers and reducing greenhouse gas emissions (GHG) • On track for expected reduction of 500 tons of carbon emissions at current replacement rate • SJG Conservation Incentive Program (CIP) severed tie between volumes and margins, encouraging reductions in consumption • Extension and/or acceleration of replacement of aging infrastructure, improving safety and reliability for customers and reducing greenhouse gas emissions (GHG) • ETG: 5-10 years of bare-steel and cast-iron pipe remaining • SJG: sizable inventory of vintage plastic and coated-steel • Significant replacement of vintage transmission infrastructure • ETG Conservation Incentive Program (CIP) pending before NJBPU Deploying Renewable Energy • Sizable investments in solar, combined heat-and-power (CHP), and landfill-to-electric generation • Executing plan to invest in clean energy infrastructure • Targeting solar at SJI corporate facilities, landfills, fuel cells and other clean energy generation projects • Investing in Renewable Natural Gas (RNG) opportunities Maximizing Energy Efficiency • Energy Efficiency program to designed to reduce consumption and emissions • Energy Efficiency proposals for SJG/ETG pending before NJBPU • Increased investment with contemporaneous rate recovery at authorized ROE Modernizing Via Technology • Developed enterprise level environmental policy and management system • Evaluating Smart Meters • Evaluating other new technologies (Power to Gas; Hydrogen)

Current Portfolio 20 Clean Energy and Decarbonization Traditional Clean Energy Decarbonization Fuel Cells ▪ In August 2020, SJI formed Catamaran Renewables (Catamaran), a 50/50 joint venture between SJI subsidiary Marina Energy and renewable industry-leader Captona, to develop, own and operate renewable energy projects ▪ In August 2020, announced the acquisition of two fuel cell projects in Staten Island, New York totaling 7.5 MW from NineDot Energy Solar Generation ▪ Currently operate multiple solar assets with plans for modest and strategic additional investments over next two years ▪ 2020 projects included installation of commercial facilities at NJ corporate facilities and the addition of four small scale solar arrays Landfill to Gas ▪ Opportunity to leverage existing infrastructure for future RNG production and methane capture initiatives Renewable Natural Gas ▪ In February, announced minority investment in REV LNG, LLC – a leading developer, operator and transporter of RNG ▪ As part of investment, development rights to anaerobic digester projects at dairy farms to produce RNG ▪ Long-term contracts with blue chip customers and credit-worthy utility counterparties Green Hydrogen ▪ Announced partnership with Atlantic Shores Offshore Wind in December 2020 to collaborate on a green hydrogen pilot program ▪ The project would utilize excess electricity generated from offshore wind projects to create “green hydrogen”, which would then be blended with natural gas to lower its carbon intensity

Appendix 21

COVID Business Update Appendix • COST RECOVERY: NJBPU has authorized deferral of incremental costs and bad debt for future recovery • PENDING PROCEEDINGS: NJBPU continues to hold regular commission agenda meetings. • SERVICE: Operations and delivery of natural gas to customers have not been materially impacted and have not experienced significant reductions in sales volumes • WORKFORCE: Through proper planning and the innovative use of technology, all our employees have been working productively -- from employees in the field to those working from home • LIQUIDITY: Strengthened liquidity to ensure funding of 2020 capital program; Confident in ability to manage through impacts • COLLECTIONS: To date, we have seen a manageable impact on accounts receivable; Continue collection efforts and are directing customers to payment plans and customer assistance programs • PENSION: No near-term cash requirements • CAPEX: While certain construction programs were temporarily halted, we are back to normal operation • O&M: While we have incurred modest incremental operating costs due to the virus, NJBPU has authorized deferral for future recovery RegulatoryUtility OperationsLiquidity Financial 2 2 Business Operations Continue to Function Effectively During the Pandemic
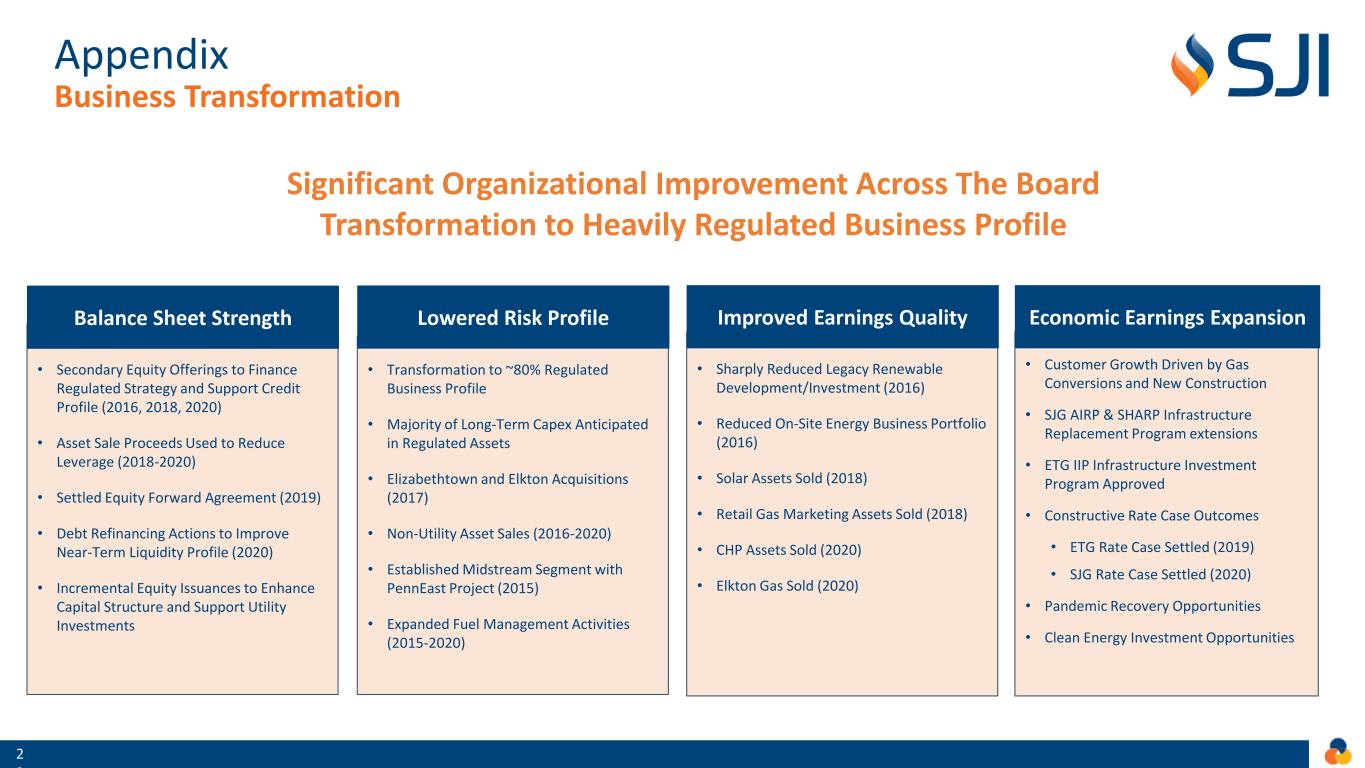
Business Transformation Appendix • Customer Growth Driven by Gas Conversions and New Construction • SJG AIRP & SHARP Infrastructure Replacement Program extensions • ETG IIP Infrastructure Investment Program Approved • Constructive Rate Case Outcomes • ETG Rate Case Settled (2019) • SJG Rate Case Settled (2020) • Pandemic Recovery Opportunities • Clean Energy Investment Opportunities • Sharply Reduced Legacy Renewable Development/Investment (2016) • Reduced On-Site Energy Business Portfolio (2016) • Solar Assets Sold (2018) • Retail Gas Marketing Assets Sold (2018) • CHP Assets Sold (2020) • Elkton Gas Sold (2020) • Secondary Equity Offerings to Finance Regulated Strategy and Support Credit Profile (2016, 2018, 2020) • Asset Sale Proceeds Used to Reduce Leverage (2018-2020) • Settled Equity Forward Agreement (2019) • Debt Refinancing Actions to Improve Near-Term Liquidity Profile (2020) • Incremental Equity Issuances to Enhance Capital Structure and Support Utility Investments • Transformation to ~80% Regulated Business Profile • Majority of Long-Term Capex Anticipated in Regulated Assets • Elizabethtown and Elkton Acquisitions (2017) • Non-Utility Asset Sales (2016-2020) • Established Midstream Segment with PennEast Project (2015) • Expanded Fuel Management Activities (2015-2020) Economic Earnings ExpansionImproved Earnings QualityBalance Sheet Strength Lowered Risk Profile Significant Organizational Improvement Across The Board Transformation to Heavily Regulated Business Profile 2 3

Recent Successes and Future Initiatives Appendix Recent Successes Future Initiatives Regulatory Initiatives • SJG: $39.5M Increase in Base Rates Effective October 1, 2020 • ETG: $34.0M Increase in Base Rates Effective Nov 15, 2019 • ETG: Infrastructure Investment Program (IIP) Effective July 2019 • SJG/ETG Energy Efficiency Programs (Filed Q3 2020) • ETG Conservation Incentive Program (Filed Q3 2020) • SJG Infrastructure Investment Program (Filed Q4 2020) Customer Growth • 12,000+ new customers added LTM; 1.5%+ Annualized Growth • Expected 1.5%+ Annualized Growth Business Transformation • ETG Integration: People, Processes and Technology • Non-Core Asset Sales (Legacy Solar/Retail Gas/CHP/Elkton Gas) • Wholesale Marketing Portfolio Reshaped / Risk and Volatility Reduced • Utility Clean Energy and Energy Efficiency Investments • Increase Operational Efficiency Through Technology Enhancements Clean Energy Investment • Targeted Solar Investment at SJI Corporate Facilities/Former Landfill Sites • Fuel Cell Investment through newly-formed Renewable JV (Catamaran) • Investing in Renewable Natural Gas (RNG) Opportunities • Investing in Power-To-Gas (Hydrogen) Opportunities Balance Sheet • Liquidity Enhancement and Reduction of Near-Term Debt Maturities • Equity Issuance via ATM, resolving equity funding need for 2020 • Enhanced Credit Through Revolver Extension • Continued Improvement in Credit Metrics • Debt/Equity to Support Regulated Strategies • Maintain Long-Term 55-65% Target Dividend Payout • Simplification of Revolving Credit 24

Appendix Long Track Record of Commitment to ESG Priorities 25 ✓ Collaborate with DEP and our state regulators to support effective environmental, health and safety standards and regulations ✓ Infrastructure built and monitored efficiency to minimize leaks ✓ Capital investment in remediation efforts and infrastructure ✓ 200+ CNG vehicles across our fleet ✓ Anticipate over 500 tons of carbon emissions will be reduced at the current pipe replacement rate ✓ Safety is the organization’s non- negotiable top priority ✓ Commitment to supplier diversity ✓ 51% workforce diversity across 1,100+ employees ✓ Focused attention on Diversity, Equity, and Inclusion efforts and programs ✓ Investment in the Customer Experience ✓ Significant contributions to support community and local non-profit organizations ✓ Health and financial wellness programs to support employee engagement ✓ Corporate giving and employee giving and volunteerism programs ✓ 30% of SJI’s board members are female ✓ 90% of board members are considered independent ✓ 80% of board members have tenure of 10 years or less ✓ Mandatory retirement age at 72 ✓ Annual independent third-party effectiveness evaluation ✓ Annual independent board compensation evaluation ✓ In the past three years 2 Directors have retired and 2 Directors were added Social GovernanceEnvironmental

Appendix Fourth Quarter 2020 | Consolidated Earnings 26 GAAP GAAP Economic Economic GAAP GAAP Economic Economic Earnings EPS Earnings EPS Earnings EPS Earnings EPS Utility $63.8 $0.63 $63.8 $0.63 $45.8 $0.50 $45.8 $0.50 Non-Utility $18.7 $0.19 $12.9 $0.13 $3.5 $0.04 $6.4 $0.07 Other ($13.4) ($0.13) ($13.8) ($0.14) ($9.9) ($0.11) ($8.7) ($0.10) Total - Continuing Operations $69.1 $0.69 $63.0 $0.62 $39.5 $0.43 $43.4 $0.47 Average Diluted Shares 100.8 100.8 92.5 92.5 Three months ended December 31, 2020 Three months ended December 31, 2019 Note: Earnings and average shares outstanding are in millions. Amounts and/or EPS may not add due to rounding
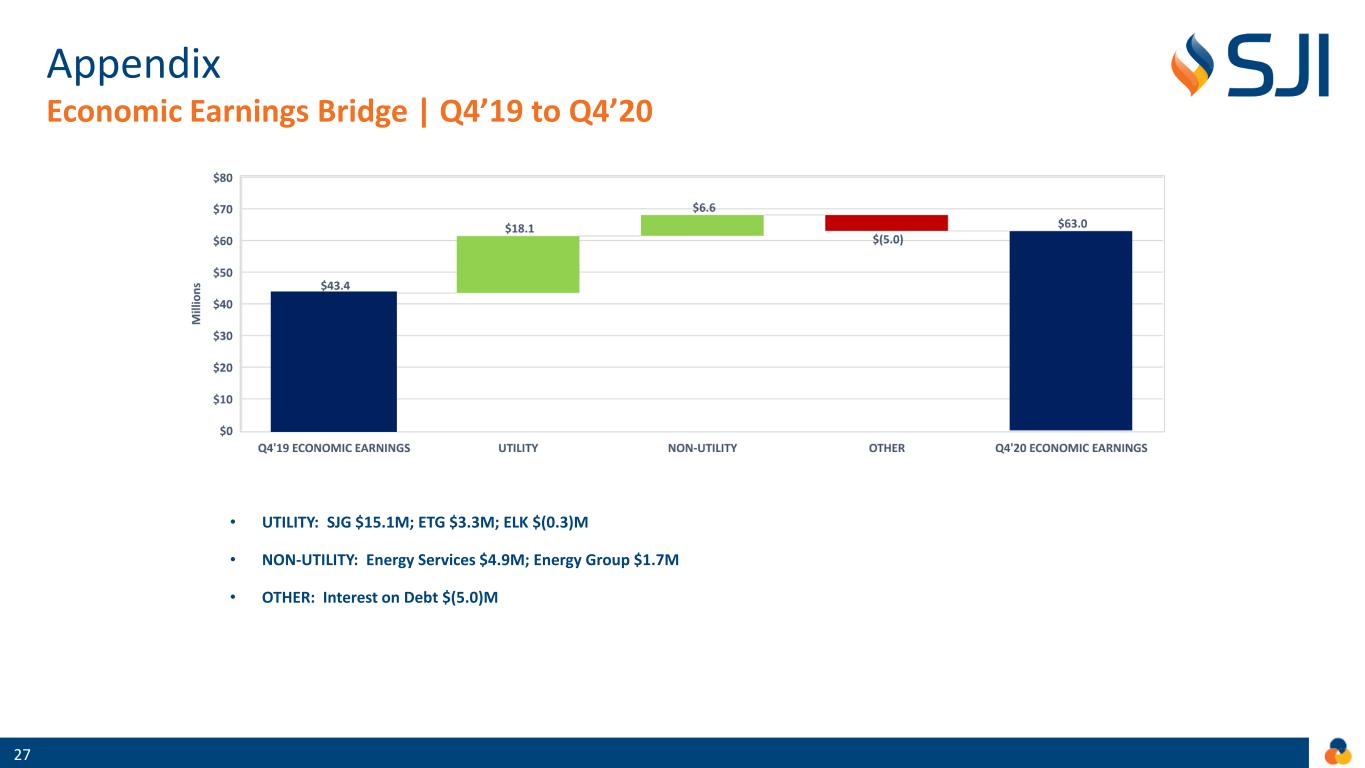
Appendix Economic Earnings Bridge | Q4’19 to Q4’20 27 • UTILITY: SJG $15.1M; ETG $3.3M; ELK $(0.3)M • NON-UTILITY: Energy Services $4.9M; Energy Group $1.7M • OTHER: Interest on Debt $(5.0)M
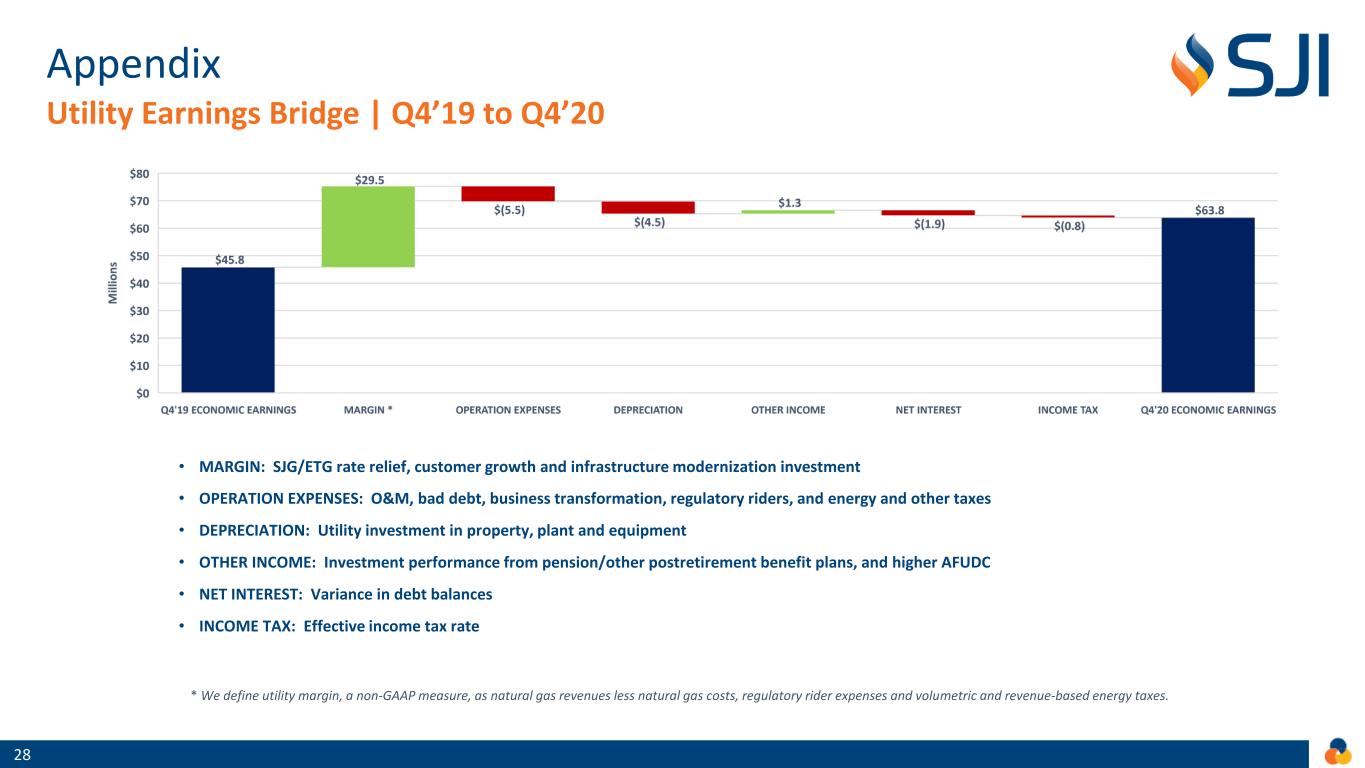
• MARGIN: SJG/ETG rate relief, customer growth and infrastructure modernization investment • OPERATION EXPENSES: O&M, bad debt, business transformation, regulatory riders, and energy and other taxes • DEPRECIATION: Utility investment in property, plant and equipment • OTHER INCOME: Investment performance from pension/other postretirement benefit plans, and higher AFUDC • NET INTEREST: Variance in debt balances • INCOME TAX: Effective income tax rate * We define utility margin, a non-GAAP measure, as natural gas revenues less natural gas costs, regulatory rider expenses and volumetric and revenue-based energy taxes. Appendix Utility Earnings Bridge | Q4’19 to Q4’20 28

• ENERGY PRODUCTION: Fuel Cell/Solar ITC’s and lower expenses from sale of non-core assets • WHOLESALE/OTHER: Improved asset optimization opportunities and reshaped portfolio • FUEL MANAGEMENT: Contracts that became operational over last twelve months and increased volumes Appendix Non-Utility Earnings Bridge | Q4’19 to Q4’20 29

Appendix 2020 Financial Results | Segment Detail Note: Amounts and/or EPS may not add due to rounding 30 GAAP Earnings 2020 2019 +/- 2020 2019 +/- GAAP Earnings 2020 2019 +/- 2020 2019 +/- UTILITY $63.8 $45.8 $18.1 $0.63 $0.50 $0.14 UTILITY $156.1 $122.2 $33.9 $1.61 $1.33 $0.28 SOUTH JERSEY GAS (SJG) $43.4 $28.3 $15.1 $0.43 $0.31 $0.12 SOUTH JERSEY GAS (SJG) $108.1 $87.4 $20.7 $1.11 $0.95 $0.17 ELIZABETHTOWN GAS (ETG) $20.4 $17.2 $3.3 $0.20 $0.19 $0.02 ELIZABETHTOWN GAS (ETG) $47.7 $34.2 $13.5 $0.49 $0.37 $0.12 ELKTON GAS (ELK) $0.0 $0.3 ($0.3) $0.00 $0.00 ($0.00) ELKTON GAS (ELK) $0.3 $0.6 ($0.3) $0.00 $0.01 ($0.00) NON-UTILITY $18.7 $3.5 $15.2 $0.19 $0.04 $0.15 NON-UTILITY $45.9 ($3.2) $49.1 $0.5 ($0.0) $0.51 MIDSTREAM $0.9 $1.0 ($0.0) $0.01 $0.01 ($0.00) MIDSTREAM $4.2 $4.2 ($0.0) $0.04 $0.05 ($0.00) ENERGY GROUP $12.6 $9.9 $2.7 $0.13 $0.11 $0.02 ENERGY GROUP $24.6 ($0.7) $25.4 $0.25 ($0.01) $0.26 Fuel Supply Management $4.0 $3.2 $0.8 $0.04 $0.03 $0.01 Fuel Supply Management $14.2 $10.9 $3.3 $0.15 $0.12 $0.03 Wholesale Marketing/Other $8.6 $6.7 $1.9 $0.09 $0.07 $0.01 Wholesale Marketing/Other $10.5 ($11.6) $22.1 $0.11 ($0.13) $0.23 ENERGY SERVICES $5.1 ($7.4) $12.5 $0.05 ($0.08) $0.13 ENERGY SERVICES $17.1 ($6.7) $23.8 $0.18 ($0.07) $0.25 Energy Production $4.6 ($8.2) $12.8 $0.05 ($0.09) $0.13 Energy Production $14.9 ($9.2) $24.0 $0.15 ($0.10) $0.25 Account Services $0.5 $0.8 ($0.3) $0.00 $0.01 ($0.00) Account Services $2.2 $2.5 ($0.2) $0.02 $0.03 ($0.00) OTHER ($13.4) ($9.9) ($3.5) ($0.13) ($0.11) ($0.03) OTHER ($44.7) ($41.8) ($2.9) ($0.46) ($0.45) ($0.01) TOTAL - CONTINUING OPS $69.1 $39.5 $29.6 $0.69 $0.43 $0.26 TOTAL - CONTINUING OPS $157.3 $77.2 $80.1 $1.62 $0.84 $0.79 Economic Earnings 2020 2019 +/- 2020 2019 +/- Economic Earnings 2020 2019 +/- 2020 2019 +/- UTILITY $63.8 $45.8 $18.1 $0.63 $0.50 $0.14 UTILITY $157.3 $122.2 $35.1 $1.62 $1.33 $0.30 SOUTH JERSEY GAS (SJG) $43.4 $28.3 $15.1 $0.43 $0.31 $0.12 SOUTH JERSEY GAS (SJG) $109.3 $87.4 $21.9 $1.13 $0.95 $0.18 ELIZABETHTOWN GAS (ETG) $20.4 $17.2 $3.3 $0.20 $0.19 $0.02 ELIZABETHTOWN GAS (ETG) $47.7 $34.2 $13.5 $0.49 $0.37 $0.12 ELKTON GAS (ELK) $0.0 $0.3 ($0.3) $0.00 $0.00 ($0.00) ELKTON GAS (ELK) $0.3 $0.6 ($0.3) $0.00 $0.01 ($0.00) NON-UTILITY $12.9 $6.4 $6.6 $0.13 $0.07 $0.06 NON-UTILITY $45.9 $13.8 $32.1 $0.47 $0.15 $0.32 MIDSTREAM $0.9 $1.0 ($0.0) $0.01 $0.01 ($0.00) MIDSTREAM $4.2 $4.2 ($0.0) $0.04 $0.05 ($0.00) ENERGY GROUP $6.7 $5.0 $1.7 $0.07 $0.05 $0.01 ENERGY GROUP $23.8 $9.5 $14.2 $0.24 $0.10 $0.14 Fuel Supply Management $4.0 $3.2 $0.8 $0.04 $0.03 $0.01 Fuel Supply Management $14.2 $10.9 $3.3 $0.15 $0.12 $0.03 Wholesale Marketing/Other $2.7 $1.8 $0.9 $0.03 $0.02 $0.01 Wholesale Marketing/Other $9.6 ($1.4) $11.0 $0.10 ($0.02) $0.11 ENERGY SERVICES $5.4 $0.4 $5.0 $0.05 $0.00 $0.05 ENERGY SERVICES $18.0 $0.1 $17.9 $0.19 $0.00 $0.18 Energy Production $4.9 ($0.4) $5.3 $0.05 ($0.00) $0.05 Energy Production $15.7 ($2.4) $18.1 $0.16 ($0.03) $0.19 Account Services $0.5 $0.8 ($0.3) $0.00 $0.01 ($0.00) Account Services $2.2 $2.5 ($0.2) $0.02 $0.03 ($0.00) OTHER ($13.8) ($8.7) ($5.1) ($0.14) ($0.10) ($0.0) OTHER ($40.3) ($33.0) ($7.3) ($0.42) ($0.36) ($0.06) TOTAL - CONTINUING OPS $63.0 $43.4 $19.6 $0.62 $0.47 $0.16 TOTAL - CONTINUING OPS $163.0 $103.0 $59.9 $1.68 $1.12 $0.56 Fourth Quarter Ended December 31 Millions Per Diluted Share Fourth Quarter Ended December 31 Millions Per Diluted Share Year-to-Date Period Ended December 31 Millions Per Diluted Share Year-to-Date Period Ended December 31 Millions Per Diluted Share

