Attached files
| file | filename |
|---|---|
| EX-99.1 - EX-99.1 - Ryerson Holding Corp | ryi-ex991_6.htm |
| 8-K - 8-K - Ryerson Holding Corp | ryi-8k_20210224.htm |

Exhibit 99.2
31 Important Information About Ryerson Holding Corporation These materials do not constitute an offer or solicitation to purchase or sell securities of Ryerson Holding Corporation (“Ryerson” or “the Company”) or its subsidiaries and no investment decision should be made based upon the information provided herein. Ryerson strongly urges you to review its filings with the Securities and Exchange Commission, which can be found at https://ir.ryerson.com/financials/sec-filings/default.aspx. This site also provides additional information about Ryerson. Safe Harbor Provision Certain statements made in this presentation and other written or oral statements made by or on behalf of the Company constitute "forward-looking statements" within the meaning of the federal securities laws, including statements regarding our future performance, as well as management's expectations, beliefs, intentions, plans, estimates, objectives, or projections relating to the future. Such statements can be identified by the use of forward-looking terminology such as “objectives,” “goals,” “preliminary,” “range,” "believes," "expects," "may," "estimates," "will," "should," "plans," or "anticipates" or the negative thereof or other variations thereon or comparable terminology, or by discussions of strategy. The Company cautions that any such forward-looking statements are not guarantees of future performance and may involve significant risks and uncertainties, and that actual results may vary materially from those in the forward-looking statements as a result of various factors. Among the factors that significantly impact our business are: the cyclicality of our business; the highly competitive, volatile, and fragmented metals industry in which we operate; fluctuating metal prices; our substantial indebtedness and the covenants in instruments governing such indebtedness; the integration of acquired operations; regulatory and other operational risks associated with our operations located inside and outside of the United States; impacts and implications of adverse health events, including the COVID-19 pandemic; work stoppages; obligations under certain employee retirement benefit plans; the ownership of a majority of our equity securities by a single investor group; currency fluctuations; and consolidation in the metals industry. Forward-looking statements should, therefore, be considered in light of various factors, including those set forth above and those set forth under "Risk Factors" in our annual report on Form 10-K for the year ended December 31, 2020, and in our other filings with the Securities and Exchange Commission. Moreover, we caution against placing undue reliance on these statements, which speak only as of the date they were made. The Company does not undertake any obligation to publicly update or revise any forward-looking statements to reflect future events or circumstances, new information or otherwise. Non-GAAP Measures Certain measures contained in these slides or the related presentation are not measures calculated in accordance with generally accepted accounting principles (“GAAP”). They should not be considered a replacement for GAAP results. Non-GAAP financial measures appearing in these slides are identified in the footnotes. A reconciliation of these non-GAAP measures to the most directly comparable GAAP financial measures is included in the Appendix. 2
3 Q4 2020 Highlights Continued successfully executing upon our dual mandate pandemic response plan to safeguard the health and safety of our employees and to improve the liquidity and recovery capacity of the Company. Redeemed $50 million in outstanding Senior Secured Notes due 2028 and ended the year with net debt of $679 million, a decrease of $244 million compared to 2019 enabled by strong cash flow generation from operations of $278 million. Fourth quarter revenues increased by 2.6% sequentially driven by the robust metals pricing environment and recovering demand fundamentals. Gross margin contracted quarter-over-quarter to 18.0% due to lagging contract business price resets, whereas gross margin, excluding LIFO expanded during the quarter to 19.3%, an increase of 260 bps quarter-over-quarter. Achieved Adjusted EBITDA, excluding LIFO of $34 million, an increase of $2 million compared to the previous quarter on higher volumes and improved pricing partially offset by restored salaries and wages, variable incentive compensation true-ups, higher delivery expenses and SAP ERP conversion expenses at CS&W. Generated fourth quarter loss per diluted share of $0.44, or adjusted loss per diluted share of $0.17 excluding one-time non-recurring and non-operating items. Exceptional working capital management during the fourth quarter with a cash conversion cycle of 62 days, a decrease of 24 days compared to the fourth quarter of 2019. Continuing to progress in de-risking the balance sheet through continued deleveraging and legacy liability management. Jim Claussen, President of Central Steel & Wire, named Executive Vice President & Chief Financial Officer of Ryerson.
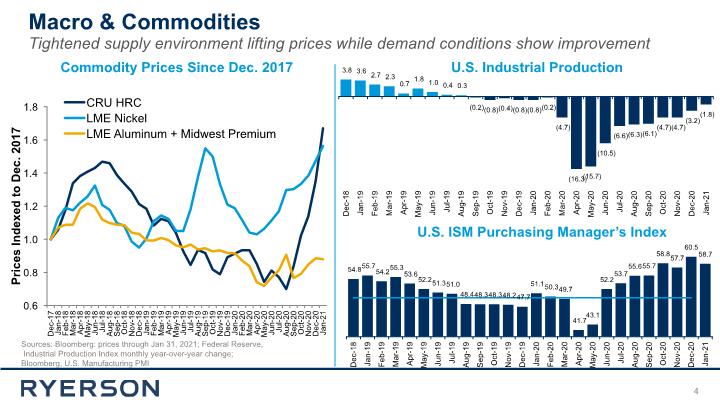
4 Macro & Commodities Tightened supply environment lifting prices while demand conditions show improvement Sources: Bloomberg: prices through Jan 31, 2021; Federal Reserve, Industrial Production Index monthly year-over-year change; Bloomberg, U.S. Manufacturing PMI Commodity Prices Since Dec. 2017 U.S. Industrial Production U.S. ISM Purchasing Manager’s Index
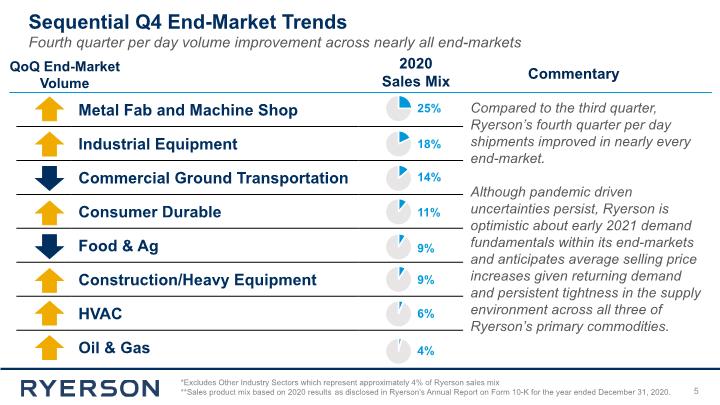
5 Fourth quarter per day volume improvement across nearly all end-markets *Excludes Other Industry Sectors which represent approximately 4% of Ryerson sales mix **Sales product mix based on 2020 results as disclosed in Ryerson’s Annual Report on Form 10-K for the year ended December 31, 2020. Compared to the third quarter, Ryerson’s fourth quarter per day shipments improved in nearly every end-market. Although pandemic driven uncertainties persist, Ryerson is optimistic about early 2021 demand fundamentals within its end-markets and anticipates average selling price increases given returning demand and persistent tightness in the supply environment across all three of Ryerson’s primary commodities. 2020 Sales Mix Commentary QoQ End-Market Volume Sequential Q4 End-Market Trends
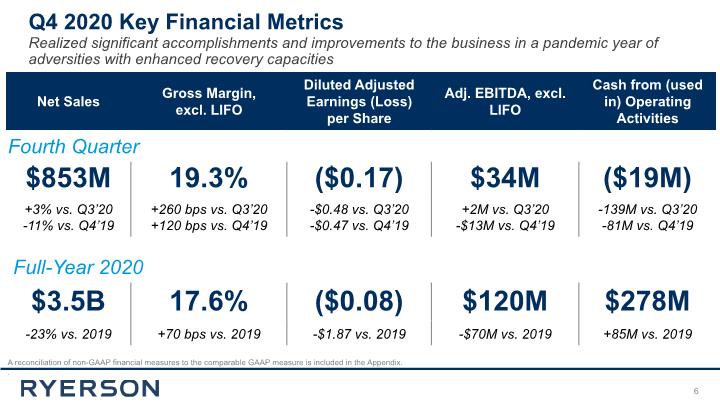
A reconciliation of non-GAAP financial measures to the comparable GAAP measure is included in the Appendix. . 6 Fourth Quarter Q4 2020 Key Financial Metrics Realized significant accomplishments and improvements to the business in a pandemic year of adversities with enhanced recovery capacities Full-Year 2020
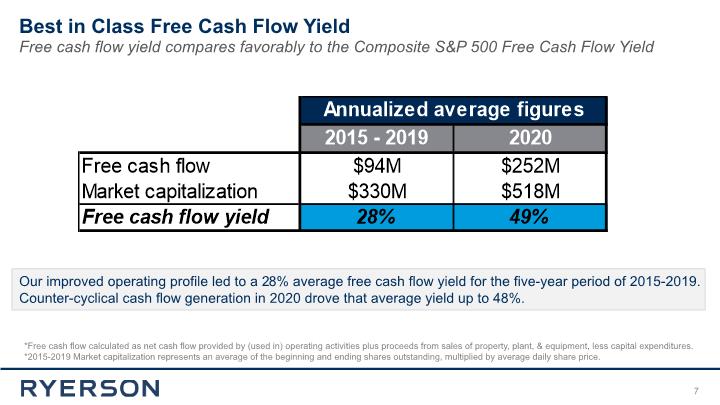
Best in Class Free Cash Flow Yield 7 Free cash flow yield compares favorably to the Composite S&P 500 Free Cash Flow Yield Our improved operating profile led to a 28% average free cash flow yield for the five-year period of 2015-2019. Counter-cyclical cash flow generation in 2020 drove that average yield up to 48%. *Free cash flow calculated as net cash flow provided by (used in) operating activities plus proceeds from sales of property, plant, & equipment, less capital expenditures. *2015-2019 Market capitalization represents an average of the beginning and ending shares outstanding, multiplied by average daily share price.
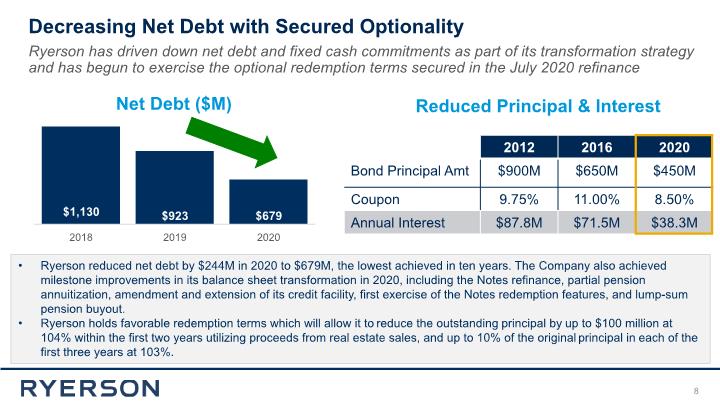
Decreasing Net Debt with Secured Optionality 8 Ryerson has driven down net debt and fixed cash commitments as part of its transformation strategy and has begun to exercise the optional redemption terms secured in the July 2020 refinance Ryerson reduced net debt by $244M in 2020 to $679M, the lowest achieved in ten years. The Company also achieved milestone improvements in its balance sheet transformation in 2020, including the Notes refinance, partial pension annuitization, amendment and extension of its credit facility, first exercise of the Notes redemption features, and lump-sum pension buyout. Ryerson holds favorable redemption terms which will allow it to reduce the outstanding principal by up to $100 million at 104% within the first two years utilizing proceeds from real estate sales, and up to 10% of the original principal in each of the first three years at 103%. Net Debt ($M) Reduced Principal & Interest
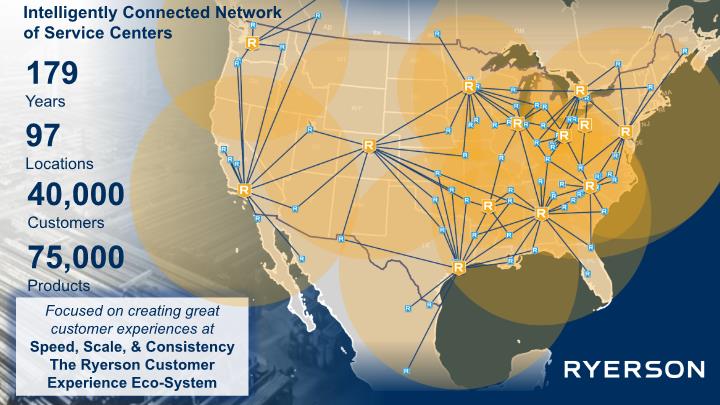
97 Locations 179 Years 40,000Customers 75,000 Products Focused on creating great customer experiences at Speed, Scale, & Consistency The Ryerson Customer Experience Eco-System Intelligently Connected Network of Service Centers
Appendix
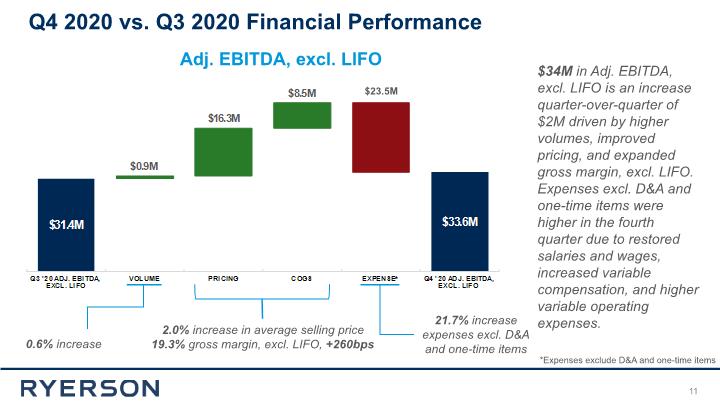
11 2.0% increase in average selling price 19.3% gross margin, excl. LIFO, +260bps Adj. EBITDA, excl. LIFO 0.6% increase 21.7% increase expenses excl. D&A and one-time items $34M in Adj. EBITDA, excl. LIFO is an increase quarter-over-quarter of $2M driven by higher volumes, improved pricing, and expanded gross margin, excl. LIFO. Expenses excl. D&A and one-time items were higher in the fourth quarter due to restored salaries and wages, increased variable compensation, and higher variable operating expenses. Q4 2020 vs. Q3 2020 Financial Performance *Expenses exclude D&A and one-time items $23.5M
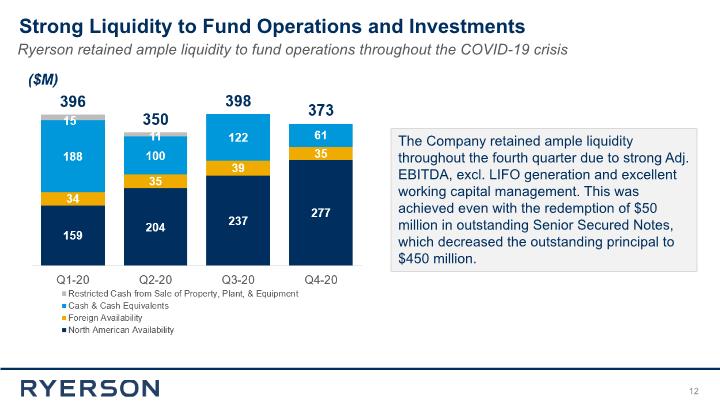
Strong Liquidity to Fund Operations and Investments 12 Ryerson retained ample liquidity to fund operations throughout the COVID-19 crisis The Company retained ample liquidity throughout the fourth quarter due to strong Adj. EBITDA, excl. LIFO generation and excellent working capital management. This was achieved even with the redemption of $50 million in outstanding Senior Secured Notes, which decreased the outstanding principal to $450 million.
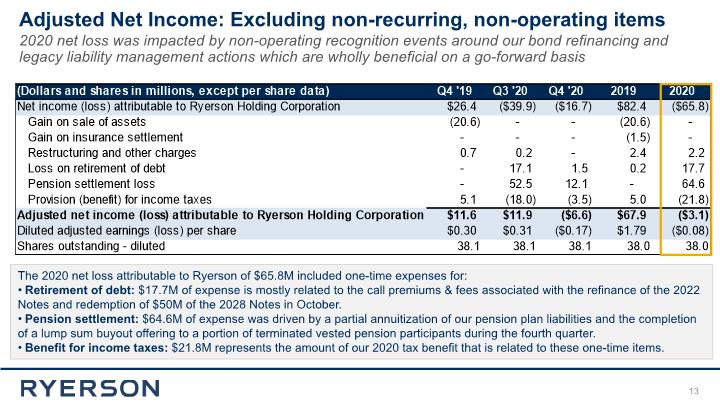
Adjusted Net Income: Excluding non-recurring, non-operating items 13 2020 net loss was impacted by non-operating recognition events around our bond refinancing and legacy liability management actions which are wholly beneficial on a go-forward basis The 2020 net loss attributable to Ryerson of $65.8M included one-time expenses for: Retirement of debt: $17.7M of expense is mostly related to the call premiums & fees associated with the refinance of the 2022 Notes and redemption of $50M of the 2028 Notes in October. Pension settlement: $64.6M of expense was driven by a partial annuitization of our pension plan liabilities and the completion of a lump sum buyout offering to a portion of terminated vested pension participants during the fourth quarter. Benefit for income taxes: $21.8M represents the amount of our 2020 tax benefit that is related to these one-time items.
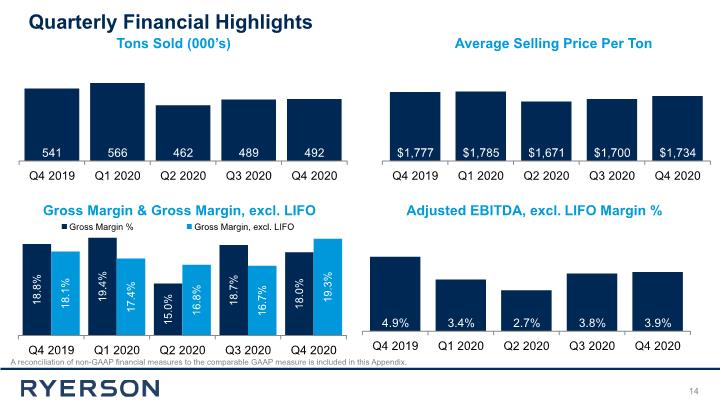
Quarterly Financial Highlights A reconciliation of non-GAAP financial measures to the comparable GAAP measure is included in this Appendix. Tons Sold (000’s) Average Selling Price Per Ton Adjusted EBITDA, excl. LIFO Margin % 14 Gross Margin & Gross Margin, excl. LIFO
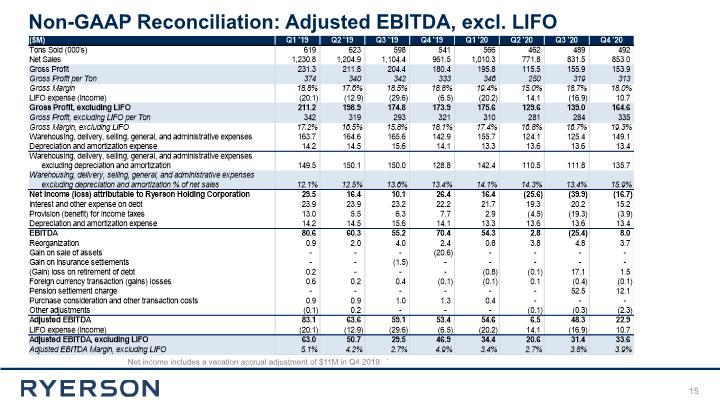
15 Net income includes a vacation accrual adjustment of $11M in Q4 2019. ` Non-GAAP Reconciliation: Adjusted EBITDA, excl. LIFO
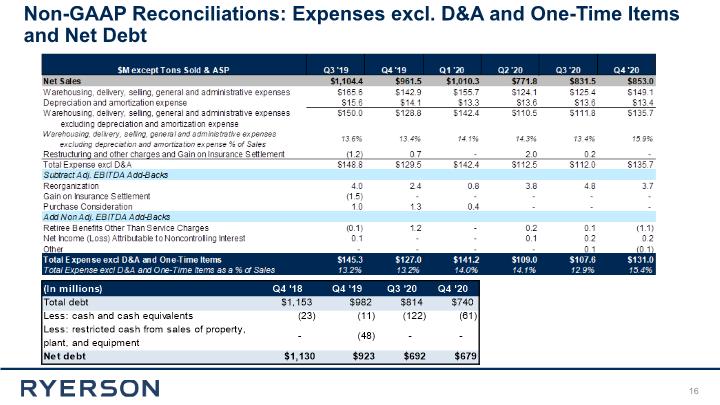
Non-GAAP Reconciliations: Expenses excl. D&A and One-Time Items and Net Debt 16
31 Note: EBITDA represents net income before interest and other expense on debt, provision for income taxes, depreciation, and amortization. Adjusted EBITDA gives further effect to, among other things, reorganization expenses, gain or loss on retirement of debt, loss on pension settlement, purchase consideration and other transaction costs, and foreign currency transaction gains and losses. We believe that the presentation of EBITDA, Adjusted EBITDA, and Adjusted EBITDA, excluding LIFO expense (income), provides useful information to investors regarding our operational performance because they enhance an investor’s overall understanding of our core financial performance and provide a basis of comparison of results between current, past, and future periods. We also disclose the metric Adjusted EBITDA, excluding LIFO expense (income), to provide a means of comparison amongst our competitors who may not use the same basis of accounting for inventories. EBITDA, Adjusted EBITDA, and Adjusted EBITDA, excluding LIFO expense (income), are three of the primary metrics management uses for planning and forecasting in future periods, including trending and analyzing the core operating performance of our business without the effect of U.S. generally accepted accounting principles, or GAAP, expenses, revenues, and gains (losses) that are unrelated to the day to day performance of our business. We also establish compensation programs for our executive management and regional employees that are based upon the achievement of pre-established EBITDA, Adjusted EBITDA, and Adjusted EBITDA, excluding LIFO expense (income), targets. We also use EBITDA, Adjusted EBITDA, and Adjusted EBITDA, excluding LIFO expense (income), to benchmark our operating performance to that of our competitors. EBITDA, Adjusted EBITDA, and Adjusted EBITDA, excluding LIFO expense (income), do not represent, and should not be used as a substitute for, net income or cash flows from operations as determined in accordance with generally accepted accounting principles, and neither EBITDA, Adjusted EBITDA, and Adjusted EBITDA, excluding LIFO expense (income), is necessarily an indication of whether cash flow will be sufficient to fund our cash requirements. This release also presents gross margin, excluding LIFO expense (income), which is calculated as gross profit minus LIFO expense (income), divided by net sales. We have excluded LIFO expense (income) from gross margin and Adjusted EBITDA as a percentage of net sales metrics in order to provide a means of comparison amongst our competitors who may not use the same basis of accounting for inventories as we do. Our definitions of EBITDA, Adjusted EBITDA, Adjusted EBITDA, excluding LIFO expense (income), gross margin, excluding LIFO expense (income), and Adjusted EBITDA, excluding LIFO expense (income), as a percentage of sales may differ from that of other companies. Adjusted Net income (loss) and Adjusted Earnings (loss) per share is presented to provide a means of comparison with periods that do not include similar adjustments. 17 Non-GAAP Reconciliation
